Embed Size (px)
Citation preview

THE CENTRE FOR MARKET AND PUBLIC ORGANISATION
Centre for Market and Public Organisation
Bristol Institute of Public Affairs
University of Bristol
2 Priory Road
Bristol BS8 1TX
http://www.bristol.ac.uk/cmpo/
Tel: (0117) 33 10952
Fax: (0117) 33 10705
E-mail: [email protected]
The Centre for Market and Public Organisation (CMPO) is a leading research
centre, combining expertise in economics, geography and law. Our objective is to
study the intersection between the public and private sectors of the economy,
and in particular to understand the right way to organise and deliver public
services. The Centre aims to develop research, contribute to the public debate
and inform policy-making.
CMPO, now an ESRC Research Centre was established in 1998 with two large
grants from The Leverhulme Trust. In 2004 we were awarded ESRC Research
Centre status, and CMPO now combines core funding from both the ESRC and the
Trust.
ISSN 1473-625X
A natural experiment in school accountability: the impact of school performance information on pupil
progress and sorting
Simon Burgess Deborah Wilson
Jack Worth
October 2010
Working Paper No. 10/246

CMPO Working Paper Series No. 10/246
A natural experiment in school accountability: the impact of school performance information on pupil progress and sorting
Simon Burgess1
Deborah Wilson2
Jack Worth2
1CMPO and Department of Economics, University of Bristol
2CMPO, University of Bristol
October 2010
Abstract
We test the hypothesis that the publication of school performance tables raises school
effectiveness. Our data allow us to implement a classic difference-in-difference analysis
comparing outcomes in England and Wales, before and after the abolition of the tables in
Wales. We find significant and robust evidence that this reform markedly reduced school
effectiveness in Wales. There is significant heterogeneity across schools: schools in the top
quartile of the league tables show no effect. We also test whether the reform reduced
school segregation in Wales, and find no systematic significant impact on either sorting by
ability or by socioeconomic status.
Keywords school accountability, school effectiveness, performance tables, segregation
JEL Classification I20
Electronic version www.bristol.ac.uk/cmpo/publications/papers/2010/wp246.pdf
Acknowledgements: We gratefully acknowledge the DfE for providing the English
PLASC/NPD data and DCELLS for providing the Welsh data, particularly Steve Hughes at the
Education and Lifelong Learning Statistics Unit. We thank Rebecca Allen, Gwyn Bevan,
Howard Glennerster, Ellen Greaves, Harvey Goldstein, Rich Harris, George Leckie, Alastair
Muriel, Carol Propper, Helen Simpson and Sarah Smith for comments and discussion on
previous drafts. We are grateful to the ESRC for funding this project via grant RES-343-28-
0001 at CMPO. The usual disclaimer applies.
Address for correspondence
CMPO, Bristol Institute of Public Affairs
University of Bristol
2 Priory Road
Bristol BS8 1TX
www.bristol.ac.uk/cmpo/
1. Introduction
A formal school accountability system is well-established in England, dating from the
Education Reform Act of 1988. The system is a mix of market-based accountability to
parents, publishing information on school performance as a basis of school choice, and
administrative accountability, based on the outcome of standardised student testing. In
Hanushek and Raymond’s (2005) terminology it is “consequential accountability” as in
England funding follows pupils and so poor performance can have serious consequences. In
their survey of accountability systems and student performance, Figlio and Ladd (2008)
argue that it is very difficult to estimate an exogenous causal effect for two reasons: lack of
an adequate control group for the counter-factual, and the typical introduction of a multi-
faceted performance management reform all at once, removing the possibility of evaluating
an individual component. Two of the leading attempts to evaluate the overall effect of
school accountability systems echo these points (Hanushek and Raymond, 2005; and Dee
and Jacob, 2009). In this paper we are able to exploit a natural experiment to evaluate a
core component of the accountability system in England which allows us to side-step these
major data problems.
From 1992 to 2001 secondary school performance tables were published annually in both
England and Wales. They quickly gained high public recognition, with league tables
published annually in national and local media and all relevant stakeholder groups very
conscious of the significance of individual schools’ league table positions (Wilson et al 2006).
Following devolution of power over education policy, the Welsh Assembly Government
abolished the publication of these tables, announcing its decision in July 2001. Other parts
of the system continued unchanged: for example, Wales continued national testing against
a common core curriculum at the end of compulsory schooling (more detail is given below).
Our data constitute a natural experiment that removed a key element from the
accountability system of two otherwise-identical education systems, allowing us to
circumvent the issues raised by Figlio and Ladd (2008). First, we have a ready-made control
group in students in England. The education systems of the two countries were practically
identical until devolution of power over education to the Welsh Assembly Government in

2
2001, certainly all the major system features were the same. Second, there were few other
major changes to the education system in Wales at the same time. Much of the system
continued the same: the national curriculum, the school inspection system, the teaching,
exam-setting and marking of the tests taken the end of compulsory schooling, which
remained as high-stakes as ever for the students in Wales.1
We test the hypothesis that school effectiveness in Wales after league table abolition is
lower than that of schools in England. A theoretical basis for the accountability system is a
principal-agent model; the publication of school performance tables helps to monitor the
output of the school. These tables are scrutinised by parents who may react by avoiding
low-performing schools and by the education authorities who may impose sanctions, either
explicit (as in the US in the No Child Left Behind (NCLB) Act of 2002) or implicit (in England).
So stopping their publication will affect both market-based and administrative
accountability systems. It may also be the case that stopping publication will shift the focus
in the classroom, away from improving the reported test scores and towards broader
educational outcomes. Our data allow us to implement a classic difference-in-difference
analysis comparing outcomes in England and Wales, before and after the reform.
Furthermore, we can also estimate a triple difference by exploiting the fact that we also
have data for primary schools, for which there was no equivalent differential reform.
We find systematic, significant and robust evidence that abolishing school league tables
markedly reduced school effectiveness in Wales. The impact is sizeable: a fall of 1.92 GCSE
grades per student per year, equivalent to 0.23 of a (school-level) standard deviation. The
key published performance measure, the percentage of students achieving at least five good
GCSE passes, falls by 3.4 percentage points per school, or 0.24 of a standard deviation. Figlio
and Ladd (2008) make the point that effect sizes are usually quoted in terms of pupil-level
standard deviations, so these are equivalent to 0.086 and 0.068 of the respective pupil-level
standard deviations. These are sizeable numbers: they are equivalent to optimistic
estimates of the effect sizes for class size reductions of around 30%2. The fact that we test
separately for effects on the published outcome measure and a non-published outcome
1 There were some changes to low-stakes testing at younger ages, discussed below.
2 Calculations based on Angrist and Lavy (1999)

3
measure, and find very similar and significant effects on both, suggests that the outcome is
not simply about gaming the published measure.
We find significant heterogeneity across schools: the effect is concentrated in the schools in
the lower 75% of the distribution of ability and poverty. Schools in the top quartile of the
league tables show no effect. This is in contrast to the findings of Dee and Jacob (2009) who
find least effect of NCLB on disadvantaged students; Hanushek and Raymond (2005) find
that Hispanic students gain the most and Black students the least from the introduction of
accountability. We show that the effect is robust across levels of local competition between
schools, and across rural and urban areas.
Closest to our analysis are the papers by Hanushek and Raymond (2005) and Dee and Jacob
(2009). The former use a state-level fixed effects model to identify the effect of introducing
state accountability and find a positive effect of around 0.2 of a (state-level) standard
deviation on test scores. They also find that this effect is only significant for accountability
systems where direct consequences, such as teacher financial incentives or private school
vouchers, are attached to poor performance. Dee and Jacob (2009) similarly use the federal
introduction of NCLB to estimate its effect on school performance. States that had
implemented a system of school accountability before NCLB, and hence were unaffected by
it, were employed as a control group. They found that NCLB had no impact on reading
scores and a 0.15 pupil-level standard deviation impact on 4th
grade maths scores. Figlio and
Ladd (2008) provide a comprehensive summary of the recent literature; see also Wilson
(2010). Much of the literature focuses on the ways in which publishing school rankings can
induce gaming responses from schools (see, for example, Neal and Schanzenbach 2007;
Reback 2008; Jacob and Levitt 2003; Burgess et al 2005).
A common critique of school league tables is that their publication encourages social
segregation by indirectly informing parents which schools have high concentrations of more
advantaged students. A more indirect argument in West et al (2006) is that the potential for
cream skimming by over-subscribed schools may lead to considerable differences in
composition between over- and under-subscribed schools. We test the implied hypothesis
that league tables lead to greater sorting by ability, as those high-performing, over-

4
subscribed schools admit more able pupils. With regard to socio-economic sorting, the
model by Hoyle and Robinson (2003) predicts increased socioeconomic stratification where
league tables are published as part of a system of school choice, as parents from higher
socioeconomic backgrounds, most able to exercise choice through the housing market, are
attracted to the best performing schools. An alternative view is that publishing performance
tables democratises the information that higher socio-economic status families are aware of
through their social networks, thereby reducing sorting.
We are able to test these competing hypotheses in our data. We consider the standard
segregation indices, and also the evolution of school-level poverty rates, and look for any
changes in the student assignment function from neighbourhood poverty to school poverty.
Whilst sorting is clearly not a short run phenomenon, we have six years of data for this
analysis. We show that the policy change had no systematic significant impact on either
sorting by ability or by socioeconomic status. There is a suggestion in one analysis of a slight
polarisation in Wales relative to England but no evidence in any of the analyses of a relative
fall in sorting in Wales.
The rest of the paper is structured as follows. In the next section we describe the policy
environment in England and Wales, discussing in detail the policy change that we exploit in
this analysis. Section 3 outlines the methodology we employ, and section 4 details our data.
We present our results in section 5, and offer some conclusions in section 6.
2. The Policy Environment and the Policy Change
National testing and performance tables
In England and Wales pupils in state-funded schools all follow the same National Curriculum
and progress through a series of four Key Stages. Our focus is on secondary education,
where pupils enter from primary schools at the age of 11, having just taken tests marking
the end of Key Stage 2. Key Stage 3 covers the first three years of secondary schooling and is
completed at age 14, and Key Stage 4 leads to the exams at the end of compulsory
education, known as GCSEs and taken at age 16. During the time period covered by our

5
analysis, tests in English, maths and science were compulsory at the end of Key Stage 3
(KS3)3. Key Stage 4 exams are taken by pupils in May and June each year with the results
released privately to pupils at the end of August. These are high-stakes exams, crucial for
progression into further education and valued by employers.
In the November of each year performance tables are published by the government
detailing the achievement of each school’s pupils in the most recent exams with a variety of
measures.4 National and local media publish the data in the form of ranking schools on the
basis of one selected performance measure, which has served to substantially focus
attention on this one aspect of school performance (Wilson et al 2006). This key indicator on
which schools are ranked is proportion of pupils gaining 5 GCSEs at grades A*-C (which is the
minimum requirement to go on to post-16 education), though usually other performance
indicators are reported alongside.5
Policy change
Following the election of the UK Labour Government in 1997 a referendum was held in
Wales to determine whether the population thought powers should be devolved away from
Westminster to an assembly in the capital, Cardiff. A majority favoured the motion and the
National Assembly for Wales was created by the Government of Wales Act in 1998. The
Welsh Assembly was responsible for spending the Welsh block grant from the UK, which
included health and education spending, and for setting policy in those areas. In July 2001
the Welsh Assembly Government announced that it would no longer publish secondary
school league tables at a national or local level, having published them since they were
introduced in England and Wales in 1992.
The main motivation for the policy change was the Welsh Assembly Government’s
eagerness to implement a Welsh alternative to the perceived ‘consumerist’ approach to the
provision of public services pursued by the New Labour government in England. League
3 These tests have since been abolished.
4 See http://www.dcsf.gov.uk/performancetables.
5 See, for example, http://news.bbc.co.uk/1/hi/education/8439617.stm (accessed 14.7.10).

6
tables, according to the evidence in a Welsh Assembly Government consultation, “do not
have the support of either the teaching profession or members of the public” (WAG 2001).
Reynolds (2008) argues that the policy change was motivated by “the left wing political
history of Wales and the use of government to ensure enhanced social justice for Welsh
citizens, [which] created a climate of greater trust in producer determined solutions”
(Reynolds, 2008: 754).
The policy was announced in the July of 2001, just after one cohort of pupils had taken their
GCSE exams. This is cohort B on the timeline in Figure A1. Pupils from cohort B and the
teachers teaching them would have expected their school’s results to be published in the
following November just as all prior cohorts had been. However, as a result of the
immediate implementation of the policy in Wales, no league tables were published in
November 2001. In Wales, it only became apparent that the exam results would not be
published after the exams had been taken in May/June, therefore we can categorise cohort
B as the last cohort before the policy was introduced. Cohorts taking GCSEs in Wales after
July 2001 (cohort C onwards) would have been aware their school’s results would not be
published, so comprise our treatment group. In looking at school performance we will focus
our attention on cohorts E onwards, as they selected which KS4 qualifications they were
going to study after the policy was announced. So we investigate the impact of league tables
on school effectiveness by comparing the outcomes of the wholly ‘before’ cohorts (A and B)
with those of the wholly ‘after’ cohorts (E onwards) in England and Wales.
The timeline relevant to our sorting hypotheses is shown in Figure A2. Here we are
interested in the ways pupils are allocated to secondary schools around the time of the
policy change, and so the ‘before’ and ‘after’ cohorts are different to those defined above.
Cohorts E – H all applied to secondary school in September with the most recent GCSE
results from those schools having been published the previous November. Pupils in cohort
H, for example, applied in September 2001 and were able to use the information in the
November 2000 League Tables to inform their choice. Whereas in England up to date
information was available for the cohorts after this, in Wales in November 2001 cohort B’s
GCSE results were not published, meaning cohort I had no more recent league tables to
inform their choice. So we investigate the impact of league tables on sorting by comparing
7
the outcomes of the ‘before’ cohorts (E – H) with those of the ‘after’ cohorts (I onwards) in
England and Wales.
Other potential off-setting information or policy changes
To be sure that our natural experiment design is a good one for assessing the effect league
tables have on school performance we need to be convinced there were no underlying
differences or additional changes around the time of the policy change between England
and Wales that might bias our estimate of the effect we are interested in. Our identification
relies on the assumption that abolishing league tables in Wales reduced the amount of
information available to parents choosing schools as well as reducing the potential for
publicly identifying poor performers. We therefore need to investigate whether other
sources of information became available in Wales after the policy announcement,
potentially offsetting the loss of information and estimates of the policy effects.
One concern was that school inspections would be increased in frequency or intensity in
Wales following the policy change, which would in turn increase the information available to
parents. England and Wales had separately run school inspection organisations – Ofsted
(the Office for Standards in Education, Children’s Services and Skills) and Estyn6, respectively
– after devolution, so this is a distinct possibility. However, this has not been the case. In
both countries schools were inspected at least every six years and are more frequently
inspected if they are performing poorly. During the period of our study there were no major
differences between the England and Wales inspection regimes (Reynolds 2008).
Another concern is that while newspapers do not publish school performance data in Wales,
schools themselves may publish the information on their websites or in their prospectuses.
Indeed, when announcing the policy change the minister declared that “schools will
continue to publish their own results in their prospectuses and Governors’ Annual Reports”
6 Estyn provides access to the individual school inspection reports by sector and by LEA, but does not provide
any comparative information. See http://www.estyn.gov.uk/inspection_reports.asp, accessed 10/7/2010.

8
(WAG 2001)7. We compared secondary schools in Cardiff with the schools in two English
cities with similar pupil compositions – Newcastle and Plymouth – to see whether there
were differences in what schools reported (findings are available on request). We found that
a majority of schools (12 out of 17) in Cardiff reported the percent achieving 5 GCSE grades
at A*-C in the most recent exams either on their website or in their Annual Report, but
some did not. The five that did not report their results had a significantly lower 5 A*-C score
than the local average. In Newcastle, all ten secondary schools reported their most recent 5
A*-C results. In Plymouth, a majority of schools (10 out of 16) did not report their exam
results; the six that did all performed above average.
A full investigation into the information schools publish in their prospectuses is beyond the
scope of this paper, but our findings suggest a mixed picture across England and Wales. How
much information schools publish themselves seems to depend on how well they have
performed and on the level of competition in an area’s education market, which is
something we control for in our analysis. Nonetheless, even if all schools publish their
recent results, the policy change led to a reduction in the amount of information collated
centrally and made publicly available as part of the systems of school accountability in
England and Wales.
Another possibility is that private ad hoc websites sprang up to take the place of the official
performance tables. While we cannot rule this out completely, a web search has not found
any. Also, the website of the Times newspaper’s ParentPower service8, which provides a
long list of websites with school comparison tables, has none for Wales.
We have also investigated potential systematic changes to the broader accountability
mechanisms within which schools in England and Wales have been operating through the
time period of our study and which could potentially undermine our identification strategy.
A system of school choice still operates in both England and Wales. Burgess et al (2009)
describe the English system in some detail. In Wales, for example, Cardiff’s admission guide
7 Performance information for each individual school is still available on the Welsh Assembly Government
website: http://www.statswales.wales.gov.uk/TableViewer/document.aspx?ReportId=18342 8 http://www.timesonline.co.uk/parentpower/links.php, accessed 10/7/2010

9
states ‘Parents have the right to express a preference which will be considered individually
and complied with wherever possible’ (Cardiff Council, 2009: 5). In both countries
geographical proximity is used as the main criterion for allocation of places to over-
subscribed schools. Straight line distances are generally used by English Local Authorities; in
Wales there is more focus on pre-defined, explicit catchment areas, although places are not
guaranteed to all children living in those areas. Details of the overall system of school choice
differ both across local authorities and through time; we have not found any evidence of
systematic change around the time of the policy change investigated in this analysis which
could undermine our identification strategy.
This is also the case with regard to the more ‘top-down’ accountability mechanisms. After
the abolition of league tables in Wales, school performance data continued to be collected
and analysed by local government and used as “the basis for challenge and discussion of
strengths and weaknesses” (WAG 2008: 21). What changed was the previously very public,
comparative and ‘high stakes’ nature of the performance information (still in evidence in
England). School closures are not directly or publicly related to a school ‘failing’; rather
there are various intervention strategies employed to help such schools improve. This runs
alongside planned reorganisations of local school places arising due to demographic change.
A full historical analysis of local authority education policy is outside the scope of the
current analysis, but again we have found no evidence of a systematic policy change in this
area that could bias our estimates.
3. Methodology
We identify the effect of school league tables on outcomes by exploiting the natural
experiment described above. We use a difference-in-difference methodology, employing
English schools as a control group for the policy change affecting Welsh schools. The
principle throughout our analysis is to difference out common time effects and control for
the fixed characteristics of the treatment group to identify the effect of the policy on
outcome y in the treatment group. To investigate the impact of the policy change on school
performance we estimate the following model for cohort t in school s:
10
(1) ststtssttstst uXawy +++++= βδηρα .
Our main variable of interest is the ‘policy off’ variable wst, which is equal to one for Welsh
schools after the policy change and zero otherwise. We include a cohort*school-specific
measure of prior attainment ast to control for pupil ability. We also include school fixed
effects ηs, cohort dummies δt and time-varying school control variables Xst. We estimate the
model using the within estimator, weighted by the size of the school and cluster standard
errors at the Local Education Authority (LEA) level.
A key identifying assumption underlying the use of England as a counterfactual is that the
time effects during the period are common to both countries. Institutional differences
between the English and Welsh education systems were small before the league table policy
change and did not change dramatically during our study period. The National Qualifications
Framework ensured that qualifications attained by pupils across the countries were
comparable during this period and none of our cohorts studied for a Welsh Baccalaureate or
a Diploma, which has since led to a divergence of qualification regimes. Both countries also
define Free School Meals eligibility identically. This suggests that any macro effects, for
example idiosyncratic shocks to examination results or changes to the poverty rate, should
affect each country similarly. We also check for common prior trends.
In our investigation of the effects of league table abolition on sorting we estimate the
following model:
(2) jttjjtjt uwy +++= δηα ,
where yjt is the Dissimilarity Index for cohort t in LEA j. We weight observations by cohort
size and include LEA fixed effects and cohort-dummies as above. We also follow two other
approaches to investigate school sorting: first, we analyse the poverty dynamics after the
policy change of schools with pupils from relatively poor and relatively wealthy families.
Second, we analyse the changing capacity of pupils from different types of neighbourhood

11
to access schools with more affluent peer groups. We use the timing of the policy change to
identify effects throughout.
4. Data
NPD/PLASC
The primary source of data we use in this study is administrative data from school censuses
in England and Wales. For England’s schools we use data from the National Pupil Database
(NPD), developed and made available by the Department for Education (DfE). Between 1999
and 2001 the data consisted of pupil-linked Key Stage (KS) 3 and 4 results and school
characteristics such as school type, percent of pupils eligible for Free School Meals (FSM)
and number of pupils. From 2002 onwards the Pupil Level Annual School Census (PLASC) is
incorporated into the NPD, giving a number of linked pupil characteristics, such as FSM,
ethnicity and age. For Welsh schools we use similar data, maintained and provided to us by
the Welsh Assembly Government. The Welsh PLASC was first collected in 2004, with similar
school- and pupil-linked variables to its English counterpart. However, prior to 2004 – the
key ‘before’ time period in our natural experiment design – Welsh KS3 and KS4 data was
only available at school level, which means our analysis must be done using school-cohort
cells. Using school- rather than pupil-level data means that we cannot analyse differential
effects of the policy across the within-school distribution of pupil ability.
School performance
(a) Data
The dependent variables in our analysis of school performance are school-mean GCSE points
and the proportion of pupils achieving 5 GCSEs at grades C or above. We include controls for
school*cohort average KS3 performance in regressions as a proxy for prior ability. This is a
good approximation for school value-added (VA), a measure of relative school achievement
calculated using pupil-level data, which we are unable to use because of the Welsh data
limitations described above. Conventionally VA is calculated by comparing a pupil’s

12
progression between KS3 to KS4 with the average progression of pupils of the same ability,
and aggregated to school level. We can test how good our approximation is by constructing
conventional VA variables in England and also in Wales from 2006 onwards and comparing
them with our estimates. The correlations between ‘real’ VA and our estimates are shown in
Table A1 and are typically around 0.9. The abolition of KS3 testing in Wales in 2006 only
affects the last cohort in our study. For these pupils we use teacher assessment scores, to
which we apply a data-based adjustment.
We include a number of variables from other sources. School expenditure data comes from
the Section 52 School Outturn statements available from DfE9 and the Welsh Department
for Children, Education, Lifelong Learning and Skills (DCELLS)10
and is deflated by the CPI and
weighted by the Department for Communities and Local Government’s area cost
adjustment factor11
. Population density data, which we use as a proxy for the
competitiveness of the local area, comes from the 2001 UK Census.12
We construct a
variable to capture local competition, counting the number of other secondary schools
within five kilometres of each school. The variables we use are summarised in Table 1.
(b) Sample
In our analysis of school performance we construct two samples. In both samples we
exclude all schools in local authorities with more than 10% of pupils in selective (known as
Grammar or Secondary Modern) schools. The first sample is a balanced panel of English and
Welsh schools in the years 1999/2000 to 2000/01 and 2003/04 to 2007/08. To balance the
panel we drop around 7% of school-year observations as some schools closed or opened
during the period and some had missing data. The differences between the balanced panel
and the subsample that was dropped is shown in Table A2. The balanced panel may be a
biased sample of all schools as a result of these differences, so we construct a second
sample to mitigate the potential bias.
9_See_www.dcsf.gov.uk/everychildmatters/strategy/financeandfunding/informationforlocalauthorities/sectio
n52/schoolbalances/s52sb/ 10
See www.statswales.wales.gov.uk/ReportFolders/ReportFolders.aspx?IF_ActivePath=P,324,332,5780. 11
See www.local.odpm.gov.uk/finance/0708/acameth.pdf 12
See www.statistics.gov.uk/STATBASE/ssdataset.asp?vlnk=7662

13
The second sample is a subsample of English schools from the balanced panel, matched with
Welsh schools on the basis of a number of observed characteristics. Our matching variables
are measures of school performance and their prior trends, percent FSM, percent white
students, population density, school expenditure and our measure of local school
competition, and are averaged over the ‘before’ period. Welsh secondary schools are
poorer and less ethnically diverse than English schools and also have more Community
schools. Welsh schools are generally less well funded and are in areas that are less densely
populated. A full list of matching variables is shown in Table A3. We match English schools
by propensity score to one nearest neighbour in the Welsh sample without replacement. In
the matched sample the difference in the means of the matching variables in England and
Wales are all individually and jointly insignificant.
Sorting
(a) Data
We use a different set of cohorts for our sorting analyses, as explained above and shown in
Figure A2. Our focus will be on sorting across schools by socioeconomic background, for
which we use FSM status as a proxy, and by ability, which we proxy with Key Stage 2 scores.
The pupil characteristics are aggregated at secondary school level, taking pupils’ KS2 results
from the last year of primary school and their FSM status in the first year of secondary
school.
There are some approximations we need to make to get equivalent data across the period
of interest in England and Wales. As mentioned above, pupil-level data in Wales was first
collected in 2004, so to have cohort-level data on FSM from before the policy change we
need to predict the ‘before’ data using later observations of the same pupils. We do the
same in England to ensure the data are comparable. Key Stage 2 data in Wales are available
for the whole period in our study but assessment by external examination was stopped in
2005. Teacher Assessment (TA) continued to be collected however, so after 2005 in both
England and Wales we use TA score13
.
13
We are aware that there may be some incomparability of teacher assessment processes due to the presence
or not of external validation of teacher scores in England and Wales respectively.

14
In England and Wales PLASC records contain pupils’ home postcodes, which enables us to
characterise the neighbourhood in which they live. We have matched pupils’ postcodes to
the socio-economic (Mosaic) classification of that address. Mosaic classification is a
postcode-level dataset that categorises each postcode in the UK into one of 61 different
types on the basis of demographics, socio-economics and consumption, financial measures,
and property characteristics and value14
. Over 400 variables are used to construct these
classifications and so this provides a rich picture of pupil’s neighbourhoods at a very local
level.
(b) Sample
To analyse changes in Dissimilarity Indices we construct a balanced panel of LEAs in England
and Wales matched on proportion FSM and population density. The matching regression is
shown in Table A4.
5. Results
We first set out our results for the impact of the abolition of league tables on school
performance, and then consider a number of robustness checks. Second, we consider the
impact on the sorting of pupils.
Impact of league tables on school performance
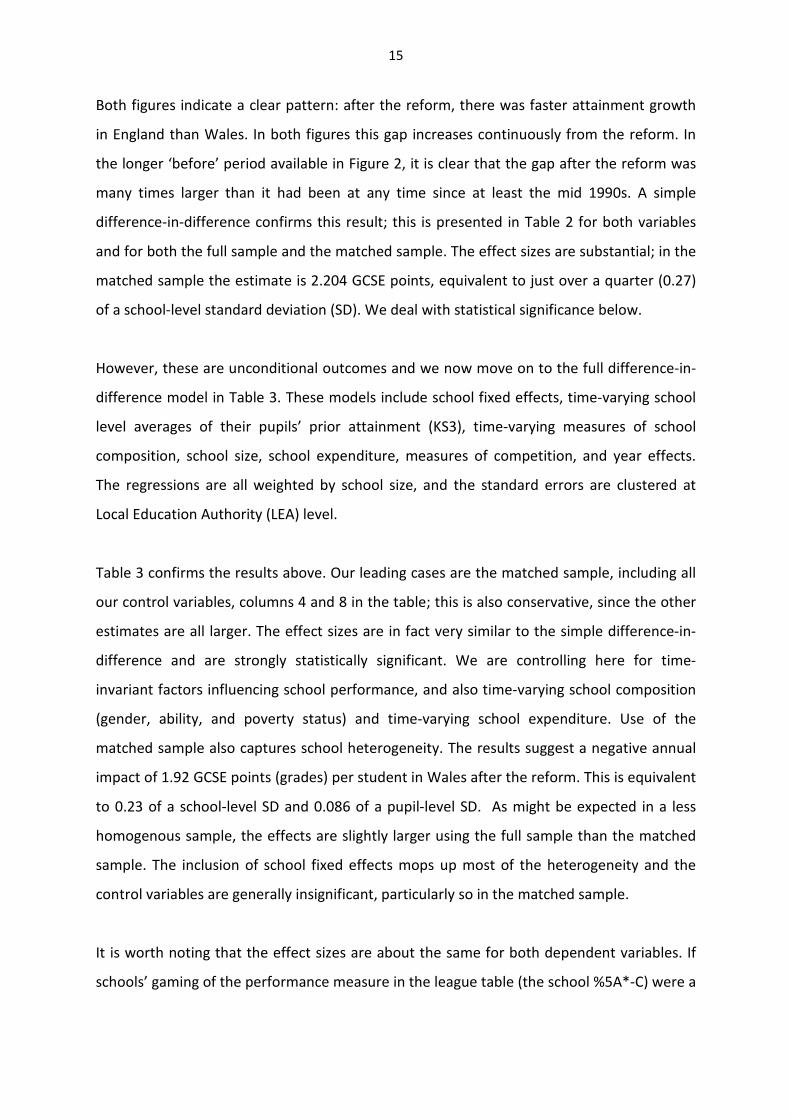
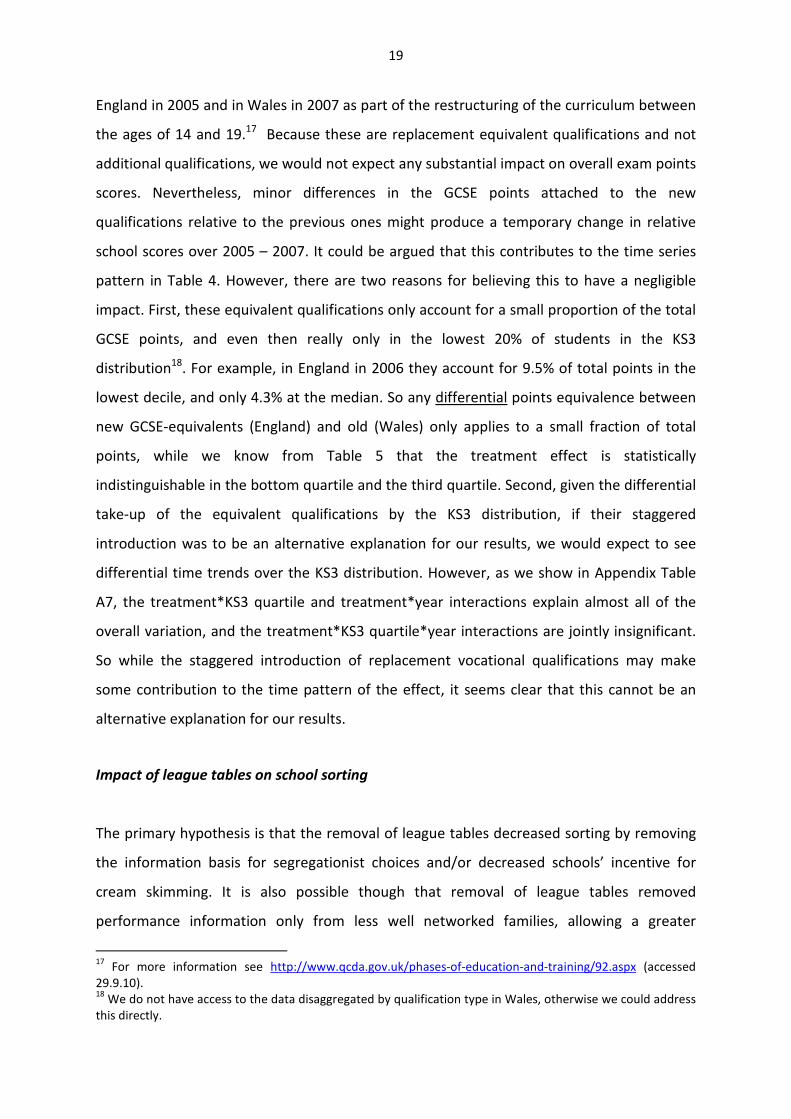
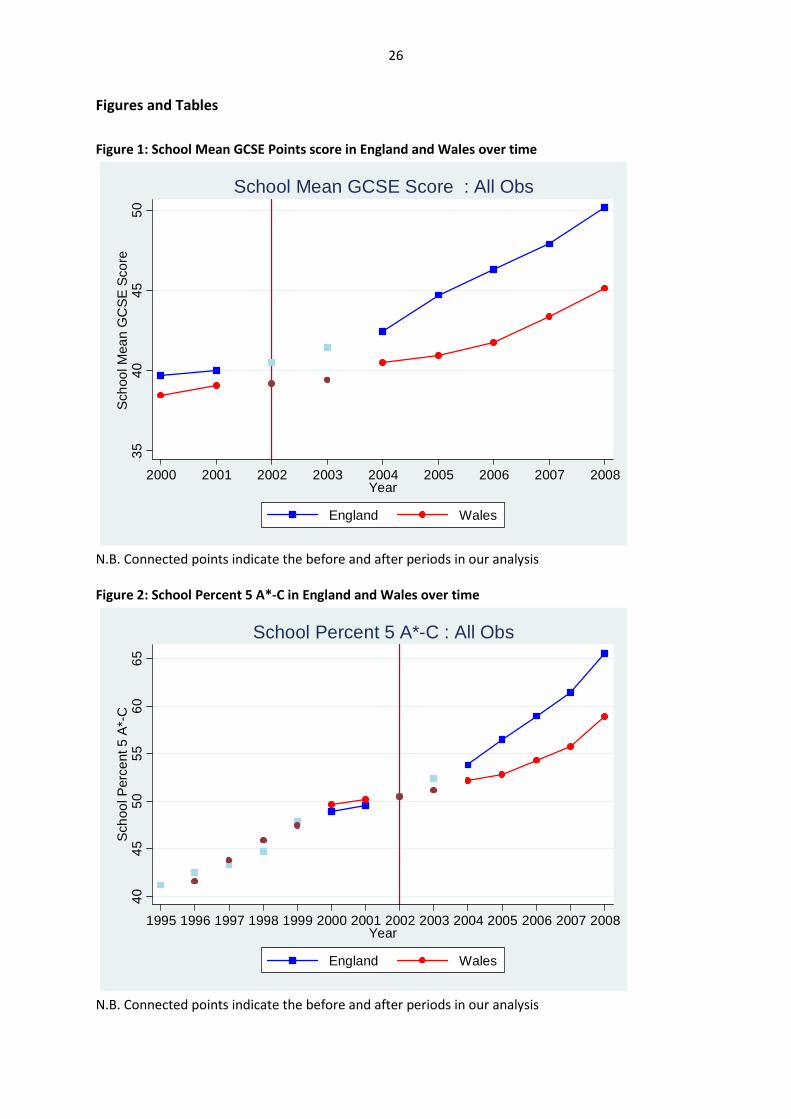
We start with two simple aggregate charts for our two dependent variables, the country-
year averages of the school mean GCSE points (Figure 1), and the percentage of the school’s
pupils gaining at least 5 grade Cs or above (Figure 2). In both figures, the vertical line
indicates the timing of the policy change, and the two unconnected points are the in-
between years, neither wholly before nor wholly after the policy change. Figure 2 provides
the much longer history available on the 5 A*-C measure (these earlier points cannot be
included in our regression analysis for data reasons, discussed above).
14
For more information see http://www.experian.co.uk/business-services/business-services.html.
15
Both figures indicate a clear pattern: after the reform, there was faster attainment growth
in England than Wales. In both figures this gap increases continuously from the reform. In
the longer ‘before’ period available in Figure 2, it is clear that the gap after the reform was
many times larger than it had been at any time since at least the mid 1990s. A simple
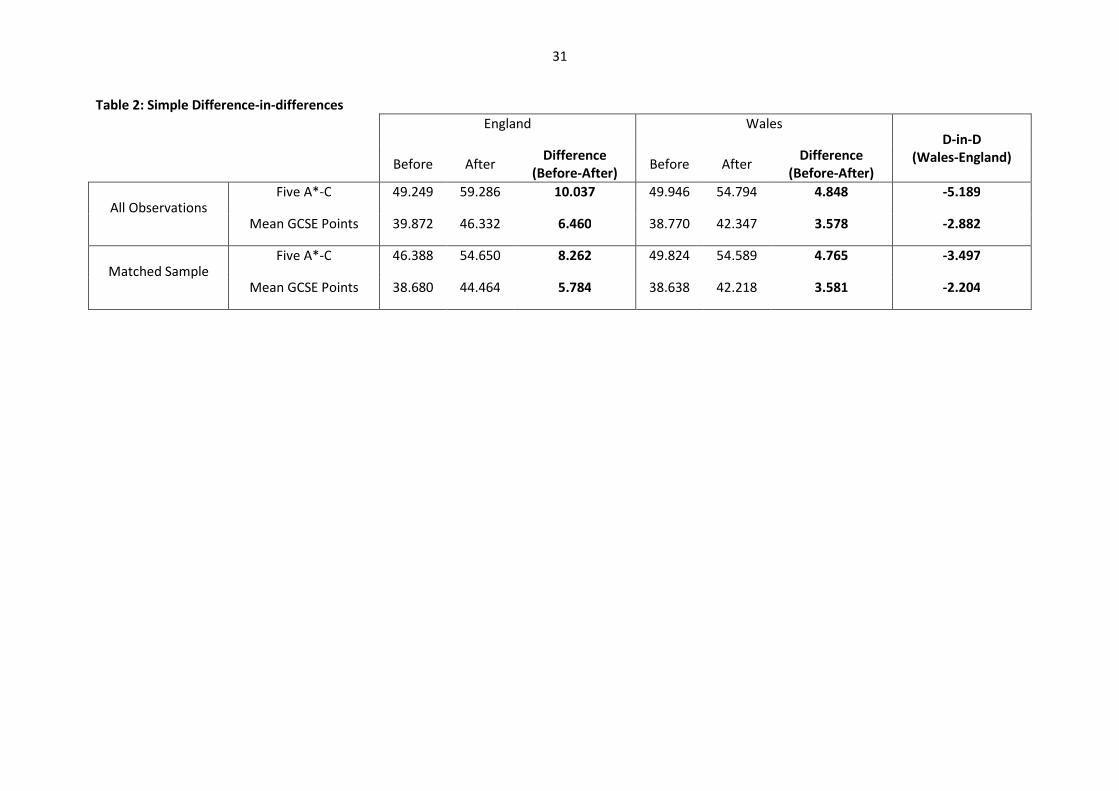
difference-in-difference confirms this result; this is presented in Table 2 for both variables
and for both the full sample and the matched sample. The effect sizes are substantial; in the
matched sample the estimate is 2.204 GCSE points, equivalent to just over a quarter (0.27)
of a school-level standard deviation (SD). We deal with statistical significance below.
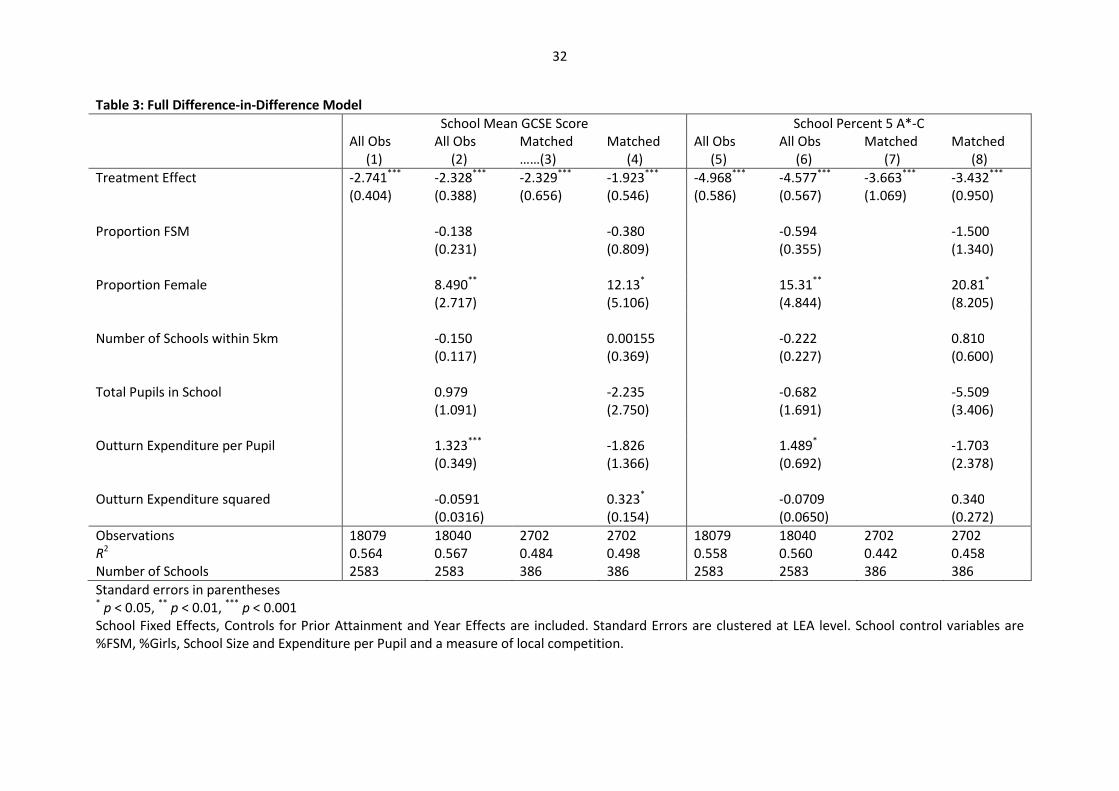
However, these are unconditional outcomes and we now move on to the full difference-in-
difference model in Table 3. These models include school fixed effects, time-varying school
level averages of their pupils’ prior attainment (KS3), time-varying measures of school
composition, school size, school expenditure, measures of competition, and year effects.
The regressions are all weighted by school size, and the standard errors are clustered at
Local Education Authority (LEA) level.
Table 3 confirms the results above. Our leading cases are the matched sample, including all
our control variables, columns 4 and 8 in the table; this is also conservative, since the other
estimates are all larger. The effect sizes are in fact very similar to the simple difference-in-
difference and are strongly statistically significant. We are controlling here for time-
invariant factors influencing school performance, and also time-varying school composition
(gender, ability, and poverty status) and time-varying school expenditure. Use of the
matched sample also captures school heterogeneity. The results suggest a negative annual
impact of 1.92 GCSE points (grades) per student in Wales after the reform. This is equivalent
to 0.23 of a school-level SD and 0.086 of a pupil-level SD. As might be expected in a less
homogenous sample, the effects are slightly larger using the full sample than the matched
sample. The inclusion of school fixed effects mops up most of the heterogeneity and the
control variables are generally insignificant, particularly so in the matched sample.
It is worth noting that the effect sizes are about the same for both dependent variables. If
schools’ gaming of the performance measure in the league table (the school %5A*-C) were a

16
major factor, we would expect a considerably greater impact on the measured variable than
the un-measured variable.
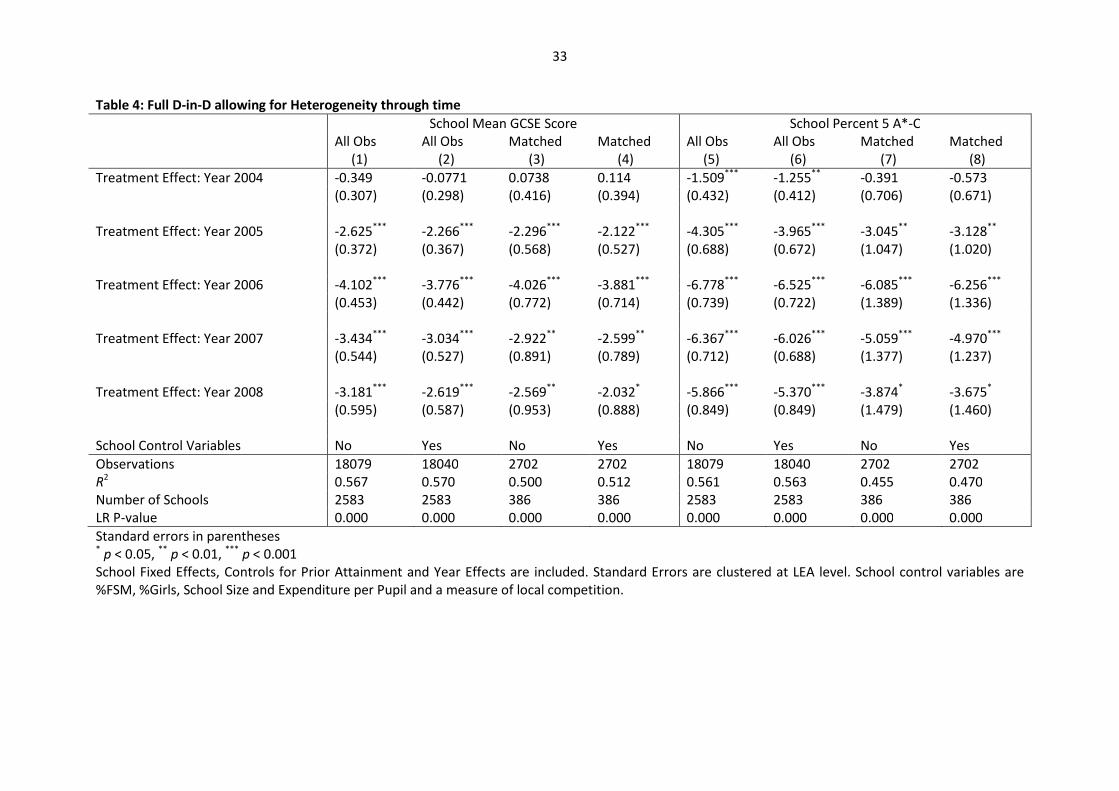
In Table 4 we allow the treatment effect to vary across different years after the reform. The
pattern is interesting – the impact is highest in 2006 and is lower by the end of our sample
in 2008. We test and confirm that the temporal variation is significant for each specification
shown. For the school mean GCSE score in the matched sample and including school
controls, the effect peaks at -3.88 GCSE points (grades), and remains at -2.03 points in 2008.
The pattern is less distinct in the full sample, with greater impacts in 2008. The effect
remains significantly different from zero in the final year, unsurprisingly more strongly so in
the full sample, more than six times bigger than the matched sample. We return to the
temporal pattern in the robustness checks below.
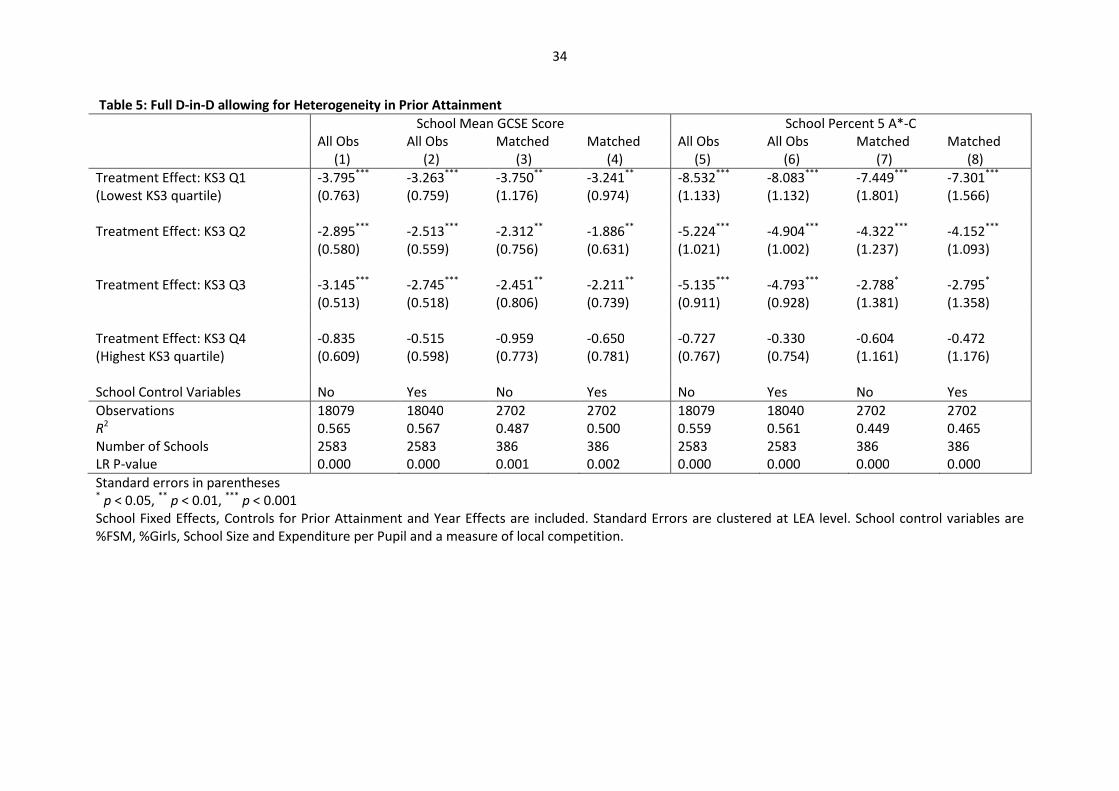
In Tables 5 and 6 we explore different dimensions of effect heterogeneity by school
characteristics. Table 5 shows significant heterogeneity by quartile of the school’s ability
profile (measured by KS3). The impact of the reform is most negative for the schools in the
lowest quartile of student ability and insignificant for schools in the highest quartile. Again,
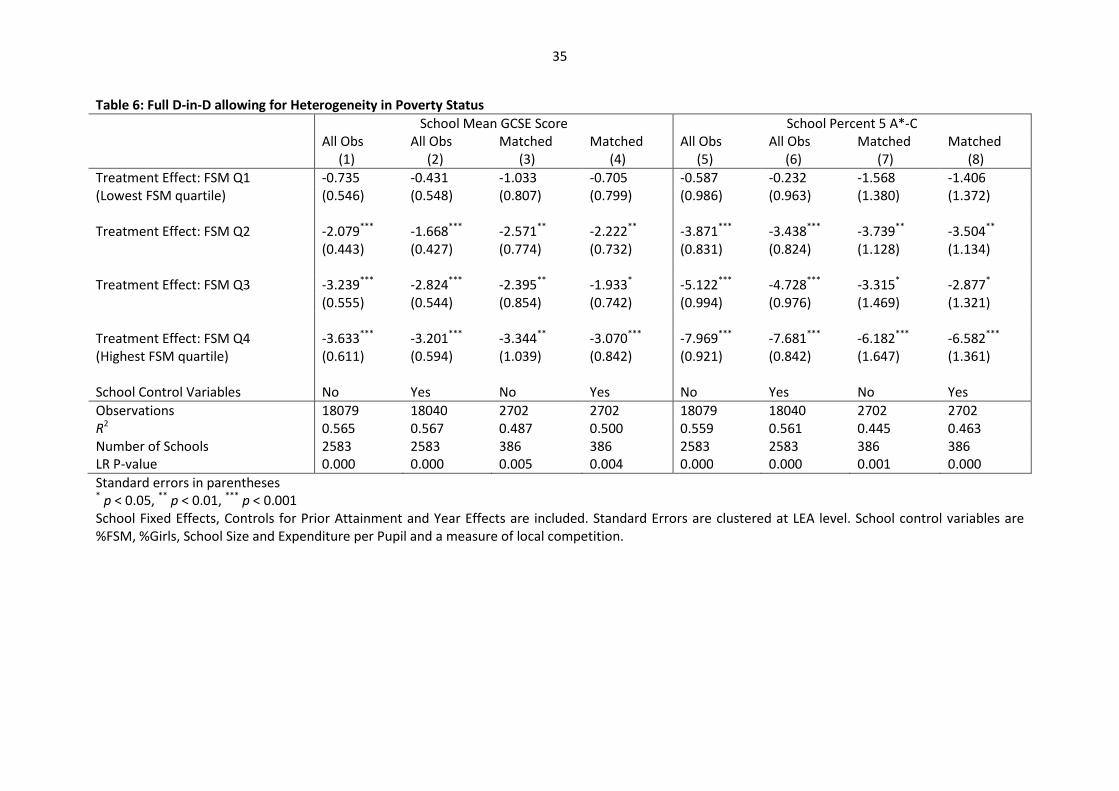
the LR test shows these effects to be significant in each specification. Table 6 shows a very
similar story by quartile of the poverty rate of the school. The reform has the greatest
negative impact in the poorest quartile of schools, and has no statistically significant effect
for the least poor schools. The pattern is repeated again by quartile of schools’ position in
the league tables (not reported). Taken together, these results show that the ‘best’ Welsh
schools – measured by highest prior attainment, lowest poverty rate, and sitting at the top
of the league tables – perform in a similar way to their matched English counterparts, and
appear to be unaffected by the reform. The lower 75% of schools are affected negatively
however, with the poorest and lowest ability schools falling behind the most.
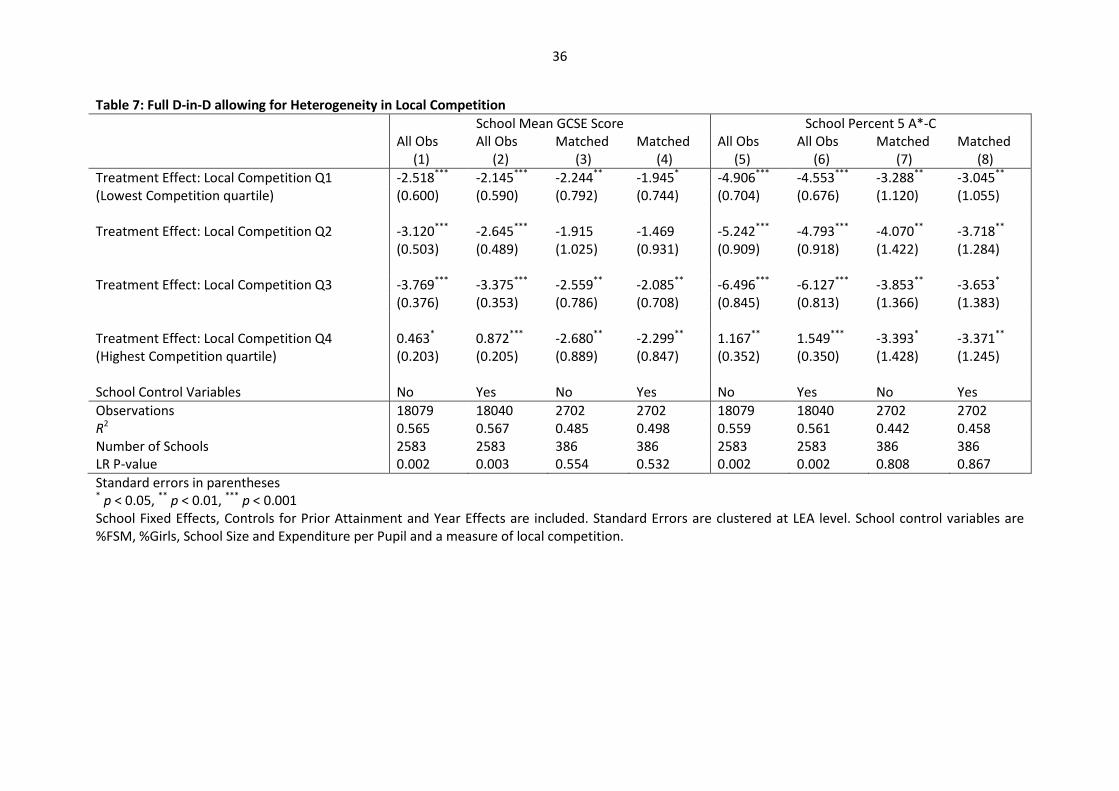
Finally, we consider whether the treatment effect varies by our measure of local
competition. Table 7 shows that the impact effect is robust across rural and urban areas
(though very urban areas in England are not in the matched sample). We do not see any
systematic differential effect by degree of competition.

17
Robustness checks
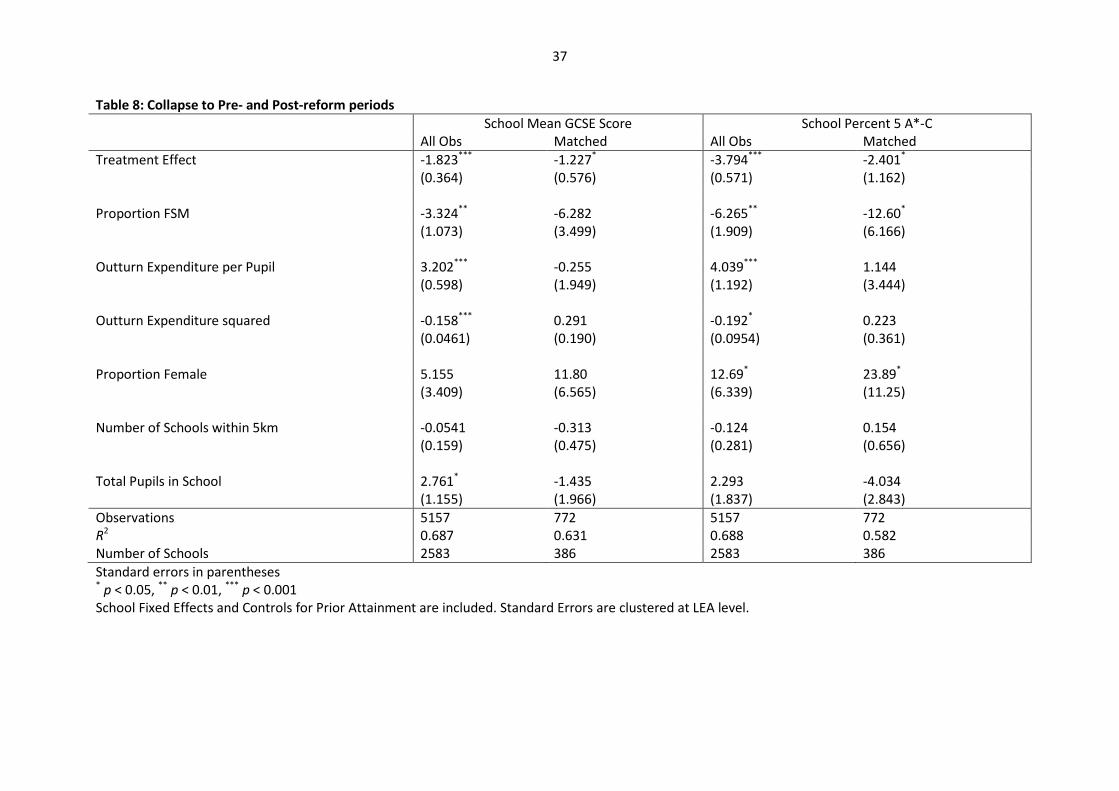
In the results above, we have ignored the time series properties of the data. Bertrand,
Duflo and Mullainathan (2004) show that serial correlation can be a problem for difference-
in-difference estimation, leading to downward bias in standard errors and to over-rejection
in hypothesis tests. In a panel setting they suggest that collapsing the time dimension to
‘before’ and ‘after’ periods, that is, reducing the time series information performs well as a
correction. We report the results of doing this in Table 8; the results remain significant after
this transformation, suggesting that serial correlation is not a major concern.
One of the key assumptions in a difference-in-difference setting is that the composition of
the two groups does not change. We consider two possible reasons why this assumption
might not hold in this case. For some families, private schools are a margin of school choice
that we need to consider. Some families in Wales might re-consider private schools once
information on state schools was restricted. This would change the composition of some
schools at the margin and might bias our estimates. In fact, data from the Independent
Schools Council on pupils attending private secondary schools does not show a sharp rise in
private school attendance in either country around the time of the policy reform (see Table
A5).
A second possibility is significant movements of families across the border between England
and Wales in response to the policy reform. The data in Table A5 indicate that the numbers
are small and in fact show no large change in pupils living in England attending Welsh
schools or pupils living in Wales attending English schools.
We consider a further experiment. Primary schools in England and Wales experienced no
such differential reform over the same time period. In England, league tables of KS2 scores
have been published since 1996, but have never been published in Wales. All that changes
over the policy date is devolution and a desire to foster a new ethos of collaboration
between schools, so this allows us to separate this potential overall effect from the removal

18
of the league tables. In order to “difference” primary and secondary school data, we
collapse primary and secondary data to LEA-year cells and standardise the dependent
variables15
. We estimate a triple-difference (after – before)*(Wales – England)*(primary –
secondary) over LEA-year cells and report the results in Table A6. We find a large,
statistically significant treatment effect of around 1 school-level SD; this essentially comes
from the substantial negative effect at secondary level discussed above, plus a large positive
effect at primary level.16
Finally we consider the possibility that other differential and coincident policy changes
might have been responsible for our results. We have found two potential candidates. First,
the ‘Literacy Hour’ was introduced in primary schools in England in 1998, and Machin and
McNally (2008) find a positive effect of the policy on reading scores at the end of primary
school. The timing means that our first ‘after’ cohort were the first to be exposed to the
policy in England but not Wales; this therefore offers an alternative potential explanation of
the relative acceleration in secondary schools in England. However, there are a number of
reasons to be sceptical about the capacity of this to explain our results. First, we are
controlling for prior attainment (KS3 tests at age 14) and it is hard to see an age 5–11 policy
exerting a strong influence on progress at age 14–16, controlling for attainment at age 14.
Second, the effect was only found in urban areas, while large parts of our matched sample
are very rural areas. We think it unlikely therefore that our results are a literacy hour effect
in disguise.
The second coincident policy change was the staggered introduction of replacement
qualifications in England and Wales. In addition to the regular GCSE qualifications, schools in
both England and Wales have used GCSE-equivalent qualifications, typically more vocational
qualifications and more frequently used for less academically able children. They count
towards the GCSE points total and the fraction of pupils gaining at least five ‘C’ grades or
better, and are in our data as such. The new equivalent qualifications were introduced in
15
The data do not allow a perfect equivalent model as we do not have KS1 scores to use as prior attainment
control. So the primary school component has no prior attainment. 16
We do not want to speculate too strongly on the cause of the positive effect we see at primary level,
because of the potential incomparability of teacher assessments across England and Wales (as noted in
footnote 13).
19
England in 2005 and in Wales in 2007 as part of the restructuring of the curriculum between
the ages of 14 and 19.17
Because these are replacement equivalent qualifications and not
additional qualifications, we would not expect any substantial impact on overall exam points
scores. Nevertheless, minor differences in the GCSE points attached to the new
qualifications relative to the previous ones might produce a temporary change in relative
school scores over 2005 – 2007. It could be argued that this contributes to the time series
pattern in Table 4. However, there are two reasons for believing this to have a negligible
impact. First, these equivalent qualifications only account for a small proportion of the total
GCSE points, and even then really only in the lowest 20% of students in the KS3
distribution18
. For example, in England in 2006 they account for 9.5% of total points in the
lowest decile, and only 4.3% at the median. So any differential points equivalence between
new GCSE-equivalents (England) and old (Wales) only applies to a small fraction of total
points, while we know from Table 5 that the treatment effect is statistically
indistinguishable in the bottom quartile and the third quartile. Second, given the differential
take-up of the equivalent qualifications by the KS3 distribution, if their staggered
introduction was to be an alternative explanation for our results, we would expect to see
differential time trends over the KS3 distribution. However, as we show in Appendix Table
A7, the treatment*KS3 quartile and treatment*year interactions explain almost all of the
overall variation, and the treatment*KS3 quartile*year interactions are jointly insignificant.
So while the staggered introduction of replacement vocational qualifications may make
some contribution to the time pattern of the effect, it seems clear that this cannot be an
alternative explanation for our results.
Impact of league tables on school sorting
The primary hypothesis is that the removal of league tables decreased sorting by removing
the information basis for segregationist choices and/or decreased schools’ incentive for
cream skimming. It is also possible though that removal of league tables removed
performance information only from less well networked families, allowing a greater
17
For more information see http://www.qcda.gov.uk/phases-of-education-and-training/92.aspx (accessed
29.9.10). 18
We do not have access to the data disaggregated by qualification type in Wales, otherwise we could address
this directly.

20
concentration of better off families in the high-scoring schools. In fact, in the range of
analyses we report below, the overall result is of little impact of the policy on sorting. We
are confident that sorting has not decreased in Wales relative to England.
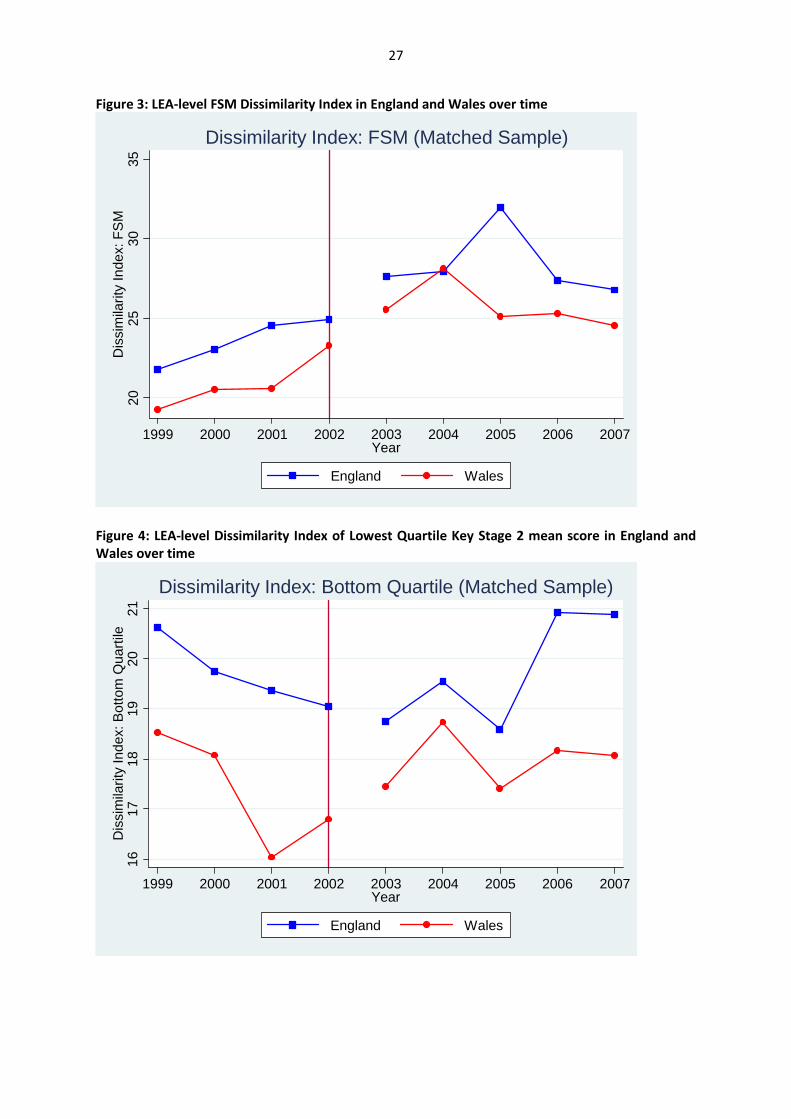
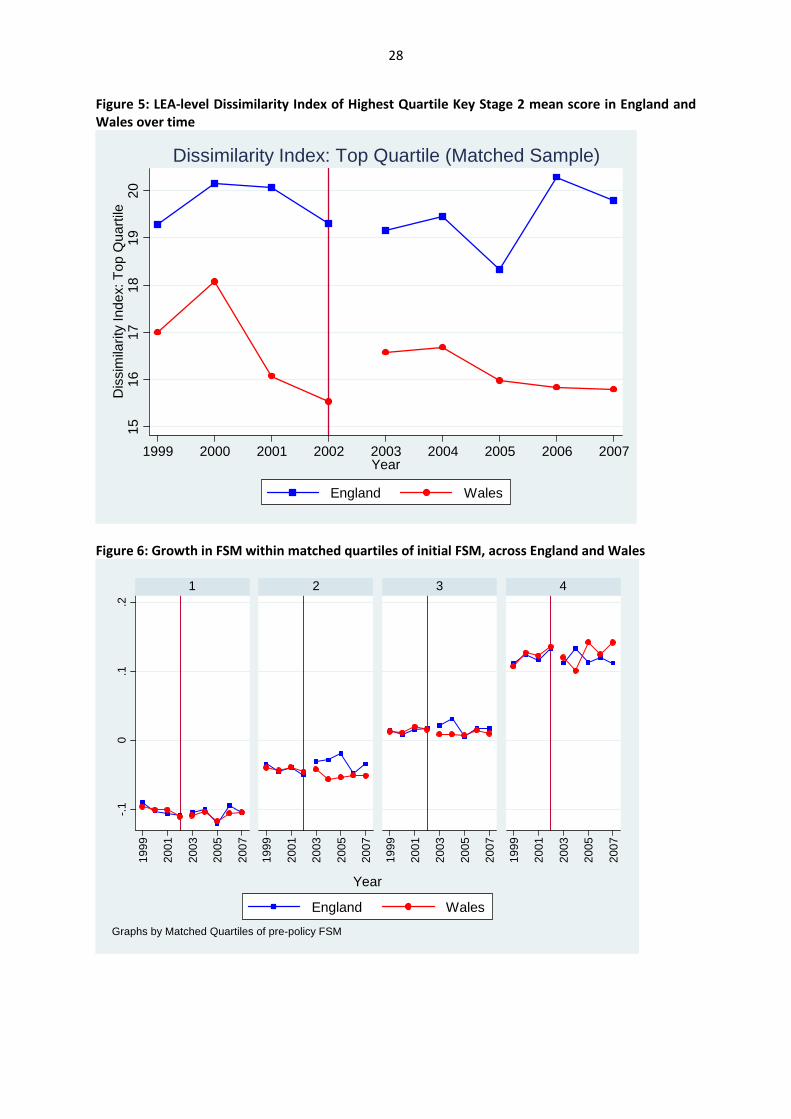
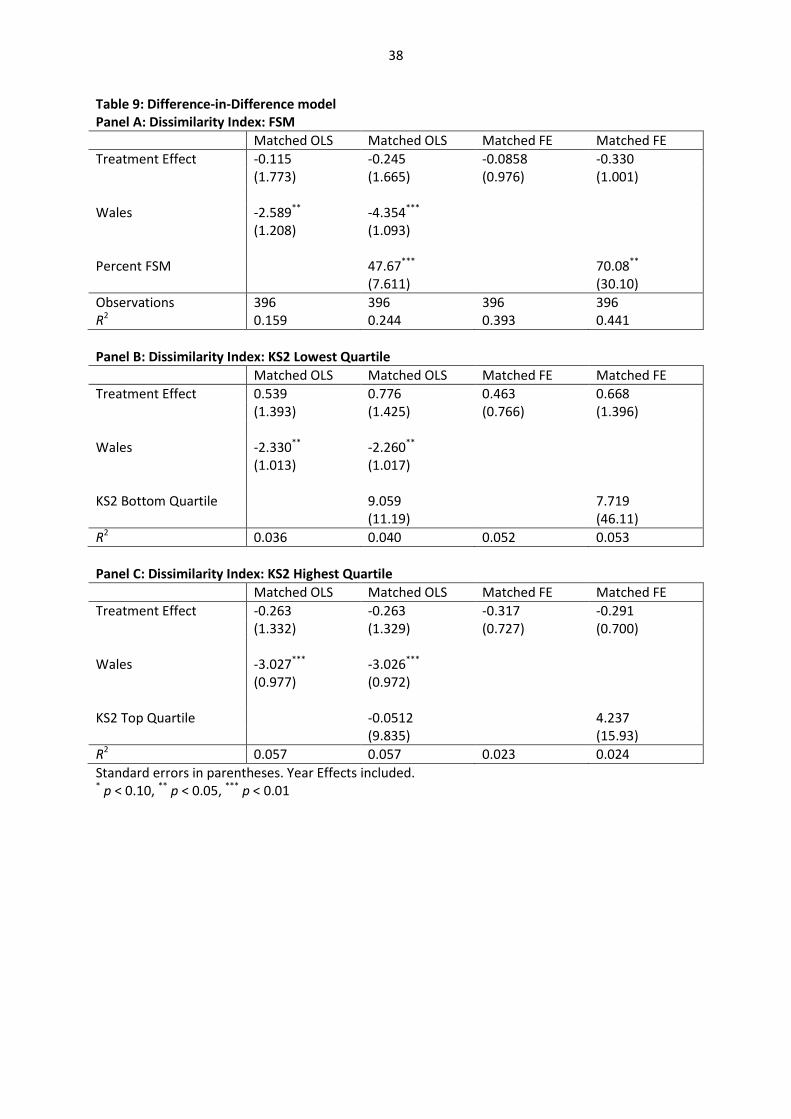
We start by plotting country-averages of simple Dissimilarity Indices for poverty status, top
and bottom ability quartiles (see Duncan and Duncan, 1955; Massey & Denton 1988) at LEA
level over the policy change. Figures 3 – 5 show that the Dissimilarity Indices are noisy, but
there appears to be no consistent picture of change in sorting in Wales relative to England,
with the possible exception of the top quartile19
. In a regression framework, the difference-
in-difference estimates in Table 9 Panels A–C confirm this, finding no statistical effect of the
league table policy change.
However, there are different dimensions to sorting and we consider two other ways of
quantifying sorting. First, we match all Welsh schools with English schools on FSM
percentage in the ‘before’ period. We then split these into quartiles and trace out the
evolution of the percentage FSM for each quartile separately for England and Wales
(normalised by the national aggregate time series). The idea is to see whether we see any
reduction in polarisation: whether poor schools become less poor in Wales and more
affluent schools more poor. Figure 6 shows that this is not the case, and the regressions in
Table 10 confirm very little significant impact of the policy change on FSM concentration.
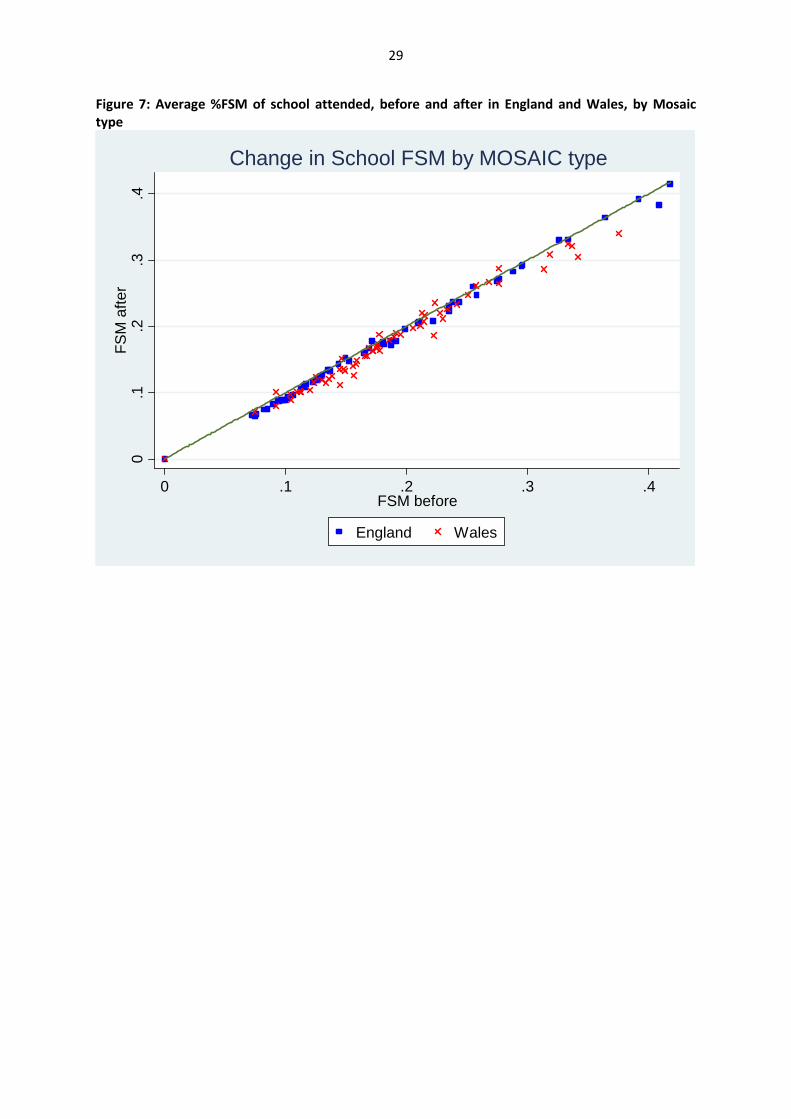
Finally, we look at the likelihood of pupils from different neighbourhoods being able to
access high-scoring schools. We assign pupils to Mosaic neighbourhood types based on their
home postcode and calculate the mean poverty rate of the schools attended by pupils of
each Mosaic type. We regress this mean school poverty rate on Mosaic code dummies
before and after the policy change, in both England and Wales. We then examine whether
the average proportion FSM of the schools pupils from the same Mosaic types go to changes
after the policy. The figures are graphed in Figure 7; each observation represents a
particular Mosaic neighbourhood type, the horizontal axis the pre-reform period and the
vertical axis the post-reform period. The value plotted is the mean poverty rate of schools
19
Confidence intervals for D indices are not straightforward to calculate (see Allen, Burgess & Windmeijer
2009) so we rely on the difference-in-difference for statistical significance.

21
attended by students living in that Mosaic type in that period. If the data lie along a line
steeper than 45o, this indicates polarisation, and we are obviously interested in a differential
slope between England and Wales. The figure hints at a slightly steeper slope in Wales, and
this is confirmed in the regressions in Table 11. The OLS coefficient suggests increasing
stratification in Wales but not in England, the positive coefficient indicating poor schools
getting poorer and rich schools getting richer. We also ran a median regression to reduce
the effect of outliers with so few observations, and this yields the same answer.
6. Conclusion
The publication of school performance tables based on a national testing programme is a
common aspect of school accountability systems. It is a core element of the long-standing
accountability system in England and of the NCLB Act in the US. In this paper we exploit a
natural experiment which involved this component of an accountability system being
dropped. The policy change arose when the devolved government of Wales ended the
publication of the performance tables, thereby removing this source of comparative public
information, whilst they carried on as before in England. Our research design allows us to
circumvent the two main data problems that previous studies of accountability have had to
cope with: lack of a credible control group, and the introduction of a whole performance
management system at once (Figlio and Ladd, 2008). Using a difference-in-difference
regression we compare changes in England and Wales before and after the policy change in
2001 in order to isolate the impact of the policy change on two outcomes: school
effectiveness (value added) and pupil sorting across schools.
We find that the reform significantly and systematically reduces school effectiveness. The
effect is substantial, amounting to 0.23 of a school-level standard deviation or 0.09 of a
pupil-level SD. This is as effective (in a negative sense) as a class size increase of 8 students,
out of a typical class size of 30 (Angrist and Lavy, 1999). The publication of performance
tables given the pre-existence of the test score data is therefore extremely cost-effective; it
is arguably still very cost-effective even including the cost of the national test system. We

22
find significant heterogeneity in the effect of the policy reform: the performance of schools
in the top quartile of schools, by intake ability, poverty status or league table position, is not
affected. Our results show that the policy reform in Wales reduced average performance
and raised educational inequality.
We also investigate whether the removal of public performance information changed the
sorting of students to schools, testing the leading hypothesis that the league tables facilitate
segregation. In fact, we find no evidence that the policy change has had a significant impact
on either sorting by ability or by socioeconomic status.
Of course, teachers and schools may have broader aims than GCSE exam results for their
pupils. These are not measured in our data so we can say nothing about the potential
impact of (ceasing) publishing performance information on these broader educational
outcomes, nor on any potential impact on teacher and headteacher motivation or morale.
We can rule out a number of potential causes of our findings. They cannot be explained by
different resource levels or funding regimes as we control for that in our analysis. Our
estimation on a matched sample, the inclusion of school fixed effects and time-varying
school composition and resource variables all give us reason to be confident that we have
dealt with a lot of school heterogeneity. Nor is it the case that gaming of the league tables
simply ceased in Wales and continued in England: our results show that there is an impact
on an unpublished school-average measure of pupil progress between the ages of 14 and 16
as well as on the target indicator.
Finally we speculate on the most likely accountability channels through which this reduction
of public information is having an impact. The effect may partly be driven through the
reduction of centrally collated and published information for parental choice. The fact that
the effect is absent at the top end of the school performance adds to this view. Schools at
the top of the league tables are known to be so locally and are generally oversubscribed,
and we would not expect the removal of league table information to affect the incentives
facing such schools in the short to medium term. Contrary to this view, however, we find
that the impact of the reform does not vary significantly by the level of local competition,

23
which suggests that it is not only choice-based accountability that is driving our results.
Moreover, there is generally a relatively low level of potential choice in Wales, illustrated by
the matched English schools being located in largely rural areas. It appears unlikely,
therefore, that market-based accountability via parental choice is the main driver behind
our results.
If we now consider the concurrent administrative accountability system as a potential
channel for change, high-stakes testing at the end of compulsory schooling continued
unchanged and Local Authorities and national governments of both countries continued to
collect and monitor performance information on individual schools. This suggests that
diminished government scrutiny of performance data is unlikely to be the major pathway
for change. There is, however, less scope for ‘naming and shaming’ when results are no
longer regularly reported by the media, which may mean that this accountability mechanism
is perceived as less ‘high stakes’ in Wales compared to the very public school league tables
in England. Such high stakes, public accountability systems have been shown to have an
impact on provider behaviour in the UK health care context (Propper et al 2008; 2010) and it
may be that such systems elicit a similar response across schools, resulting in higher average
test scores.
Our results suggest that school accountability policies hold promise for raising school
performance, particularly for students in disadvantaged schools and neighbourhoods. If
uniform national test results exist, publishing these in a locally comparative format appears
to be an extremely cost-effective policy for raising attainment and reducing inequalities in
attainment.
24
References
Allen, R., Burgess, S. and Windmeijer, F. (2009) More reliable inference for segregation
indices, CMPO Working Paper 09/216, CMPO, University of Bristol.
Angrist, J and Lavy, V (1999) Using Maimonides’ rule to estimate the effect of class size on
scholastic achievement, Quarterly Journal of Economics, 114(2): 533-575.
Bertrand, M., Duflo, E. and Mullainathan, S. (2004) How much should we trust differences-
in-differences estimates? Quarterly Journal of Economics, 119(1): 246-275.
Burgess, S., Greaves, E., Vignoles, A., and Wilson, D. (2009) Parental choice of primary school
in England: what ‘type’ of school do parents choose? CMPO Working Paper 09/224, CMPO,
University of Bristol.
Burgess, S., Propper, C., Slater, H., and Wilson, D. (2005) Who wins and who loses from
school accountability? The distribution of educational gain in English secondary schools,
CMPO Working Paper 05/128, CMPO, University of Bristol.
Cardiff Council (2009) School Admissions Policy 2010/2011:
http://www.cardiff.gov.uk/objview.asp?Object_ID=14140& (accessed 15.7.10).
Dee, T. and Jacob, B. (2009) The impact of No Child Left Behind on student achievement,
NBER Working Paper No 15531, NBER: Cambridge MA.
Duncan, O. and Duncan, B. (1955) A methodological analysis of segregation indices,
American Sociological Review, 20(2): 210-217.
Figlio, D. and Ladd, H. (2008) School accountability and student achievement, in: Ladd, H.
and Fiske, E. (eds) Handbook of Research in Education Finance and Policy, London:
Routledge.
Hanushek, E. and Raymond, M. (2005) Does school accountability lead to improved student
performance?, Journal of Policy Analysis and Management, 24(2) p297-327.
Hoyle, R. and Robinson, J. (2003) League tables and school effectiveness: a mathematical
model, Proceedings of the Royal Society, 270: 113-119.
Jacob, B. and Levitt, S. (2003) Rotten apples: an investigation of the prevalence and
predictors of teacher cheating, The Quarterly Journal of Economics, 118(3): 843-877.
Machin, S., and McNally, S. (2008) The literacy hour, Journal of Public Economics, 92(5-6):
1441-1462.
Massey, D. and Denton, N. (1988) The dimensions of residential segregation, Social Forces,
67(2): 281-315.
Neal, D. and Schanzenbach, D. (2007) Left behind by design: proficiency counts and test-
based accountability, NBER Working Paper No. 13293, NBER: Cambridge MA.

25
Propper, C., Sutton, M., Whitnall, C. and Windmeijer, F. (2010) Incentives and targets in
hospital care: evidence from a natural experiment, Journal of Public Economics, 94(3-4):
318-335.
Propper, C., Sutton, M., Whitnall, C. and Windmeijer, F. (2008) Did ‘targets and terror’
reduce waiting times in England for hospital care?, The B.E. Journal of Economic Analysis and
Policy, 8(2) Contributions: Article 5.
Reback, R. (2008) Teaching to the rating: school accountability and the distribution of
student achievement, Journal of Public Economics, 92(5-6): 1394-1415.
Reynolds, D. (2008) New Labour, education and Wales: the devolution decade, Oxford
Review of Education, 34(6): 753-765.
Welsh Assembly Government (2001) Secondary school ‘league tables’ to be scrapped in
Wales, Department for Children, Education, Lifelong Learning and Skills:
http://wales.gov.uk/newsroom/educationandskills/2001/4026162/ (accessed 15.7.10).
Welsh Assembly Government (2008) School effectiveness framework: building effective
learning communities together, Department for Children, Education, Lifelong Learning and
Skills:
http://wales.gov.uk/docs/dcells/publications/091020frameworken.pdf (accessed 15.7.10).
West, A., Ingram, D., and Hind, A. (2006) ‘Skimming the cream’: admissions to charter
schools in the United States and to autonomous schools in England, Educational Policy,
20(4): 615-639.
Wilson, D. (2010) Targets, choice and voice: accountability in public services, 2020 Public
Services Trust: www.2020publicservicestrust.org/publications/ (accessed 10.9.10).
Wilson, D., Croxson, B., and Atkinson, A. (2006) ‘What gets measured gets done’:
headteachers’ responses to the English secondary school performance management system,
Policy Studies, 27(2): 153-171.
26
Figures and Tables
Figure 1: School Mean GCSE Points score in England and Wales over time 35
4045
50S
choo
l Mea
n G
CS
E S
core
2000 2001 2002 2003 2004 2005 2006 2007 2008Year
England Wales
School Mean GCSE Score : All Obs
N.B. Connected points indicate the before and after periods in our analysis
Figure 2: School Percent 5 A*-C in England and Wales over time
4045
5055
6065
Sch
ool P
erce
nt 5
A*-
C
1995 1996 1997 1998 1999 2000 2001 2002 2003 2004 2005 2006 2007 2008Year
England Wales
School Percent 5 A*-C : All Obs
N.B. Connected points indicate the before and after periods in our analysis
27
Figure 3: LEA-level FSM Dissimilarity Index in England and Wales over time
2025
3035
Dis
sim
ilarit
y In
dex:
FS
M
1999 2000 2001 2002 2003 2004 2005 2006 2007Year
England Wales
Dissimilarity Index: FSM (Matched Sample)
Figure 4: LEA-level Dissimilarity Index of Lowest Quartile Key Stage 2 mean score in England and
Wales over time
1617
1819
2021
Dis
sim
ilarit
y In
dex:
Bot
tom
Qua
rtile
1999 2000 2001 2002 2003 2004 2005 2006 2007Year
England Wales
Dissimilarity Index: Bottom Quartile (Matched Sample)
28
Figure 5: LEA-level Dissimilarity Index of Highest Quartile Key Stage 2 mean score in England and
Wales over time 15
1617
1819
20D
issi
mila
rity
Inde
x: T
op Q
uart
ile
1999 2000 2001 2002 2003 2004 2005 2006 2007Year
England Wales
Dissimilarity Index: Top Quartile (Matched Sample)
Figure 6: Growth in FSM within matched quartiles of initial FSM, across England and Wales
-.1
0.1
.2
1999
2001
2003
2005
2007
1999
2001
2003
2005
2007
1999
2001
2003
2005
2007
1999
2001
2003
2005
2007
1 2 3 4
England Wales
Year
Graphs by Matched Quartiles of pre-policy FSM
29
Figure 7: Average %FSM of school attended, before and after in England and Wales, by Mosaic
type 0
.1.2
.3.4
FS
M a
fter
0 .1 .2 .3 .4FSM before
England Wales
Change in School FSM by MOSAIC type
30
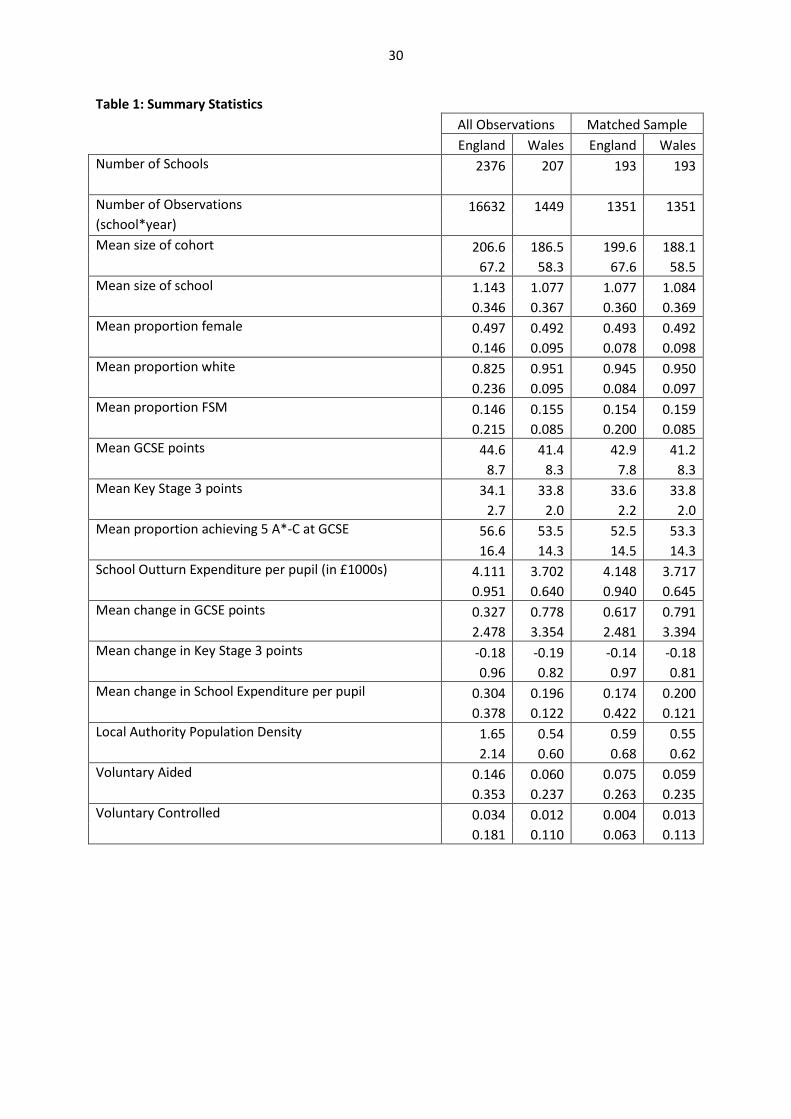
Table 1: Summary Statistics
All Observations Matched Sample
England Wales England Wales
Number of Schools 2376 207 193 193
Number of Observations 16632 1449 1351 1351
(school*year)
Mean size of cohort 206.6 186.5 199.6 188.1
67.2 58.3 67.6 58.5
Mean size of school 1.143 1.077 1.077 1.084
0.346 0.367 0.360 0.369
Mean proportion female 0.497 0.492 0.493 0.492
0.146 0.095 0.078 0.098
Mean proportion white 0.825 0.951 0.945 0.950
0.236 0.095 0.084 0.097
Mean proportion FSM 0.146 0.155 0.154 0.159
0.215 0.085 0.200 0.085
Mean GCSE points 44.6 41.4 42.9 41.2
8.7 8.3 7.8 8.3
Mean Key Stage 3 points 34.1 33.8 33.6 33.8
2.7 2.0 2.2 2.0
Mean proportion achieving 5 A*-C at GCSE 56.6 53.5 52.5 53.3
16.4 14.3 14.5 14.3
School Outturn Expenditure per pupil (in £1000s) 4.111 3.702 4.148 3.717
0.951 0.640 0.940 0.645
Mean change in GCSE points 0.327 0.778 0.617 0.791
2.478 3.354 2.481 3.394
Mean change in Key Stage 3 points -0.18 -0.19 -0.14 -0.18
0.96 0.82 0.97 0.81
Mean change in School Expenditure per pupil 0.304 0.196 0.174 0.200
0.378 0.122 0.422 0.121
Local Authority Population Density 1.65 0.54 0.59 0.55
2.14 0.60 0.68 0.62
Voluntary Aided 0.146 0.060 0.075 0.059
0.353 0.237 0.263 0.235
Voluntary Controlled 0.034 0.012 0.004 0.013
0.181 0.110 0.063 0.113
31
Table 2: Simple Difference-in-differences
England Wales
D-in-D
(Wales-England)
Before After Difference
(Before-After) Before After
Difference
(Before-After)
All Observations Five A*-C 49.249 59.286 10.037 49.946 54.794 4.848 -5.189
Mean GCSE Points 39.872 46.332 6.460 38.770 42.347 3.578 -2.882
Matched Sample Five A*-C 46.388 54.650 8.262 49.824 54.589 4.765 -3.497
Mean GCSE Points 38.680 44.464 5.784 38.638 42.218 3.581 -2.204
32
Table 3: Full Difference-in-Difference Model
School Mean GCSE Score School Percent 5 A*-C
All Obs All Obs Matched Matched All Obs All Obs Matched Matched
(1) (2) ……(3) (4) (5) (6) (7) (8)
Treatment Effect -2.741***
-2.328***
-2.329***
-1.923***
-4.968***
-4.577***
-3.663***
-3.432***
(0.404) (0.388) (0.656) (0.546) (0.586) (0.567) (1.069) (0.950)
Proportion FSM -0.138 -0.380 -0.594 -1.500
(0.231) (0.809) (0.355) (1.340)
Proportion Female 8.490**
12.13* 15.31
** 20.81
*
(2.717) (5.106) (4.844) (8.205)
Number of Schools within 5km -0.150 0.00155 -0.222 0.810
(0.117) (0.369) (0.227) (0.600)
Total Pupils in School 0.979 -2.235 -0.682 -5.509
(1.091) (2.750) (1.691) (3.406)
Outturn Expenditure per Pupil 1.323***
-1.826 1.489* -1.703
(0.349) (1.366) (0.692) (2.378)
Outturn Expenditure squared -0.0591 0.323* -0.0709 0.340
(0.0316) (0.154) (0.0650) (0.272)
Observations 18079 18040 2702 2702 18079 18040 2702 2702
R2 0.564 0.567 0.484 0.498 0.558 0.560 0.442 0.458
Number of Schools 2583 2583 386 386 2583 2583 386 386
Standard errors in parentheses * p < 0.05,
** p < 0.01,
*** p < 0.001
School Fixed Effects, Controls for Prior Attainment and Year Effects are included. Standard Errors are clustered at LEA level. School control variables are
%FSM, %Girls, School Size and Expenditure per Pupil and a measure of local competition.
33
Table 4: Full D-in-D allowing for Heterogeneity through time
School Mean GCSE Score School Percent 5 A*-C
All Obs All Obs Matched Matched All Obs All Obs Matched Matched
(1) (2) (3) (4) (5) (6) (7) (8)
Treatment Effect: Year 2004 -0.349 -0.0771 0.0738 0.114 -1.509***
-1.255**
-0.391 -0.573
(0.307) (0.298) (0.416) (0.394) (0.432) (0.412) (0.706) (0.671)
Treatment Effect: Year 2005 -2.625***
-2.266***
-2.296***
-2.122***
-4.305***
-3.965***
-3.045**
-3.128**
(0.372) (0.367) (0.568) (0.527) (0.688) (0.672) (1.047) (1.020)
Treatment Effect: Year 2006 -4.102***
-3.776***
-4.026***
-3.881***
-6.778***
-6.525***
-6.085***
-6.256***
(0.453) (0.442) (0.772) (0.714) (0.739) (0.722) (1.389) (1.336)
Treatment Effect: Year 2007 -3.434***
-3.034***
-2.922**
-2.599**
-6.367***
-6.026***
-5.059***
-4.970***
(0.544) (0.527) (0.891) (0.789) (0.712) (0.688) (1.377) (1.237)
Treatment Effect: Year 2008 -3.181***
-2.619***
-2.569**
-2.032* -5.866
*** -5.370
*** -3.874
* -3.675
*
(0.595) (0.587) (0.953) (0.888) (0.849) (0.849) (1.479) (1.460)
School Control Variables No Yes No Yes No Yes No Yes
Observations 18079 18040 2702 2702 18079 18040 2702 2702
R2 0.567 0.570 0.500 0.512 0.561 0.563 0.455 0.470
Number of Schools 2583 2583 386 386 2583 2583 386 386
LR P-value 0.000 0.000 0.000 0.000 0.000 0.000 0.000 0.000
Standard errors in parentheses * p < 0.05,
** p < 0.01,
*** p < 0.001
School Fixed Effects, Controls for Prior Attainment and Year Effects are included. Standard Errors are clustered at LEA level. School control variables are
%FSM, %Girls, School Size and Expenditure per Pupil and a measure of local competition.
34
Table 5: Full D-in-D allowing for Heterogeneity in Prior Attainment
School Mean GCSE Score School Percent 5 A*-C
All Obs All Obs Matched Matched All Obs All Obs Matched Matched
(1) (2) (3) (4) (5) (6) (7) (8)
Treatment Effect: KS3 Q1 -3.795***
-3.263***
-3.750**
-3.241**
-8.532***
-8.083***
-7.449***
-7.301***
(Lowest KS3 quartile) (0.763) (0.759) (1.176) (0.974) (1.133) (1.132) (1.801) (1.566)
Treatment Effect: KS3 Q2 -2.895***
-2.513***
-2.312**
-1.886**
-5.224***
-4.904***
-4.322***
-4.152***
(0.580) (0.559) (0.756) (0.631) (1.021) (1.002) (1.237) (1.093)
Treatment Effect: KS3 Q3 -3.145***
-2.745***
-2.451**
-2.211**
-5.135***
-4.793***
-2.788* -2.795
*
(0.513) (0.518) (0.806) (0.739) (0.911) (0.928) (1.381) (1.358)
Treatment Effect: KS3 Q4 -0.835 -0.515 -0.959 -0.650 -0.727 -0.330 -0.604 -0.472
(Highest KS3 quartile) (0.609) (0.598) (0.773) (0.781) (0.767) (0.754) (1.161) (1.176)
School Control Variables No Yes No Yes No Yes No Yes
Observations 18079 18040 2702 2702 18079 18040 2702 2702
R2 0.565 0.567 0.487 0.500 0.559 0.561 0.449 0.465
Number of Schools 2583 2583 386 386 2583 2583 386 386
LR P-value 0.000 0.000 0.001 0.002 0.000 0.000 0.000 0.000
Standard errors in parentheses * p < 0.05,
** p < 0.01,
*** p < 0.001
School Fixed Effects, Controls for Prior Attainment and Year Effects are included. Standard Errors are clustered at LEA level. School control variables are
%FSM, %Girls, School Size and Expenditure per Pupil and a measure of local competition.
35
Table 6: Full D-in-D allowing for Heterogeneity in Poverty Status
School Mean GCSE Score School Percent 5 A*-C
All Obs All Obs Matched Matched All Obs All Obs Matched Matched
(1) (2) (3) (4) (5) (6) (7) (8)
Treatment Effect: FSM Q1 -0.735 -0.431 -1.033 -0.705 -0.587 -0.232 -1.568 -1.406
(Lowest FSM quartile) (0.546) (0.548) (0.807) (0.799) (0.986) (0.963) (1.380) (1.372)
Treatment Effect: FSM Q2 -2.079***
-1.668***
-2.571**
-2.222**
-3.871***
-3.438***
-3.739**
-3.504**
(0.443) (0.427) (0.774) (0.732) (0.831) (0.824) (1.128) (1.134)
Treatment Effect: FSM Q3 -3.239***
-2.824***
-2.395**
-1.933* -5.122
*** -4.728
*** -3.315
* -2.877
*
(0.555) (0.544) (0.854) (0.742) (0.994) (0.976) (1.469) (1.321)
Treatment Effect: FSM Q4 -3.633***
-3.201***
-3.344**
-3.070***
-7.969***
-7.681***
-6.182***
-6.582***
(Highest FSM quartile) (0.611) (0.594) (1.039) (0.842) (0.921) (0.842) (1.647) (1.361)
School Control Variables No Yes No Yes No Yes No Yes
Observations 18079 18040 2702 2702 18079 18040 2702 2702
R2 0.565 0.567 0.487 0.500 0.559 0.561 0.445 0.463
Number of Schools 2583 2583 386 386 2583 2583 386 386
LR P-value 0.000 0.000 0.005 0.004 0.000 0.000 0.001 0.000
Standard errors in parentheses * p < 0.05,
** p < 0.01,
*** p < 0.001
School Fixed Effects, Controls for Prior Attainment and Year Effects are included. Standard Errors are clustered at LEA level. School control variables are
%FSM, %Girls, School Size and Expenditure per Pupil and a measure of local competition.
36
Table 7: Full D-in-D allowing for Heterogeneity in Local Competition
School Mean GCSE Score School Percent 5 A*-C
All Obs All Obs Matched Matched All Obs All Obs Matched Matched
(1) (2) (3) (4) (5) (6) (7) (8)
Treatment Effect: Local Competition Q1 -2.518***
-2.145***
-2.244**
-1.945* -4.906
*** -4.553
*** -3.288
** -3.045
**
(Lowest Competition quartile) (0.600) (0.590) (0.792) (0.744) (0.704) (0.676) (1.120) (1.055)
Treatment Effect: Local Competition Q2 -3.120***
-2.645***
-1.915 -1.469 -5.242***
-4.793***
-4.070**
-3.718**
(0.503) (0.489) (1.025) (0.931) (0.909) (0.918) (1.422) (1.284)
Treatment Effect: Local Competition Q3 -3.769***
-3.375***
-2.559**
-2.085**
-6.496***
-6.127***
-3.853**
-3.653*
(0.376) (0.353) (0.786) (0.708) (0.845) (0.813) (1.366) (1.383)
Treatment Effect: Local Competition Q4 0.463* 0.872
*** -2.680
** -2.299
** 1.167
** 1.549
*** -3.393
* -3.371
**
(Highest Competition quartile) (0.203) (0.205) (0.889) (0.847) (0.352) (0.350) (1.428) (1.245)
School Control Variables No Yes No Yes No Yes No Yes
Observations 18079 18040 2702 2702 18079 18040 2702 2702
R2 0.565 0.567 0.485 0.498 0.559 0.561 0.442 0.458
Number of Schools 2583 2583 386 386 2583 2583 386 386
LR P-value 0.002 0.003 0.554 0.532 0.002 0.002 0.808 0.867
Standard errors in parentheses * p < 0.05,
** p < 0.01,
*** p < 0.001
School Fixed Effects, Controls for Prior Attainment and Year Effects are included. Standard Errors are clustered at LEA level. School control variables are
%FSM, %Girls, School Size and Expenditure per Pupil and a measure of local competition.
37
Table 8: Collapse to Pre- and Post-reform periods
School Mean GCSE Score School Percent 5 A*-C
All Obs Matched All Obs Matched
Treatment Effect -1.823***
-1.227* -3.794
*** -2.401
*
(0.364) (0.576) (0.571) (1.162)
Proportion FSM -3.324**
-6.282 -6.265**
-12.60*
(1.073) (3.499) (1.909) (6.166)
Outturn Expenditure per Pupil 3.202***
-0.255 4.039***
1.144
(0.598) (1.949) (1.192) (3.444)
Outturn Expenditure squared -0.158***
0.291 -0.192* 0.223
(0.0461) (0.190) (0.0954) (0.361)
Proportion Female 5.155 11.80 12.69* 23.89
*
(3.409) (6.565) (6.339) (11.25)
Number of Schools within 5km -0.0541 -0.313 -0.124 0.154
(0.159) (0.475) (0.281) (0.656)
Total Pupils in School 2.761* -1.435 2.293 -4.034
(1.155) (1.966) (1.837) (2.843)
Observations 5157 772 5157 772
R2 0.687 0.631 0.688 0.582
Number of Schools 2583 386 2583 386
Standard errors in parentheses * p < 0.05,
** p < 0.01,
*** p < 0.001
School Fixed Effects and Controls for Prior Attainment are included. Standard Errors are clustered at LEA level.
38
Table 9: Difference-in-Difference model
Panel A: Dissimilarity Index: FSM
Matched OLS Matched OLS Matched FE Matched FE
Treatment Effect -0.115 -0.245 -0.0858 -0.330
(1.773) (1.665) (0.976) (1.001)
Wales -2.589**
-4.354***
(1.208) (1.093)
Percent FSM 47.67***
70.08**
(7.611) (30.10)
Observations 396 396 396 396
R2 0.159 0.244 0.393 0.441
Panel B: Dissimilarity Index: KS2 Lowest Quartile
Matched OLS Matched OLS Matched FE Matched FE
Treatment Effect 0.539 0.776 0.463 0.668
(1.393) (1.425) (0.766) (1.396)
Wales -2.330**
-2.260**
(1.013) (1.017)
KS2 Bottom Quartile 9.059 7.719
(11.19) (46.11)
R2 0.036 0.040 0.052 0.053
Panel C: Dissimilarity Index: KS2 Highest Quartile
Matched OLS Matched OLS Matched FE Matched FE
Treatment Effect -0.263 -0.263 -0.317 -0.291
(1.332) (1.329) (0.727) (0.700)
Wales -3.027***
-3.026***
(0.977) (0.972)
KS2 Top Quartile -0.0512 4.237
(9.835) (15.93)
R2 0.057 0.057 0.023 0.024
Standard errors in parentheses. Year Effects included. * p < 0.10,
** p < 0.05,
*** p < 0.01
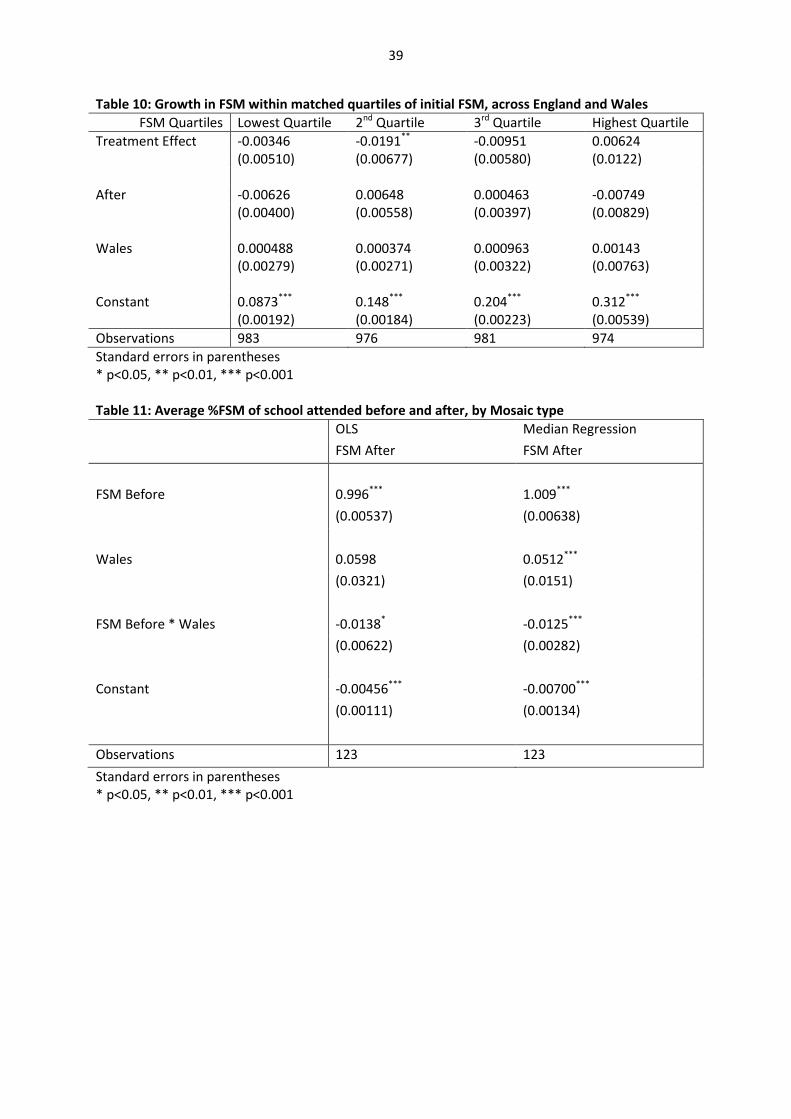
39
Table 10: Growth in FSM within matched quartiles of initial FSM, across England and Wales
FSM Quartiles Lowest Quartile 2nd
Quartile 3rd
Quartile Highest Quartile
Treatment Effect -0.00346 -0.0191**
-0.00951 0.00624
(0.00510) (0.00677) (0.00580) (0.0122)
After -0.00626 0.00648 0.000463 -0.00749
(0.00400) (0.00558) (0.00397) (0.00829)
Wales 0.000488 0.000374 0.000963 0.00143
(0.00279) (0.00271) (0.00322) (0.00763)
Constant 0.0873***
0.148***
0.204***
0.312***
(0.00192) (0.00184) (0.00223) (0.00539)
Observations 983 976 981 974
Standard errors in parentheses
* p<0.05, ** p<0.01, *** p<0.001
Table 11: Average %FSM of school attended before and after, by Mosaic type
OLS Median Regression
FSM After FSM After
FSM Before 0.996***
1.009***
(0.00537) (0.00638)
Wales 0.0598 0.0512***
(0.0321) (0.0151)
FSM Before * Wales -0.0138* -0.0125
***
(0.00622) (0.00282)
Constant -0.00456***
-0.00700***
(0.00111) (0.00134)
Observations 123 123
Standard errors in parentheses
* p<0.05, ** p<0.01, *** p<0.001
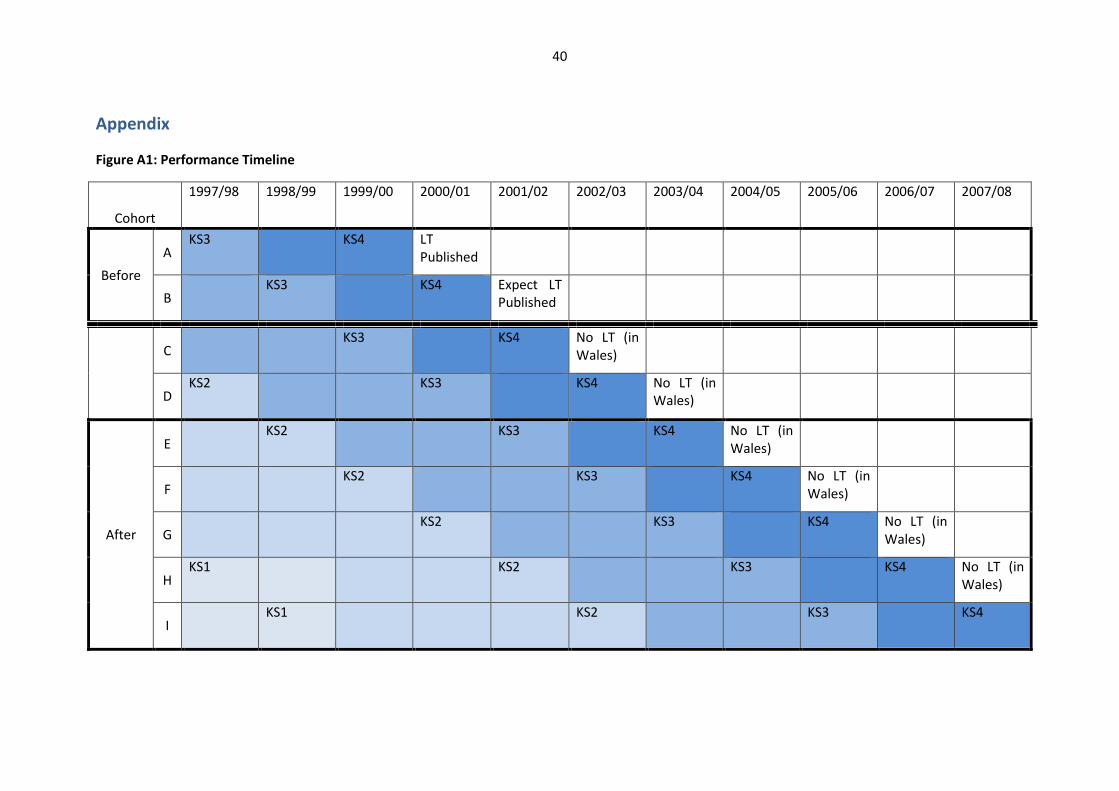
40
Appendix
Figure A1: Performance Timeline
Cohort
1997/98 1998/99 1999/00 2000/01 2001/02 2002/03 2003/04 2004/05 2005/06 2006/07 2007/08
Before
A KS3 KS4 LT
Published
B KS3 KS4 Expect LT
Published
C
KS3 KS4 No LT (in
Wales)
D KS2 KS3 KS4 No LT (in
Wales)
After
E KS2 KS3 KS4 No LT (in
Wales)
F KS2 KS3 KS4 No LT (in
Wales)
G KS2 KS3 KS4 No LT (in
Wales)
H KS1 KS2 KS3 KS4 No LT (in
Wales)
I KS1 KS2 KS3 KS4
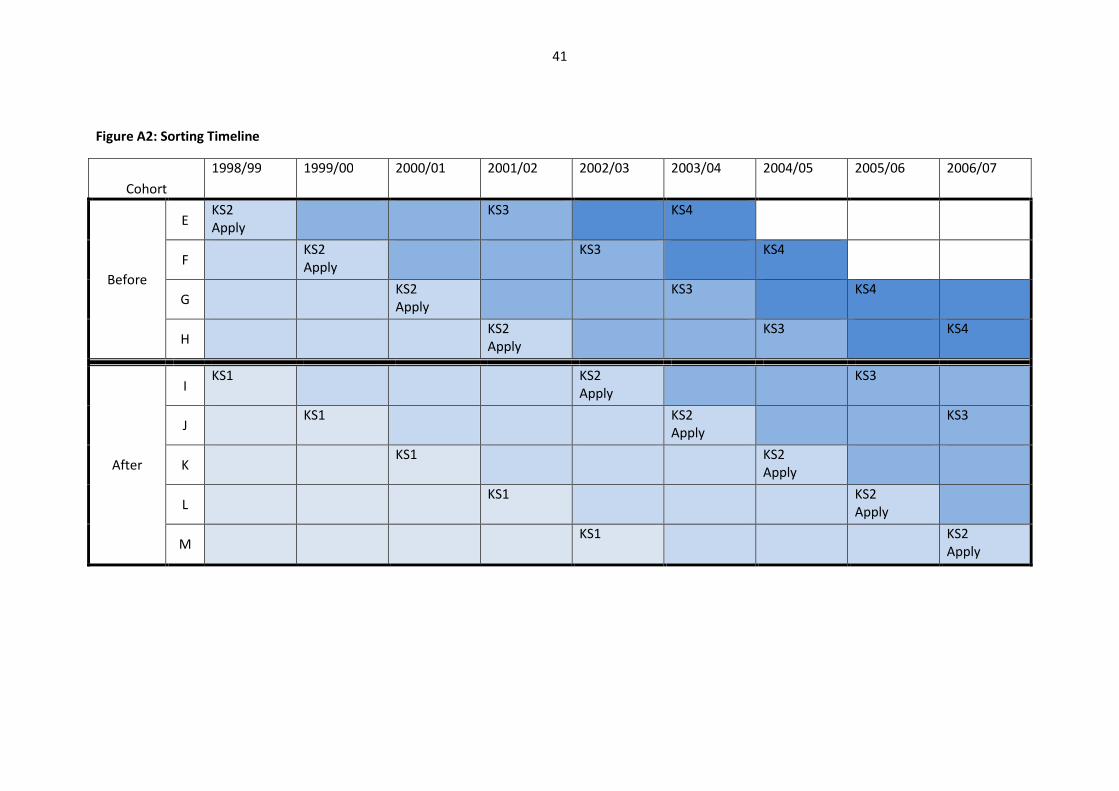
41
Figure A2: Sorting Timeline
Cohort
1998/99 1999/00 2000/01 2001/02 2002/03 2003/04 2004/05 2005/06 2006/07
Before
E KS2
Apply
KS3 KS4
F KS2
Apply
KS3 KS4
G KS2
Apply
KS3 KS4
H KS2
Apply
KS3 KS4
After
I KS1 KS2
Apply
KS3
J KS1 KS2
Apply
KS3
K KS1 KS2
Apply
L KS1 KS2
Apply
M KS1 KS2
Apply
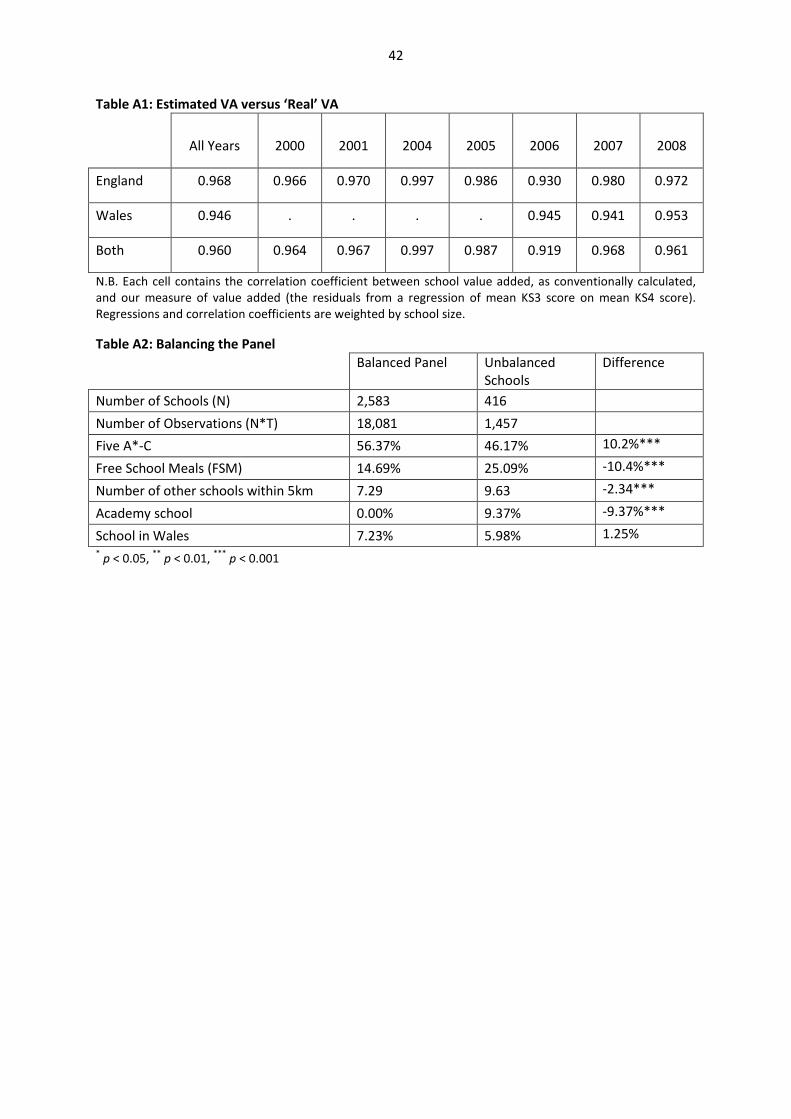
42
Table A1: Estimated VA versus ‘Real’ VA
All Years 2000 2001 2004 2005 2006 2007 2008
England 0.968 0.966 0.970 0.997 0.986 0.930 0.980 0.972
Wales 0.946 . . . . 0.945 0.941 0.953
Both 0.960 0.964 0.967 0.997 0.987 0.919 0.968 0.961
N.B. Each cell contains the correlation coefficient between school value added, as conventionally calculated,
and our measure of value added (the residuals from a regression of mean KS3 score on mean KS4 score).
Regressions and correlation coefficients are weighted by school size.
Table A2: Balancing the Panel
Balanced Panel Unbalanced
Schools
Difference
Number of Schools (N) 2,583 416
Number of Observations (N*T) 18,081 1,457
Five A*-C 56.37% 46.17% 10.2%***
Free School Meals (FSM) 14.69% 25.09% -10.4%***
Number of other schools within 5km 7.29 9.63 -2.34***
Academy school 0.00% 9.37% -9.37%***
School in Wales 7.23% 5.98% 1.25%
* p < 0.05,
** p < 0.01,
*** p < 0.001
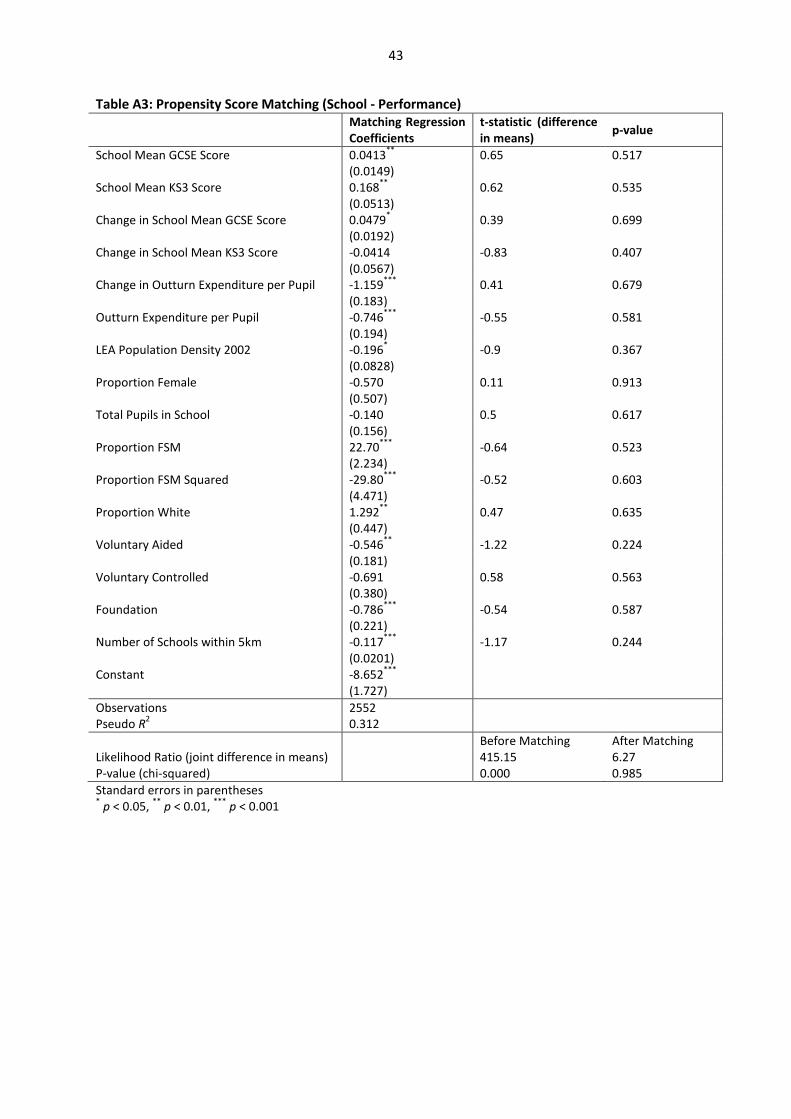
43
Table A3: Propensity Score Matching (School - Performance)
Matching Regression
Coefficients
t-statistic (difference
in means) p-value
School Mean GCSE Score 0.0413**
0.65 0.517
(0.0149)
School Mean KS3 Score 0.168**
0.62 0.535
(0.0513)
Change in School Mean GCSE Score 0.0479* 0.39 0.699
(0.0192)
Change in School Mean KS3 Score -0.0414 -0.83 0.407
(0.0567)
Change in Outturn Expenditure per Pupil -1.159***
0.41 0.679
(0.183)
Outturn Expenditure per Pupil -0.746***
-0.55 0.581
(0.194)
LEA Population Density 2002 -0.196* -0.9 0.367
(0.0828)
Proportion Female -0.570 0.11 0.913
(0.507)
Total Pupils in School -0.140 0.5 0.617
(0.156)
Proportion FSM 22.70***
-0.64 0.523
(2.234)
Proportion FSM Squared -29.80***
-0.52 0.603
(4.471)
Proportion White 1.292**
0.47 0.635
(0.447)
Voluntary Aided -0.546**
-1.22 0.224
(0.181)
Voluntary Controlled -0.691 0.58 0.563
(0.380)
Foundation -0.786***
-0.54 0.587
(0.221)
Number of Schools within 5km -0.117***
-1.17 0.244
(0.0201)
Constant -8.652***
(1.727)
Observations 2552
Pseudo R2 0.312
Before Matching After Matching
Likelihood Ratio (joint difference in means) 415.15 6.27
P-value (chi-squared) 0.000 0.985
Standard errors in parentheses * p < 0.05,
** p < 0.01,
*** p < 0.001
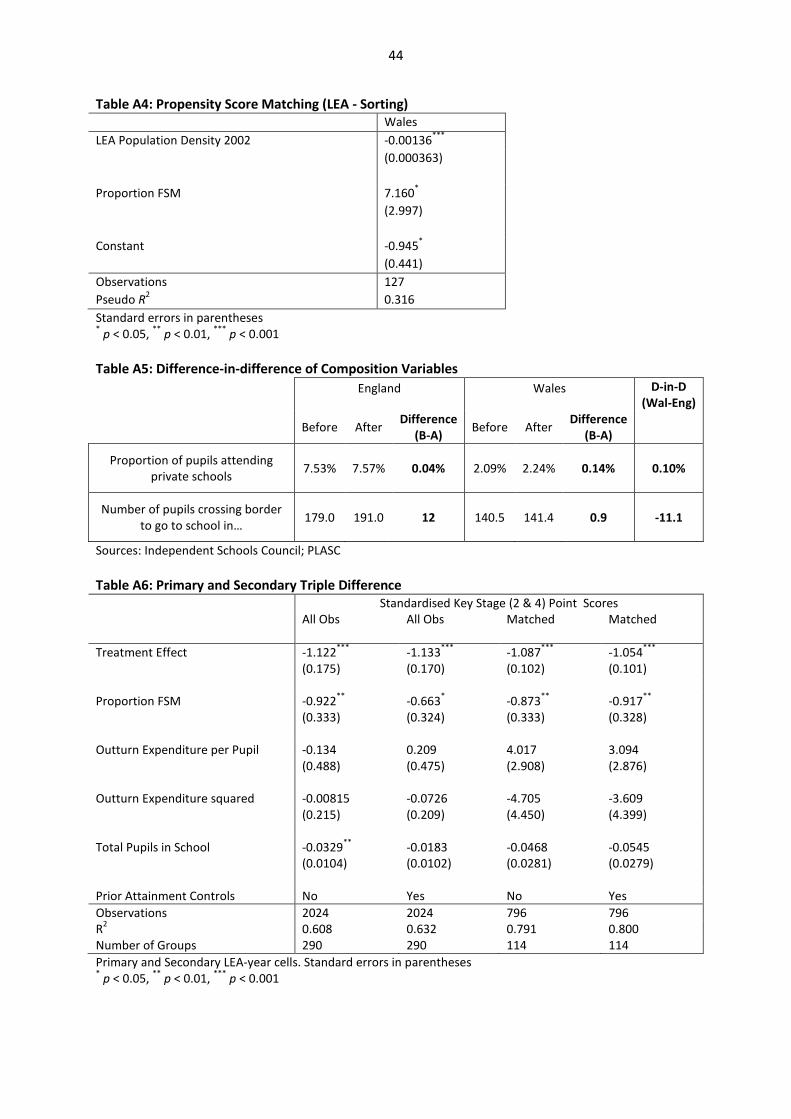
44
Table A4: Propensity Score Matching (LEA - Sorting)
Wales
LEA Population Density 2002 -0.00136***
(0.000363)
Proportion FSM 7.160*
(2.997)
Constant -0.945*
(0.441)
Observations 127
Pseudo R2 0.316
Standard errors in parentheses * p < 0.05,
** p < 0.01,
*** p < 0.001
Table A5: Difference-in-difference of Composition Variables
England Wales D-in-D
(Wal-Eng)
Before After
Difference
(B-A) Before After
Difference
(B-A)
Proportion of pupils attending
private schools 7.53% 7.57% 0.04% 2.09% 2.24% 0.14% 0.10%
Number of pupils crossing border
to go to school in… 179.0 191.0 12 140.5 141.4 0.9 -11.1
Sources: Independent Schools Council; PLASC
Table A6: Primary and Secondary Triple Difference
Standardised Key Stage (2 & 4) Point Scores
All Obs All Obs Matched Matched
Treatment Effect -1.122***
-1.133***
-1.087***
-1.054***
(0.175) (0.170) (0.102) (0.101)
Proportion FSM -0.922**
-0.663* -0.873
** -0.917
**
(0.333) (0.324) (0.333) (0.328)
Outturn Expenditure per Pupil -0.134 0.209 4.017 3.094
(0.488) (0.475) (2.908) (2.876)
Outturn Expenditure squared -0.00815 -0.0726 -4.705 -3.609
(0.215) (0.209) (4.450) (4.399)
Total Pupils in School -0.0329**
-0.0183 -0.0468 -0.0545
(0.0104) (0.0102) (0.0281) (0.0279)
Prior Attainment Controls No Yes No Yes
Observations 2024 2024 796 796
R2 0.608 0.632 0.791 0.800
Number of Groups 290 290 114 114
Primary and Secondary LEA-year cells. Standard errors in parentheses * p < 0.05,
** p < 0.01,
*** p < 0.001
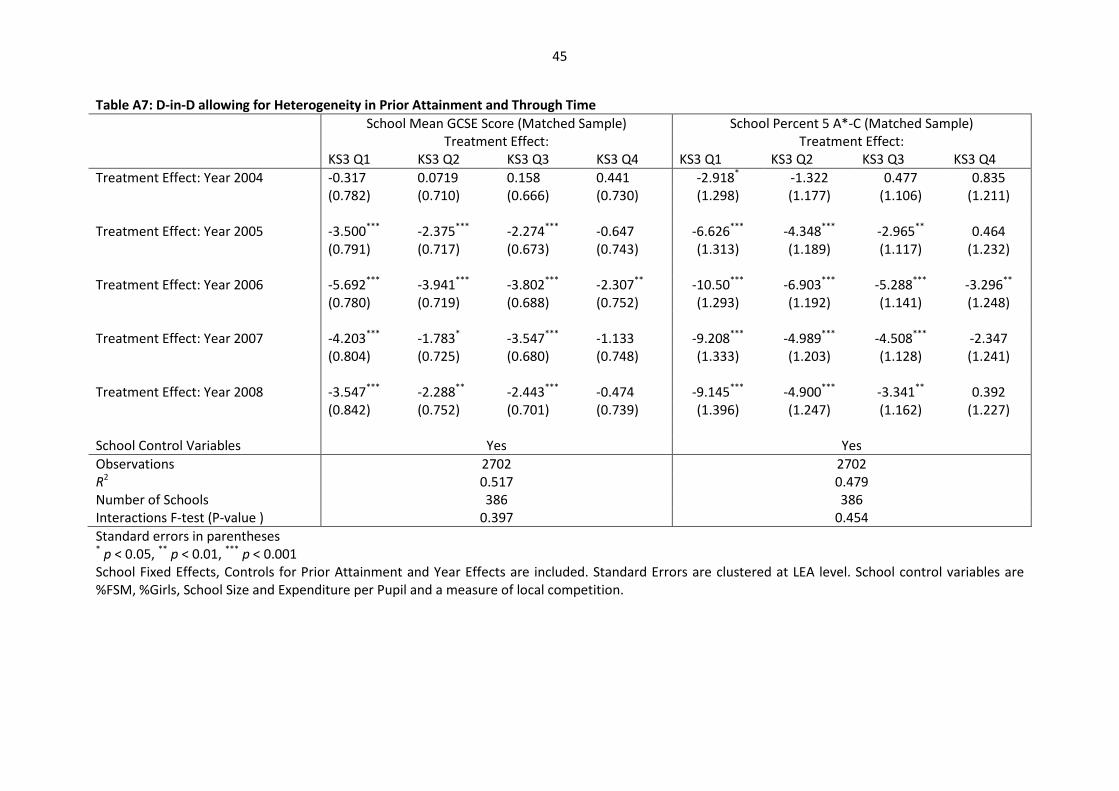
45
Table A7: D-in-D allowing for Heterogeneity in Prior Attainment and Through Time
School Mean GCSE Score (Matched Sample) School Percent 5 A*-C (Matched Sample)
Treatment Effect: Treatment Effect:
KS3 Q1 KS3 Q2 KS3 Q3 KS3 Q4 KS3 Q1 KS3 Q2 KS3 Q3 KS3 Q4
Treatment Effect: Year 2004 -0.317 0.0719 0.158 0.441 -2.918* -1.322 0.477 0.835
(0.782) (0.710) (0.666) (0.730) (1.298) (1.177) (1.106) (1.211)
Treatment Effect: Year 2005 -3.500***
-2.375***
-2.274***
-0.647 -6.626***
-4.348***
-2.965**
0.464
(0.791) (0.717) (0.673) (0.743) (1.313) (1.189) (1.117) (1.232)
Treatment Effect: Year 2006 -5.692***
-3.941***
-3.802***
-2.307**
-10.50***
-6.903***
-5.288***
-3.296**
(0.780) (0.719) (0.688) (0.752) (1.293) (1.192) (1.141) (1.248)
Treatment Effect: Year 2007 -4.203***
-1.783* -3.547
*** -1.133 -9.208
*** -4.989
*** -4.508
*** -2.347
(0.804) (0.725) (0.680) (0.748) (1.333) (1.203) (1.128) (1.241)
Treatment Effect: Year 2008 -3.547***
-2.288**
-2.443***
-0.474 -9.145***
-4.900***
-3.341**
0.392
(0.842) (0.752) (0.701) (0.739) (1.396) (1.247) (1.162) (1.227)
School Control Variables Yes Yes
Observations 2702 2702
R2 0.517 0.479
Number of Schools 386 386
Interactions F-test (P-value ) 0.397 0.454
Standard errors in parentheses * p < 0.05,
** p < 0.01,
*** p < 0.001
School Fixed Effects, Controls for Prior Attainment and Year Effects are included. Standard Errors are clustered at LEA level. School control variables are
%FSM, %Girls, School Size and Expenditure per Pupil and a measure of local competition.