Embed Size (px)
Citation preview

Net Sales at September 30, 2016
October 19, 2016
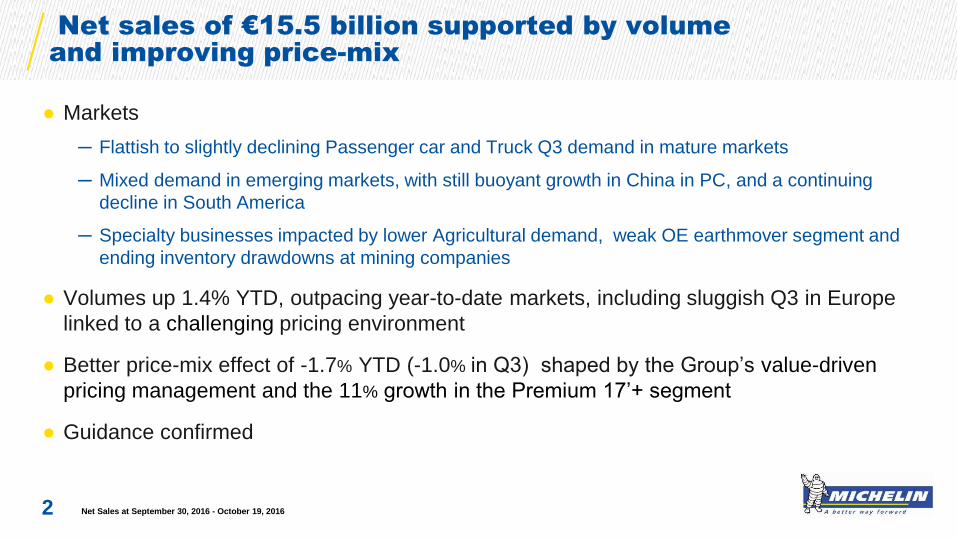
Net sales of €15.5 billion supported by volume
and improving price-mix
Net Sales at September 30, 2016 - October 19, 2016 2
● Markets
─ Flattish to slightly declining Passenger car and Truck Q3 demand in mature markets
─ Mixed demand in emerging markets, with still buoyant growth in China in PC, and a continuing
decline in South America
─ Specialty businesses impacted by lower Agricultural demand, weak OE earthmover segment and
ending inventory drawdowns at mining companies
● Volumes up 1.4% YTD, outpacing year-to-date markets, including sluggish Q3 in Europe
linked to a challenging pricing environment
● Better price-mix effect of -1.7% YTD (-1.0% in Q3) shaped by the Group’s value-driven
pricing management and the 11% growth in the Premium 17’+ segment
● Guidance confirmed
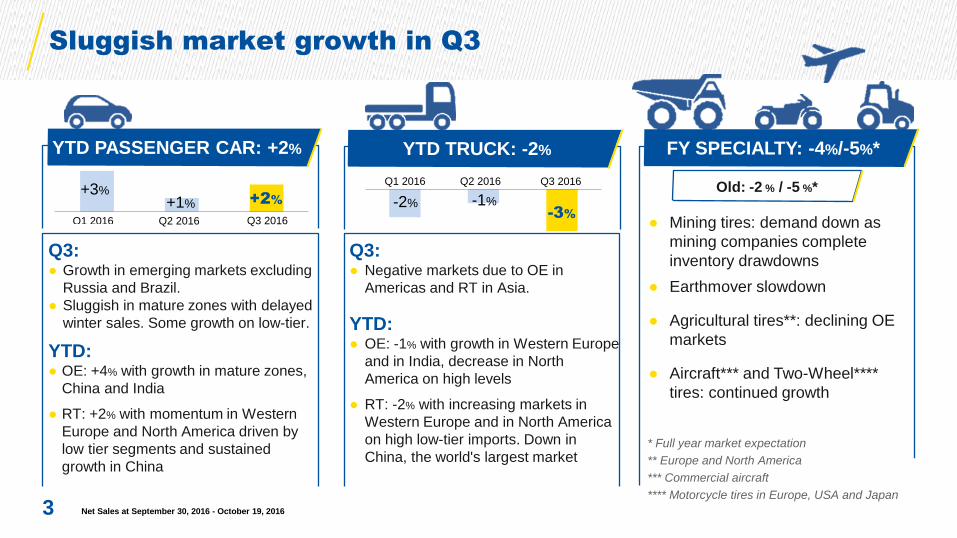
Sluggish market growth in Q3
3
Q3: ● Growth in emerging markets excluding
Russia and Brazil.
● Sluggish in mature zones with delayed
winter sales. Some growth on low-tier.
YTD: ● OE: +4% with growth in mature zones,
China and India
● RT: +2% with momentum in Western
Europe and North America driven by
low tier segments and sustained
growth in China
Q3: ● Negative markets due to OE in
Americas and RT in Asia.
YTD: ● OE: -1% with growth in Western Europe
and in India, decrease in North
America on high levels
● RT: -2% with increasing markets in
Western Europe and in North America
on high low-tier imports. Down in
China, the world's largest market
● Mining tires: demand down as
mining companies complete
inventory drawdowns
● Earthmover slowdown
● Agricultural tires**: declining OE
markets
● Aircraft*** and Two-Wheel****
tires: continued growth
YTD PASSENGER CAR: +2% FY SPECIALTY: -4%/-5%*
Q1 2016
+3% +1%
Q2 2016
Q1 2016
-1%
Q2 2016
-2%
YTD TRUCK: -2%
+2%
Q3 2016
Q3 2016
-3%
Net Sales at September 30, 2016 - October 19, 2016
Old: -2 % / -5 %*
* Full year market expectation
** Europe and North America
*** Commercial aircraft
**** Motorcycle tires in Europe, USA and Japan
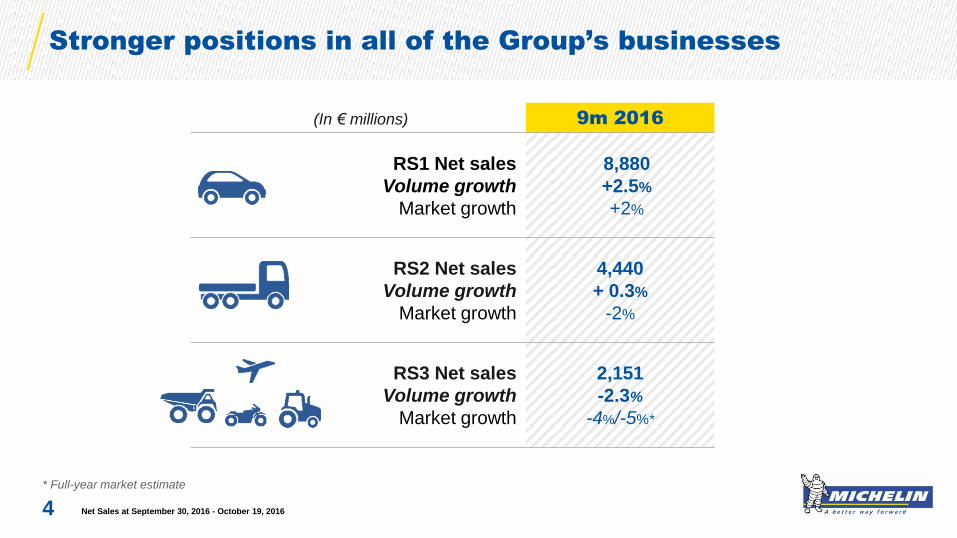
9m 2016
RS1 Net sales
Volume growth
Market growth
8,880
+2.5%
+2%
RS2 Net sales
Volume growth
Market growth
4,440
+ 0.3%
-2%
RS3 Net sales
Volume growth
Market growth
2,151
-2.3%
-4%/-5%*
Stronger positions in all of the Group’s businesses
Net Sales at September 30, 2016 - October 19, 2016 4
* Full-year market estimate
(In € millions)
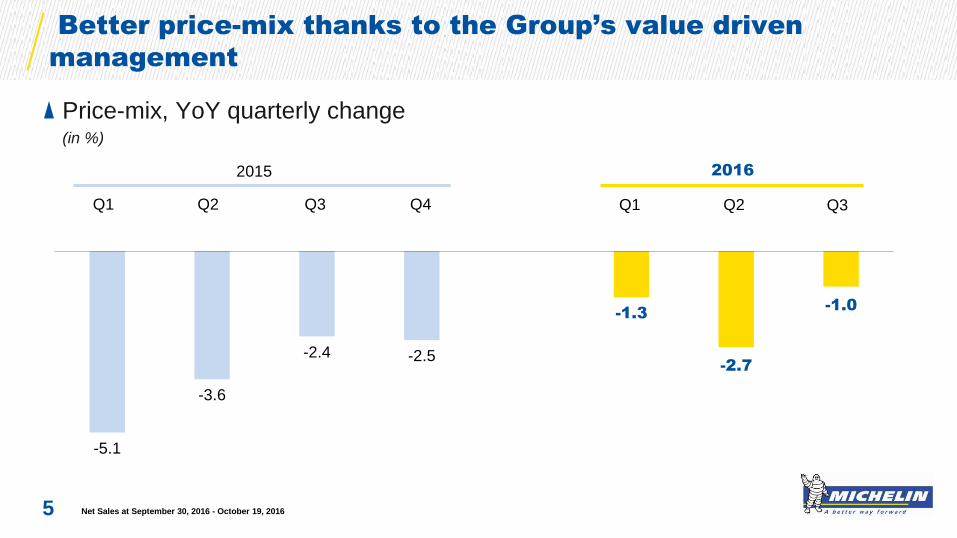
Better price-mix thanks to the Group’s value driven
management
Net Sales at September 30, 2016 - October 19, 2016
Price-mix, YoY quarterly change (in %)
5
2015 2016
Q1 Q2 Q3 Q4 Q1 Q2 Q3
-5.1
-3.6
-2.4 -2.5
-1.3
-2.7
-1.0
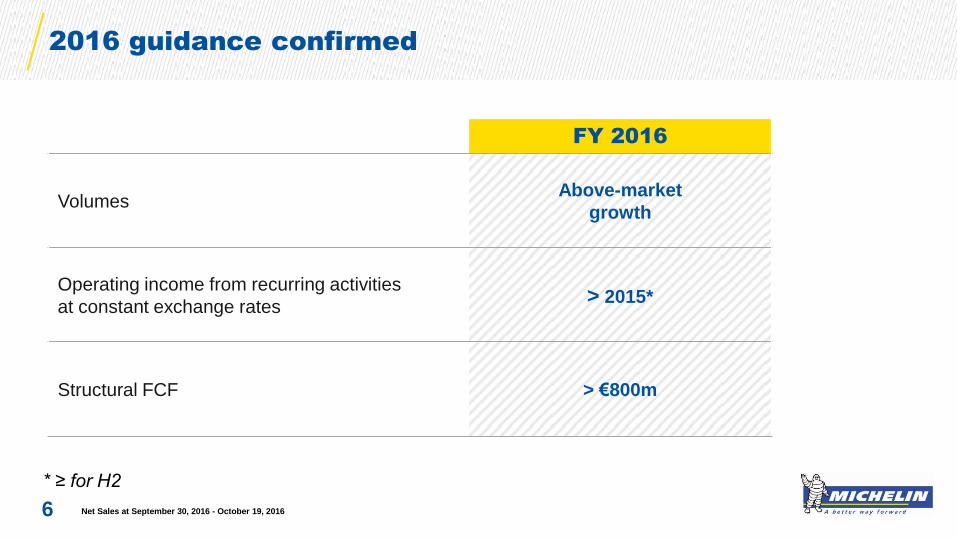
FY 2016
Volumes Above-market
growth
Operating income from recurring activities
at constant exchange rates > 2015*
Structural FCF > €800m
2016 guidance confirmed
* ≥ for H2
6 Net Sales at September 30, 2016 - October 19, 2016
October 19, 2016
Net Sales at September 30, 2016
Net sales of €15.5 billion supported by volume and improving price-mix
2016 guidance confirmed
Net Sales at September 30, 2016 - October 19, 2016 7
1
2
October 19, 2016
Net Sales at September 30, 2016
1 Net sales of €15.5 billion
supported by volume and
improving price-mix
Net Sales at September 30, 2016 - October 19, 2016 8
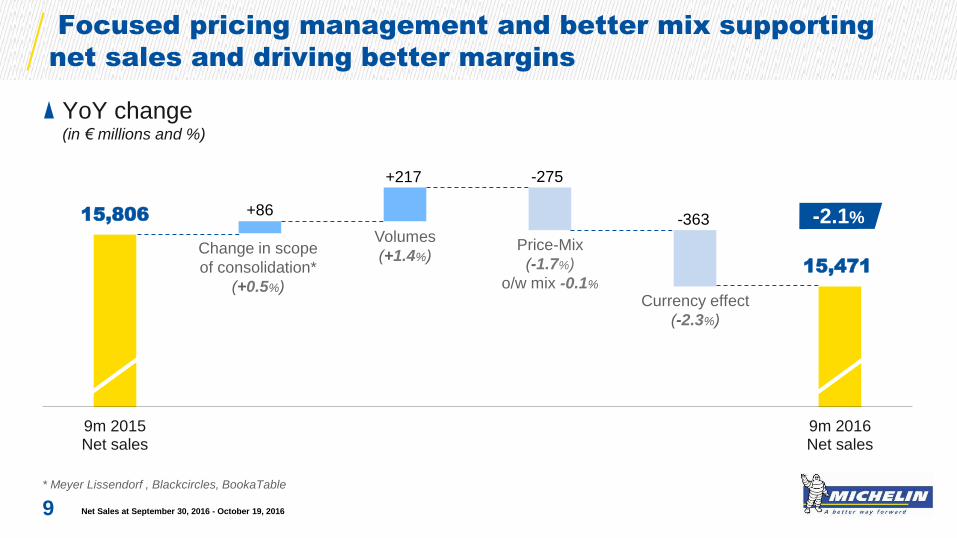
15,806
15,471
+217 -275
-363 +86
9m 2015Net sales
9m 2016Net sales
Focused pricing management and better mix supporting
net sales and driving better margins
Net Sales at September 30, 2016 - October 19, 2016
YoY change (in € millions and %)
* Meyer Lissendorf , Blackcircles, BookaTable
9
-2.1% Volumes
(+1.4%) Price-Mix
(-1.7%)
o/w mix -0.1%
Change in scope
of consolidation*
(+0.5%) Currency effect
(-2.3%)
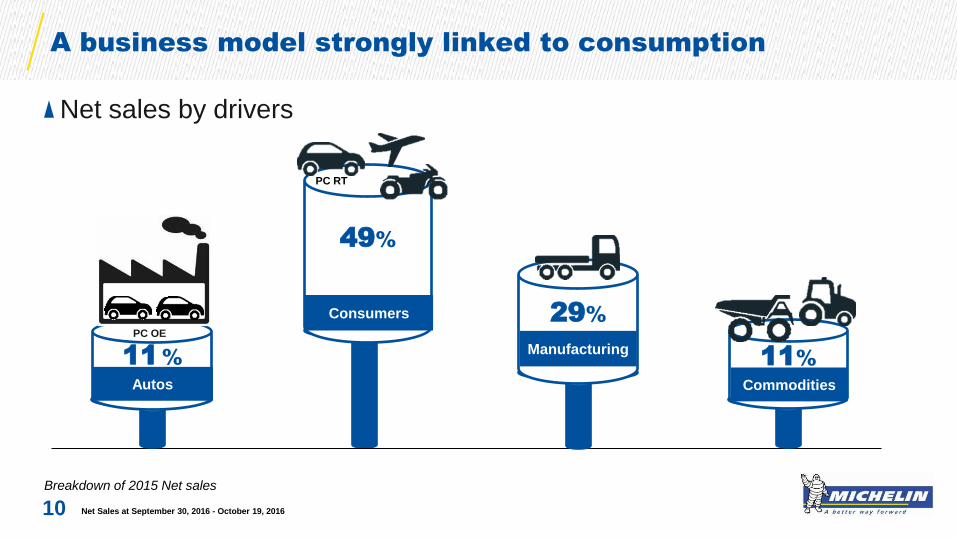
A business model strongly linked to consumption
Breakdown of 2015 Net sales
49%
Consumers
Net sales by drivers
11%
Commodities Autos
11 %
29%
Manufacturing
PC RT
PC OE
10 Net Sales at September 30, 2016 - October 19, 2016

MICHELIN CrossClimate, “the ideal ‘all-season’ tire”
11 Net Sales at September 30, 2016 - October 19, 2016
● Best All Seasons tire ranked by
● MICHELIN summer tire with winter certification
“There is only
one candidate that meets
all the requirements
of an ideal, uncompromising
‘all-season’ tire,” says
MICHELIN CrossClimate.”
magazine, “and that’s the
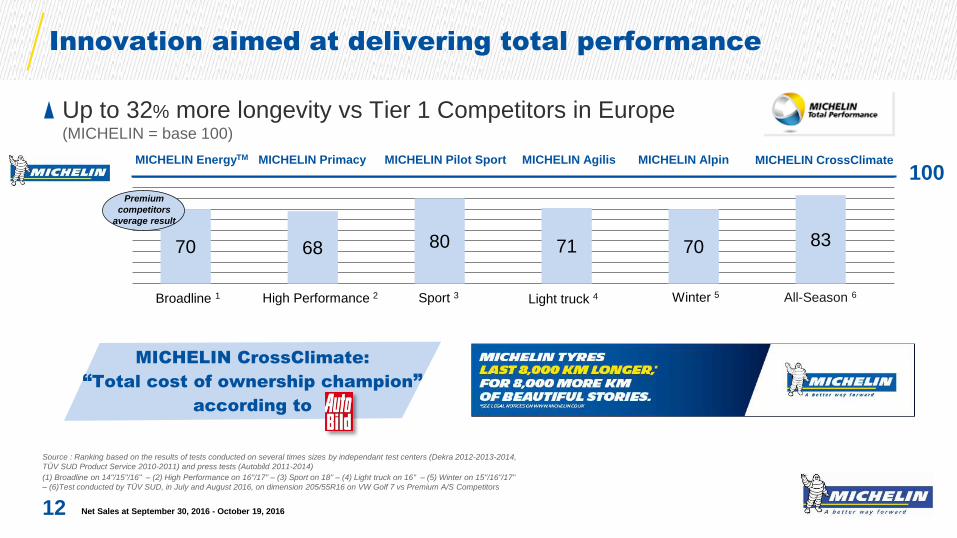
Innovation aimed at delivering total performance
Net Sales at September 30, 2016 - October 19, 2016
Up to 32% more longevity vs Tier 1 Competitors in Europe (MICHELIN = base 100)
12
Source : Ranking based on the results of tests conducted on several times sizes by independant test centers (Dekra 2012-2013-2014,
TÜV SUD Product Service 2010-2011) and press tests (Autobild 2011-2014)
(1) Broadline on 14"/15"/16" – (2) High Performance on 16"/17" – (3) Sport on 18" – (4) Light truck on 16" – (5) Winter on 15"/16"/17"
– (6)Test conducted by TÜV SUD, in July and August 2016, on dimension 205/55R16 on VW Golf 7 vs Premium A/S Competitors
MICHELIN CrossClimate:
“Total cost of ownership champion”
according to
70 68 80 71 70 83
MICHELIN EnergyTM MICHELIN Primacy MICHELIN Agilis MICHELIN Alpin
100 Premium
competitors
average result
Broadline 1 High Performance 2 Sport 3 Light truck 4 Winter 5
MICHELIN Pilot Sport MICHELIN CrossClimate
All-Season 6
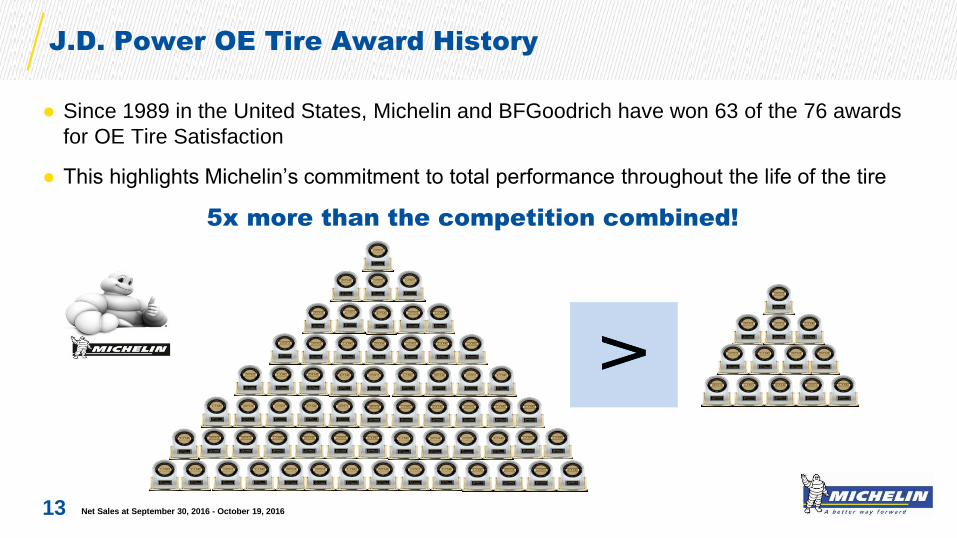
● Since 1989 in the United States, Michelin and BFGoodrich have won 63 of the 76 awards
for OE Tire Satisfaction
● This highlights Michelin’s commitment to total performance throughout the life of the tire
5x more than the competition combined!
J.D. Power OE Tire Award History
Net Sales at September 30, 2016 - October 19, 2016 13
+ +
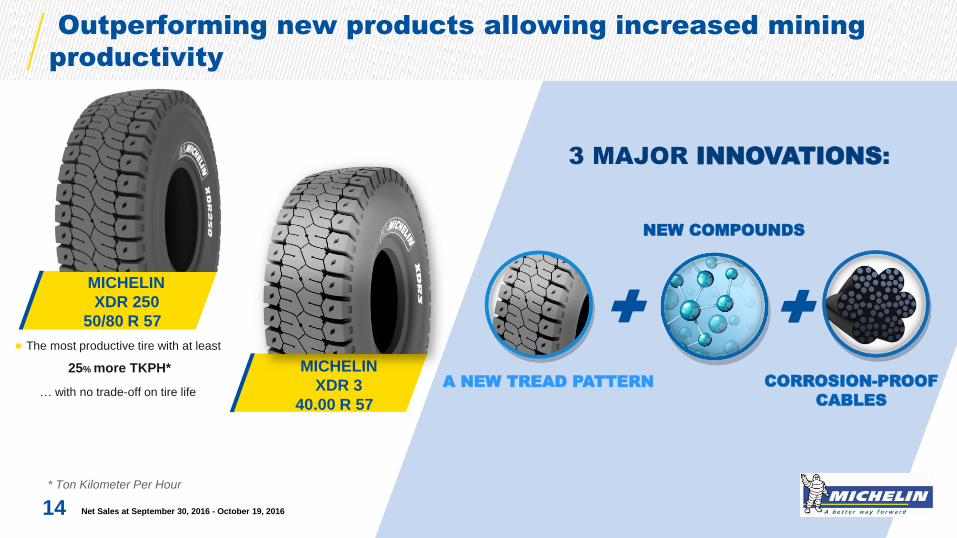
Outperforming new products allowing increased mining
productivity
Net Sales at September 30, 2016 - October 19, 2016
* Ton Kilometer Per Hour
14
MICHELIN
XDR 250
50/80 R 57
3 MAJOR INNOVATIONS:
● The most productive tire with at least
25% more TKPH*
… with no trade-off on tire life A NEW TREAD PATTERN
NEW COMPOUNDS
CORROSION-PROOF
CABLES
MICHELIN
XDR 3
40.00 R 57

October 19, 2016
Net Sales at September 30, 2016
2 2016 guidance confirmed
Net Sales at September 30, 2016 - October 19, 2016 15
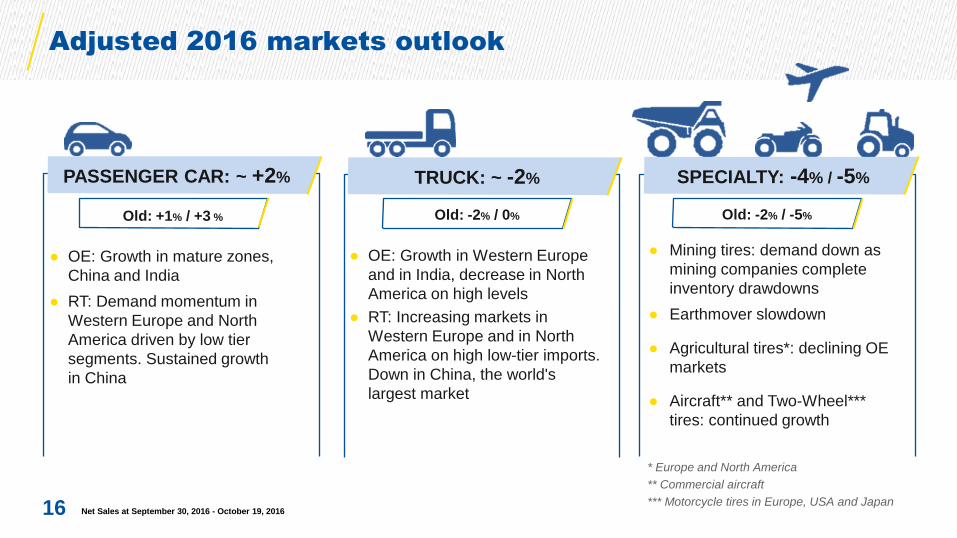
Adjusted 2016 markets outlook
Net Sales at September 30, 2016 - October 19, 2016 16
● OE: Growth in Western Europe
and in India, decrease in North
America on high levels
● RT: Increasing markets in
Western Europe and in North
America on high low-tier imports.
Down in China, the world's
largest market
TRUCK: ~ -2% PASSENGER CAR: ~ +2% SPECIALTY: -4% / -5%
● OE: Growth in mature zones,
China and India
● RT: Demand momentum in
Western Europe and North
America driven by low tier
segments. Sustained growth
in China
Old: +1% / +3 % Old: -2% / 0% Old: -2% / -5%
● Mining tires: demand down as
mining companies complete
inventory drawdowns
● Earthmover slowdown
● Agricultural tires*: declining OE
markets
● Aircraft** and Two-Wheel***
tires: continued growth
* Europe and North America
** Commercial aircraft
*** Motorcycle tires in Europe, USA and Japan
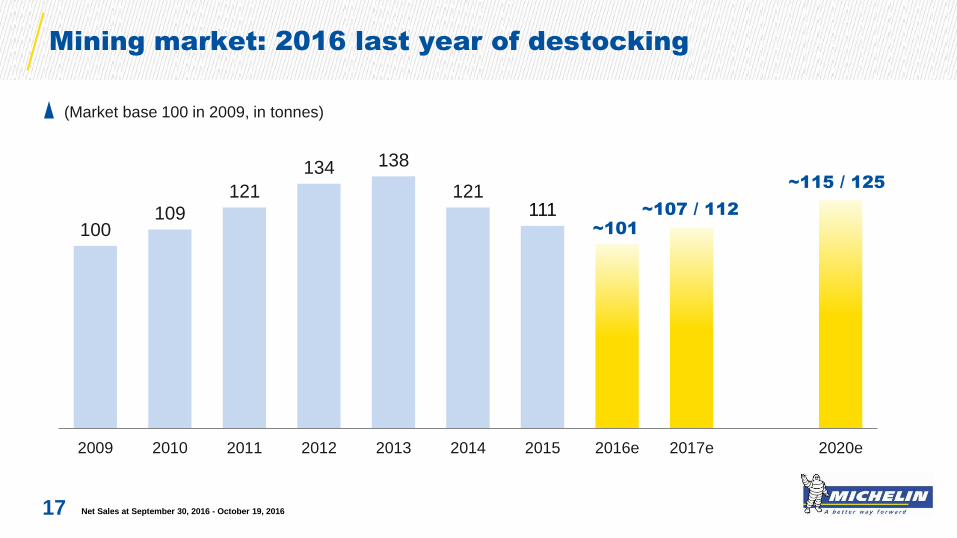
Mining market: 2016 last year of destocking
17
100 109
121
134 138
121 111
~101
2009 2010 2011 2012 2013 2014 2015 2016e 2017e 2020e
~107 / 112
~115 / 125
(Market base 100 in 2009, in tonnes)
Net Sales at September 30, 2016 - October 19, 2016
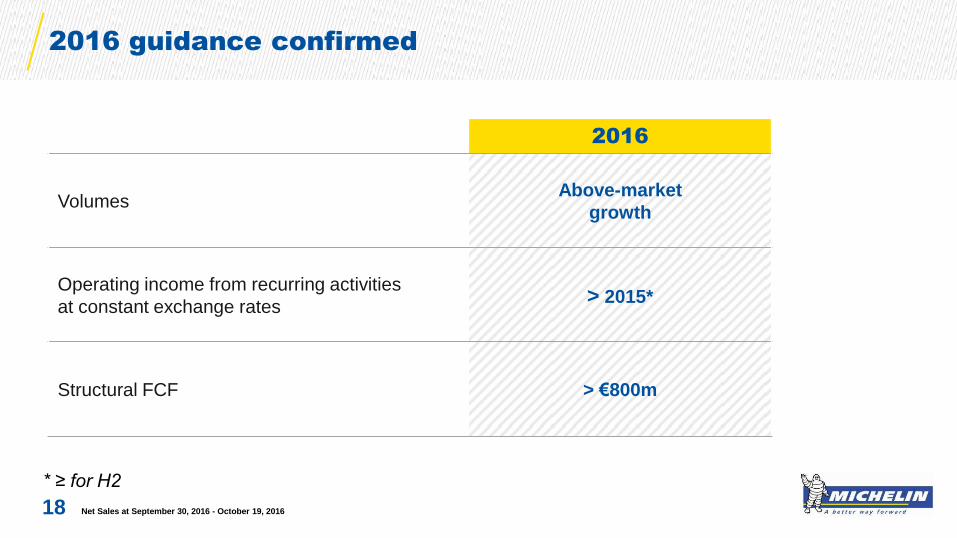
2016
Volumes Above-market
growth
Operating income from recurring activities
at constant exchange rates > 2015*
Structural FCF > €800m
2016 guidance confirmed
18 Net Sales at September 30, 2016 - October 19, 2016
* ≥ for H2
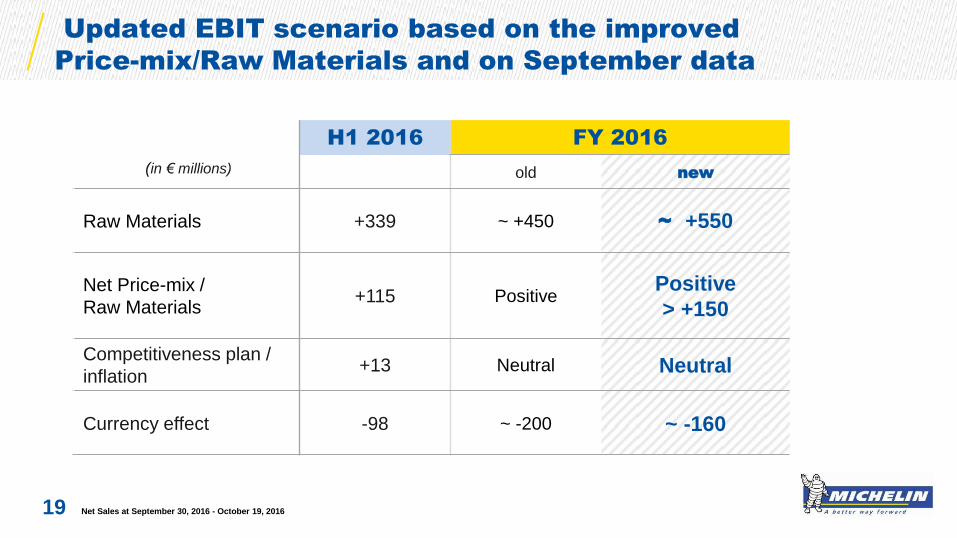
Updated EBIT scenario based on the improved
Price-mix/Raw Materials and on September data
Net Sales at September 30, 2016 - October 19, 2016 19
H1 2016 FY 2016
old new
Raw Materials +339 ~ +450 ~ +550
Net Price-mix /
Raw Materials +115 Positive
Positive
> +150
Competitiveness plan /
inflation +13 Neutral Neutral
Currency effect -98 ~ -200 ~ -160
(in € millions)
Net Sales at September 30, 2016 - October 19, 2016 20 20 Net Sales at September 30, 2016 - October 19, 2016

October 19, 2016
Net Sales at September 30, 2016
Appendices
Net Sales at September 30, 2016 - October 19, 2016 21
-2%
GLOBAL MARKET
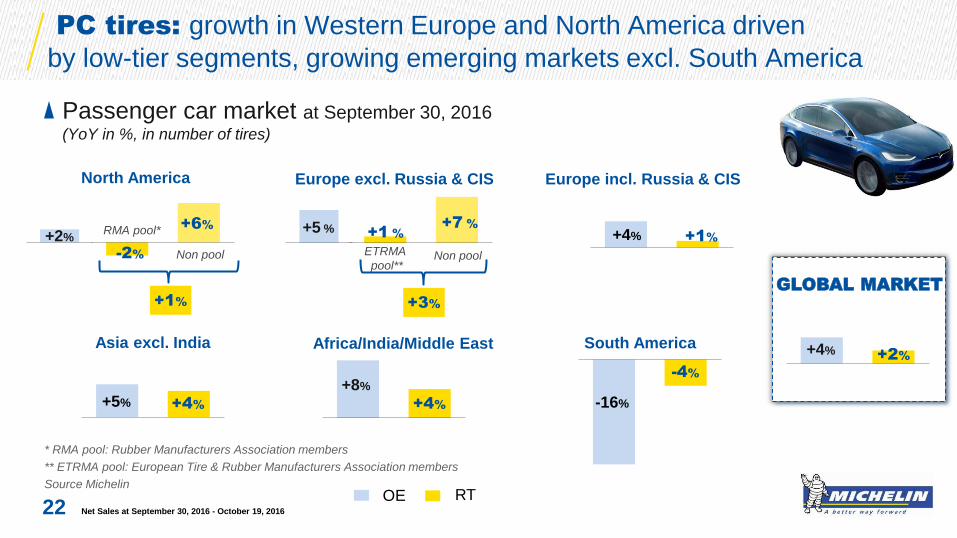
PC tires: growth in Western Europe and North America driven
by low-tier segments, growing emerging markets excl. South America
22
North America
Africa/India/Middle East Asia excl. India
+4%
+8%
+4% +5%
+2% +4%
OE RT
Passenger car market at September 30, 2016 (YoY in %, in number of tires)
Europe incl. Russia & CIS
+1% +4%
Net Sales at September 30, 2016 - October 19, 2016
RMA pool*
Non pool
* RMA pool: Rubber Manufacturers Association members
** ETRMA pool: European Tire & Rubber Manufacturers Association members
Source Michelin
Europe excl. Russia & CIS
+5 %
ETRMA
pool** Non pool
+7 %
+1 %
+6%
+2%
+1% +3%
-4%
-16%
South America
Europe excl. Russia & CIS
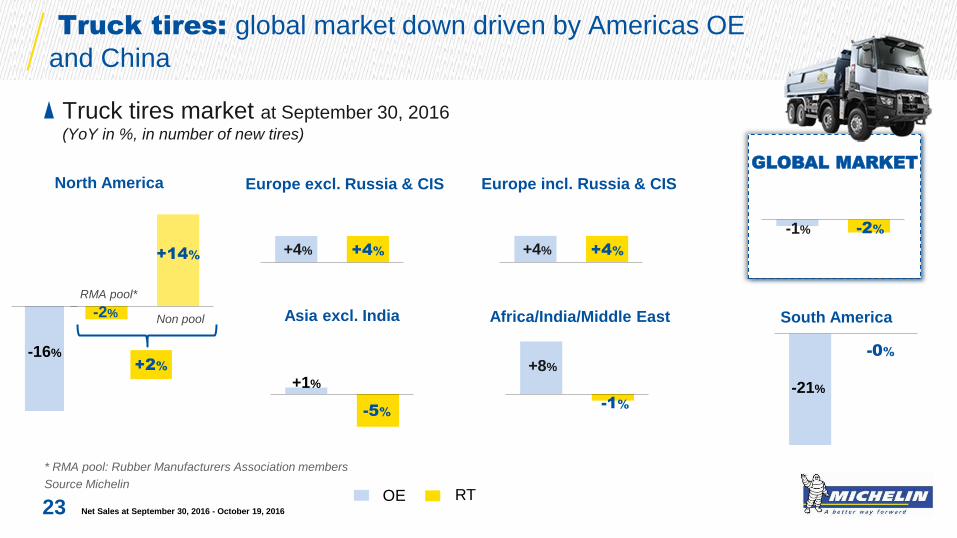
GLOBAL MARKET
Truck tires: global market down driven by Americas OE
and China
23
North America
Asia excl. India
+14%
-2%
+4% +4%
-1%
+8%
-5%
+1%
-2% -1%
OE RT
Truck tires market at September 30, 2016 (YoY in %, in number of new tires)
Europe incl. Russia & CIS
+4% +4%
Net Sales at September 30, 2016 - October 19, 2016
-16%
RMA pool*
Non pool
* RMA pool: Rubber Manufacturers Association members
Source Michelin
Africa/India/Middle East
+2%
-0%
-21%
South America
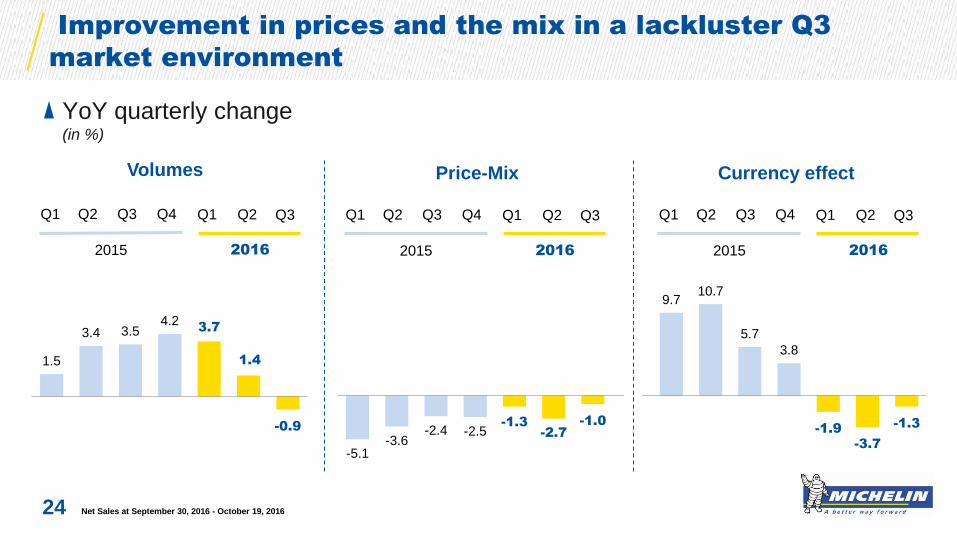
Improvement in prices and the mix in a lackluster Q3
market environment
Net Sales at September 30, 2016 - October 19, 2016
YoY quarterly change (in %)
24
-5.1 -3.6
-2.4 -2.5 -1.3
-2.7
-1.0
9.7 10.7
5.7
3.8
-1.9
-3.7
-1.3
Volumes Price-Mix Currency effect
1.5
3.4 3.5 4.2
3.7
1.4
-0.9
2015 2016
Q1 Q2 Q3 Q4 Q1 Q2 Q3
2015 2016
Q1 Q2 Q3 Q4 Q1 Q2 Q3
2015 2016
Q1 Q2 Q3 Q4 Q1 Q2 Q3
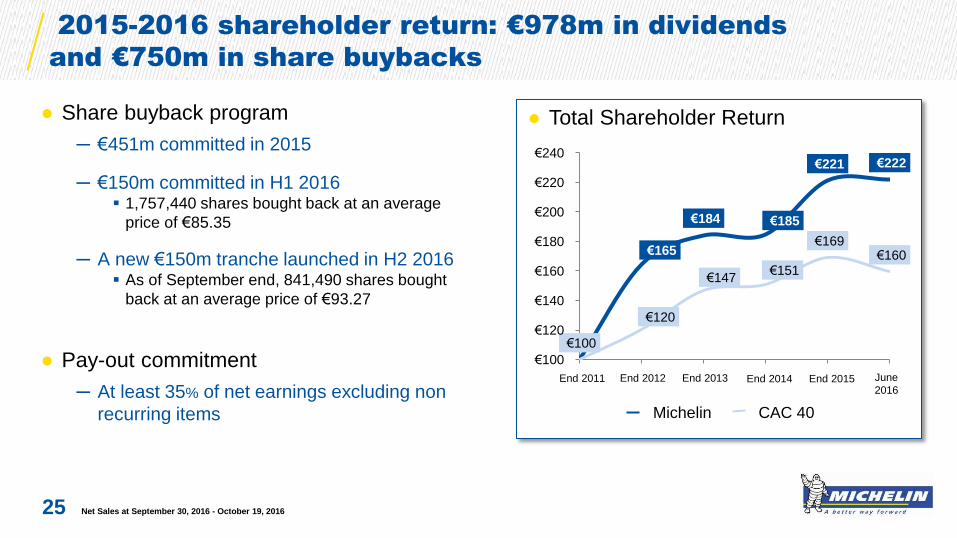
2015-2016 shareholder return: €978m in dividends
and €750m in share buybacks
● Share buyback program
─ €451m committed in 2015
─ €150m committed in H1 2016 1,757,440 shares bought back at an average
price of €85.35
─ A new €150m tranche launched in H2 2016 As of September end, 841,490 shares bought
back at an average price of €93.27
● Pay-out commitment
─ At least 35% of net earnings excluding non
recurring items
● Total Shareholder Return
25
€165
€184 €185
€221 €222
€100
€120
€147 €151
€169 €160
€100
€120
€140
€160
€180
€200
€220
€240
Fin 2011 Fin 2012 Fin 2013 Fin 2014 Fin 2015 Juin2016
Michelin CAC 40
End 2011 End 2014 End 2015 June
2016 End 2012 End 2013
Net Sales at September 30, 2016 - October 19, 2016
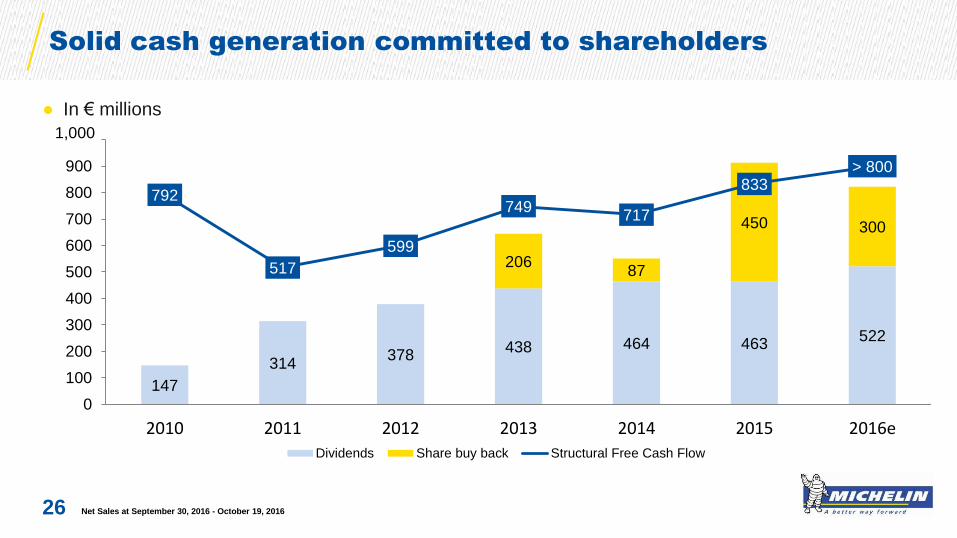
● In € millions
26
Solid cash generation committed to shareholders
147
314 378
438 464 463 522
206 87
450 300
792
517
599
749 717
833 > 800
0
100
200
300
400
500
600
700
800
900
1000
2010 2011 2012 2013 2014 2015 2016e
Dividends Share buy back Structural Free Cash Flow
1,000
Net Sales at September 30, 2016 - October 19, 2016
1.00
1.05
1.10
1.15
1.20
1.25
1.30
1.35
1.40
1.45
01/01/2013 01/01/2014 01/01/2015 01/01/2016
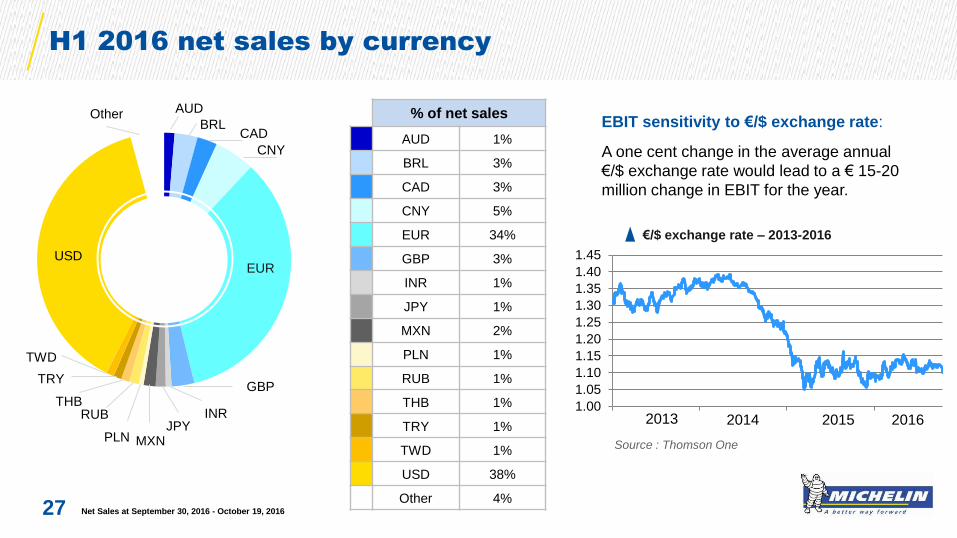
H1 2016 net sales by currency
27
Source : Thomson One
2013 2014 2015 2016
USD EUR
GBP
CNY
CAD BRL
AUD Other
TRY
THB RUB
MXN JPY
INR
PLN
% of net sales
AUD 1%
BRL 3%
CAD 3%
CNY 5%
EUR 34%
GBP 3%
INR 1%
JPY 1%
MXN 2%
PLN 1%
RUB 1%
THB 1%
TRY 1%
TWD 1%
USD 38%
Other 4%
TWD
EBIT sensitivity to €/$ exchange rate:
A one cent change in the average annual
€/$ exchange rate would lead to a € 15-20
million change in EBIT for the year.
€/$ exchange rate – 2013-2016
Net Sales at September 30, 2016 - October 19, 2016

● February, 14: 2016 Annual Results
● April, 20: Q1 Net Sales
● May, 19: Annual Shareholders’ Meeting
● July, 25: H1 Results
● October, 19: Q3 Net Sales
2017 Upcoming events
28 Net Sales at September 30, 2016 - October 19, 2016
"This presentation is not an offer to purchase or a solicitation to recommend the purchase
of Michelin shares. To obtain more detailed information on Michelin, please consult the
documentation published in France by Autorité des marchés financiers available from the
http://www.michelin.com/eng/ website.
This presentation may contain a number of forward-looking statements. Although the
Company believes that these statements are based on reasonable assumptions at the time
of the publication of this document, they are by nature subject to risks and contingencies
liable to translate into a difference between actual data and the forecasts made or induced
by these statements."
Disclaimer
Net Sales at September 30, 2016 - October 19, 2016 29

Contacts
Net Sales at September 30, 2016 - October 19, 2016 30
Valérie MAGLOIRE
Matthieu DEWAVRIN
Humbert de FEYDEAU
+33 (0)1 78 76 45 36
27, cours de l’île Seguin
92100 Boulogne-Billancourt - France