Embed Size (px)
Citation preview
October 17, 2012Connie S. SorrellChief of Systems Operations
What is a Strategic Highway Safety Plan?What is a Strategic Highway Safety Plan?
VA’s Statewide, multi-agency comprehensive safety plan – required by MAP-21
Coordinated framework for reducing deaths and severe injuries on all public roads
Statewide goals and critical emphasis areas
Developed in consultation with Federal, state, local, and private sector safety stakeholders
Continues Virginia’s highway safety progress
2
2006 SHSP Emphasis Areas2006 SHSP Emphasis Areas
3
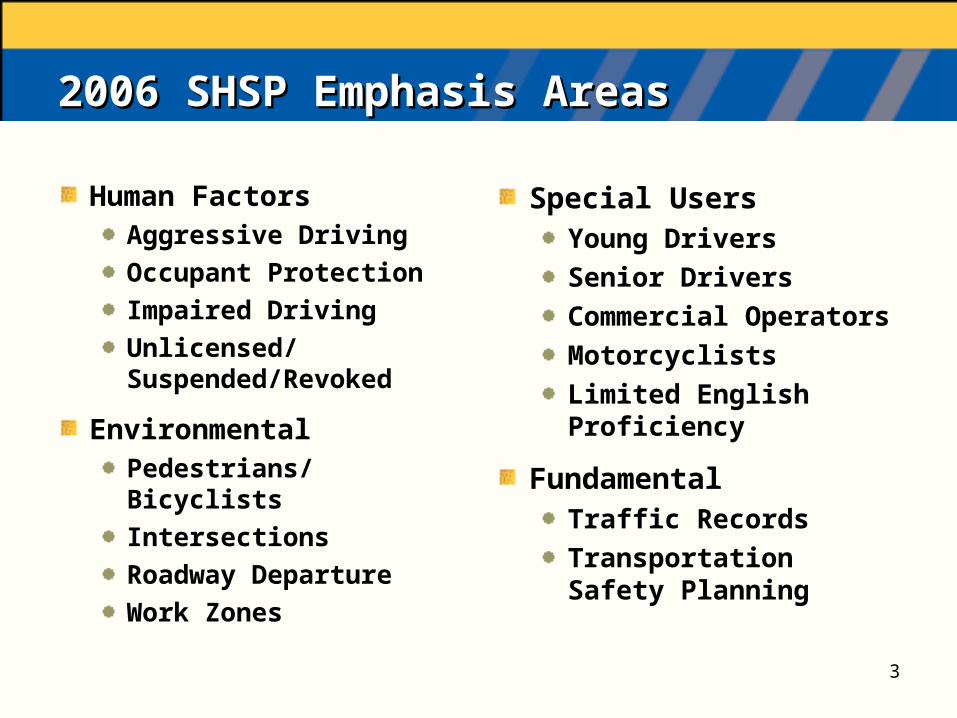
Human Factors Aggressive Driving
Occupant Protection
Impaired Driving
Unlicensed/Suspended/Revoked
Environmental Pedestrians/Bicyclists
Intersections
Roadway Departure
Work Zones
Special Users Young Drivers
Senior Drivers
Commercial Operators
Motorcyclists
Limited English Proficiency
Fundamental Traffic Records
Transportation Safety Planning
2006 Strategic Plan Accomplishments2006 Strategic Plan Accomplishments
The goal was to reduce deaths by 100 and reduce all injury types by 4,000 by 2010.
Realized 221 (23%) fewer traffic deaths; 9596 (45 %) fewer severe injuries; decreases in alcohol, young driver and speed related deaths
Safety belt use increased to more than 81 percent
Enhanced graduated driver’s license law and drivers’ education requirements
Improved enforcement
Improved child passenger and bicycle safety
Improved data through TREDS and RNS web based tools
4
State of Traffic Safety State of Traffic Safety
5
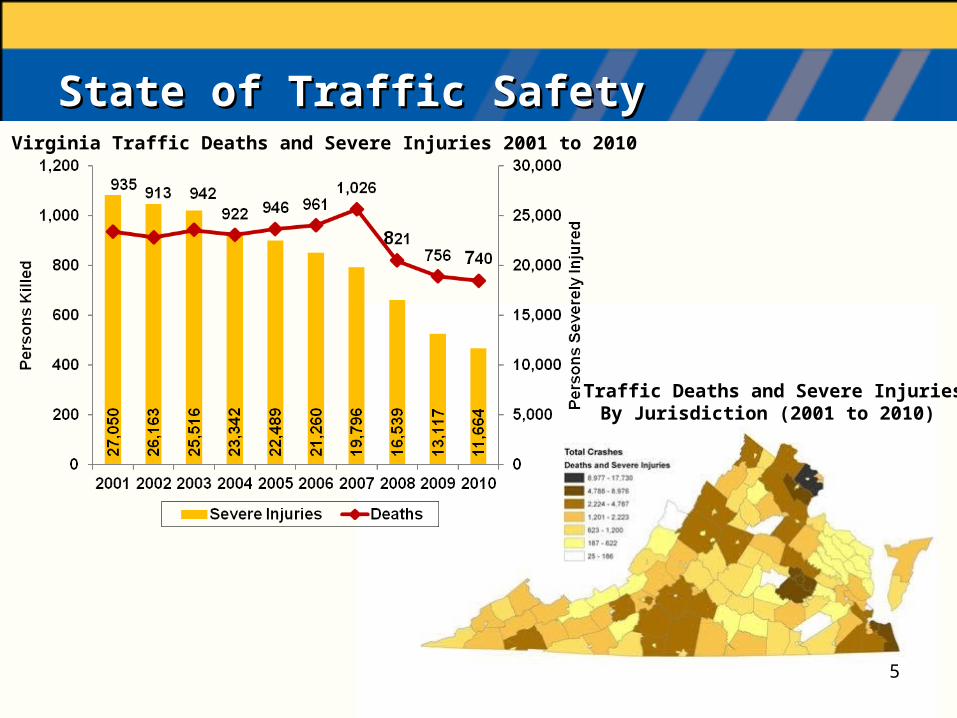
Virginia Traffic Deaths and Severe Injuries 2001 to 2010
Traffic Deaths and Severe InjuriesBy Jurisdiction (2001 to 2010)
2012-2016 Emphasis Areas 2012-2016 Emphasis Areas
Speeding
Young Drivers
Unrestrained Occupants
Alcohol Related Incidents
Roadway Departure
Intersections
Data Management and Analysis
6
Vision, Mission & GoalVision, Mission & Goal
Vision -
Toward Zero Deaths. All roadway users should arrive safely at their destinations
Mission –
To save lives and reduce motor vehicle crashes and injuries through a data driven strategic approach that uses enforcement, education, engineering, and emergency response strategies
Goal –
To reduce deaths and severe injuries by half by 2030
7
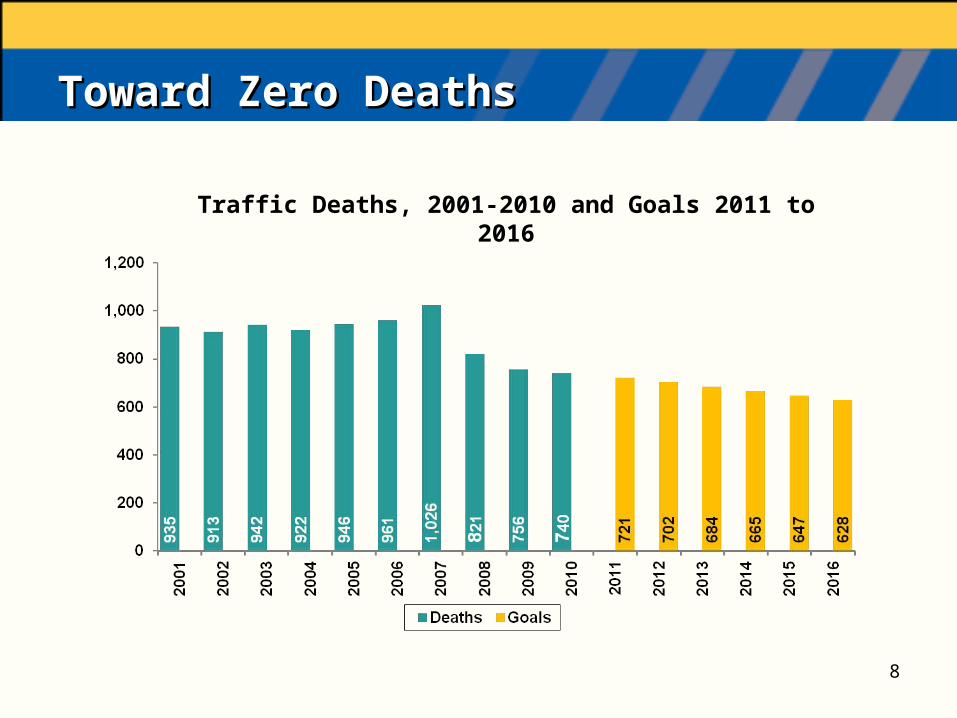
Toward Zero Deaths Toward Zero Deaths
8
Traffic Deaths, 2001-2010 and Goals 2011 to 2016
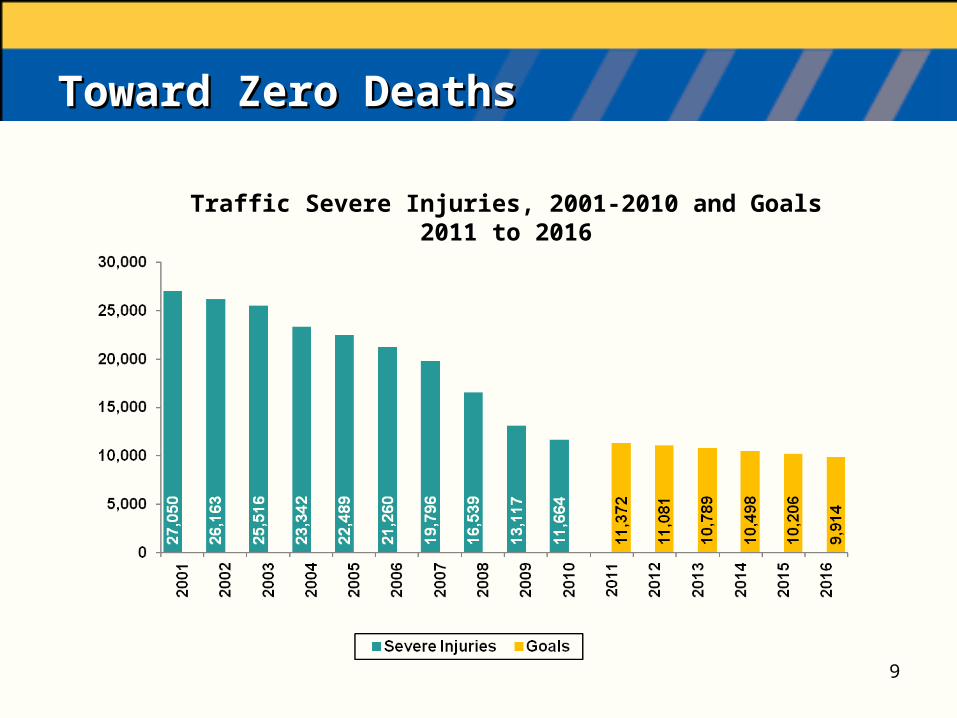
Toward Zero Deaths Toward Zero Deaths
9
Traffic Severe Injuries, 2001-2010 and Goals 2011 to 2016
Emphasis Area Team OverviewEmphasis Area Team Overview
Three meetings
Reviewed team rosters and data
Identified strategies and action steps Reviewed the strategies from the 2006 plan
Recommendations from the outreach meetings
Proven countermeasures
Selected action step leaders
Measurable death and severe injury objectives
10
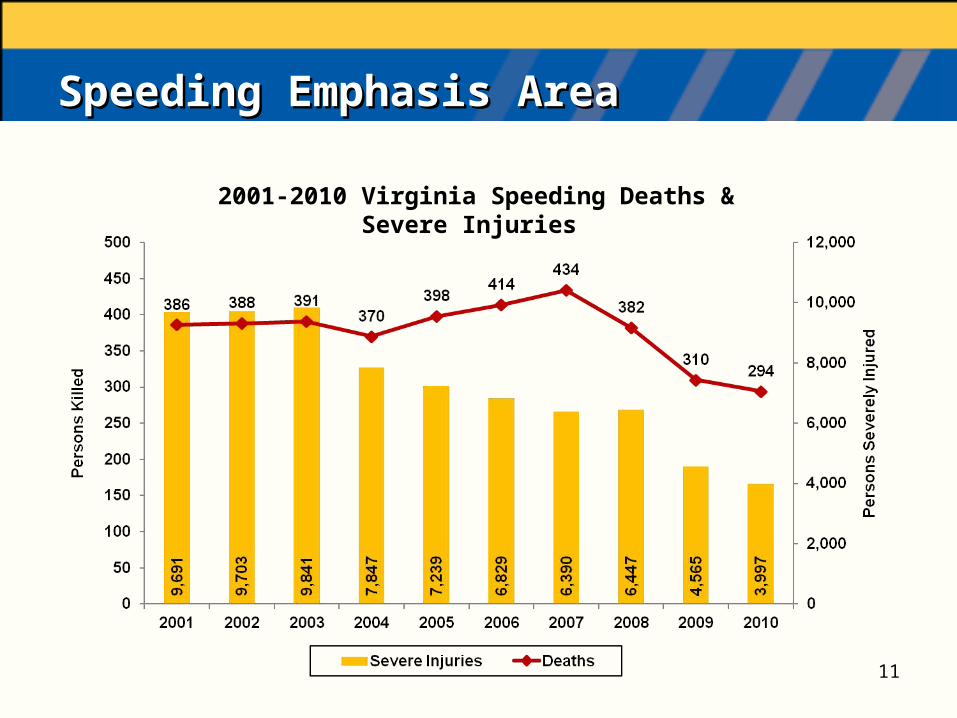
Speeding Emphasis Area Speeding Emphasis Area
2001-2010 Virginia Speeding Deaths & Severe Injuries
11
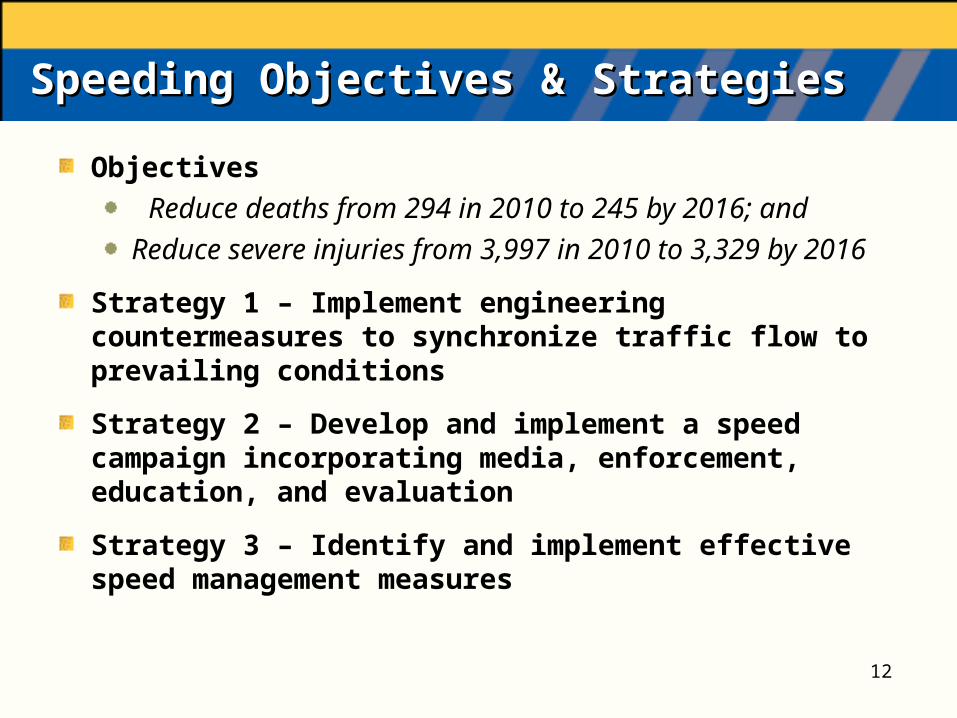
Speeding Objectives & StrategiesSpeeding Objectives & Strategies
Objectives
Reduce deaths from 294 in 2010 to 245 by 2016; and
Reduce severe injuries from 3,997 in 2010 to 3,329 by 2016
Strategy 1 – Implement engineering countermeasures to synchronize traffic flow to prevailing conditions
Strategy 2 – Develop and implement a speed campaign incorporating media, enforcement, education, and evaluation
Strategy 3 – Identify and implement effective speed management measures
12
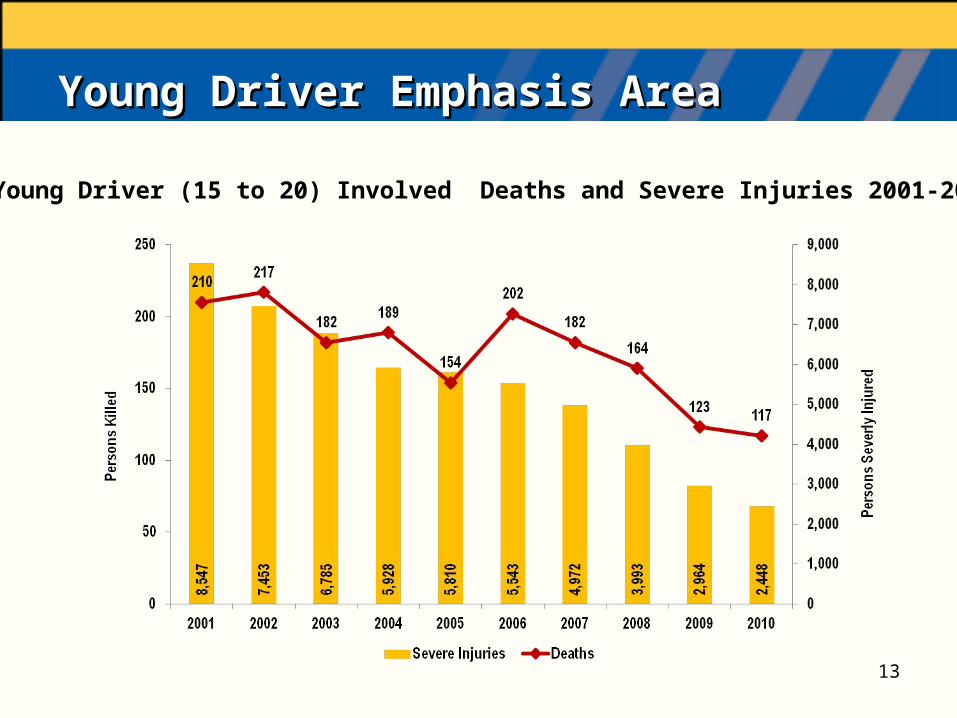
Young Driver Emphasis AreaYoung Driver Emphasis Area
13
Young Driver (15 to 20) Involved Deaths and Severe Injuries 2001-2010
Young Driver Objectives & Strategies Young Driver Objectives & Strategies
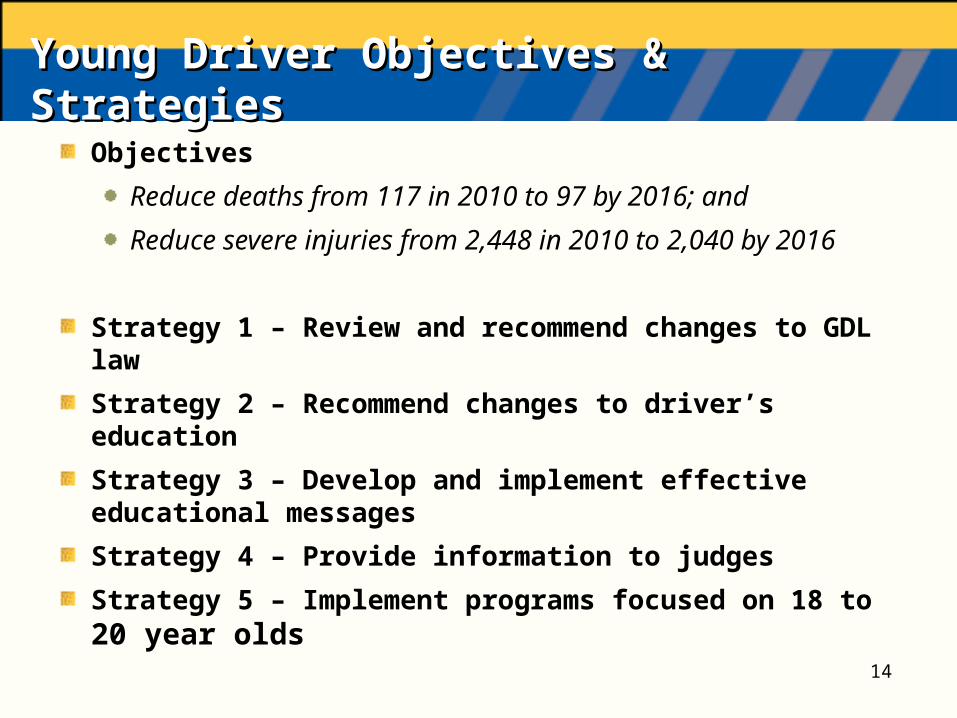
Objectives
Reduce deaths from 117 in 2010 to 97 by 2016; and
Reduce severe injuries from 2,448 in 2010 to 2,040 by 2016
Strategy 1 – Review and recommend changes to GDL law
Strategy 2 – Recommend changes to driver’s education
Strategy 3 – Develop and implement effective educational messages
Strategy 4 – Provide information to judges
Strategy 5 – Implement programs focused on 18 to 20 year olds
14
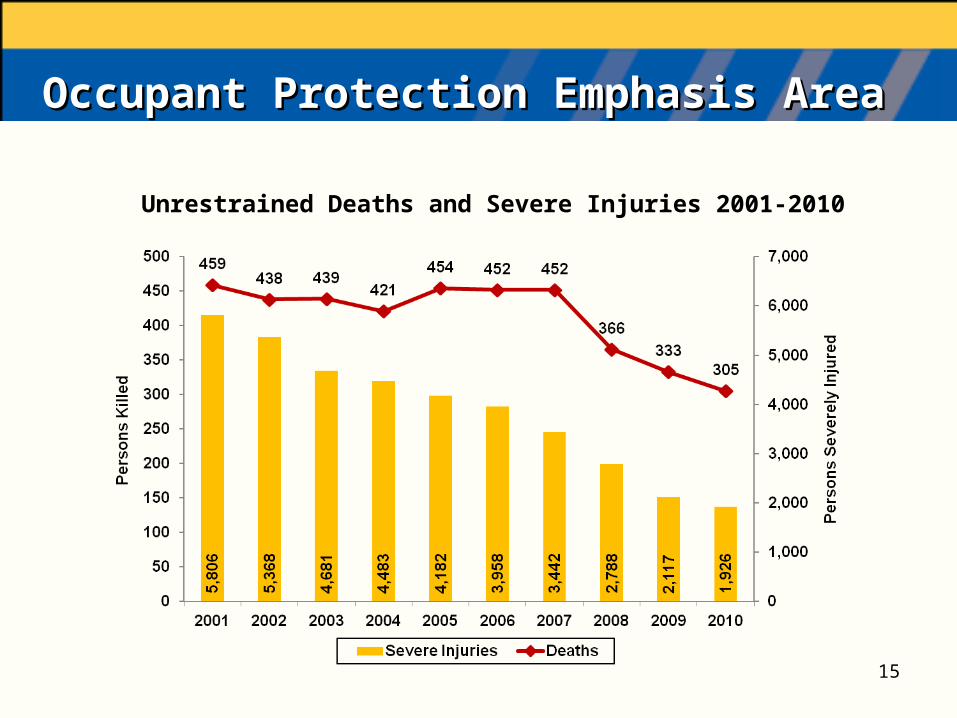
Occupant Protection Emphasis Area Occupant Protection Emphasis Area
15
Unrestrained Deaths and Severe Injuries 2001-2010
Occupant Protection Objectives & Occupant Protection Objectives & Strategies Strategies
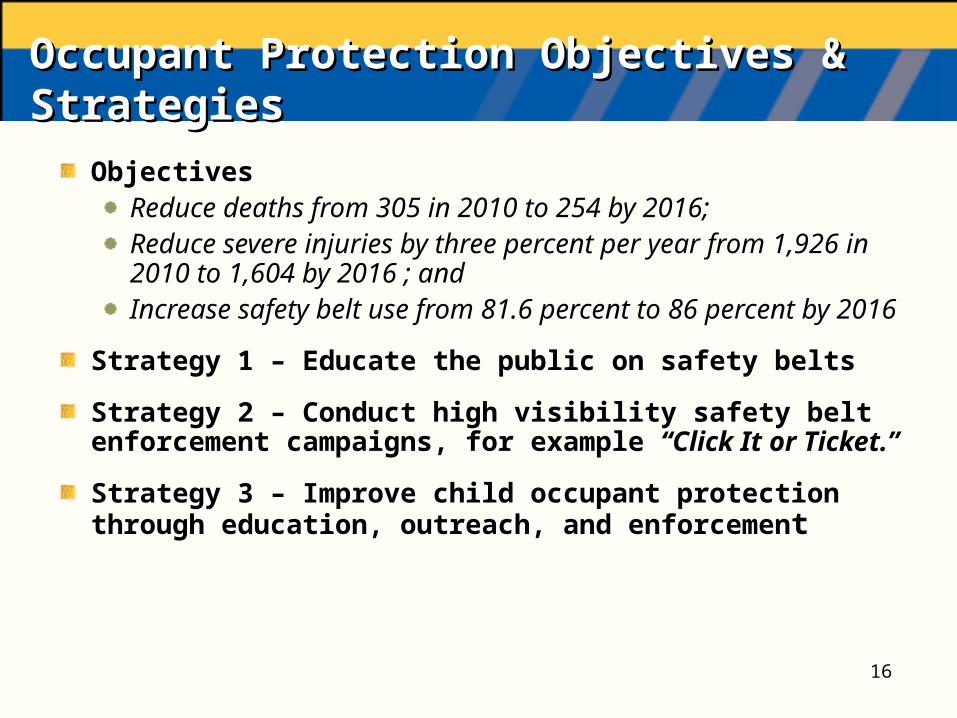
Objectives Reduce deaths from 305 in 2010 to 254 by 2016; Reduce severe injuries by three percent per year from 1,926 in 2010 to 1,604 by 2016 ; andIncrease safety belt use from 81.6 percent to 86 percent by 2016
Strategy 1 – Educate the public on safety belts
Strategy 2 – Conduct high visibility safety belt enforcement campaigns, for example “Click It or Ticket.”
Strategy 3 – Improve child occupant protection through education, outreach, and enforcement
16
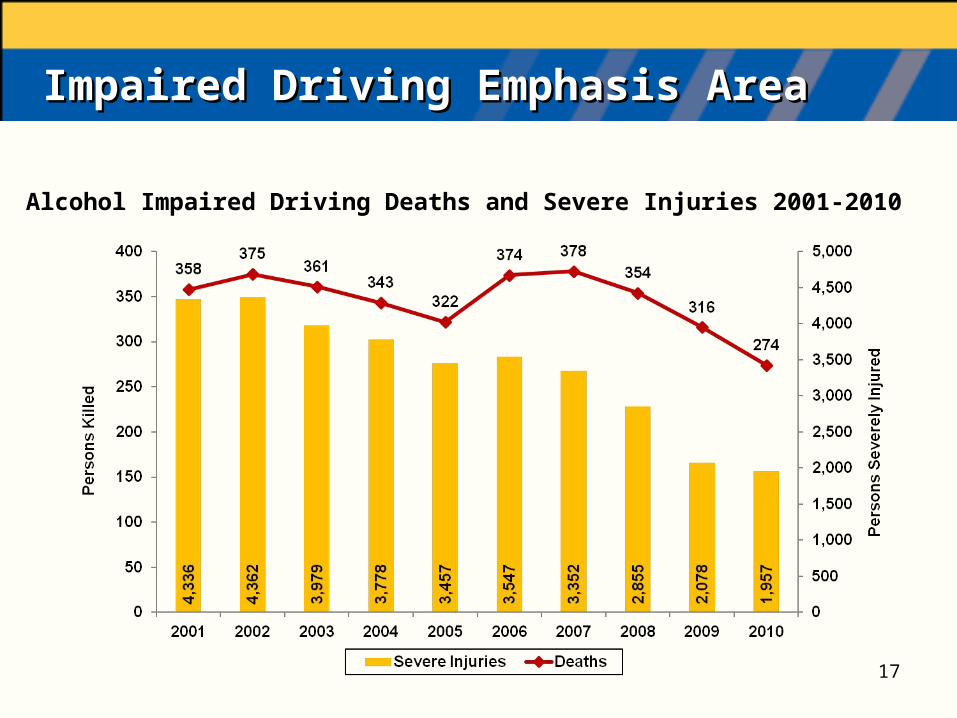
Impaired Driving Emphasis AreaImpaired Driving Emphasis Area
17
Alcohol Impaired Driving Deaths and Severe Injuries 2001-2010
Impaired Driving Objectives & Strategies Impaired Driving Objectives & Strategies
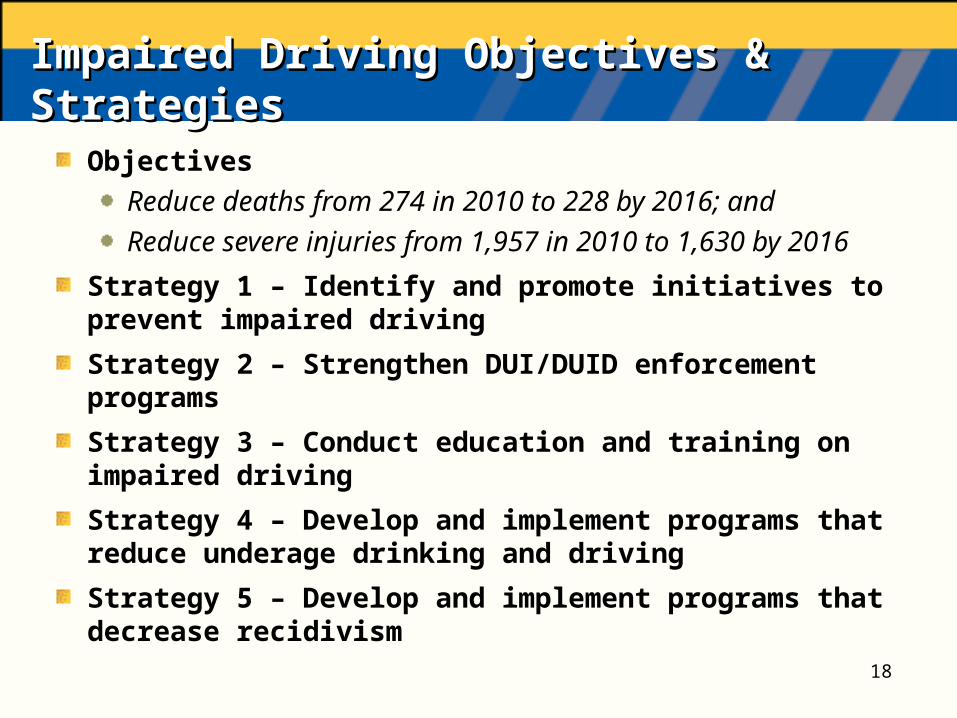
Objectives
Reduce deaths from 274 in 2010 to 228 by 2016; and
Reduce severe injuries from 1,957 in 2010 to 1,630 by 2016
Strategy 1 – Identify and promote initiatives to prevent impaired driving
Strategy 2 – Strengthen DUI/DUID enforcement programs
Strategy 3 – Conduct education and training on impaired driving
Strategy 4 – Develop and implement programs that reduce underage drinking and driving
Strategy 5 – Develop and implement programs that decrease recidivism
18
Roadway Departure Emphasis AreaRoadway Departure Emphasis Area
19
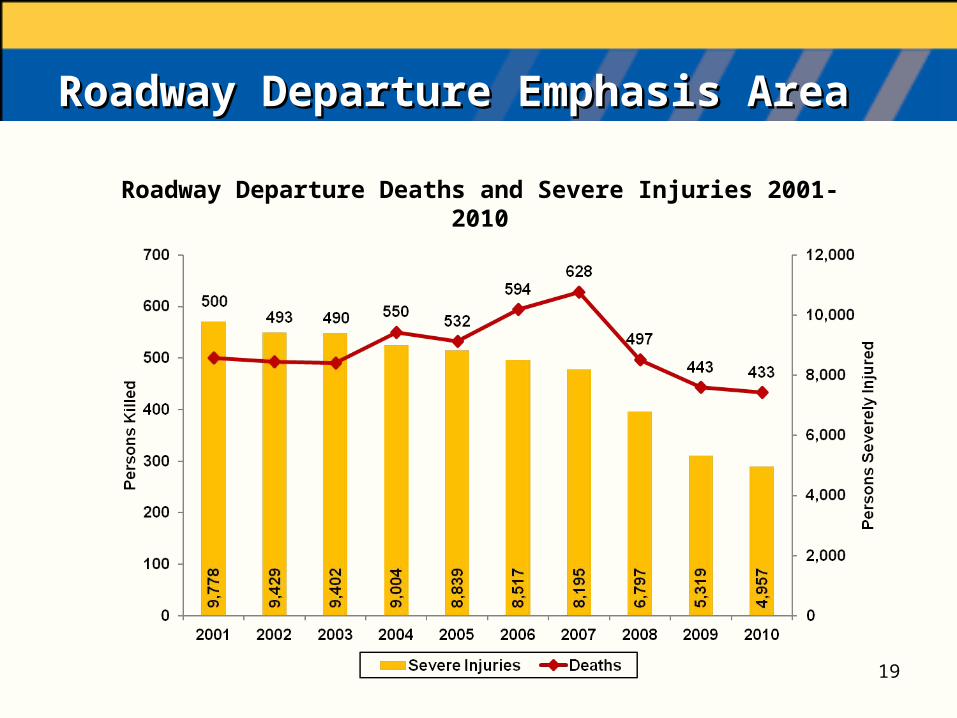
Roadway Departure Deaths and Severe Injuries 2001-2010
Roadway Departure Objectives & Roadway Departure Objectives & StrategiesStrategies
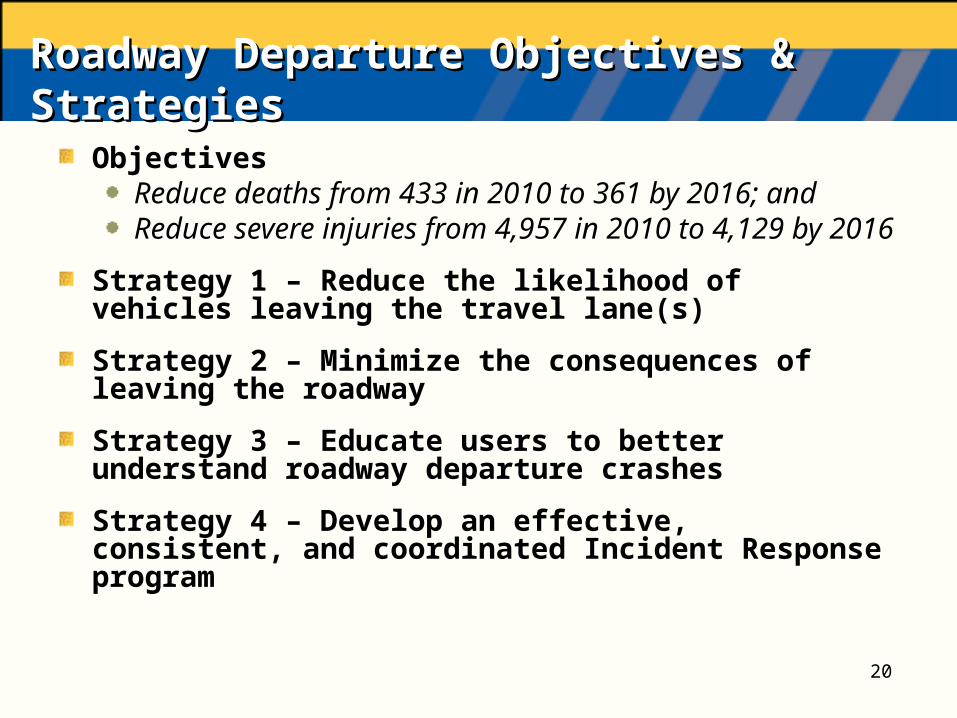
ObjectivesReduce deaths from 433 in 2010 to 361 by 2016; andReduce severe injuries from 4,957 in 2010 to 4,129 by 2016
Strategy 1 – Reduce the likelihood of vehicles leaving the travel lane(s)
Strategy 2 – Minimize the consequences of leaving the roadway
Strategy 3 – Educate users to better understand roadway departure crashes
Strategy 4 – Develop an effective, consistent, and coordinated Incident Response program
20
Intersection Emphasis AreaIntersection Emphasis Area
21
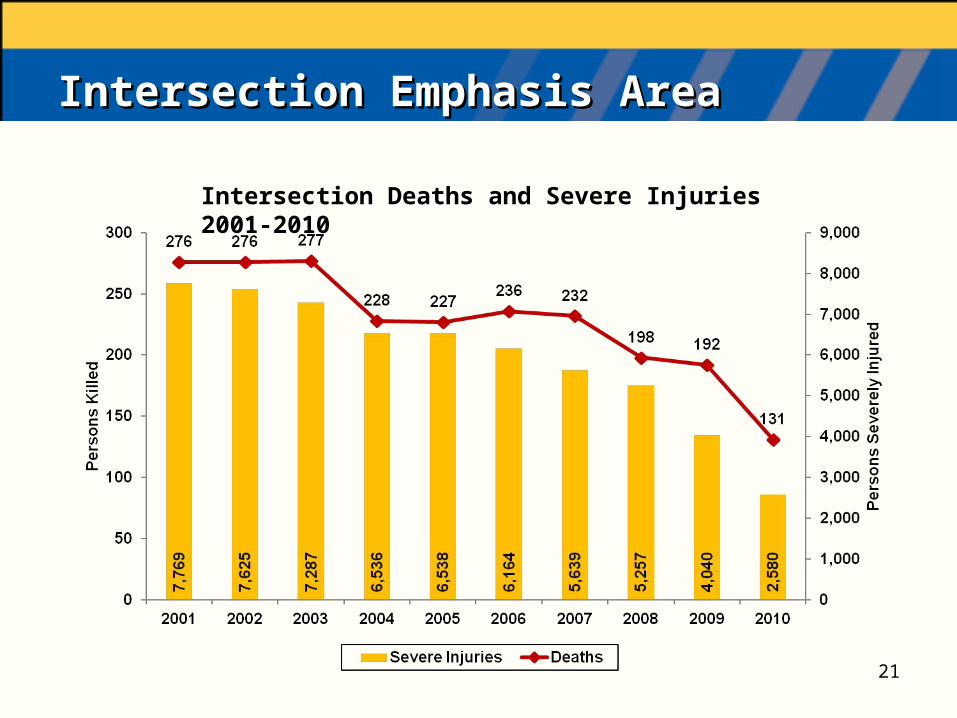
Intersection Deaths and Severe Injuries 2001-2010
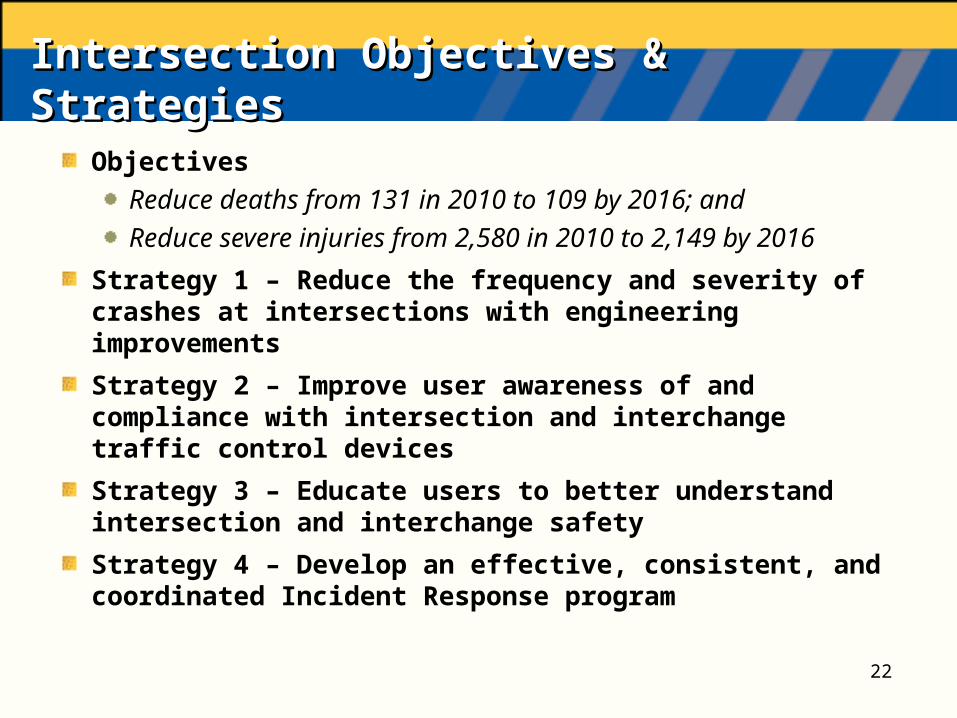
Intersection Objectives & StrategiesIntersection Objectives & Strategies
Objectives
Reduce deaths from 131 in 2010 to 109 by 2016; and
Reduce severe injuries from 2,580 in 2010 to 2,149 by 2016
Strategy 1 – Reduce the frequency and severity of crashes at intersections with engineering improvements
Strategy 2 – Improve user awareness of and compliance with intersection and interchange traffic control devices
Strategy 3 – Educate users to better understand intersection and interchange safety
Strategy 4 – Develop an effective, consistent, and coordinated Incident Response program
22
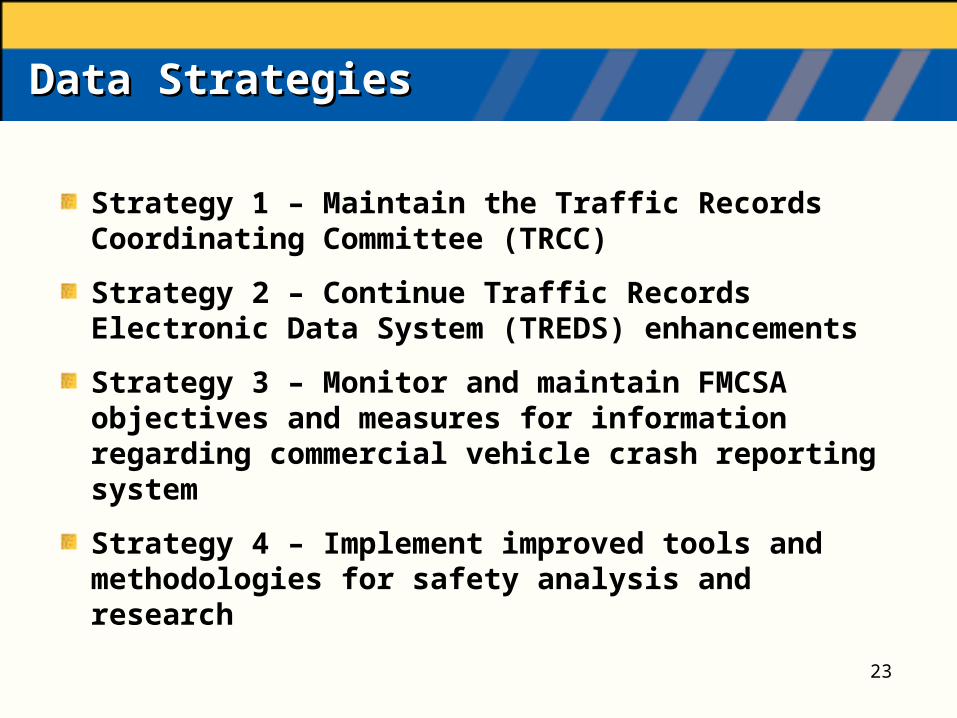
Data Strategies Data Strategies
Strategy 1 – Maintain the Traffic Records Coordinating Committee (TRCC)
Strategy 2 – Continue Traffic Records Electronic Data System (TREDS) enhancements
Strategy 3 – Monitor and maintain FMCSA objectives and measures for information regarding commercial vehicle crash reporting system
Strategy 4 – Implement improved tools and methodologies for safety analysis and research
23
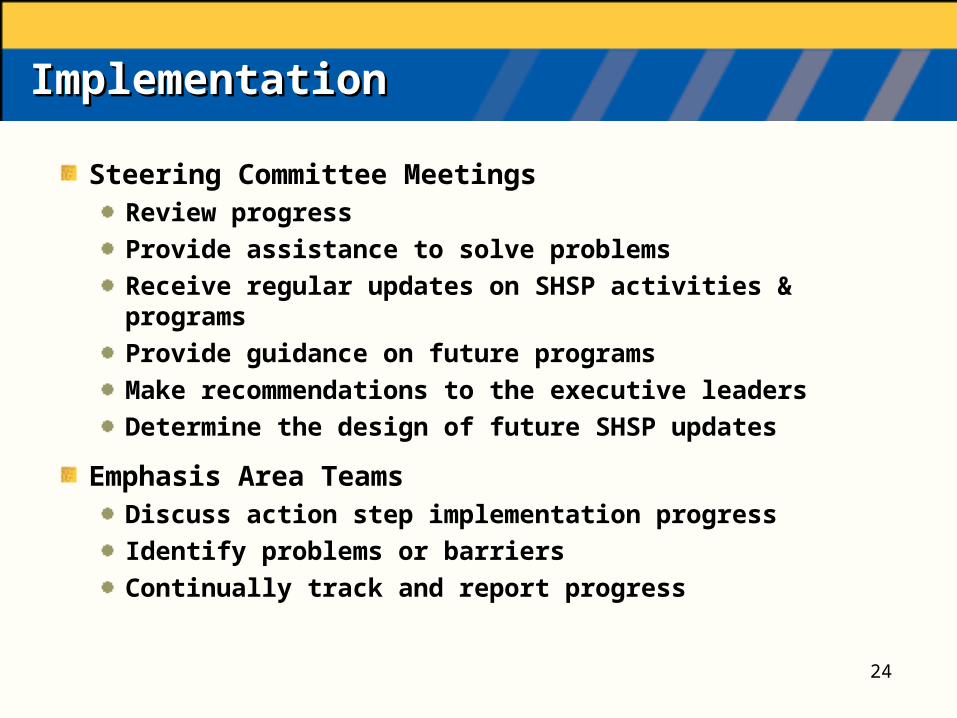
ImplementationImplementation
Steering Committee MeetingsReview progress
Provide assistance to solve problems
Receive regular updates on SHSP activities & programs
Provide guidance on future programs
Make recommendations to the executive leaders
Determine the design of future SHSP updates
Emphasis Area Teams Discuss action step implementation progress
Identify problems or barriers
Continually track and report progress
24
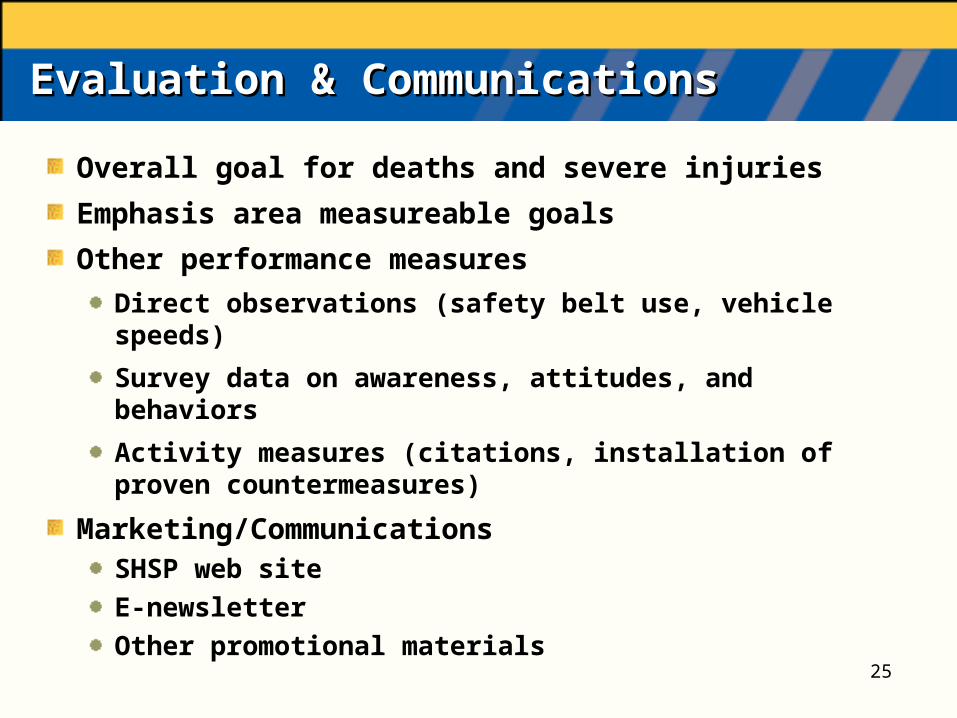
Evaluation & Communications Evaluation & Communications
Overall goal for deaths and severe injuries
Emphasis area measureable goals
Other performance measures
Direct observations (safety belt use, vehicle speeds)
Survey data on awareness, attitudes, and behaviors
Activity measures (citations, installation of proven countermeasures)
Marketing/Communications SHSP web site
E-newsletter
Other promotional materials
25