Embed Size (px)
Citation preview
1
IPN Progress Report 42-191 • November 15, 2012
OCTL Laser Beam Transmission Interruptions due to Aircraft and Predictive Avoidance
Abhijit Biswas,* William T. Roberts,* Joseph M. Kovalik,* and Malcolm W. Wright*
* Communications Architectures and Research Section.
The research described in this publication was carried out by the Jet Propulsion Laboratory, California Institute of Technology, under a contract with the National Aeronautics and Space Administration. © 2012 California Institute of Technology. U.S. Government sponsorship acknowledged.
abstract. — Laser beam transmission from the Optical Communications Telescope Labora-tory (OCTL) at Table Mountain, California, is required in order to provide a beacon source for optical link acquisition between spacecraft carrying laser communication terminals and OCTL. The laser transmission must be regulated in order to avoid inadvertent irradia-tion of overflying aircraft or spacecraft. In this article, we present an analysis and data to determine the frequency and duration of laser transmission interruptions so that future laser communication operations can be planned. A week’s worth of aircraft flight-path data in the vicinity of OCTL was obtained from the Federal Aviation Administration (FAA). The FAA data were analyzed, along with simulated Lunar Atmospheric and Dust Environment Explorer (LADEE) spacecraft predicted orbital data, in order to determine the frequency of laser transmission interruptions. An upper bound of five interruptions per 15-min period was observed due to aircraft overflights. Under more favorable conditions, a 15-min pass to the LADEE spacecraft could encounter no interruptions due to aircraft. The analysis was cor-roborated with “ground-truth” measurements at OCTL, using the existing laser safety sys-tem sensors and radar, to monitor aircraft that intercept a ±2.5-deg exclusion zone around the boresight axis of the OCTL telescope. The frequency of interruptions obtained from this data was in agreement with the predictions obtained using the FAA data analysis. Further-more, the ground observation confirmed typical interrupt durations of 3 to 5 s due to over-flying aircraft. This sets a lower bound for the fractional duration of the shoot window to be ~98 percent. Predictive avoidance (PA) data obtained from the Laser Clearing House (LCH) for approximately one month with the Moon as a target was analyzed. Note that the differ-ence between using the Moon as a target versus simulated LADEE spacecraft orbital data is that the Moon line of sight is continuous from moonrise to moonset, whereas the line of sight to the spacecraft is interrupted due to occultation of the spacecraft by the Moon. The limited LCH data analysis presented indicates that though >90 percent of laser shoot win-dows can be accessed nearly two-thirds of the time, it can drop to 60 to 90 percent approxi-mately one-third of the time, with a single instance when it dropped to 32 percent.
2
I. Introduction
The Optical Communications Telescope Laboratory (OCTL) telescope is being prepared to support a number of space-to-ground optical communication demonstrations, namely,
• TheLunarLaserCommunicationsDemonstration(LLCD)withtheLincolnLaboratory,Massachusetts Institute of Technology (LL-MIT)–developed Lunar Laser Space Terminal (LLST), on board the Lunar Atmospheric and Dust Environment Explorer (LADEE).
• TheOpticalPayloadforLasercommScience(OPALS)terminal,developedundertheJetPropulsion Laboratory (JPL) Phaeton Program, on board the International Space Station (ISS).
• TheLaserCommunicationsRelayDemonstration(LCRD),ledbyGoddardSpaceFlightCenter, where optical terminals will be deployed on geostationary Earth-orbiting (GEO) satellites.
In all cases, laser beacons will be transmitted from the OCTL telescope to the space termi-nal. Link operations from OCTL will comply with Occupational Safety and Health Admin-istration (OSHA), Federal Aviation Administration (FAA), and Laser Clearing House (LCH) restrictions so that personnel, overflying aircraft, and space assets are not inadvertently ex-posed to laser irradiation. Aircraft overflying OCTL are actively sensed with a synchronized infrared camera and radar system so that laser transmission can be interrupted to avoid inadvertent irradiation. Space assets are also protected by interrupting laser beam transmis-sion in accordance with predictive avoidance “shoot” and “shutter” time windows obtained from the LCH, where “shoot” times represent durations when laser transmission is permit-ted, while during “shutter” times laser beams exiting the OCTL telescope must be blocked.
In this article, we present analysis and ground measurements to determine the frequency and duration of transmission interruptions expected during link operations.
II. OCTL Laser Safety Considerations and Capabilities
A three-tier laser safety system was installed at OCTL; a brief description follows.
Tier 1 consists of a pair of infrared cameras mounted and boresighted with the telescope. The camera’s image is a narrow-field-of-view (NFOV), 9-deg × 12-deg region of sky centered within a wide-field-of-view (WFOV), 36-deg × 46-deg region. The Image Labs International (ILI) camera subsystem is capable of detecting low-flying aircraft at ranges out to at least 3.3 km and operates reliably with a 30-deg Sun-separation angle.
Tier 2 consists of a weather radar subsystem, also boresighted and mounted with the tele-scope, capable of detecting aircraft out to ranges of at least 23 km with an approximately 9-deg radar beam.
Tier 3 relies on LCH predictive avoidance (PA) files obtained from the U.S. Strategic Com-mand. These files indicate times when laser beam transmission in a predefined direction with a registered laser beam must be interrupted.
3
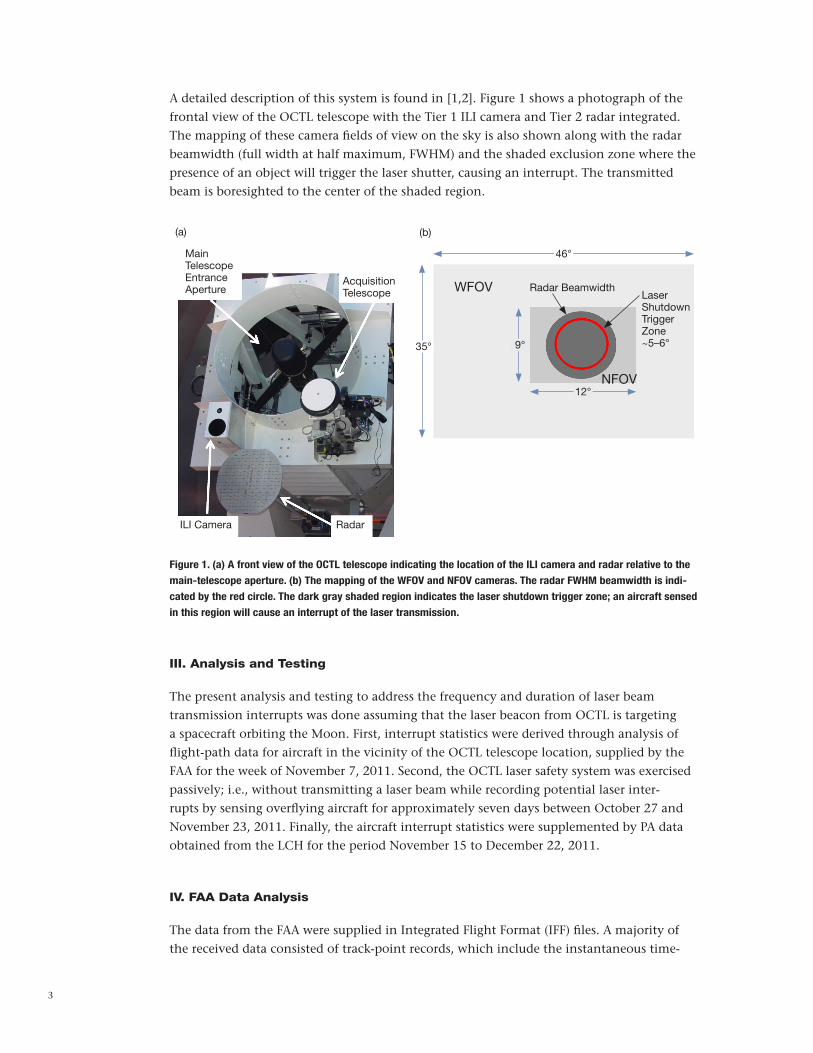
A detailed description of this system is found in [1,2]. Figure 1 shows a photograph of the frontal view of the OCTL telescope with the Tier 1 ILI camera and Tier 2 radar integrated. The mapping of these camera fields of view on the sky is also shown along with the radar beamwidth (full width at half maximum, FWHM) and the shaded exclusion zone where the presence of an object will trigger the laser shutter, causing an interrupt. The transmitted beam is boresighted to the center of the shaded region.
Figure 1. (a) A front view of the OCTL telescope indicating the location of the ILI camera and radar relative to the
main-telescope aperture. (b) The mapping of the WFOV and NFOV cameras. The radar FWHM beamwidth is indi-
cated by the red circle. The dark gray shaded region indicates the laser shutdown trigger zone; an aircraft sensed
in this region will cause an interrupt of the laser transmission.
III. Analysis and Testing
The present analysis and testing to address the frequency and duration of laser beam transmission interrupts was done assuming that the laser beacon from OCTL is targeting a spacecraft orbiting the Moon. First, interrupt statistics were derived through analysis of flight-path data for aircraft in the vicinity of the OCTL telescope location, supplied by the FAA for the week of November 7, 2011. Second, the OCTL laser safety system was exercised passively; i.e., without transmitting a laser beam while recording potential laser inter-rupts by sensing overflying aircraft for approximately seven days between October 27 and November 23, 2011. Finally, the aircraft interrupt statistics were supplemented by PA data obtained from the LCH for the period November 15 to December 22, 2011.
IV. FAA Data Analysis
The data from the FAA were supplied in Integrated Flight Format (IFF) files. A majority of the received data consisted of track-point records, which include the instantaneous time-
AcquisitionTelescope
NFOV
Radar BeamwidthLaserShutdownTriggerZone~5–6°
WFOV
RadarILI Camera
MainTelescopeEntranceAperture
35° 9°
12°
46°
(a) (b)
4
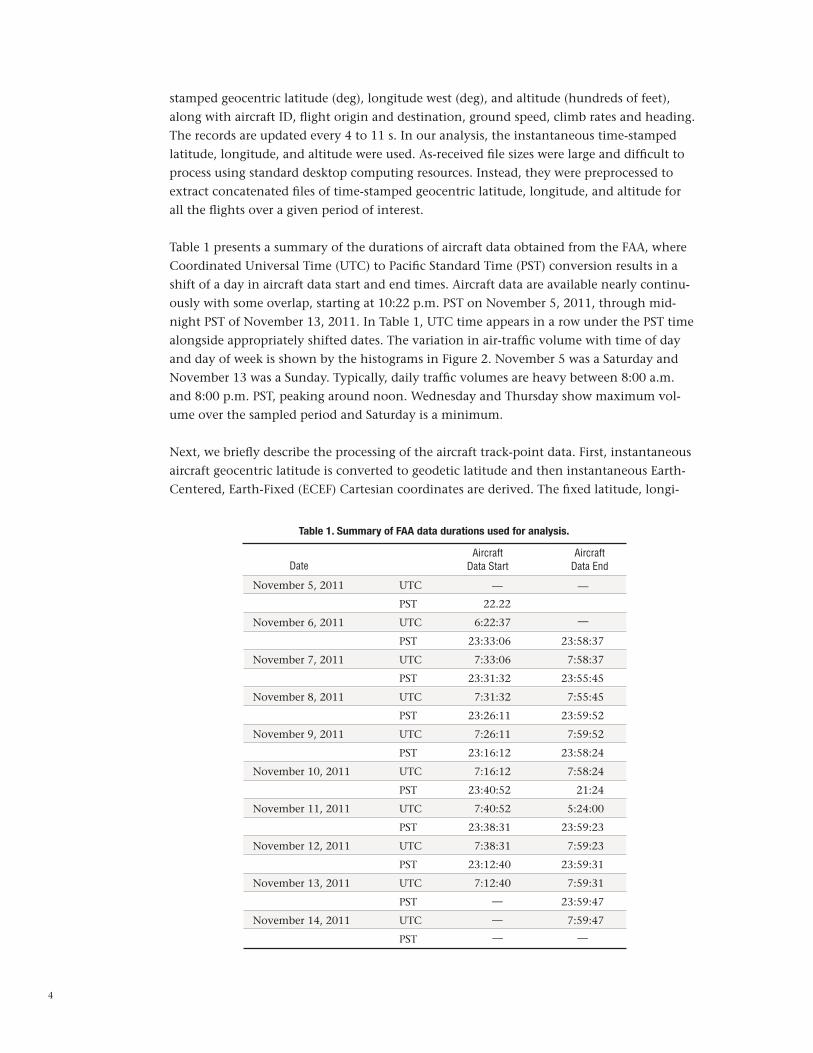
stamped geocentric latitude (deg), longitude west (deg), and altitude (hundreds of feet), along with aircraft ID, flight origin and destination, ground speed, climb rates and heading. The records are updated every 4 to 11 s. In our analysis, the instantaneous time-stamped latitude, longitude, and altitude were used. As-received file sizes were large and difficult to process using standard desktop computing resources. Instead, they were preprocessed to extract concatenated files of time-stamped geocentric latitude, longitude, and altitude for all the flights over a given period of interest.
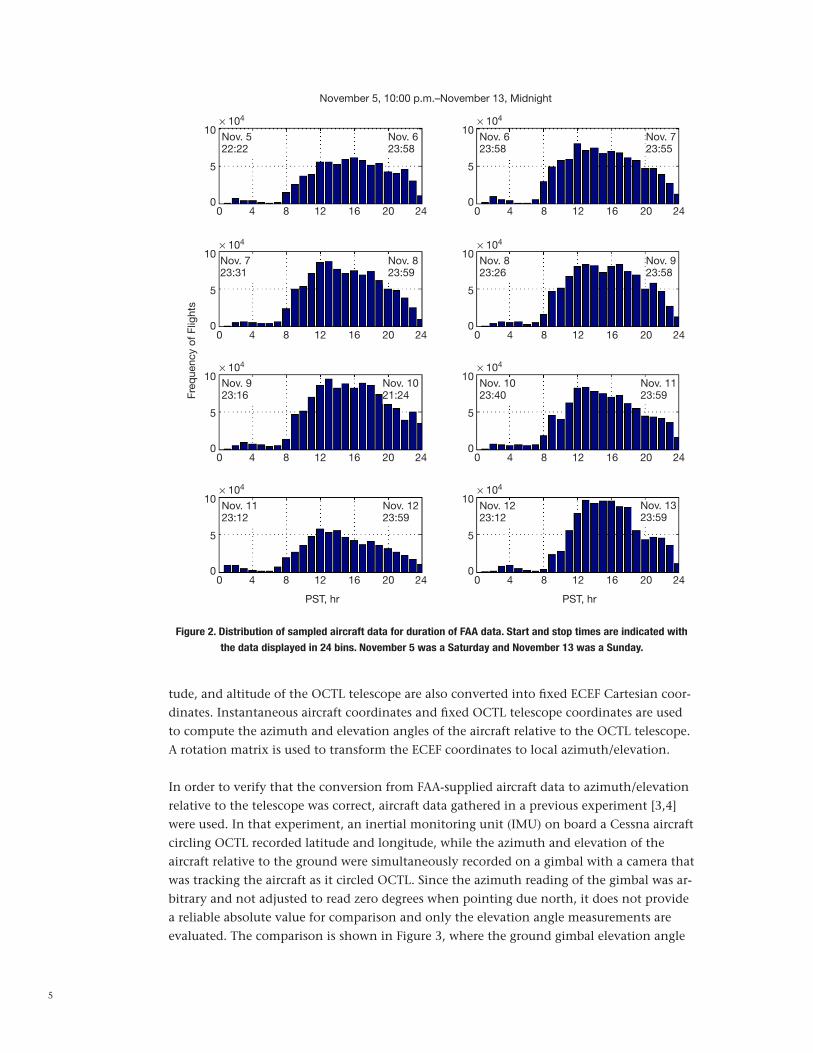
Table 1 presents a summary of the durations of aircraft data obtained from the FAA, where Coordinated Universal Time (UTC) to Pacific Standard Time (PST) conversion results in a shift of a day in aircraft data start and end times. Aircraft data are available nearly continu-ously with some overlap, starting at 10:22 p.m. PST on November 5, 2011, through mid-night PST of November 13, 2011. In Table 1, UTC time appears in a row under the PST time alongside appropriately shifted dates. The variation in air-traffic volume with time of day and day of week is shown by the histograms in Figure 2. November 5 was a Saturday and November 13 was a Sunday. Typically, daily traffic volumes are heavy between 8:00 a.m. and 8:00 p.m. PST, peaking around noon. Wednesday and Thursday show maximum vol-ume over the sampled period and Saturday is a minimum.
Next, we briefly describe the processing of the aircraft track-point data. First, instantaneous aircraft geocentric latitude is converted to geodetic latitude and then instantaneous Earth-Centered, Earth-Fixed (ECEF) Cartesian coordinates are derived. The fixed latitude, longi-
Table 1. Summary of FAA data durations used for analysis.
DateAircraft
Data Start
November 5, 2011 UTC —
PST 22.22
November 6, 2011 UTC 6:22:37
PST 23:33:06 23:58:37
November 7, 2011 UTC 7:33:06 7:58:37
PST 23:31:32 23:55:45
November 8, 2011 UTC 7:31:32 7:55:45
PST 23:26:11 23:59:52
November 9, 2011 UTC 7:26:11 7:59:52
PST 23:16:12 23:58:24
November 10, 2011 UTC 7:16:12 7:58:24
PST 23:40:52 21:24
November 11, 2011 UTC 7:40:52 5:24:00
PST 23:38:31 23:59:23
November 12, 2011 UTC 7:38:31 7:59:23
PST 23:12:40 23:59:31
November 13, 2011 UTC 7:12:40 7:59:31
PST 23:59:47
November 14, 2011 UTC 7:59:47
PST
Aircraft Data End
—
—
—
—
— —
5
Figure 2. Distribution of sampled aircraft data for duration of FAA data. Start and stop times are indicated with
the data displayed in 24 bins. November 5 was a Saturday and November 13 was a Sunday.
Nov. 522:22
Nov. 723:31
Nov. 923:16
Nov. 1123:12
Nov. 623:58
Nov. 823:26
Nov. 1023:40
Nov. 1223:12
× 104
× 104
× 104
× 104
× 104
× 104
× 104
× 104
Nov. 623:58
Nov. 823:59
Nov. 1021:24
Nov. 1223:59
Nov. 723:55
Nov. 923:58
Nov. 1123:59
Nov. 1323:59
November 5, 10:00 p.m.–November 13, Midnight
PST, hr
Freq
uenc
y of
Flig
hts
PST, hr
10
10
10
10
10
10
10
10
5
5
5
5
5
5
5
5
0
0
0
0
0
0
0
0
0
0
0
0
0
0
0
0
4
4
4
4
4
4
4
4
8
8
8
8
8
8
8
8
12
12
12
12
12
12
12
12
16
16
16
16
16
16
16
16
20
20
20
20
20
20
20
20
24
24
24
24
24
24
24
24
tude, and altitude of the OCTL telescope are also converted into fixed ECEF Cartesian coor-dinates. Instantaneous aircraft coordinates and fixed OCTL telescope coordinates are used to compute the azimuth and elevation angles of the aircraft relative to the OCTL telescope. A rotation matrix is used to transform the ECEF coordinates to local azimuth/elevation.
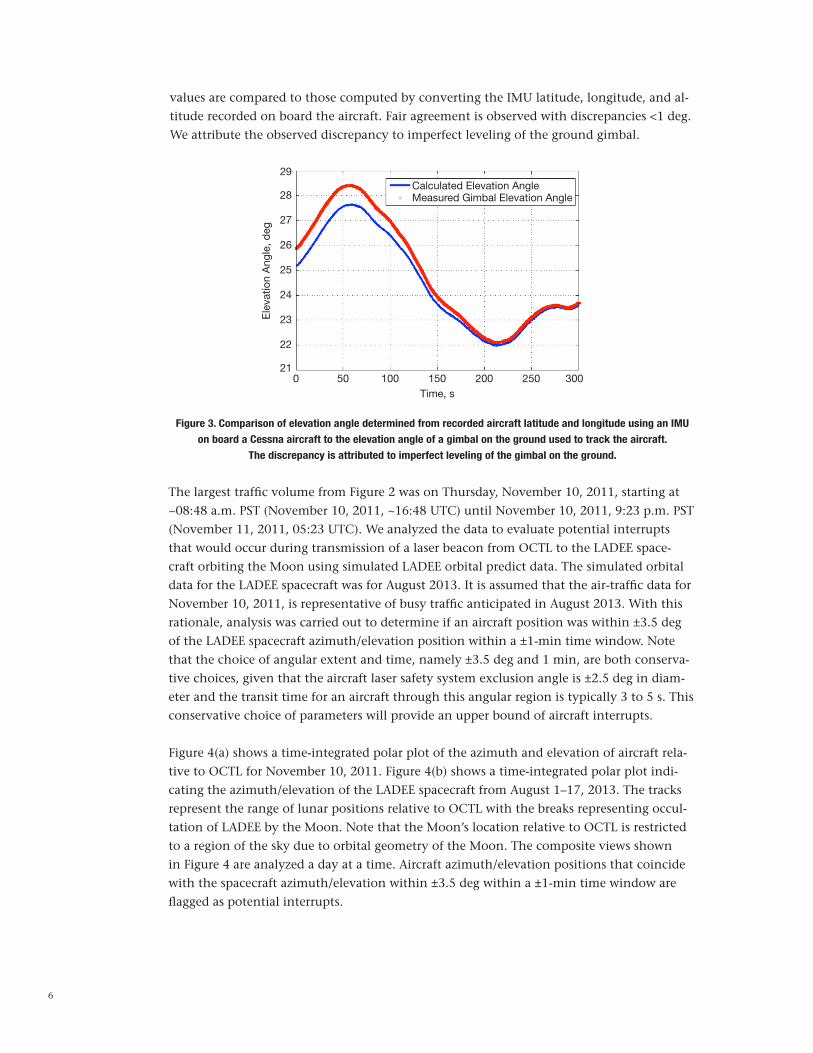
In order to verify that the conversion from FAA-supplied aircraft data to azimuth/elevation relative to the telescope was correct, aircraft data gathered in a previous experiment [3,4] were used. In that experiment, an inertial monitoring unit (IMU) on board a Cessna aircraft circling OCTL recorded latitude and longitude, while the azimuth and elevation of the aircraft relative to the ground were simultaneously recorded on a gimbal with a camera that was tracking the aircraft as it circled OCTL. Since the azimuth reading of the gimbal was ar-bitrary and not adjusted to read zero degrees when pointing due north, it does not provide a reliable absolute value for comparison and only the elevation angle measurements are evaluated. The comparison is shown in Figure 3, where the ground gimbal elevation angle
6
values are compared to those computed by converting the IMU latitude, longitude, and al-titude recorded on board the aircraft. Fair agreement is observed with discrepancies <1 deg. We attribute the observed discrepancy to imperfect leveling of the ground gimbal.
Time, s
Calculated Elevation AngleMeasured Gimbal Elevation Angle
Ele
vatio
n A
ngle
, deg
29
28
27
26
25
24
23
22
210 50 100 150 200 250 300
Figure 3. Comparison of elevation angle determined from recorded aircraft latitude and longitude using an IMU
on board a Cessna aircraft to the elevation angle of a gimbal on the ground used to track the aircraft.
The discrepancy is attributed to imperfect leveling of the gimbal on the ground.
The largest traffic volume from Figure 2 was on Thursday, November 10, 2011, starting at ~08:48 a.m. PST (November 10, 2011, ~16:48 UTC) until November 10, 2011, 9:23 p.m. PST (November 11, 2011, 05:23 UTC). We analyzed the data to evaluate potential interrupts that would occur during transmission of a laser beacon from OCTL to the LADEE space-craft orbiting the Moon using simulated LADEE orbital predict data. The simulated orbital data for the LADEE spacecraft was for August 2013. It is assumed that the air-traffic data for November 10, 2011, is representative of busy traffic anticipated in August 2013. With this rationale, analysis was carried out to determine if an aircraft position was within ±3.5 deg of the LADEE spacecraft azimuth/elevation position within a ±1-min time window. Note that the choice of angular extent and time, namely ±3.5 deg and 1 min, are both conserva-tive choices, given that the aircraft laser safety system exclusion angle is ±2.5 deg in diam-eter and the transit time for an aircraft through this angular region is typically 3 to 5 s. This conservative choice of parameters will provide an upper bound of aircraft interrupts.
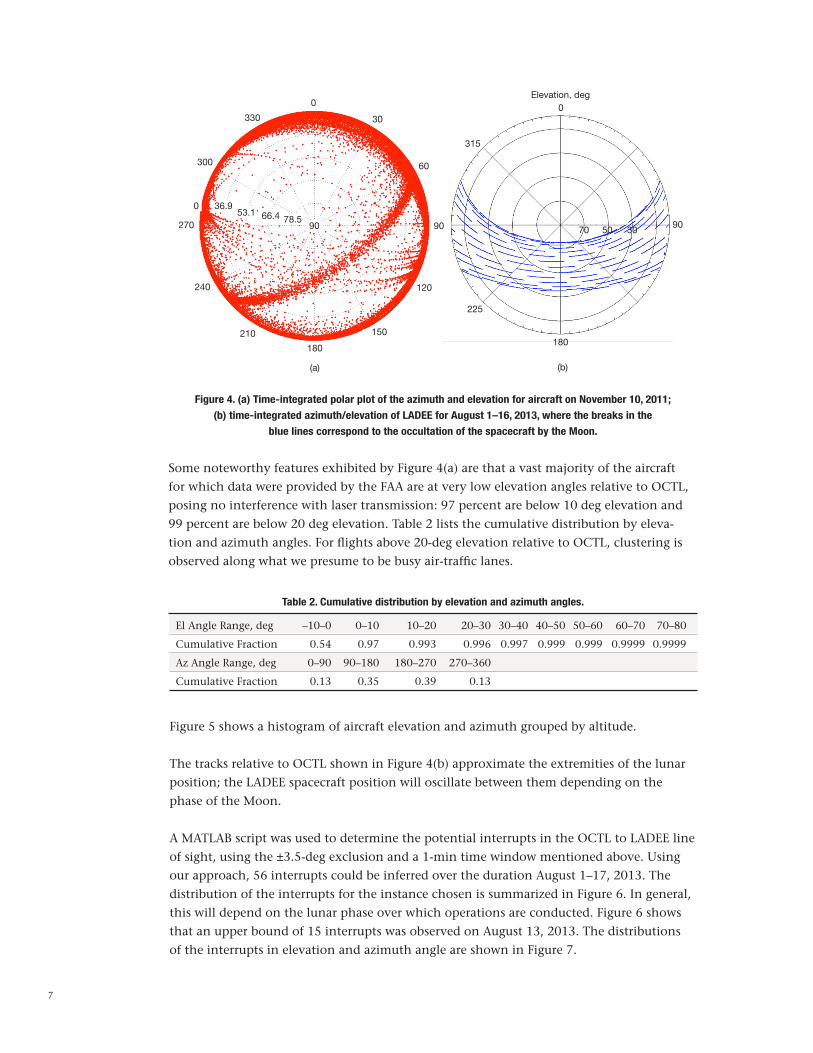
Figure 4(a) shows a time-integrated polar plot of the azimuth and elevation of aircraft rela-tive to OCTL for November 10, 2011. Figure 4(b) shows a time-integrated polar plot indi-cating the azimuth/elevation of the LADEE spacecraft from August 1–17, 2013. The tracks represent the range of lunar positions relative to OCTL with the breaks representing occul-tation of LADEE by the Moon. Note that the Moon’s location relative to OCTL is restricted to a region of the sky due to orbital geometry of the Moon. The composite views shown in Figure 4 are analyzed a day at a time. Aircraft azimuth/elevation positions that coincide with the spacecraft azimuth/elevation within ±3.5 deg within a ±1-min time window are flagged as potential interrupts.
7
10
45
90
135
36.9
330
300
0
270
240
210
180
(a) (b)
Elevation, deg
150
120
90 70 50 30
60
30
0 0
180
225
53.1 66.4 78.590
315
Figure 4. (a) Time-integrated polar plot of the azimuth and elevation for aircraft on November 10, 2011;
(b) time-integrated azimuth/elevation of LADEE for August 1–16, 2013, where the breaks in the
blue lines correspond to the occultation of the spacecraft by the Moon.
Some noteworthy features exhibited by Figure 4(a) are that a vast majority of the aircraft for which data were provided by the FAA are at very low elevation angles relative to OCTL, posing no interference with laser transmission: 97 percent are below 10 deg elevation and 99 percent are below 20 deg elevation. Table 2 lists the cumulative distribution by eleva-tion and azimuth angles. For flights above 20-deg elevation relative to OCTL, clustering is observed along what we presume to be busy air-traffic lanes.
Table 2. Cumulative distribution by elevation and azimuth angles.
El Angle Range, deg –10–0 0–10 10–20 20–30 30–40 40–50 50–60 60–70 70–80
Cumulative Fraction 0.54 0.97 0.993 0.996 0.997 0.999 0.999 0.9999 0.9999
Az Angle Range, deg 0–90 90–180 180–270 270–360
Cumulative Fraction 0.13 0.35 0.39 0.13
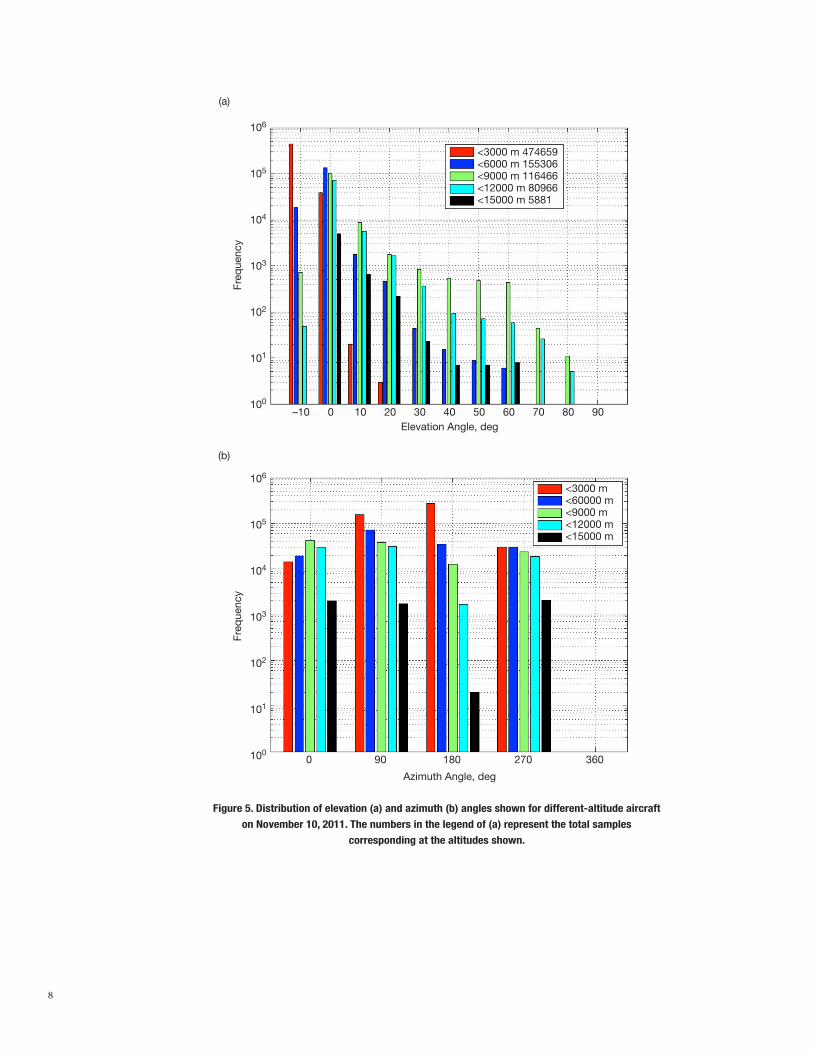
Figure 5 shows a histogram of aircraft elevation and azimuth grouped by altitude.
The tracks relative to OCTL shown in Figure 4(b) approximate the extremities of the lunar position; the LADEE spacecraft position will oscillate between them depending on the phase of the Moon.
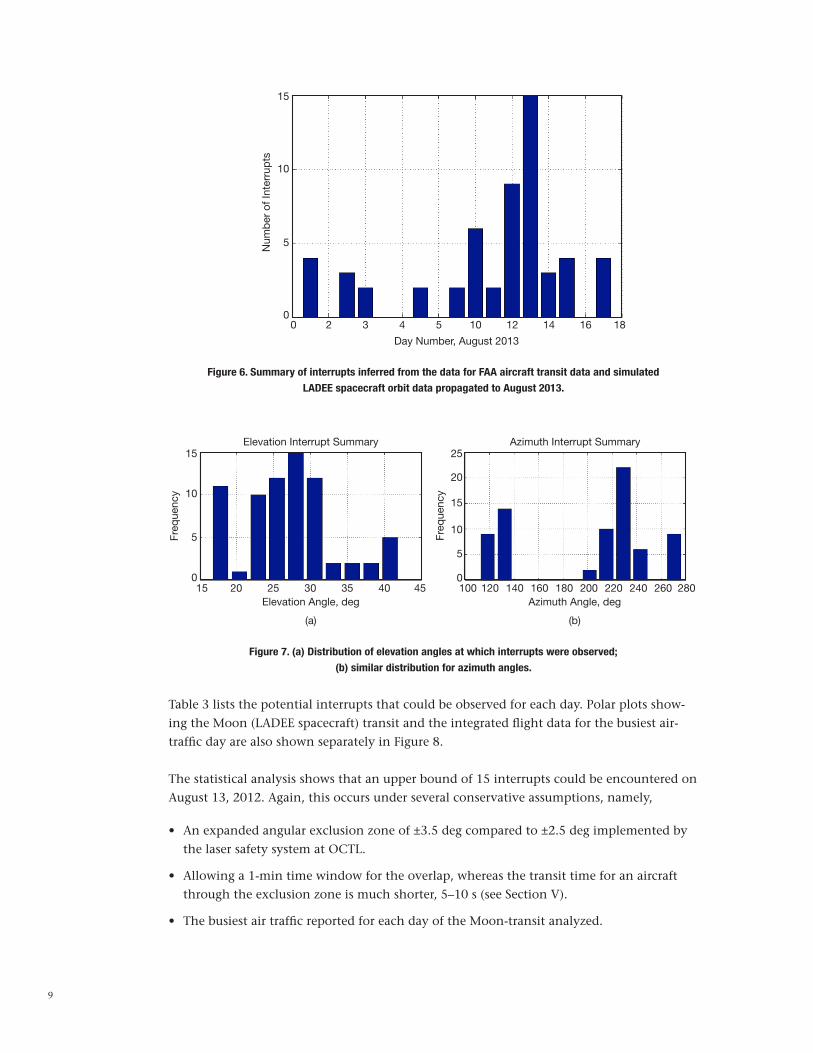
A MATLAB script was used to determine the potential interrupts in the OCTL to LADEE line of sight, using the ±3.5-deg exclusion and a 1-min time window mentioned above. Using our approach, 56 interrupts could be inferred over the duration August 1–17, 2013. The distribution of the interrupts for the instance chosen is summarized in Figure 6. In general, this will depend on the lunar phase over which operations are conducted. Figure 6 shows that an upper bound of 15 interrupts was observed on August 13, 2013. The distributions of the interrupts in elevation and azimuth angle are shown in Figure 7.
8
Figure 5. Distribution of elevation (a) and azimuth (b) angles shown for different-altitude aircraft
on November 10, 2011. The numbers in the legend of (a) represent the total samples
corresponding at the altitudes shown.
Azimuth Angle, deg
101
1000 90 180 270 360
<3000 m<60000 m<9000 m<12000 m<15000 m
Freq
uenc
y
(b)
106
105
104
103
102
<3000 m 474659<6000 m 155306<9000 m 116466<12000 m 80966<15000 m 5881
Freq
uenc
y
Elevation Angle, deg
(a)
106
105
104
103
102
101
100–10 0 10 20 30 40 50 60 70 80 90
9
Figure 7. (a) Distribution of elevation angles at which interrupts were observed;
(b) similar distribution for azimuth angles.
Num
ber
of I
nter
rup
ts
Day Number, August 2013
15
10
5
00 2 3 4 5 10 12 14 16 18
Figure 6. Summary of interrupts inferred from the data for FAA aircraft transit data and simulated
LADEE spacecraft orbit data propagated to August 2013.
Freq
uenc
y
Freq
uenc
yAzimuth Interrupt SummaryElevation Interrupt Summary
Elevation Angle, deg
(a)
Azimuth Angle, deg
(b)
15
10
0
25
20
15
10
5
0
5
10015 20 25 30 35 40 45 120 140 160 180 200 220 240 260 280
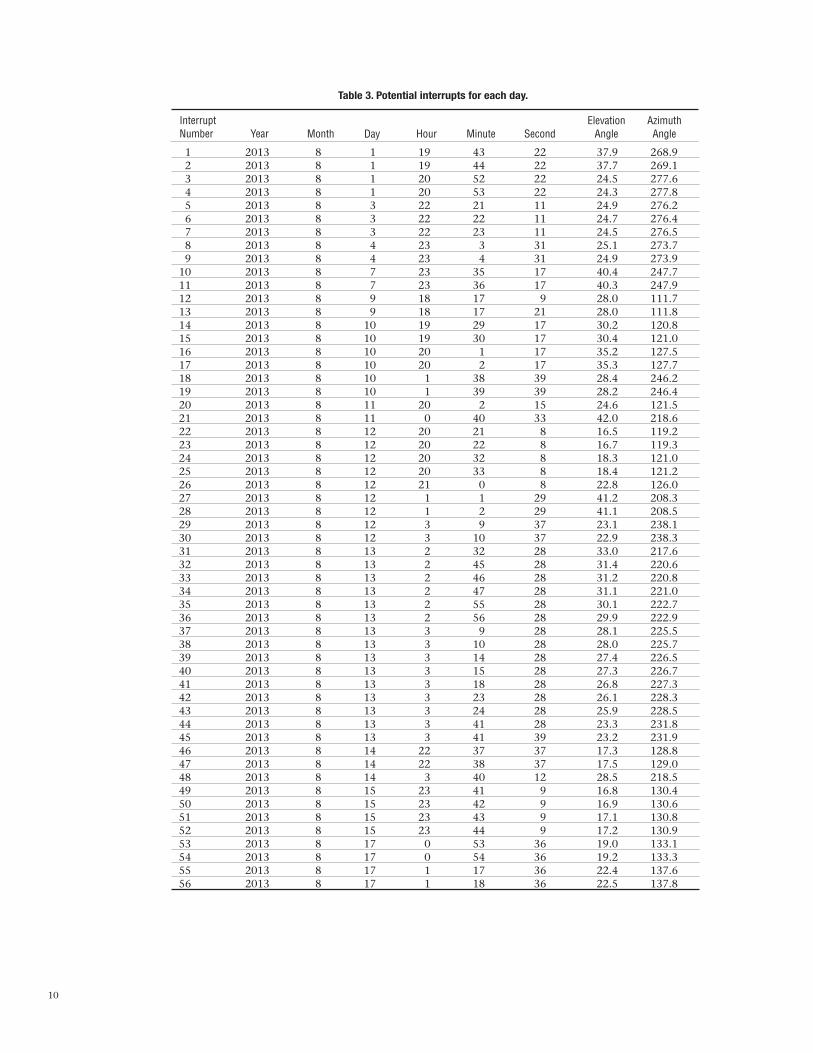
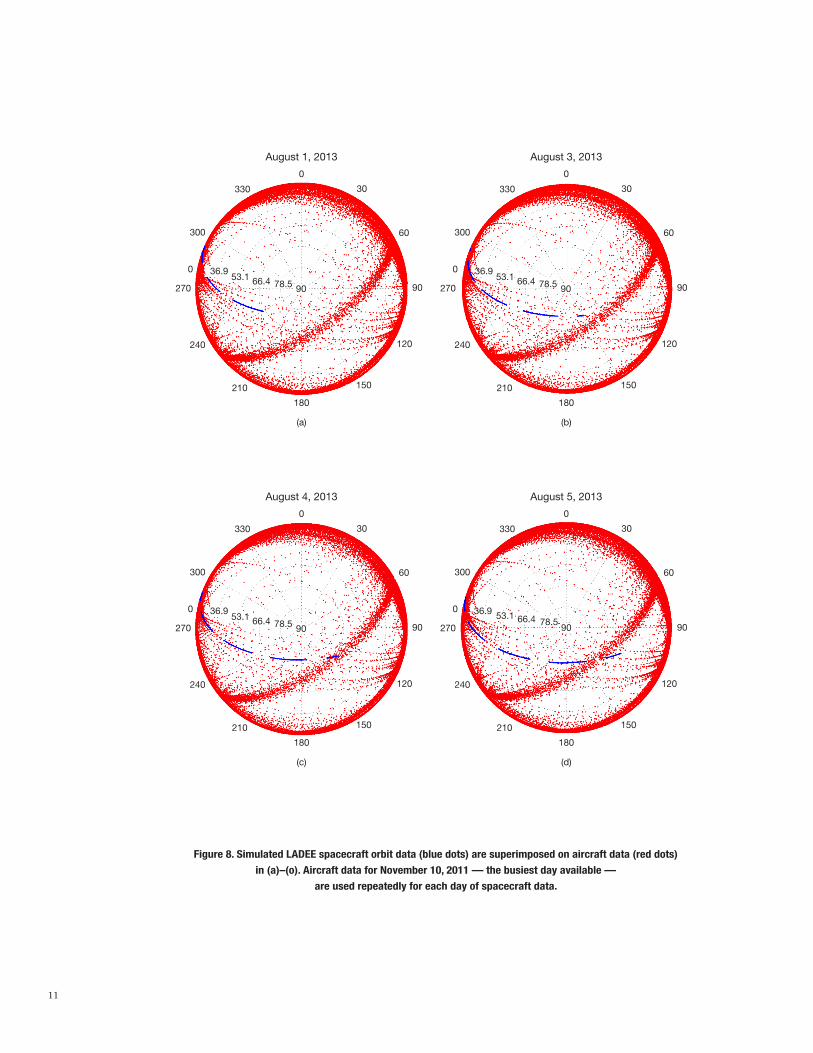
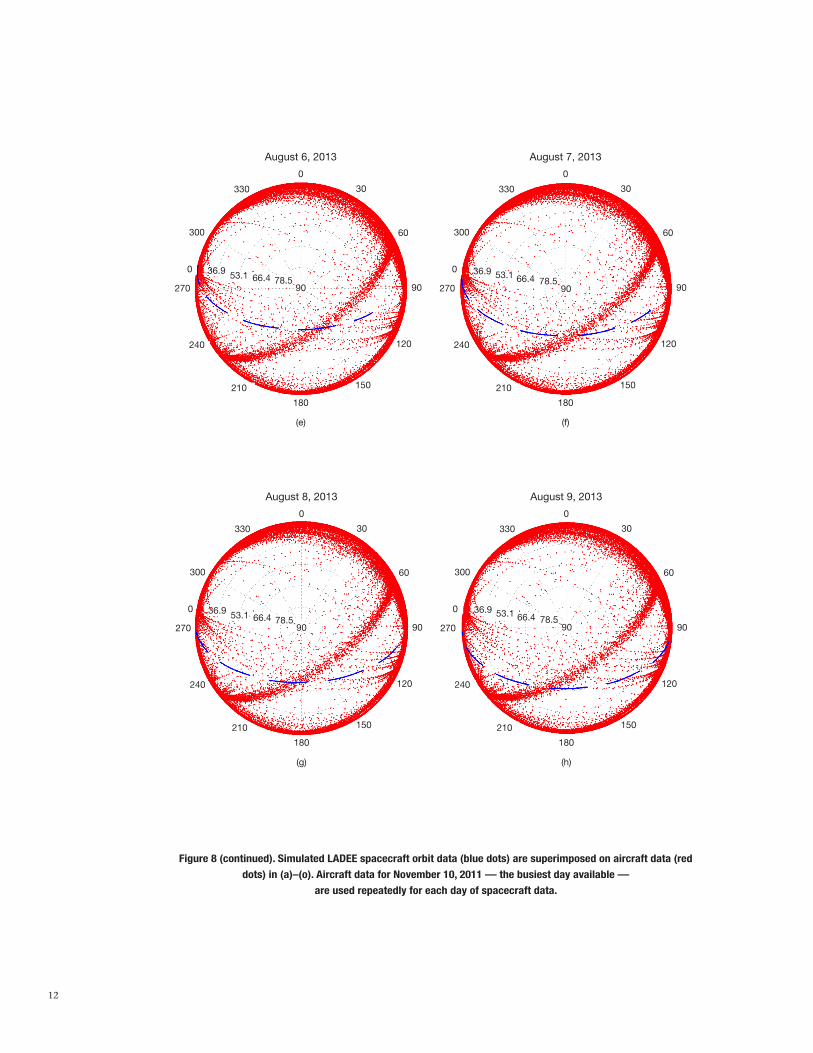
Table 3 lists the potential interrupts that could be observed for each day. Polar plots show-ing the Moon (LADEE spacecraft) transit and the integrated flight data for the busiest air-traffic day are also shown separately in Figure 8.
The statistical analysis shows that an upper bound of 15 interrupts could be encountered on August 13, 2012. Again, this occurs under several conservative assumptions, namely,
• Anexpandedangularexclusionzoneof±3.5degcomparedto±2.5degimplementedbythe laser safety system at OCTL.
• Allowinga1-mintimewindowfortheoverlap,whereasthetransittimeforanaircraftthrough the exclusion zone is much shorter, 5–10 s (see Section V).
• ThebusiestairtrafficreportedforeachdayoftheMoon-transitanalyzed.
10
InterruptNumber
Table 3. Potential interrupts for each day.
Year Month Day Hour Minute SecondElevation
AngleAzimuth
Angle
1 2013 8 1 19 43 22 37.9 268.9 2 2013 8 1 19 44 22 37.7 269.1 3 2013 8 1 20 52 22 24.5 277.6 4 2013 8 1 20 53 22 24.3 277.8 5 2013 8 3 22 21 11 24.9 276.2 6 2013 8 3 22 22 11 24.7 276.4 7 2013 8 3 22 23 11 24.5 276.5 8 2013 8 4 23 3 31 25.1 273.7 9 2013 8 4 23 4 31 24.9 273.9 10 2013 8 7 23 35 17 40.4 247.7 11 2013 8 7 23 36 17 40.3 247.9 12 2013 8 9 18 17 9 28.0 111.7 13 2013 8 9 18 17 21 28.0 111.8 14 2013 8 10 19 29 17 30.2 120.8 15 2013 8 10 19 30 17 30.4 121.0 16 2013 8 10 20 1 17 35.2 127.5 17 2013 8 10 20 2 17 35.3 127.7 18 2013 8 10 1 38 39 28.4 246.2 19 2013 8 10 1 39 39 28.2 246.4 20 2013 8 11 20 2 15 24.6 121.5 21 2013 8 11 0 40 33 42.0 218.6 22 2013 8 12 20 21 8 16.5 119.2 23 2013 8 12 20 22 8 16.7 119.3 24 2013 8 12 20 32 8 18.3 121.0 25 2013 8 12 20 33 8 18.4 121.2 26 2013 8 12 21 0 8 22.8 126.0 27 2013 8 12 1 1 29 41.2 208.3 28 2013 8 12 1 2 29 41.1 208.5 29 2013 8 12 3 9 37 23.1 238.1 30 2013 8 12 3 10 37 22.9 238.3 31 2013 8 13 2 32 28 33.0 217.6 32 2013 8 13 2 45 28 31.4 220.6 33 2013 8 13 2 46 28 31.2 220.8 34 2013 8 13 2 47 28 31.1 221.0 35 2013 8 13 2 55 28 30.1 222.7 36 2013 8 13 2 56 28 29.9 222.9 37 2013 8 13 3 9 28 28.1 225.5 38 2013 8 13 3 10 28 28.0 225.7 39 2013 8 13 3 14 28 27.4 226.5 40 2013 8 13 3 15 28 27.3 226.7 41 2013 8 13 3 18 28 26.8 227.3 42 2013 8 13 3 23 28 26.1 228.3 43 2013 8 13 3 24 28 25.9 228.5 44 2013 8 13 3 41 28 23.3 231.8 45 2013 8 13 3 41 39 23.2 231.9 46 2013 8 14 22 37 37 17.3 128.8 47 2013 8 14 22 38 37 17.5 129.0 48 2013 8 14 3 40 12 28.5 218.5 49 2013 8 15 23 41 9 16.8 130.4 50 2013 8 15 23 42 9 16.9 130.6 51 2013 8 15 23 43 9 17.1 130.8 52 2013 8 15 23 44 9 17.2 130.9 53 2013 8 17 0 53 36 19.0 133.1 54 2013 8 17 0 54 36 19.2 133.3 55 2013 8 17 1 17 36 22.4 137.6 56 2013 8 17 1 18 36 22.5 137.8
11
36.9 36.9
330 330
300 300
0 0
270 270
240 240
210 210
180 180
(a) (b)
August 1, 2013 August 3, 2013
150 150
120 120
90 90
60 60
30 30
0 0
53.1 53.166.4 66.478.5 78.590 90
36.9 36.9
330 330
300 300
0 0
270 270
240 240
210 210
180 180
(c) (d)
August 4, 2013 August 5, 2013
150 150
120 120
90 90
60 60
30 30
0 0
53.1 53.166.4 66.478.5 78.590 90
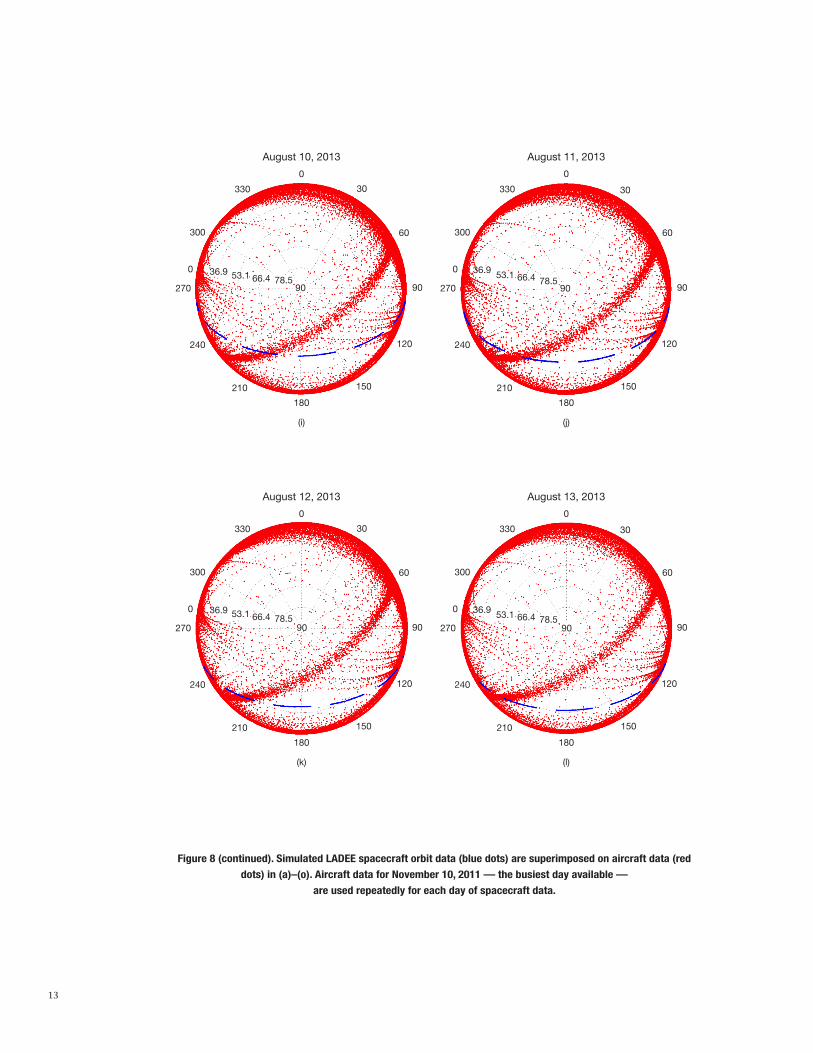
Figure 8. Simulated LADEE spacecraft orbit data (blue dots) are superimposed on aircraft data (red dots)
in (a)–(o). Aircraft data for November 10, 2011 — the busiest day available —
are used repeatedly for each day of spacecraft data.
12
36.9 36.9
330 330
300 300
0 0
270 270
240 240
210 210
180 180
(e) (f)
August 6, 2013 August 7, 2013
150 150
120 120
90 90
60 60
30 30
0 0
53.1 53.166.4 66.478.5 78.590 90
Figure 8 (continued). Simulated LADEE spacecraft orbit data (blue dots) are superimposed on aircraft data (red
dots) in (a)–(o). Aircraft data for November 10, 2011 — the busiest day available —
are used repeatedly for each day of spacecraft data.
36.9 36.9
330 330
300 300
0 0
270 270
240 240
210 210
180 180
(g) (h)
August 8, 2013 August 9, 2013
150 150
120 120
90 90
60 60
30 30
0 0
53.1 53.166.4 66.478.5 78.590 90
13
Figure 8 (continued). Simulated LADEE spacecraft orbit data (blue dots) are superimposed on aircraft data (red
dots) in (a)–(o). Aircraft data for November 10, 2011 — the busiest day available —
are used repeatedly for each day of spacecraft data.
36.9 36.9
330 330
300 300
0 0
270 270
240 240
210 210
180 180
(i) (j)
August 10, 2013 August 11, 2013
150 150
120 120
90 90
60 60
30 30
0 0
53.1 53.166.4 66.478.5 78.590 90
36.9 36.9
330 330
300 300
0 0
270 270
240 240
210 210
180 180
(k) (l)
August 12, 2013 August 13, 2013
150 150
120 120
90 90
60 60
30 30
0 0
53.1 53.166.4 66.478.5 78.590 90
14
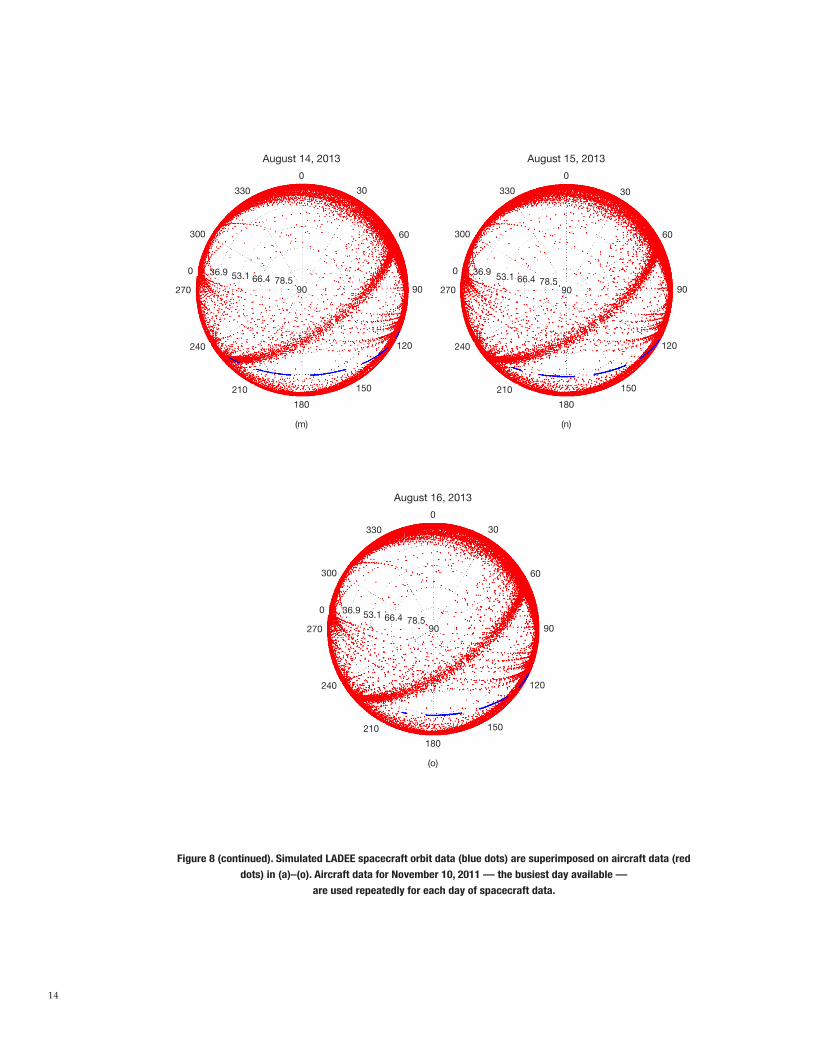
Figure 8 (continued). Simulated LADEE spacecraft orbit data (blue dots) are superimposed on aircraft data (red
dots) in (a)–(o). Aircraft data for November 10, 2011 — the busiest day available —
are used repeatedly for each day of spacecraft data.
36.9 36.9
330 330
300 300
0 0
270 270
240 240
210 210
180 180
(m) (n)
August 14, 2013 August 15, 2013
150 150
120 120
90 90
60 60
30 30
0 0
53.1 53.166.4 66.478.5 78.590 90
36.9
330
300
0
270
240
210
180
(o)
August 16, 2013
150
120
90
60
30
0
53.1 66.4 78.590
15
• ChoosingalunarphasesuchthatthelineofsightfromOCTLtotheMooninterceptsthebusy air-traffic lane at relatively low elevation angles (see polar plots for August 12 and August 13).
The interruptions also occur in bursts and are not uniformly distributed. Table 3 indicates as many as five interruptions during any 15-min period of an anticipated LADEE space-craft pass during the upcoming LLCD, currently planned for August–September 2013. The LADEE spacecraft hosts the LLST, which will receive the beacon transmitted from OCTL and in turn transmit downlink communications to OCTL. The 15-min pass duration is a result of spacecraft occultation by the Moon and available spacecraft resources to operate LLST. Our analysis indicates that each interrupt will last about 5 s, so that the fraction of the pass interrupted due to aircraft overflights will be very low. However, each interrupt will require reacquisition of the laser link since the LLST reception of the beacon from OCTL can be interrupted for <1 s in order to initiate reacquisition by the spacecraft.
V. Measurements with the OCTL Laser Safety System
A. OCTL Laser Safety System Status
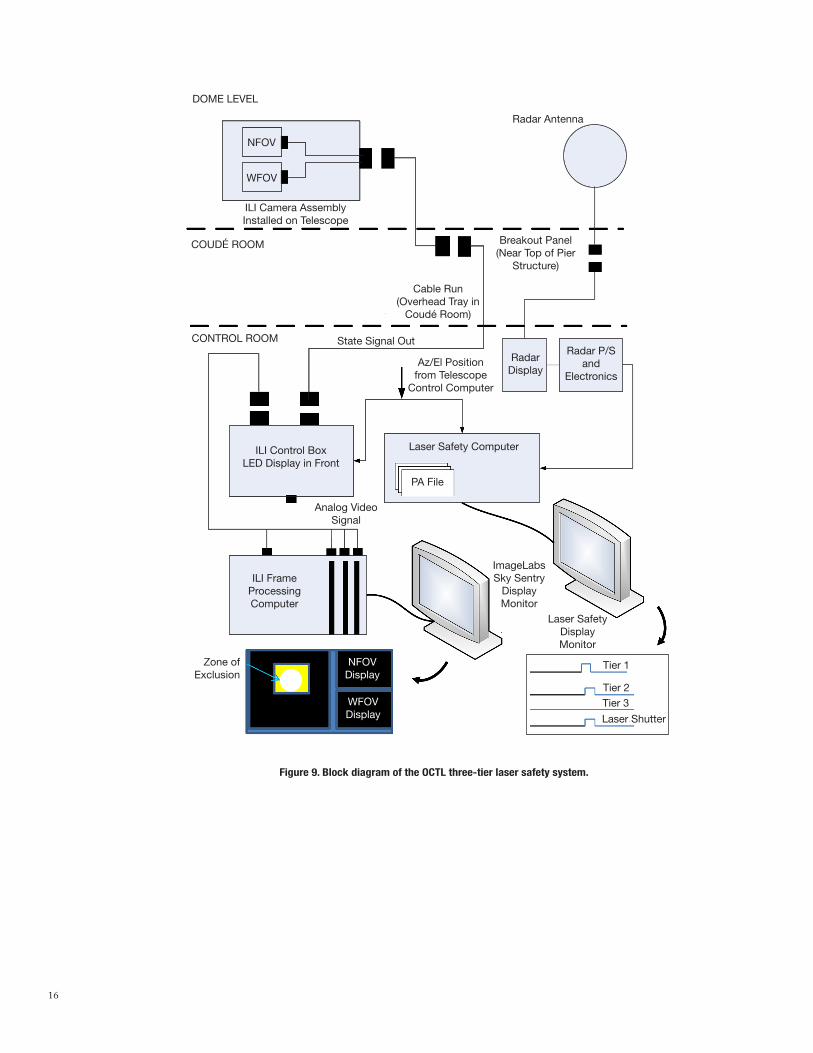
Figure 9 shows a block diagram of the OCTL three-tier laser safety system. The elements are distributed in the telescope dome and the control room with connectivity through the coudé room. The Tier 1 ILI camera system is mounted on the telescope (See Figure 1) and is remotely powered and monitored from the control room by the ILI control box. Analog video feed from the control box is output to the ILI frame processing computer where real-time images are generated and displayed by the ImageLabs Sky Sentry software.
The Tier 2 radar antenna is mounted on the telescope (see Figure 1) and connected to a display unit and electronics that generate a transistor–transistor logic (TTL)–trigger signal when a radar return from plausible aircraft ranges is detected. The radar display indicates the signal return range, allowing a crude visual estimate of the range of the aircraft.
A separate laser safety computer serves as a central repository for logging laser safety data gathered from Tier 1 and Tier 2. Additionally, PA files received from the LCH are also loaded in this computer. Time-stamped records of the three-tier laser safety system and laser shut-ter status are logged at 1-Hz rates, and the trigger status of each tier, including the laser safety shutter, is displayed in real time. A digital feed of the telescope azimuth and eleva-tion positions is also simultaneously logged.
The status of the OCTL laser safety system was checked prior to making aircraft observa-tions. The ILI camera subsystem was reinstalled at the beginning of the campaign on Sep-tember 28, 2011. Following installation, the NFOV camera was found to be unresponsive. A discontinuity in the cable from the camera mounted on the telescope to a break-out panel in the coudé room was identified and repaired. Following repair, the NFOV camera oper-ated intermittently. When the ILI NFOV camera was operating, nominal functioning of the OCTL laser safety system could be verified. However, because of the intermittent operation of the NFOV camera, the laser safety system could not be relied upon to faithfully log all potential aircraft interrupts.
16
Figure 9. Block diagram of the OCTL three-tier laser safety system.
DOME LEVEL
NFOV
WFOV
ILI Camera Assembly Installed on Telescope
COUDÉ ROOM
CONTROL ROOM
Radar Antenna
Breakout Panel (Near Top of Pier
Structure)
Cable Run (Overhead Tray in
Coudé Room)
State Signal Out
Az/El Position from Telescope
Control Computer
Radar Display
Radar P/S and
Electronics
ILI Control BoxLED Display in Front
Laser Safety Computer
PA File
Analog Video Signal
ILI Frame Processing Computer
ImageLabs Sky Sentry
Display Monitor
Laser Safety Display Monitor
Zone of Exclusion
WFOV Display
NFOV Display
Tier 1
Tier 2Tier 3
Laser Shutter

17
Instead of postponing the aircraft tracking activity until the NFOV camera could be repaired or replaced, testing proceeded by relying on the WFOV camera and radar combination. The radar beamwidth overlaps the NFOV camera field of view, providing sufficient redundancy to allow identifying aircraft in the beam path (see Figure 1). The radar system was deter-mined to be working nominally, albeit with a vertical offset between the radar footprint and the NFOV camera estimated to be ~3 deg. Rectifying this misalignment is pending.
Additionally, visual observations were made of (i) the telescope position from the telescope control graphical user interface (GUI) (not shown in Figure 9); (ii) the Sky Sentry software real-time image display; and (iii) the radar display. These observations were manually recorded, allowing a sanity check of the autonomously logged data as well as providing ad-ditional oversight for durations when the NFOV camera was not operating.
Most tests were conducted while tracking the Moon except when the Moon was up at off-peak aircraft flight hours or was too close (<30 deg separation) to the Sun. Moon tracking was substituted with either tracking a star on the ecliptic or “staring” with the telescope at a fixed portion of the sky and monitoring the aircraft that intercepted the telescope line of sight. In the “staring” mode, a region of sky that appeared to overlap busy air traffic lanes was chosen. Note that our visual observations independently concluded there were certain regions of the sky where more frequent aircraft passages could be sensed, as corroborated by the later FAA data analysis presented in the previous section.
B. Detailed Test Results
Initially, tests were conducted for a cumulative duration of 16 hr on October 14 and Octo-ber 26 while tracking the Moon or stars near the ecliptic. Very few aircraft that could cause interrupts to laser transmission were sensed or visually observed by the laser safety system. Two passages of aircraft directly through the 9-deg zone of exclusion (see Figure 1) were detected in 16 hr of observation time, spanning two days. During this same period, several aircraft (12) were observed to traverse the WFOV camera field of view, outside the zone of exclusion.
On Friday, October 27, the test strategy was modified and the telescope was switched to a “staring” mode to a region of the sky where more frequent aircraft passages were encoun-tered. With the telescope parked, data were logged for 170 min. During these observations, proper functioning of the radar was confirmed.
Frequent aircraft overflights were sensed and tracked by the WFOV camera and could be vi-sually observed on the ILI display screen represented by Figure 9. Of these, the aircraft paths that intersected the central circle inside the NFOV box in Figure 9 would potentially cause a laser shutdown trigger. Under normal OCTL laser safety system operations, shutdown triggers would be issued by the ILI and radar for aircraft ranges out to at least 3.3 km. Closer bright aircraft would be triggered by the WFOV system while dimmer farther objects would be triggered by the NFOV camera. For farther ranges out to 23 km, only the Tier 2 radar trig-ger would operate.

18
On October 27, the WFOV camera sensitivity was set to maximize detection of as many aircraft as possible. This allowed a better evaluation of aircraft flying in our vicinity as well as assessing the subset of these aircraft that would cause interruption of laser transmissions from OCTL. Manual logs of visual observations augmented the laser safety system log.
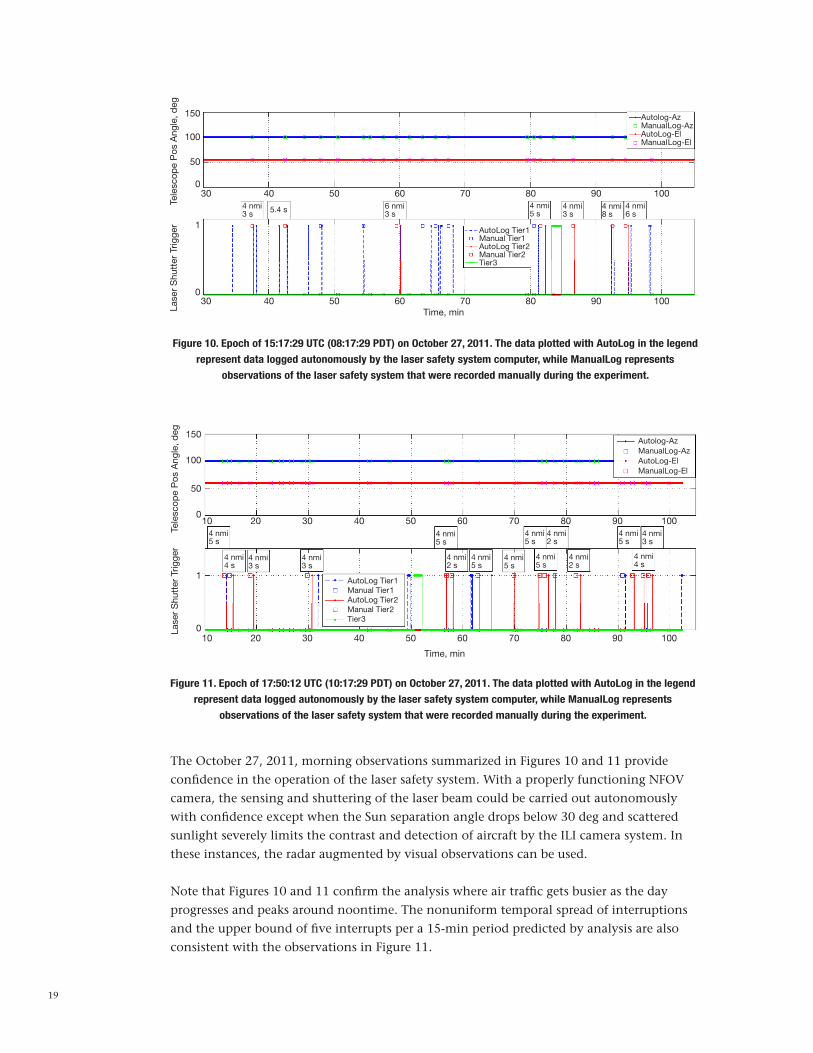
Figures 10 and 11 show the logged results of aircraft tracked. Note that potential laser shutdown triggers visually determined by viewing an aircraft traverse the central circular portion inside the NFOV shown in Figure 9 are generally indicated either by (i) the radar and ILI system both generating shutdown triggers, or (ii) by only the radar generating shut-down triggers.
In the top panel of Figure 10, the fixed azimuth and elevation angles of the parked tele-scope as logged by the laser safety system are shown by the solid red and blue lines. The square data points represent telescope azimuth and elevation readings observed on the tele-scope control computer GUI. These were logged manually and verified that the laser safety system was logging telescope position reliably.
In the lower panel of Figure 10, the vertical lines represent the start and end of laser shutter triggers initiated by the radar (red) and the ILI cameras (blue). The red and blue squares represent manually logged interrupt times that were determined by visually observing the radar and ILI frame processing computer display. Finally, the green lines represent the start and stop of Tier 3 (PA)–initiated triggers.
Thus, the red vertical lines are corroborated by the red squares, with the discrepancy in time being due to delay in manual logging. There were seven interruptions. The ranges in nautical miles (nmi) obtained from the visual observation of the radar display and logged manually along with the measured duration of the potential interrupt in seconds are an-notated on the plot. A cumulative duration of 32 s of potential interrupts was logged over 70 min (0.76 percent).
Note that almost all the red vertical lines are followed by a blue vertical line, representing that the WFOV camera was also generating shutdown triggers for each of these events. The blue vertical lines and squares that occur by themselves represent the passage of an aircraft through a WFOV region outside the exclusion zone. Furthermore, it should be noted that in addition to the blue vertical lines there were other instances of aircraft flying through the WFOV that did not cause a Tier 1 trigger, presumably because the range of these aircraft was too distant.
The PA triggers were verified to occur at prescribed times that were uploaded in a dummy test file; i.e., some interrupts’ time windows were entered into a PA file and the laser safety system faithfully generated a laser shutter trigger for these durations.
Figure 11 shows a record for another 100 min later on the morning of October 27, 2011, during which we again stared at the busiest air-traffic lane with a 5-deg increase in eleva-tion angle; i.e., 60 deg instead of 55 deg. As indicated by the red vertical lines and squares, many more potential interruptions were encountered during this busier period. A distrib-uted outage of nearly 62 s was logged over a 95-min observation period (1 percent).
19
Figure 11. Epoch of 17:50:12 UTC (10:17:29 PDT) on October 27, 2011. The data plotted with AutoLog in the legend
represent data logged autonomously by the laser safety system computer, while ManualLog represents
observations of the laser safety system that were recorded manually during the experiment.
150
100
50
0
1
0
30
30
40
40
50
50
60
Autolog-AzManualLog-AzAutoLog-ElManualLog-El
AutoLog Tier1Manual Tier1AutoLog Tier2Manual Tier2Tier3
4 nmi3 s 5.4 s 6 nmi
3 s4 nmi5 s
4 nmi3 s
4 nmi8 s
4 nmi6 s
60
70
70Time, min
80
80
90
90
100
100
Tele
scop
e P
os A
ngle
, deg
Lase
r S
hutt
er T
rigge
r
150
100
50
0
1
0
10
10
20
20
30
30
40
40
Autolog-AzManualLog-AzAutoLog-ElManualLog-El
AutoLog Tier1Manual Tier1AutoLog Tier2Manual Tier2Tier3
4 nmi5 s
4 nmi4 s
4 nmi3 s
4 nmi3 s
4 nmi2 s
4 nmi5 s
4 nmi5 s
4 nmi5 s
4 nmi2 s
4 nmi4 s
4 nmi5 s
4 nmi5 s
4 nmi2 s
4 nmi5 s
4 nmi3 s
50
50
Time, min
60
60
70
70
80
80
90
90
100
100
Tele
scop
e P
os A
ngle
, deg
Lase
r S
hutt
er T
rigge
r
Figure 10. Epoch of 15:17:29 UTC (08:17:29 PDT) on October 27, 2011. The data plotted with AutoLog in the legend
represent data logged autonomously by the laser safety system computer, while ManualLog represents
observations of the laser safety system that were recorded manually during the experiment.
The October 27, 2011, morning observations summarized in Figures 10 and 11 provide confidence in the operation of the laser safety system. With a properly functioning NFOV camera, the sensing and shuttering of the laser beam could be carried out autonomously with confidence except when the Sun separation angle drops below 30 deg and scattered sunlight severely limits the contrast and detection of aircraft by the ILI camera system. In these instances, the radar augmented by visual observations can be used.
Note that Figures 10 and 11 confirm the analysis where air traffic gets busier as the day progresses and peaks around noontime. The nonuniform temporal spread of interruptions and the upper bound of five interrupts per a 15-min period predicted by analysis are also consistent with the observations in Figure 11.
20
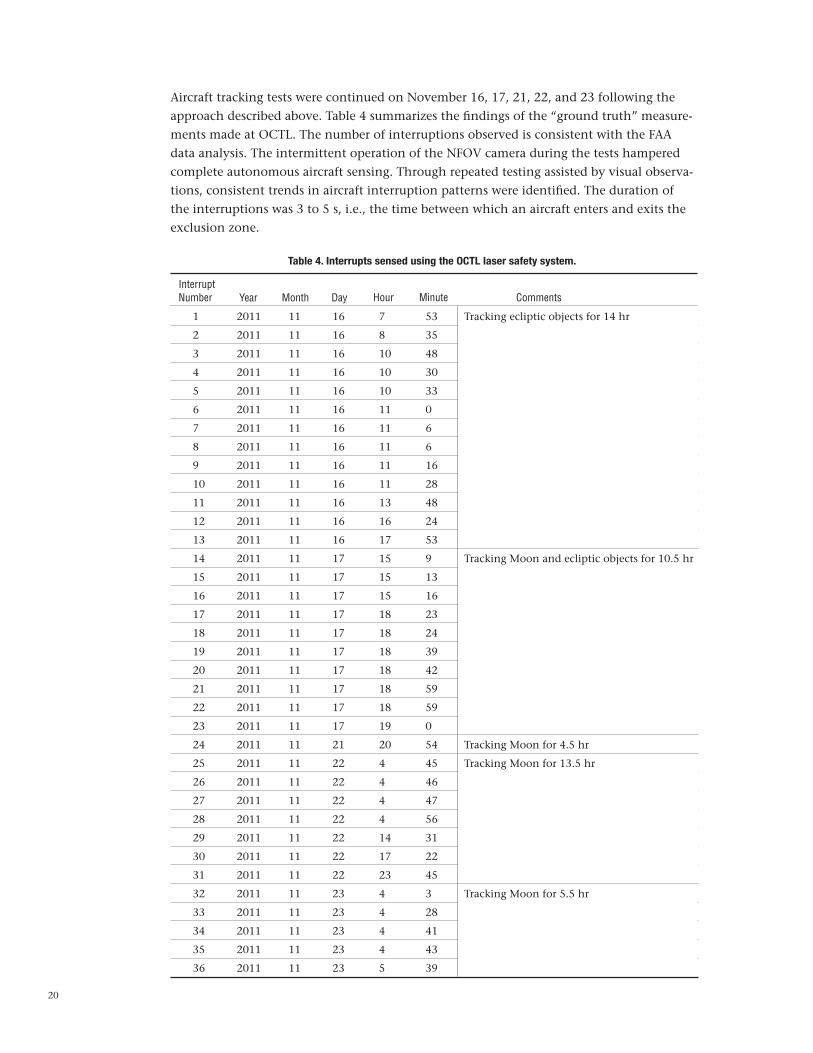
Aircraft tracking tests were continued on November 16, 17, 21, 22, and 23 following the approach described above. Table 4 summarizes the findings of the “ground truth” measure-ments made at OCTL. The number of interruptions observed is consistent with the FAA data analysis. The intermittent operation of the NFOV camera during the tests hampered complete autonomous aircraft sensing. Through repeated testing assisted by visual observa-tions, consistent trends in aircraft interruption patterns were identified. The duration of the interruptions was 3 to 5 s, i.e., the time between which an aircraft enters and exits the exclusion zone.
InterruptNumber
Table 4. Interrupts sensed using the OCTL laser safety system.
Year Month Day Hour Minute Comments
1 2011 11 16 7 53 Tracking ecliptic objects for 14 hr
2 2011 11 16 8 35
3 2011 11 16 10 48
4 2011 11 16 10 30
5 2011 11 16 10 33
6 2011 11 16 11 0
7 2011 11 16 11 6
8 2011 11 16 11 6
9 2011 11 16 11 16
10 2011 11 16 11 28
11 2011 11 16 13 48
12 2011 11 16 16 24
13 2011 11 16 17 53
14 2011 11 17 15 9 Tracking Moon and ecliptic objects for 10.5 hr
15 2011 11 17 15 13
16 2011 11 17 15 16
17 2011 11 17 18 23
18 2011 11 17 18 24
19 2011 11 17 18 39
20 2011 11 17 18 42
21 2011 11 17 18 59
22 2011 11 17 18 59
23 2011 11 17 19 0
24 2011 11 21 20 54 Tracking Moon for 4.5 hr
25 2011 11 22 4 45 Tracking Moon for 13.5 hr
26 2011 11 22 4 46
27 2011 11 22 4 47
28 2011 11 22 4 56
29 2011 11 22 14 31
30 2011 11 22 17 22
31 2011 11 22 23 45
32 2011 11 23 4 3 Tracking Moon for 5.5 hr
33 2011 11 23 4 28
34 2011 11 23 4 41
35 2011 11 23 4 43
36 2011 11 23 5 39
21
VI. Laser Clearing House Interruptions
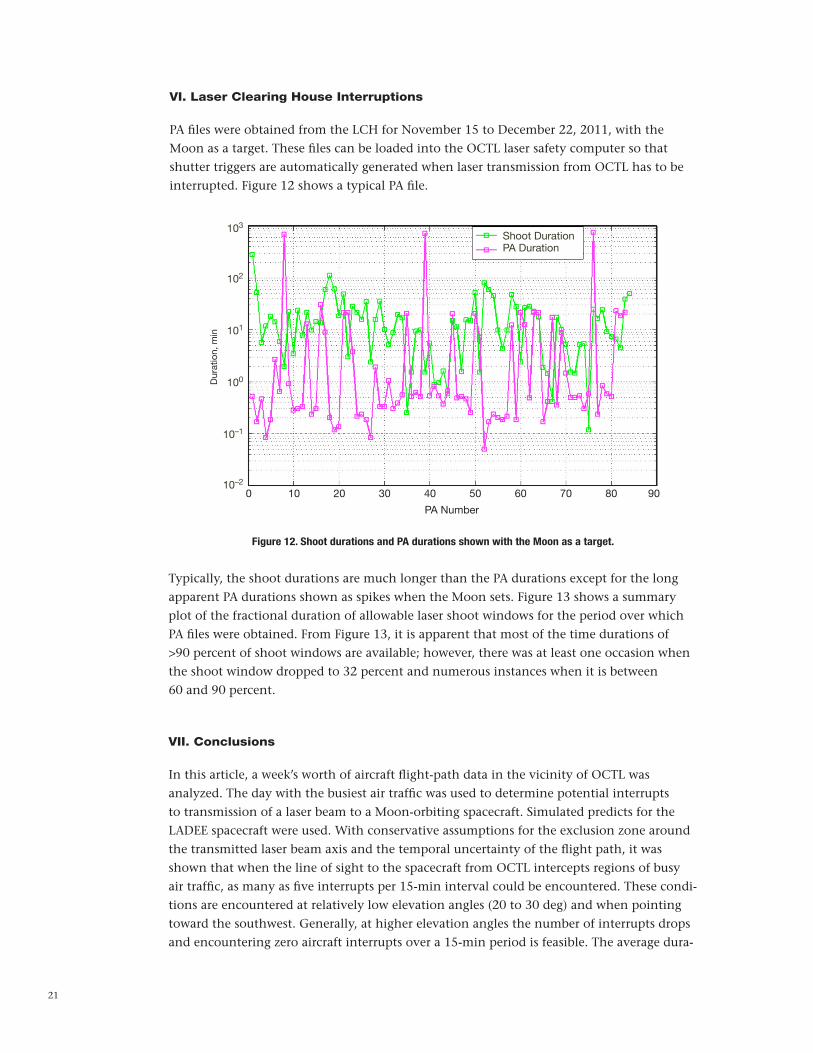
PA files were obtained from the LCH for November 15 to December 22, 2011, with the Moon as a target. These files can be loaded into the OCTL laser safety computer so that shutter triggers are automatically generated when laser transmission from OCTL has to be interrupted. Figure 12 shows a typical PA file.
Figure 12. Shoot durations and PA durations shown with the Moon as a target.
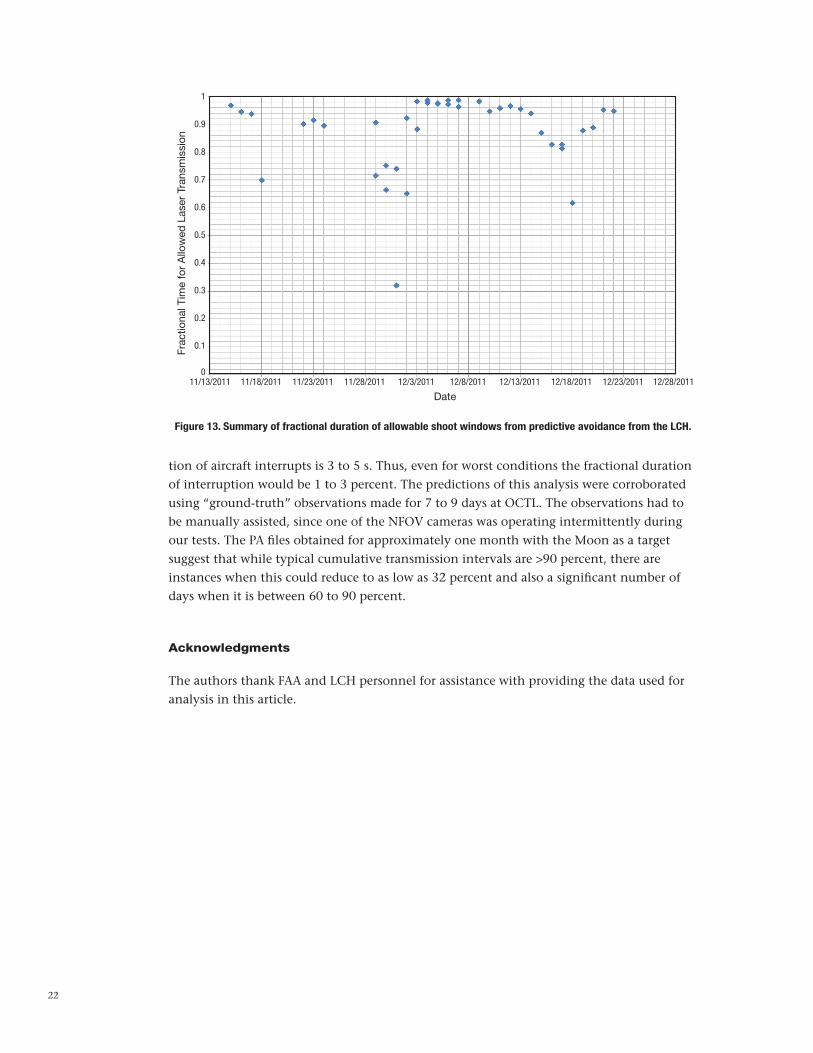
Typically, the shoot durations are much longer than the PA durations except for the long apparent PA durations shown as spikes when the Moon sets. Figure 13 shows a summary plot of the fractional duration of allowable laser shoot windows for the period over which PA files were obtained. From Figure 13, it is apparent that most of the time durations of >90 percent of shoot windows are available; however, there was at least one occasion when the shoot window dropped to 32 percent and numerous instances when it is between 60 and 90 percent.
VII. Conclusions
In this article, a week’s worth of aircraft flight-path data in the vicinity of OCTL was analyzed. The day with the busiest air traffic was used to determine potential interrupts to transmission of a laser beam to a Moon-orbiting spacecraft. Simulated predicts for the LADEE spacecraft were used. With conservative assumptions for the exclusion zone around the transmitted laser beam axis and the temporal uncertainty of the flight path, it was shown that when the line of sight to the spacecraft from OCTL intercepts regions of busy air traffic, as many as five interrupts per 15-min interval could be encountered. These condi-tions are encountered at relatively low elevation angles (20 to 30 deg) and when pointing toward the southwest. Generally, at higher elevation angles the number of interrupts drops and encountering zero aircraft interrupts over a 15-min period is feasible. The average dura-
0 10 20 30 40 50 60 70 80 90
PA Number
Dur
atio
n, m
in
Shoot DurationPA Duration
103
102
101
100
10–1
10–2
22
Figure 13. Summary of fractional duration of allowable shoot windows from predictive avoidance from the LCH.
11/13/2011 11/18/2011 11/23/2011 11/28/2011 12/3/2011 12/8/2011
Date12/13/2011 12/18/2011 12/23/2011 12/28/2011
Frac
tiona
l Tim
e fo
r A
llow
ed L
aser
Tra
nsm
issi
on
1
0.9
0.8
0.7
0.6
0.5
0.4
0.3
0.2
0.1
0
tion of aircraft interrupts is 3 to 5 s. Thus, even for worst conditions the fractional duration of interruption would be 1 to 3 percent. The predictions of this analysis were corroborated using “ground-truth” observations made for 7 to 9 days at OCTL. The observations had to be manually assisted, since one of the NFOV cameras was operating intermittently during our tests. The PA files obtained for approximately one month with the Moon as a target suggest that while typical cumulative transmission intervals are >90 percent, there are instances when this could reduce to as low as 32 percent and also a significant number of days when it is between 60 to 90 percent.
Acknowledgments
The authors thank FAA and LCH personnel for assistance with providing the data used for analysis in this article.

23
References
[1] K. E. Wilson, W. T. Roberts, V. Garkanian, F. Battle, R. Leblanc, H. Hemmati, and P. Ro-bles, “Plan for Safe Laser Beam Propagation from the Optical Communications Tele-scope Laboratory,” The Interplanetary Network Progress Report, vol. 42-152, Jet Propulsion Laboratory, Pasadena, California, pp. 1–17, February 15, 2003. http://ipnpr.jpl.nasa.gov/progress_report/42-152/152G.pdf
[2] B. Smithgall and K. Wilson, “Automatic Aircraft Detection to Support Aircraft Spotters during Outdoor Laser Propagation,” International Laser Safety Conference, 2007.
[3] A. Biswas, J. Kovalik, M. W. Regehr, and M. Wright, “Emulating an Optical Planetary Access Link with an Aircraft,“ Proceedings of SPIE, Free-Space Laser Communication Technologies XXII, vol. 7587, February 26, 2010.
[4] A. Biswas, J. Kovalik, M. W. Regehr, and M. Wright, “Low Complexity Transceivers and Autonomous Concept of Operations for Optical Planetary Access Links,” Proceedings
of SPIE, Free-Space Laser Communication Technologies XXII, vol. 7587, February 26, 2010.
JPL CL# 12-3891