Embed Size (px)
Citation preview
‘o
o
.
—
●
OCS Study MMS 84-0027
U.S. Depar tment o f the Inter ior Technical Report
Number 110Volume II
~ha . . . . . . . . . . ...’” :::.:.:::::::::.. .
Socia l and EconomicStudies Program
Sponsor:M inera ls ManagementService
A l a s k a OuterCont inentalShel f Region
Eva lua t i on Of Bering Ma Crude Oil
Transportation Systems: Appendices
30077
—
—
APPENDIX A
NORTH SEA CRUDE OIL TRANSPORTATION EXPERIENCE
I
—
—
—
——
—
——
APPENDIX A
NORTH SEA CRUDE OIL TRANSPORTATION SYSTEM
TABLE OF CONTENTS
Page No.
LIST OF FIGURES . . . ● b . . . . . ** e e 0 . 0. ● 9* . . . 0 * e e . * . . ● ● * ● ● ● e. . * ● A-ii
LIST OF TABLES . . e * . ● e ● . . . . . e o . . * . . ● e- 0 , . e -e . ● . . e . ● ● ● *e . ● ● e A-iii
A.1 INTRODUCTION ● . ● * . ● . ● ● . * . 0 * . . . . ● . *e . . 0 0 a . . e e e e e e * . . . .* . * . . e A== 1
A.2 NORTH SEA OIL FIELD DEVELOPMENT 0s. 8 . * ● . . . . 9 * . . - . . ● . . ● * . . . e A-3
A.3 TYPES OF NORTH SEA OFFSHORE LOADING SYSTEMS . . . . . . . . . . . . . . . A-7Ae3el Catenary Anchor Leg Mooring (CALM) . . . . . . . . . . . . . . . . . A-7A.3.2 Single Anchor Leg Mooring (SALE) . . . . . . . . . . . . . . . . . . . A-9A.3.3 Articulated Column (AC) . . .* ● .*. . .*** ● . ● . ● . ● *... . . . ● A-13A.3.4 Exposed Location Single BUOY Mooring (ELSBM) . . . . . . . A-13A.3.5 SPAR ● ● . . . . . . . . . . . . e ● ● ● . . . ● . . ● . . . . . ● ● ● . ● . ● e . . . . ● ● . ● s A-16
A.4 CHARACTERISTICS OF NORTH SEA OIL FIELDS UTILIZINGOFFSHORE LOADING SYSTEMS ..**...**. . . . . . . . . . . ..0.00..0. ..00 A-19
A.5 PERFORMANCE OF NORTH SEA OFFSHORE LOADING SYSTEMS . . . . . . . . . A-36A.5.1 General Offshore Loading System Maintenance
Problems . . . . . . . . . . . . . . . . . . . . . . . . . . . . . . . . . . . . . . . . . . . A-56A.5.2 Specific Instances of Offshore Loading System
Problems . . . . . . . . . . . . . . . . . . . . . . . . . . . . . . . . . . . . . . . . . . . A-60
Ae6 NORTH SEA OFFSHORE LOADING SYSTEM CONSTRUCTION SCHEDULE... A-67
A.7 NORTH SEA OFFSHORE LOADING SYSTEM CAPITAL AND OPERATINGCOSTS , . . . . . . . . . . . . . . . . . . . . . . . . ● . . ● * ● ● . . . . 0 . . . . . . ● ● . * . . ● . ● ● A-70
A.8 CHARACTERISTICS OF NORTH SEA OIL FIELDS UTILIZINGPIPELINE SYSTEMS ● . ● ● . . . . ● .0 . ● ● ● ● . ● . ● ● . . . . . . . . . . . ● . . . . . . ● * ● A-72
A.9 PERFORMANCE OF NORTH SEA PIPELINE SYSTEMS . . . . . . . . . . . . . . . . . A-74
A.1O NORTH SEA PIPELINE SYSTEM CONSTRUCTION SCHEDULE . . . . . . . . . . . A-76
All NORTH SEA PIPELINE SYSTEM CAPITAL AND OPERATING COSTS . . . . . A-78
A.12 NORTH SEA CRUDE OIL TRANSPORTATION SYSTEM SELECTIONPHILOSOPHY . . . ● . . ● . . . . . . . . . . ● . . . . . . . . . . . . ● . . ● . . . . . ..* . . ● ● . . A-81
A.13 REFERENCES . ● ● .* . . . .00.. . . ● .* ● . . ..** . . . ..** ● .* . . . . . . . . . . ● e ● A-85——
A-i
wA-1
A-2
A-=3
A-4
A-5
A-6
A-7
A-8
A-9
NORTH SEA CRUDE
.e-
APPENDIX A
OIL TRANSPORTATION SYSTEMS
LJST OF FIGURES
Title Page No.
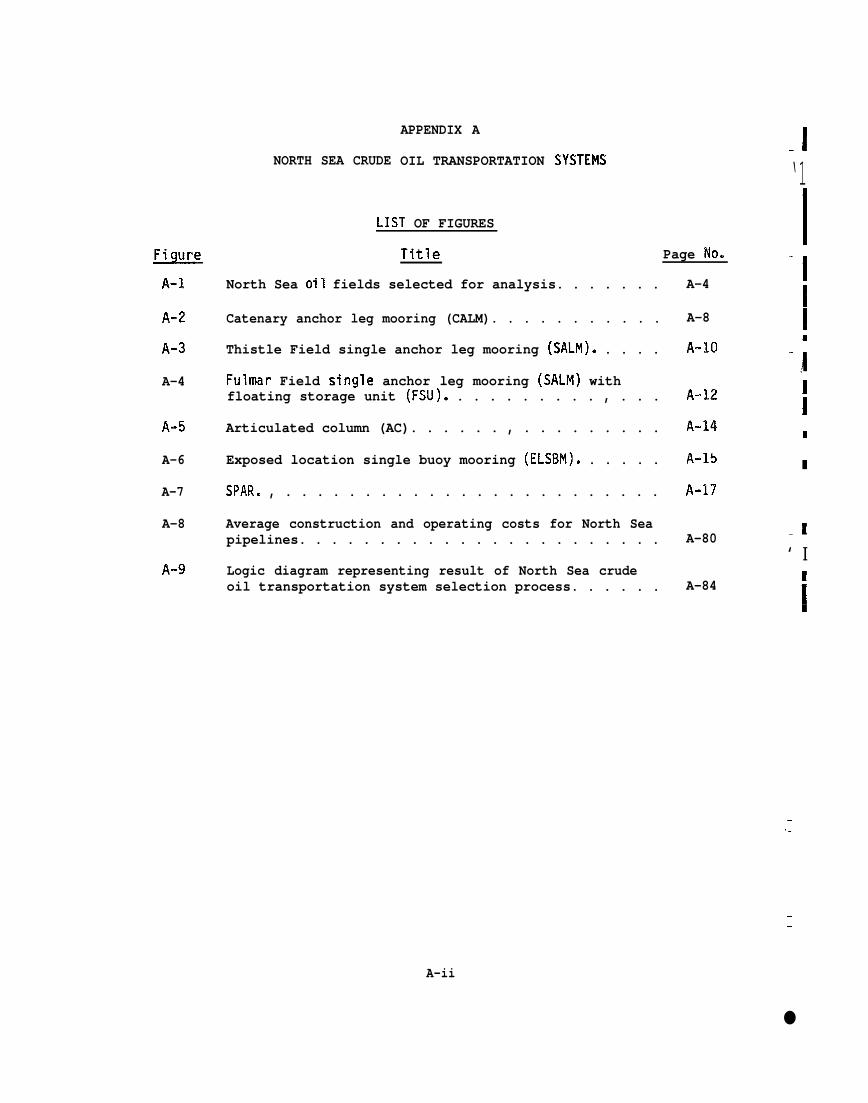
North Sea oil fields selected for analysis. . . . . . .
Catenary anchor leg mooring (CALM). . . . . . . . . . .
Thistle Field single anchor leg mooring (SAL!JI). . . . .
Fulmar Field single anchor leg mooring (SALM) withfloating storage unit (FSU). . . . . . . . . . , . . .
Articulated column (AC). . . . . . , . . . . . . . . .
Exposed location single buoy mooring (ELSBM). . . . . .
SPAR. , . . . . . . . . . . . . . . . . . . . . . . . .
Average construction and operating costs for North Seapipelines. . . . . . . . . . . . . . . . . . . . . . .
Logic diagram representing result of North Sea crudeoil transportation system selection process. . . . . .
A-4
A-8
A-IO
A-12
A-14
A-l!)
A-17
A-80
A-84
.1‘1
-1‘1:
II
.1
‘1I:n
‘ I
——
—.—
——
A-ii
●
APPENDIX A
NORTH SEA CRUDE OIL TRANSPORTATION SYSTEMS
—
Table
A-1
A-2
A-3
A-4
A-5
A-6
A-7
A-8
A-9
A-10
A-11
A-12
A-13
A-14
A-15
A-16
A-17
A-18
A-19
A-20
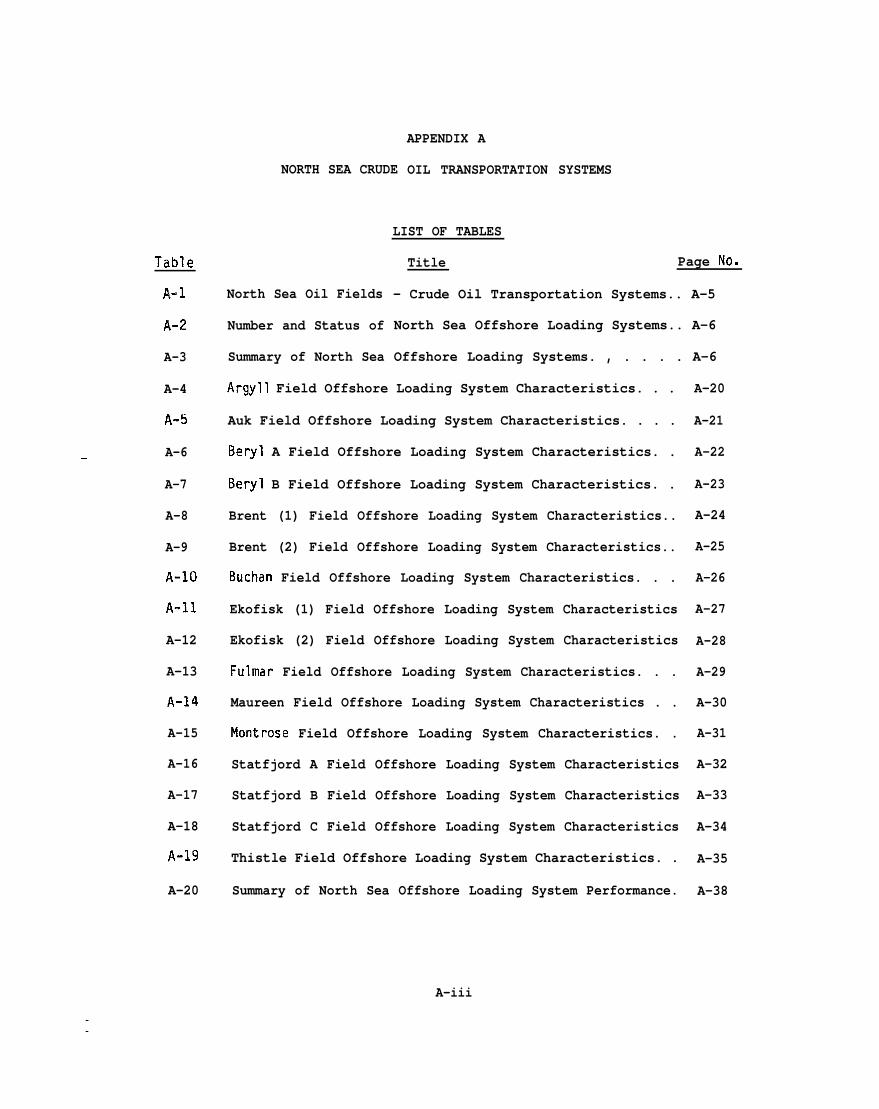
North Sea Oil Fields
Number and Status of
Summary of North Sea
LIST OF TABLES
Title Page No.
- Crude Oil Transportation Systems.. A-5
North Sea Offshore Loading Systems.. A-6
Offshore Loading Systems. , . . . . A-6
Argyll Field Offshore Loading System Characteristics. . .
Auk Field Offshore Loading System Characteristics. . . .
Beryl A Field Offshore Loading System Characteristics. .
Beryl B Field Offshore Loading System Characteristics. .
Brent (1) Field Offshore Loading System Characteristics..
Brent (2) Field Offshore Loading System Characteristics..
Buchan Field Offshore Loading System Characteristics. . .
Ekofisk (1) Field Offshore Loading System Characteristics
Ekofisk (2) Field Offshore Loading System Characteristics
Fulmar Field Offshore Loading System Characteristics. . .
Maureen Field Offshore Loading System Characteristics . .
Montrose Field Offshore Loading System Characteristics. .
Statfjord A Field Offshore Loading System Characteristics
Statfjord B Field Offshore Loading System Characteristics
Statfjord C Field Offshore Loading System Characteristics
Thistle Field Offshore Loading System Characteristics. .
Summary of North Sea Offshore Loading System Performance.
A-20
A-21
A-22
A-23
A-24
A-25
A-26
A-27
A-28
A-29
A-30
A-31
A-32
A-33
A-34
A-35
A-38
A-iii
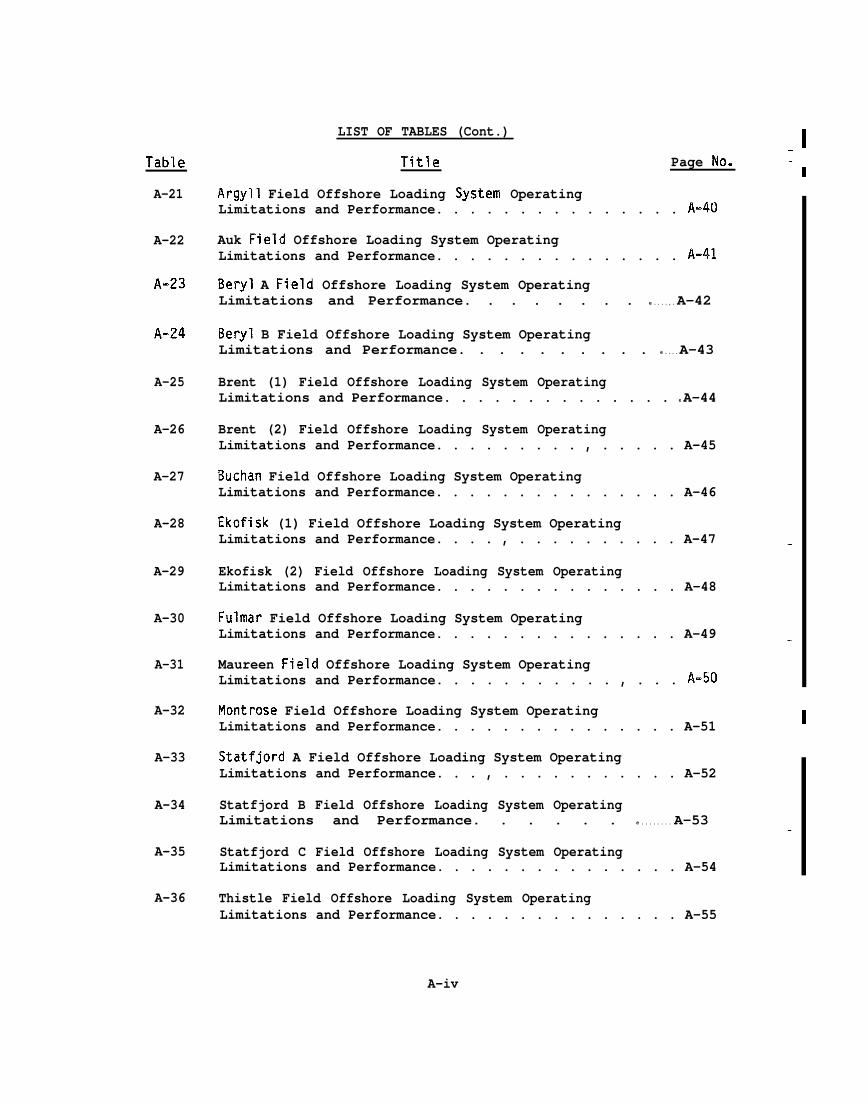
LIST OF TABLES (Cont.)
Table
A-21
A-22
A-23
A-=24
A-25
A-26
A-27
A-28
A-29
A-30
A-31
A-32
A-33
A-34
A-35
A-36
Title Page No.
Argyll Field Offshore Loading System OperatingLimitations and Performance. . . . . . . . . . . . . . . A-40
Auk Field Offshore Loading System OperatingLimitations and Performance. . . . . . . . . . . . . . . A-41
Beryl A Field Offshore Loading System OperatingLimitations and Performance. . . . . . . . e . . . . , . A-42
Beryl B Field Offshore Loading System OperatingLimitations and Performance. . . . . . . . . . e . . . . A-43
Brent (1) Field Offshore Loading System OperatingLimitations and Performance. . . . . . . . . . . . . . e A-44
Brent (2) Field Offshore Loading System OperatingLimitations and Performance. . . . . . . . . , . . . . . A-45
Buchan Field Offshore Loading System OperatingLimitations and Performance. . . . . . . . . . . . . . . A-46
Ekofisk (1) Field Offshore Loading System OperatingLimitations and Performance. . . . , . . . . . . . . . . A-47
Ekofisk (2) Field Offshore Loading System OperatingLimitations and Performance. . . . . . . . . . . . . . . A-48
Fulmar Field Offshore Loading System OperatingLimitations and Performance. . . . . . . . . . . . . . . A-49
.—
—
—
Maureen Field Offshore Loading System OperatingLimitations and Performance. . . . . . . . . . . , . . . A-50
Montrose Field Offshore Loading System OperatingLimitations and Performance. . . . . . . . . . . . . . . A-51
.statfjord A Field Offshore Loading System OperatingLimitations and Performance. . . , . . . . . . . . . . . A-52
Statfjord B Field Offshore Loading System OperatingLimitations and Performance. . . . . . e . . . . . . . . A-53 —
Statfjord C Field Offshore Loading System OperatingLimitations and Performance. . . . . . . . . . . . . . . A-54
Thistle Field Offshore Loading System OperatingLimitations and Performance. . . . . . . . . . . . . . . A-55
—
A-iv

—Table
A-37
A-38——
A-39
A-40
A-41
A-42
LIST OF TABLES (Cont.)
Title Page No.
Key Dates for Fulmar Project. . . . . . . . . . . . . . . A-68
Time Requirements and Sea Conditions for CriticalActivities for Fulmar Project. . . . . . . . . . . . . . A-69
North Sea Offshore Loading System Capital andOperating Costs. , . . . . . . . . . . . , . . . . . . . A-71
North Sea Pipeline System Characteristics. . . . . . . . A-=73
Laying Vessel Limitations and Costs. . . . . . . . . . . A--76
Installed Cost of Recent North Sea Pipelines. . . . . . . A-78
—
—
—
A-v
—
A.1 INTRODUCTION
—
The environment of the Bering Sea is unique and consequently
there is no existing offshore crude oil development and operating
— experience that can be directly applied to Bering Sea development.
Of all offshore crude oil development that has taken place around the
world, the development in the North Sea has taken place under
— conditions that most closely resemble conditions in the Bering Sea.
Approximately ten years of operating experience in the North Sea is
available and this experience can provide valuable insight and a
realistic basis for evaluating potential offshore loading systems and
pipeline systems in the Bering Sea. However, it is extremely
important to bear in mind that North Sea experience is not directly
applicable to the Bering Sea because a number of major factors
affecting oil field development are quite different.
One major difference is the fact that Bering Sea oil fields will
be much further from refining centers than are oil fields in the
North Sea. Pipeline systems for North Sea oil fields deliver the
produced crude oil either directly to a refinery or to a large tanker
loading terminal with a throughput on the order of 500,000 barrels
per day. Thus, many North Sea oil fields that utilize pipelines for
transporting the crude oil do not require tanker terminals or tankers
and for those that do require terminals and tankers, the cost is
shared among several oil field developments. All pipeline systems in
the Bering Sea considered in this study will deliver the crude oil to
A-1
a relatively low volume tanker terminal where it will be loaded
aboard a tanker for ultimate delivery to a refinery located more than
3,000 km (1,800 mi) away. Thus, all Bering Sea oil field
developments must include some type of tanker terminal and a tanker
fleet and, for purposes of this study, it has been assumed that each
oil field development must stand alone so terminal costs cannot be
shared.
-1
—
Artother major difference between the Bering Sea and the North
Sea is the environment. Obviously, the environment in which an
offshore loading system or pipeline system must be installed and —
function will have a great effect on both construction and operating
costs. The most important environmental difference between the
Bering Sea and the North Sea is the presence of ice floes and large
ice features. These ice conditions make North Sea type offshore
loading systems unsuitable for use in the Bering Sea without
significant modifications. Ice forces on an offshore loading system .
In the Bering Sea will be considerably higher than environmental m
forces acting on a North Sea system.
In spite of the differences between the two regions, North Sea
experience can provide much useful information. The following‘:
sections provide particular documentation for North Sea oil fields ■
that utilize either offshore loading systems or pipeline systems for ■
transporting the produced crude oil.
J
A-2
A.2 NORTH SEA OIL FIELQ DEVELOPMENT
—
The North Sea province, situated in a politically stable region
close to main consumer markets, is one of the most important
petroleum regions in the world today. The first offshore drilling
took place in Dutch waters in 1961, while the first application for
permission to explore for oil and gas in Norwegian and United Kingdom
waters was received in 1962. In 1965, the first hydrocarbon was
found in U.K. waters with a gas discovery, and in 1969 the first
major oil field was struck in the Norwegian part of the Continental
Shelf. With the rise in price of Middle East oil in the mid-1970s,
the cost of North Sea oil became very competitive; thus triggering a
tremendous development in the North Sea area during the past decade.
Twenty-six active North Sea oil fields have been selected for
analysis to provide a basis for evaluation of crude oil
transportation system alternatives in the Bering Sea. These oil
fields include almost all of the oil fields presently producing in
the United Kingdom and Norwegian sectors of the North Sea. The
location of the twenty-six fields is indicated on Figure A-1. Of
these, eight presently utilize an offshore loading system as the long
term method for transporting the produced crude oil, six utilize a
pipeline directly to an onshore terminal and the remaining twelve
utilize interfield pipelines to connect with a pipeline to an onshore
terminal. Three of the fields utilizing pipelines initially utilized
an offshore loading system to achieve early production and to serve
A-3
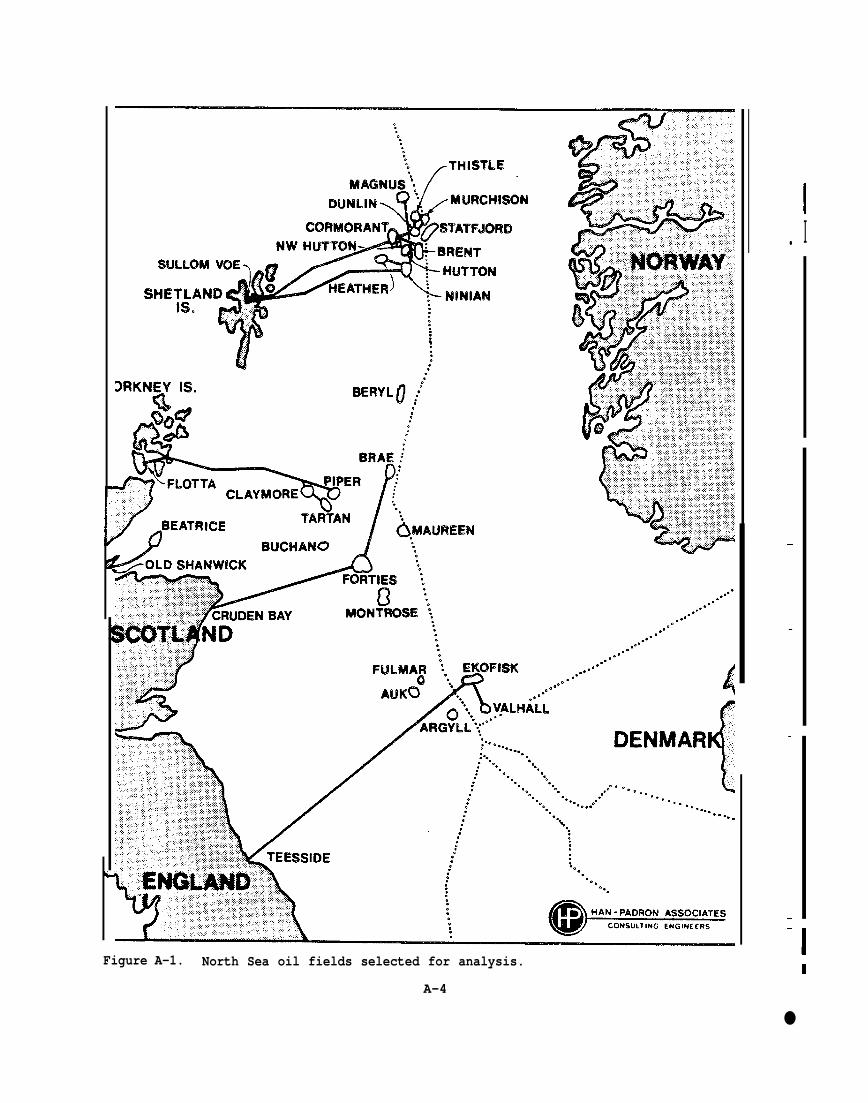
Figure A-1. North Sea oil fields selected for analysis.
A-4
II.
—
.
—
—
‘1i●
—
—
—
—
●
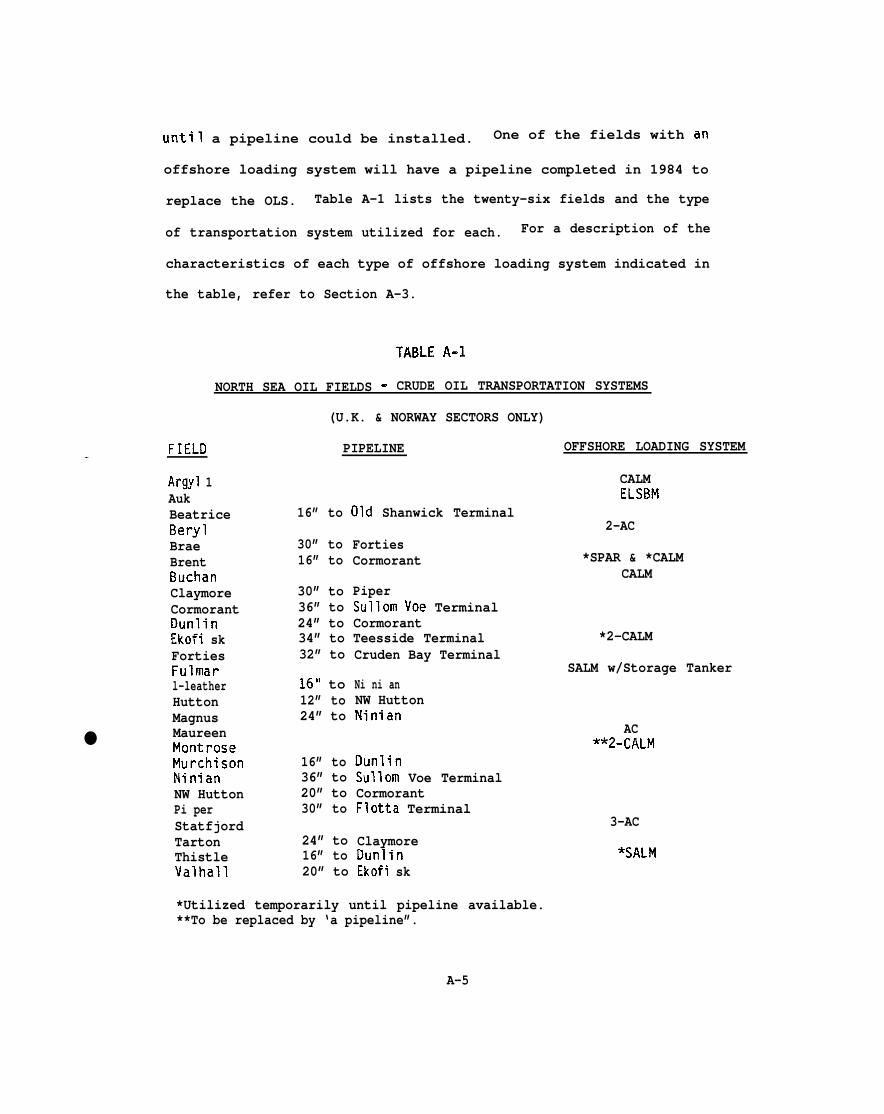
until a pipeline could be installed. One of the fields with an
offshore loading system will have a pipeline completed in 1984 to
replace the OLS. Table A-1 lists the twenty-six fields and the type
of transportation system utilized for each. For a description of the
characteristics of each type of offshore loading system indicated in
the table, refer to Section A-3.
TABLE A-1
NORTH SEA OIL FIELDS - CRUDE OIL TRANSPORTATION SYSTEMS
(U.K. & NORWAY SECTORS ONLY)
FIELD
Argyl 1AukBeatriceBerylBraeBrentBuchanClaymoreCormorantDunlinEkofi skFortiesFulmarl-leatherHuttonMagnusMaureenMontroseMurchisonNinianNW HuttonPi perStatfjordTartonThistleValhall
PIPELINE
16” to
30” to16” to
30” to36” to24” to34” to32” to
16” to12” to24” to
16” to36” to20” to30” to
24” to16” to20” to
Old Shanwick Terminal
FortiesCormorant
PiperSullom Voe TerminalCormorantTeesside TerminalCruden Bay Terminal
Ni ni anNW HuttonNinian
DunlinSullom Voe TerminalCormorantFlotta Terminal
ClaymoreDunlinEkofi sk
*Utilized temporarily until pipeline available.**To be replaced by ‘a pipeline”.
A-5
OFFSHORE LOADING SYSTEM
CALMELSBM
2-AC
*SPAR & *CALMCALM
*2-CALM
SALM w/Storage Tanker
AC**2-(’-ALf4
3-AC
*SALM
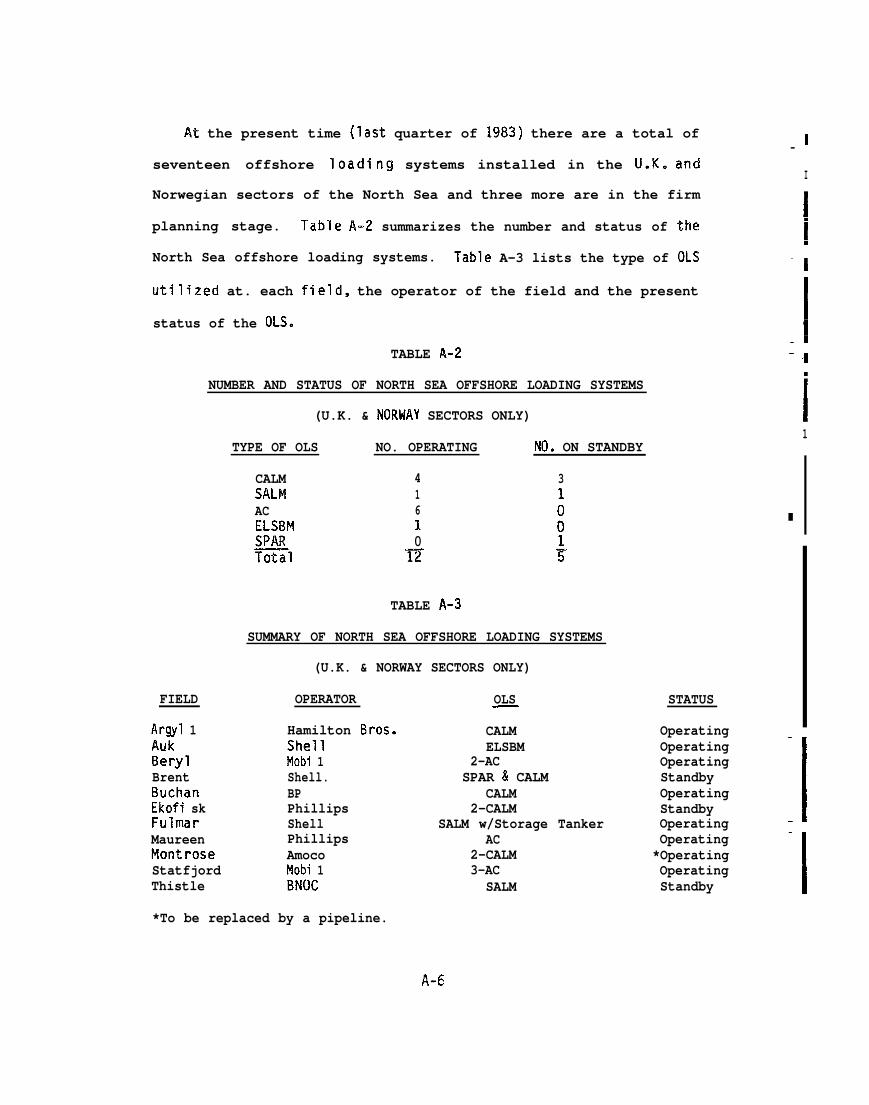
At the present time (last quarter of 1983) there are a total of
seventeen offshore loading systems installed in the LI.K. and
Norwegian sectors of the North Sea and three more are in the firm
planning stage. Table A-2 summarizes the number and status of the
North Sea offshore loading systems. Table A-3 lists the type of OLS
utilized at. each field, the operator of the field and the present
status of the OLS.
FIELD
TABLE A-2
NUMBER AND STATUS OF NORTH SEA OFFSHORE LOADING SYSTEMS
(U.K. & NORWAY SECTORS ONLY)
Argyl 1AukBerylBrentBuchanEkofi skFulmarMaureenMontroseStatfjordThistle
TYPE OF OLS NO. OPERATING NO. ON STANDBY
CALM 4 3Sm’1 1 1AC 6ELSBM 1 :
o-12-
TABLE A-3
SUMMARY OF NORTH SEA OFFSHORE LOADING SYSTEMS
(U.K. & NORWAY SECTORS ONLY)
OPERATOR
Hamilton Bros.ShellMobi 1Shell.BPPhillipsShellPhillipsAmocoMobi 1BNOC
OLS
*To be replaced by a pipeline.
A-6
CALMELSBM
2-ACSPAR & CALM
CALM2-CALM
SALM w/Storage TankerAC
2-CALM3-AC
SALM
STATUS
OperatingOperatingOperatingStandbyOperatingStandbyOperatingOperating*OperatingOperatingStandby
I—
I
‘1
- ‘1
1—
I—
‘1-1
‘1.
A.3 TYPES OF NORTH SEA OFFSHORE LOADING SYSTEMS.
I A number of
offshore loading
different types, and variations within a type, of
systems have been utilized in the North Sea. They
have been designed to accommodate shuttle tankers up to 150,00U DWT
and one is designed to permanently moor a 210,000 DWT storage vessel.
The basic types of OLS used in the North Sea include:
A.3.l Catenary Anchor Leg Mooring (CALM)
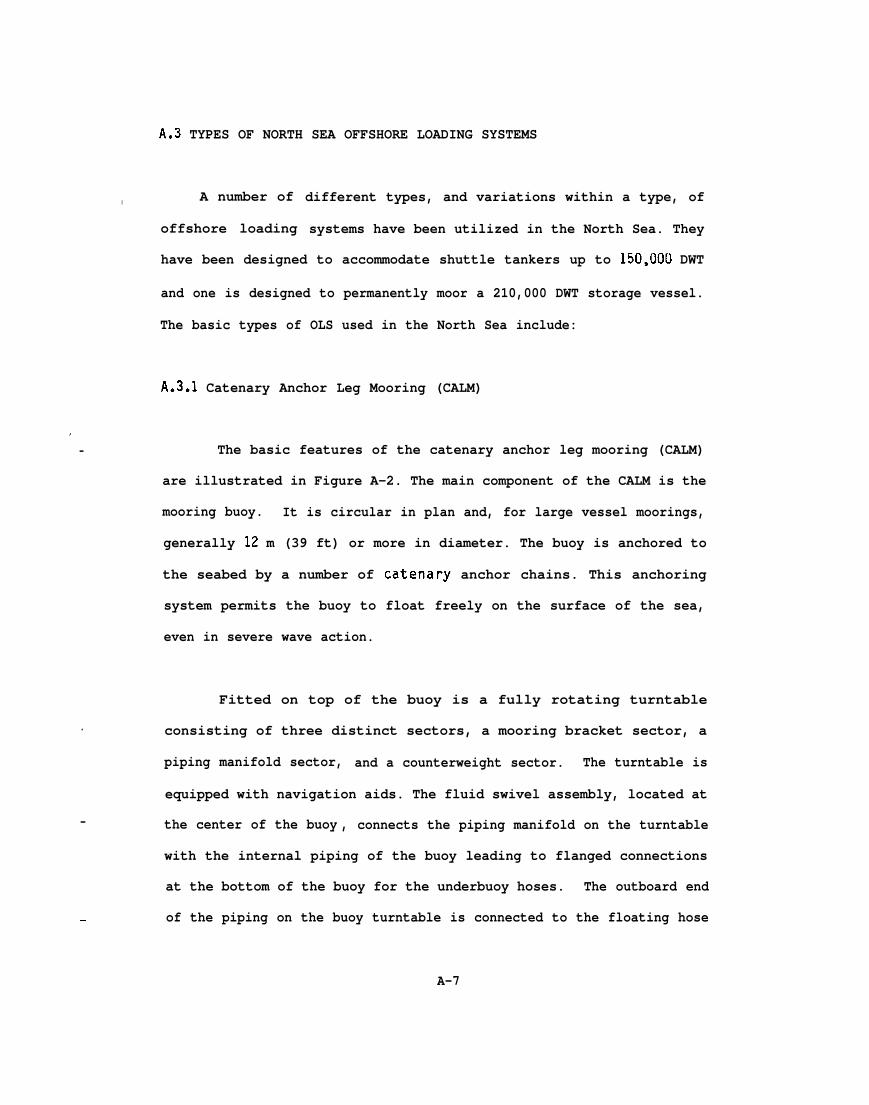
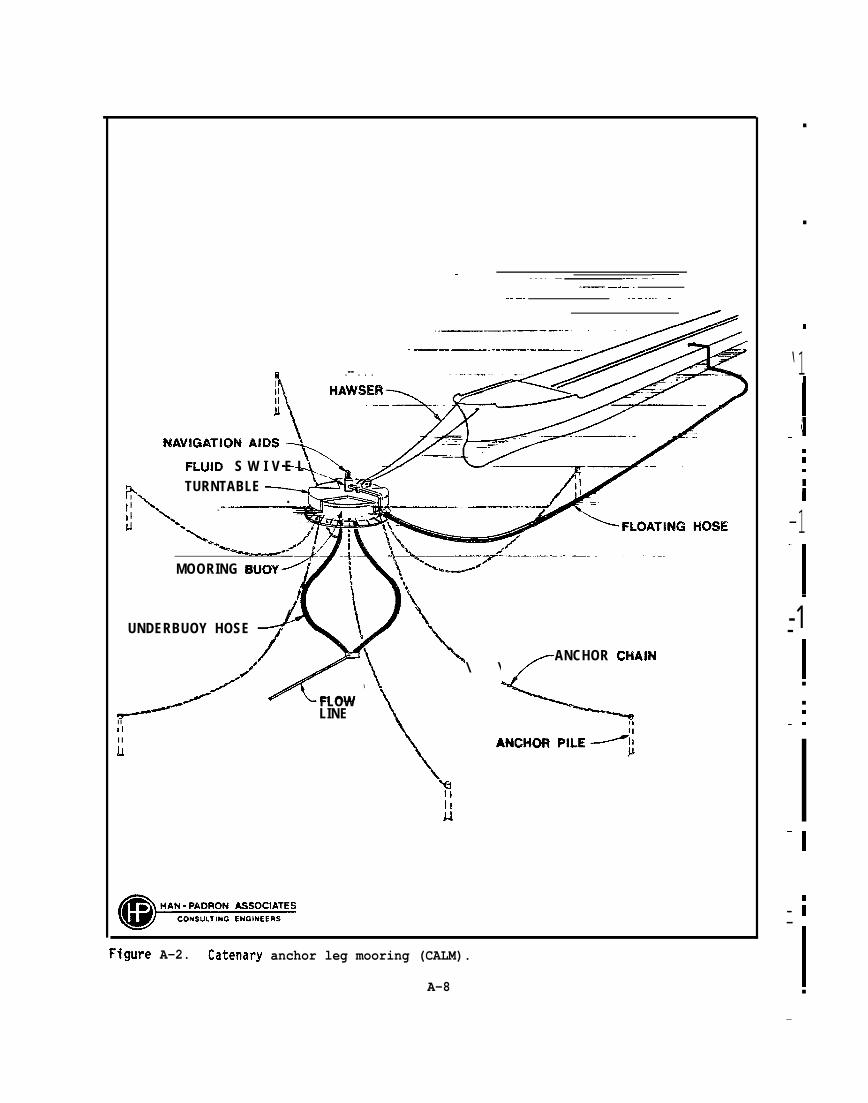
,The basic features of the catenary anchor leg mooring (CALM)—
are illustrated in Figure A-2. The main component of the CALM is the
mooring buoy. It is circular in plan and, for large vessel moorings,
generally 12 m (39 ft) or more in diameter. The buoy is anchored to
the seabed by a number of catenary anchor chains. This anchoring
system permits the buoy to float freely on the surface of the sea,
even in severe wave action.
Fitted on top of the buoy is a fully rotating turntable
. consisting of three distinct sectors, a mooring bracket sector, a
piping manifold sector, and a counterweight sector. The turntable is
equipped with navigation aids. The fluid swivel assembly, located at
— the center of the buoy , connects the piping manifold on the turntable
—
with the internal piping of the buoy leading to flanged connections
at the bottom of the buoy for the underbuoy hoses. The outboard end
of the piping on the buoy turntable is connected to the floating hose
A-7
. . . . . ..— .—. - .—.—— —.— .
.- —- .. ----/
a .-- . . .III
;
NAVIGATION AIDS
FLWD S W I V E L .,TURNTABLE
.“\,m -
‘\*-,’
MOORING BUOY
UNDERBUOY HOSE + ‘Y; ‘$
// \\
/s
\
\ ANCHOR CHA!N\ \./d’
/ <e---’ FLOWLINE --=-.
II IIIII I
&
F4gure A-2. Catenary anchor leg mooring (CALM).
A-8
■
■
✃
‘1I
‘1.–s
n.
i
-1‘1[-1—
I■
■.—.
‘1
n— I—
I■
—
—
—
—
—
system. The hose is of sufficient length to reach the midship
manifold of the largest tanker to use the mooring, with adequate
slack to allow for the relative movement of the ship and buoy. The
underbuoy hose system transfers the cargo between the buoy and the
submarine pipeline end manifold.
The mooring hawser system transfers the mooring forces from
the ship’s mooring fittings to the mooring bracket sector of the
turntable. The force is then transferred through the mooring buoy
and into the anchor chains.
A.3.2 Single Anchor Leg Mooring (SALM)
The single anchor leg mooring (SALM) system was developed to
improve the performance of the catenary anchor leg mooring system.
Two SALM’S have been installed in the North Sea and they are quite
different in appearance and function.
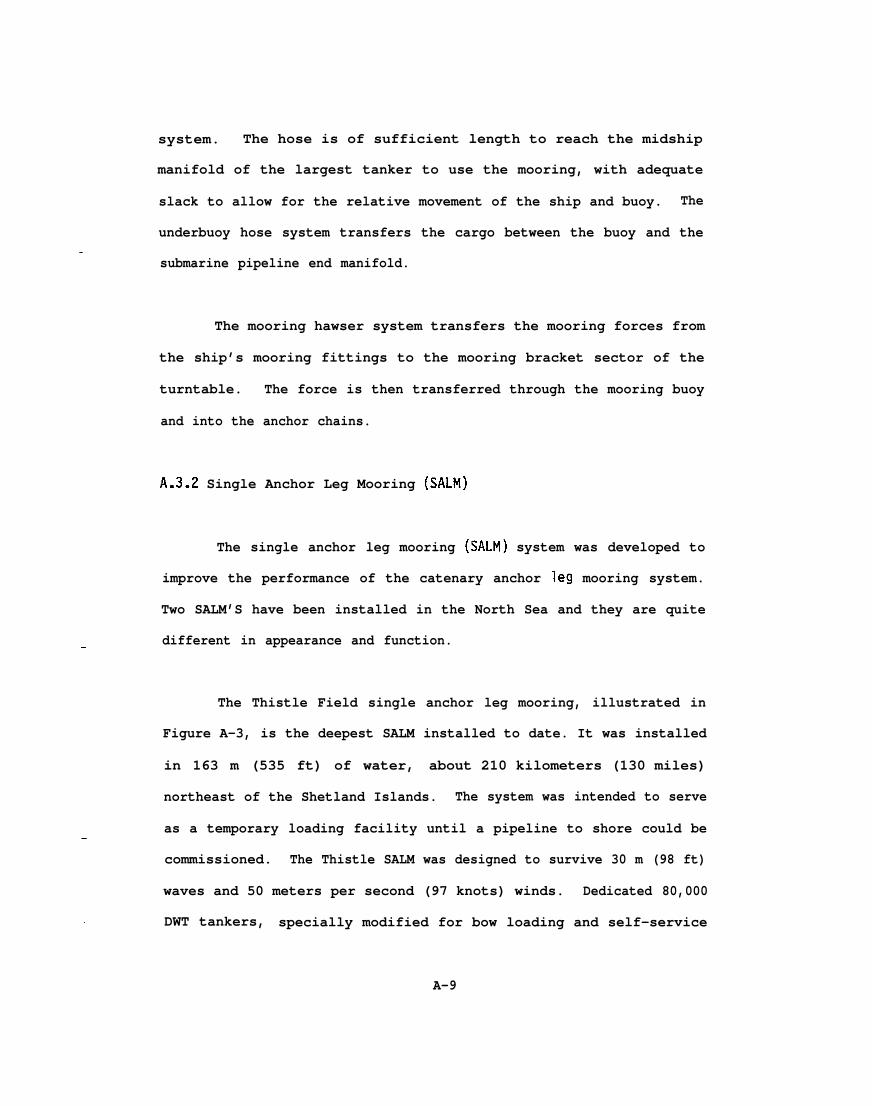
The Thistle Field single anchor leg mooring, illustrated in
Figure A-3, is the deepest SALM installed to date. It was installed
in 163 m (535 ft) of water, about 210 kilometers (130 miles)
northeast of the Shetland Islands. The system was intended to serve
as a temporary loading facility until a pipeline to shore could be
commissioned. The Thistle SALM was designed to survive 30 m (98 ft)
waves and 50 meters per second (97 knots) winds. Dedicated 80,000
DWT tankers, specially modified for bow loading and self-service
A-9
NAVIGATKM14 AIDS>
PRC17ECTWE CAGE - ~L*FENDERS ~ r -
—. -.*!J~5 - .
“Lii!b—.iL-.4
MOOIWNG BUOY—
fi~~A~lN~ Ho~~UPPER UNIVERSALJOINT
JUMPER HOSE
FLOW LINES
~/
JUMPER HOSE
LOWER UNIVERSAL
GRAVITY BASE
(g))~
JOINT
Figure A-3. Thistle Field single anchor leg mooring (SALM).
,
-1
‘1i
-1.-1.\
—■
1
- :—
.
1
.
—
~
.
!
—■
n
i
A-10
mooring, can remain moored in significant wave heights up to 4.5 m
(15 ft) (Miller et al. 1979).
The Thistle SALM consists of a relatively small diameter buoy—
connected to a rigid riser by means of a universal joint. The riser
is connected to a mooring base by a second
brackets are fixed to the buoy deck for—
hawsers and navigational aid features are
universal joint. Mooring
attachment of the mooring
also provided on the buoy
—
deck. The Thistle buoy is 4 m (13 ft) in diameter and 56 m (184 ft)
in length. The top 16 m (52 ft) of the buoy is reduced to 2.5 m (8
ft) in diameter to minimize wave forces. The riser is 2.5 m (8 ft)
in diameter and 101 m (331 ft) in length. The fluid swivel assembly
is located inside the mooring buoy at the bottom. This allows the
fluid swivel assembly to be independent of the load-carrying members
and readily available for inspection and maintenance by non-diver
personnel. The cargo hoses are connected to a platform attached to
the bottom of the buoy.
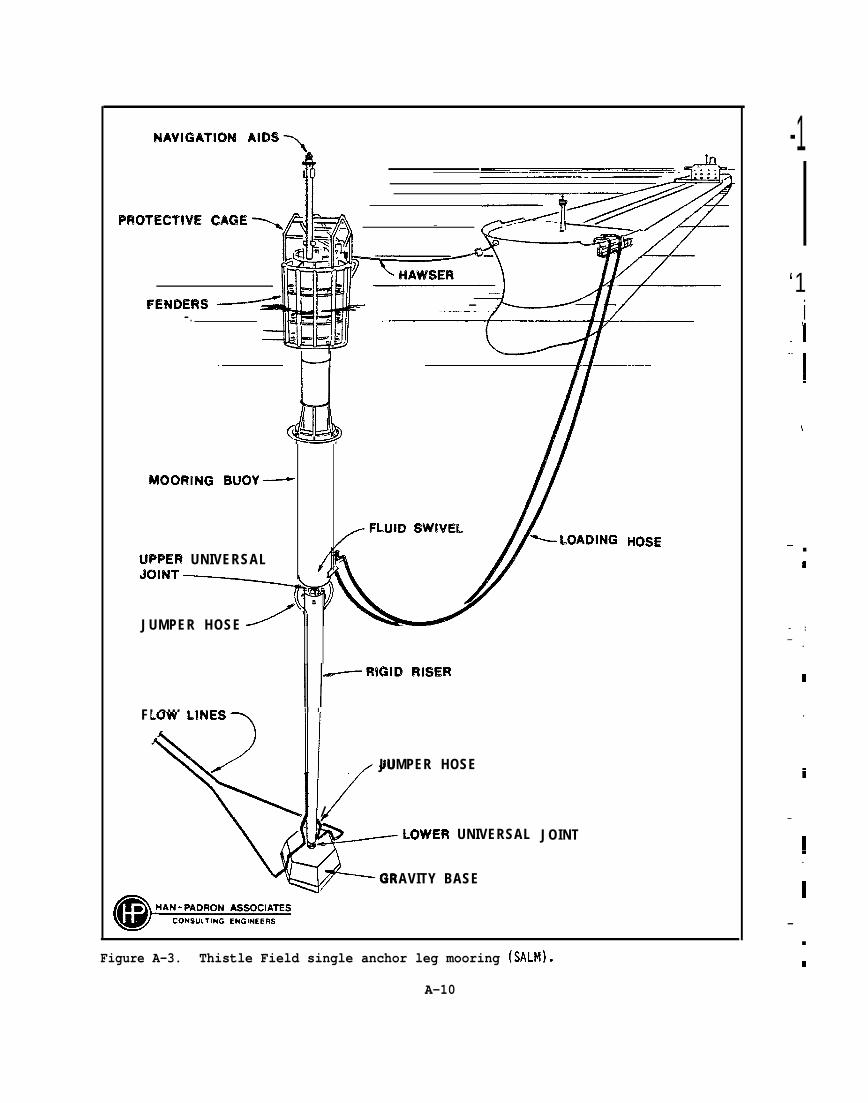
The Fulmar Field SALM is illustrated in Figure A-4. This SALM
is utilized to permanently moor a 21O,OOO DWT storage vessel to which
a 110,000 DWT shuttle tanker is moored in tandem. The primary
components of the Fulmar SALM are the buoy, rigid arm, base and
mechanical articulations that connect them. The buoy serves also as
the rigid anchor leg, attached to both the rigid arm and the base.
The outside diameter of the buoy ranges from 8 m (26 ft) at the lower
end to 15.9 m (52 ft) at the maximum diameter and down to 5.5 m (18
A-n
—
–===7BUOY -4
FLOW LINE
UNIVERSAL JOINT
Figure A-4. Fulmar Field single anchor leg mooring (SALM) with floating storageunit (FSU).
A-12
I—.—
II
I!.-
‘1I
— I‘1
■
— i
‘1.
—
—
——
I——
—
ft) at the top (Mack et al. 1981, Ocean Industry 1981).
—
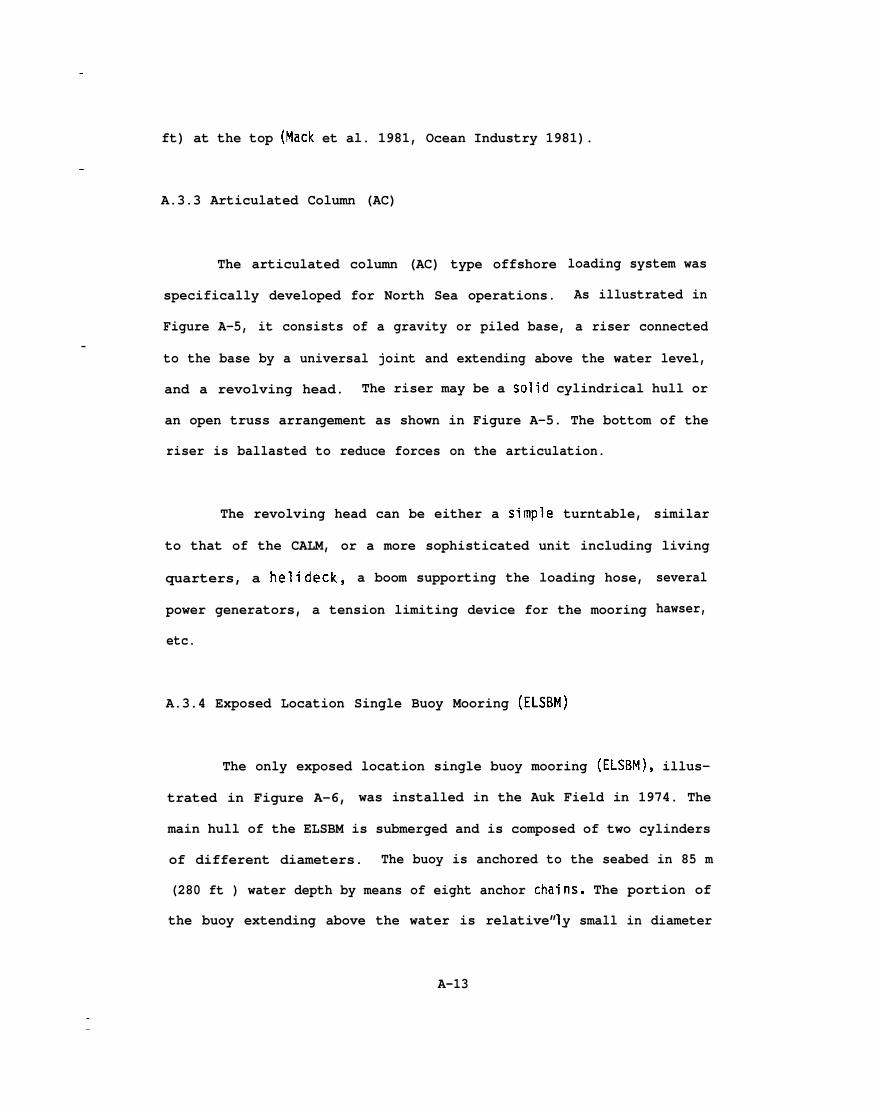
A.3.3 Articulated Column (AC)
The articulated column (AC) type offshore
specifically developed for North Sea operations.
loading system was
As illustrated in
Figure A-5, it consists of a gravity or piled base, a riser connected—
to the base by a universal joint and extending above the water level,
and a revolving head. The riser may be a solid cylindrical hull or
an open truss arrangement as shown in Figure A-5. The bottom of the
riser is ballasted to reduce forces on the articulation.
The revolving head can be either a simple turntable, similar
to that of the CALM, or a more sophisticated unit including living
quarters, a helideck, a boom supporting the loading hose,
power generators, a tension limiting device for the mooring
etc.
several
hawser,
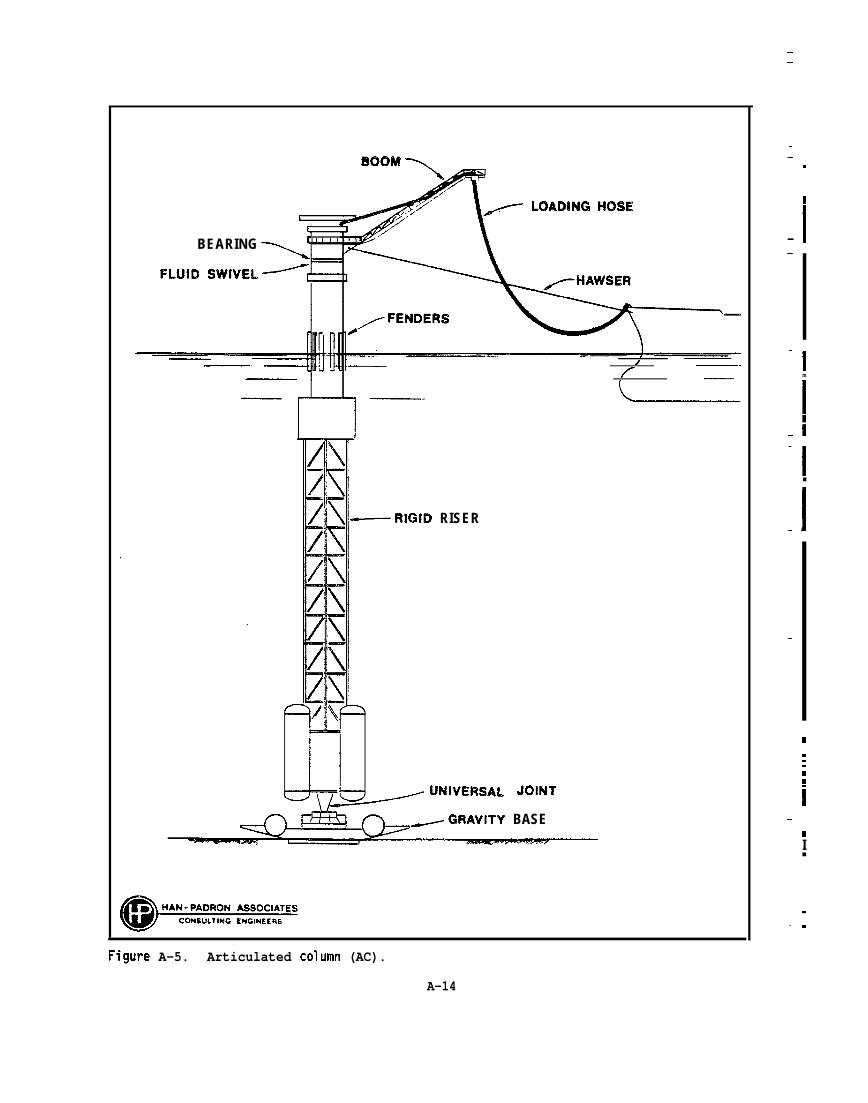
A.3.4 Exposed Location Single Buoy Mooring (ELSBM)
The only exposed location single buoy mooring (ELSBM), illus-
trated in Figure A-6, was installed in the Auk Field in 1974. The
main hull of the ELSBM is submerged and is composed of two cylinders
of different diameters. The buoy is anchored to the seabed in 85 m
(280 ft ) water depth by means of eight anchor cha”
the buoy extending above the water is relative”
ns. The portion of
y small in diameter
A-13
——
BOOM --N) ,
< ~OAOING HOSE
<BEARING
FLUID SW[VEL~
/ —.f
~l~{D RISER
UPWERSAL, JoINT
~GRAVtTY BASE
——
.
I
— I—
—Im
I— i‘1
■
-1
—
—m...
i—
nI■
_-—.
Figure A-5. Articulated column (AC).
A-14
—
—
—
—
—
—
LOADING HOSE
!JUMPER
ANCHOR CHAIN
HOSE I
W
I
FLOW LINE I1.
_=- - - - -
Figure A-6. Exposed location single buoy mooring (ELSBM).
A-15
—
and supports a turntable. The turntable contains a power supply
unit, living quarters for three people, a helideck and w~nches for
hauling floating hoses and hawsers.
Crude oil is transported to a flexible hose on the turntable
through a hose from the seabed pipeline manifold to the bottom of the
buoy, a pipeline along the outside of the buoy hull and a central
swivel at the turntable. When not in use, the loading hose is coiled
on a hose reel. During loading, the hose is partly unrolled and
freely suspended from the reel to the tanker. A counterweight on the
hose reel keeps the loading hose in equilibrium and serves to coil up
the hose automatically after the loading operation has been
completed.
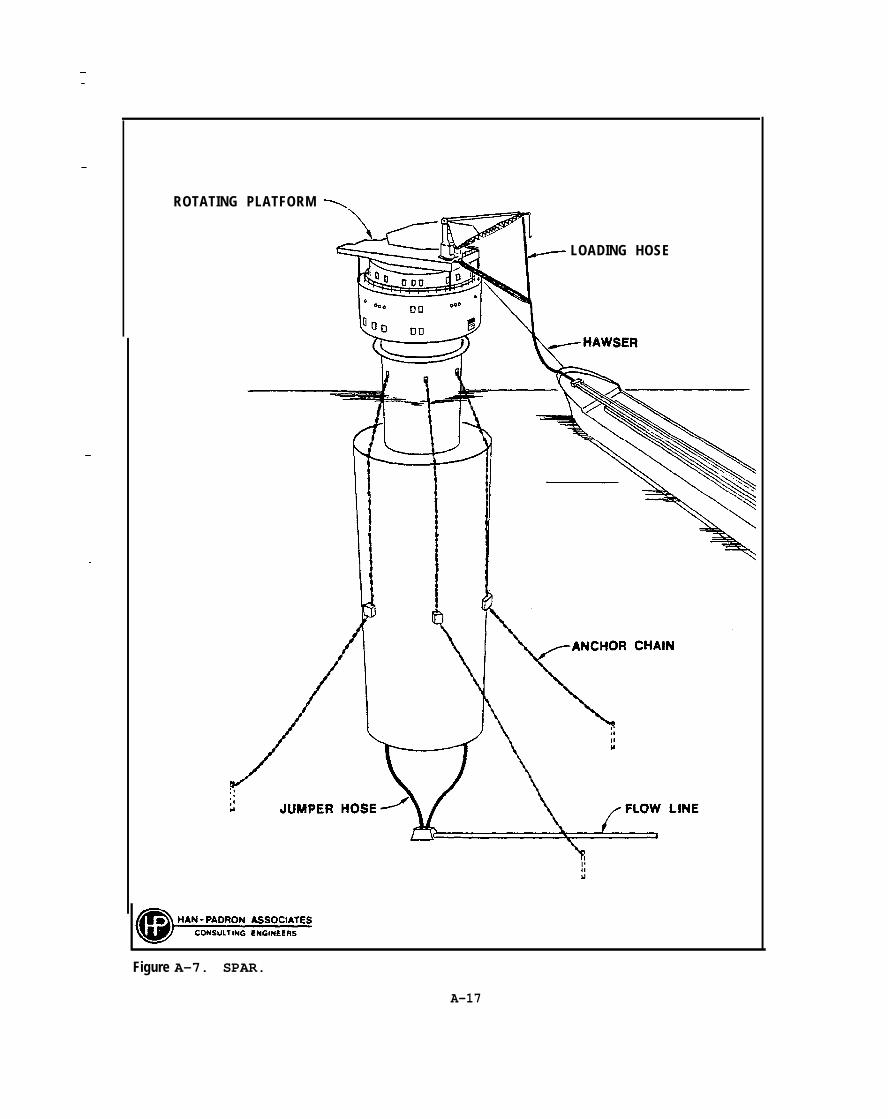
A.3.5 SPAR
The SPAR is similar to”the ELSBM but incorporates oil storage
capacity within the buoy. Figure A-7 illustrates the Brent Field
SPAR, the only one installed to date. It consists of three
cylindrical sections placed one on top of the other with an overall
height of 137 m (450 ft). The lowest section, the storage facility,
is 93 m (305 ft) high with a diameter of 29.3 m (96 ft). Located
above this is a 17 m (56 ft) diameter cylinder some 32 m (105 ft)
high containing pumping and other equipment, A 12 m (39 ft) high by
26 m (85 ft) diameter cylindrical superstructure forming the top end
of the SPAR houses power-generating equipment, control equipment, and
—
——
I
,1
IA-16
—
——
—
—
——
—
—
LOADING HOSE
ROTATING PLATFORM >
w
. @~
Figure A-7. SPAR.
A-17

crew quarters. Mooring and offloading facilities, together with a
helipad, are incorporated in the turntable located on top of the
superstructure (Bax 1974).
The SPAR has been designed to maintain a constant. draft in
both the loaded and ballasted conditions, utilizing a seawater
displacement system. Since there is a difference between the
specific gravities of oil and seawater, not all of the storage
compartments are filled with water when the unit is in ballast.
-I—
In
— i
I
~
I—-!
-1—
-!
‘1.I
-1
‘1
.—
A-18
—
A.4 CHARACTERISTICS OF NORTHOFFSHORE LOADING SYSTEMS
SEA OIL FIELDS UTILIZING
—
Considerable information is available concerning the
characteristics of North Sea oil fields that utilize offshore loading
systems for transporting crude oil and the characteristics of the
offshore loading systems. This information is categorized and
documented in Tables A-4 through A-19 for each of the eleven fields
in the U.K. and Norwegian sectors that presently have an OLS
installed. Where a field has more than one OLS, a separate table is
provided for each OLS if they are not identical. Where information—
was not available,
cost listed for each
—
“N.A.” appears in the tables. The construction
is the cost in the year the OLS was installed.
In addition to the characteristics of the offshore loading
systems and the oil fields, the tables contain a brief statement
regarding the operator’s philosophy with regard to the selection of
the crude oil transportation system. This information is not
available for every field.
A-19
—
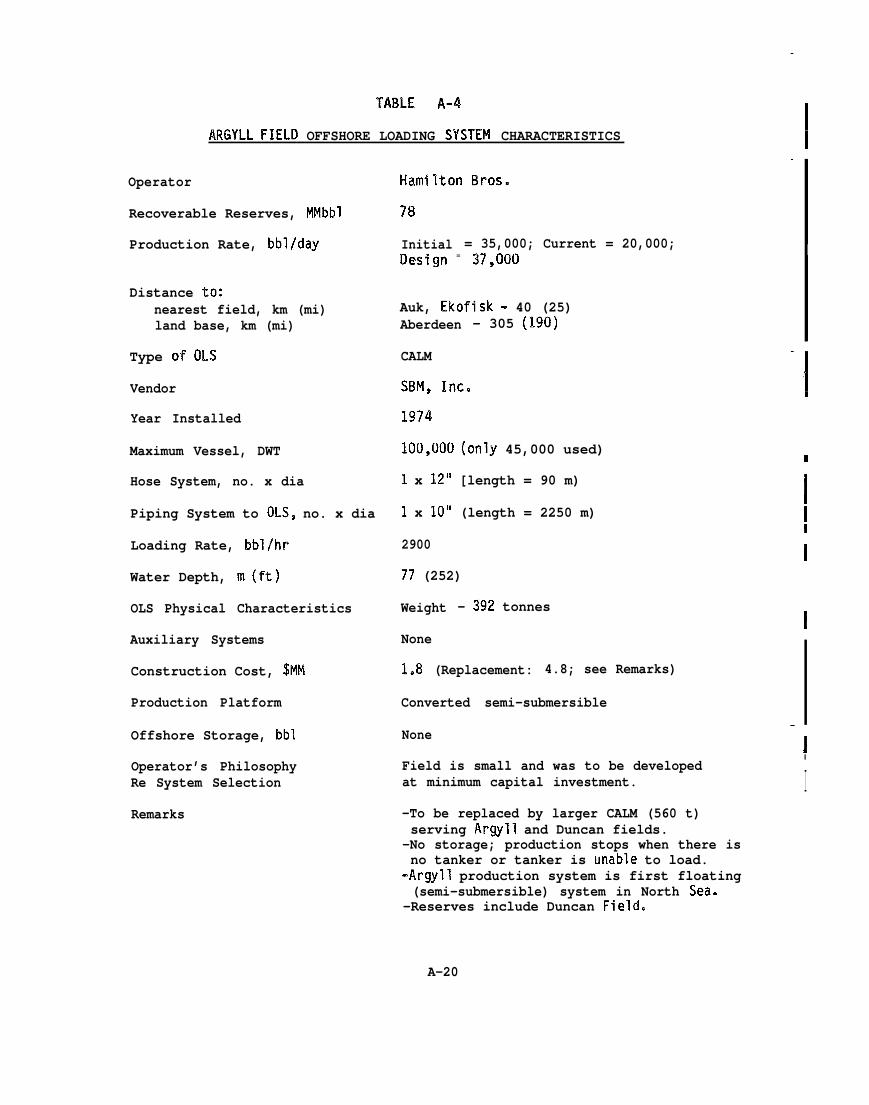
TABLE A-4
ARGYL.L FIELD OFFSHORE LOADING SYSTEM CHARACTERISTICS—
Operator
Recoverable Reserves, Mhlbbl
Production Rate, bbl/day
Hamilton Bros.
78
Initial = 35,000; Current = 20,000;Design = 37,000
Distance to:nearest field, km (mi)land base, km (mi)
Auk, Ekofisk - 40 (25)Aberdeen - 305 (190)
—CALMType of OLS
SB!d, Inc.Vendor
Year Installed
100,000 (only 45,000 used)Maximum Vessel, DWT I
I1I
I
1 x 12” [length = 90 m)Hose System, no. x dia
1 x 10” (length = 2250 m)Piping System to OLS, no. x dia
—Loading Rate, bbl/hr
Water Depth, m (ft)
2900
77 (252)
Weight - 392 tonnesOLS Physical CharacteristicsI
II
I
Auxiliary Systems
Construction Cost, $EIM
None
1.8 (Replacement: 4.8; see Remarks)
Converted semi-submersibleProduction Platform—
NoneOffshore Storage, bbl
Field is small and was to be developedat minimum capital investment.
Operator’s PhilosophyRe System Selection
-To be replaced by larger CALM (560 t)serving Argyll and Duncan fields.
-No storage; production stops when there isno tanker or tanker is unable to load.
-Argyll production system is first floating(semi-submersible) system in North Sea.
-Reserves include Duncan Field.
Remarks
A-20
——
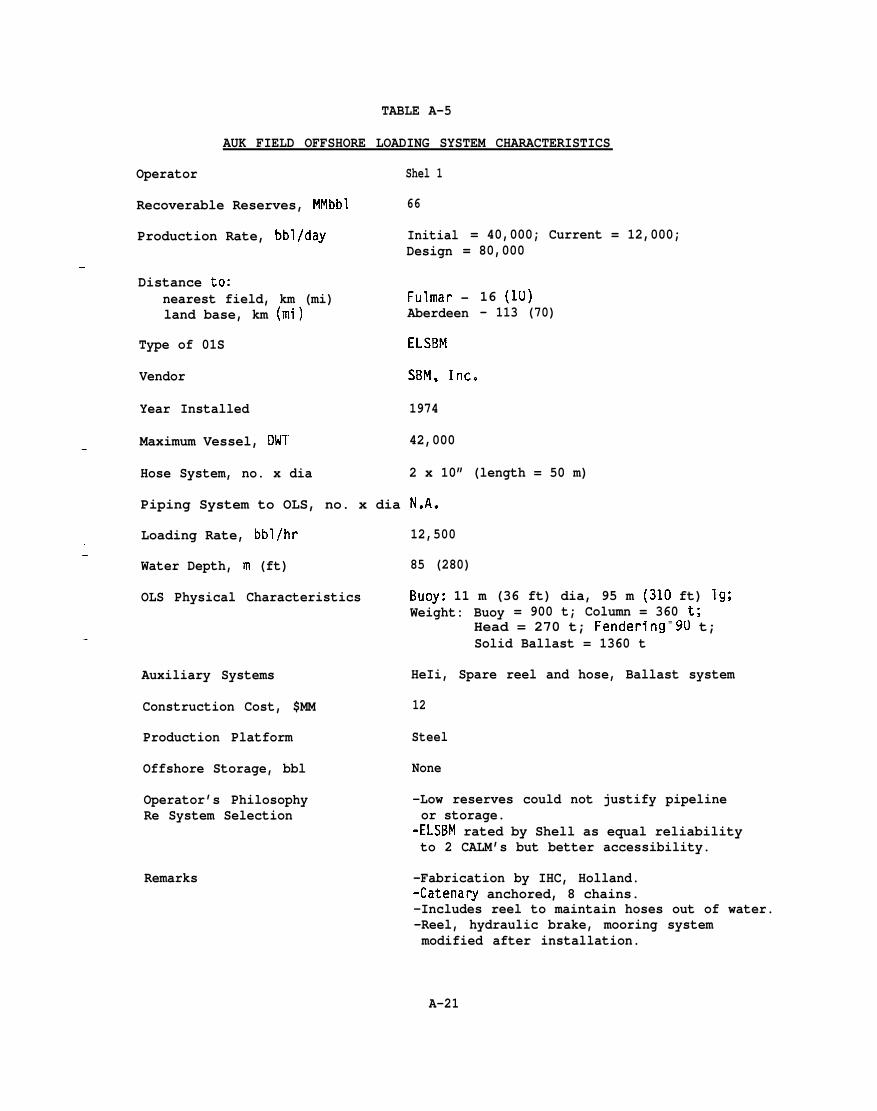
TABLE A-5
AUK FIELD OFFSHORE LOADING SYSTEM CHARACTERISTICS
Operator Shel 1
Recoverable Reserves, MMbbl 66
Production Rate, bbl/day Initial = 40,000; Current = 12,000;Design = 80,000
Distance to:nearest field, km (mi) Fulmar - 16 (lu)land base, km (mi) Aberdeen - 113 (70)
Type of 01S EISBM
Vendor SBM, Inc.
Year Installed 1974
Maximum Vessel, DWT 42,000—
Hose System, no. x dia 2 x 10” (length = 50 m)
Piping System to OLS, no. x dia N.A.
.—
.
Loading Rate, bbl/hr 12,500
Water Depth, m (ft) 85 (280)
OLS Physical Characteristics BUOY: 11 m (36 ft) dia, 95 m (310 ft) lg;Weight: Buoy = 900 t; Column = 360 t;
Head = 270 t; Fendering = 90 t;Solid Ballast = 1360 t
Auxiliary Systems
Construction Cost, $MM
Production Platform
Offshore Storage, bbl
Operator’s PhilosophyRe System Selection
Remarks
HeIi, Spare reel and hose, Ballast system
12
Steel
None
-Low reserves could not justify pipelineor storage.
-ELSBM rated by Shell as equal reliabilityto 2 CALM’s but better accessibility.
-Fabrication by IHC, Holland.-Catenary anchored, 8 chains.-Includes reel to maintain hoses out of water.-Reel, hydraulic brake, mooring systemmodified after installation.
A-21
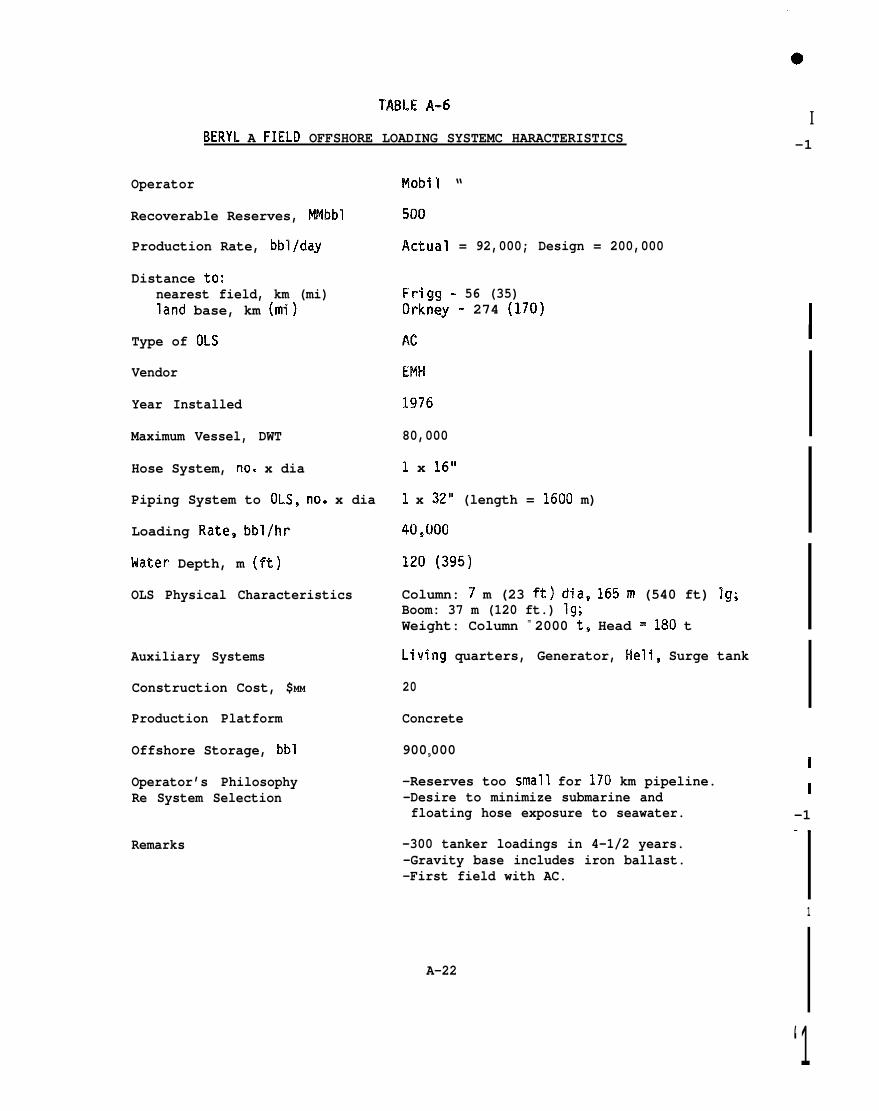
TABLE A-6
BERYL A FIELD OFFSHORE LOADING SYSTEMC HARACTERISTICS
Operator Mobil “
Recoverable Reserves, M!lbbl !500
Production Rate, bbl/day Actual = 92,000; Design = 200,000
Distance to:nearest field, km (mi) Frigg - 56 (35)land base, km (mi) Orkney - 274 (170)
Type of OLS AC
Vendor EM+
Year Installed 1976
Maximum Vessel, DWT 80,000
Hose System, no. x dia 1 x 16”
Piping System to OLS, no. x dia I x 32” (length = 1600 m)
Loading Rate, bbl/hr 40,000
Water Depth, m (ft) 120 (395)
OLS Physical Characteristics Column: 7 m (23 ft) dia, 165 m (540 ft) Ig;Boom: 37 m (120 ft.) lg;Weight: Column = 2000 t, Head = 180 t
I-1
-1
—
Auxiliary Systems Living quarters, Generator, HeIi, Surge tank
Construction Cost, $MM 20
Production Platform Concrete
Offshore Storage, bbl 9009000I
Operator’s Philosophy -Reserves too small for 170 km pipeline.Re System Selection -Desire to minimize submarine and I
floating hose exposure to seawater. -1—.
Remarks -300 tanker loadings in 4-1/2 years.-Gravity base includes iron ballast.-First field with AC.
1
A-22
—
‘1
—
Operator
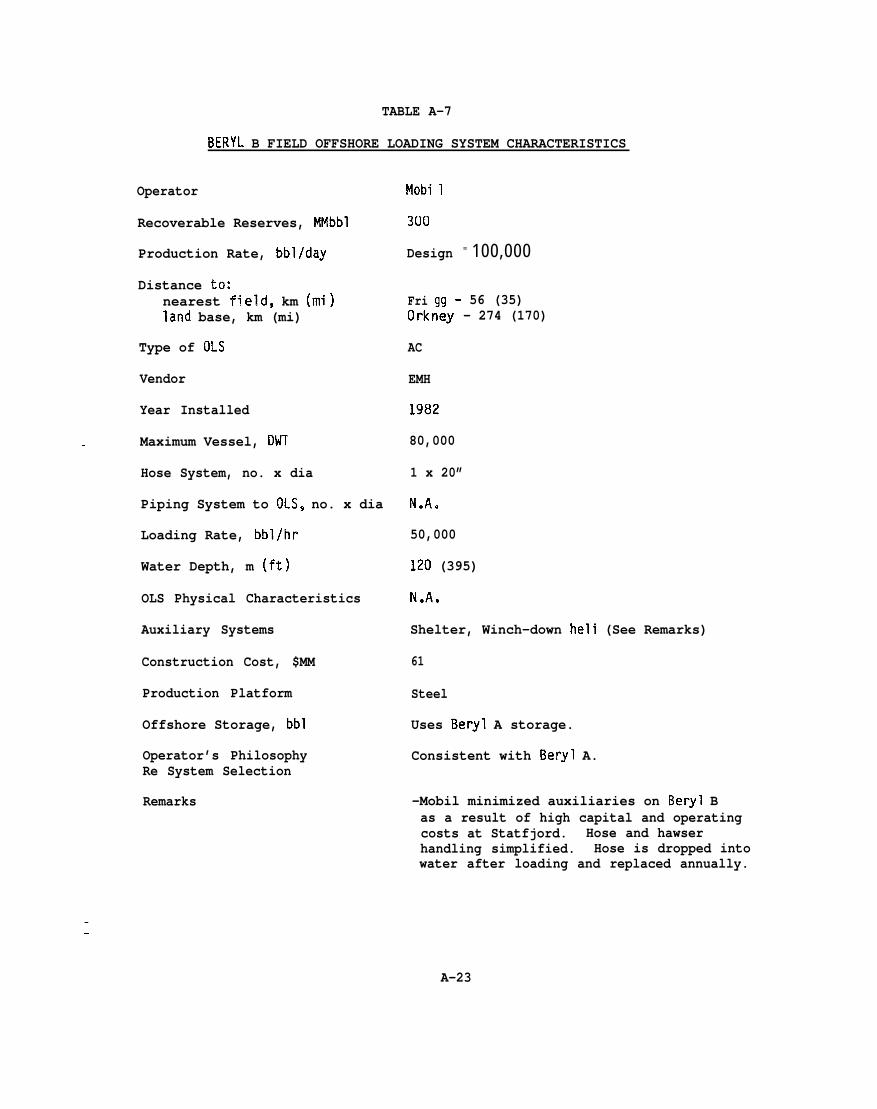
TABLE A-7
BERYL B FIELD OFFSHORE LOADING SYSTEM CHARACTERISTICS
Recoverable Reserves, MMbbl
Production Rate, bbl/day
Distance to:nearest field, km (mi)land base, km (mi)
Type of OLS
Vendor
Year Installed
Maximum Vessel, DWT
Hose System, no. x dia
Piping System to OLS, no. x dia
Loading Rate, bbl/hr
Water Depth, m (ft)
OLS Physical Characteristics
Auxiliary Systems
Construction Cost, $MM
Production Platform
Offshore Storage, bbl
Operator’s PhilosophyRe System Selection
Remarks
Mobi 1
3(IO
Design = 100,000
Fri gg - 56 (35)Orkney - 274 (170)
AC
EMH
1982
80,000
1 x 20”
N.Aa
50,000
120 (395)
N.A.
Shelter, Winch-down heli (See Remarks)
61
Steel
Uses Beryl A storage.
Consistent with Beryl A.
-Mobil minimized auxiliaries on Beryl Bas a result of high capital and operatingcosts at Statfjord. Hose and hawserhandling simplified. Hose is dropped intowater after loading and replaced annually.
.—
A-23
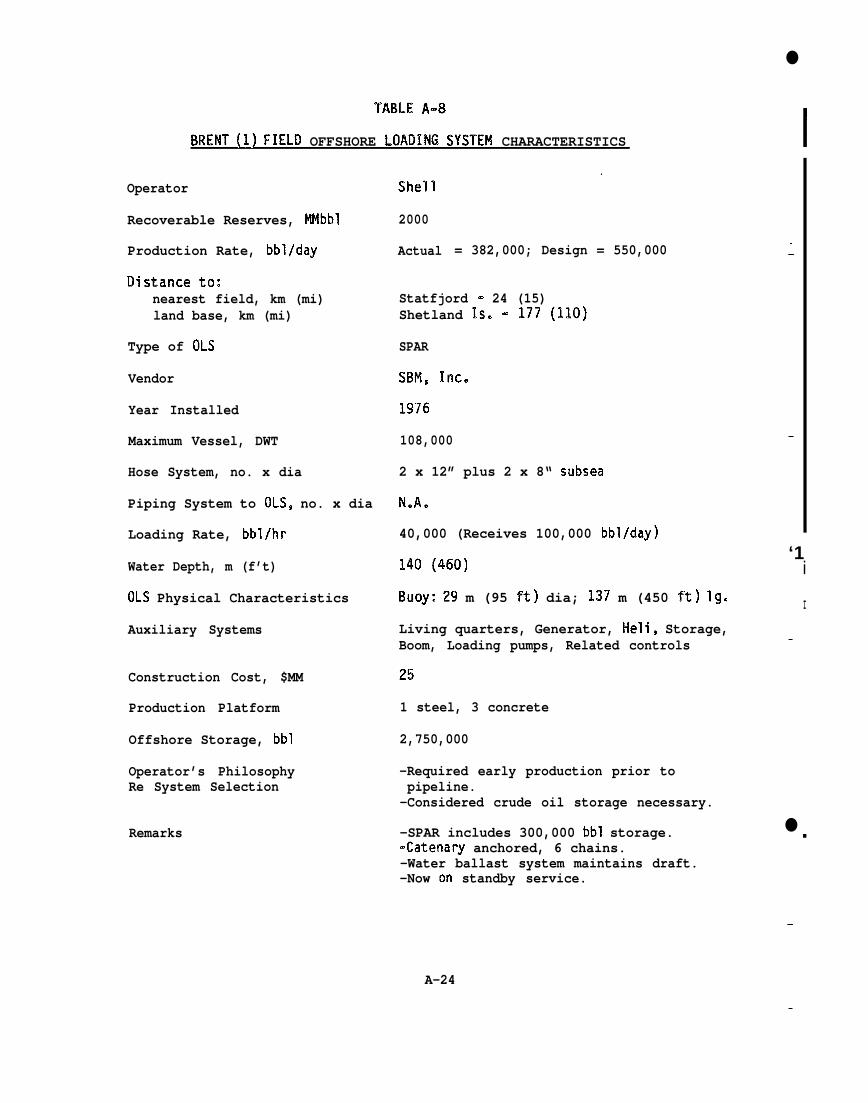
TABLE A-8
BRENT (1) FIELD OFFSHORE LOADING SYSTEM CHARACTERISTICS
Operator
Recoverable Reserves, MMbbl
Production Rate, bbl/day
Distance to:nearest field, km (mi)land base, km (mi)
Type of OLS
Vendor
Year Installed
Maximum Vessel, DWT
Hose System, no. x dia
Piping System to OLS, no. x dia
Loading Rate, bbl/hr
Water Depth, m (f’t)
OLS Physical Characteristics
Auxiliary Systems
Construction Cost, $MM
Production Platform
Offshore Storage, bbl
Operator’s PhilosophyRe System Selection
Remarks
2000
Actual = 382,000; Design = 550,000
Statfjord -= 24 (15)Shetland 1s. - 177 (110)
SPAR
SBM, Inc.
1976
108,000
2 x 12” plus 2 x 8“ subsea
N.A.
40,000 (Receives 100,000 bbl/day)
140 (460]
Buoy: 29 m (95 ft) dia; 137 m (450 ft) lg.
Living quarters, Generator, HeIi, Storage,Boom, Loading pumps, Related controls
25
1 steel, 3 concrete
2,750,000
-Required early production prior topipeline.
-Considered crude oil storage necessary.
-SPAR includes 300,000 bbl storage.-Catenary anchored, 6 chains.-Water ballast system maintains draft.-Now on standby service.
●
-1
——
—
‘1i
I
—
●■
—
A-24
—
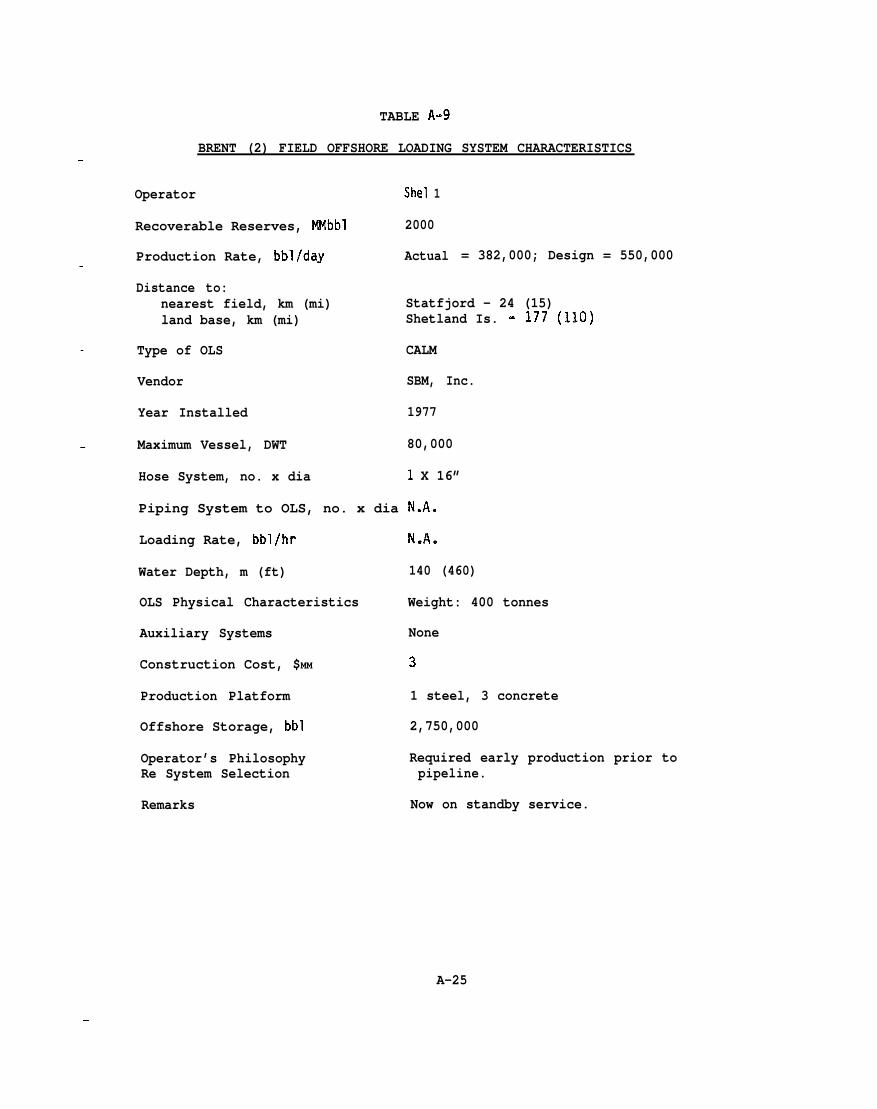
TABLE A-9
BRENT (2) FIELD OFFSHORE LOADING SYSTEM CHARACTERISTICS.
Operator Shel 1
—
—
—
—
Recoverable Reserves, MMbbl 2000
Production Rate, bbl/day Actual = 382,000; Design = 550,000
Distance to:nearest field, km (mi) Statfjord - 24 (15)land base, km (mi) Shetland Is. - 177 (110)
Type of OLS CALM
Vendor SBM, Inc.
Year Installed 1977
Maximum Vessel, DWT 80,000
Hose System, no. x dia 1 X 16”
Piping System to OLS, no. x dia N.A.
Loading Rate, bbl/hr N.A.
Water Depth, m (ft) 140 (460)
OLS Physical Characteristics Weight: 400 tonnes
Auxiliary Systems None
Construction Cost, $MM 3
Production Platform 1 steel, 3 concrete
Offshore Storage, bbl 2,750,000
Operator’s Philosophy Required early production prior toRe System Selection pipeline.
Remarks Now on standby service.
A-25
—
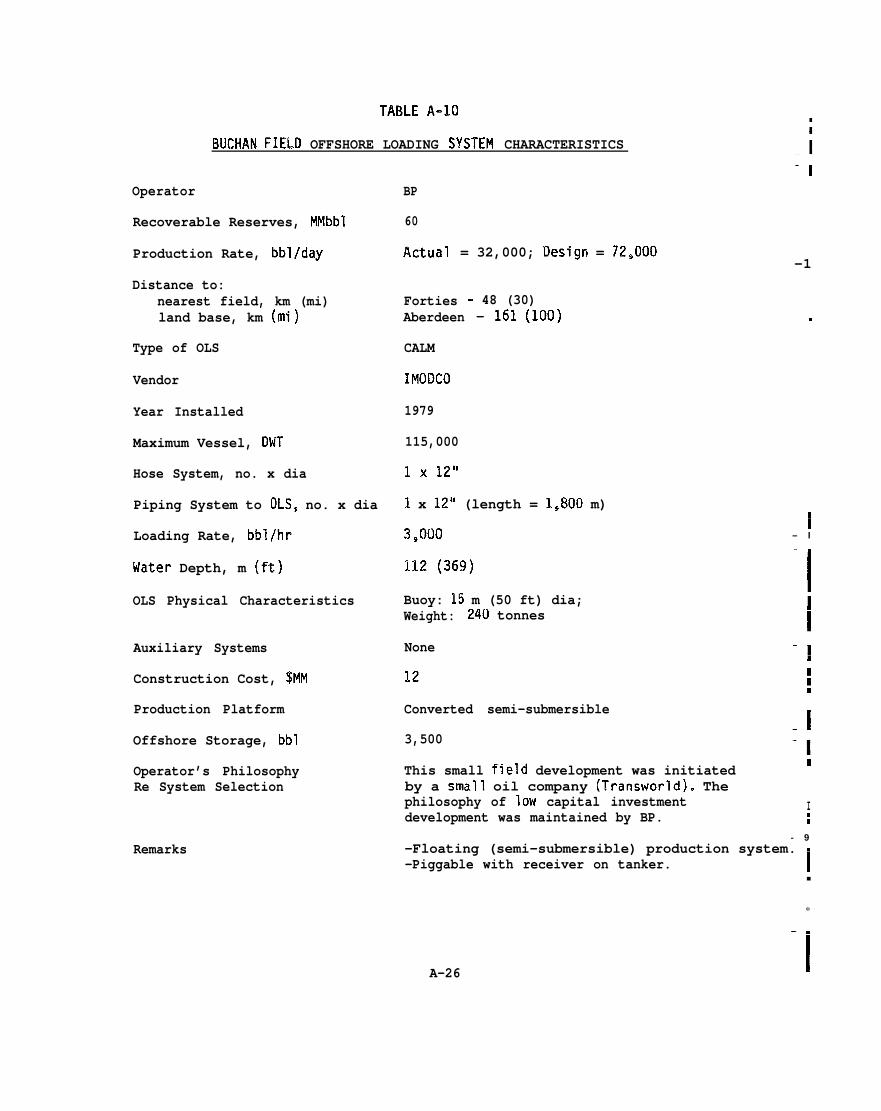
TABLE A-10
f3UCHAN FIELD OFFSHORE LOADING SYSTEM CHARACTERISTICS
Operator
Recoverable Reserves, MMbbl
Production Rate, bbl/day
Distance to:nearest field, km (mi)land base, km (mi)
Type of OLS
Vendor
Year Installed
Maximum Vessel, DWT
Hose System, no. x dia
Piping System to OLS, no. x dia
Loading Rate, bbl/hr
l+Jater Depth, m (ft)
OLS Physical Characteristics
Auxiliary Systems
Construction Cost, $MM
Production Platform
Offshore Storage, bbl
Operator’s PhilosophyRe System Selection
Remarks
BP
60
Actual = 32,000; Design = 72,000-1
Forties - 48 (30)Aberdeen - 161 (100)
CALM
IMODCO
1979
115,000
1 x 12” (length = 1,800 m)
Buoy: 15 m (50 ft) dia;Weight: 240 tonnes
None
.
:– I—.
IiI■
-!
Converted semi-submersibleI
3,500
This small field development was initiated I
by a small oil company (Transworld). Thephilosophy of low capital investmentdevelopment was maintained by BP.
In#- 9
-Floating (semi-submersible) production system. I-Piggable with receiver on tanker. 1
■
❉
A-26
—.
I
—
——
—
Operator
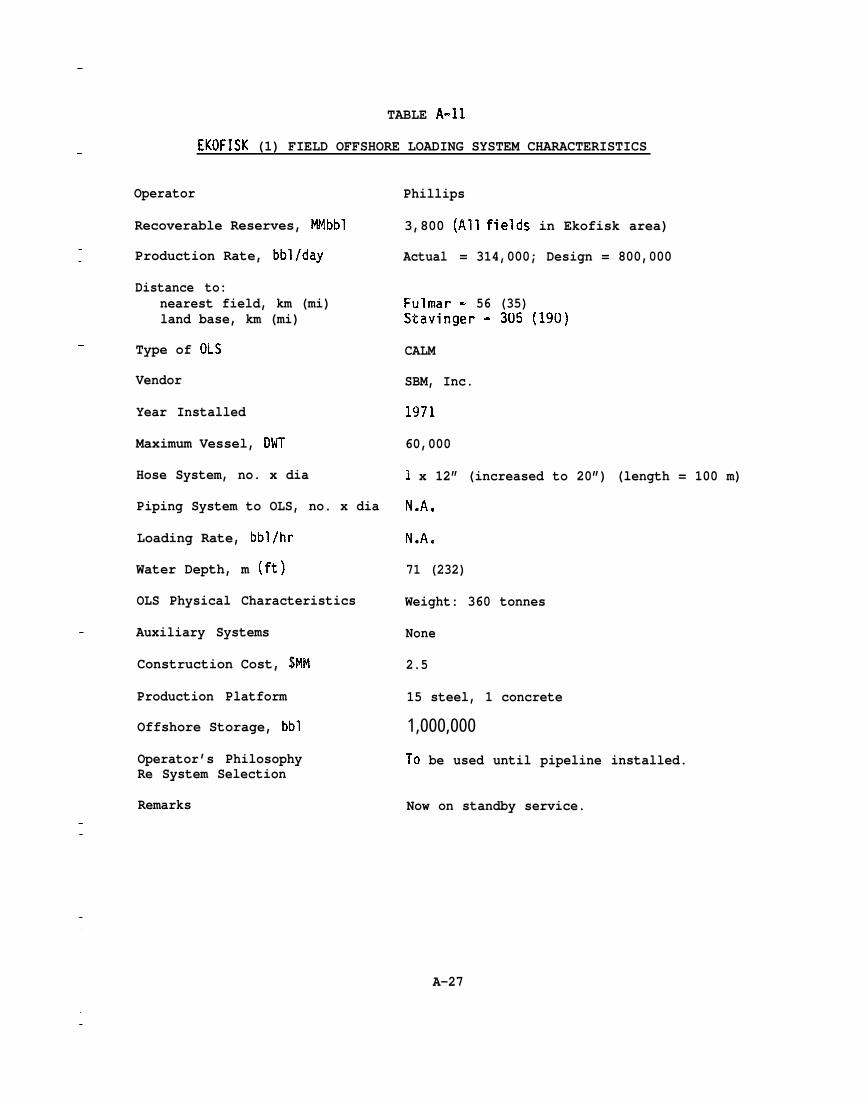
TABLE A-=11
EKOFISK (1) FIELD OFFSHORE LOADING SYSTEM CHARACTERISTICS
Recoverable Reserves, MMbbl
Production Rate, bbl/day
Distance to:nearest field, km (mi)land base, km (mi)
Type of OLS
Vendor
Year Installed
Maximum Vessel, DWT—
Hose System, no. x dia
Piping System to OLS, no. x dia
Loading Rate, bbl/hr
Water Depth, m (ft)
—
OLS Physical Characteristics
Auxiliary Systems
Construction Cost, $Mbl
Production Platform
Offshore Storage, bbl
Operator’s PhilosophyRe System Selection
Phillips
3,800 (All fields in Ekofisk area)
Actual = 314,000; Design = 800,000
Fulmar - 56 (35)Stavinger - 305 (190)
CALM
SBM, Inc.
1971
60,000
1 x 12” (increased to 20”) (length = 100 m)
N.A.
N.A.
71 (232)
Weight: 360 tonnes
None
2.5
15 steel, 1 concrete
1,000,000
To be used until pipeline installed.
Remarks Now on standby service.
A-27
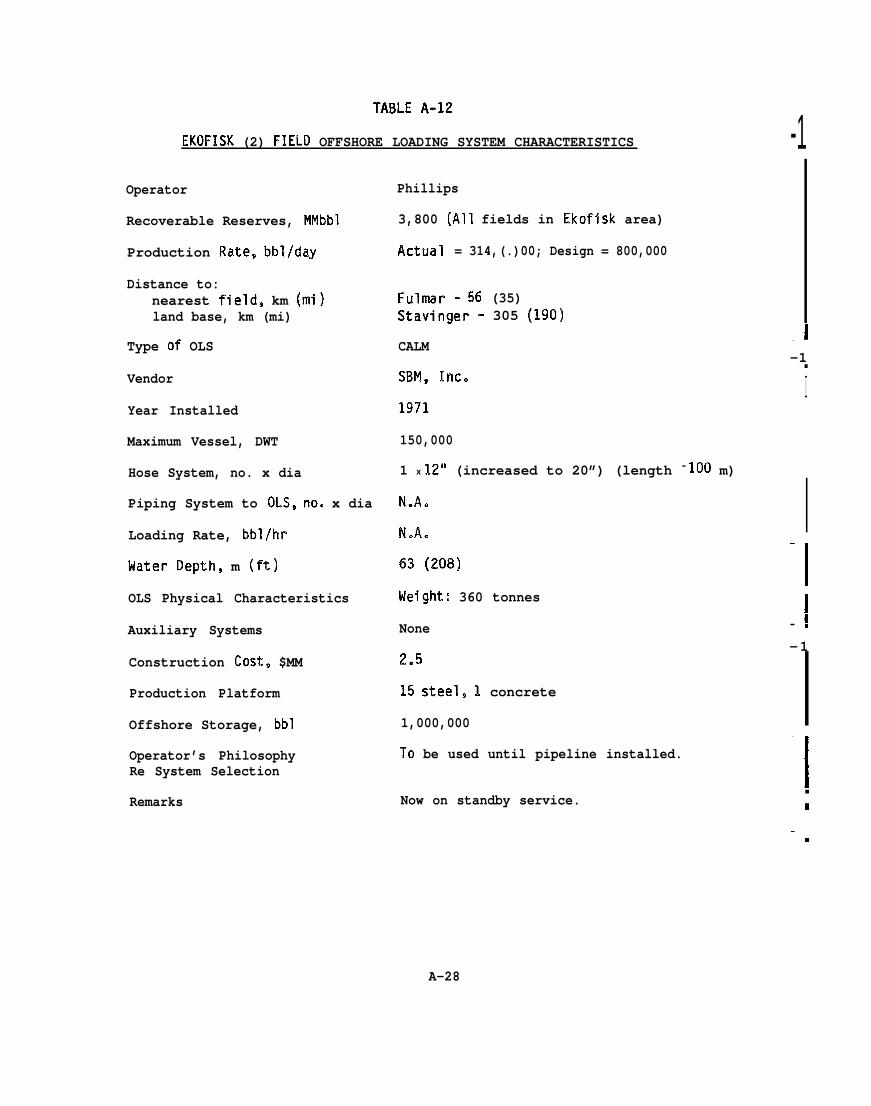
TABLE A-12
EKOFISK (2) FIELD OFFSHORE LOADING SYSTEM CHARACTERISTICS
Operator
Recoverable Reserves, MMbbl
Production Rate, bbl/day
Distance to:nearest field, km (rni)land base, km (mi)
Type of OLS
Vendor
Year Installed
Maximum Vessel, DWT
Hose System, no. x dia
Piping System to OLS, no. x dia
Loading Rate, bbl/hr
Water Depth, m (ft)
OLS Physical Characteristics
Auxiliary Systems
Construction Cost, $MM
Production Platform
Offshore Storage, bbl
Operator’s PhilosophyRe System Selection
Phillips
3,800 (All fields in Ekofisk area)
Actual = 314,(.)00; Design = 800,000
Fulmar - !56 (35)Stavinger - 305 (190)
CALM
SBM, Inc.
1971
150,000
1 x 12” (increased to 20”) (length = 100 m)
N.A.
N.Ae
63 (208)
Weight: 360 tonnes
None
2.5
15 steel, 1 concrete
1,000,000
To be used until pipeline installed.
-1
_l-1
■
I
— I‘1
I!—
-1
‘1■
Remarks Now on standby service.
A-28
—
—
—
—
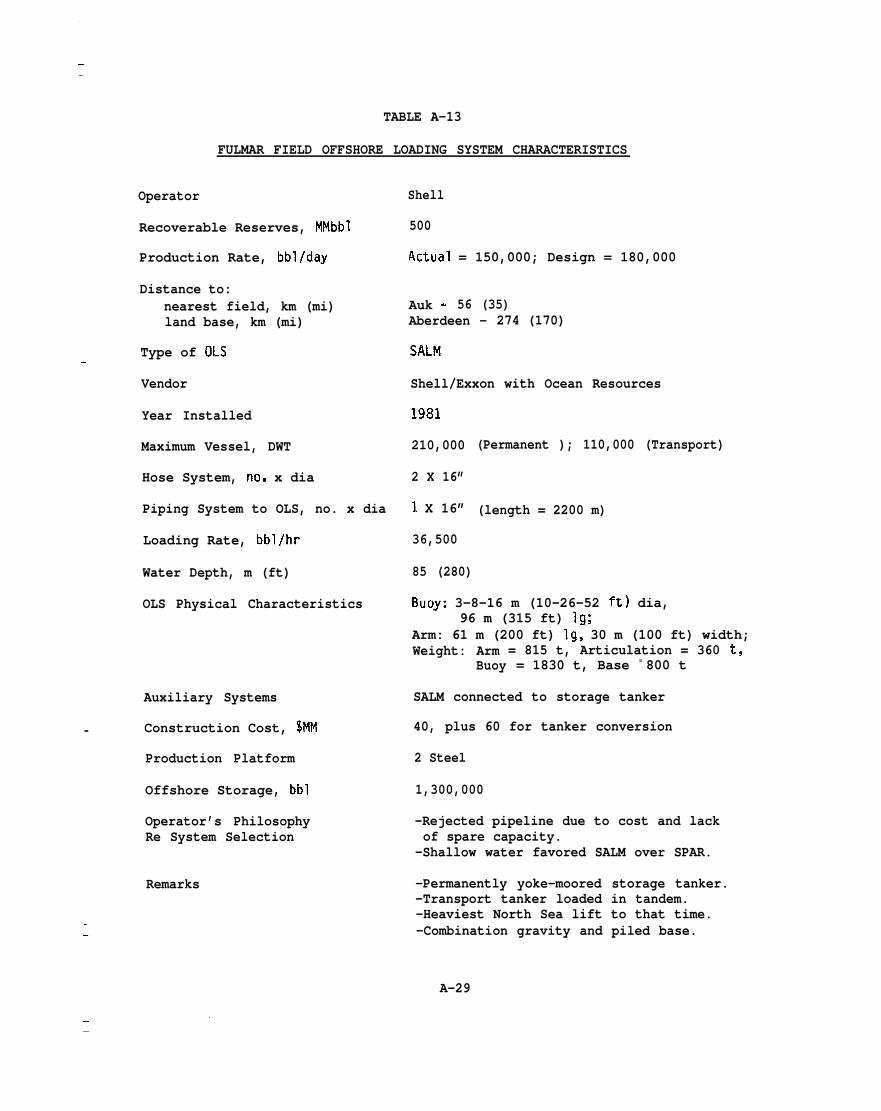
TABLE A-13
FULMAR FIELD OFFSHORE LOADING SYSTEM CHARACTERISTICS
Operator Shell
Recoverable Reserves, MMbbl 500
Production Rate, bbl/day Actual = 150,000; Design = 180,000
Distance to:nearest field, km (mi) Auk - 56 (35)land base, km (mi) Aberdeen - 274 (170)
Type of OLS SALM
Vendor Shell/Exxon with Ocean Resources
Year Installed 1981
Maximum Vessel, DWT 210,000
Hose System, no. x dia 2 X 16”
Piping System to OLS, no. x dia ~ X 16”
Loading Rate, bbl/hr 36,500
(Permanent ); 110,000 (Transport)
(length = 2200 m)
Water Depth, m (ft) 85 (280)
OLS Physical Characteristics Buoy: 3-8-16 m (10-26-52 ft) dia,96 m (315 ft) lg;
Arm: 61 m (200 ft) lg, 30 m (100 ft) width;Weight: Arm = 815 t, Articulation = 360 t,
Buoy = 1830 t, Base = 800 t
Auxiliary Systems
Construction Cost, $MM—
Production Platform
Offshore Storage, bbl
Operator’s PhilosophyRe System Selection
Remarks
SALM connected to storage tanker
40, plus 60 for tanker conversion
2 Steel
1,300,000
-Rejected pipeline due to cost and lackof spare capacity.
-Shallow water favored SALM over SPAR.
-Permanently yoke-moored storage tanker.-Transport tanker loaded in tandem.-Heaviest North Sea lift to that time.-Combination gravity and piled base.
A-29
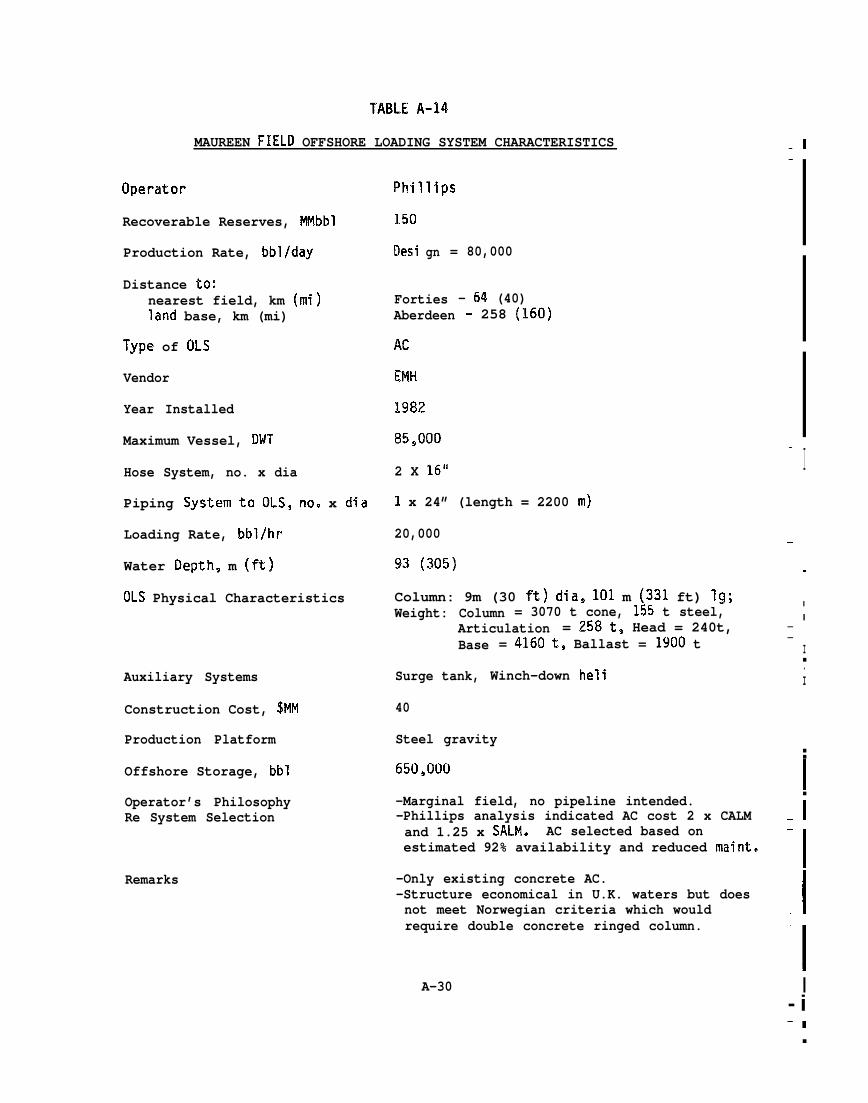
TABLE A-14
MAUREEN FIELD OFFSHORE LOADING SYSTEM CHARACTERISTICS — 1—
Operatcw Phillips
150
!lesi gn = 80,000
Recoverable Reserves, MMbbl
Production Rate, bbl/day
Distance to:nearest field, km (mi)land base, km (mi)
Type of OLS
Forties - 64 (40)Aberdeen - 258 (160)
AC
Vendor law-i
Year Installed
Maximum Vessel, DWT
1982
8!5,000 —
I2 X 16”Hose System, no. x dia
1 x 24” (length = 2200 m)Piping Systemto OLS, no. x dia
Loading Rate, bbl/hr
Water Depth, m (ft)
20,000 —
93 (305) .
Column: 9m (30 ft) dia, 101 m (331 ft) Ig;Weight: Column = 3070 t cone, 155 t steel,
Articulation = 258t, Head = 240t,Base = 4160 t, Ballast = 1900 t
OLS Physical Characteristics I
I——
I■.IAuxiliary Systems
Construction Cost, $MM
Production Platform
Offshore Storage, bbl
Operator’s PhilosophyRe System Selection
Surge tank, Winch-down heli
40
Steel gravity■■
I■
650,0LKJ
-Marginal field, no pipeline intended.-Phillips analysis indicated AC cost 2 x CALMand 1.25 x SALM. AC selected based onestimated 92% availability and reduced maint.
— I—
I— I‘1
I- i
-Only existing concrete AC.-Structure economical in U.K. waters but doesnot meet Norwegian criteria which wouldrequire double concrete ringed column.
Remarks
A-30
■
——
——
—
—
——
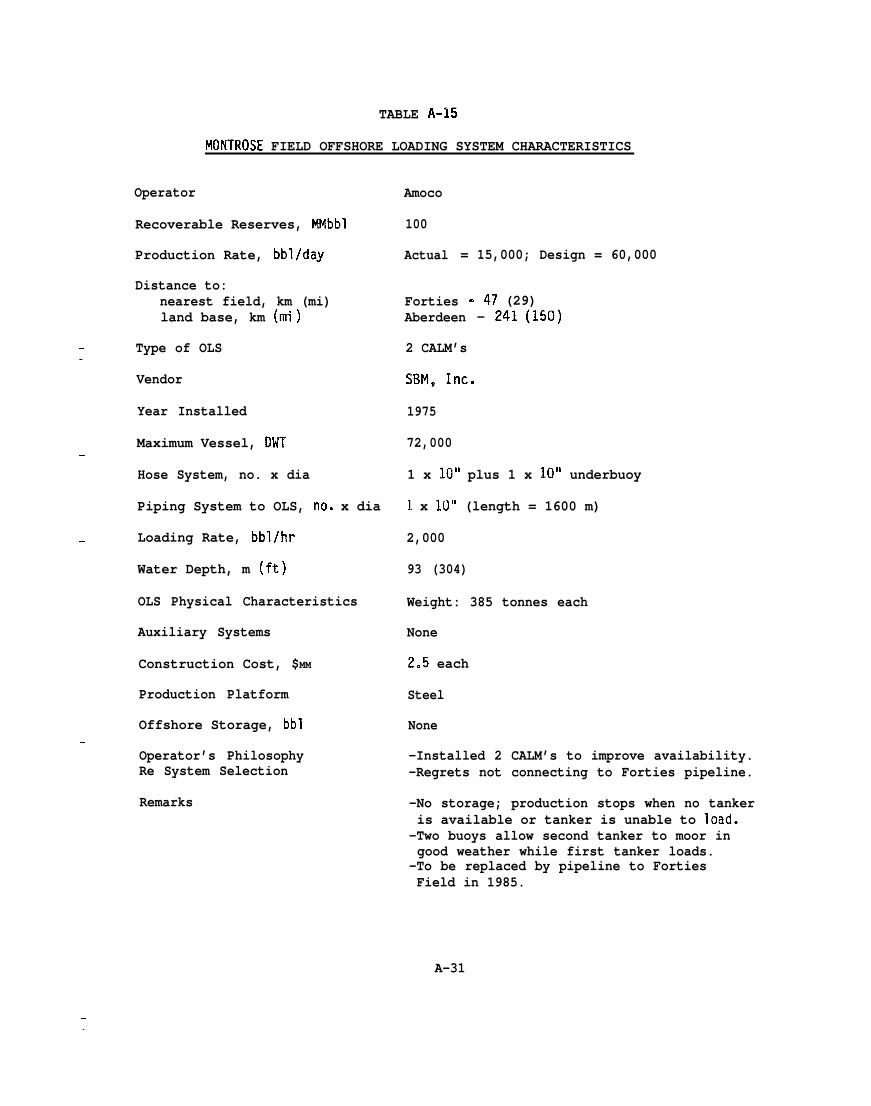
TABLE A-15
MONTROSE FIELD OFFSHORE LOADING SYSTEM CHARACTERISTICS
Operator
Recoverable Reserves, MMbbl
Production Rate, bbl/day
Distance to:nearest field, km (mi)land base, km (mi)
Type of OLS
Vendor
Year Installed
Maximum Vessel, DWT
Hose System, no. x dia
Piping System to OLS, no. x dia
Loading Rate, bbl/hr
Water Depth, m (ft)
OLS Physical Characteristics
Auxiliary Systems
Construction Cost, $MM
Production Platform
Offshore Storage, bbl
Operator’s PhilosophyRe System Selection
Remarks
Amoco
100
Actual = 15,000; Design = 60,000
Forties - 47 (29)Aberdeen - 241 (150)
2 CALM’s
SBM, Inc.
1975
72,000
1 x 10” plus 1 x 10” underbuoy
1 x 10” (length = 1600 m)
2,000
93 (304)
Weight: 385 tonnes each
None
2.5 each
Steel
None
-Installed 2 CALM’s to improve availability.-Regrets not connecting to Forties pipeline.
-No storage; production stops when no tankeris available or tanker is unable to load.
-Two buoys allow second tanker to moor ingood weather while first tanker loads.
-To be replaced by pipeline to FortiesField in 1985.
A-31
—
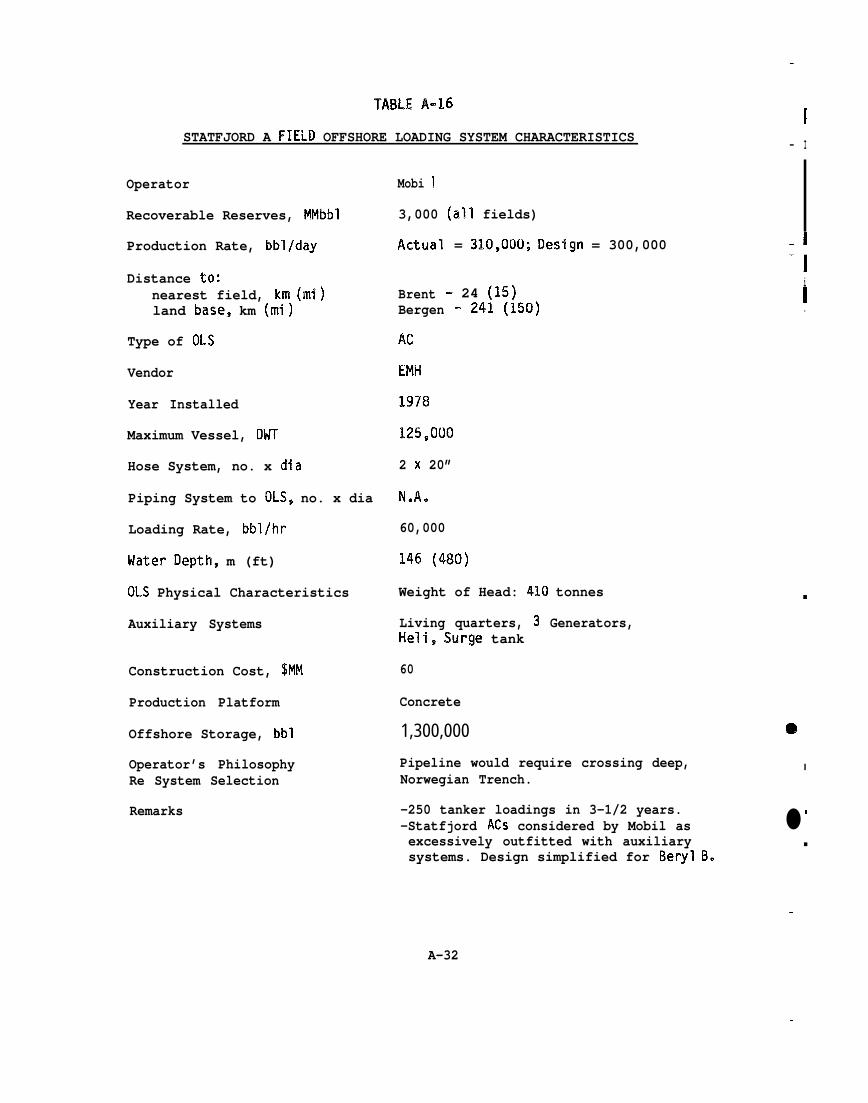
TABLE A-16I
STATFJORD A FIELD OFFSHORE LOADING SYSTEM CHARACTERISTICS — I
Operator
Recoverable Reserves, MMbbl
Production Rate, bbl/day
Distance to:nearest field, km (mi)land base, km (mi)
Type of OLS
Vendor
Year Installed
Maximum Vessel, DidT
Hose System, no. x dia
Piping System to OLS, no. x dia
Loading Rate, bbl/hr
Hater Depth, m (ft)
OLS Physical Characteristics
Auxiliary Systems
Construction Cost, $MM
Production Platform
Offshore Storage, bbl
Operator’s PhilosophyRe System Selection
Remarks
Mobi 1
3,000 (all fields)
Actual = 310,000; Design = 300,000
‘1
- 24 (15)i
Brent IBergen - 241 (150)
I.
Ac
EMH
1978
125,000
2 x 20”
N*A.
60,000
146 (480)
Weight of Head: 410 tonnes
Living quarters, 3 Generators,HeIi, Surge tank
60
Concrete
1,300,000
Pipeline would require crossing deep,Norwegian Trench.
-250 tanker loadings in 3-1/2 years.-Statfjord ACS considered by Mobil asexcessively outfitted with auxiliarysystems. Design simplified for 13eryl B.
e
I
● ’■
—
A-32
—
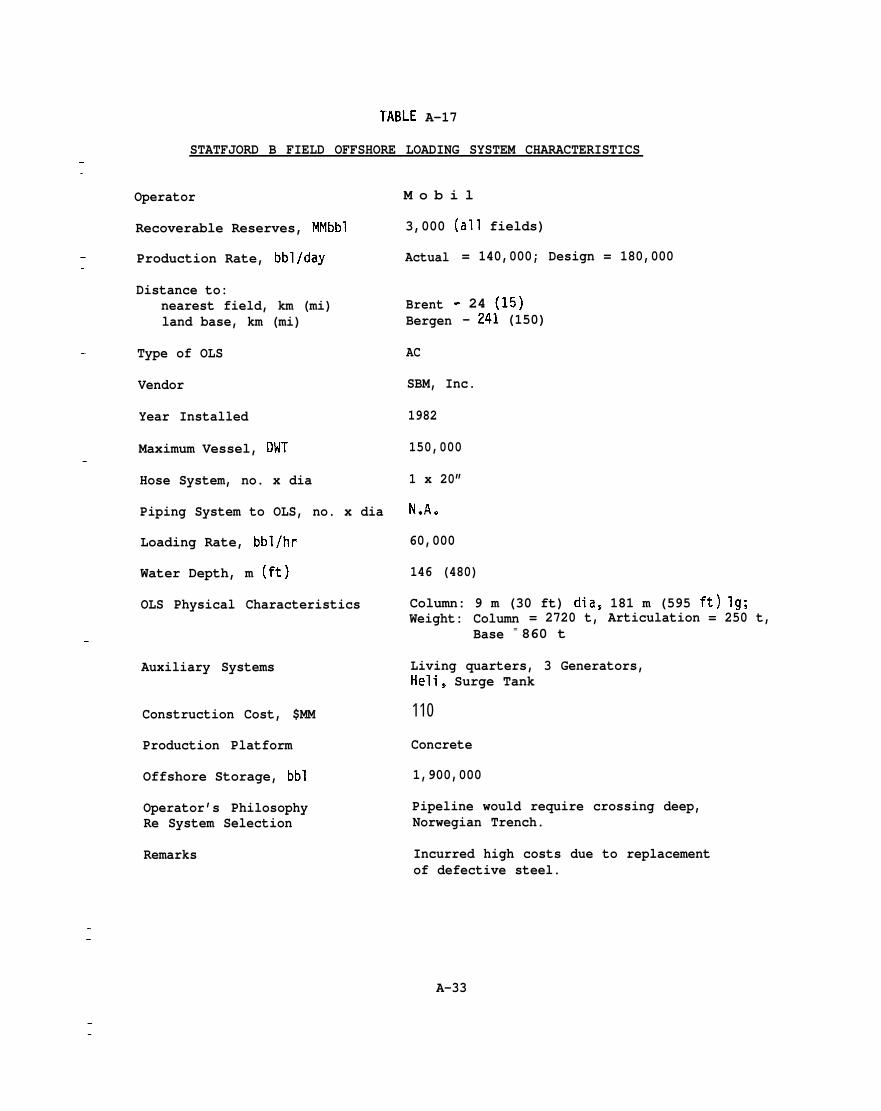
TABLE A-17
STATFJORD B FIELD OFFSHORE LOADING SYSTEM CHARACTERISTICS.—
——
—
—
——
Operator
Recoverable Reserves, MMbbl
Production Rate, bbl/day
Distance to:nearest field, km (mi)land base, km (mi)
Type of OLS
Vendor
Year Installed
Maximum Vessel, DWT
Hose System, no. x dia
Piping System to OLS, no. x dia
Loading Rate, bbl/hr
Water Depth, m (ft)
OLS Physical Characteristics
Auxiliary Systems
Construction Cost, $MM
Production Platform
Offshore Storage, bbl
Operator’s PhilosophyRe System Selection
Remarks
M o b i l
3,000 (all fields)
Actual = 140,000; Design = 180,000
Brent - 24 (15)Bergen - 241 (150)
AC
SBM, Inc.
1982
150,000
1 x 20”
N.A.
60,000
146 (480)
Column: 9 m (30 ft) dia, 181 m (595 ft) lg;Weight: Column = 2720 t, Articulation = 250 t,
Base = 860 t
Living quarters, 3 Generators,Heli, Surge Tank
110
Concrete
1,900,000
Pipeline would require crossing deep,Norwegian Trench.
Incurred high costs due to replacementof defective steel.
——
A-33
——
—
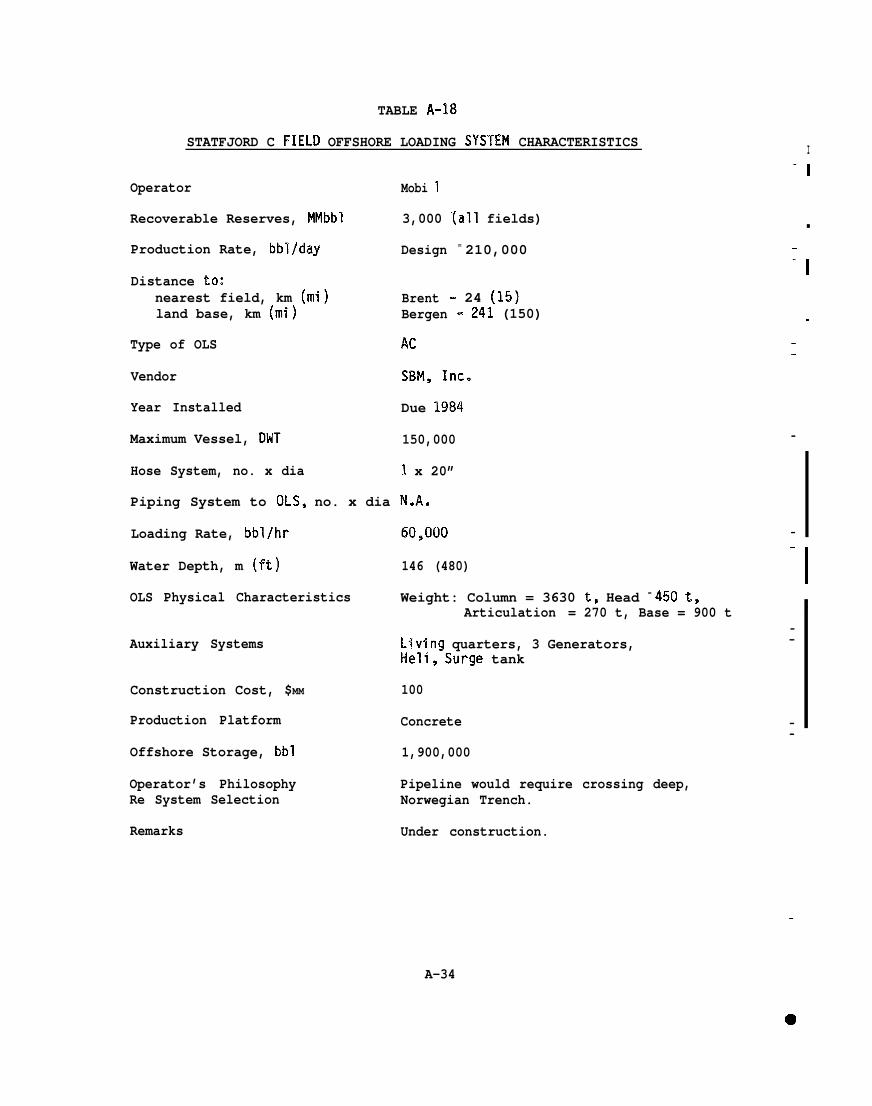
TABLE A-18
STATFJORD C FIELD OFFSHORE LOADING SYSTEM CHARACTERISTICS
Operator Mobi 1
Recoverable Reserves, MMbbl 3,000 “(all fields)
Production Rate, bbl/day Design = 210,000
Distance to:nearest field, km (mi) Brent - 24 (15)land base, km (mi) Bergen - 241 (150)
Type of OLS Ac
Vendor S13M, Inc.
Year Installed Due 1984
Maximum Vessel, DVdT 150,000 —
Hose System, no. x dia 1 x 20”
Piping System to OLS, no. x dia N.A.
Loading Rate, bbl/hr 60,000 —
Water Depth, m (ft)
OLS Physical Characteristics
Auxiliary Systems
Construction Cost, $MM
Production Platform
Offshore Storage, bbl
Operator’s PhilosophyRe System Selection
Remarks
I–1I
■
—
-!
.
——
146 (480) ‘1Weight: Column = 3630 t, Head = 450 t,
Articulation = 270 t, Base = 900 t
Living quarters, 3 Generators,——
HeIi, Surge tank
100
Concrete ——
1,900,000
Pipeline would require crossing deep,Norwegian Trench.
Under construction.
I
—
A-34
——
—
●
��
�
●
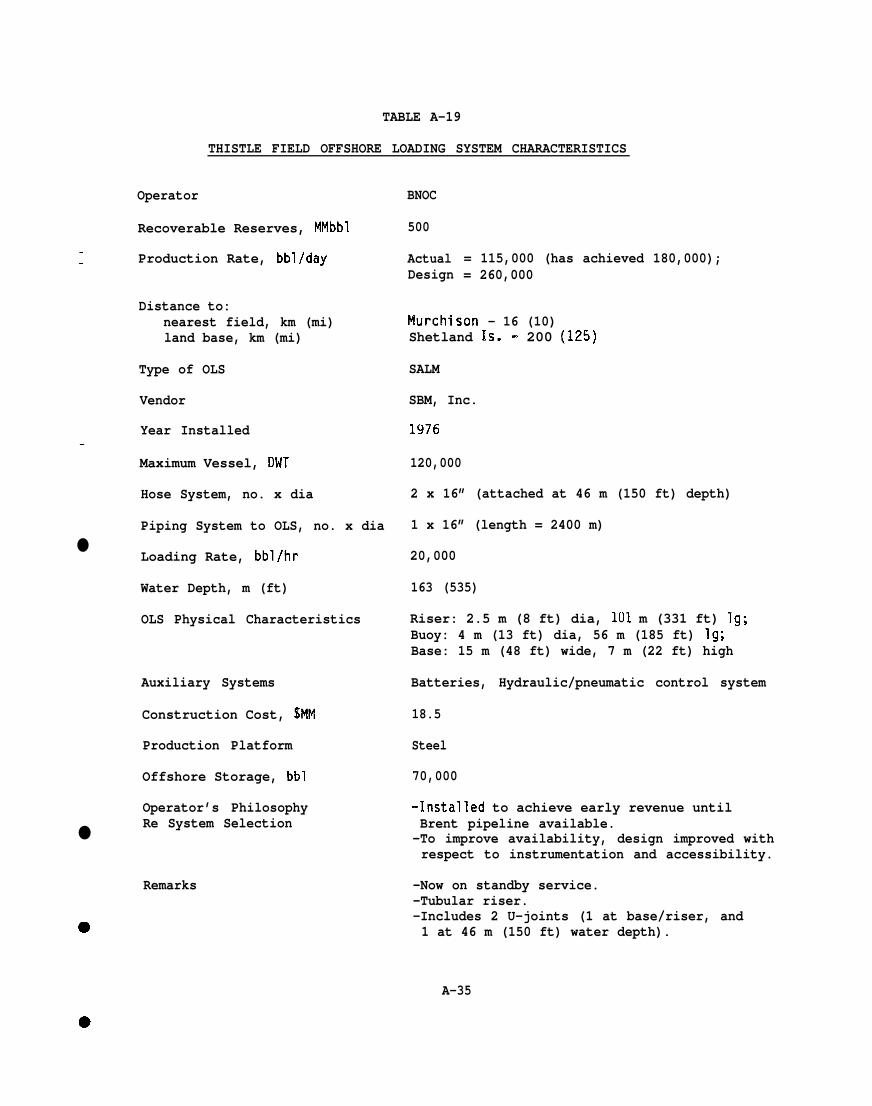
TABLE A-19
THISTLE FIELD OFFSHORE LOADING SYSTEM CHARACTERISTICS
Operator
Recoverable Reserves, MMbbl
Production Rate, bbl/day
Distance to:nearest field, km (mi)land base, km (mi)
Type of OLS
Vendor
Year Installed
Maximum Vessel, DWT
Hose System, no. x dia
Piping System to OLS, no. x dia
Loading Rate, bbl/hr
Water Depth, m (ft)
OLS Physical Characteristics
Auxiliary Systems
Construction Cost, $MM
Production Platform
Offshore Storage, bbl
Operator’s PhilosophyRe System Selection
Remarks
BNOC
500
Actual = 115,000 (has achieved 180,000);Design = 260,000
Murchison - 16 (10)Shetland 1s. - 200 (125)
SALM
SBM, Inc.
1976
120,000
2 x 16” (attached at 46 m (150 ft) depth)
1 x 16” (length = 2400 m)
20,000
163 (535)
Riser: 2.5 m (8 ft) dia, 101 m (331 ft) lg;Buoy: 4 m (13 ft) dia, 56 m (185 ft) lg;Base: 15 m (48 ft) wide, 7 m (22 ft) high
Batteries, Hydraulic/pneumatic control system
18.5
Steel
70,000
=-Installed to achieve early revenue untilBrent pipeline available.
-To improve availability, design improved withrespect to instrumentation and accessibility.
-Now on standby service.-Tubular riser.-Includes 2 U-joints (1 at base/riser, and1 at 46 m (150 ft) water depth).
A-35
A.5 PERFORMANCE OF NORTH SEA OFFSHORE LOADING SYSTEMS
There are a number of different types of offshore loading
systems operating in the North Sea and within each general type there
is a wide range of variations. Therefore, a comparison of the
performance of the various systems is extremely difficult and must be
kept. fairly general. The actual performance of a particular system
depends on a great many factors including:
e sea conditions, @ maintenance,
s water depth, @ operational procedures,
a throughput, e in
There are no locations in the North
of offshore loading system. Since no
tia- capital investment.
Sea that have more than one type
two systems are subjected to
the same conditions, comparisons between different systems at
different locations can only be on a qualitative basis.
Where information on weather downtime, downtime due to buoy
repairs, weather limitations for mooring and loading, etc.~ is
available, it is still difficult to make a reliable comparison
between the performance of different loading systems because:
@ data collection is not uniform,
o often wave data are based on imprecise visual
observations 5
-1‘1
II
-1
‘1
I–=‘ m
m
——
—
—-I
●
A-36
o some locations include storage facilities which have
a significant influence on OLS performance,
o the availability of a second OLS influences the
loading performance.
A summary of the performance of North Sea offshore loading
systems by types is presented in Table A-20. The specified operating
limitations and reported performance of each of the offshore loading—
systems evaluated are presented in Tables A-21 through A-36.
Operating history is presented in the form of reported availability
— of the OLS, with an indication of the cause of the non-availability
or downtime.
— Note that the availability and downtime indicated in Tables A-20
through A-36 are based on operators’ reports of the occasions when a
tanker was required to standby due to severe weather or maintenance
operations. Thus, periods of time when the OLS was unavailable due——
to severe weather or maintenance operations but no tanker was
standing by are not recorded as downtime. This is different than the
definition of availability and downtime used in the body of this——
report. For the optimization analyses, weather downtime is defined
as those periods of time when the weather is too severe to permit
mooring or loading operations, regardless of whether or not a tanker—
is required to wait. For maintenance downtime estimates, it has been
assumed in the body of this report that most maintenance operations
can be performed during periods of time when no tanker is scheduled●
A-37

to call and unplanned maintenance has only a small effect on overall
availability to OLS.
An evaluation of the data in Tables A-20 through A-36 leads to
the following general conclusions regarding North Sea offshore
loading system performance:
1. All offshore loading systems require substantial
maintenance. — 1—
2. Where offshore storage is provided, the offshore
loading systems can be preventively maintained to
virtually eliminate loss of production due to —
maintenance downtime.
3. As the size and cost of the offshore loading system
increases, its availability increases. —
TABLE A-20
SUMMARY OF NORTH SEA OFFSHORE LOADING SYSTEM PERFORMANCE -.
PERFORMANCE CRITERIA
—
TYPE OF OFFSHORE LOADING SYSTEM
ELSBMCALM SALM & SPAR AC ——
Operating Wave (Significant), m (ft)
Mooring 2 (6.5) 3 (10) 3 (10) 4 (13)
Loading 4 (13) 4.5 (15) 5 (16) 5.5 (18) ~
Overall Availability, % 7(I 80 85 97
Weather Downtime, % 20 10 10 2
Maintenance Downtime, % 10 10 5 1 ●
A-38
—
—
—
There is no disclosure of reservoir damage due to offshore
loading system downtime. If reservoir damage were to occur the prime
candidates would be those fields with long OLS history and no storage
to compensate for OLS unavailability. These fields are Argyll, Auk,
%uchan and Montrose. All have experienced about 25 percent downtime
due to OLS unavailability for reasons of maintenance and weather and
all have current production rates substantially below initial. Si rice
these fields are generally marginal, to what degree downtime due to
OLS unavailability is related to poor reservoir performance is
unknown. However, Amoco has recently reported that they expect the
installation of a pipeline at the Montrose Field, replacing the
existing OLS, to improve reservoir performance by increasing
recoverable reserves approximately 1.5 million barrels or
approximately 1s5 percent.
A-39
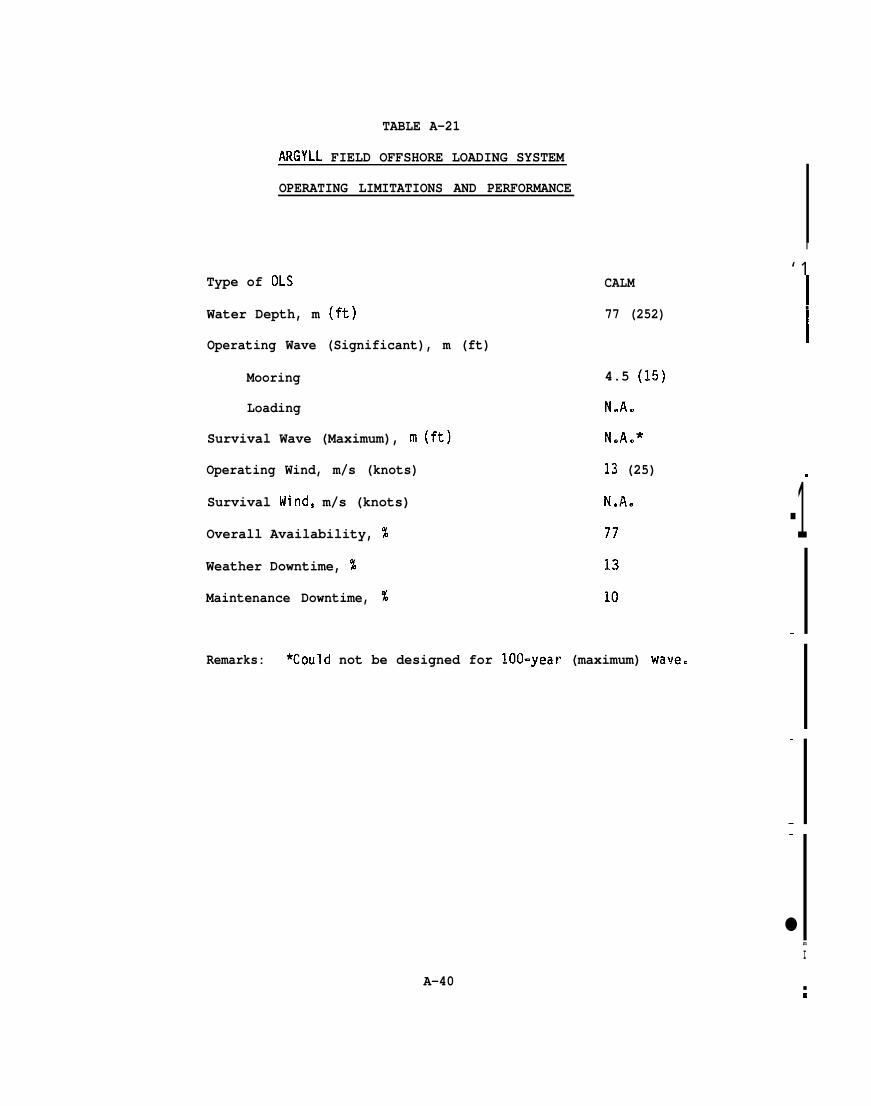
TABLE A-21
ARGYLL FIELD OFFSHORE LOADING SYSTEM
OPERATING LIMITATIONS AND PERFORMANCE
Type of OLS
Water Depth, m (ft)
Operating Wave (Significant), m (ft)
Mooring
Loading
Survival Wave (Maximum), m (ft)
Operating Wind, m/s (knots)
Survival Wind, m/s (knots)
Overall Availability, %
Weather Downtime, %
Maintenance Downtime, %
CALM
77 (252)
4.5 (15)
NeA.
NOA,*
13 (25)
N.A.
77
13
10
Remarks: *Coulcl not be designed for 100-year (maximum) wave.
I
‘ 1
I■
I
.
-1.
—
.—
●m
I
A-40■
m
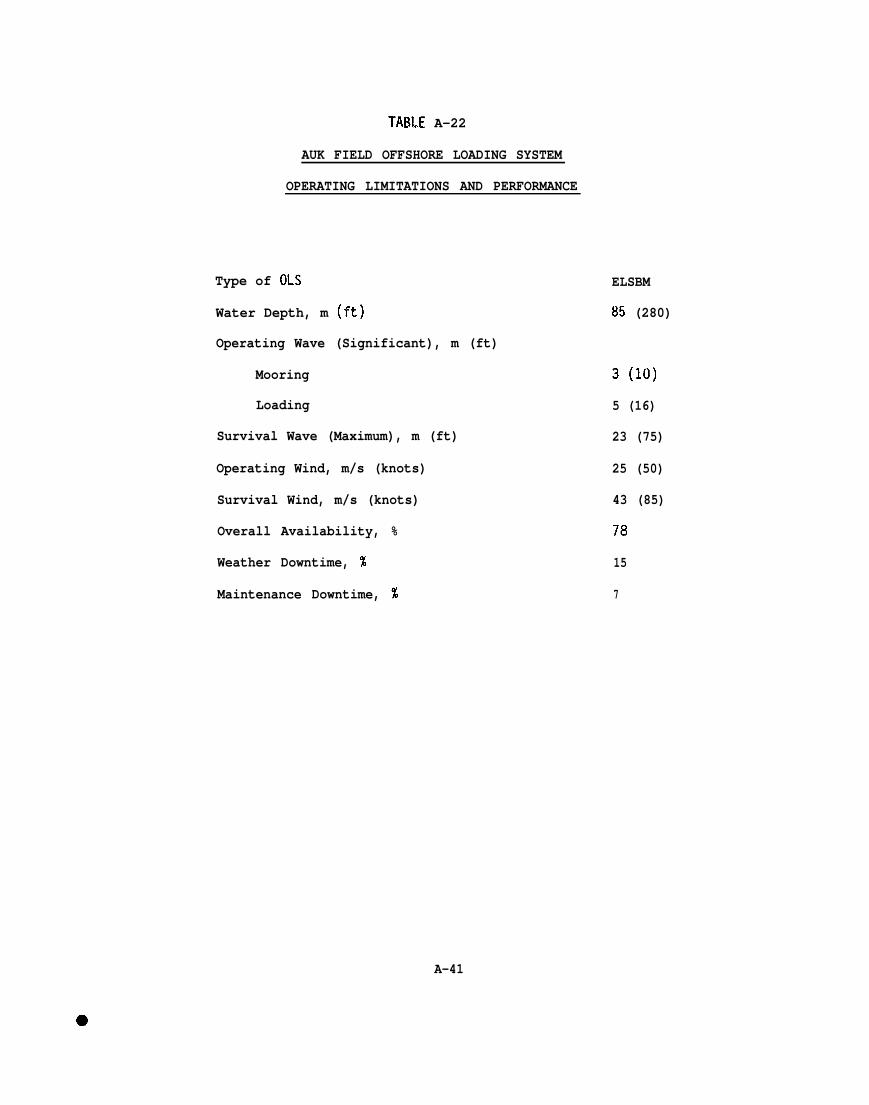
TABLE A-22
AUK FIELD OFFSHORE LOADING SYSTEM
OPERATING LIMITATIONS AND PERFORMANCE
Type of 01..S
Water Depth, m (ft)
Operating Wave (Significant), m (ft)
Mooring
Loading
Survival Wave (Maximum), m (ft)
Operating Wind, m/s (knots)
Survival Wind, m/s (knots)
Overall Availability, %
Weather Downtime, %
Maintenance Downtime, %
A-41
ELSBM
85 (280)
3 (10)
5 (16)
23 (75)
25 (50)
43 (85)
78
15
7
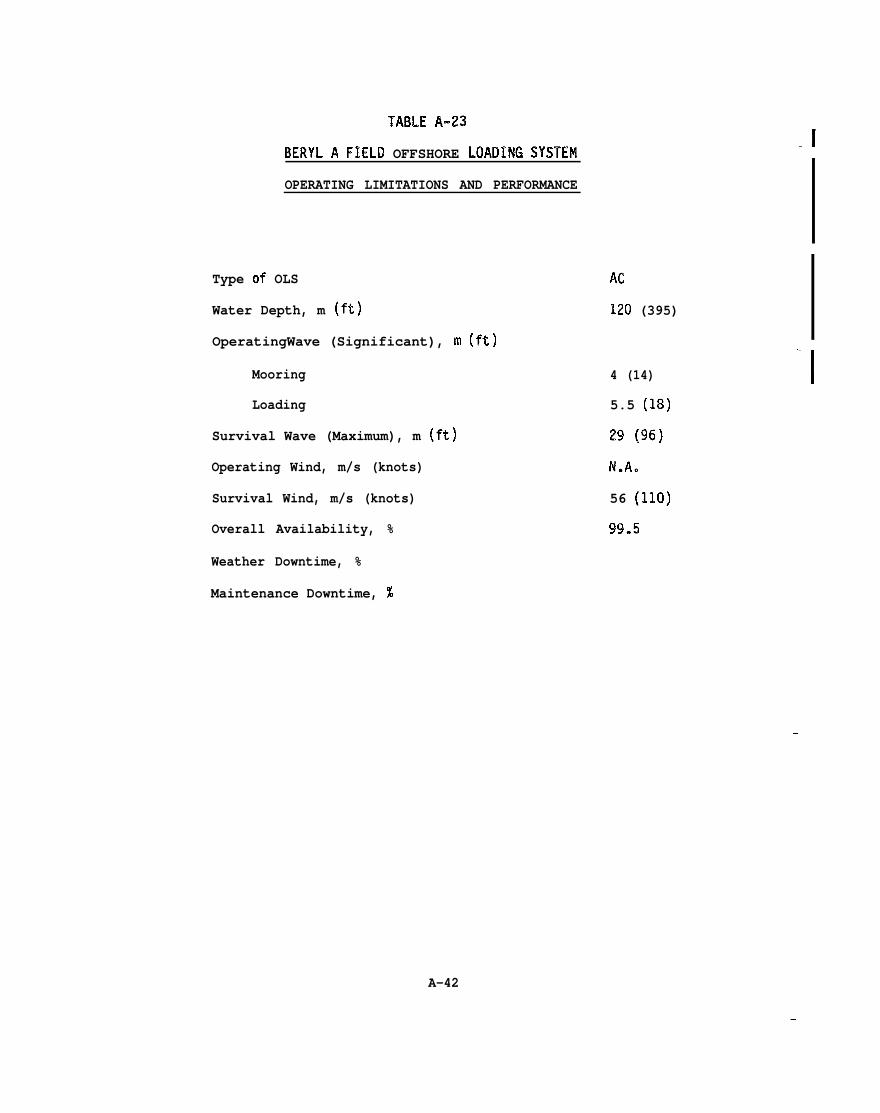
TABLE A-23
BERYL A FIELD OFFSHORE LOADING SYSTEM
OPERATING LIMITATIONS AND PERFORMANCE
Type Of OLS
Water Depth, m (ft)
OperatingWave (Significant), m (ft)
Mooring
Loading
Survival Wave (Maximum), m (ft)
Operating Wind, m/s (knots)
Survival Wind, m/s (knots)
Overall Availability, %
Weather Downtime, %
Maintenance Downtime, %
M
120 (395)
4 (14)
5.5 (18)
29 (96)
N.Ao
56 (110)
9!3.5
-1
—
—
—
—
A-42
—
‘1
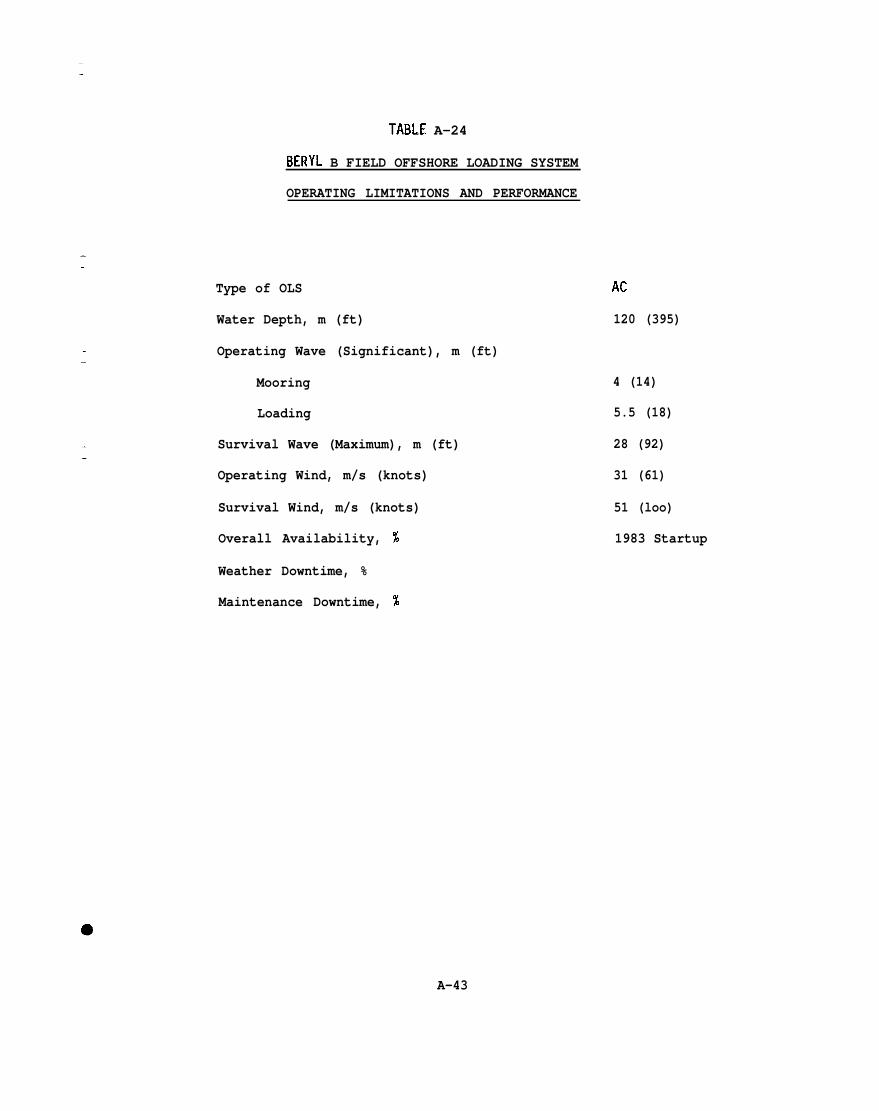
TABLE A-24
BERYL B FIELD OFFSHORE LOADING SYSTEM
OPERATING LIMITATIONS AND PERFORMANCE
Type of OLS
Water Depth, m (ft)
Operating Wave (Significant), m (ft)
Mooring
Loading
Survival Wave (Maximum), m (ft)
Operating Wind, m/s (knots)
Survival Wind, m/s (knots)
Overall Availability, %
Weather Downtime, %
Maintenance Downtime, %
Ac
120 (395)
4 (14)
5.5 (18)
28 (92)
31 (61)
51 (loo)
1983 Startup
A-43
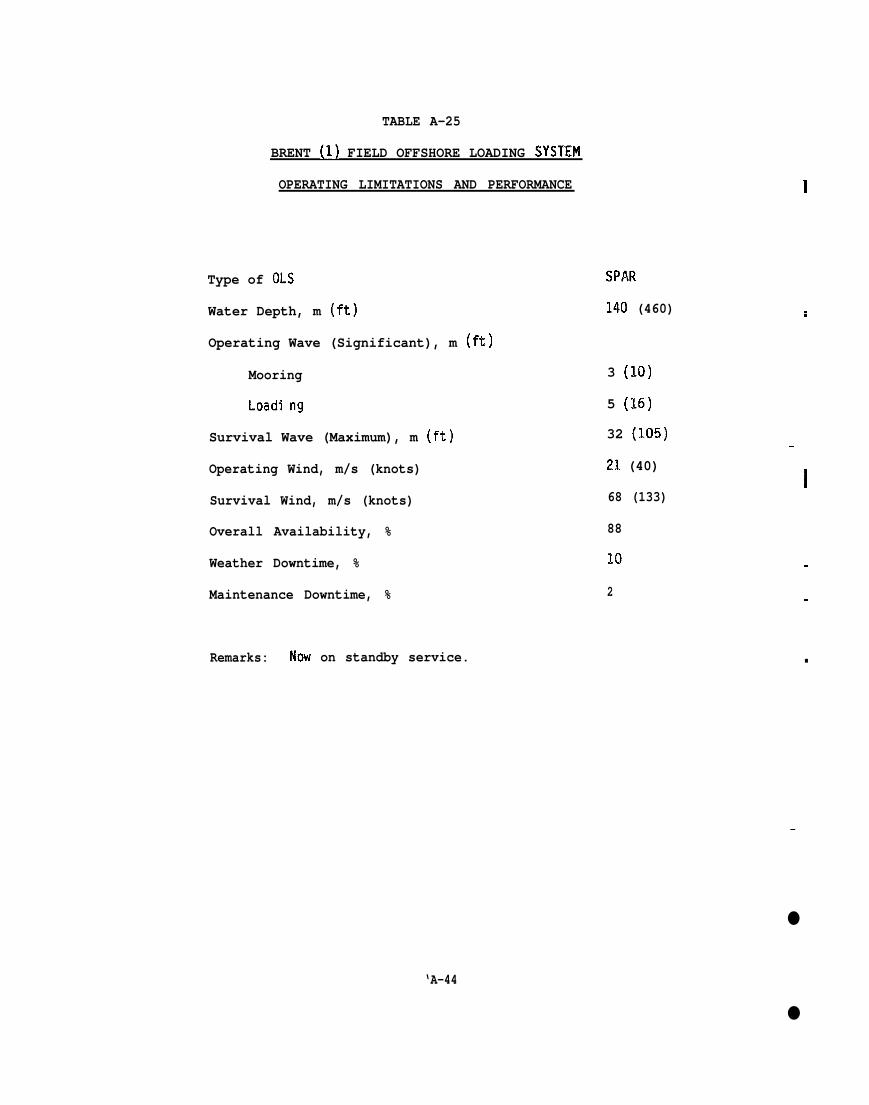
TABLE A-25
BRENT (1) FIELD OFFSHORE LOADING SYSTEM
OPERATING LIMITATIONS AND PERFORMANCE
Type of OLS
Water Depth, m (ft)
Operating Wave (Significant), m (ft)
Mooring
L.oadi ng
Survival Wave (Maximum), m (ft)
Operating Wind, m/s (knots)
Survival Wind, m/s (knots)
Overall Availability, %
Weather Downtime, %
Maintenance Downtime, %
Remarks: Now on standby service.
SPAR
140 (460)
3 (10)
5 (16)
32 (105)
21 (40)
68 (133)
88
10
2
I
:
—
i
.
.
■
‘A-44
—
●
●
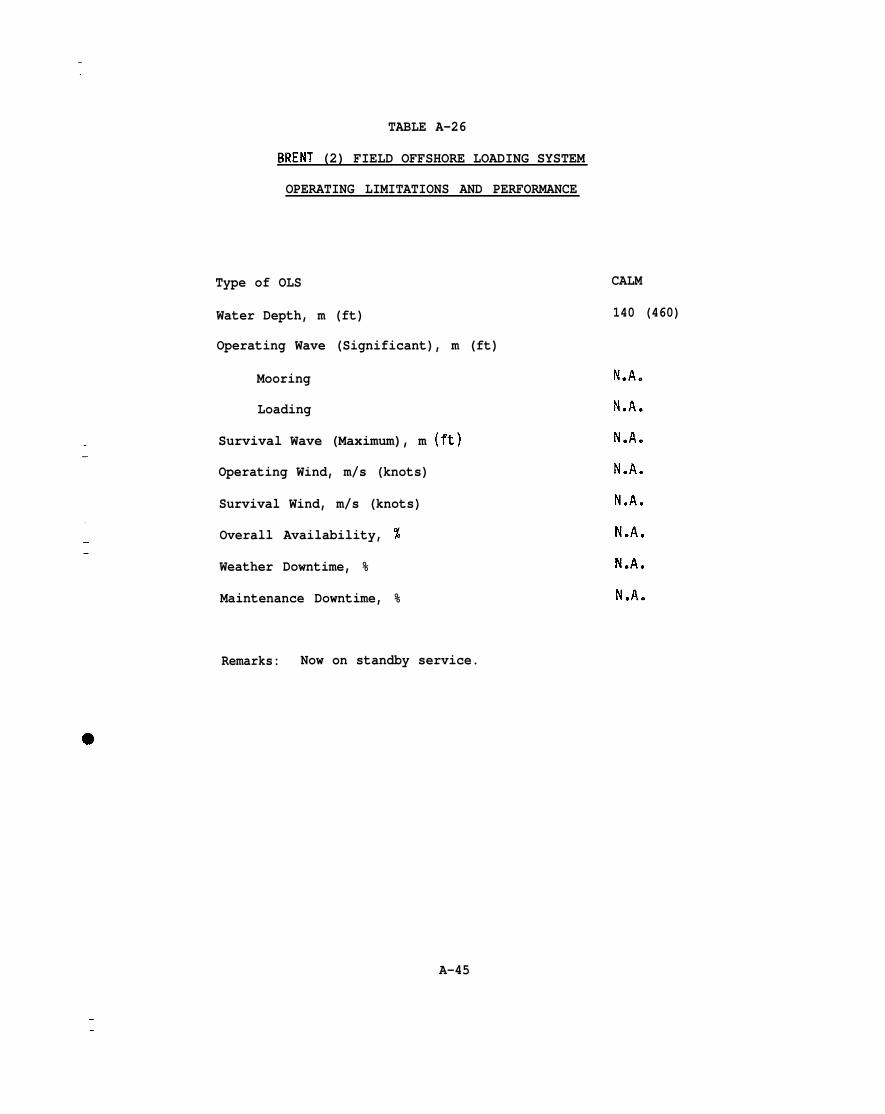
TABLE A-26
BRENT (2) FIELD OFFSHORE LOADING SYSTEM
OPERATING LIMITATIONS AND PERFORMANCE
Type of OLS
Water Depth, m (ft)
Operating Wave (Significant), m (ft)
Mooring
Loading
Survival Wave (Maximum), m (ft)
Operating Wind, m/s (knots)
Survival Wind, m/s (knots)
Overall Availability, %
Weather Downtime, %
Maintenance Downtime, %
CALM
140 (460)
N,A.
N.A.
N.A.
N.A.
N.A.
N.A.
N.A.
N.A.
Remarks: Now on standby service.
A-45
——
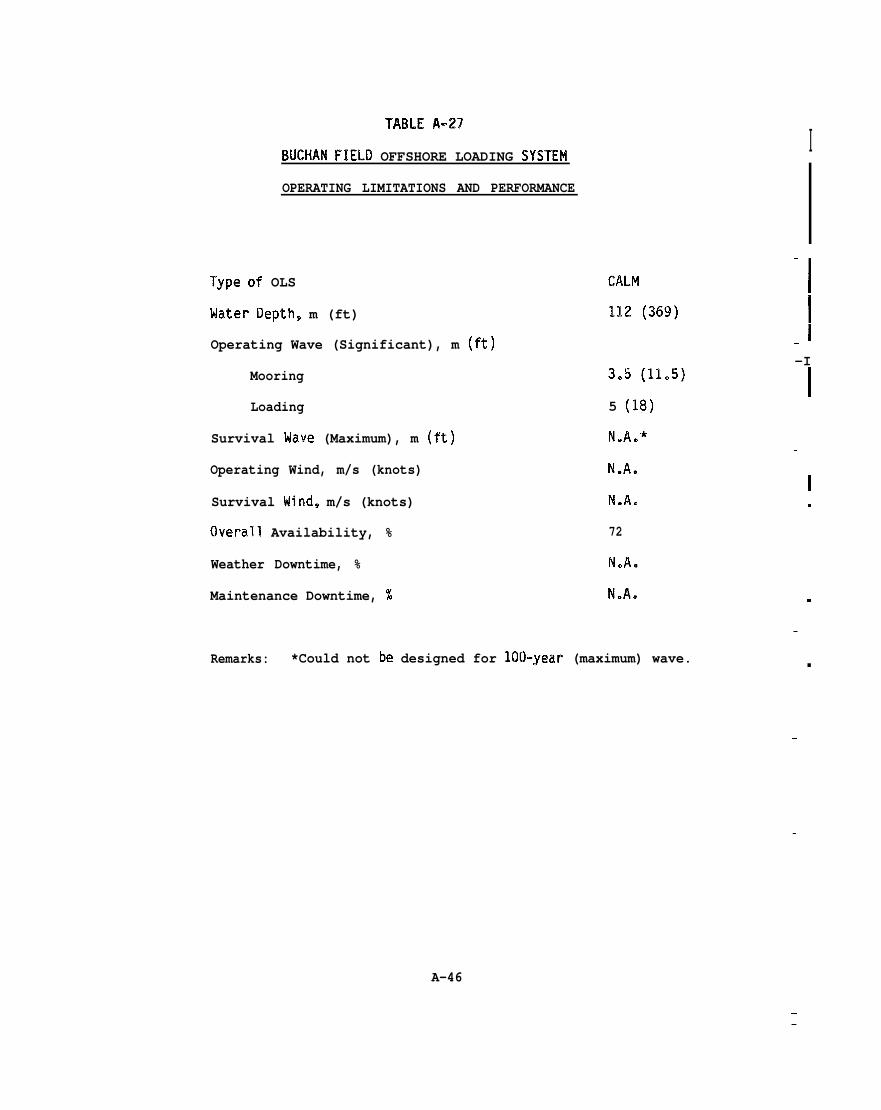
TABLE A-=27
BUCHAN FIELD OFFSHORE LOADING SYSTEM
OPERATING LIMITATIONS AND PERFORMANCE
Type of OLS
Mater Depth, m (ft)
Operating Wave (Significant), m (f%)
Mooring
Loading
Survival Wave (Maximum), m (ft)
Operating Wind, m/s (knots)
Survival Wind, m/s (knots)
Overall Availability, %
Weather Downtime, %
Maintenance Downtime, %
CALPI
112 (369)
3.5 (11.5)
5 (18)
N.A.*
N.A.
Nell.
72
N.A.
N.A.
Remarks: *Could not be designed for 100-year (maximum) wave.
I
‘1.I
I_l-I
I—
I.
.
.
■
—
—
A-46
——

TABLE A-28
EKOFISK (1) FIELD OFFSHORE LOADING SYSTEM
OPERATING LIMITATIONS AND PERFORMANCE
Type of OLS
Water Depth, m (ft)
Operating Wave (Significant), m (ft)
Mooring
Loading
Survival Wave (Maximum), m (ft)
Operating Wind, m/s (knots)
Survival Wind, m/s (knots)
Overall Availability, %
Weather Downtime, %
Maintenance Downtime, %
CALM
71 (232)
N.IA.
N.A.
N.A.*
N.A.
N.A.
60
N.A.
N.A.
Remarks: *Could not be designed for 100-year (maximum) wave.
Now on standby service.
A-47
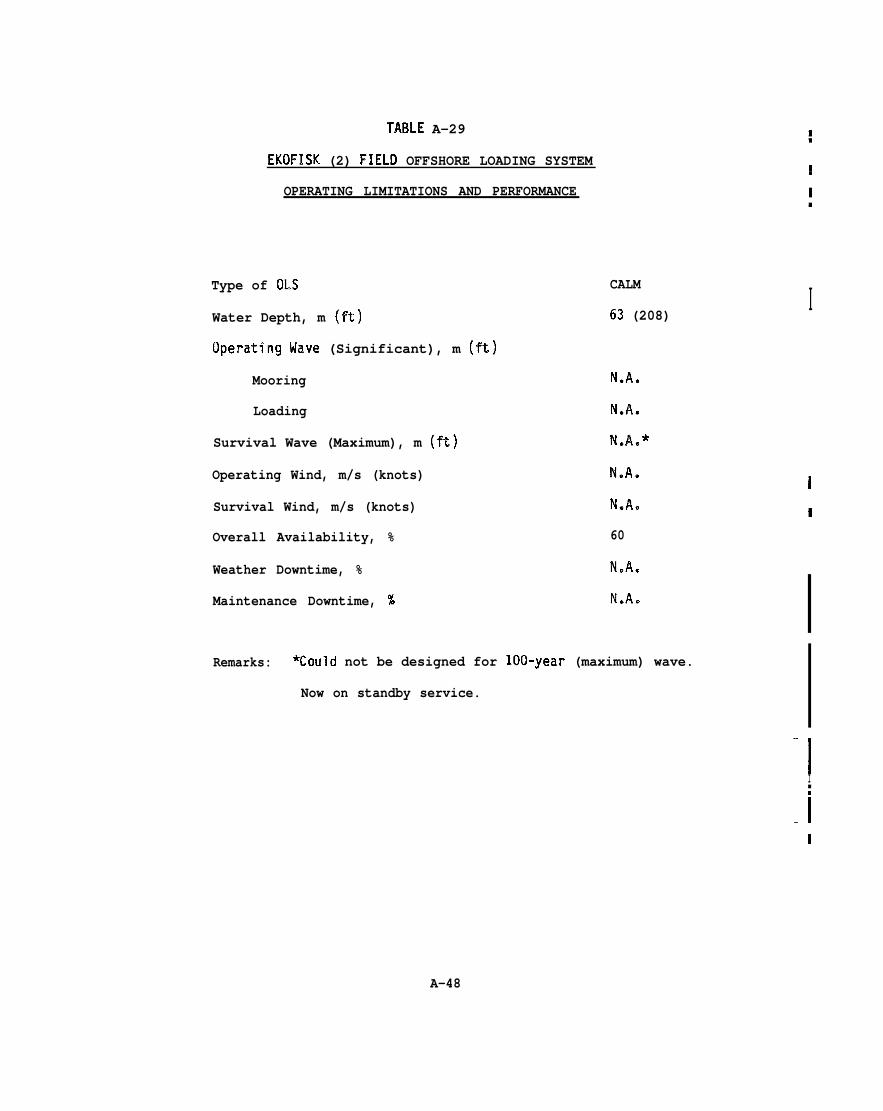
TABLE A-29
EKOFISK (2) FIELD OFFSHORE LOADING SYSTEM
OPERATING LIMITATIONS AND PERFORMANCE
Type of OLS
Water Depth, m (ft)
Operating klave (Significant), m (ft)
Mooring
Loading
Survival Wave (Maximum), m (ft)
Operating Wind, m/s (knots)
Survival Wind, m/s (knots)
Overall Availability, %
Weather Downtime, %
Maintenance Downtime, %
CALM
63 (208)
N*A.
N.A.
N.A.*
N.A.
N.A.
60
Nell.
N.A.
-!
I
—
i
I
Remarks: *Could not be designed for 100-year (maximum) wave.
Now on standby service.
‘1I■
n
-1I
A-48
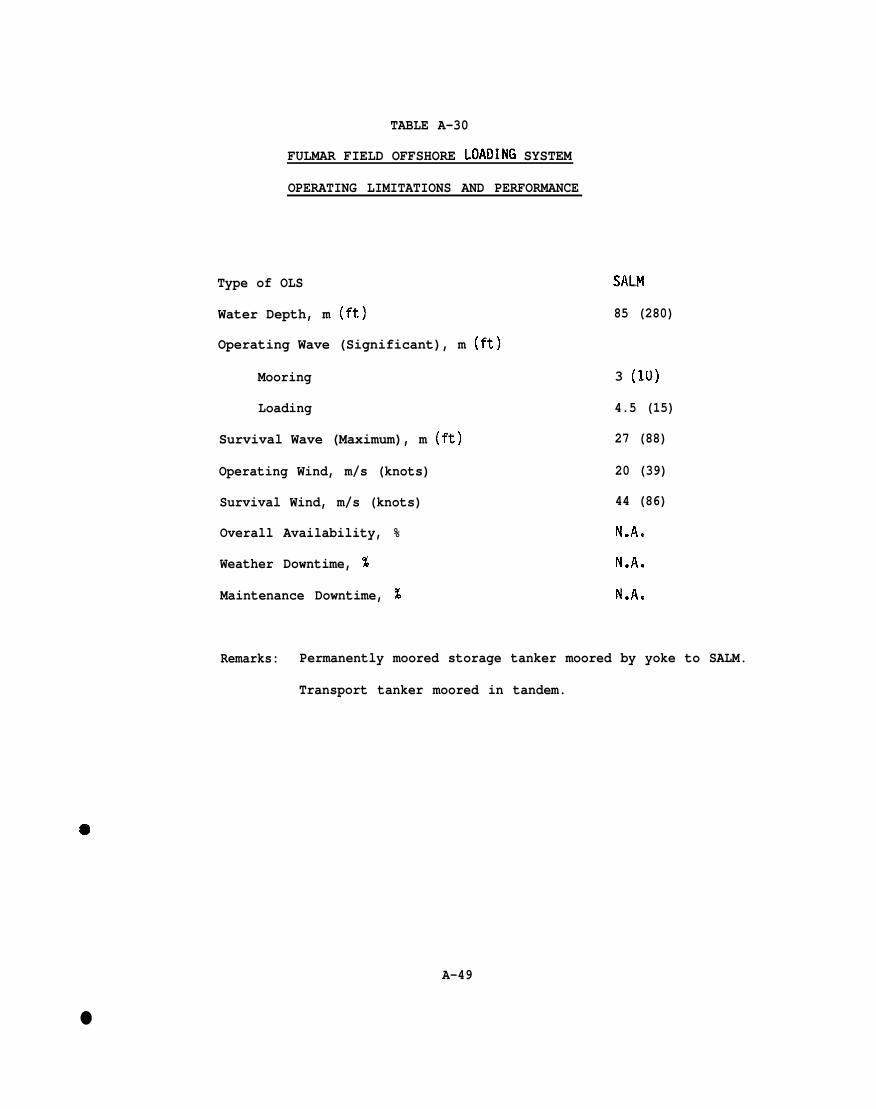
TABLE A-30
FULMAR FIELD OFFSHORE LOADItIIG SYSTEM
OPERATING LIMITATIONS AND PERFORMANCE
Type of OLS
Water Depth, m (ft)
Operating Wave (Significant), m (ft)
Mooring
Loading
Survival Wave (Maximum), m (ft)
Operating Wind, m/s (knots)
Survival Wind, m/s (knots)
Overall Availability, %
Weather Downtime, %
Maintenance Downtime, %
SALM
85 (280)
3 (10)
4.5 (15)
27 (88)
20 (39)
44 (86)
N.A.
N.A.
N*A.
Remarks: Permanently moored storage tanker moored by yoke to SALM.
Transport tanker moored in tandem.
9
A-49
●
.
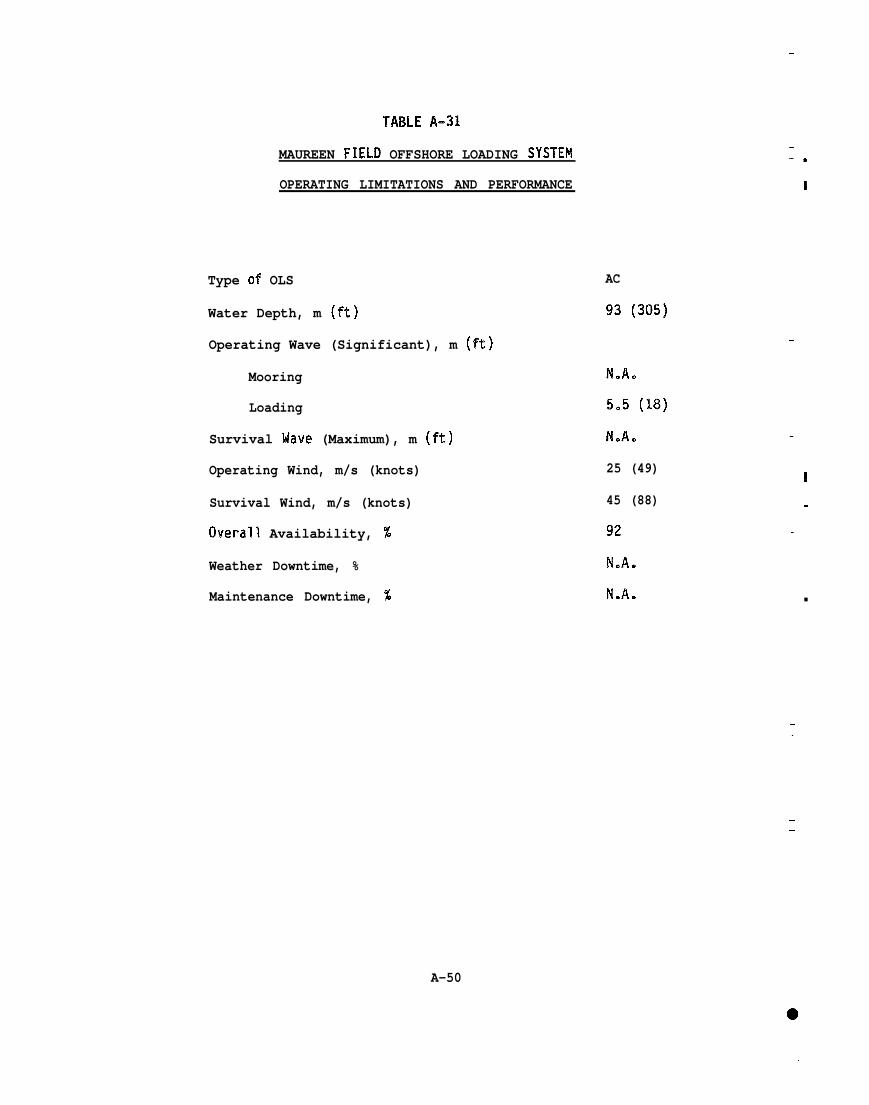
TABLE A-31
MAUREEN FIELD OFFSHORE LOADING SYSTEM
OPERATING LIMITATIONS AND PERFORMANCE
Type of OLS
Water Depth, m (ft)
Operating Wave (Significant), m (ft)
Mooring
Loading
Survival Wave (Maximum), m (ft)
Operating Wind, m/s (knots)
Survival Wind, m/s (knots)
Overall Availability, %
Weather Downtime, %
Maintenance Downtime, %
.—,
——
AC
93 (305)——
N.Ae
5.5 (18)
N.A.
25 (49)
45 (88)
!32
N.A.
Neil.
I
—
.
—
■
—
——
——
A-50

.
TABLE A-32
MONTROSE FIELD OFFSHORE LOADING SYSTEM
OPERATING LIMITATIONS AND PERFORMANCE
—
——
Type of 01S
Water Depth, m (ft)
Operating Wave (Significant), m (ft)
Mooring
Loading
Survival Wave (Maximum), m (ft)
Operating Wind, m/s (knots)
Survival Wind, m/s (knots)
Overall Availability, %
Weather Downtime, %
Maintenance Downtime, %
(2) CALM’s
93 (304)
1.5 (5)
4 (13)
N-A**
25 (49)
45 (88)
76
18
6
——
Remarks: *Could not be designed for 100-year (maximum) wave.
. To be replaced by pipeline to Forties Field in 1985.
A-51
—
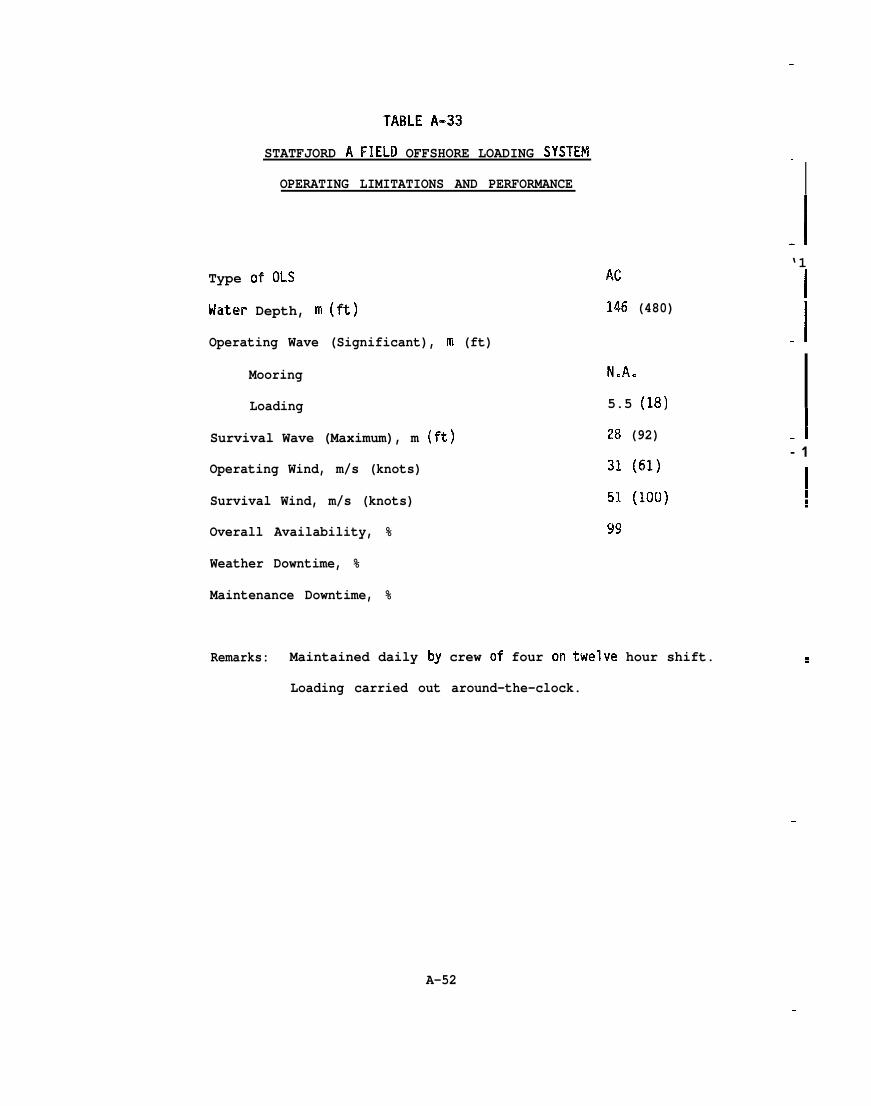
TABLE A-33
STATFJORD A FIELD OFFSHORE LOADING SYSTEM
OPERATING LIMITATIONS AND PERFORMANCE
Type of OLS
Water Depth, m (ft)
Operating Wave (Significant), m (ft)
Mooring
Loading
Survival Wave (Maximum), m (ft)
Operating Wind, m/s (knots)
Survival Wind, m/s (knots)
Overall Availability, %
Weather Downtime, %
Maintenance Downtime, %
AC
146 (480)
N.A.a
5.5 (18)
28 (92)
31 (619
51 (100)
99
Remarks: Maintained daily by crew of four on twelve hour shift.
Loading carried out around-the-clock.
—
I-1
‘1
I-1
-1- 1
:
——
A-52
——
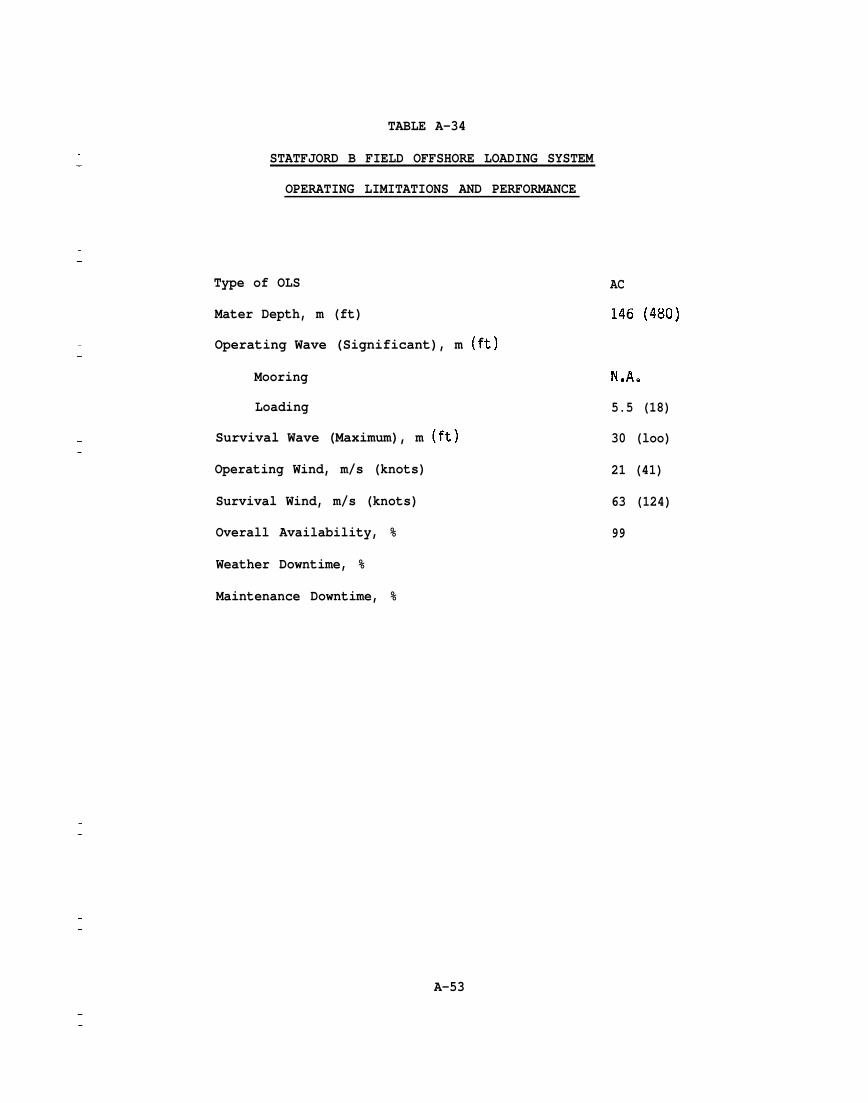
TABLE A-34
STATFJORD B FIELD OFFSHORE LOADING SYSTEM
OPERATING LIMITATIONS AND PERFORMANCE
Type of OLS
Mater Depth, m (ft)
Operating Wave (Significant), m (ft)
Mooring
Loading
Survival Wave (Maximum), m (ft)
Operating Wind, m/s (knots)
Survival Wind, m/s (knots)
Overall Availability, %
Weather Downtime, %
Maintenance Downtime, %
A-53
AC
146 (480)
N*A.
5.5 (18)
30 (loo)
21 (41)
63 (124)
99
—
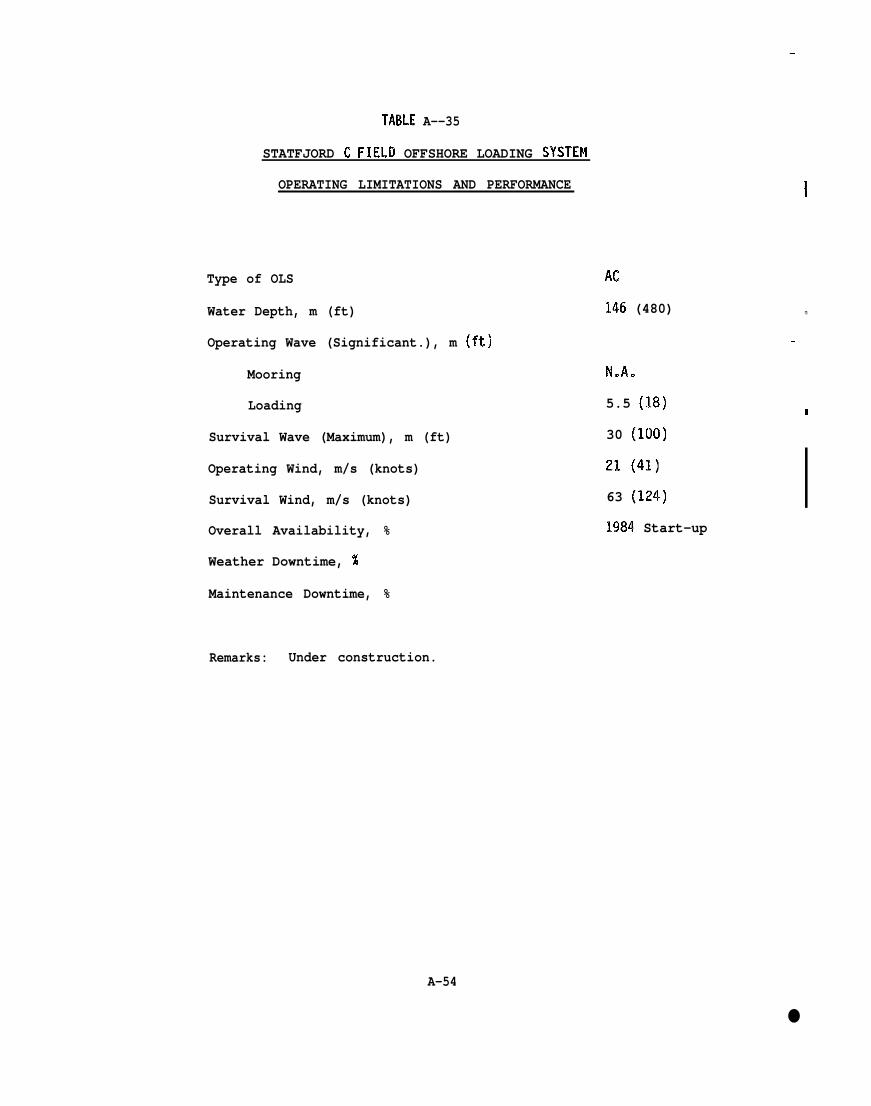
TABLE A--35
STATFJORD C FIELD OFFSHORE LOADING SYSTEM
OPERATING LIMITATIONS AND PERFORMANCE
Type of OLS
Water Depth, m (ft)
Operating Wave (Significant.), m (ft)
Mooring
Loading
Survival Wave (Maximum), m (ft)
Operating Wind, m/s (knots)
Survival Wind, m/s (knots)
Overall Availability, %
Weather Downtime, %
Maintenance Downtime, %
AC
146 (480)
N.A.
5.5 (18)
30 (100)
21 (41)
63 (124)
1984 Start-up
—
I
m
I
Remarks: Under construction.
A-54
●
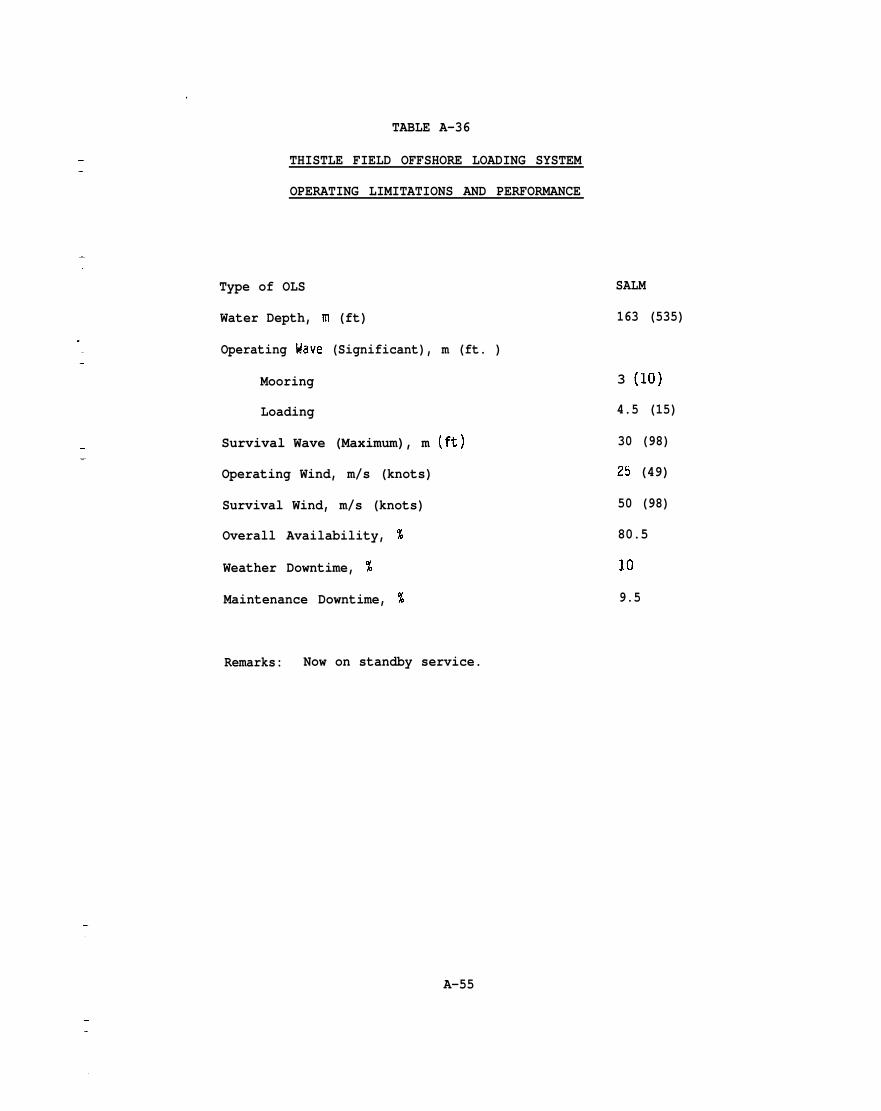
TABLE A-36
THISTLE FIELD OFFSHORE LOADING SYSTEM
OPERATING LIMITATIONS AND PERFORMANCE
Type of OLS
Water Depth, m (ft)
Operating Wave (Significant), m (ft. )
Mooring
Loading
Survival Wave (Maximum), m (ft)
Operating Wind, m/s (knots)
Survival Wind, m/s (knots)
Overall Availability, %
Weather Downtime, %
Maintenance Downtime, %
Remarks: Now on standby service.
A-55
SALM
163 (535)
3 (10)
4.5 (15)
30 (98)
25 (49)
50 (98)
80.5
10
9.5
A.5.I General Offshore Loading System Maintenance Problems
In general, North Sea offshore loading system operating and
maintenance problems can be characterized, from the sea floor upward,
as follows:
a) PLEM/Riser Connection
Leaks have occurred where the pipeline end manifold (PLEM)
connects with the riser to the offshore loading system, particularly
where the subsea product line from the production facility has been
hard piped to the fluid riser at the universal joint of articulated
columns. Failing successful seal repairs, bypass hoses have been
ifistalled successfully.
b)
associated
Underbuoy and Floating Hoses
One of the most
with the hoses,
common offshore loading system problems is
both underbuoy and floating hoses. Due to
wave action, improper handling and inadequate materials, the hoses
have kinked, twisted, deteriorated and failed at the connections. As
a result, many operating companies have advanced their maintenance
programs to replace the hoses at regular periods, regardless of
condition, rather than risk failure with consequent interrupted
loading operations. Also, hose technology has advanced considerably.
Concerned oil companies have formed a user’s organization which, in
A-56
—
. I
‘1II-i—
—
I-1-I
I:
— I
—
——
——
association with regulatory
— hose materials, construction,
——
—
agencies, has established standards for
manufacturing, and quality control.
Operators of large, costly facilities have chosen to avoid
most of the floating hose problems associated with long term hose
residence in the sea. by using the articulated column and the ELSBM.
One operator has concluded that hose life can be extended by allowing
it to simply hang about 9 m (30 ft) into the water from the
articulated column boom rather than transfer it from the boom to the
loading tanker and back after each loading. Designers of the Thistle
Field SALM chose to keep the hose totally submerged to avoid wave
action. The hose is connected to the buoy at a depth of 52 m (170
ft), hangs to 107 m (350 ft) deep and, when not loading, terminates
15 m (50 ft) below the surface.
c) Bearings
The proper selection, design and maintenance of bearings
for offshore loading systems is critical to the successful operation
of these systems. In most systems that incorporate large bearings, a
bearing failure can lead to long shutdown periods and extremely
costly repairs. Preventing seawater access to roller bearings is an
extremely important consideration in the design of bearings and their’
supporting structures. This is normally achieved by providing water
barriers on the structure, by provjding the bearings with integral
seals or by a combination of these methods.
A-57
Proper maintenance is essential in order for roller
bearings to have a reasonable service life in the marine environment.
Maintenance generally consists of lubricating the bearings on a
regular basis. The recommended interval between lubrications varies
“ depending on the manufacturer, operator and degree of exposure.
Typically, the interval used is between one week and one month.
d) Fluid Swivels
All single point mooring systems contain fluid swivels to
permit the tanker to rotate about the mooring and all fluid swivels
require maintenance and occasional overhaul. The location,
arrangement and details of the fluid swivel assembly in the different
types of mooring systems varies considerably. CALM’S and some types
of articulated column moorings utilize non-submerged fluid swivels
while SALM’S and some other types of articulated column moorings
utilize submerged fluid swivels.
The main difference between
submerged swivels is that the submerged
external seawater seals and two internal
the submerged and non-
swivels normally have two
crude oil or product seals
while the non-submerged swivels have only one external seal and two
internal seals. Problems that do occur with fluid swivels usually
involve the seals.
‘1I. I—
‘1
I——I
I●
A-5S
—
e) Hawsers
—
—
The SPM hawser consists of a synthetic rope spliced to
form an endless strop or with splices at each end. Hawsers are a
particularly vulnerable portion of most offshore loading facilities
because they usually float free when not in use and are subjected to
extremely high loading when a ship is moored. Consequently, the two
main problems are abrasion and fatigue. At present, these problems
cannot be eliminated but they can be minimized by proper selection of
hawser materials, proper design of hawser connection and support
details, and proper operation of the OLS to eliminate overloading of
the hawser.
There are no established rules for hawser replacement.
Research is being carried out to develop a relationship among number
of load cycles, magnitude of load and remaining useful life of
hawsers. Of course, for such a development to be useful it would be
necessary to install load-monitoring equipment on the OLS. In
addition to predicting hawser useful life, the use of a load-
monitoring system will decrease the probability of overloading the
hawser and of a hawser failure by keeping the vessel’s master aware
of the load level in the hawser. There are several load-monitoring
systems available and in use in the North Sea but their use is by no
means universal. The present practice of OLS terminal operators
regarding hawser replacement varies greatly. Some North Sea
terminals retire hawsers after only one month of service while other
terminals utilize a hawser for three months or more.
A-59
A.5.2 Specific Instances of Offshore Loading System Problem I
- 1:The following discussion of North Sea offshore loading system I
problems is based on interviews with representatives of manufacturers I
of offshore loading systems and oil companies, published articles and-1
the authors’ experience. It is by no
all problems that have occurred but
diversity of problems that can occur.
means a complete evaluation of z
is provided to illustrate the m
No conclusions should be drawn —
reqarding the quality of a particular type of mooring or of the!
moori ng of a particular manufacturer. The number of OLSS designed 9
and installed by each manufacturer varies greatly so the absolute
number of specific problems discussed below provides no information !
regarding the percentage of successful versus unsuccessful systems ofI
a particular manufacturer. Also, and more importantly, the
philosophy of the various manufacturers and oil companies regarding
publicizing problems which their systems have encountered varies
greatly. Some are quite willing to volunteer this type of
information while others will only provide limited replies to
specific questions.
a) Argyll Field
The Argyll Field CALM experienced problems with the buoy
turntable. The mooring was taken out of service and the buoy was
taken to shore for repair of the main bearing.
-I
—
——
m
m
I!-60
‘1
b) Auk Field
The Auk Field’s Exposed Location Single Buoy Mooring (ELSBM)
started tanker loading operations in January 1976. During the first
year of operation the downtime due to buoy repairs was high. These
breakdowns were mainly due to mooring rope failures, which also
caused damage to the counterweight arrangements and to reel hoses.
To improve operational efficiency some minor modificat’
to the original ELSBM concept were introduced (Versluis 1980).
hydraulic brakes of ropes and hose reel are now activated after
ons
The
the
tanker mooring operation is finishe~. In the case of a mooring rope
failure the counterweight system is no longer subject to failure.
The introduction of a weak link in the reel hose eliminated damage to
the reel hose in the case of a mooring rope failure. Also, to
minimize mooring rope failures, the mooring hawser is changed every
four weeks.
Although the buoy has been designed for a maximum mooring
load of 180 tonnes, loading is stopped and the hose is disconnected
if the hawser tension, which is constantly monitored and recorded,
reaches 70 tonnes. If hawser tension reaches 90 tonnes, the tanker
departs from the buoy.
Downtime due to buoy repairs have been
the above measures. However, due to limitat”
nearly eliminated by
ons in the allowable
A.-61
——
mooring load, the yearly weather downtime is approximately 15 percent
(Versluis 1980].
The Beryl “A” articulated column had an initial design
provision for the hose to be stored in a catenary configuration
suspended between the boom tip and t-he hawser fairlead with the
hawser in the retrieved position. The hose strings required
extremely frequent replacement, probably because the arrangement of
storing the loading hose in the catenary configuration created severe
fatigue loadings on the hose string. The problem was solved by
allowing the hose string to hang vertically from the boom tip, with
the lower end submerged in the sea, thus damping the hose movement.
The boom had to be reinforced to accommodate this new hose
configuration.
d) Buchan Field
In its first year of operation the Buchan CALM experienced
premature wear of the mooring hawser chafe chain links where the
chain rubs on the tanker bow apron. Also, the weak link bolts in the
loading hose end stretched. At about the same time a failure of the
weak link shackle on the mooring hawser occurred due to fatigue
cracking at a load of 30 tonnes (design breaking load was 270
tonnes). This resulted in the parting of the weak link bolts in the
.
‘1I
-1- I
‘1Ii
–9
II
A-62
—1
.
I
■
1-!
■
loading hose end
of the system.
unit. Pollution was minimized by automatic shutdown
—
—
—
Following another crack in the weak link shackle, the
shackle was redesigned and has not failed since. However, the hawser
parted at 110 tonnes versus its upgraded design breaking load of 490
tonnes. Two weeks later the hawser parted again at about lZO tonnes.
The hawser became entangled with a CALM mooring chain and had to be
cut free. For reinstallation a stellite coated chafe chain was used
to obtain longer wear. Chafe chain Iifewas doubled but it was still
susceptible to wearing against the tanker bow. The weak link bolts
in the hose end unit were replaced with bolts of a different material
and stretching has not recurred.
Recurring maintenance problems with the buoy, including a
jammed turntable, have also been reported.
e) Maureen Field
The Maureen Field articulated column has reportedly had
trouble retrieving hoses due to the angle of the tanker bow slot.
The configuration was revised to solve the problem.
f) Montrose Field
During the first three years of operations with the Montrose
A-63
CALMS, there were a number of problems which resulted in downtime
(Fairbrother 1979). The two components requiring major repairs were
the floating hose and the mooring hawser. Since there are two buoys,
downtime incurred due to repairs is significantly reduced because
regular preventive maintenance can be carried out on the
A total of approximately eleven mooring ropes
vacant. buoy.
are used for
the buoys each year. This is, in part, because the rope is provided
with small buoy-type floats to keep the rope afloat when no tanker is
moored. These are frequently lost, which causes the rope to dip
below the surface, where it can become tangled with the anchor
chains. Also, during the first three years of operation, three
mooring ropes parted.
A common problem with the floating hose string is the
tangling of the hose and hawser messenger ropes, which prevents
mooring until they are untangled. Since repairs on the hoses and
hawsers require work offshore they are very sensitive to weather, and
an average 3.5 percent downtime has been incurred due to waiting on
weather to effect repairs.
Three major equipment failures have been experienced at
Montrose (Fairbrother 1979). First a manhole cover worked loose and
a buoyancy tank flooded. A derrick barge levelled the buoy, pumped
out the tank and tightened the cover. Then two mooring chains
parted, both due to a Kenter link (which is used to join the shots of
_l– 1
I
-1— m
III1
— I‘1
_ln
!
‘11—
-1-1
I● ’:
III
A-64:
chain together) coming apart. Both links were in the thrash zone
where the chain first contacts the seabed, the chain motion having
caused the link to vibrate apart. .This was despite the provision of
a lead plug and a welded plate over the Kenter link pin to prevent
— this. The discovery of a fatigue crack in a flange on the vertical
product pipe from the buoy turntable, located in the splash zone, put
one of the buoys completely out of service.
Early problems were encountered with the expansion joint on
the buoy plpework which had a tendency to invert on the vacant buoy
due to vacuum formation. This was countered by use of reinforced—
joints and maintenance of a small positive pressure on the line.
The operator is in the process of installing a pipeline to
replace the two CALMS. The pipeline will be operational in 1985.
g) Thistle Field
The Thistle SALM was placed on standby in 1978 when the
pipeline to shore
of the system was
universal joint.
disengage, leaving the buoy connected to the riser only by the cargo
jumper hoses. While the buoy was being removed for repairs, the
riser system was damaged and as a result also had to be removed for
repairs. The failure was probably caused
was commissioned. While on standby, the buoyancy
reduced enough to remove tension from the upper
This allowed a joint pin to become loose and
by the fact that while on
A-65
standby service, the SALM was apparently unattended for several
months and water leaked into the buoy from a valve at the end of the
hose and via a small leak in an expansion joint inside the buoy.
Although the Thistle SAL-M buoy was designed to retain positive
buoyancy with any two compartments flooded, valves between
compartments were inadvertently left open, allowing three .
compartments to flood.
I
‘1.-1
A-66
——
—
A.6 NORTH SEA OFFSHORE LOADING SYSTEM CONSTRUCTION SCHEDULE
—
The four-year program for the design, fabrication and
installation of the Fulmar SALM and Floating Storage Unit (FSU) is
shown in Table A-37 (Gunderson et al. 1982). The FSU is a converted
VLCC used to store 1.3 million barrels of crude oil from the Fulmar
drilling and production platform. In turn, the FSU loads shuttle
tankers in tandem. This example is selected because the SALM/FSU is
the only system of its type in the North Sea and is a recent project.
It required special evaluation, design and model testing by the
operator, Shell, and its partner, Exxon. Thus, it is somewhat
analagous to an offshore loading system for frontier areas such as
the Bering Sea in that the operator had to evaluate the following:
o type of production platform
e storage or non-storage
o type of storage: platform or SPM
● pipeline versus tanker loading
o modification and upgrading of standard OLS, in this
case a SALM, for the specific application
o relevant design criteria
e model test program
The project schedule and environmental criteria are shown in
Table A-38 (Gundersen et al. 1982).
A-67
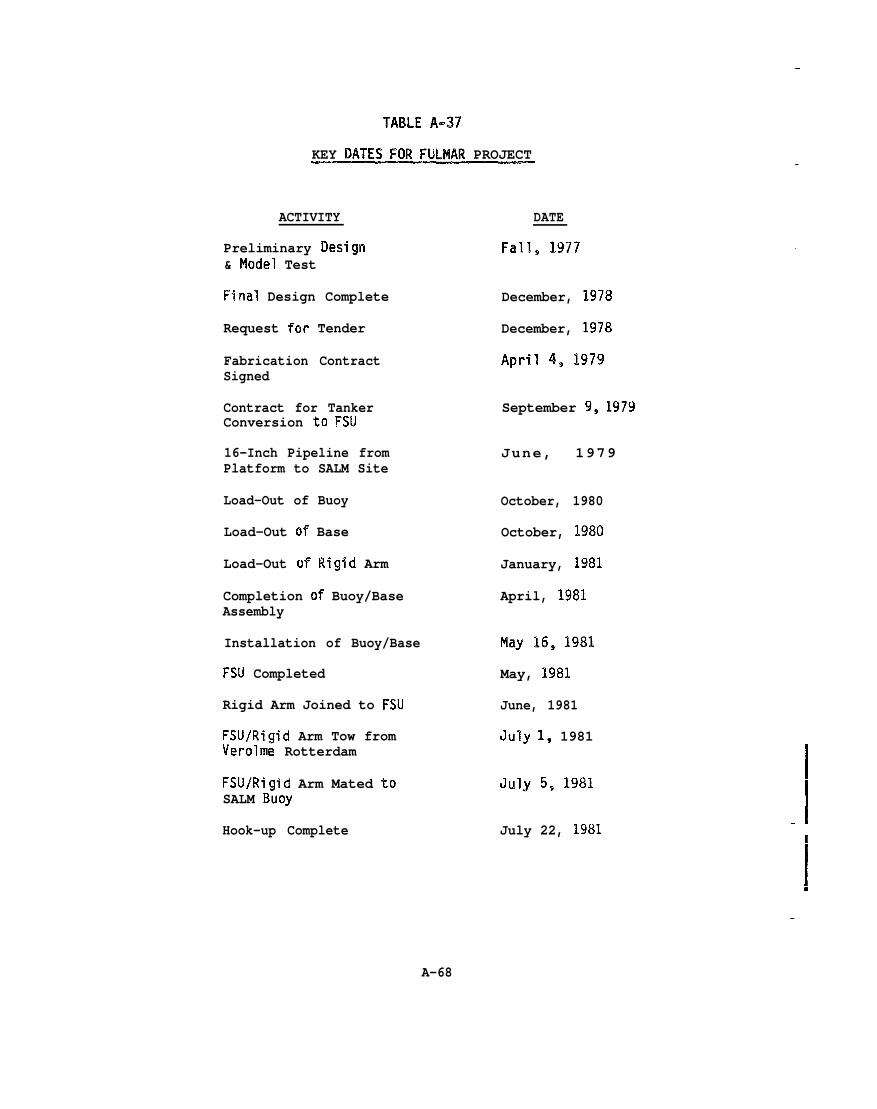
—
TABLE A-37
KEY DATES FOR FIJLMAR PROJECT
ACTIVITY
Preliminary Design& Model Test
Final Design Complete
Request Tor Tender
Fabrication ContractSigned
Contract for TankerConversion to FSU
16-Inch Pipeline fromPlatform to SALM Site
Load-Out of Buoy
Load-Out of Base
Load-Out of Rigid Arm
Completion of Buoy/BaseAssembly
Installation of Buoy/Base
FSU Completed
Rigid Arm Joined to FSU
FSU/Rigid Arm Tow fromVerolme Rotterdam
FSU/Rigid Arm Mated toSALM BuOy
Hook-up Complete
DATE
Fall, 1977
December, 1978
December, 1978
April 4, 1979
September 9, 1979
June, 1979
October, 1980
October, 1980
January, 1981
April, 1981
May 16, 1981
May, 1981
June, 1981
July 1, 1981
July ~, 1981
July 22, 1981
——
.
I_l
[
IM
—
A-68
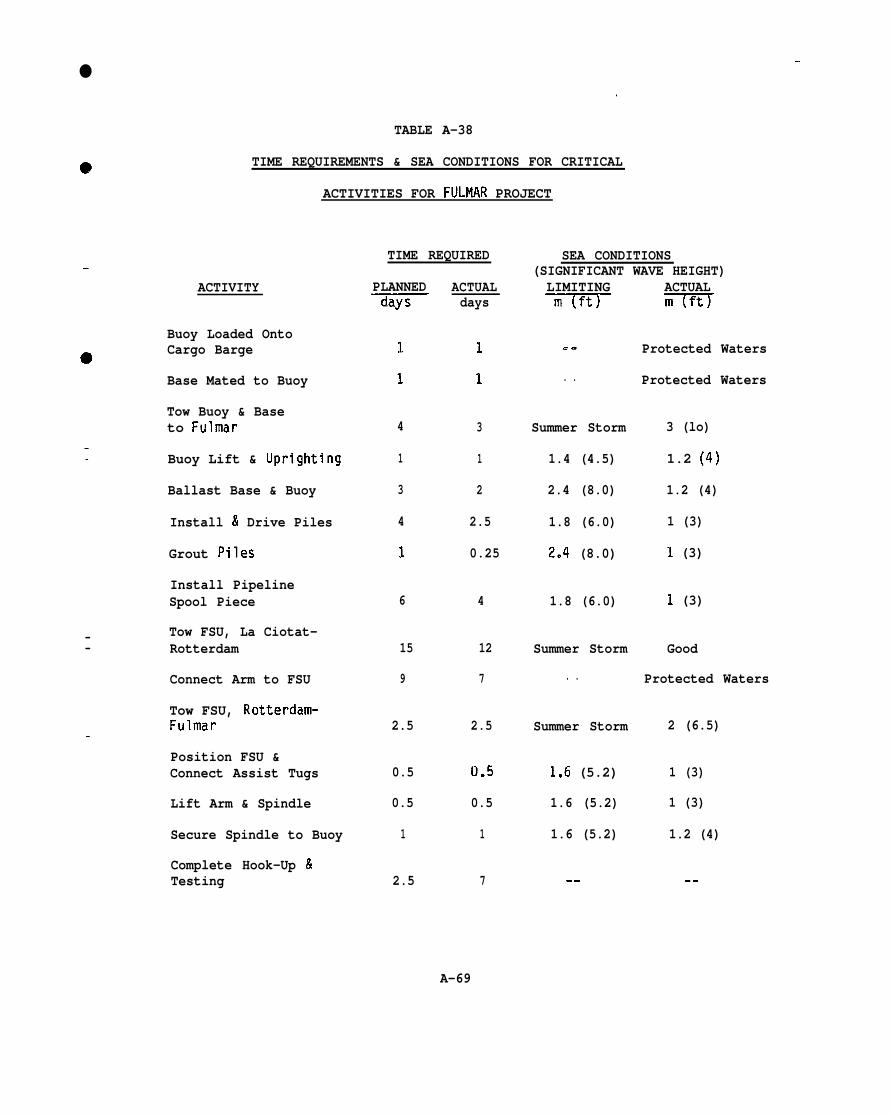
●—
TABLE A-38
TIME REQUIREMENTS & SEA CONDITIONS FOR CRITICAL
ACTIVITIES FOR FULMAR PROJECT
—
a
——
——
——
ACTIVITY
Buoy Loaded OntoCargo Barge
Base Mated to Buoy
Tow Buoy & Baseto Fulmar
Buoy Lift & Uprighting
Ballast Base & Buoy
Install & Drive Piles
Grout Piles
Install PipelineSpool Piece
Tow FSU, La Ciotat-—— Rotterdam
Connect Arm to FSU
Tow FSU, Rotterdam-Fulmar
Position FSU &Connect Assist Tugs
Lift Arm & Spindle
Secure Spindle to Buoy
Complete Hook-Up &Testing
TIME REQUIRED
PLANNED~
1
1
4
1
3
4
1
6
15
9
2.5
0.5
0.5
1
2.5
ACTUALdays
1
1
3
1
2
2.5
0.25
4
12
7
2.5
0.5
0.5
1
7
SEA CONDITIONS(SIGNIFICANT WAVE HEIGHT)LIMITING ACTUAL~ m
. . Protected Waters
. . Protected Waters
Summer Storm 3 (lo)
1.4 (4.5) 1.2 (4)
2.4 (8.0) 1.2 (4)
1.8 (6.0) 1 (3)
2.4 (8.0) 1 (3)
1.8 (6.0) 1 (3)
Summer Storm Good
. . Protected Waters
Summer Storm 2 (6.5)
1.6 (5.2) 1 (3)
1.6 (5.2) 1 (3)
1.6 (5.2) 1.2 (4)
-- -.
A-69
A.7 NORTH SEA OFFSHORE LOADING SYSTEM CAPITAL AND OPERATING COSTS
The capital cost of North Sea offshore loading systems varies
greatly depending on water depth, type of system, size of tankers,
throughput, environmental design criteria and ancillary facilities
provided. The least expensive type of mooring system, a CALM, in a
water depth of 75 m (250 ft) to 100 m (325 ft), suitable for mooring
tankers of under 100,000 DWT, would cost less than ten million
dollars (all costs are in 1982 dollars). The most expensive offshore
loading systems constructed to date, articulated columns, in a water
depth of approximately 146 m (480 ft) suitable for mooring 150,000
DWT tankers cost more than one hundred million dollars.
Operating and
each field because
maintenance costs are difficult to determine for
operators assign costs differently in terms of
services provided to support the direct operating and maintenance
manpower and material. However, most operators report that annual
operating costs are approximately $4,000,000 to $5,000,000,
regardless of the type of offshore loading system utilized.
Bearing in mind the great variation in costs that can exist,
typical capital and operating costs for the various types of offshore
loading systems used in the North Sea are presented in Table A-39.
These costs are based on a water depth of approximately 120 m
ft), a tanker size of approximately 100,000 DWT, minimal anti”
facilities, and 1982 dollars.
400
a ry
Ie .
—
I.-1‘1.
■
— I—II
—.—
A-70
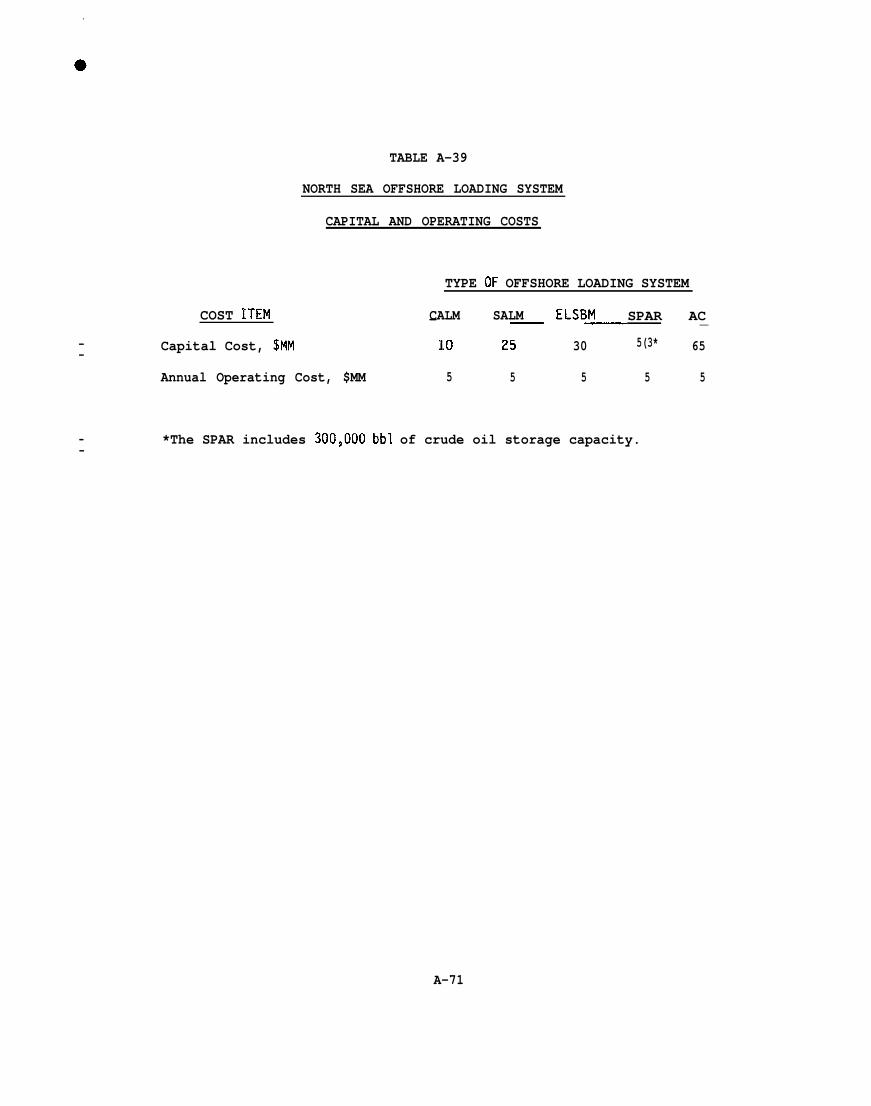
TABLE A-39
NORTH SEA OFFSHORE LOADING SYSTEM
CAPITAL AND OPERATING COSTS
TYPE OF OFFSHORE LOADING SYSTEM
COST ITEM CALM SALM ELSBM SPAR AC— — ,— _
— Capital Cost, $MM 10 25 30 5(3* 65—Annual Operating Cost, $MM 5 5 5 5 5
*The SPAR includes 300hO00 bbl of crude oil storage capacity.——
A-71
.—●
Ae8 CHARi!CTERISTICS OF NORTH SEA OIL FIELDS UTILIZING PIPELINESYSTEMS
Of the twenty-six oil producing fields in the United Kingdom and
Norwegian sectors of the North Sea that were analyzed, eighteen
transport the crude oil by pipeline. All of these pipelines,
including those from the Norwegian fields, ultimately terminate at’
U.K. onshore terminals. Three of the fields now serviced by pipeline
utilized offshore loading systems initially in order to derive
revenue until the installation of pipelines could be completed.
These OLS remain installed and are maintained for standby service.
One field presently serviced by 01S will be have a pipeline installed
in the near future to replace the OLS. Table A-1 lists the
transportation systems utilized by the various North Sea oil fields.
Information regarding the characteristics of North Sea oil fields
that utilize pipeline systems for transporting crude oil to shore,
and the characteristics of these pipelines is presented in Table A-
40*
I—
I
●
II
——
I1
I
-1II1
—E
.
—
—
—
—
I
—
A-72

(1 ● 11 II
ROUTE
Main Pipelines
Beatrice to Old ShanwickCormorant to Sullom VoeEkofisk to TeessideForties to Cruden BayNinian to Sullom VoePiper to Flotta
Interfield Pipelines
Brae to FortiesBrent to CormorantClaymore to PiperDunlin to CormorantHeather to NinianHutton to NW HuttonMagnus to NinianMontrose to FortiesMurchison to DunlinNW Hutton to CormorantTartan to ClaymoreThistle to DunlinValhall to Ekofisk
TABLE A-40
NORTH SEA PIPELINE SYSTEM CHARACTERISTICS
RECOVERABLE WATERLENGTH ~Akm (mi) in.
68 (42) 16175 (109) 36354 (220) 34179 (111) 32169 (105) 36210 (131) 30
116 (72) 30:3 f;) 30
3032 (20) 2435 (22) 166 (4) 1292 (57) 24;; :;:] 14
1620 (12) 2023 (14) 2411 (7) 1635 (22) 20
C~PACITYMb/day
1001,0001,000
600950560
10049010012575
10512060
150205
2::90
MD/Clay
7:;310470340400
3;;948234
100**
***
1%13
12590
Ut’tKAIUK
BNOCShel 1PhillipsBPBPOccidental
MarathonShel 1OccidentalShel 1UnionConocoBPAmocoConocoAmocoTexacoBNOCAmoco
YEARINSTALL
197919761974197419761975
1983197919771978197819841983198519801982198019781982
RESERVESMMb
130500
3,800*1,8001,200
620
5002,000
400400120250500100320300250500370
DEPTHm (ft)
45 (148)160 (525)71 (232)
128 (420)135 (443)145 (476)
112 (367)140 (460)114 (374)151 (495)145 (476)147 (482)186 (610)93 (304)
156 (512)144 (472)145 (476)163 (535)70 (230)
* All fields in the Ekofisk area.** Startup at time of publication.*** Future.
Ae9 PERFORMANCE OF NORTH SEA PIPELINE SYSTEMS
-1A pipeline is generally considered to be a more reliable crude
oil transportation method than an offshore loading system since it is
not susceptible to weather downtime. Nevertheless, there have been a
number of instances of lost production due to North Sea pipeline
system downtime, which is usually related to planned or unplanned
maintenance and repairs. This section describes some specific
incidents of North Sea pipeline system downtime due to a variety of
problems. It is not a complete list of all pipeline problems that
have occurred but is provided to illustrate the types of problems
that can occur.
The 36 inch oil line from Cormorant to Sullom Voe was found to
be laying on a rocky bottom with some concrete damage. On one
section, the concrete coating was lost progressively due to
vibrations caused by high velocity currents. With progressive loss
of concrete, the pipe became buoyant and floated to the surface.
This occurred over a length of 1.5 km (0.9 mi). A few short segments
of the same pipeline suffered concrete damage and some loss and
lifted slightly off-bottom when the pipe was empty. Some small
concrete losses were occasionally observed related to damage of the
concrete due to laydown and pick-up caused by bad weather periods
(Starting 1981). An anchor was found lying beside the Ekofisk-
Teesside pipeline, 8 km (5 mi) outside Teesside. The 9 tonne anchor
was traced back to a 50,000 DWT tanker. The line was bent and
— I-E.
I— .
——
——
—
—
‘11—
A-74
—
—
buckled locally. The damage was analyzed and the operator
established a reduced maximum operating pressure pending repair of
the damage. The line was eventually shut down for approximately six
weeks to make a hyperbaric weld repair. Other work on the pipeline
was carried out simultaneously with the repair. Greater Ekofisk oil
production was maintained during the shutdown by reinstalling the
original CALM offshore loading system used to load Ekofisk oil to
tankers before the pipeline start-up (Kaufman 1978),
Free spans have occurred on the Ekofisk-Teesside pipeline. All
spans over 25 m (82 ft) length are sandbagged. Natural backfilling
has not been satisfactory and about 50 percent of the line lies
exposed in the trench. The situation is more or less stable
(Starting 1981).
During operations around the Piper-Cl aymore-Flotta pipeline, the
Claymore spur line spool piece connection to the tee was snagged and
ripped free at the Claymore end connection. Although the main oil
line from Piper to Flotta was not damaged, it was decided that
additional protection should be implemented on pipelines leading away
from key areas to guard against snagging, impacts and chain/wire burn
type damage to the pipelines. Simple reinforced concrete covers,
later known as PPU’S (Pipeline Protection Units) were developed to
achieve the objective. These units were placed at all key areas on
the pipeline.
A-75
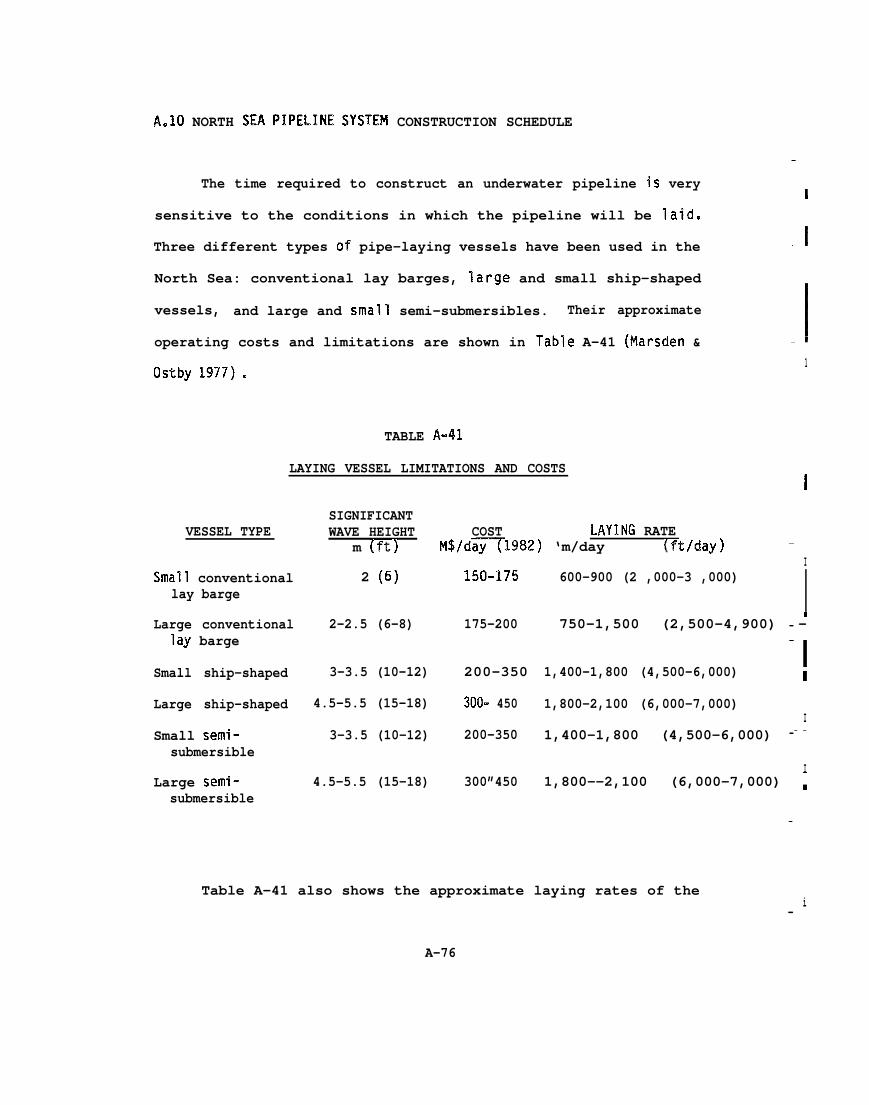
A.10 NORTH SEA PIPELINE SYSTEM CONSTRUCTION SCHEDULE
The time required to construct an underwater pipeline is very
sensitive to the conditions in which the pipeline will be laid.
Three different types of pipe-laying vessels have been used in the
North Sea: conventional lay barges, large and small ship-shaped
vessels, and large and small semi-submersibles. Their approximate
operating costs and limitations are shown in Table A-41 (Marscien &
Ostby 1977) c
VESSEL TYPE
—
I
-1
1
Small conventionallay barge
TABLE A-41
LAYING VESSEL LIMITATIONS AND COSTS!
Large conventionallay barge
Small ship-shaped
Large ship-shaped
Small semi-submersible
Large semi-submersible
SIGNIFICANTWAVE HEIGHT COST LAYING RATE
m (ft) M$/d~1982) ‘m/day (ft/day) ~I
2 (6) 150-17!5 600-900 (2 ,000-3 ,000) I2-2.5 (6-8) 175-200
I750-1,500 (2,500-4,900) -—
‘13-3.5 (10-12) 200-350 1,400-1,800 (4,500-6,000) I
4.5-5.5 (15-18) 300== 450 1,800-2,100 (6,000-7,000)I
3-3.5 (10-12) 200-350 1,400-1,800 (4,500-6,000) - -—
I4.5-5.5 (15-18) 300”450 1,800--2,100 (6,000-7,000) ;
Table A-41 also shows the approximate laying rates of the
A-76
—
i—
—
,-—
different types of laying vessels for large pipe of more than 30-inch
outside diameter. Laying rate is not a function of water depth for
depths down to approximately 300 m (1OOU ft). However, a 16 inch
pipeline can be laid 20 percent faster than a 36 inch line (Marsden &
Ostby 1977).
Pipelines in the North Sea are buried. The rate of trenching
or burying depends on the depth of cover, the seabed consistency,
obstructions around the pipeline and the type of trenching barge. A
large trenching barge can operate in seas up to approximately 1.5 m
(5 ft ) significant wave height. The rate of travel is approximately
1 to 3 m (3 to 10 ft) per minute in water depths less than 3U0 m
(1000 ft). The operating cost of a large trenching barge is
approximately $150,000 per day.
A-77
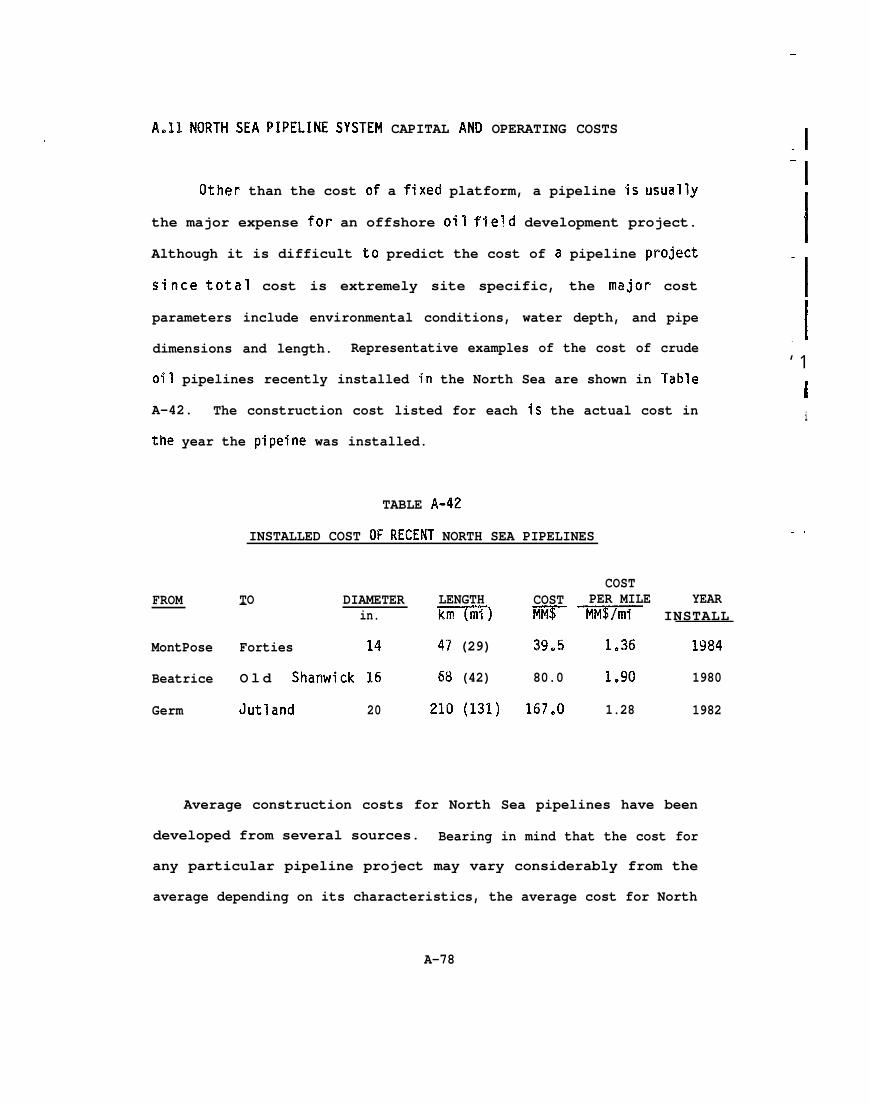
Aell NORTH SEA PIPELINE SYSTEM CAPITAL AND OPERATING COSTS
.
Other than the cost of a fixed platform, a pipeline is usually
the major expense for an offshore oil field development project.
Although it is difficult to predict the cost of a pipeline project
since total cost is extremely site specific, the major cost
parameters include environmental conditions, water depth, and pipe
dimensions and length. Representative examples of the cost of crude
oil pipelines recently installed in the North Sea are shown in Table
A-42. The construction cost listed for each is the actual cost in
the year the pipeine was installed.
TABLE A-=42
INSTALLED COST OF RECENT NORTH SEA PIPELINES
FROM TO—COST
DIAMETER LENGTH COST PER MILE YEARin. m) ~ ~ INSTALL
MontPose Forties 14 47’ (29) 39.5 1.36 1984
Beatrice O l d Shanwick 16 68 (42) 80.0 1.90 1980
Germ Jutland 20 210 (131) 167.0 1.28 1982
Average construction costs for North Sea pipelines have been
developed from several sources. Bearing in mind that the cost for
any particular pipeline project may vary considerably from the
average depending on its characteristics, the average cost for North
-1—IIa
I1
—
I1‘ 1
Ii
—,
A-78
—
—
Sea pipelines is presented in Figure A-8, in dollars per mile. Since
all North Sea pipelines are buried, the cost presented includes the
cost of burial.
Pipeline operating costs are more difficult to define than
construction costs because different operators have different methods
of allocating costs for operation, maintenance and repairs. However,
most operators report that pipeline operating costs average between
three and five percent of construction cost. Assuming that annual
operating costs are four percent of pipeline construction cost, the
annual operating cost for North Sea pipelines is indicated in Figure
A-8 .
A-79
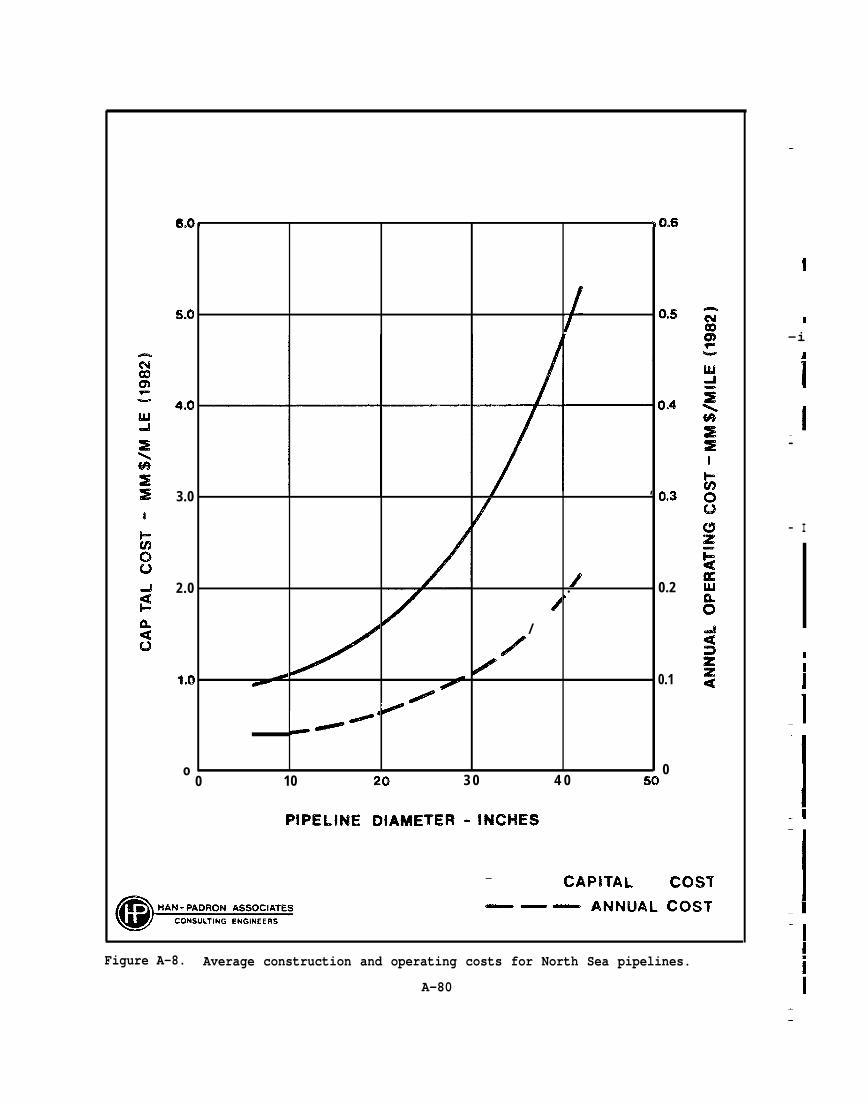
+w
k=-@0u
60 t 90.6
!5.0 10.5
4.0 0.4
3.0 ‘ 0.3
2.0 /. 0.2$ ‘
/
/
41,0 ~ r/ / 0.1
-/+‘
o 00 10 20 3 0 4 0 50
1-U3s
— cAPITAL ~OST——— ANNUAL COST
Figure A-8. Average construction and operating costs for North Sea pipelines.
A-80
—
1
a
-i-1
I
_l—
— I
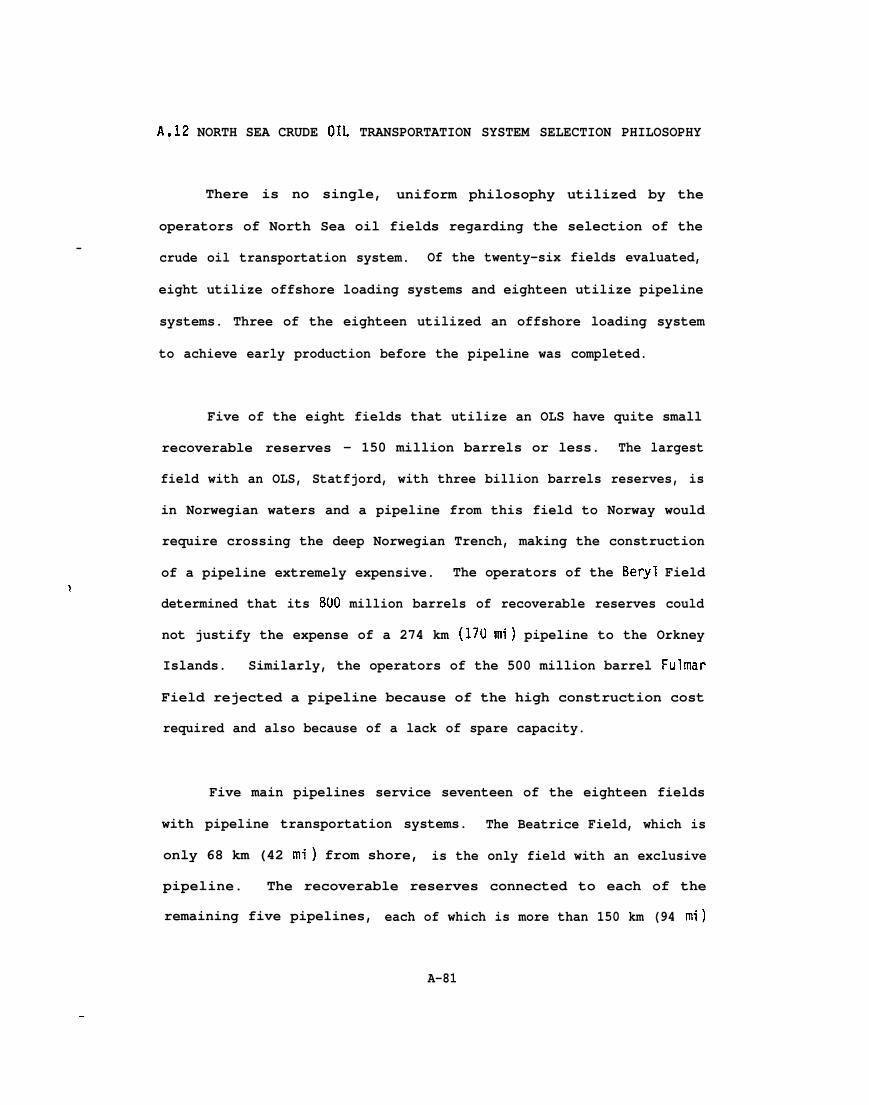
A.12 NORTH SEA CRUDE 01!.. TRANSPORTATION SYSTEM SELECTION PHILOSOPHY
There is no single, uniform philosophy utilized by the
operators of North Sea oil fields regarding the selection of the—
crude oil transportation system. Of the twenty-six fields evaluated,
eight utilize offshore loading systems and eighteen utilize pipeline
systems. Three of the eighteen utilized an offshore loading system
to achieve early production before the pipeline was completed.
Five of the eight fields that utilize an OLS have quite small
recoverable reserves - 150 million barrels or less. The largest
field with an OLS, Statfjord, with three billion barrels reserves, is
in Norwegian waters and a pipeline from this field to Norway would
require crossing the deep Norwegian Trench, making the construction
of a pipeline extremely expensive. The operators of the Beryl Field
determined that its 800 million barrels of recoverable reserves could
not justify the expense of a 274 km (170 mi) pipeline to the Orkney
Islands. Similarly, the operators of the 500 million barrel Fulmar
Field rejected a pipeline because of the high construction cost
required and also because of a lack of spare capacity.
Five main pipelines service seventeen of the eighteen fields
with pipeline transportation systems. The Beatrice Field, which is
only 68 km (42 mi) from shore, is the only field with an exclusive
pipeline. The recoverable reserves connected to each of the
remaining five pipelines, each of which is more than 150 km (94 mi)
A-81
—
long, ranges from 1.3 billion barrels to 4.2 billion barrels.
The Brent, Ekofisk and Thistle Fields each had offshore loading
systems initially with pipelines installed at a later date. The
Ekofisk OLS operated for approximately five years, the Brent.
approximately three years and the Thistle OLS for only nine
The operators of the Thistle Field report that even though
OLS for -1
months. i
the OLS ~
operated for only nine months, loading approximately 18 million “- i
barrels of crude oil, it was very valuable to the Thistle Development !
Plan. It provided early oil flow and consequent revenue and also
provided valuable experience in
the pipeline became available
starting up the field so that when
the majority of the preliminaryj
production problems had been overcome.
—
Thus, it appears that for oil fields located more than approx- 1f
imately 100 km (60 mi) from land, when recoverable reserves exceeded Ione billion barrels, and a pipeline was technically feasible, a —
—
pipeline was selected for the crude oil transportation system for I
North Sea oil fields. When recoverable reserves were less than one i1
billion barrels, an offshore loading system was selected.
The type of offshore loading system selected also appears to be
a function of the size of the reservoir. Fields with recoverable
reserves of 150 million barrels or more were provided with the
highest capital cost, highest availability articulated columns,
except for the Fulmar Field which has a SALM (essentially an
-.
Ii.
——
A-82
articulated column) with a floating storage unit. Fields with 100
:— million barrels or less of recoverable reserves were provided with
lowest cost, lowest availability CALMS. Where an OLS was utilized
only on a temporary basis, a CALM was provided except in the
extremely deep water of the Thistle Field where a more cost effective~-
SALM was provided and at the Brent Field where a SPAR was installed
to provide offshore crude oil storage capacity.
——
——
The general philosophy used in the selection of crude oil
transportation systems in the North Sea apparently is based on
minimizing overall llfe cycle costs, within the limits of existing
technology, although some extrapolation of existing technology was
acceptable. The apparent results of this philosophy are presented in
the logic diagram shown in Figure A-9.
—
A-83
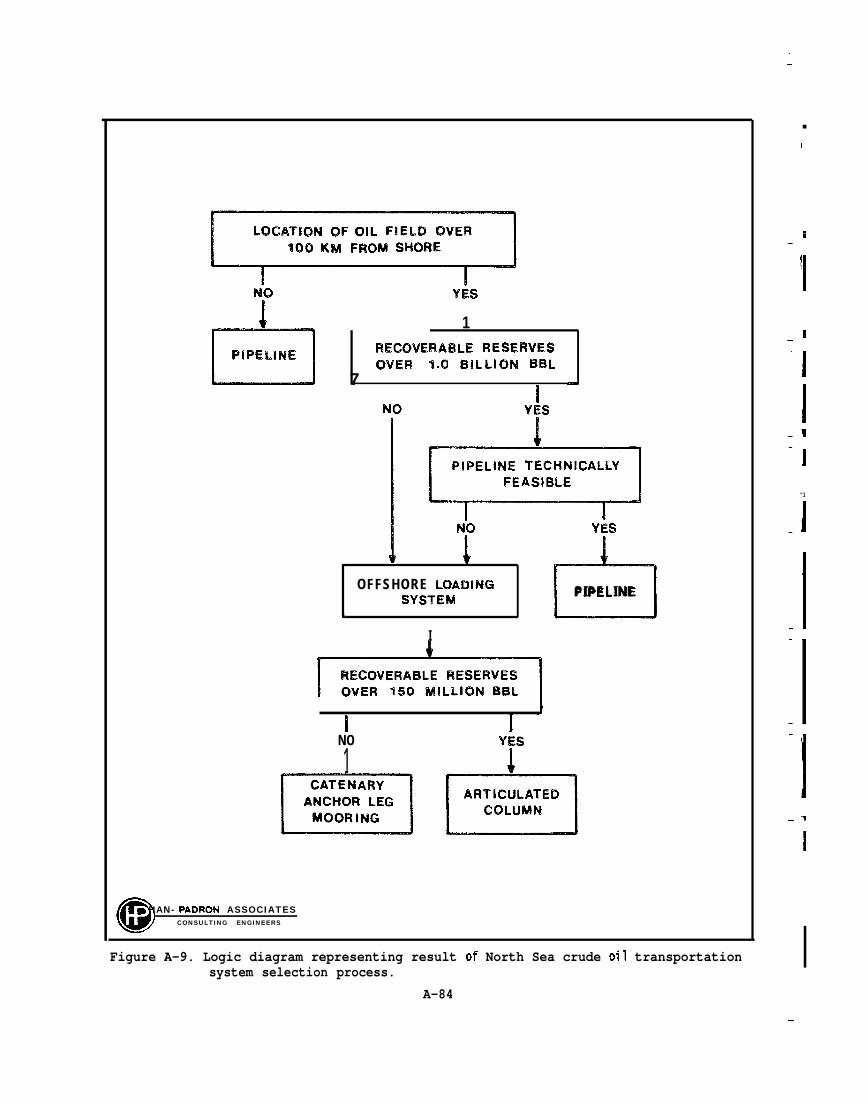
——
NC) YES
1n 7
1
PIPEL!NE R!EcmvERAi3L.E RESERVESOVER 1.0 BILLION BBL
[4
.
‘o*I
OFFSHORE LOADINGSYSTEM
&
I
YES
bPIPELINE
NO
1YES
i
@~ HAN- PADRON ASSOCIATES
CONSULTING ENGINEERS
■
1
E,—
-!II—
—
II
-1—
I“1
I—
J
——
I—- ‘~
—
Figure A-9. Logic diagram representing result of North Sea crude oil transportationsystem selection process.
A-84——
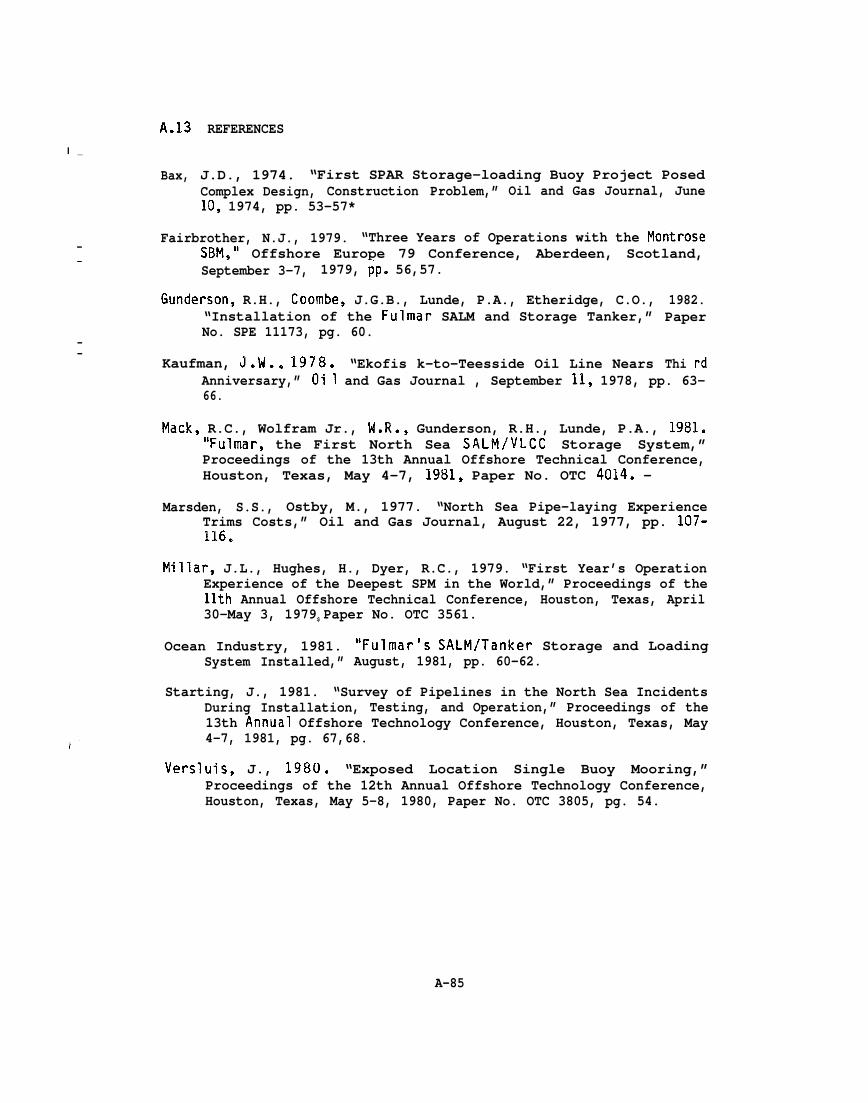
A.13l _
Bax,
REFERENCES
J.D., 1974. “First SPAR Storage-loading Buoy Project PosedComplex Design, Construction Problem,” Oil and Gas Journal, June10, 1974, pp. 53-57*
Fairbrother, N.J., 1979. “Three Years of Operations with the Montrose— SBM,” Offshore Europe 79 Conference, Aberdeen, Scotland,—
September 3-7, 1979, Pp. 56,57.
Gunderson, R.H., Coombe, J.G.B., Lunde, P.A., Etheridge, C.O.,“Installation of the Fulmar SALM and Storage Tanker,”No. SPE 11173, pg. 60.
——
Kaufman, J.W., 1978. “Ekofis k-to-Teesside Oil Line Nears
1982.Paper
Thi rdAnniversary,” Oi 1 and Gas Journal , September 11, 1978, pp. 63-66.
Mack, R.C., Wolfram Jr., M.R., Gunderson, R.H., Lunde, P.A., 1981.“Fulmar, the First North Sea SALM/VLCC Storage System,”Proceedings of the 13th Annual Offshore Technical Conference,Houston, Texas, May 4-7, 1981, Paper No. OTC 4014. -
Marsden, S.S., Ostby, M., 1977. “North Sea Pipe-laying ExperienceTrims Costs,” Oil and Gas Journal, August 22, 1977, pp. 107-116.
—
/-
Millar, J.L., Hughes, H., Dyer, R.C., 1979. “First Year’s OperationExperience of the Deepest SPM in the World,” Proceedings of thellth Annual Offshore Technical Conference, Houston, Texas, April30-May 3, 1979$ Paper No. OTC 3561.
Ocean Industry, 1981. “Fulmar’s SALM/Tanker Storage and LoadingSystem Installed,” August, 1981, pp. 60-62.
Starting, J., 1981. “Survey of Pipelines in the North Sea IncidentsDuring Installation, Testing, and Operation,” Proceedings of the13th Annual Offshore Technology Conference, Houston, Texas, May4-7, 1981, pg. 67,68.
Versluis, J., 1980. “Exposed Location Single Buoy Mooring,”Proceedings of the 12th Annual Offshore Technology Conference,Houston, Texas, May 5-8, 1980, Paper No. OTC 3805, pg. 54.
—
A-85
——
—
——
——
APPENDIX B
TRANSPORTATION ALTERNATIVE SENSITIVITY ANALYSES——
—
——
APPENDIX B
TRANSPORTATION ALTERNATIVE SENSITIVITY ANALYSES——
TABLE OF CONTENTS
—Page No.
B.1 INTRODUCTION . . ● * ● ● e 00 0 e ● 0 . * ● . O* . ● * 00 ● * ● me e ● s ● * ● 0 . ● 00 B-1
B.2 SENSITIVITY ANALYSIS TABLES . . . . . . . . . . . . . . . . . . . . . . . e. B-4—
—
I
—
B-i
——
B.1 INTRODUCTION
All relevant parameters regarding environmental factors, crude
oil production parameters and crude oil destinations were defined
— each of the three scenarios utilized in the evaluation of crude
transportation alternatives from the Bering Sea. The parameters
referred to as the “base case” parameters.
for
oi 1
are
—
,—
-1
In order to evaluate the effect of variations to the base case
parameters on the conclusions regarding the optimum transportation
alternative, a number of sensitivity analyses have been carried out.
The parameters varied for the analyses include:
o quantity of recoverable reserves (production rate),
o crude oil properties,
o distance to shore,
o water depth, and
o geotechnical conditions.
The effects of these variations on the individual transportation
elements are discussed in the sections of this report in which the
elements are described. The tables contained in this Appendix
illustrate the effect on the overall transportation system
alternative for each scenario.
The base case recoverable reserves has been defined as 500
million barrels and the sensitivity values are 100 million, 200
million, one billion and two billion barrels. All size reservoirs
B-1
ihave been assumed to perform in the same manner, as described in
Section 3.3.2, with peak production rate equal to 9.1 percent of
reserves. Thus, the base case peak production rate is 125 MBPD and
the sensitivity values are 25, 50, 250 and 500 MBPD.
The base case crude oil properties are quite suitable for
transportation in either long pipelines or tankers. The sensitivity
case crude oil” has a relatively high pour point making the cost of
alternatives requiring\
pumping long distances underwater prohibitive.
alternatives, loading pipeline diameters and
would increase but the increase in total
For offshore loading
pumping horsepower
transportation system cost would be negligible. Therefore, no
further economic analysis was conducted for crude oil properties
sensitivity.
Variations in the distance of the production platform from
shore have virtually no effect on alternatives which have offshore
crude oil storage and loading and no distance sensitivity analyses
were conducted for these alternatives. Also, where any likely
variation in a pipeline or tanker route length was less than ten
percent of the base case length ~ no distance sensitivity analysis was
performed.
Variations in water depth only affect alternatives which have
offshore crude oil storage and loading and water depth sensitivity
analyses were conducted only for these alternatives.
I-1
‘1.-1-i-1—
(
—
B-2
—
As for water depth, variations of the seabed soil parameters
affect only the offshore storage and loading alternatives.
The tables presented in the following section show the capital—
cost, annual operating cost during a peak production year and
manpower required for each major transportation system element, for
each alternative, and for each sensitivity parameter variation. The
manpower figures presented are the crew size times a “shift factor”
and times a “rotation factor.” Tanker crews are not included. The
J_ tables also list the present value of the total life cycle cost and—
the average transportation cost (ATC) of the crude oil for each case.
They have been developed by fixing all scenario parameters but one at
the base case values and setting the one parameter at a non-base case
(sensitivity) value.
The present value of the total life cycle cost is based on
constant January 1982 dollars and an 8 percent discount rate. The
effect of taxes or royalties is not included. To obtain the ATC of
the crude oil, on a per barrel basis, the present value of total cost
is divided by the total volume of oil produced over the 15 year life
of the reservoir.
B-3

B.2 SENSITIVITY ANALYSIS TABLES
—
.1‘ 1.– m
—
.1
——
B-4
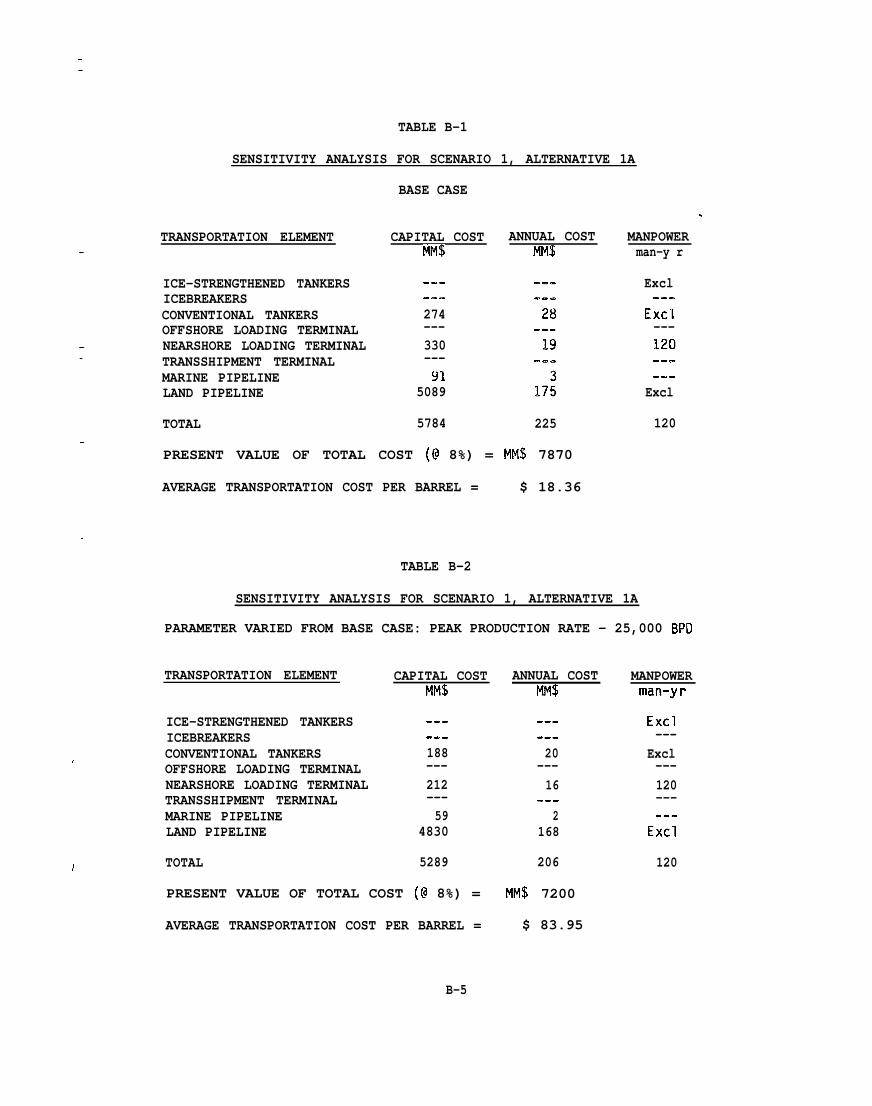
,_—
TABLE B-1
SENSITIVITY ANALYSIS FOR SCENARIO 1, ALTERNATIVE 1A
BASE CASE
.
MANPOWERman-y r
TRANSPORTATION ELEMENT CAPITAL COSTMM$
ANNUAL COSTMM$—
ICE-STRENGTHENED TANKERSICEBREAKERSCONVENTIONAL TANKERSOFFSHORE LOADING TERMINALNEARSHORE LOADING TERMINALTRANSSHIPMENT TERMINALMARINE PIPELINELAND PIPELINE
TOTAL
Excl.--
Excl---120.-.
---
274---330---91
5089
——
.-=Excl
5784 225 120—
PRESENT VALUE OF TOTAL COST (@ 8%) = MM$ 7870
AVERAGE TRANSPORTATION COST PER BARREL = $ 18.36
TABLE B-2
—
SENSITIVITY ANALYSIS FOR SCENARIO 1, ALTERNATIVE 1A
PARAMETER VARIED FROM BASE CASE: PEAK PRODUCTION RATE - 25,000 BPD
TRANSPORTATION ELEMENT CAPITAL COST ANNUAL COSTMM$ MM$
MANPOWERman-yr
ICE-STRENGTHENED TANKERSICEBREAKERSCONVENTIONAL TANKERSOFFSHORE LOADING TERMINALNEARSHORE LOADING TERMINALTRANSSHIPMENT TERMINALMARINE PIPELINELAND PIPELINE
TOTAL
Excl---
Excl---120---.-=
Excl
—--- ------188---212---59
4830
---20
---16
,
---2
168
} 5289 206 120
PRESENT VALUE OF TOTAL COST (@ 8%) = MM$ 7200
AVERAGE TRANSPORTATION COST PER BARREL = $ 83.95
B-5
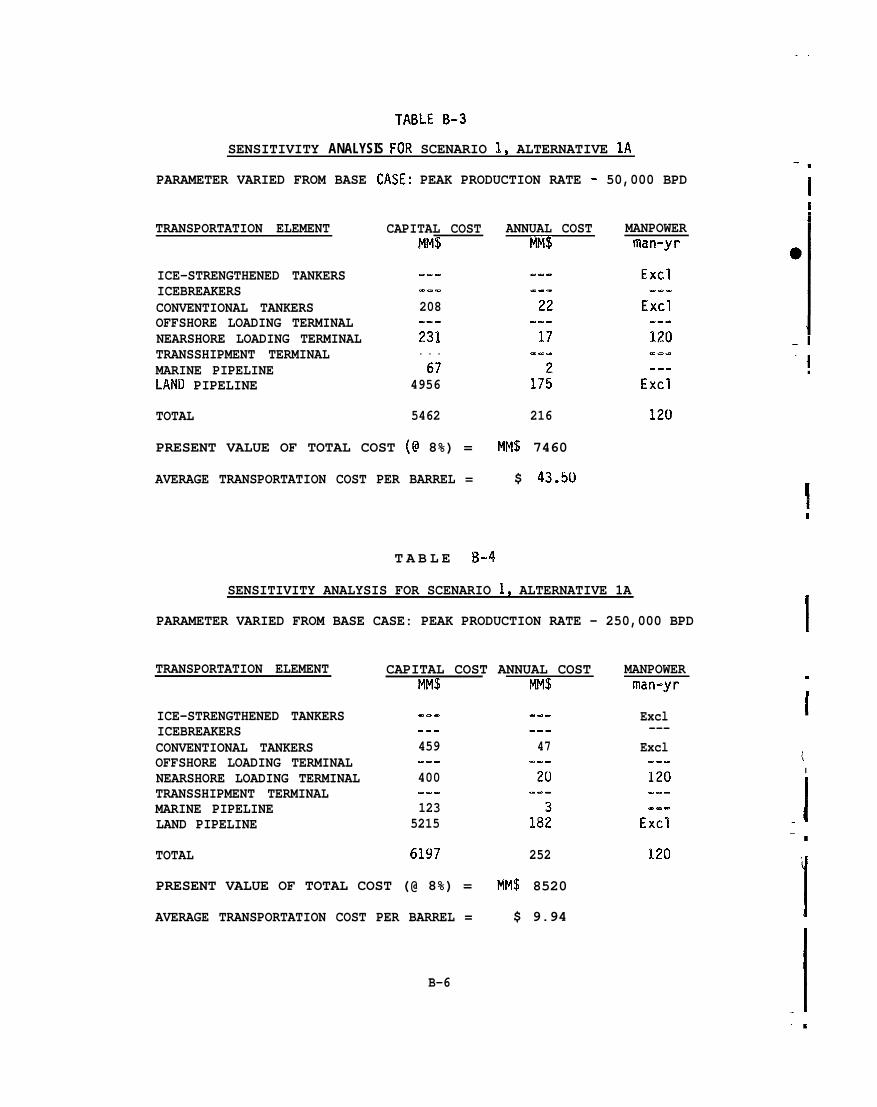
-,
TABLE B-3
SENSITIVITY ANALYSIS FOR SCENARIO 1, ALTERNATIVE 1A-=
IPARAMETER VARIED FROM BASE CASE: PEAK PRODUCTION RATE - 50,000 BPD
TRANSPORTATION ELEMENT CAPITAL COSTMM$
ANNUAL COSTMM$
MANPOWERman-yr
ICE-STRENGTHENED TANKERSICEBREAKERSCONVENTIONAL TANKERSOFFSHORE LOADING TERMINALNEARSHORE LOADING TERMINALTRANSSHIPMENT TERMINALMARINE PIPELINELAND PIPELINE
TOTAL
..----
208--.231. . .67
4956-!
5462 216 120
PRESENT VALUE OF TOTAL COST (@ 8%) = MM$ 7460
AVERAGE TRANSPORTATION COST PER BARREL = $ 43.50
T A B L E B-4
SENSITIVITY ANALYSIS FOR SCENARIO 1, ALTERNATIVE 1A
— IPARAMETER VARIED FROM BASE CASE: PEAK PRODUCTION RATE - 250,000 BPD
TRANSPORTATION ELEMENT CAPITAL COST ANNUAL COSTMM$ MM$
MANPOWERman-yr
.
I■ICE-STRENGTHENED TANKERS
ICEBREAKERSCONVENTIONAL TANKERSOFFSHORE LOADING TERMINALNEARSHORE LOADING TERMINALTRANSSHIPMENT TERMINALMARINE PIPELINELAND PIPELINE
TOTAL
Excl---
Excl-..120..---.
Excl
. . .459--.400--.123
5215
..-47
..-2Ll
.-.
18;
I
]
6197 252 120
IPRESENT VALUE OF TOTAL COST (@ 8%) = MM$ 8520
AVERAGE TRANSPORTATION COST PER BARREL = $ 9.94
B-6
-1
1

—
——
TABLE B-5
SENSITIVITY ANALYSIS FOR SCENARIO 1, ALTERNATIVE 1A
PARAMETER VARIED FROM BASE CASE: PEAK PRODUCTION RATE - 500,000 BPD
TRANSPORTATION ELEMENT——
CAPITAL COST ANNUAL COSTMM$ MM$
—
—
)
ICE-STRENGTHENED TANKERS .-. ---ICEBREAKERS .-= ..-CONVENTIONAL TANKERS 835 84OFFSHORE LOADING TERMINAL --- -..NEARSHORE LOADING TERMINAL 493 22TRANSSHIPMENT TERMINAL .-. -..MARINE PIPELINE 185 5LAND PIPELINE 5600 196
TOTAL 7113 307
PRESENT VALUE OF TOTAL COST (@ 8%) = MM$ 994U
AVERAGE TRANSPORTATION COST PER BARREL = $ 5.80
MANPOWERman-yr
Excl--.
Excl. . .120-e.. . .
Excl
120
—
—
/
B-7
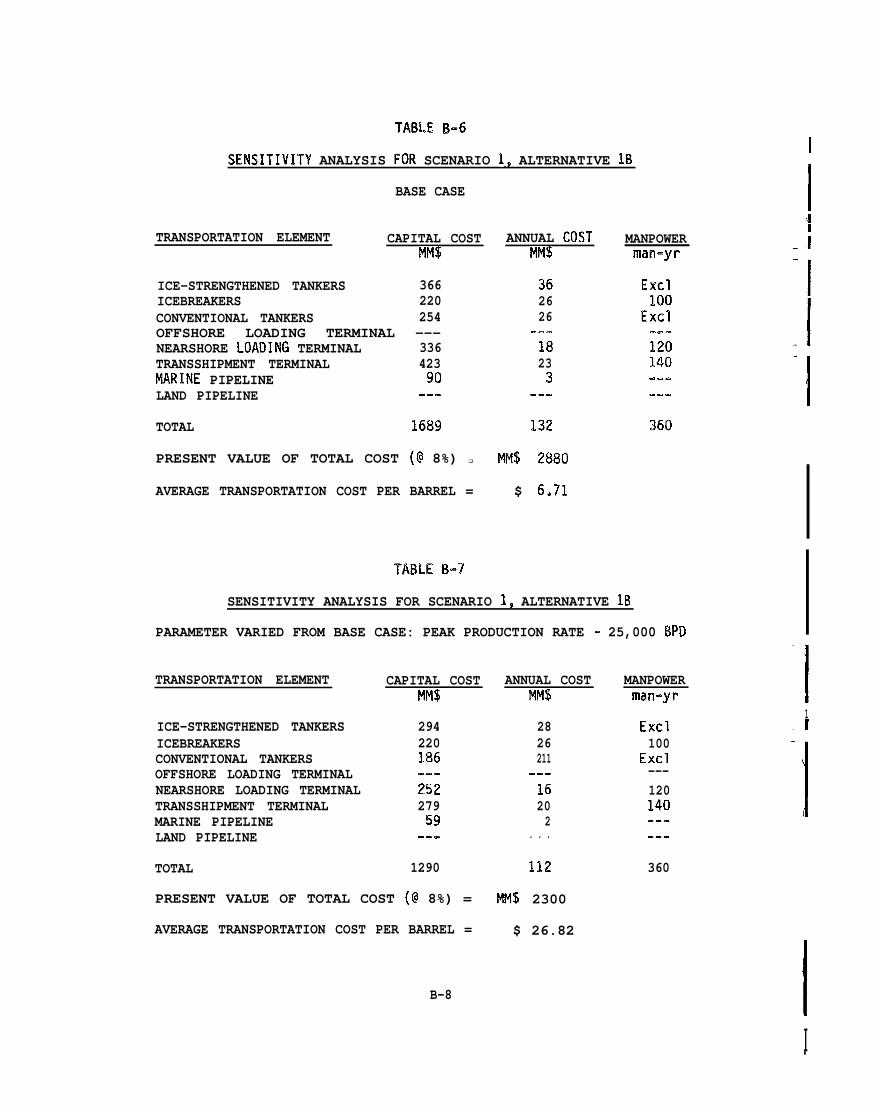
TABLE B-6
SENSITIVITY ANALYSIS FOR SCENARIO 1, ALTERNATIVE Ill
BASE CASE
TRANSPORTATION ELEMENT CAPITAL COST ANNUAL COSTMM$ MM$
ICE-STRENGTHENED TANKERS 366 36ICEBREAKERS 220 26CONVENTIONAL TANKERS 254 26OFFSHORE LOADING TERMINAL --- ..=NEARSHORE LOADINIi TERMINAL 336 18TRANSSHIPMENT TERMINAL 423 23MARINE PIPELINE 90 3LAND PIPELINE --. ..-
TOTAL 1689 132
PRESENT VALUE OF TOTAL COST (@ 8%) ❑ M!l$ 2880
AVERAGE TRANSPORTATION COST PER BARREL = $ 6.71
MANPOWERman==yr
Excl100
Excl-e.120140--..-.
360
TABLE B-7
SENSITIVITY ANALYSIS FOR SCENARIO 1, ALTERNATIVE lB
PARAMETER VARIED FROM BASE CASE: PEAK PRODUCTION RATE - 25,000 BPD
TRANSPORTATION ELEMENT
ICE-STRENGTHENED TANKERSICEBREAKERSCONVENTIONAL TANKERSOFFSHORE LOADING TERMINALNEARSHORE LOADING TERMINALTRANSSHIPMENT TERMINALMARINE PIPELINELAND PIPELINE
TOTAL
CAPITAL COSTMbl$
294220186.-.25227959
-..
1290
ANNUAL COSTMM$
2826211
..-16202
. . .
PRESENT VALUE OF TOTAL COST (@ 8%) = MM$ 2300
AVERAGE TRANSPORTATION COST PER BARREL = $ 26.82
B-8
MANPOWERman-yr
Excl100
Excl---120140.---..
360
I—
II4I
_l
‘1_l
‘11
.1
.1I.
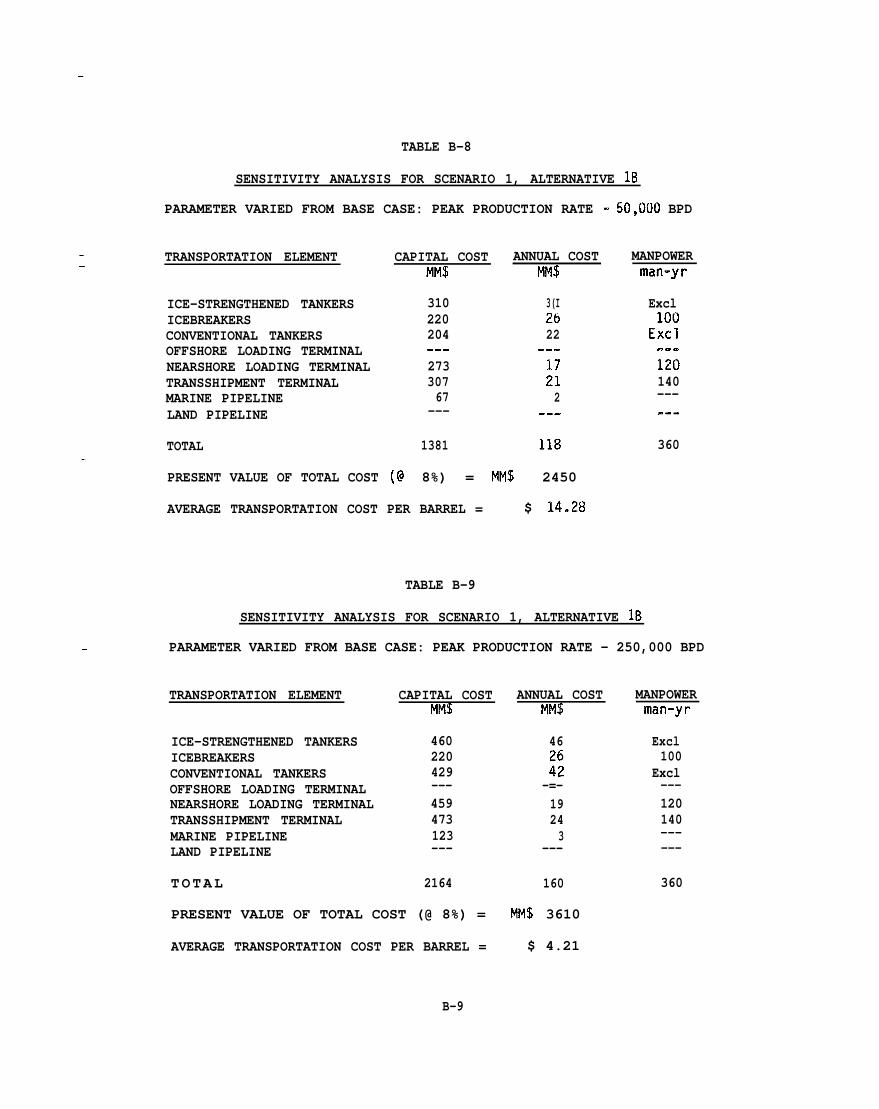
—
.—
—
TABLE B-8
SENSITIVITY ANALYSIS FOR SCENARIO 1, ALTERNATIVE lB
PARAMETER VARIED FROM BASE CASE: PEAK PRODUCTION RATE - 50,000 BPD
TRANSPORTATION ELEMENT
ICE-STRENGTHENED TANKERSICEBREAKERSCONVENTIONAL TANKERSOFFSHORE LOADING TERMINALNEARSHORE LOADING TERMINALTRANSSHIPMENT TERMINALMARINE PIPELINELAND PIPELINE
TOTAL
PRESENT VALUE OF TOTAL COST
CAPITAL COST ANNUAL COSTMM$ MM$
310 3(I220 26204 22.aa ..-273 17307 2167 2
--- -.-
1381 118
(@ 8%) = MM$ 2450
AVERAGE TRANSPORTATION COST PER BARREL = $ 14.28
—
MANPOWERman-yr
Excl100
Excl-a.120140------
360
TABLE B-9
SENSITIVITY ANALYSIS FOR SCENARIO 1, ALTERNATIVE lB
PARAMETER VARIED FROM BASE CASE: PEAK PRODUCTION RATE - 250,000 BPD
TRANSPORTATION ELEMENT
ICE-STRENGTHENED TANKERSICEBREAKERSCONVENTIONAL TANKERSOFFSHORE LOADING TERMINALNEARSHORE LOADING TERMINALTRANSSHIPMENT TERMINALMARINE PIPELINELAND PIPELINE
TOTAL
CAPITAL COSTMM$
460220429---459473123---
2164
ANNUAL COSTMM$
46
::-=-19243
---
160
MANPOWERman-yr
Excl100
Excl---120140------
360
PRESENT VALUE OF TOTAL COST (@ 8%) = MM$ 3610
AVERAGE TRANSPORTATION COST PER BARREL = $ 4.21
B-9
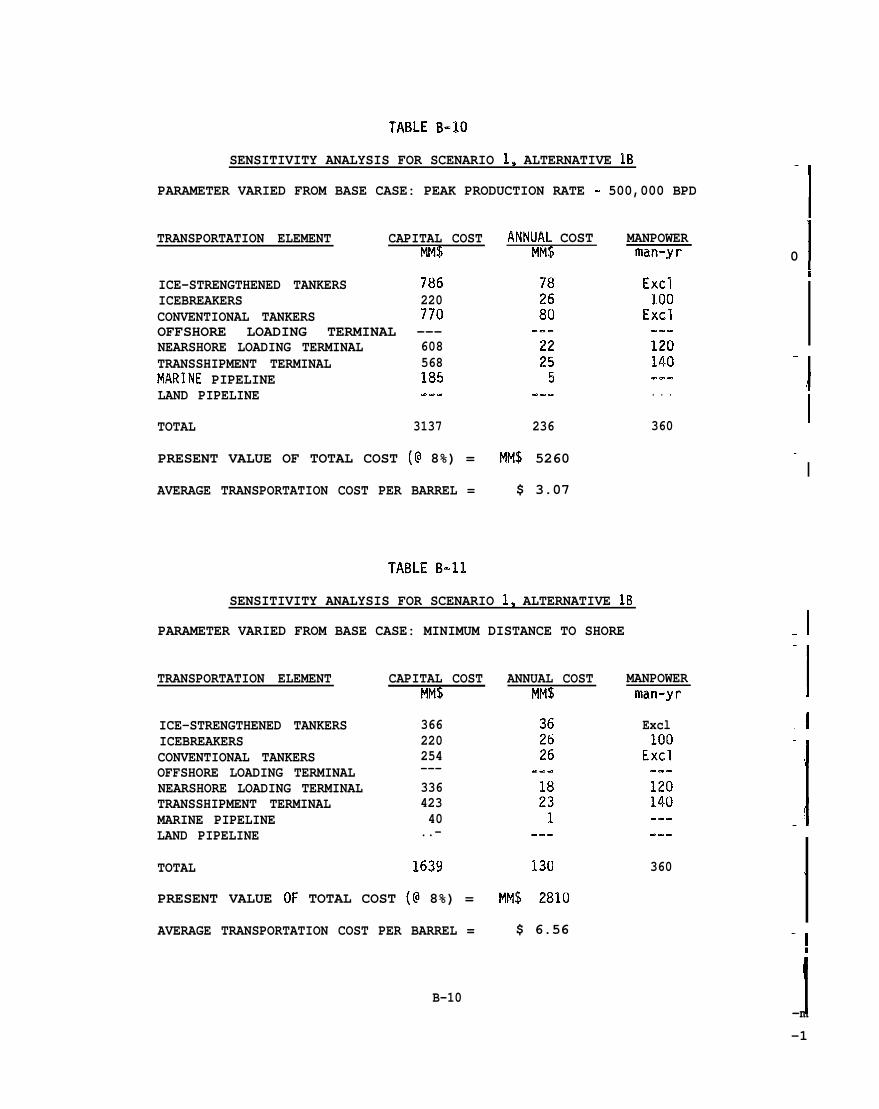
TABLE B-10
SENSITIVITY ANALYSIS FOR SCENARIO 1, ALTERNATIVE IB
PARAMETER VARIED FROM BASE CASE: PEAK PRODUCTION RATE - 500,000 BPD
TRANSPORTATION ELEMENT CAPITAL COST ANNUAL COSTMM$ MM$
ICE-STRENGTHENED TANKERS 786ICEBREAKERS 220CONVENTIONAL TANKERS 770OFFSHORE LOADING TERMINAL ---NEARSHORE LOADING TERMINAL 608TRANSSHIPMENT TERMINAL 568MARINE PIPELINE 185LAND PIPELINE --.
TOTAL 3137
PRESENT VALUE OF TOTAL COST (@ 8%) =
AVERAGE TRANSPORTATION COST PER BARREL =
5
236
MM$ 5260
$ 3.07
MANPOWERman-yr
Excl100
Excla..120140--.. . .
360
TABLE B-11
SENSITIVITY ANALYSIS FOR SCENARIO 1, ALTERNATIVE lB
PARAMETER VARIED FROM BASE CASE: MINIMUM DISTANCE TO SHORE
TRANSPORTATION ELEMENT CAPITAL COST ANNUAL COSTMbi$ MM$
ICE-STRENGTHENED TANKERSICEBREAKERSCONVENTIONAL TANKERSOFFSHORE LOADING TERMINALNEARSHORE LOADING TERMINALTRANSSHIPMENT TERMINALMARINE PIPELINELAND PIPELINE
366220254---33642340
..-
TOTAL 1639 13(I
PRESENT VALUE OF TOTAL COST (@ 8%) = MM$ 2810
AVERAGE TRANSPORTATION COST PER BARREL = $ 6.56
B-10
MANPOWERman-yr
Excl100
Excl.=-120140.-.
360
‘1
0 II
‘1I
—
I
I— I
‘1
-1
I
,
—-!
I–m
-1
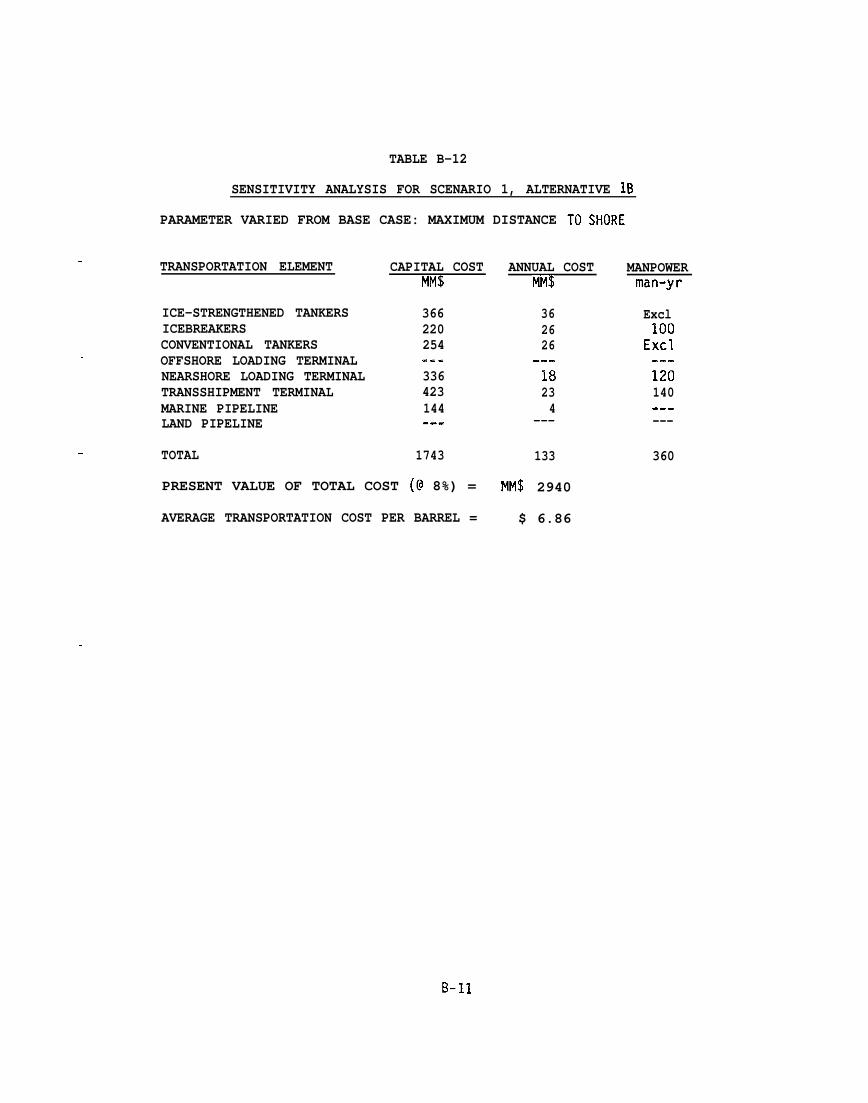
——
—
—
TABLE B-12
SENSITIVITY ANALYSIS FOR SCENARIO 1, ALTERNATIVE lB
PARAMETER VARIED FROM BASE CASE: MAXIMUM DISTANCE TO ‘jHORE
TRANSPORTATION ELEMENT
ICE-STRENGTHENED TANKERSICEBREAKERSCONVENTIONAL TANKERSOFFSHORE LOADING TERMINALNEARSHORE LOADING TERMINALTRANSSHIPMENT TERMINALMARINE PIPELINELAND PIPELINE
CAPITAL COST ANNUAL COSTMM$ MM$
366220254. . .336423144.-.
TOTAL 1743
PRESENT VALUE OF TOTAL COST (@ 8%) =
AVERAGE TRANSPORTATION COST PER BARREL =
362626
-..18234
---
133
MM$ 2940
$ 6.86
MANPOWERman-yr
Excl100
Excl-..120140..----
360
—
——
B-11
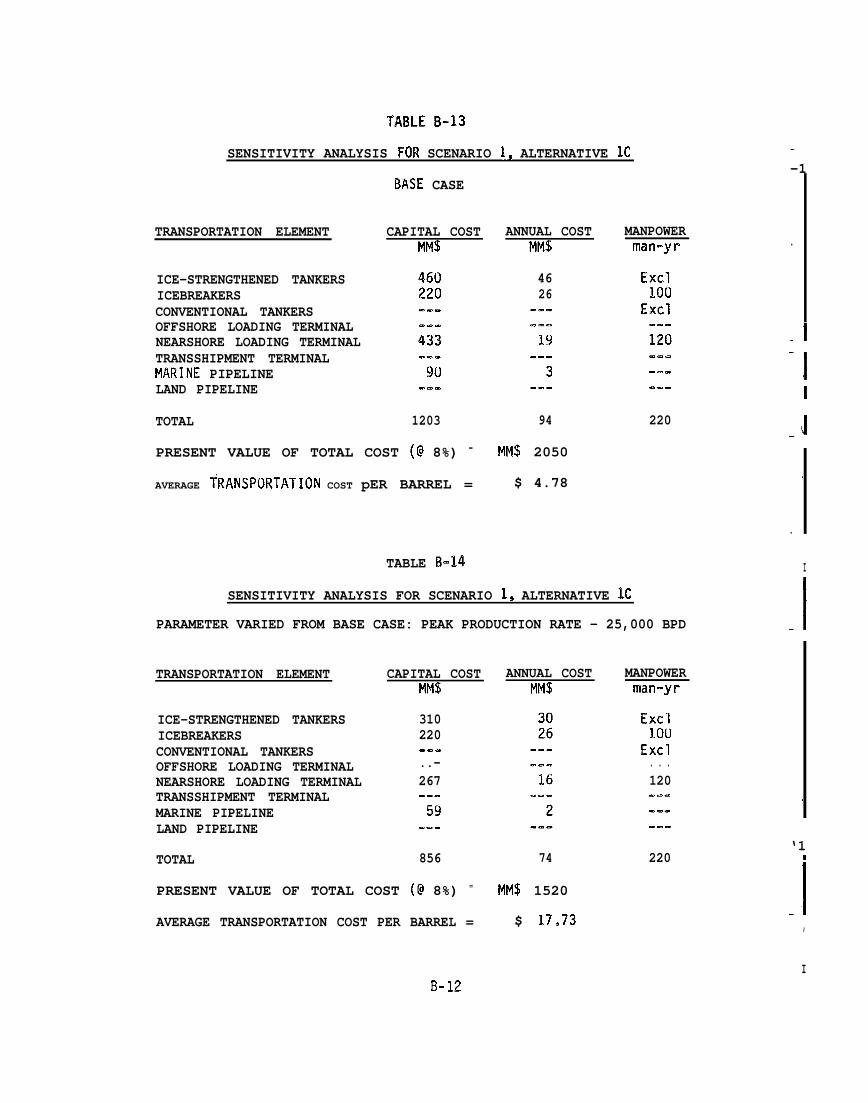
TABLE B-13
SENSITIVITY ANALYSIS FOR SCENARIO 1, ALTERNATIVE IC
BASE CASE
TRANSPORTATION ELEMENT
ICE-STRENGTHENED TANKERSICEBREAKERSCONVENTIONAL TANKERSOFFSHORE LOADING TERMINALNEARSHORE LOADING TERMINALTRANSSHIPMENT TERMINALMARINE PIPELINELAND PIPELINE
TOTAL
CAPITAL COSTMM$
1203
ANNUAL COSTMM$
4626
94
MANPOWERman-yr
220
PRESENT VALUE OF TOTAL COST (@ 8%) = MM$ 2050
AVERAGE tRANSPORTATION COST pER BARREL = $ 4.78
TABLE B-14
SENSITIVITY ANALYSIS FOR SCENARIO 1, ALTERNATIVE IC
PARAMETER VARIED FROM BASE CASE: PEAK PRODUCTION RATE - 25,000 BPD
TRANSPORTATION ELEMENT
ICE-STRENGTHENED TANKERSICEBREAKERSCONVENTIONAL TANKERSOFFSHORE LOADING TERMINALNEARSHORE LOADING TERMINALTRANSSHIPMENT TERMINALMARINE PIPELINELAND PIPELINE
TOTAL
CAPITAL COSTMM$
310220---..-267-..59
.-.
856
ANNUAL COSTMM$
74
PRESENT VALUE OF TOTAL COST (@ 8%) = MM$ 1520
AVERAGE TRANSPORTATION COST PER BARREL = $ 17,73
MANPOWERman-yr
ExclIOU
Excl. . .120.-.
220
—
-1
.
-1
‘1I
_J
/
.
I
,1
/
‘19
—I,
IB-12
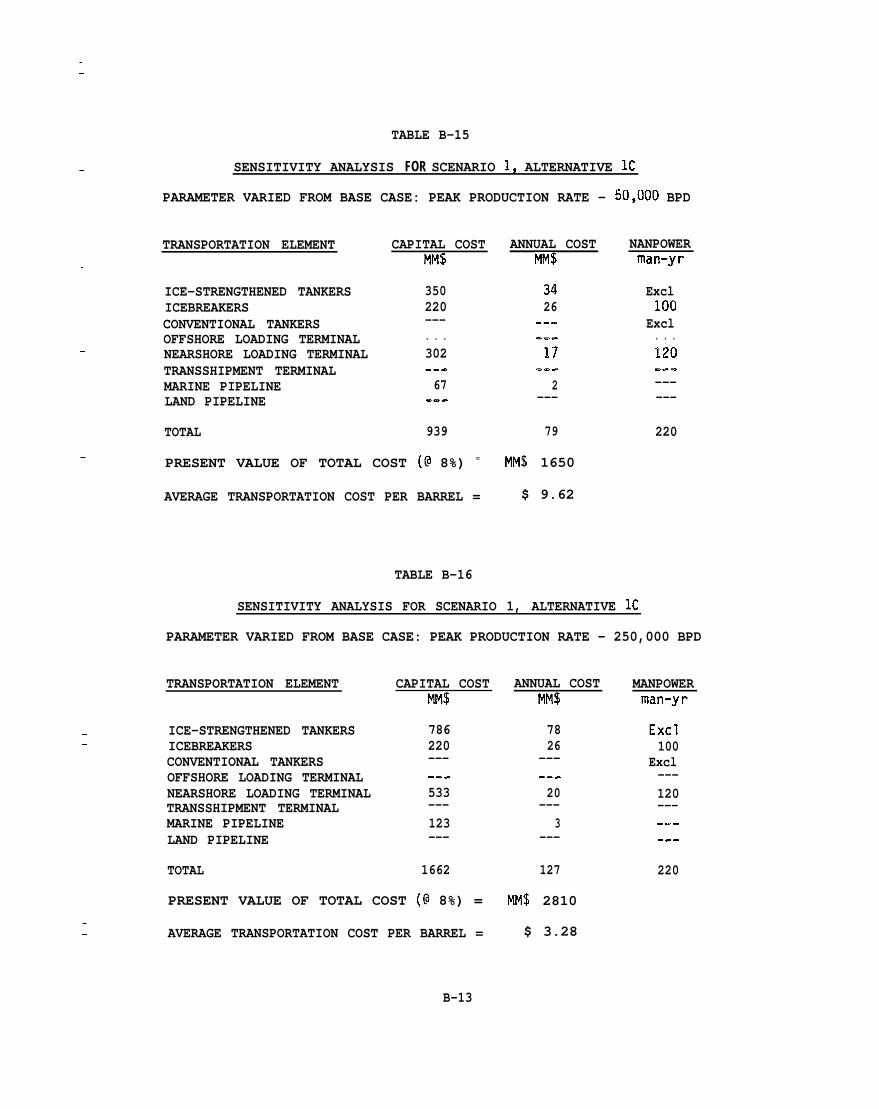
——
TABLE B-15
SENSITIVITY ANALYSIS FOR SCENARIO 1, ALTERNATIVE lC—
PARAMETER VARIED FROM BASE CASE: PEAK PRODUCTION RATE - 50,000 BPD
TRANSPORTATION ELEMENT CAPITAL COST ANNUAL COSTMM$ MM$
NANPOWERman-yr
Excl100
Excl. . .120.-.------
220
—
ICE-STRENGTHENED TANKERS 350 34ICEBREAKERS 220 26CONVENTIONAL TANKERS --- .-.OFFSHORE LOADING TERMINAL . . . ..-NEARSHORE LOADING TERMINAL 302 17TRANSSHIPMENT TERMINAL -.. ..-MARINE PIPELINE 67 2LAND PIPELINE .-- ---
TOTAL 939 79
PRESENT VALUE OF TOTAL COST (@ 8%) = MM$ 1650
AVERAGE TRANSPORTATION COST PER BARREL = $ 9.62
——
—
—
TABLE B-16
SENSITIVITY ANALYSIS FOR SCENARIO 1, ALTERNATIVE lC
PARAMETER VARIED FROM BASE CASE: PEAK PRODUCTION RATE - 250,000 BPD
TRANSPORTATION ELEMENT
ICE-STRENGTHENED TANKERSICEBREAKERSCONVENTIONAL TANKERSOFFSHORE LOADING TERMINALNEARSHORE LOADING TERMINALTRANSSHIPMENT TERMINALMARINE PIPELINELAND PIPELINE
TOTAL
CAPITAL COSTMM$
ANNUAL COSTMM$
MANPOWERman-yr
786220---
7826
---
Excl100
Excl---120---
——
---533---123---
---20
---3
---------
1662 127 220
PRESENT VALUE OF TOTAL COST (@ 8%) = MM$ 2810
AVERAGE TRANSPORTATION COST PER BARREL = $ 3.28——
B-13
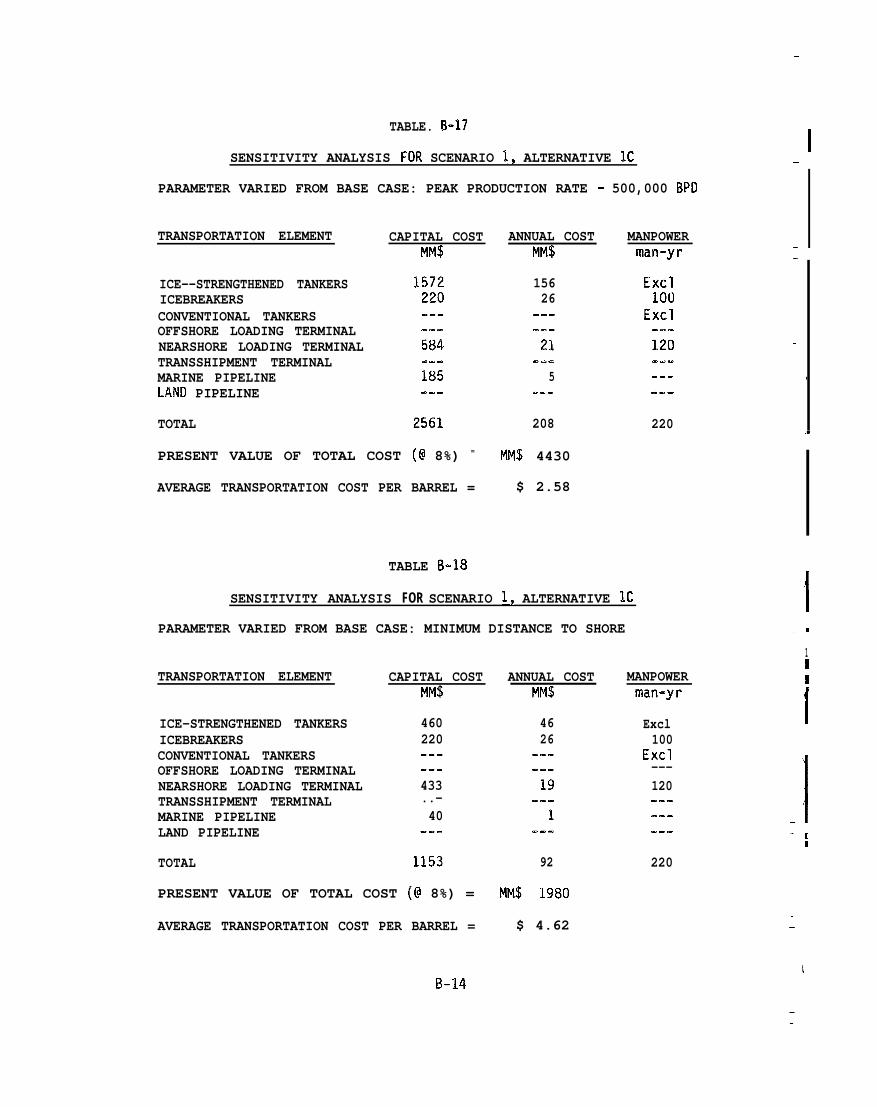
—
TABLE. B-17 .
— ISENSITIVITY ANALYSIS FOR SCENARIO 1, ALTERNATIVE IC
PARAMETER VARIED FROM BASE CASE: PEAK PRODUCTION RATE - 500,000 BPD
—
— ITRANSPORTATION ELEMENT CAPITAL COSTMM$
ANNUAL COSTMM$
MANPOWERman-yr —
——
I
.
ICE--STRENGTHENED TANKERSICEBREAKERSCONVENTIONAL TANKERSOFFSHORE LOADING TERMINALNEARSHORE LOADING TERMINALTRANSSHIPMENT TERMINALMARINE PIPELINELAND PIPELINE
TOTAL
156 Excl26 100
Excl-..120
5 . . .. . . ---
2561 208 220
PRESENT VALUE OF TOTAL COST ((? 8%) = MM$ 4430
AVERAGE TRANSPORTATION COST PER BARREL = $ 2.58
TABLE B-18
SENSITIVITY ANALYSIS FOR SCENARIO 1, ALTERNATIVE IC
PARAMETER VARIED FROM BASE CASE: MINIMUM DISTANCE TO SHORE
—
I1I
TRANSPORTATION ELEMENT CAPITAL COST ANNUAL COSTMM$ MM$
MANPOWERman-yr
Excl100
Excl---120..-.-..-.
220
I
1ICE-STRENGTHENED TANKERSICEBREAKERSCONVENTIONAL TANKERSOFFSHORE LOADING TERMINALNEARSHORE LOADING TERMINALTRANSSHIPMENT TERMINALMARINE PIPELINELAND PIPELINE
TOTAL
460220..-.-.433..-40
-m.
4626
-1–[
:
1153 92
PRESENT VALUE OF TOTAL COST ((? 8%) = MM$ 1980
AVERAGE TRANSPORTATION COST PER BARREL = $ 4.62
B-14
——
——

—
—
—
——
TABLE B-19
SENSITIVITY ANALYSIS FOR SCENARIO 1, ALTERNATIVE lC
PARAMETER VARIED FROM BASE CASE: MAXIMUM DISTANCE TO SHORE
TRANSPORTATION ELEMENT CAPITAL COST ANNUAL COSTMM$ MM$
ICE-STRENGTHENED TANKERS 460 46ICEBREAKERS 220 26CONVENTIONAL TANKERS .-- .=-OFFSHORE LOADING TERMINAL .-e -e.NEARSHORE LOADING TERMINAL 433 19TRANSSHIPMENT TERMINAL -.- . . .MARINE PIPELINE 144 4LAND PIPELINE ..- . . .
TOTAL 1257 95
PRESENT VALUE OF TOTAL COST (@ 8%) = MM$ 2120
AVERAGE TRANSPORTATION COST PER BARREL = $ 4*94
MANPOWERman-yr
Excl100
Excl-e.120.--.=..-.
220
—
——
B-15
—

TABLE B-20
SENSITIVITY ANALYSIS FOR SCENARIO 1, ALTERNATIVE Ill
BASE CASE
TRANSPORTATION ELEMENT CAPITAL COST ANNUAL COSTMM$ MM$
ICE-STRENGTHENED TANKERS 366 36ICEBREAKERS 220 26CONVENTIONAL TANKERS 254 26OFFSHORE LOADING TERMINAL 323 18NEARSHORE LOADING TERMINAL --- ..-TRANSSHIPMENT TERMINAL 423 23MARINE PIPELINE -q. ..-LAND PIPELINE -s. ..-
TOTAL 1586 129
PRESENT VALUE OF TOTAL COST (@ 8%) = MM$ 2750
AVERAGE TRANSPORTATION COST PER BARREL = $ 6.41
MANPOWERman--yr
Excl100
Excl100. . .140-.----
340
TABLE B-21
SENSITIVITY ANALYSIS FOR SCENARIO 1, ALTERNATIVE ID
PARAMETER VARIED FROM BASE CASE: PEAK PRODUCTION RATE - 25,000 BPD
TRANSPORTATION ELEMENT
ICE-STRENGTHENED TANKERSICEBREAKERSCONVENTIONAL TANKERSOFFSHORE LOADING TERMINALNEARSHORE LOADING TERMINALTRANSSHIPMENT TERMINALMARINE PIPELINELAND PIPELINE
TOTAL
CAPITAL COSTMM$
29422(.)136250-a.289. . .-.=
1179
ANNUAL COSTMM$
28262018
. . .20
..----
PRESENT VALUE OF TOTAL COST (@ 8%) = MM$ 2180
AVERAGE TRANSPORTATION COST PER BARREL = $ 25.45
B-16
MANPOWERman-yr
Excl100
Excl100---140. . .---
340
—1
-i—
m
.
I
‘1I
I—
II1
.-—
1
.
.
_l—
I■

TABLE B-22
SENSITIVITY ANALYSIS FOR SCENARIO 1, ALTERNATIVE lD
PARAMETER VARIED FROM BASE CASE: PEAK PRODUCTION RATE - 50,000 BPD
TRANSPORTATION ELEMENT CAPITAL COSTMM$
ANNUAL COSTMM$
MANPOWERman-yr
Excl100
Excl100.-.140.e-.C=
340
ICE-STRENGTHENED TANKERSICEBREAKERSCONVENTIONAL TANKERSOFFSHORE LOADING TERMINALNEARSHORE LOADING TERMINALTRANSSHIPMENT TERMINALMARINE PIPELINELAND PIPELINE
310220204268
30262220
..-21
. . .
. . .
—
---
TOTAL 1309 119
— PRESENT VALUE OF TOTAL COST (@ 8%) = MM$ 2380
AVERAGE TRANSPORTATION COST PER BARREL = $ 13.86
TABLE B-23
SENSITIVITY ANALYSIS FOR SCENARIO 1, ALTERNATIVE lD
PARAMETER VARIED FROM BASE CASE: PEAK PRODUCTION RATE - 250,000 BPD—
TRANSPORTATION ELEMENT CAPITAL COSTMM$
ANNUAL COSTMM$
MANPOWERman-yr
460220429407
46264219
ICE-STRENGTHENED TANKERSICEBREAKERSCONVENTIONAL TANKERSOFFSHORE LOADING TERMINALNEARSHORE LOADING TERMINALTRANSSHIPMENT TERMINALMARINE PIPELINELAND PIPELINE
TOTAL
Excl100
Excl100..-140
—
---23
---473--- ---
--- ---
1989 156 340
PRESENT VALUE OF TOTAL COST (@ 8%) = MM$ 3390
AVERAGE TRANSPORTATION COST PER BARREL = $ 3.95
B-17
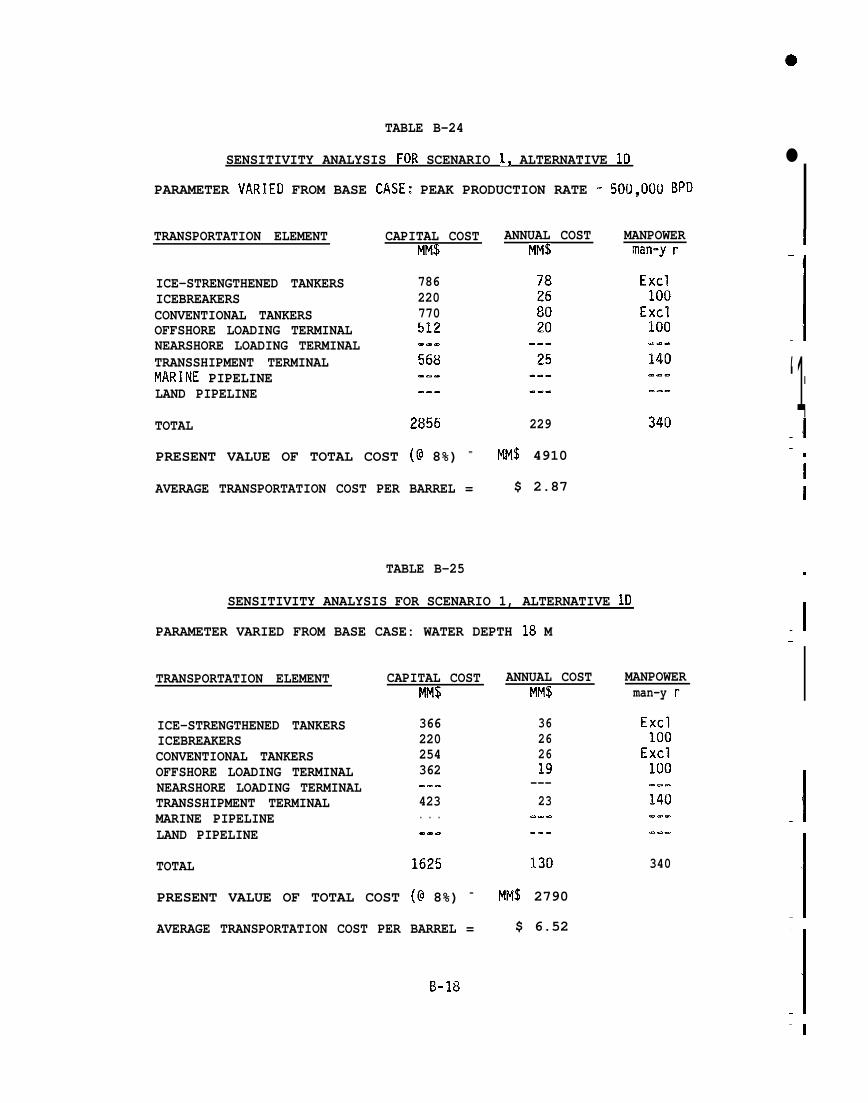
TABLE B-24
●
-1
SENSITIVITY ANALYSIS FOR SCENARIO 1, ALTERNATIVE ID
PARAMETER VARIED FROM BASE CASE: PEAK PRODUCTION RATE - 500,00U BPD
TRANSPORTATION ELEMENT
ICE-STRENGTHENED TANKERSICEBREAKERSCONVENTIONAL TANKERSOFFSHORE LOADING TERMINALNEARSHORE LOADING TERMINALTRANSSHIPMENT TERMINALMARINE PIPELINELAND PIPELINE
TOTAL
CAPITAL COSTMM$
ANNUAL COST MANPOWERMM$ man-y r
‘1I
-1
786220770512--.568--.
Excl100
‘1:-1
--- ---
2856 229 340
PRESENT VALUE OF TOTAL COST (@ 8%) = MM$ 4910
AVERAGE TRANSPORTATION COST PER BARREL = $ 2.87
TABLE B-25
—
i
i
.
SENSITIVITY ANALYSIS FOR SCENARIO 1, ALTERNATIVE ID
-1PARAMETER VARIED FROM BASE CASE: WATER DEPTH 18 M —
ICAPITAL COSTMM$
ANNUAL COSTMM$
MANPOWERman-y r
TRANSPORTATION ELEMENT
36262619
---23
.-.
ICE-STRENGTHENED TANKERSICEBREAKERSCONVENTIONAL TANKERSOFFSHORE LOADING TERMINALNEARSHORE LOADING TERMINALTRANSSHIPMENT TERMINALMARINE PIPELINELAND PIPELINE
TOTAL
366220254362.-.423. . .
—
— I. . .--.
:13401625 130
PRESENT VALUE OF TOTAL COST (@ 8%) = MM$ 2790
AVERAGE TRANSPORTATION COST PER BARREL = $ 6.52
B-18 :1-1
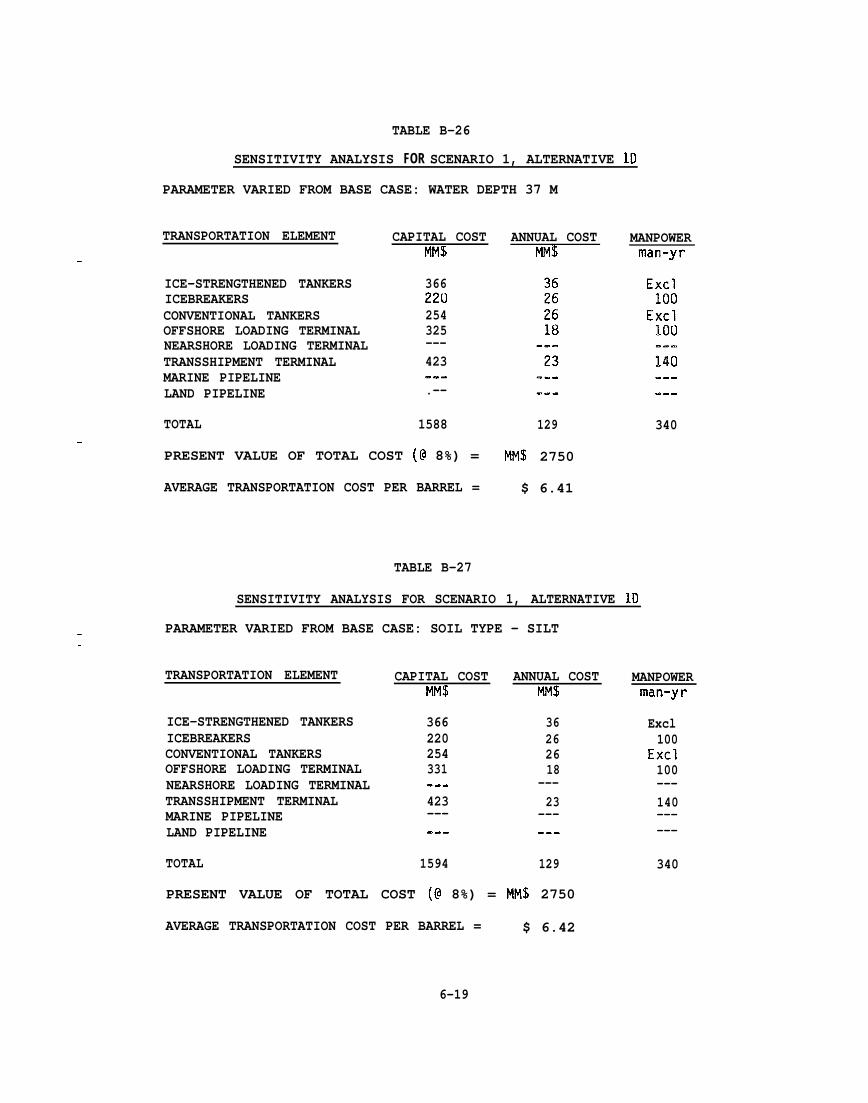
TABLE B-26
SENSITIVITY ANALYSIS FOR SCENARIO 1, ALTERNATIVE 10
PARAMETER VARIED FROM BASE CASE: WATER DEPTH 37 M
TRANSPORTATION ELEMENT—
—
——
ICE-STRENGTHENED TANKERSICEBREAKERSCONVENTIONAL TANKERSOFFSHORE LOADING TERMINALNEARSHORE LOADING TERMINALTRANSSHIPMENT TERMINALMARINE PIPELINELAND PIPELINE
TOTAL
CAPITAL COSTMM$
366220254325---423-e-.--
1588
ANNUAL COSTMM$
129
MANPOWERman-yr
PRESENT VALUE OF TOTAL COST (@ 8%) = MM$ 2750
AVERAGE TRANSPORTATION COST PER BARREL = $ 6.41
TABLE B-27
SENSITIVITY ANALYSIS FOR SCENARIO 1, ALTERNATIVE ID
PARAMETER VARIED FROM BASE CASE: SOIL TYPE - SILT
TRANSPORTATION ELEMENT CAPITAL COST ANNUAL COSTMM$ MM$
ICE-STRENGTHENED TANKERSICEBREAKERSCONVENTIONAL TANKERSOFFSHORE LOADING TERMINALNEARSHORE LOADING TERMINALTRANSSHIPMENT TERMINALMARINE PIPELINELAND PIPELINE
366220254331---423------
36262618
---23
------
TOTAL 1594 129
PRESENT VALUE OF TOTAL COST (@ 8%) = MM$ 2750
--.
340
MANPOWERman-yr
Excl100
Excl100---140------
340
AVERAGE TRANSPORTATION COST PER BARREL = $ 6.42
6-19

TABLE B-28
SENSITIVITY ANALYSIS FOR SCENARIO 1, ALTERNATIVE IE
.
- 1
BASE CASE
MANPOWERrnan-yr
Excl100
Excl120.-.. . .----..
220
TRANSPORTATION ELEMENT CAPITAL COST ANNUAL COSTMPl$ MPI$
:——
ICE-STRENGTHENED TANKERSICEBREAKERSCONVENTIONAL TANKERSOFFSHORE LOADING TERMINALNEARSHORE LOADING TERMINALTRANSSHIPMENT TERMINALMARINE PIPELINELAND PIPELINE
TOTAL
460220
m
---385
I
,:
1065
PRESENT VALUE OF TOTAL COST (@ 8%) = MM$ 1880
AVERAGE TRANSPORTATION COST PER BARREL = $ 4.39I
-1‘1
■
TABLE B-29
SENSITIVITY ANALYSIS FOR SCENARIO 1, ALTERNATIVE lE
PARAMETER VARIED FROM BASE CASE: PEAK PRODUCTION RATE - 25,000 BpD
I
I— 1
Ii1
MANPOWERman-yr
Excl100
Excl120-------..---
220
TRANSPORTATION ELEMENT CAPITAL COST ANNUAL COSTMM$ MM$
ICE-STRENGTHENED TANKERSICEBREAKERSCONVENTIONAL TANKERSOFFSHORE LOADING TERMINALNEARSHORE LOADING TERMINALTRANSSHIPMENT TERMINALMARINE PIPELINELAND PIPELINE
TOTAL
310220
3026
. . .268.-- . . ...- . . .. . .--- . . .
798 74
PRESENT VALUE OF TOTAL COST (@ 8%) = MM$ 1460
AVERAGE TRANSPORTATION COST PER BARREL = $ 17.04
B-20
—
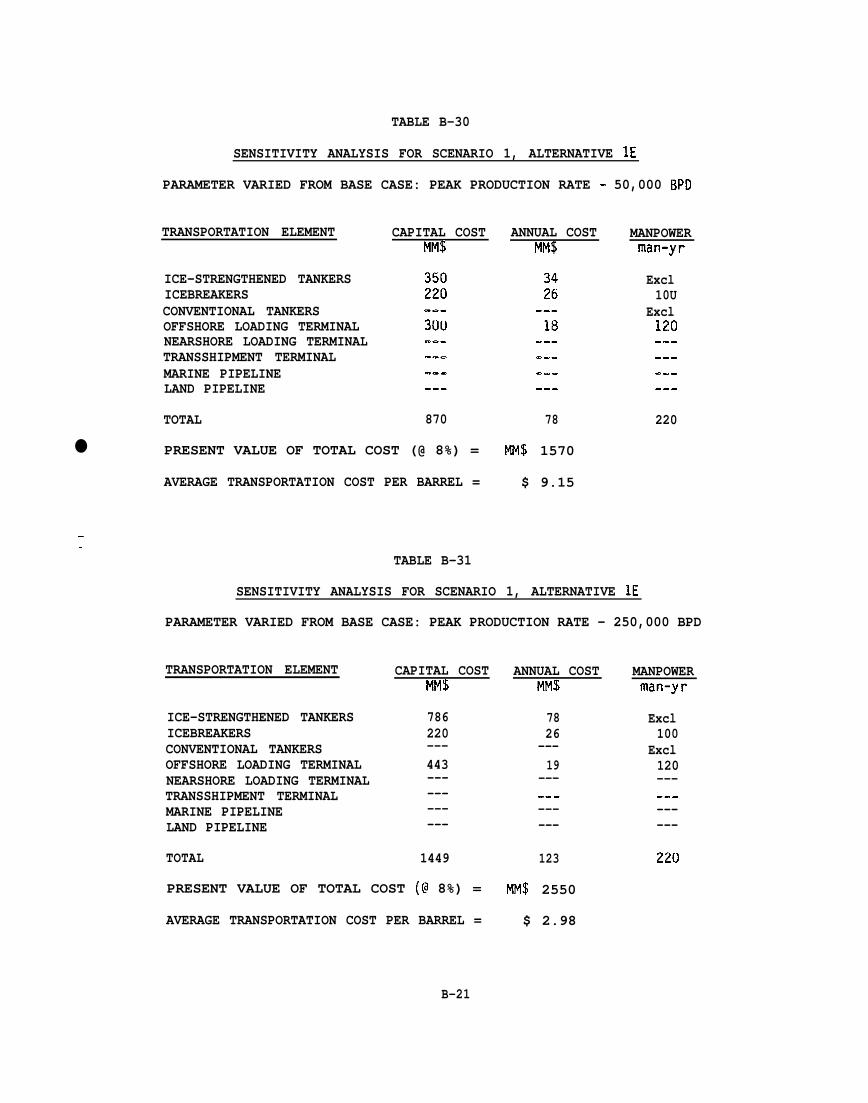
TABLE B-30
SENSITIVITY ANALYSIS FOR SCENARIO 1, ALTERNATIVE IE
PARAMETER VARIED FROM BASE CASE: PEAK PRODUCTION RATE - 50,000 BPD
TRANSPORTATION ELEMENT CAPITAL COSTMM$
ANNUAL COSTMM$
MANPOWERman-yr
—
ICE-STRENGTHENED TANKERSICEBREAKERSCONVENTIONAL TANKERSOFFSHORE LOADING TERMINALNEARSHORE LOADING TERMINALTRANSSHIPMENT TERMINALMARINE PIPELINELAND PIPELINE
TOTAL
Excl10U
Excl120-..
870 78 220
● PRESENT VALUE OF TOTAL COST (@ 8%) = MM$ 1570
AVERAGE TRANSPORTATION COST PER BARREL = $ 9.15
TABLE B-31
——
SENSITIVITY ANALYSIS FOR SCENARIO 1, ALTERNATIVE lE
PARAMETER VARIED FROM BASE CASE: PEAK PRODUCTION RATE - 250,000 BPD
TRANSPORTATION ELEMENT
ICE-STRENGTHENED TANKERSICEBREAKERSCONVENTIONAL TANKERSOFFSHORE LOADING TERMINALNEARSHORE LOADING TERMINALTRANSSHIPMENT TERMINALMARINE PIPELINELAND PIPELINE
TOTAL
CAPITAL COSTMM$
ANNUAL COSTMM$
MANPOWERman-yr
Excl100
Excl120----.-------
220
786220---443------------
7826
---19
----.-------
1449 123
PRESENT VALUE OF TOTAL COST ((? 8%) = MM$ 2550
AVERAGE TRANSPORTATION COST PER BARREL = $ 2.98
B-21.
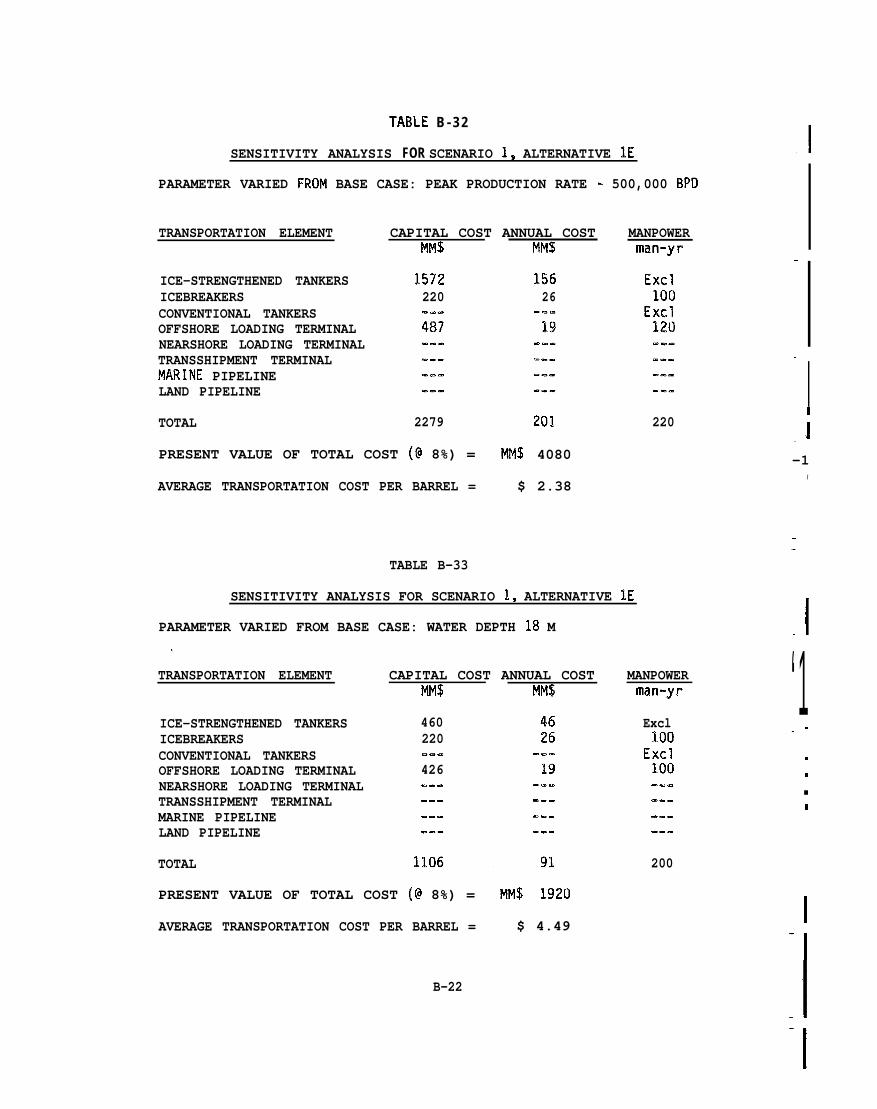
—
TABLE B - 3 2
-1SENSITIVITY ANALYSIS FOR SCENARIO 1, ALTERNATIVE IE
PARAMETER VARIED FROM BASE CASE: PEAK PRODUCTION RATE - 500,000 BPD
TRANSPORTATION ELEMENT CAPITAL COST ANNUAL COSTMM$ MM$
MANPOWERman-yr
—
15626
ICE-STRENGTHENED TANKERSICEBREAKERSCONVENTIONAL TANKERSOFFSHORE LOADING TERMINALNEARSHORE LOADING TERMINALTRANSSHIPMENT TERMINALMARINE PIPELINELAND PIPELINE
TOTAL
1572220
487
—
I.i-1
,
---
2279 201 220
PRESENT VALUE OF TOTAL COST (@ 8%) = MM$ 4080
AVERAGE TRANSPORTATION COST PER BARREL = $ 2.38
TABLE B-33
——
SENSITIVITY ANALYSIS FOR SCENARIO 1, ALTERNATIVE IE
-1PARAMETER VARIED FROM BASE CASE: WATER DEPTH 18 M
‘1I
TRANSPORTATION ELEMENT CAPITAL COST ANNUAL COSTMM$ MP4$
MANPOWERman-yr
Excl100
Excl100-.=-..-.--..
200
ICE-STRENGTHENED TANKERSICEBREAKERSCONVENTIONAL TANKERSOFFSHORE LOADING TERMINALNEARSHORE LOADING TERMINALTRANSSHIPMENT TERMINALMARINE PIPELINELAND PIPELINE
TOTAL
460 ..220
.426
------ .-.
---
PRESENT VALUE OF TOTAL COST (@ 8%) = MM$ 1920
AVERAGE TRANSPORTATION COST PER BARREL = $ 4.49
B-22
. I
1—
I
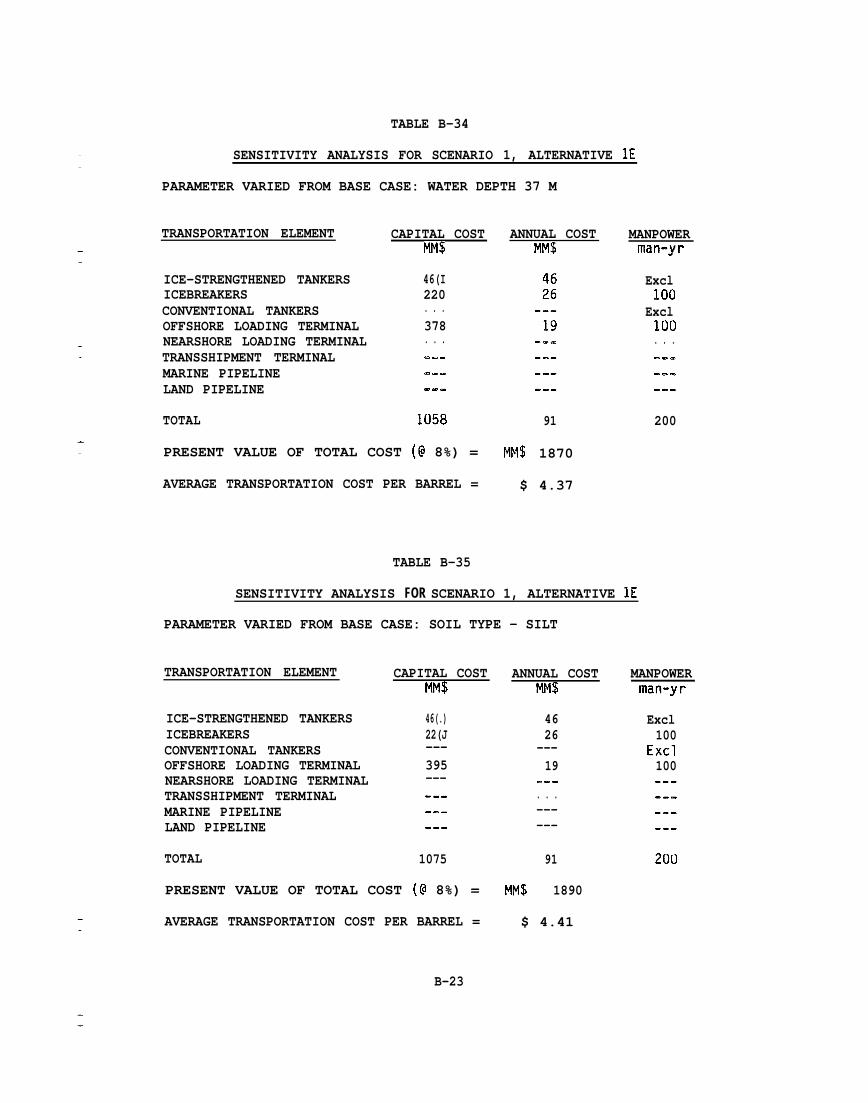
TABLE B-34
SENSITIVITY ANALYSIS FOR SCENARIO 1, ALTERNATIVE lE
PARAMETER VARIED FROM BASE CASE: WATER DEPTH 37 M
TRANSPORTATION ELEMENT
ICE-STRENGTHENED TANKERSICEBREAKERSCONVENTIONAL TANKERSOFFSHORE LOADING TERMINALNEARSHORE LOADING TERMINALTRANSSHIPMENT TERMINALMARINE PIPELINELAND PIPELINE
TOTAL
CAPITAL COSTMM$
46(I220. . .378. . .
---
1058
ANNUAL COSTMM$
91
MANPOWERrrtan-=yr
PRESENT VALUE OF TOTAL COST (@ 8%) = MM$ 1870
AVERAGE TRANSPORTATION COST PER BARREL = $ 4.37
TABLE B-35
SENSITIVITY ANALYSIS FOR SCENARIO 1, ALTERNATIVE lE
PARAMETER VARIED FROM BASE CASE: SOIL TYPE - SILT
TRANSPORTATION ELEMENT
ICE-STRENGTHENED TANKERSICEBREAKERSCONVENTIONAL TANKERSOFFSHORE LOADING TERMINALNEARSHORE LOADING TERMINALTRANSSHIPMENT TERMINALMARINE PIPELINELAND PIPELINE
TOTAL
CAPITAL COSTMM$
46(.)22(J---395------------
1075
ANNUAL COSTMM$
4626
---19
..-
. . .------
91
Excl100
Excl100. . .
200
MANPOWERman-yr
Excl100
Excl100------------
200
PRESENT VALUE OF TOTAL COST (@ 8%) = MM$ 1890
AVERAGE TRANSPORTATION COST PER BARREL = $ 4.41
B-23
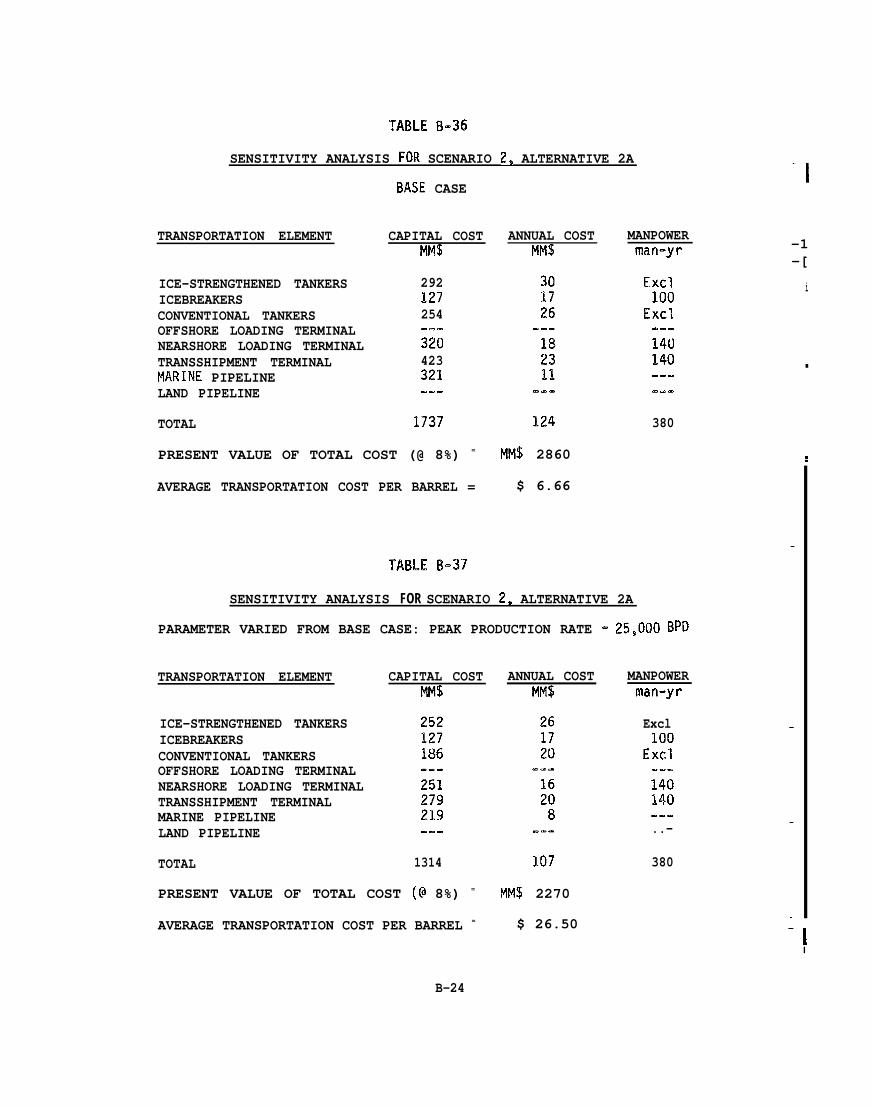
TABLE B-36
SENSITIVITY ANALYSIS FOR SCENARIO 29 ALTERNATIVE 2A
BASE CASE
TRANSPORTATION ELEMENT
ICE-STRENGTHENED TANKERSICEBREAKERSCONVENTIONAL TANKERSOFFSHORE LOADING TERMINALNEARSHORE LOADING TERMINALTRANSSHIPMENT TERMINALMARINE PIPELINELAND PIPELINE
TOTAL
CAPITAL COSTMM$
292127254.=.320423321--.
1737
ANNUAL COSTMM$
124
MANPOWERrnan=-yr
Excl100
Excl..=14Ll140..-
380
PRESENT VALUE OF TOTAL COST (@ 8%) = MM$ 2860
AVERAGE TRANSPORTATION COST PER BARREL = $ 6.66
TABLE B-37
SENSITIVITY ANALYSIS FOR SCENARIO 29 ALTERNATIVE 2A
PARAMETER VARIED FROM BASE CASE: PEAK PRODUCTION RATE - 25,000 BPD
TRANSPORTATION ELEMENT
ICE-STRENGTHENED TANKERSICEBREAKERSCONVENTIONAL TANKERSOFFSHORE LOADING TERMINALNEARSHORE LOADING TERMINALTRANSSHIPMENT TERMINALMARINE PIPELINELAND PIPELINE
TOTAL
CAPITAL COSTMM$
1314
ANNUAL COSTMM$
107
PRESENT VALUE OF TOTAL COST (@ 8%) = MM$ 2270
AVERAGE TRANSPORTATION COST PER BARREL = $ 26.50
MANPOWERman-yr
Excl100
Excl.-.140140-.-..-
380
-1-[
i
■
:
—
.
—
—
—
‘1I
B-24
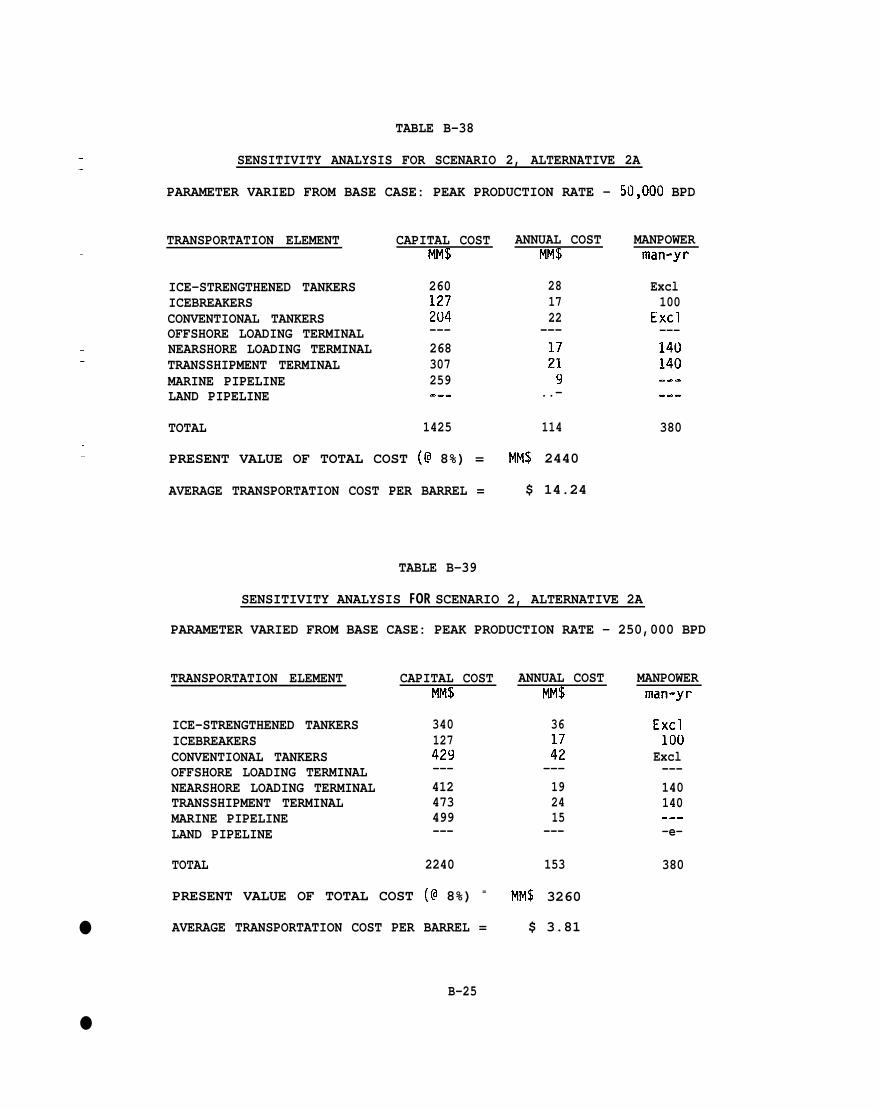
●
●
TABLE B-38
SENSITIVITY ANALYSIS FOR SCENARIO 2, ALTERNATIVE 2A
PARAMETER VARIED FROM BASE CASE: PEAK PRODUCTION RATE - 50,000 BPD
TRANSPORTATION ELEMENT
ICE-STRENGTHENED TANKERSICEBREAKERSCONVENTIONAL TANKERSOFFSHORE LOADING TERMINALNEARSHORE LOADING TERMINALTRANSSHIPMENT TERMINALMARINE PIPELINELAND PIPELINE
TOTAL
CAPITAL COSTMM$
260127204---268307259-=.
1425
ANNUAL COSTMM$
281722
---17219
..-
114
MANPOWERman-yr
Excl100
Excl---140140------
380
PRESENT VALUE OF TOTAL COST (@ 8%) = MM$ 2440
AVERAGE TRANSPORTATION COST PER BARREL = $ 14.24
TABLE B-39
SENSITIVITY ANALYSIS FOR SCENARIO 2, ALTERNATIVE 2A
PARAMETER VARIED FROM BASE CASE: PEAK PRODUCTION RATE - 250,000 BPD
TRANSPORTATION ELEMENT
ICE-STRENGTHENED TANKERSICEBREAKERSCONVENTIONAL TANKERSOFFSHORE LOADING TERMINALNEARSHORE LOADING TERMINALTRANSSHIPMENT TERMINALMARINE PIPELINELAND PIPELINE
TOTAL
CAPITAL COST ANNUAL COSTMM$ MM$
340 36127429 :;--- ---412 19473 24499 15--- ---
2240 153
PRESENT VALUE OF TOTAL COST (@ 8%) = MM$ 3260
AVERAGE TRANSPORTATION COST PER BARREL = $ 3.81
B-25
MANPOWERman-yr
Excl100
Excl---140140.e--e-
380

TABLE B-40
SENSITIVITY ANALYSIS FOR SCENARIO 2, ALTERNATIVE 2AI
——
■
PARAMETER VARIED FROM BASE CASE: PEAK PRODUCTION RATE - 500,000 BPD
TRANSPORTATION ELEMENT CAPITAL COSTMM$
ANNUAL COSTMM$
MANPOWERman-yi-
ICE-STRENGTHENED TANKERSICEBREAKERSCONVENTIONAL TANKERSOFFSHORE LOADING TERMINALNEARSHORE LOADING TERMINALTRANSSHIPMENT TERMINALMARINE PIPELINELAND PIPELINE
TOTAL
438127770. . .591568707. . .
3201 213 380
PRESENT VALUE OF TOTAL COST (@ 8%) = MM$ 5130
AVERAGE TRANSPORTATION COST PER BARREL = $ 2.99
TABLE B-41
SENSITIVITY ANALYSIS FOR SCENARIO 2, ALTERNATIVE 2A
PARAMETER VARIED FROM BASE CASE: MINIMUM DISTANCE TO SHORE—
TRANSPORTATION ELEMENT CAPITAL COSTMM$
ANNUAL COSTMM$
MANPOWERman-yr
■
ICE-STRENGTHENED TANKERSICEBREAKERSCONVENTIONAL TANKERSOFFSHORE LOADING TERMINALNEARSHORE LOADING TERMINALTRANSSHIPMENT TERMINALMARINE PIPELINELAND PIPELINE
TOTAL
292127254
301726
Excl100
Excl-e.140140--.
---
320423242.m.
1
——
1658 122 380
PRESENT VALUE OF TOTAL COST (@ 8%) = MM$ 2750
AVERAGE TRANSPORTATION COST PER BARREL = $ 6.41—
I
B-26—

TABLE B-42
SENSITIVITY ANALYSIS FOR SCENARIO 2, ALTERNATIVE 2A
PARAMETER VARIED FROM BASE CASE: MAXIMUM DISTANCE TO SHORE
TRANSPORTATION ELEMENT
ICE-STRENGTHENED TANKERSICEBREAKERSCONVENTIONAL TANKERSOFFSHORE LOADING TERMINALNEARSHORE LOADING TERMINALTRANSSHIPMENT TERMINALMARINE PIPELINELAND PIPELINE
TOTAL
CAPITAL COST ANNUAL COSTMM$ MM$
292127254. . .32(.)423428.-.
1844
301726
. . .182315
..-
129
MANPOWERman-yr
Excl100
Excl-..140140-q-.a-
380
PRESENT VALUE OF TOTAL COST (@ 8%) = MM$ 3010
AVERAGE TRANSPORTATION COST PER BARREL = $ 7.02
B-27
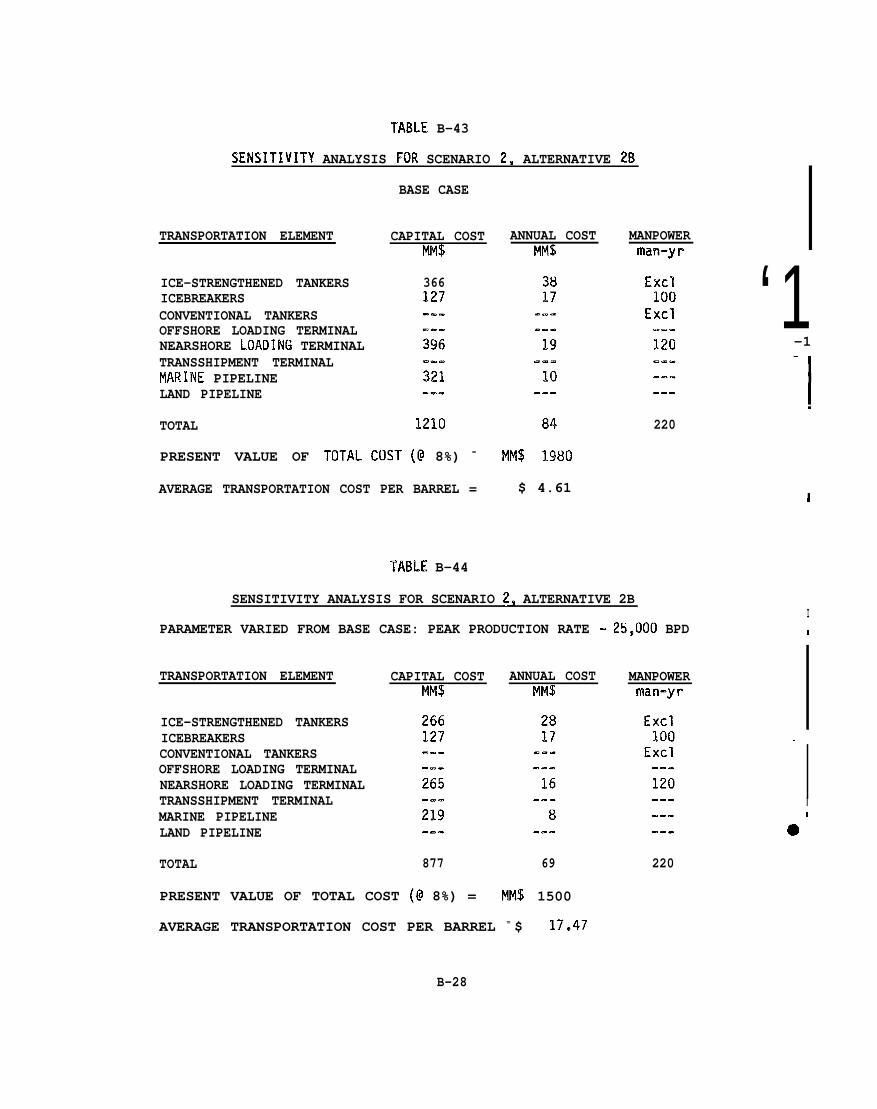
TABLE B-43
SENSITIVITY ANALYSIS FOR SCENARIO 2, ALTERNATIVE 2B
BASE CASE
MANPOWERTRANSPORTATION ELEMENT
ICE-STRENGTHENED TANKERSICEBREAKERSCONVENTIONAL TANKERSOFFSHORE LOADING TERMINALNEARSHORE LOAI)ING TERMINALTRANSSHIPMENT TERMINALMARINE PIPELINELAND PIPELINE
TOTAL
CAPITAL COST ANNUAL COSTMkl$ MM$ rn?in=-yr
Excl100
Excl ‘1-..120 -1
366127
3817
84 220
PRESENT VALUE OF TOTAL COST (@ 8%) = MM$ 1980
AVERAGE TRANSPORTATION COST PER BARREL = $ 4.611
TABLE B-44
SENSITIVITY ANALYSIS FOR SCENARIO 2, ALTERNATIVE 2BI
PARAMETER VARIED FROM BASE CASE: PEAK PRODUCTION RATE - 25,000 BPD B
TRANSPORTATION ELEMENT CAPITAL COSTMM$
ANNUAL COSTMM$
MANPOWERman-yr
ICE-STRENGTHENED TANKERSICEBREAKERSCONVENTIONAL TANKERSOFFSHORE LOADING TERMINALNEARSHORE LOADING TERMINALTRANSSHIPMENT TERMINALMARINE PIPELINELAND PIPELINE
TOTAL
—
I.0’
877 69 220
PRESENT VALUE OF TOTAL COST (@ 8%) = MM$ 1500
AVERAGE TRANSPORTATION COST PER BARREL = $ 17.47
B-28
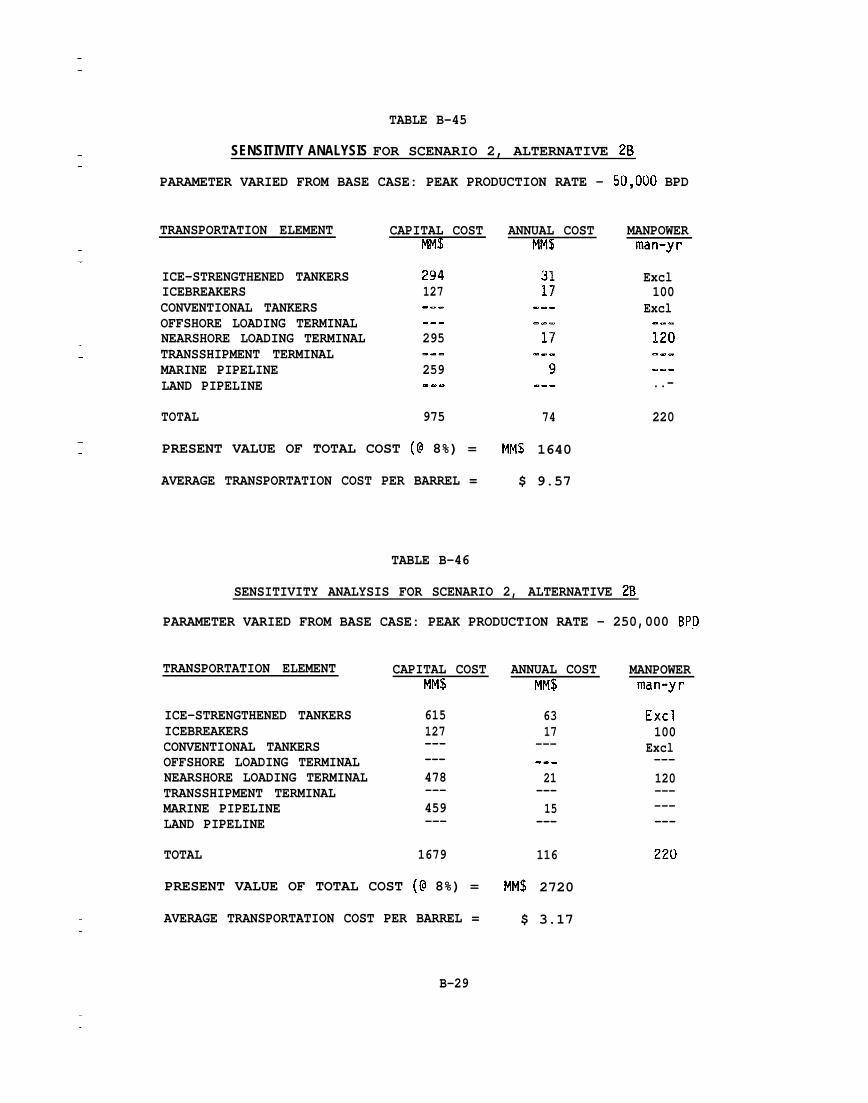
TABLE B-45
SENSITIVITY ANALYSIS FOR SCENARIO 2, ALTERNATIVE 2B
PARAMETER VARIED FROM BASE CASE: PEAK PRODUCTION RATE - 50,000 BPD
TRANSPORTATION ELEMENT
ICE-STRENGTHENED TANKERSICEBREAKERSCONVENTIONAL TANKERSOFFSHORE LOADING TERMINALNEARSHORE LOADING TERMINALTRANSSHIPMENT TERMINALMARINE PIPELINELAND PIPELINE
TOTAL
CAPITAL COSTMM$
294127------295
259..-
975
ANNUAL COSTMM$
74
MANPOWERman-yr
Excl100
Excl.-.120.m..--..-
220
PRESENT VALUE OF TOTAL COST ((? 8%) = MM$ 1640
AVERAGE TRANSPORTATION COST PER BARREL = $ 9.57
TABLE B-46
SENSITIVITY ANALYSIS FOR SCENARIO 2, ALTERNATIVE 2B
PARAMETER VARIED FROM BASE CASE: PEAK PRODUCTION RATE - 250,000 BPD
TRANSPORTATION ELEMENT
ICE-STRENGTHENED TANKERSICEBREAKERSCONVENTIONAL TANKERSOFFSHORE LOADING TERMINALNEARSHORE LOADING TERMINALTRANSSHIPMENT TERMINALMARINE PIPELINELAND PIPELINE
TOTAL
CAPITAL COST ANNUAL COSTMM$ MM$
615127------478---459---
1679
6317
------21
---15
---
116
PRESENT VALUE OF TOTAL COST (@ 8%) = MM$ 2720
AVERAGE TRANSPORTATION COST PER BARREL = $ 3.17
B-29
MANPOWERman-yr
Excl100
Excl---120---------
220
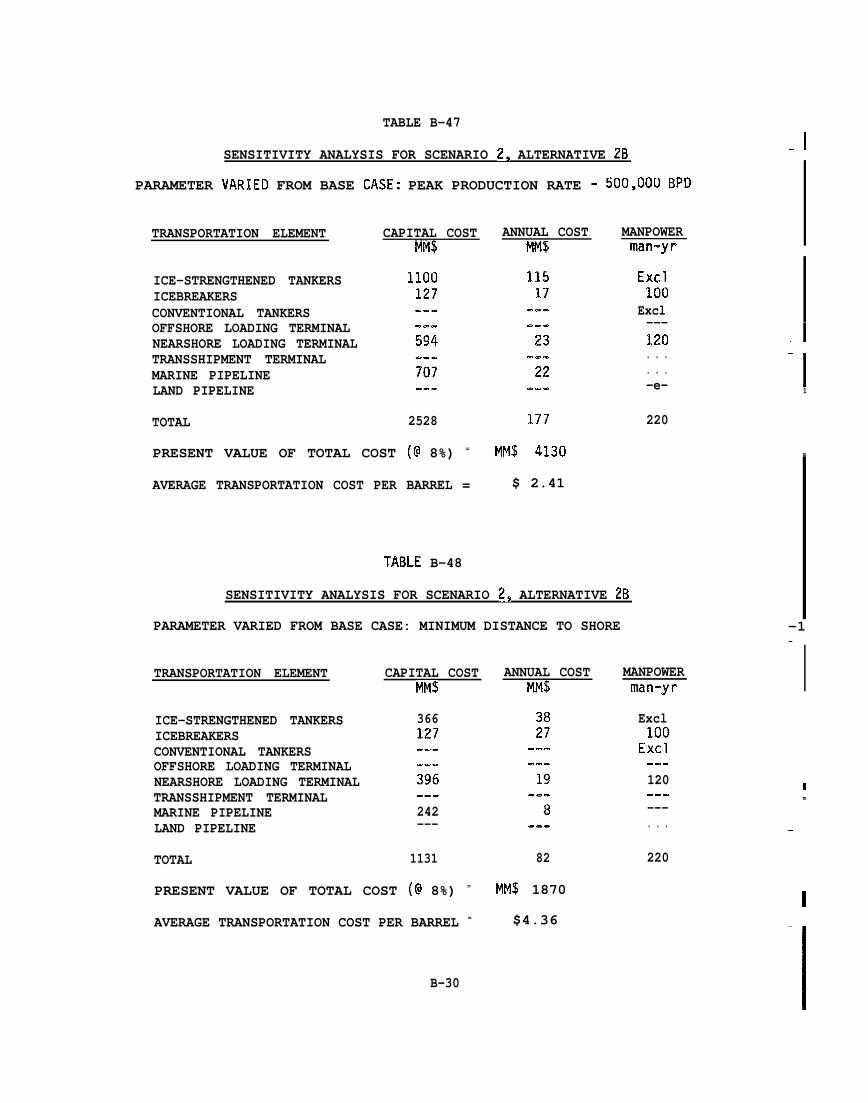
TABLE B-47
SENSITIVITY ANALYSIS FOR SCENARIO 2, ALTERNATIVE 2B
PARAMETER VARIED FROM BASE CASE.: PEAK PRODUCTION RATE - 500,000 BpD
TRANSPORTATION ELEMENT
ICE-STRENGTHENED TANKERSICEBREAKERSCONVENTIONAL TANKERSOFFSHORE LOADING TERMINALNEARSHORE LOADING TERMINALTRANSSHIPMENT TERMINALMARINE PIPELINELAND PIPELINE
TOTAL
CAPITAL COSTMM$
2528
ANNUAL COSTMM$
177
MANPOWERman-yr
Excl100
Excl---120. . .. . .-e-
220
PRESENT VALUE OF TOTAL COST (@ 8%) = MM$ 4130
AVERAGE TRANSPORTATION COST PER BARREL = $ 2.41
TABLE B-48
SENSITIVITY ANALYSIS FOR SCENARIO 2, ALTERNATIVE 2B
PARAMETER VARIED FROM BASE CASE: MINIMUM DISTANCE TO SHORE
TRANSPORTATION ELEMENT
ICE-STRENGTHENED TANKERSICEBREAKERSCONVENTIONAL TANKERSOFFSHORE LOADING TERMINALNEARSHORE LOADING TERMINALTRANSSHIPMENT TERMINALMARINE PIPELINELAND PIPELINE
TOTAL
CAPITAL COSTMM$
366127.-..-.396.-.242---
1131
ANNUAL COSTMM$
82
PRESENT VALUE OF TOTAL COST (@ 8%) = MM$ 1870
AVERAGE TRANSPORTATION COST PER BARREL = $4.36
B-30
MANPOWERman-yr
Excl100
Excl-..120..----. . .
220
— I
-1
‘11
m
-1—
I1m
—
I
‘1I
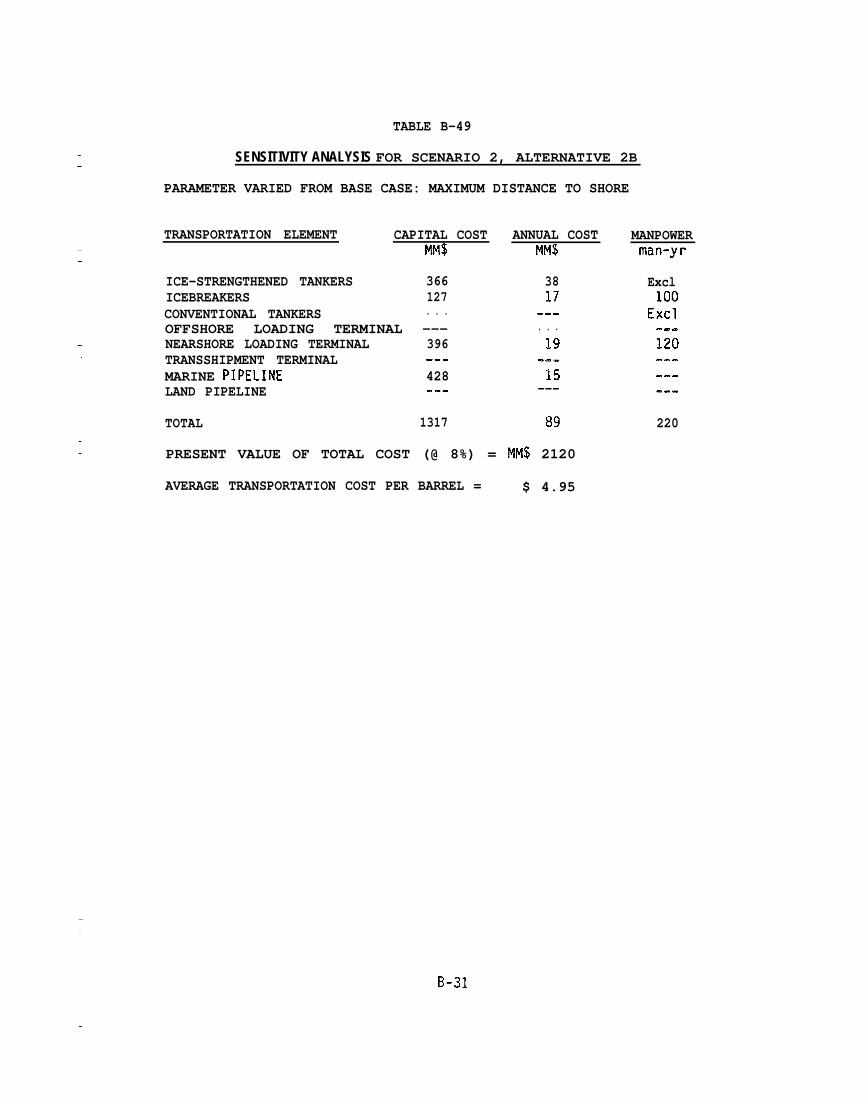
TABLE B-49
SENSITIVITY ANALYSIS FOR SCENARIO 2, ALTERNATIVE 2B
PARAMETER VARIED FROM BASE CASE: MAXIMUM DISTANCE TO SHORE
TRANSPORTATION ELEMENT CAPITAL COST ANNUAL COSTMM$ MM$
ICE-STRENGTHENED TANKERS 366 38ICEBREAKERS 127 17CONVENTIONAL TANKERS . . . ..=OFFSHORE LOADING TERMINAL --- . . .NEARSHORE LOADING TERMINAL 396 19TRANSSHIPMENT TERMINAL m-. Q-.MARINE PIPELINE 428 15LAND PIPELINE ..- ---
TOTAL 1317 89
PRESENT VALUE OF TOTAL COST (@ 8%) = MM$ 2120
AVERAGE TRANSPORTATION COST PER BARREL = $ 4.95
MANPOWERman-yr
Excl100
Excl-..120-..-c---.
220
B-31

TABLE B-50
SENSITIVITY ANALYSIS FOR SCENARIO 2, ALTERNATIVE 2C
TRANSPORTATION ELEMENT
ICE-STRENGTHENED TANKERSICEBREAKERSCONVENTIONAL TANKERSOFFSHORE LOADING TERMINALNEARSHORE LOADING TERMINALTRANSSHIPMENT TERMINALMARINE PIPELINELAND PIPELINE
TOTAL
BASE CASE
CAPITAL COSTMbl$
26480
254.=.437423796.--
2254
ANNUAL COSTMM$
281226
---222328
.-.
139
PRESENT VALUE OF TOTAL COST (@ 8%) = MM$ 3510
AVERAGE TRANSPORTATION COST PER BARREL = $ 8.18
MANPOWERman-yr=
Excl100
Excl.-.140140..----
380
TABLE B-51
SENSITIVITY ANALYSIS FOR SCENARIO 2, ALTERNATIVE 2C
PARAMETER VARIED FROM BASE CASE: PEAK PRODUCTION RATE - 25,000BPD
TRANSPORTATION ELEMENT
ICE-STRENGTHENED TANKERSICEBREAKERSCONVENTIONAL TANKERSOFFSHORE LOADING TERMINALNEARSHORE LOADING TERMINALTRANSSHIPMENT TERMINALMARINE PIPELINELAND PIPELINE
TOTAL
CAPITAL COST ANNUAL COSTMM$ MM$
23480
186-e.365279484---
1628 115
PRESENT VALUE OF TOTAL COST (@ 8%) = MM$ 2 6 7 0
AVERAGE TRANSPORTATION COST PER BARREL = $ 31.10
MANPOWERman-yr
Excl100
Excl..-140140. . .---
380
—
I.
. I—
.—— I
‘1
— I‘1.:
i‘1
1
B-32
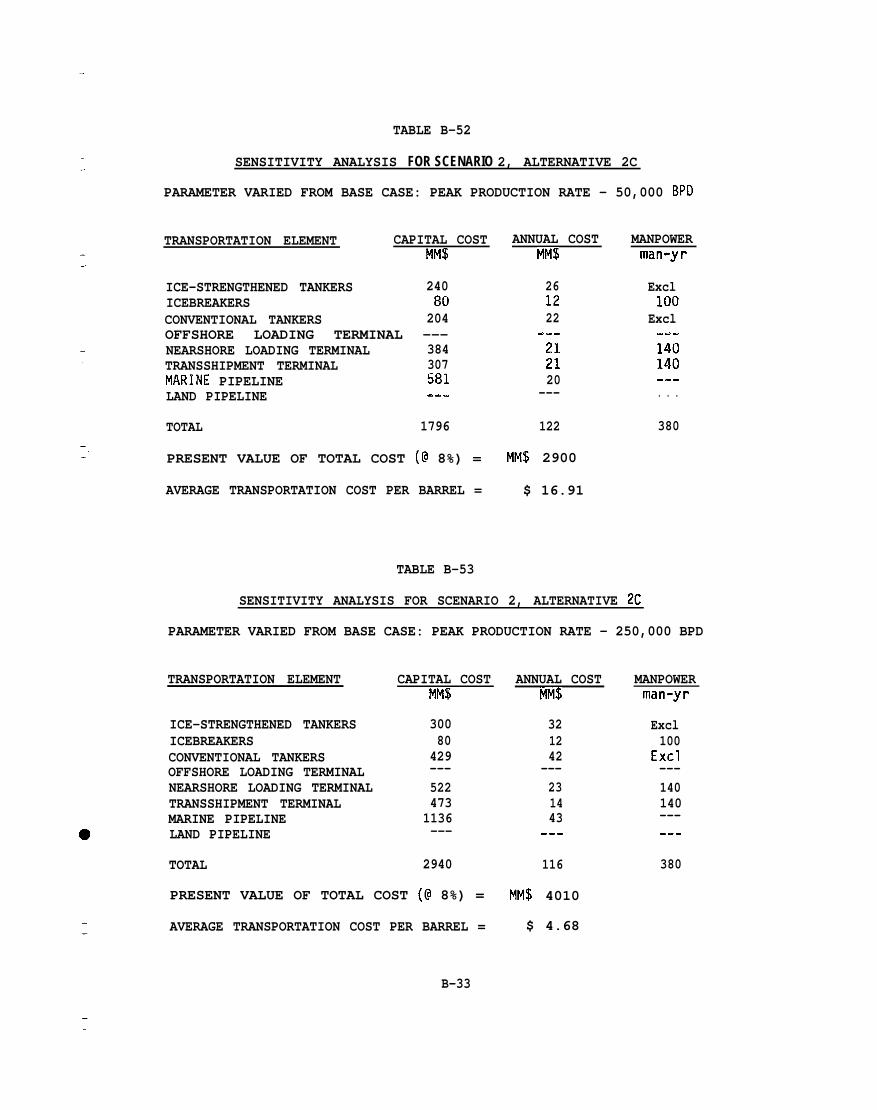
TABLE B-52
o
SENSITIVITY ANALYSIS FOR SCENARIO 2, ALTERNATIVE 2C
PARAMETER VARIED FROM BASE CASE: PEAK PRODUCTION RATE - 50,000 BPD
TRANSPORTATION ELEMENT CAPITAL COST ANNUAL COSTMM$ MM$
ICE-STRENGTHENED TANKERS 240 26ICEBREAKERS 80 12CONVENTIONAL TANKERS 204 22OFFSHORE LOADING TERMINAL --- ..-NEARSHORE LOADING TERMINAL 384 21TRANSSHIPMENT TERMINAL 307 21MARINE PIPELINE 581 20LAND PIPELINE .-. ---
TOTAL 1796 122
PRESENT VALUE OF TOTAL COST (@ 8%) = MM$ 2900
AVERAGE TRANSPORTATION COST PER BARREL = $ 16.91
MANPOWERman-yr
Excl100
Excl.-.140140.-.. . .
380
TABLE B-53
SENSITIVITY ANALYSIS FOR SCENARIO 2, ALTERNATIVE 2C
PARAMETER VARIED FROM BASE CASE: PEAK PRODUCTION RATE - 250,000 BPD
TRANSPORTATION ELEMENT
ICE-STRENGTHENED TANKERSICEBREAKERSCONVENTIONAL TANKERSOFFSHORE LOADING TERMINALNEARSHORE LOADING TERMINALTRANSSHIPMENT TERMINALMARINE PIPELINELAND PIPELINE
TOTAL
CAPITAL COST ANNUAL COST MANPOWERMM$ MM$ man-yr
30080
429---5224731136---
2940
321242
---231443
---
116
Excl100
Excl---140140------
380
PRESENT VALUE OF TOTAL COST (@ 8%) = MM$ 4010
AVERAGE TRANSPORTATION COST PER BARREL = $ 4.68
B-33
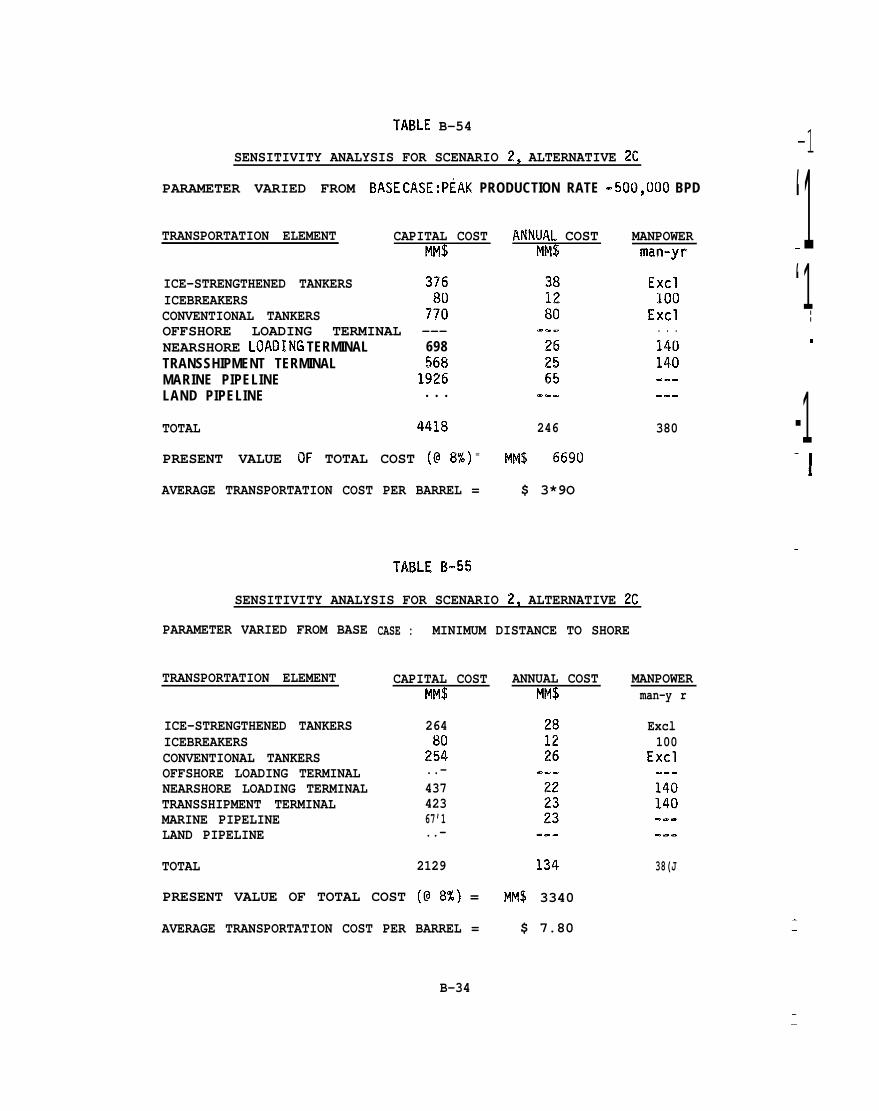
—
TABLE B-54-1SENSITIVITY ANALYSIS FOR SCENARIO 2, ALTERNATIVE 2C
—‘1PARAMETER VARIED FROM BASE CASE: PEAK PRODUCTION RATE - 500,UO0 BPD
TRANSPORTATION ELEMENT CAPITAL COSTMM$
ANNUAL COSTMM$
MANPOWERman-yr
‘1II
ICE-STRENGTHENED TANKERS 376ICEBREAKERS 80CONVENTIONAL TANKERS 770OFFSHORE LOADING TERMINAL ---NEARSHORE LOADING TERMINAL 698TRANSSHIPMENT TERMINAL 568MARINE PIPELINE 1!326LAND PIPELINE . . .
Excl100
Excl. . .140140-e.-..
.
-1380TOTAL 4418 246
PRESENT VALUE OF TOTAL COST (@ 8??) = MM$ 669(.) —
IAVERAGE TRANSPORTATION COST PER BARREL = $ 3*9O
——
TABLE B-55
SENSITIVITY ANALYSIS FOR SCENARIO 2, ALTERNATIVE 2C
PARAMETER VARIED FROM BASE CASE : MINIMUM DISTANCE TO SHORE
TRANSPORTATION ELEMENT CAPITAL COSTMM$
ANNUAL COSTMM$
MANPOWERman-y r
ICE-STRENGTHENED TANKERSICEBREAKERSCONVENTIONAL TANKERSOFFSHORE LOADING TERMINALNEARSHORE LOADING TERMINALTRANSSHIPMENT TERMINALMARINE PIPELINELAND PIPELINE
TOTAL
264
2::..-43742367’1..-
Excl100
Excl-..140140-..
2129 134 38(J
PRESENT VALUE OF TOTAL COST (@ 8%) = FIM$ 3340
AVERAGE TRANSPORTATION COST PER BARREL = $ 7.80
B-34
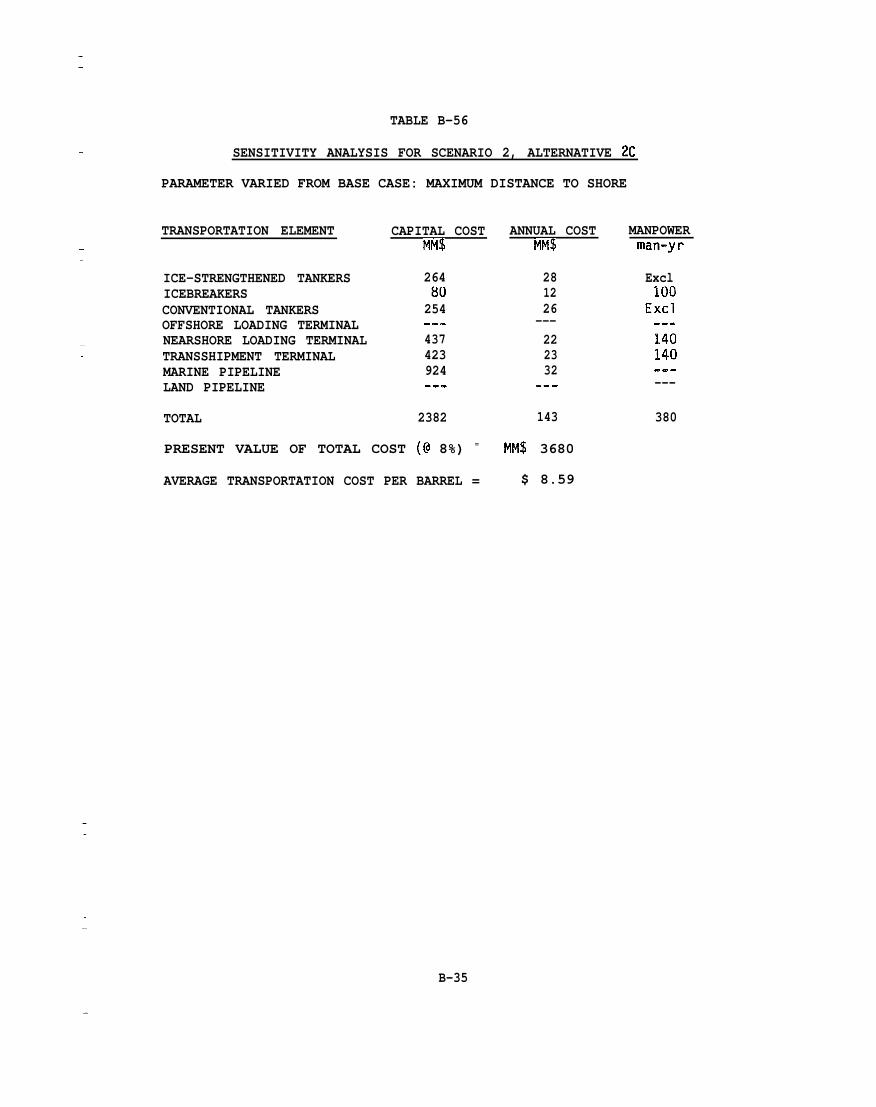
TABLE B-56
SENSITIVITY ANALYSIS FOR SCENARIO 2, ALTERNATIVE 2C
PARAMETER VARIED FROM BASE CASE: MAXIMUM DISTANCE TO SHORE
TRANSPORTATION ELEMENT CAPITAL COST ANNUAL COSTMM$ MM$
ICE-STRENGTHENED TANKERS 264 28ICEBREAKERS 80 12CONVENTIONAL TANKERS 254 26OFFSHORE LOADING TERMINAL .-- ---NEARSHORE LOADING TERMINAL 437 22TRANSSHIPMENT TERMINAL 423 23MARINE PIPELINE 924 32LAND PIPELINE -.- ..-
TOTAL 2382 143
PRESENT VALUE OF TOTAL COST (@ 8%) = MM$ 3680
AVERAGE TRANSPORTATION COST PER BARREL = $ 8.59
MANPOWERman-yr
Excl100
Excl.Z.140140.-.---
380
B-35
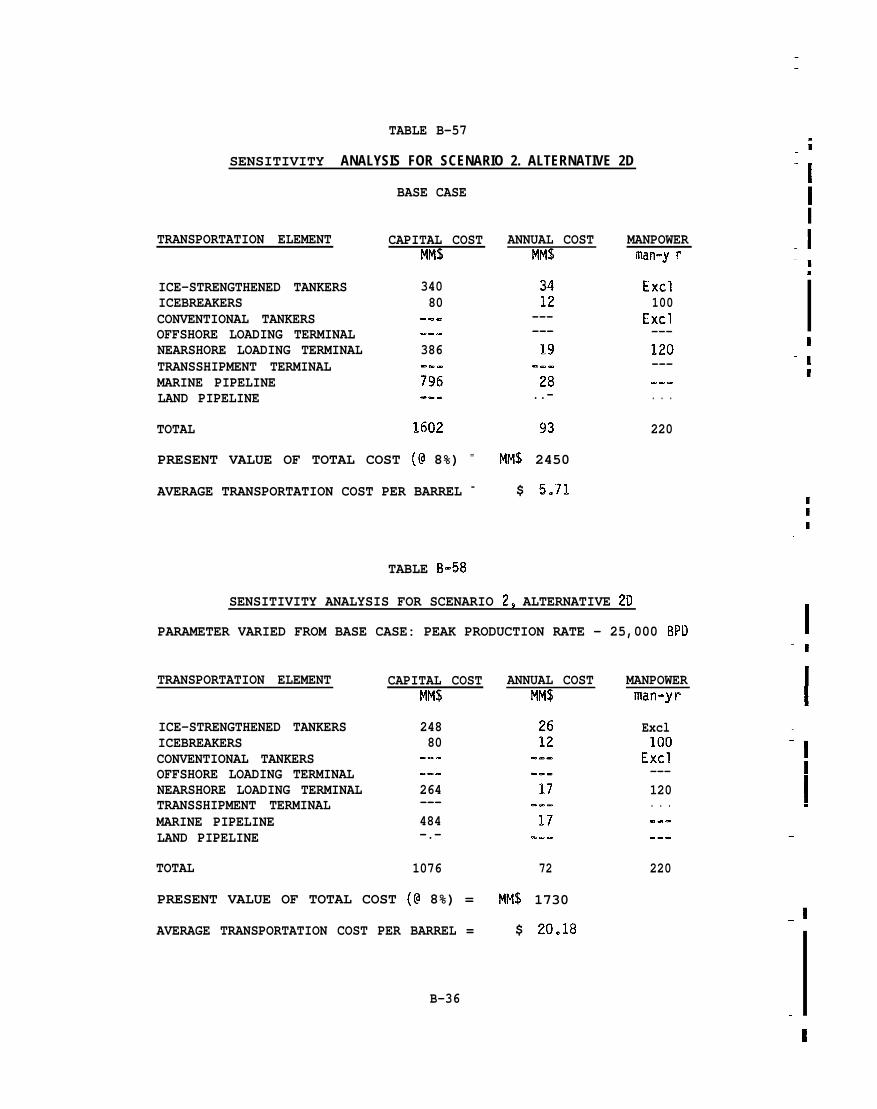
——
TABLE B-57
SENSITIVITY ANALYSIS FOR SCENARIO 2. ALTERNATIVE 2Di—
‘1BASE CASE
.iTRANSPORTATION ELEMENT CAPITAL COSTMM$
ANNUAL COSTMM$
MANPOWERman-y r
Excl100
Excl---120----... . .
220
ICE-STRENGTHENED TANKERSICEBREAKERSCONVENTIONAL TANKERSOFFSHORE LOADING TERMINALNEARSHORE LOADING TERMINALTRANSSHIPMENT TERMINALMARINE PIPELINELAND PIPELINE
340 3412
------19
-..28
..-
80------
— I386
796---
TOTAL 1602 93
PRESENT VALUE OF TOTAL COST (@ 8%) = MM$ 2450
AVERAGE TRANSPORTATION COST PER BARREL = $ 5.71
TABLE B-58
SENSITIVITY ANALYSIS FOR SCENARIO 2, ALTERNATIVE 2D
— IPARAMETER VARIED FROM BASE CASE: PEAK PRODUCTION RATE - 25,000 BPD-1
ITRANSPORTATION ELEMENT
ICE-STRENGTHENED TANKERSICEBREAKERSCONVENTIONAL TANKERSOFFSHORE LOADING TERMINALNEARSHORE LOADING TERMINALTRANSSHIPMENT TERMINALMARINE PIPELINELAND PIPELINE
TOTAL
CAPITAL COSTMM$
ANNUAL COSTMM$
MANPOWERman-yr
24880
.S.
.=.264---484-.-
Excl100
Excl---120. . .
I
I..-.
—---
1076 72 220
PRESENT VALUE OF TOTAL COST (@ 8%) = MM$ 1730
AVERAGE TRANSPORTATION COST PER BARREL = $ 20.18
—B-36
I
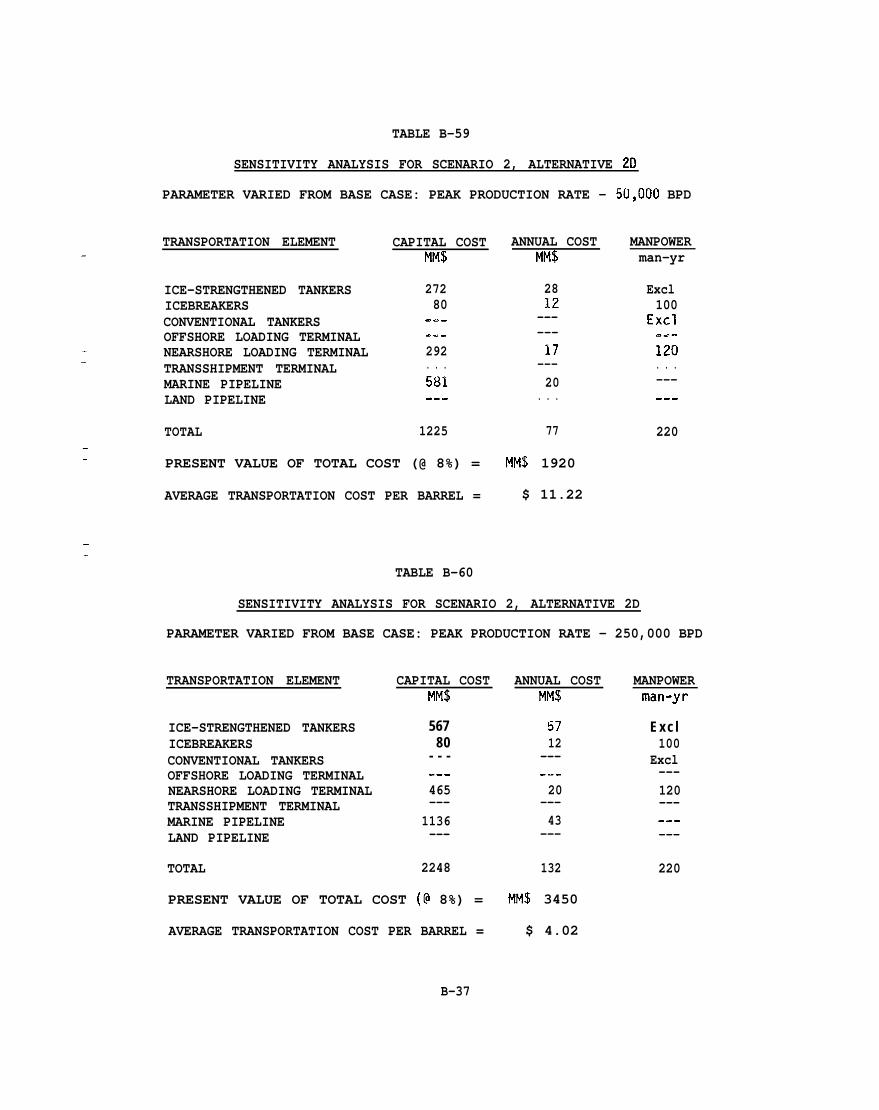
TABLE B-59
SENSITIVITY ANALYSIS FOR SCENARIO 2, ALTERNATIVE 2D
PARAMETER VARIED FROM BASE CASE: PEAK PRODUCTION RATE - 50,000 BPD
TRANSPORTATION ELEMENT CAPITAL COSTMM$
ICE-STRENGTHENED TANKERSICEBREAKERSCONVENTIONAL TANKERSOFFSHORE LOADING TERMINALNEARSHORE LOADING TERMINALTRANSSHIPMENT TERMINALMARINE PIPELINELAND PIPELINE
27280
..-
. . .292. . .581
TOTAL 1225
PRESENT VALUE OF TOTAL COST (@ 8%) =
AVERAGE TRANSPORTATION COST PER BARREL =
ANNUAL COSTMM$
2812
------17
---20
. . .
77
MM$ 1920
$ 11.22
MANPOWERman-yr
Excl100
Excl.e-120. . .---.-.
220
TABLE B-60
SENSITIVITY ANALYSIS FOR SCENARIO 2, ALTERNATIVE 2D
PARAMETER VARIED FROM BASE CASE: PEAK PRODUCTION RATE - 250,000 BPD
TRANSPORTATION ELEMENT
ICE-STRENGTHENED TANKERSICEBREAKERSCONVENTIONAL TANKERSOFFSHORE LOADING TERMINALNEARSHORE LOADING TERMINALTRANSSHIPMENT TERMINALMARINE PIPELINELAND PIPELINE
TOTAL
CAPITAL COSTMM$
56780
- - ----465---
1136---
2248
ANNUAL COSTMM$
5712
------20
---43
---
132
PRESENT VALUE OF TOTAL COST (@ 8%) = MM$ 3450
AVERAGE TRANSPORTATION COST PER BARREL = $ 4.02
B-37
MANPOWERman-yr
Excl100
Excl---120---..----
220
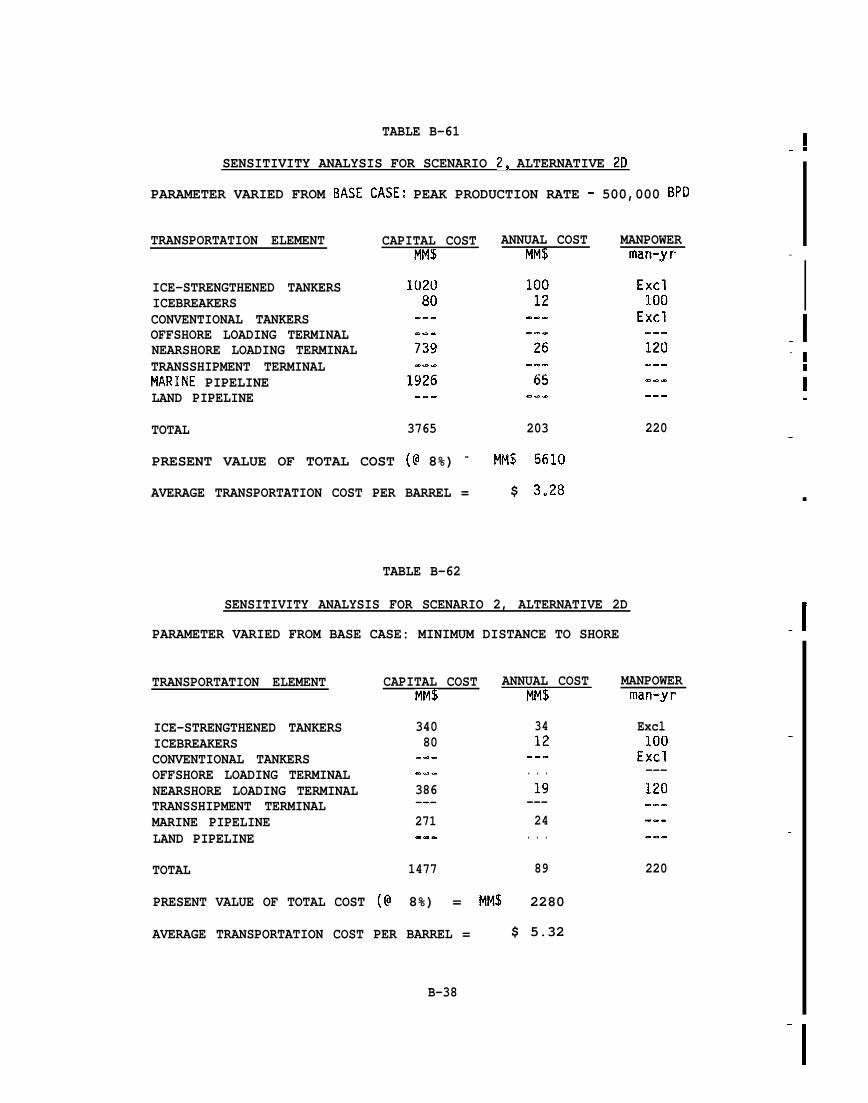
TABLE B-61
SENSITIVITY ANALYSIS FOR SCENARIO 2, ALTERNATIVE 2D
PARAMETER VARIED FROM BASE CASE: PEAK PRODUCTION RATE - 500,000 BPD
TRANSPORTATION ELEMENT CAPITAL COSTMM$
ICE-STRENGTHENED TANKERSICEBREAKERSCONVENTIONAL TANKERSOFFSHORE LOADING TERMINALNEARSHORE LOADING TERMINALTRANSSHIPMENT TERMINALMARINE PIPELINELAND PIPELINE
102080
TOTAL 3765
PRESENT VALUE OF TOTAL COST (@ 8%) =
AVERAGE TRANSPORTATION COST PER BARREL =
ANNUAL COSTMM$
203
MM$ 5610
$ 3.28
MANPOWERman-yr
TABLE B-62
SENSITIVITY ANALYSIS FOR SCENARIO 2, ALTERNATIVE 2D
PARAMETER VARIED FROM BASE CASE: MINIMUM DISTANCE TO SHORE
TRANSPORTATION ELEMENT
ICE-STRENGTHENED TANKERSICEBREAKERSCONVENTIONAL TANKERSOFFSHORE LOADING TERMINALNEARSHORE LOADING TERMINALTRANSSHIPMENT TERMINALMARINE PIPELINELAND PIPELINE
TOTAL
PRESENT VALUE OF TOTAL COST
CAPITAL COST ANNUAL COSTMM$ MM$
340 3480 12
-Q- ..---. . . .386 19--- ---271 24.-. . . .
1477 89
(@ 8%) = MM$ 2280
AVERAGE TRANSPORTATION COST PER BARREL = $ 5.32
B-38
220
MANPOWERman-yr
Excl100
Excl---120.-.-..
220
I–m
—
I-1-:
I.
—
■
— I—
—
——
—
I

TABLE B-63
SENSITIVITY ANALYSIS FOR SCENARIO 2, ALTERNATIVE 2D
PARAMETER VARIED FROM BASE CASE: MAXIMUM DISTANCE TO SHORE
TRANSPORTATION ELEMENT CAPITAL COST ANNUAL COSTMM$ MM$
ICE-STRENGTHENED TANKERS 340 34ICEBREAKERS 80 12CONVENTIONAL TANKERS ..- -..OFFSHORE LOADING TERMINAL .-. -.-NEARSHORE LOADING TERMINAL 386 19TRANSSHIPMENT TERMINAL . . . . . .MARINE PIPELINE 924 32LAND PIPELINE --. . . .
TOTAL 1730 97
PRESENT VALUE OF TOTAL COST (@ 8%) = MM$ 2610
AVERAGE TRANSPORTATION COST PER BARREL = $ 6.10
MANPOWERman-yr
Excl100
Excl.CQ120.-.-.-..-
220
●
——
——
B-39
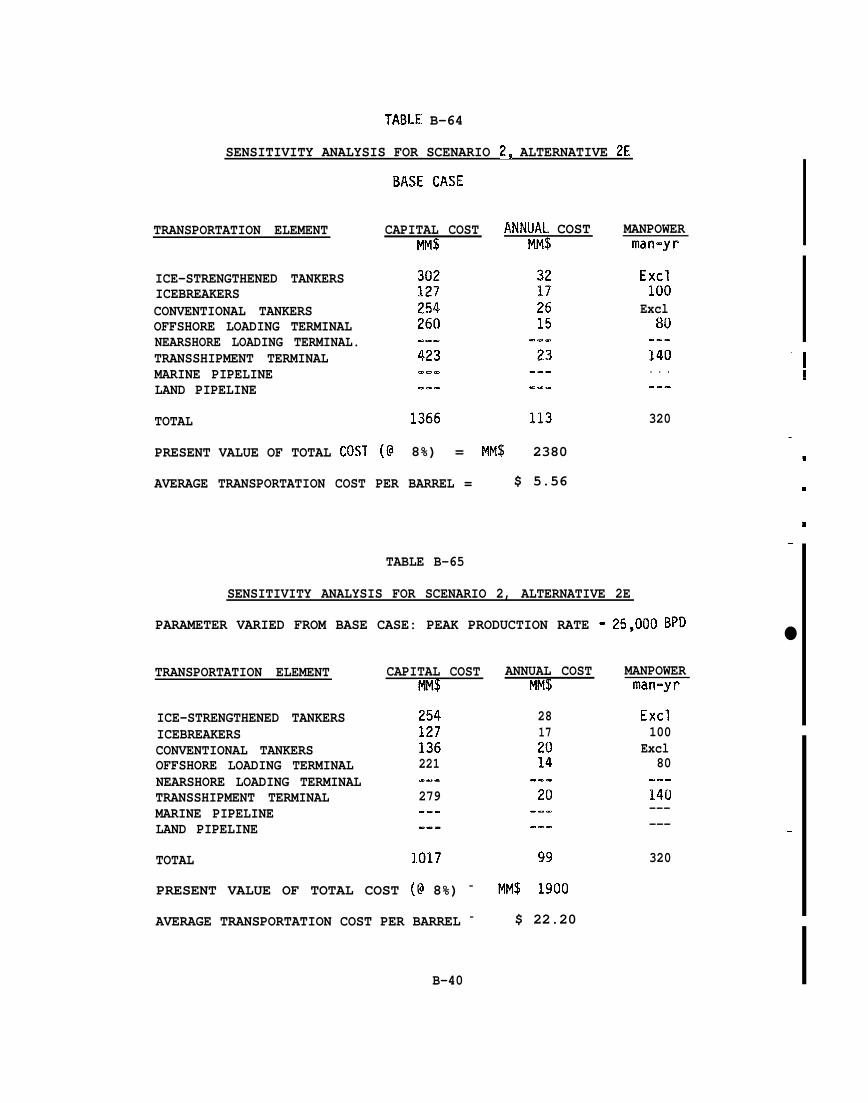
TABLE B-64
SENSITIVITY ANALYSIS FOR SCENARIO 2, ALTERNATIVE 2E
BASE CASE
CAPITAL COST ANNUAL COSTMM$ MM$
MANPOWERman-yr
TRANSPORTATION ELEMENT—
Excl100
Exclw
.-.140. . .
ICE-STRENGTHENED TANKERSICEBREAKERSCONVENTIONAL TANKERSOFFSHORE LOADING TERMINALNEARSHORE LOADING TERMINAL.TRANSSHIPMENT TERMINALMARINE PIPELINELAND PIPELINE
TOTAL
PRESENT VALUE OF TOTAL COST
‘1g..-
320—
(@ 8%) = MM$ 2380
AVERAGE TRANSPORTATION COST PER BARREL = $ 5.56
TABLE B-65
SENSITIVITY ANALYSIS FOR SCENARIO 2, ALTERNATIVE 2E
PARAMETER VARIED FROM BASE CASE: PEAK PRODUCTION RATE - 25,000 BpD
m
a
—
●
MANPOWERman-yr
Excl100
Excl80
-..140------
320
TRANSPORTATION ELEMENT CAPITAL COST ANNUAL COSTMM$ MM$
ICE-STRENGTHENED TANKERSICEBREAKERSCONVENTIONAL TANKERSOFFSHORE LOADING TERMINALNEARSHORE LOADING TERMINALTRANSSHIPMENT TERMINALMARINE PIPELINELAND PIPELINE
TOTAL
254127136221
28172014
—
.-.279.-.
..-
1017 99
PRESENT VALUE OF TOTAL COST (@ 8%) = MM$ 1900
AVERAGE TRANSPORTATION COST PER BARREL = $ 22.20
B-40
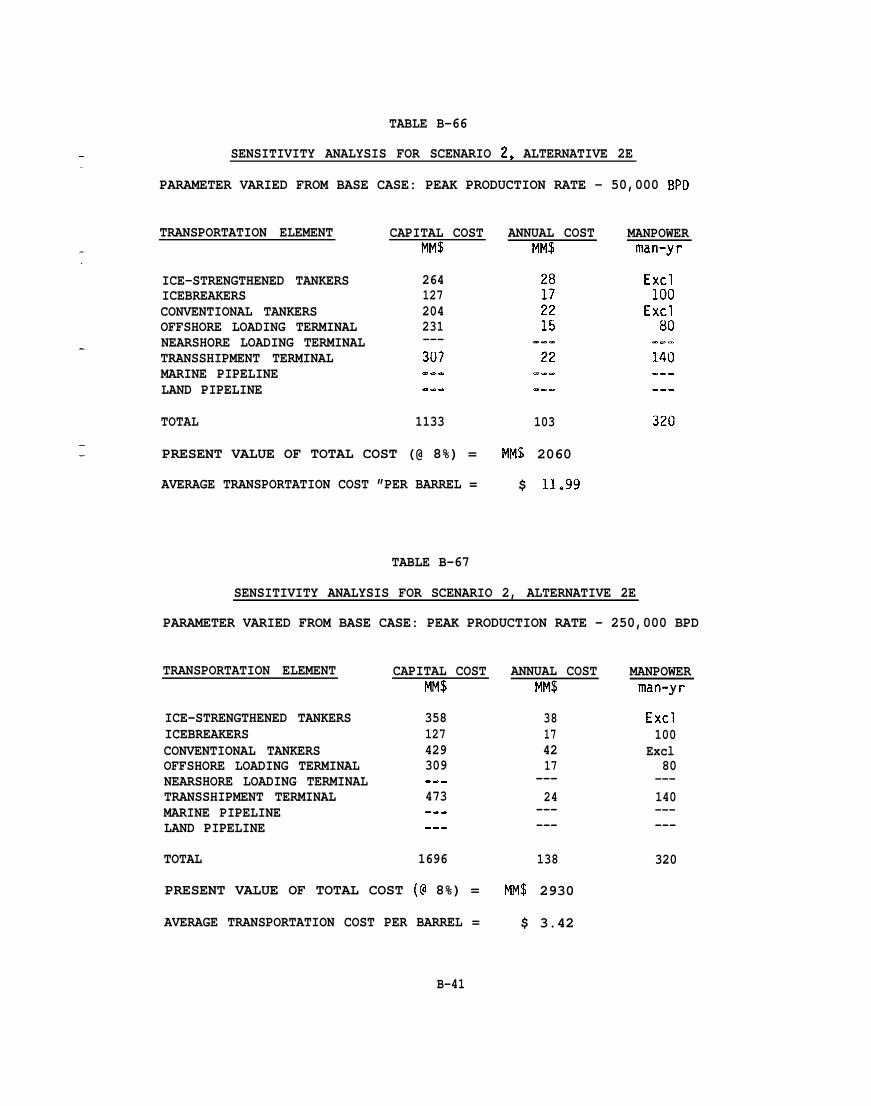
—
TABLE B-66
SENSITIVITY ANALYSIS FOR SCENARIO 2, ALTERNATIVE 2E
PARAMETER VARIED FROM BASE CASE: PEAK PRODUCTION RATE - 50,000 BPD
TRANSPORTATION ELEMENT
ICE-STRENGTHENED TANKERSICEBREAKERSCONVENTIONAL TANKERSOFFSHORE LOADING TERMINALNEARSHORE LOADING TERMINALTRANSSHIPMENT TERMINALMARINE PIPELINELAND PIPELINE
TOTAL
CAPITAL COSTMM$
264127204231---3U7.----.
1133
ANNUAL COSTMM$
103
MANPOWERman-yr
32iI
PRESENT VALUE OF TOTAL COST (@ 8%) = MM$ 2060
AVERAGE TRANSPORTATION COST ”PER BARREL = $ 11.99
TABLE B-67
SENSITIVITY ANALYSIS FOR SCENARIO 2, ALTERNATIVE 2E
PARAMETER VARIED FROM BASE CASE: PEAK PRODUCTION RATE - 250,000 BPD
TRANSPORTATION ELEMENT CAPITAL COSTMM$
ICE-STRENGTHENED TANKERSICEBREAKERSCONVENTIONAL TANKERSOFFSHORE LOADING TERMINALNEARSHORE LOADING TERMINALTRANSSHIPMENT TERMINALMARINE PIPELINELAND PIPELINE
358127429309---473------
TOTAL 1696
PRESENT VALUE OF TOTAL COST (@ 8%) =
AVERAGE TRANSPORTATION COST PER BARREL =
ANNUAL COSTMM$
38174217
---24
------
138
MM$ 2930
$ 3.42
MANPOWERman-yr
Excl100
Excl80
---140------
320
B-41
—
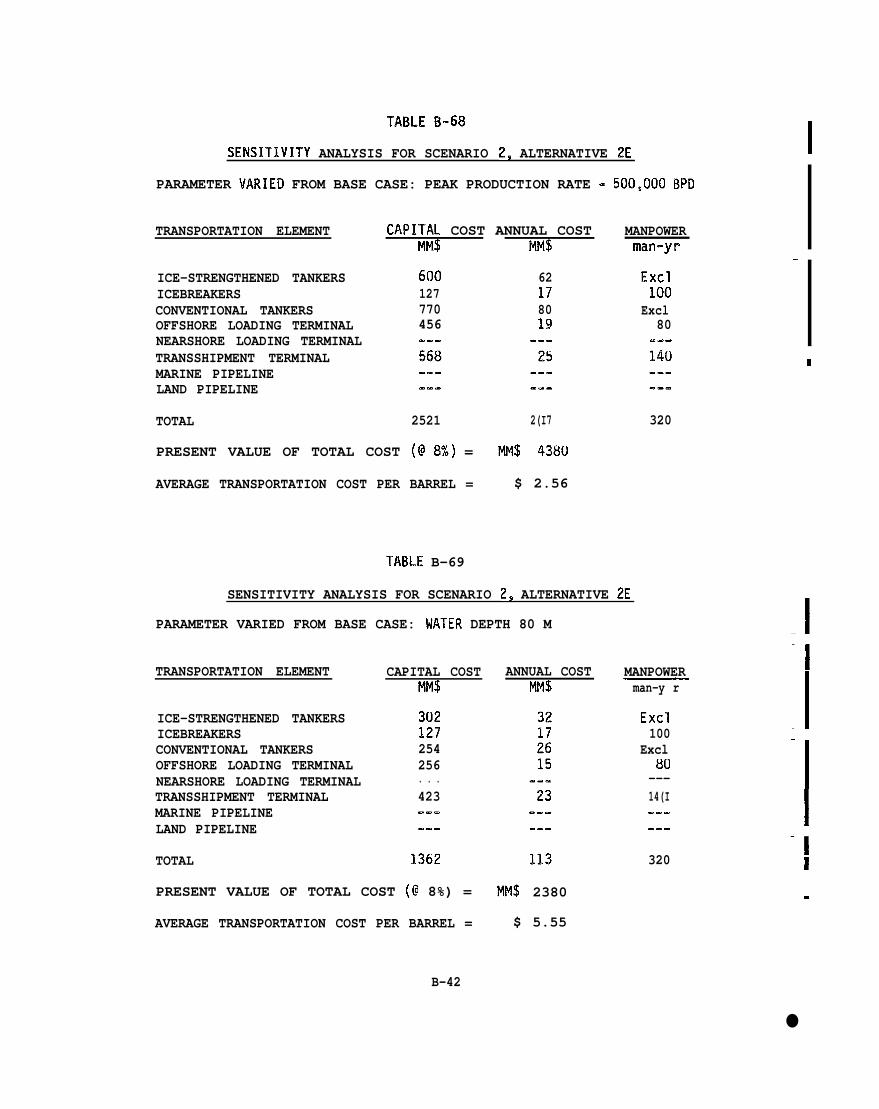
TIWLE B-m
ISENSITIVITY ANALYSIS FOR SCENARIO 2, ALTERNATIVE 2E
PARAMETER VARIED FROM BASE CASE: PEAK PRODUCTION RATE - !500,000 BPD
TRANSPORTATION ELEMENT CAPITAL COST ANNUAL COSTMM$ MM$
MANPOWERman-yr
—
ICE-STRENGTHENED TANKERSICEBREAKERSCONVENTIONAL TANKERSOFFSHORE LOADING TERMINALNEARSHORE LOADING TERMINALTRANSSHIPMENT TERMINALMARINE PIPELINELAND PIPELINE
600127770456
62178019
Excl100
Excl80
---
140--.
TOTAL 2521 2(I7 320
PRESENT VALUE OF TOTAL COST (@ 8%) = MM$ 4380
AVERAGE TRANSPORTATION COST PER BARREL = $ 2.56
TABLE B-69
SENSITIVITY ANALYSIS FOR SCENARIO 2, ALTERNATIVE 2E
.1PARAMETER VARIED FROM BASE CASE: WATER DEPTH 80 M
‘1
_l
TRANSPORTATION ELEMENT CAPITAL COSTMM$
ANNUAL COSTMM$
MANPOWERman-y r
Excl100
Excl80
---14(I..-.ez
320
ICE-STRENGTHENED TANKERSICEBREAKERSCONVENTIONAL TANKERSOFFSHORE LOADING TERMINALNEARSHORE LOADING TERMINALTRANSSHIPMENT TERMINALMARINE PIPELINELAND PIPELINE
TOTAL
302127254256. . .423-.. I.--
‘1:1362
PRESENT VALUE OF TOTAL COST (@ 8%) = MM$ 2380
AVERAGE TRANSPORTATION COST PER BARREL = $ 5.55
B-42
.
●
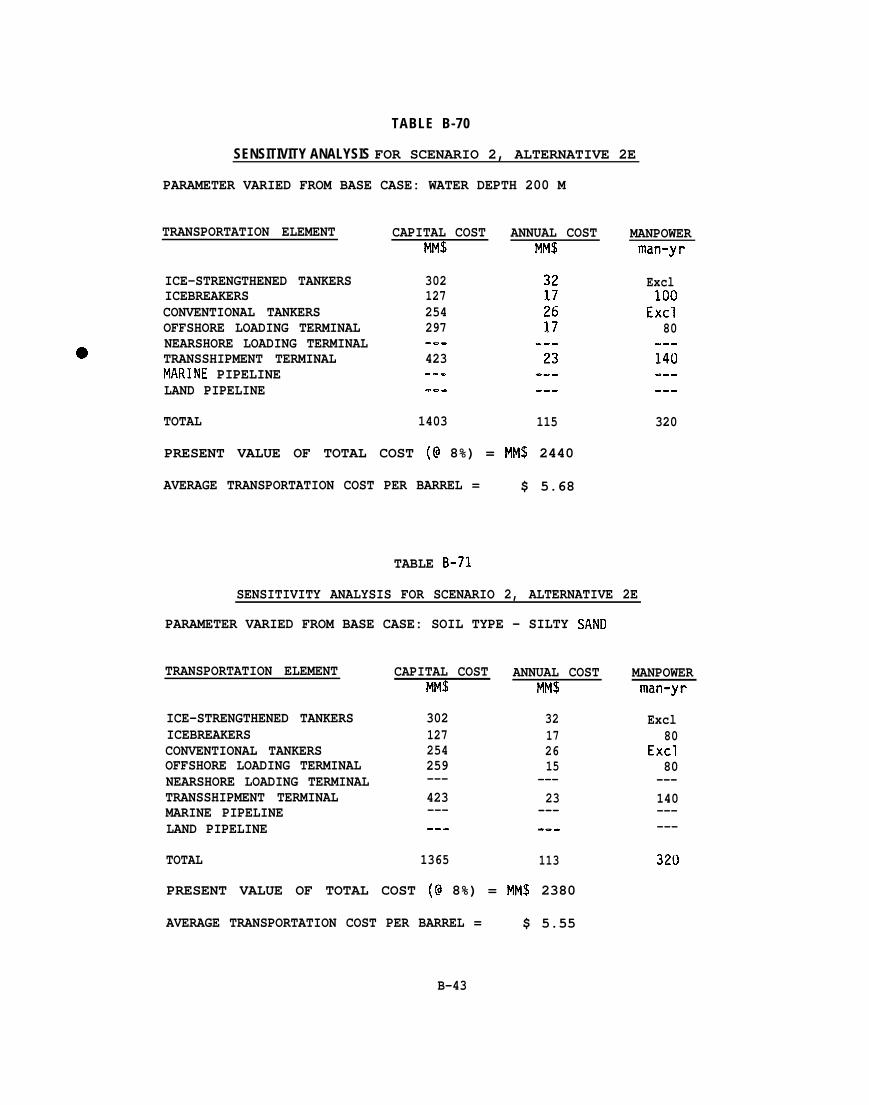
TABLE B-70
SENSITIVITY ANALYSIS FOR SCENARIO 2, ALTERNATIVE 2E
PARAMETER VARIED FROM BASE CASE: WATER DEPTH 200 M
TRANSPORTATION ELEMENT
ICE-STRENGTHENED TANKERSICEBREAKERSCONVENTIONAL TANKERSOFFSHORE LOADING TERMINALNEARSHORE LOADING TERMINALTRANSSHIPMENT TERMINALMARINE PIPELINELAND PIPELINE
TOTAL
CAPITAL COSTMM$
302127254297--.423. . ..-.
1403
ANNUAL COSTMM$
115
MANPOWERman-yr
PRESENT VALUE OF TOTAL COST (@ 8%) = MM$ 2440
AVERAGE TRANSPORTATION COST PER BARREL = $ 5.68
TABLE B-71
SENSITIVITY ANALYSIS FOR SCENARIO 2, ALTERNATIVE 2E
PARAMETER VARIED FROM BASE CASE: SOIL TYPE - SILTY SAND
TRANSPORTATION ELEMENT
ICE-STRENGTHENED TANKERSICEBREAKERSCONVENTIONAL TANKERSOFFSHORE LOADING TERMINALNEARSHORE LOADING TERMINALTRANSSHIPMENT TERMINALMARINE PIPELINELAND PIPELINE
TOTAL
CAPITAL COSTMM$
302127254259---423------
1365
ANNUAL COSTMM$
32172615
---23
------
113
PRESENT VALUE OF TOTAL COST (k? 8%) = MM$ 2380
Excl100
Excl80
140
320
MANPOWERman-yr
Excl80
Excl80
---140------
320
AVERAGE TRANSPORTATION COST PER BARREL = $ 5.55
B-43

TABLE B - 7 2
SENSITIVITY ANALYSIS FOR SCENARIO 2, ALTERNATIVE 2F
BASE CASE
CAPITAL COSTMM$
ANNUAL COSTMM$
MANPOWERman-yr
TRANSPORTATION ELEMENT
ICE-STRENGTHENED TANKERSICEBREAKERSCONVENTIONAL TANKERSOFFSHORE LOADING TERMINALNEARSHORE LOADING TERMINALTRANSSHIPMENT TERMINALMARINE PIPELINELAND PIPELINE
TOTAL
‘I
-1—
—
——
——
—
368127
288
.----. ---
-..
73 180783
PRESENT VALUE OF TOTAL COST (@ 8%) = MM$ 1440
AVERAGE TRANSPORTATION COST PER BARREL = $ 3.35
TABLE B-73
SENSITIVITY ANALYSIS FOR SCENARIO 2, ALTERNATIVE 2F
PARAMETER VARIED FROM BASE CASE: PEAK PRODUCTION RATE - 2S,000 BpD
MANPOWERman-yr
Excl100
Excl80
-..------. . .
180
TRANSPORTATION ELEMENT CAPITAL COSTMM$
ANNUAL COSTMM$
268127---227.a-. . .
2817
ICE-STRENGTHENED TANKERSICEBREAKERSCONVENTIONAL TANKERSOFFSHORE LOADING TERMINALNEARSHORE LOADING TERMINALTRANSSHIPMENT TERMINALMARINE PIPELINELAND PIPELINE
TOTAL
.-.--.
‘1622 59
PRESENT VALUE OF TOTAL COST (@ 8%) ‘ MM$ 1150
AVERAGE TRANSPORTATION COST PER BARREL = $ 13.42—– m
B-44—
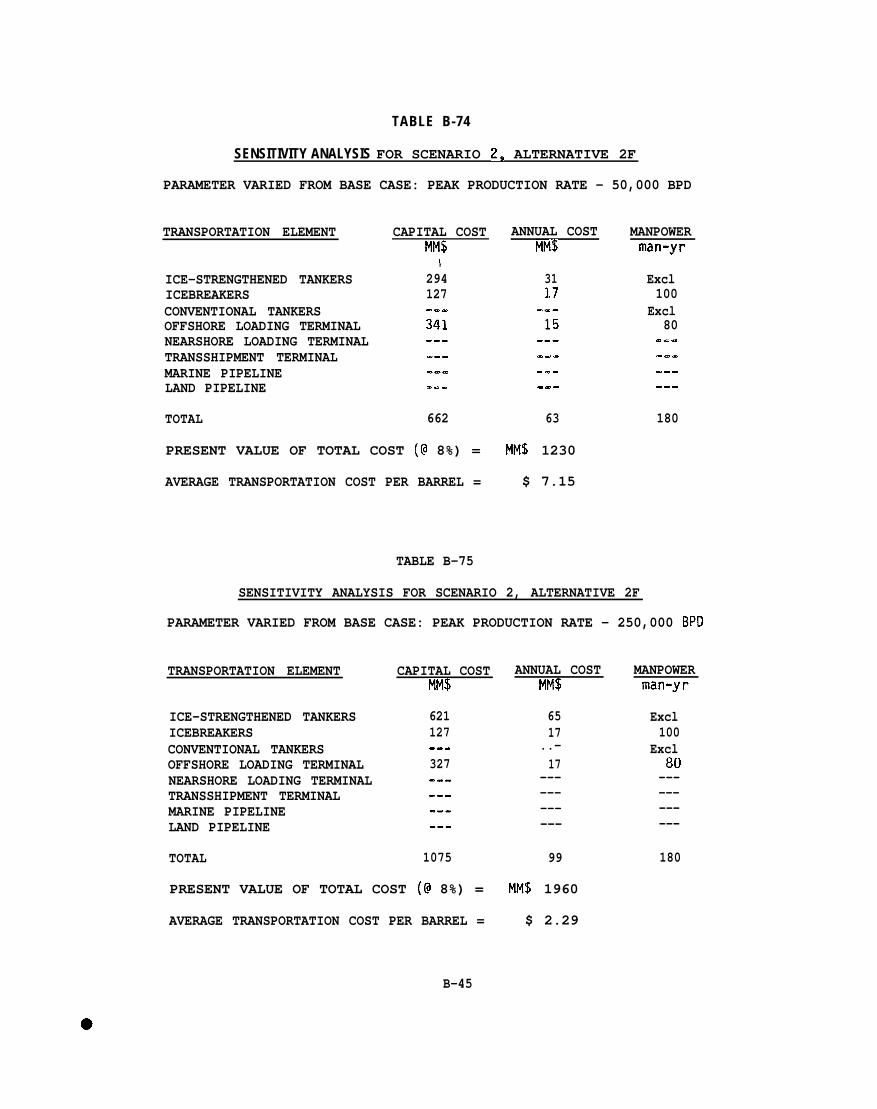
TABLE B-74
SENSITIVITY ANALYSIS FOR SCENARIO 2, ALTERNATIVE 2F
PARAMETER VARIED FROM BASE CASE: PEAK PRODUCTION RATE - 50,000 BPD
TRANSPORTATION ELEMENT CAPITAL COSTMM$
ANNUAL COSTMM$
MANPOWERman-yr
\ICE-STRENGTHENED TANKERSICEBREAKERSCONVENTIONAL TANKERSOFFSHORE LOADING TERMINALNEARSHORE LOADING TERMINALTRANSSHIPMENT TERMINALMARINE PIPELINELAND PIPELINE
TOTAL
294 31 Excl100
Excl80
..-
127--- ..-341
.-.. . .
. . . --.
662 63 180
PRESENT VALUE OF TOTAL COST (@ 8%) = MM$ 1230
AVERAGE TRANSPORTATION COST PER BARREL = $ 7.15
TABLE B-75
SENSITIVITY ANALYSIS FOR SCENARIO 2, ALTERNATIVE 2F
PARAMETER VARIED FROM BASE CASE: PEAK PRODUCTION RATE - 250,000 BPD
MANPOWERman-yr
Excl100
Excl80
------------
180
TRANSPORTATION ELEMENT CAPITAL COSTMM$
ANNUAL COSTMM$
ICE-STRENGTHENED TANKERSICEBREAKERSCONVENTIONAL TANKERSOFFSHORE LOADING TERMINALNEARSHORE LOADING TERMINALTRANSSHIPMENT TERMINALMARINE PIPELINELAND PIPELINE
621 6517
..-17
------------
127---327------
---
TOTAL 1075 99
PRESENT VALUE OF TOTAL COST (@ 8%) = MM$ 1960
$ 2.29AVERAGE TRANSPORTATION COST PER BARREL =
B-45
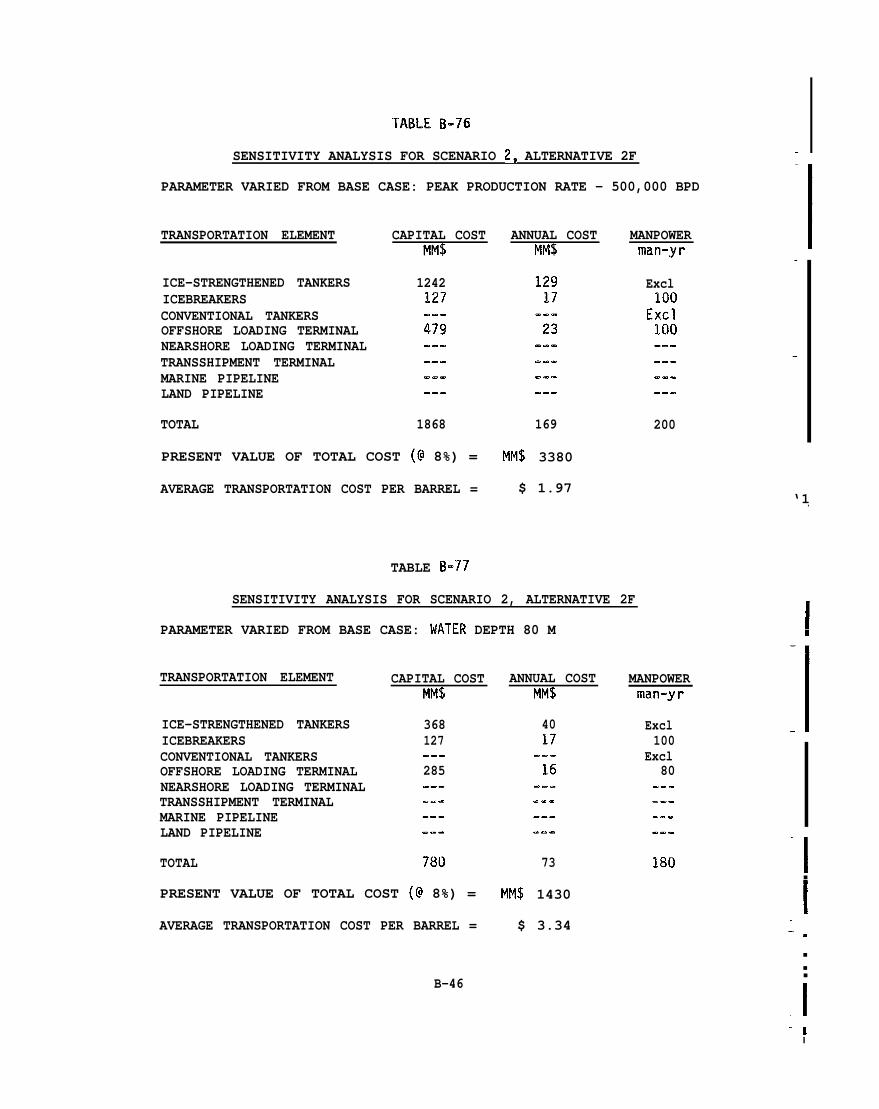
. ITABLE B-76
SENSITIVITY ANALYSIS FOR SCENARIO 2, ALTERNATIVE 2F
PARAMETER VARIED FROM BASE CASE: PEAK PRODUCTION RATE - 500,000 BPD ‘1TRANSPORTATION ELEMENT CAPITAL COST ANNUAL COST MANPOWER
MM$ MM$ man-yr I—
ICE-STRENGTHENED TANKERSICEBREAKERSCONVENTIONAL TANKERSOFFSHORE LOADING TERMINALNEARSHORE LOADING TERMINALTRANSSHIPMENT TERMINALMARINE PIPELINELAND PIPELINE
TOTAL
1242127.-.479.e-
Excl100
Excl100-..
1868 169 200
PRESENT VALUE OF TOTAL COST (@ 8%) = MM$ 3380
AVERAGE TRANSPORTATION COST PER BARREL = $ 1.97‘1.
TABLE B-77
SENSITIVITY ANALYSIS FOR SCENARIO 2, ALTERNATIVE 2FI
PARAMETER VARIED FROM BASE CASE: WATER DEPTH 80 M :
TRANSPORTATION ELEMENT
ICE-STRENGTHENED TANKERSICEBREAKERSCONVENTIONAL TANKERSOFFSHORE LOADING TERMINALNEARSHORE LOADING TERMINALTRANSSHIPMENT TERMINALMARINE PIPELINELAND PIPELINE
TOTAL
CAPITAL COST ANNUAL COSTMM$ MM$
MANPOWERman-yr
368 40 Excl100
Excl80
..-
127---
285---..- . . .
. . .
‘1■
1780 73 180
PRESENT VALUE OF TOTAL COST (@ 8%) = MM$ 1430
AVERAGE TRANSPORTATION COST PER BARREL = $ 3.34 — .
■
■
■
B-46 .
-1-1
I
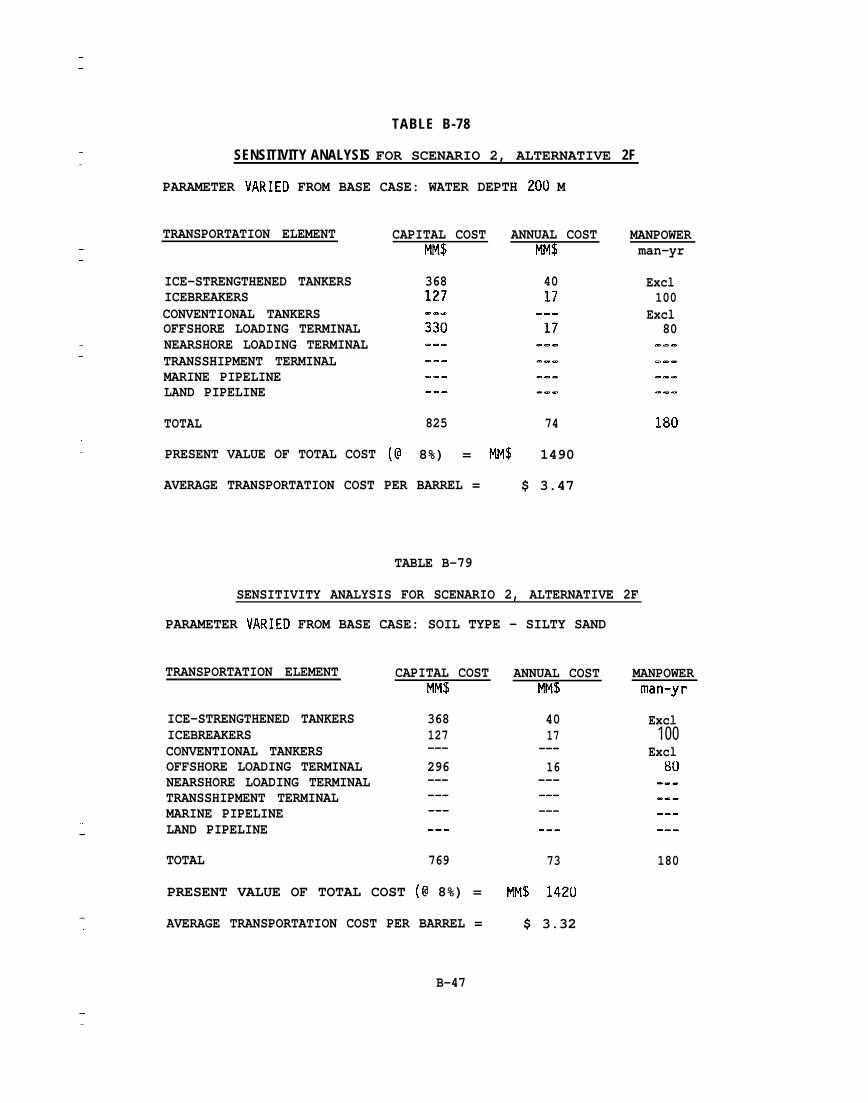
TABLE B-78
SENSITIVITY ANALYSIS FOR SCENARIO 2, ALTERNATIVE 2F
PARAMETER VARIED FROM BASE CASE: WATER DEPTH 200 M
TRANSPORTATION ELEMENT CAPITAL COST ANNUAL COSTMM$ MM$
MANPOWERman-yr
ICE-STRENGTHENED TANKERSICEBREAKERSCONVENTIONAL TANKERSOFFSHORE LOADING TERMINALNEARSHORE LOADING TERMINALTRANSSHIPMENT TERMINALMARINE PIPELINELAND PIPELINE
TOTAL
PRESENT VALUE OF TOTAL COST
368127
4017
Excl100
Excl80
..-
-.-
825 74 180
(@ 8%) = MM$ 1490
AVERAGE TRANSPORTATION COST PER BARREL = $ 3.47
TABLE B-79
SENSITIVITY ANALYSIS FOR SCENARIO 2, ALTERNATIVE 2F
PARAMETER VARIED FROM BASE CASE: SOIL TYPE - SILTY SAND
TRANSPORTATION ELEMENT
ICE-STRENGTHENED TANKERSICEBREAKERSCONVENTIONAL TANKERSOFFSHORE LOADING TERMINALNEARSHORE LOADING TERMINALTRANSSHIPMENT TERMINALMARINE PIPELINELAND PIPELINE
TOTAL
CAPITAL COSTMM$
ANNUAL COSTMM$
MANPOWERman-yr
368127---296---------
4017
---16
---------
Excl100
Excl8(I
---
------ --- ---
769 73 180
PRESENT VALUE OF TOTAL COST (@ 8%) = MM$ 1420
AVERAGE TRANSPORTATION COST PER BARREL = $ 3.32
B-47
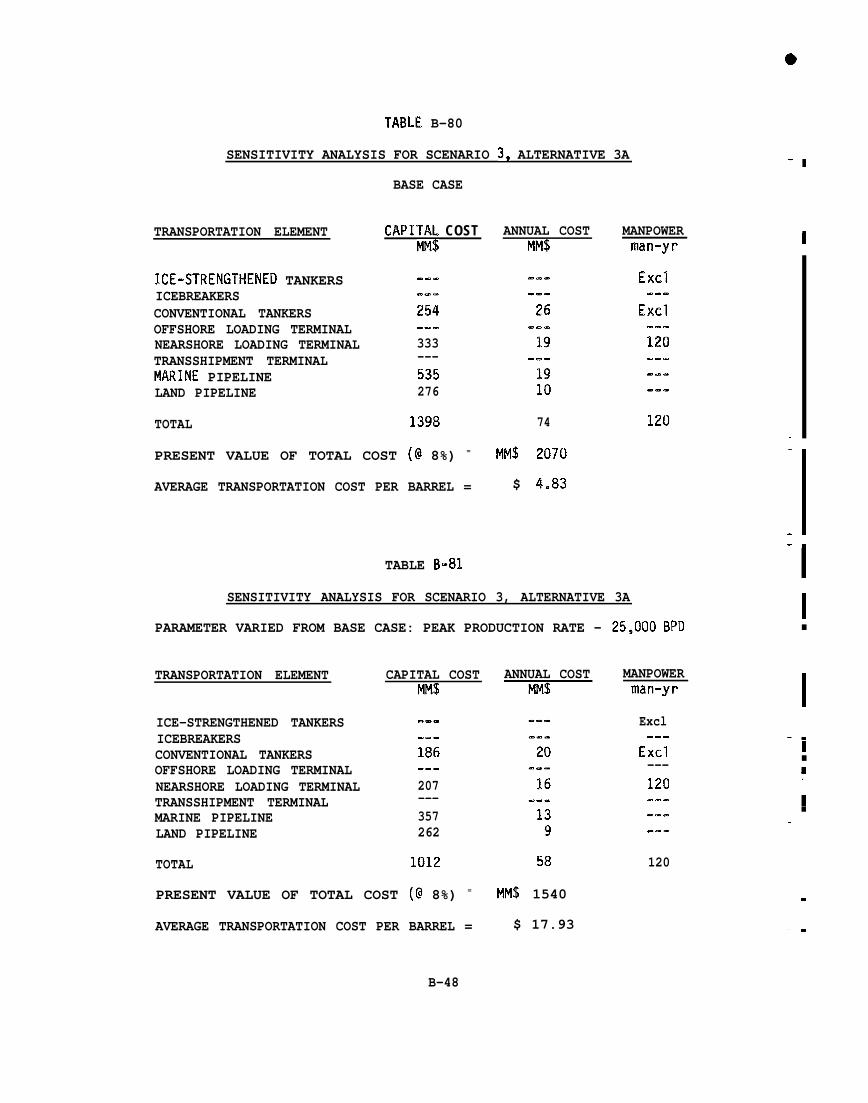
TABLE B-80
SENSITIVITY ANALYSIS FOR SCENARIO 3, ALTERNATIVE 3A-I
BASE CASE
CAPITAL COST ANNUAL COSTMM$ MM$
MANPOWERman==yr
TRANSPORTATION ELEMENT -1
.
:1
ExclICE-STRENGTI-IENED TANKERSICEBREAKERSCONVENTIONAL TANKERSOFFSHORE LOADING TERMINALNEARSHORE LOADING TERMINALTRANSSHIPMENT TERMINALMARINE PIPELINELAND PIPELINE
TOTAL
Excl..----
333---535276
120
1398 74
PRESENT VALUE OF TOTAL COST (@ 8%) = MM$ 2070
AVERAGE TRANSPORTATION COST PER BARREL = $ 4.83
TABLE B-81
SENSITIVITY ANALYSIS FOR SCENARIO 3, ALTERNATIVE 3A
PARAMETER VARIED FROM BASE CASE: PEAK PRODUCTION RATE - 25,000 BPD
‘1I■
TRANSPORTATION ELEMENT
ICE-STRENGTHENED TANKERSICEBREAKERSCONVENTIONAL TANKERSOFFSHORE LOADING TERMINALNEARSHORE LOADING TERMINALTRANSSHIPMENT TERMINALMARINE PIPELINELAND PIPELINE
TOTAL
CAPITAL COSTMM$
ANNUAL COSTMM$
MANPOWERman-yr
Excl..-
Excl---120.----.-..
120
II
.-.-..186--.207---357262
—.I■
9.
.
1012 58
PRESENT VALUE OF TOTAL COST (@ 8%) = MM$ 1540
AVERAGE TRANSPORTATION COST PER BARREL = $ 17.93
.
—.
B-48

——
TABLE B-82
SENSITIVITY ANALYSIS FOR SCENARIO 3, ALTERNATIVE 3A
PARAMETER VARIED FROM BASE CASE: PEAK PRODUCTION RATE - !)0,000 BPD
TRANSPORTATION ELEMENT
ICE-STRENGTHENED TANKERSICEBREAKERSCONVENTIONAL TANKERSOFFSHORE LOADING TERMINALNEARSHORE LOADING TERMINALTRANSSHIPMENT TERMINALMARINE PIPELINELAND PIPELINE
TOTAL
CAPITAL COSTMM$
1100
ANNUAL COSTMM$
---149
62
MANPOWERman-yr
120
PRESENT VALUE OF TOTAL COST (@ 8%) = MM$ 1670
AVERAGE TRANSPORTATION COST PER BARREL = $ 9.72
TABLE B-83
SENSITIVITY ANALYSIS FOR SCENARIO 3, ALTERNATIVE 3A
PARAMETER VARIED FROM BASE CASE: PEAK PRODUCTION RATE - 250,000 BPD
TRANSPORTATION ELEMENT
ICE-STRENGTHENED TANKERSICEBREAKERSCONVENTIONAL TANKERSOFFSHORE LOADING TERMINALNEARSHORE LOADING TERMINALTRANSSHIPMENT TERMINALMARINE PIPELINELAND PIPELINE
TOTAL
CAPITAL COSTMM$
---.=-426---374---824283
1907
ANNUAL COSTMM$
------42
---20
---2910
101
MANPOWERman-yr
Excl---
Excl---120---------
120
PRESENT VALUE OF TOTAL COST (@ 8%) = MM$ 2830
AVERAGE TRANSPORTATION COST PER BARREL = $ 3.30
B-49
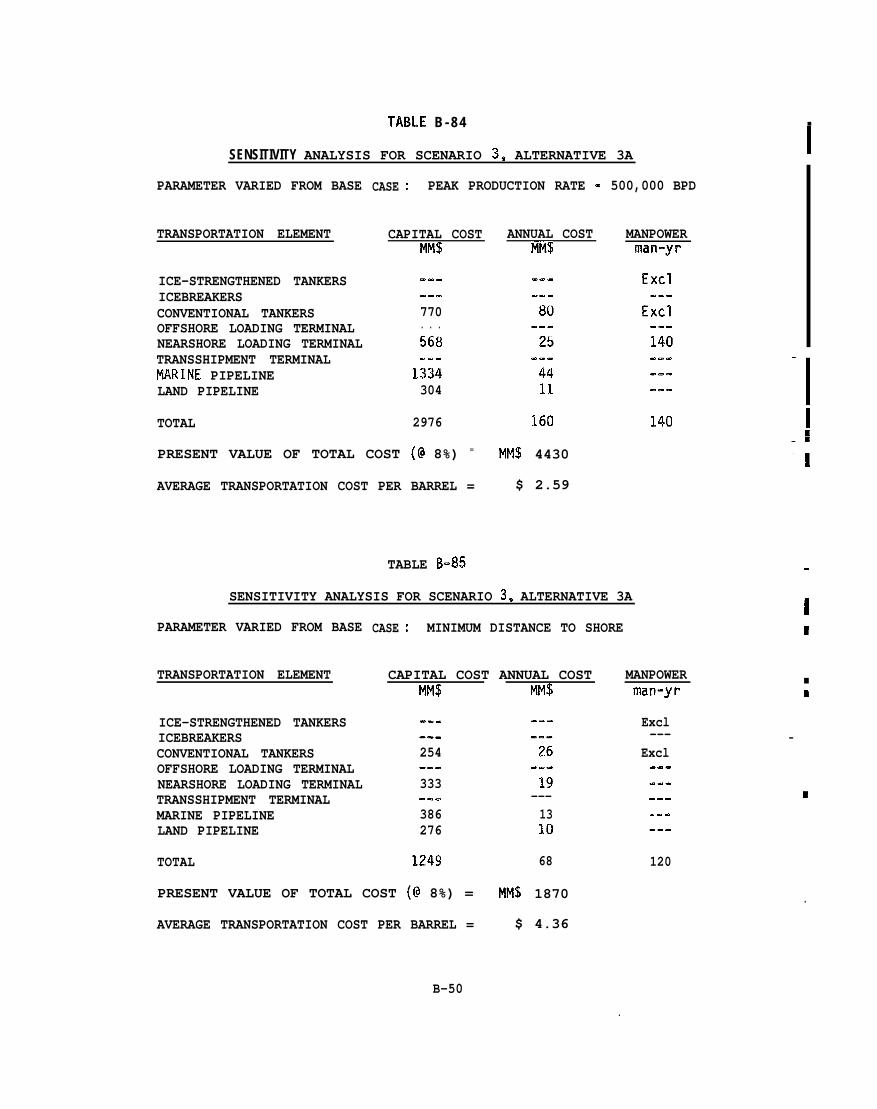
TABLE B - 8 4 ■
SENSITIVITY ANALYSIS FOR SCENARIO 3, ALTERNATIVE 3A _l
—
‘1I
PARAMETER VARIED FROM BASE CASE : PEAK PRODUCTION RATE - 500,000 BPD
TRANSPORTATION ELEMENT CAPITAL COST ANNUAL COSTMM$ MM$
MANPOWERman-yr
ICE-STRENGTHENED TANKERSICEBREAKERSCONVENTIONAL TANKERSOFFSHORE LOADING TERMINALNEARSHORE LOADING TERMINALTRANSSHIPMENT TERMINALMARINE PIPELINELAND PIPELINE
TOTAL
-..770. . .568. . .
1334304
2976 160 140:—
PRESENT VALUE OF TOTAL COST (@ 8%) = MM$ 4430
AVERAGE TRANSPORTATION COST PER BARREL = $ 2.59‘1
.TABLE B-435
SENSITIVITY ANALYSIS FOR SCENARIO 3, ALTERNATIVE 3AI
PARAMETER VARIED FROM BASE CASE : MINIMUM DISTANCE TO SHORE B
TRANSPORTATION ELEMENT CAPITAL COST ANNUAL COSTMM$ MM$
MANPOWER■
man-yr E
ICE-STRENGTHENED TANKERSICEBREAKERSCONVENTIONAL TANKERSOFFSHORE LOADING TERMINALNEARSHORE LOADING TERMINALTRANSSHIPMENT TERMINALMARINE PIPELINELAND PIPELINE
TOTAL
Excl--- —
Excl.--
-.. ------254-..333.S.386276
---
19---1310
. . .-.-
1249 68 120
PRESENT VALUE OF TOTAL COST (@ 8%) = MM$ 1870 .
AVERAGE TRANSPORTATION COST PER BARREL = $ 4.36
B-50

—
—
TABLE B-86
SENSITIVITY ANALYSIS FOR SCENARIO 3, ALTERNATIVE 3A
PARAMETER VARIEII FROM BASE
TRANSPORTATION ELEMENT——
ICE-STRENGTHENED TANKERSICEBREAKERSCONVENTIONAL TANKERSOFFSHORE LOADING TERMINALNEARSHORE LOADING TERMINALTRANSSHIPMENT TERMINALMARINE PIPELINELAND PIPELINE
TOTAL
CASE : MAXIMUM DISTANCE TO SHORE
CAPITAL COSTMM$
0..
254. . .333.ms699276
1562
ANNUAL COSTMM$
..---.
26---19
.-.251(I
80
PRESENT VALUE OF TOTAL COST (@ 8%) = MM$ 2290
AVERAGE TRANSPORTATION COST PER BARREL = $ 5.34
MANPOWERman-yr
Excl.e-
Excl---120. . ...-. . .
120
—
—
B-51
——
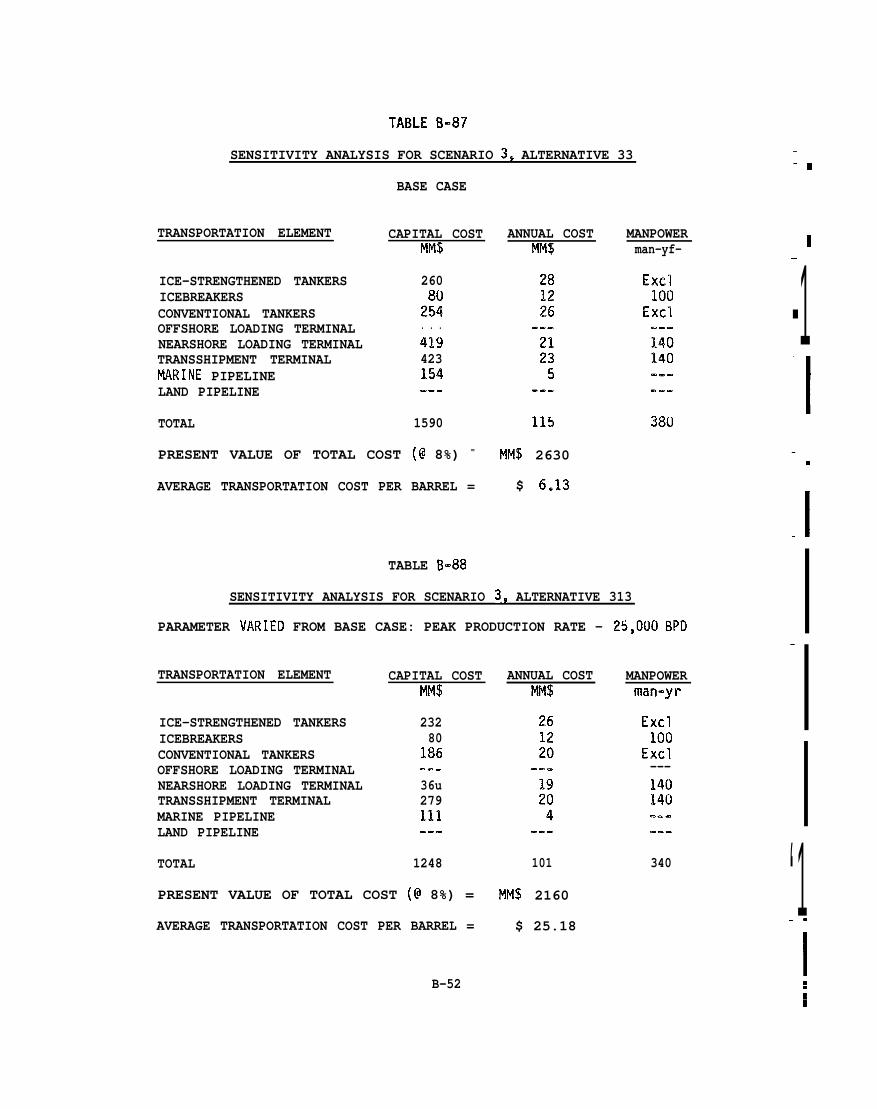
TABLE B-87
SENSITIVITY ANALYSIS FOR SCENARIO 3, ALTERNATIVE 33
BASE CASE
TRANSPORTATION ELEMENT
ICE-STRENGTHENED TANKERSICEBREAKERSCONVENTIONAL TANKERSOFFSHORE LOADING TERMINALNEARSHORE LOADING TERMINALTRANSSHIPMENT TERMINALMARINE PIPELINELAND PIPELINE
TOTAL
CAPITAL COSTMM$
ANNUAL COSTMM$
MANPOWERman-yf- — 1
—
-1260
2::. . .4194231!’54-.. ‘11590 115 380
PRESENT VALUE OF TOTAL COST (@ 8%) = MM$ 2630
AVERAGE TRANSPORTATION COST PER BARREL = $ 6.13
TABLE B-88
SENSITIVITY ANALYSIS FOR SCENARIO 3, ALTERNATIVE 313
PARAMETER VARIED FROM BASE CASE: PEAK PRODUCTION RATE - 25,000 BPD
—.
-1
—
TRANSPORTATION ELEMENT
ICE-STRENGTHENED TANKERSICEBREAKERSCONVENTIONAL TANKERSOFFSHORE LOADING TERMINALNEARSHORE LOADING TERMINALTRANSSHIPMENT TERMINALMARINE PIPELINELAND PIPELINE
TOTAL
CAPITAL COSTMM$
ANNUAL COSTMM$
MANPOWERman-yr
23280
186
Excl100
Excl---140140-..
. . .36u279111.-. -..
‘1—.1248 101 340
PRESENT VALUE OF TOTAL COST (@ 8%) = MM$ 2160
AVERAGE TRANSPORTATION COST PER BARREL = $ 25.18
B-52“-I::
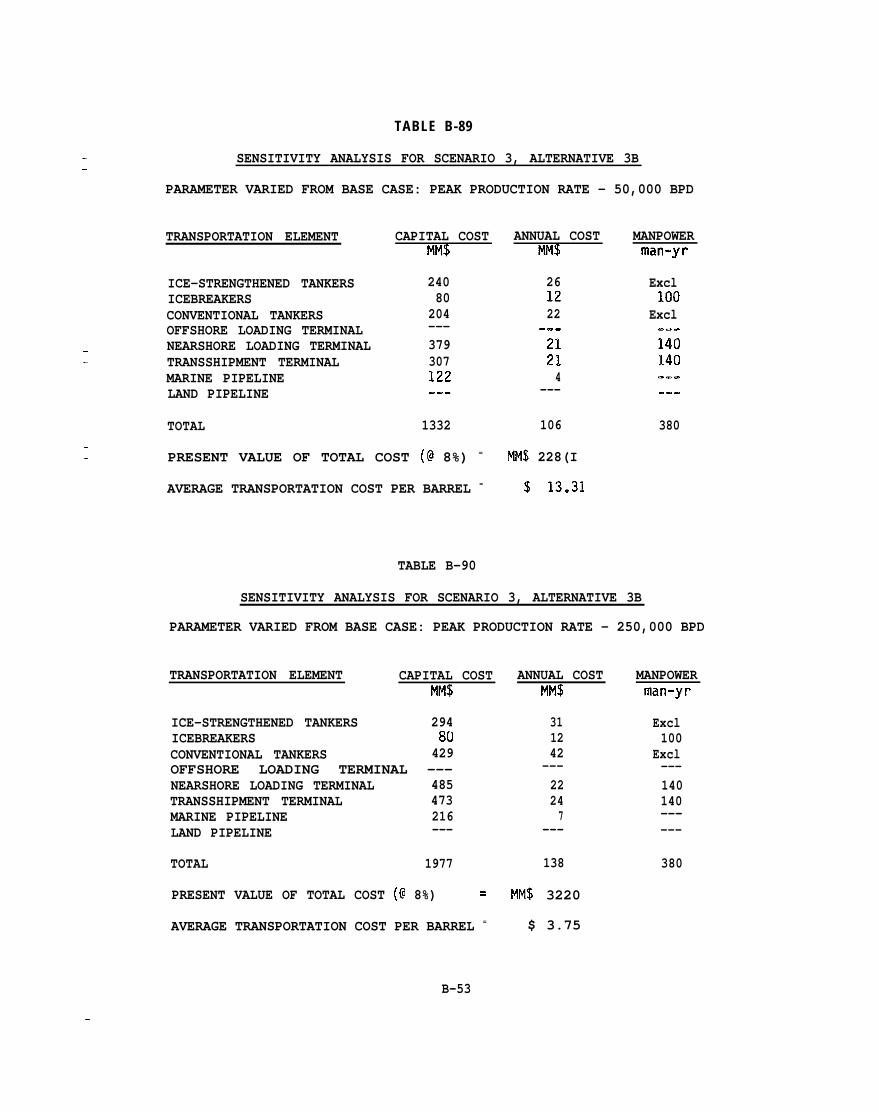
TABLE B-89
——
——
——
SENSITIVITY ANALYSIS FOR SCENARIO 3, ALTERNATIVE 3B
PARAMETER VARIED FROM BASE CASE: PEAK PRODUCTION RATE - 50,000 BPD
TRANSPORTATION ELEMENT CAPITAL COSTMM$
ICE-STRENGTHENED TANKERSICEBREAKERSCONVENTIONAL TANKERSOFFSHORE LOADING TERMINALNEARSHORE LOADING TERMINALTRANSSHIPMENT TERMINALMARINE PIPELINELAND PIPELINE
24080
204---379307122..-
TOTAL 1332
PRESENT VALUE OF TOTAL COST (@ 8%) =
AVERAGE TRANSPORTATION COST PER BARREL =
ANNUAL COSTMM$
261222
-..21214
---
106
MM$ 228(I
$ 13.31
MANPOWERman-yr
Excl100
Excl-..140140-=..--
380
TABLE B-90
SENSITIVITY ANALYSIS FOR SCENARIO 3, ALTERNATIVE 3B
PARAMETER VARIED FROM BASE CASE: PEAK PRODUCTION RATE - 250,000 BPD
TRANSPORTATION ELEMENT CAPITAL COST ANNUAL COST MANPOWERMM$
ICE-STRENGTHENED TANKERS 294ICEBREAKERS 8(ICONVENTIONAL TANKERS 429OFFSHORE LOADING TERMINAL ---NEARSHORE LOADING TERMINAL 485TRANSSHIPMENT TERMINAL 473MARINE PIPELINE 216LAND PIPELINE ---
TOTAL 1977
PRESENT VALUE OF TOTAL COST (@ 8%)
MM$
311242
---22247
---
138
= MM$ 3220
man-yr
Excl100
Excl---140140------
380
AVERAGE TRANSPORTATION COST PER BARREL = $ 3.75
B-53
——
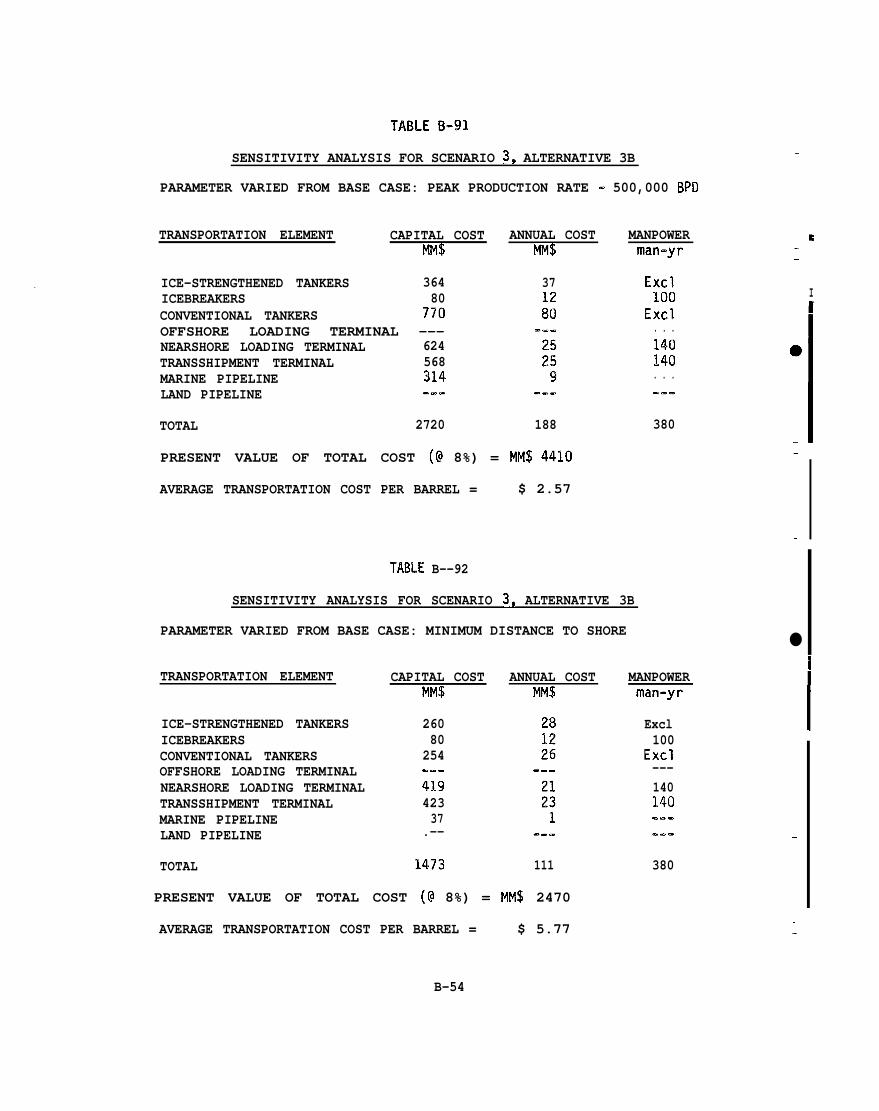
TABLE B-91
SENSITIVITY ANALYSIS FOR SCENARIO 3, ALTERNATIVE 3B
PARAMETER VARIED FROM BASE CASE: PEAK PRODUCTION RATE - 500,000 BPD
—
TRANSPORTATION ELEMENT CAPITAL COST ANNUAL COSTMM$ MM$
MANPOWERman-yr
ICE-STRENGTHENED TANKERS 364ICEBREAKERS 80CONVENTIONAL TANKERS 770OFFSHORE LOADING TERMINAL ---NEARSHORE LOADING TERMINAL 624TRANSSHIPMENT TERMINAL 568MARINE PIPELINE 314LAND PIPELINE -m.
371280
Excl100
Excl. . .140140. . .
I
TOTAL 2720 188 380
PRESENT VALUE OF TOTAL COST (@ 8%) = MM$ 4410 —
— IAVERAGE TRANSPORTATION COST PER BARREL = $ 2.57
●
I
. I
TABLE B--92
SENSITIVITY ANALYSIS FOR SCENARIO 3, ALTERNATIVE 3B
PARAMETER VARIED FROM BASE CASE: MINIMUM DISTANCE TO SHORE
TRANSPORTATION ELEMENT CAPITAL COSTMM$
ANNUAL COSTMM$
MANPOWERman-yr
ICE-STRENGTHENED TANKERSICEBREAKERSCONVENTIONAL TANKERSOFFSHORE LOADING TERMINALNEARSHORE LOADING TERMINALTRANSSHIPMENT TERMINALMARINE PIPELINELAND PIPELINE
TOTAL
26080
254--.41942337
.--
Excl100
Excl---140140-..
—
1473 111 380
PRESENT VALUE OF TOTAL COST (@ 8%) = MM$ 2470
AVERAGE TRANSPORTATION COST PER BARREL = $ 5.77——
B-54

—
——
TABLE B-93
SENSITIVITY ANALYSIS FOR SCENARIO 3, ALTERNATIVE 39
PARAMETER VARIED FROM BASE CASE: MAXIMUM DISTANCE TO SHORE
TRANSPORTATION ELEMENT CAPITAL COSTMM$
ICE-STRENGTHENED TANKERS .ICEBREAKERSCONVENTIONAL TANKERSOFFSHORE LOADING TERMINALNEARSHORE LOADING TERMINALTRANSSHIPMENT TERMINALMARINE PIPELINELAND PIPELINE
260
2::. . .419423290
TOTAL 1726
PRESENT VALUE OF TOTAL COST (@ 8%) =
AVERAGE TRANSPORTATION COST PER BARREL =
ANNUAL COSTMM$
281226
.-O212310
. . .
120
MM$ 2810
$ 6.55
MANPOWERman-y r
380
B-55
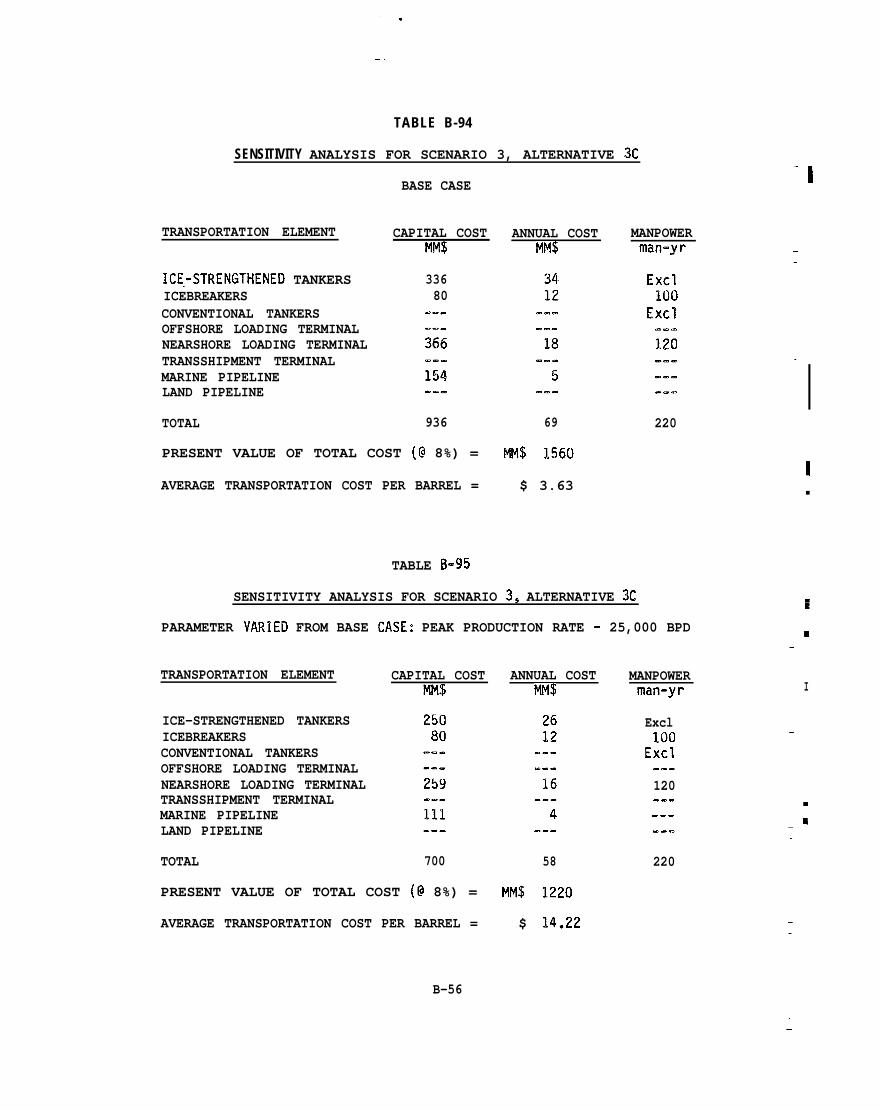
TABLE B-94
SENSITIVITY ANALYSIS FOR SCENARIO 3, ALTERNATIVE 3C
‘1BASE CASE
TRANSPORTATION ELEMENT CAPITAL COSTMM$
ANNUAL COSTMM$
MANPOWERman-=yr —
—
ICEVSTRENGTHENED TANKERSICEBREAKERSCONVENTIONAL TANKERSOFFSHORE LOADING TERMINALNEARSHORE LOADING TERMINALTRANSSHIPMENT TERMINALMARINE PIPELINELAND PIPELINE
TOTAL
33680
.-.
—
I936 69 220
PRESENT VALUE OF TOTAL COST (@ 8%) = MM$ 1560
AVERAGE TRANSPORTATION COST PER BARREL = $ 3.63
TABLE B-95
I■
SENSITIVITY ANALYSIS FOR SCENARIO 3, ALTERNATIVE 3C
PARAMETER VARIED FROM BASE CASE: PEAK PRODUCTION RATE - 25,000 BPD m—
TRANSPORTATION ELEMENT CAPITAL COSTMM$
ANNUAL COSTMM$
MANPOWERman-yr I
ICE-STRENGTHENED TANKERSICEBREAKERSCONVENTIONAL TANKERSOFFSHORE LOADING TERMINALNEARSHORE LOADING TERMINALTRANSSHIPMENT TERMINALMARINE PIPELINELAND PIPELINE
TOTAL
Excl100
——
Excl-.-
120--.. . .
700 58 220
PRESENT VALUE OF TOTAL COST (@ 8%) = MM$ 1220
AVERAGE TRANSPORTATION COST PER BARREL = $ 14.22
B-56

‘3
TABLE B-96
SENSITIVITY ANALYSIS FOR SCENARIO 3, ALTERNATIVE 3C
PARAMETER VARIED FROM BASE CASE: PEAK PRODUCTION RATE - 50,000 BPD
TRANSPORTATION ELEMENT
ICE-STRENGTHENED TANKERSICEBREAKERSCONVENTIONAL TANKERSOFFSHORE LOADING TERMINALNEARSHORE LOADING TERMINALTRANSSHIPMENT TERMINALMARINE PIPELINELAND PIPELINE
TOTAL
CAPITAL COSTMM$
27080
. . .
..-
284--.122. . .
756
ANNUAL COSTMM$
2812
..-
61
MANPOWERman-y r
Excl100
Excl---120---------
220
PRESENT VALUE OF TOTAL COST (@ 8%) = MM$ 1310
AVERAGE TRANSPORTATION COST PER BARREL = $ 7.61
TABLE B-97
SENSITIVITY ANALYSIS FOR SCENARIO 3, ALTERNATIVE 3C
PARAMETER VARIED FROM BASE CASE: PEAK PRODUCTION RATE - 250,000 BPD
TRANSPORTATION ELEMENT
ICE-STRENGTHENED TANKERSICEBREAKERSCONVENTIONAL TANKERSOFFSHORE LOADING TERMINALNEARSHORE LOADING TERMINALTRANSSHIPMENT TERMINALMARINE PIPELINELAND PIPELINE
TOTAL
CAPITAL COSTMM$
56180
------429---216---
1286
ANNUAL COSTMM$
5712
------19
---7
---
95
PRESENT VALUE OF TOTAL COST (@ 8%) = MM$ 2140
AVERAGE TRANSPORTATION COST PER BARREL = $ 2.50
B-57
MANPOWERman-yr
Excl100
Excl---120---------
220
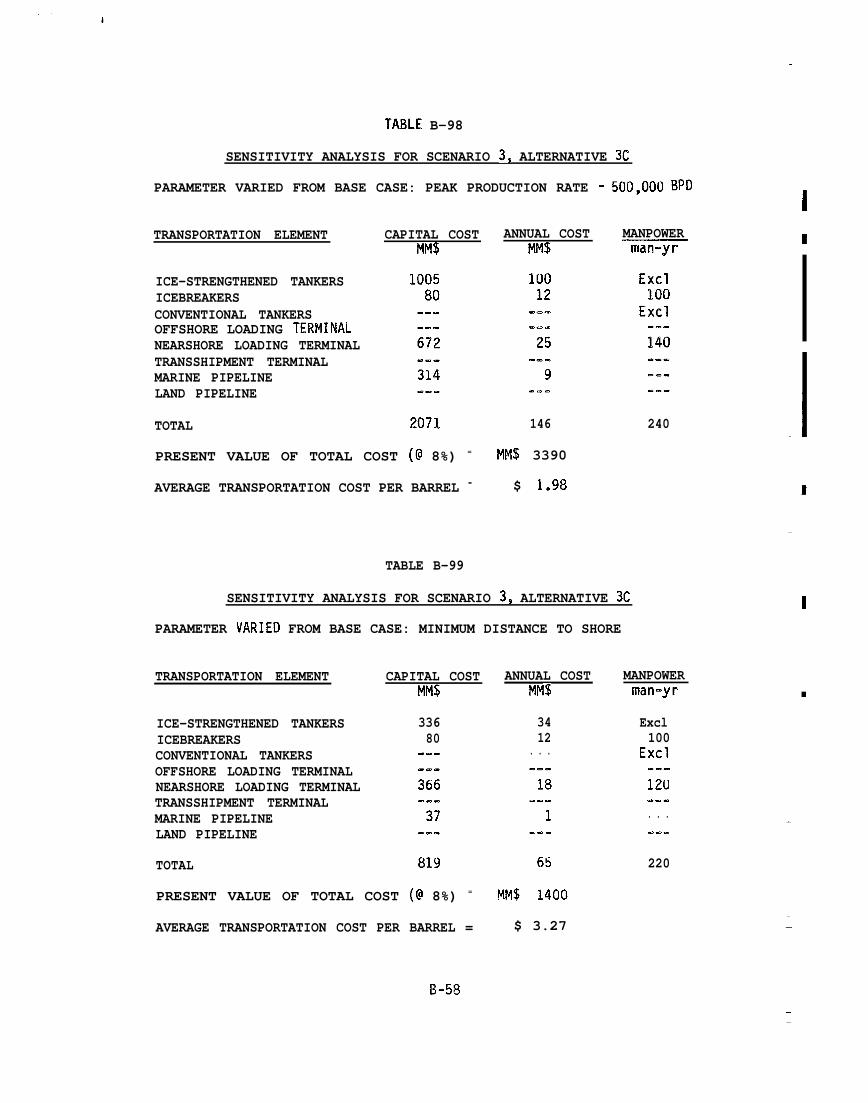
—--
TABLE B-98
SENSITIVITY ANALYSIS FOR SCENARIO 3, ALTERNATIVE X
PARAMETER VARIED FROM BASE CASE: PEAK PRODUCTION RATE - 500,000 BpD
—
I— I
1
CAPITAL COSTMM$
ANNUAL COSTMM$
MANPOWERman-.yr
TRANSPORTATION ELEMENT
ICE-STRENGTHENED TANKERSICEBREAKERSCONVENTIONAL TANKERSOFFSHORE LOADING TERMINALNEARSHORE LOADING TERMINALTRANSSHIPMENT TERMINALMARINE PIPELINELAND PIPELINE
TOTAL
. . .
2071 146 240
PRESENT VALUE OF TOTAL COST (@ 8%) = MM$ 3390
AVERAGE TRANSPORTATION COST PER BARREL = $ 1.98
TABLE B-99
SENSITIVITY ANALYSIS FOR SCENARIO 3, ALTERNATIVE 3C 1
PARAMETER VARIED FROM BASE CASE: MINIMUM DISTANCE TO SHORE —
CAPITAL COSTMM$
ANNUAL COSTMM$
MANPOWERman-yr
Excl100
Excl.--12U--.. . .--.
220
TRANSPORTATION ELEMENT
33680
3412
. . .
ICE-STRENGTHENED TANKERSICEBREAKERSCONVENTIONAL TANKERSOFFSHORE LOADING TERMINALNEARSHORE LOADING TERMINALTRANSSHIPMENT TERMINALMARINE PIPELINELAND PIPELINE
TOTAL 819 65
PRESENT VALUE OF TOTAL COST (@ 8%) = MM$ 1400
AVERAGE TRANSPORTATION COST PER BARREL = $ 3.27
6-5!3
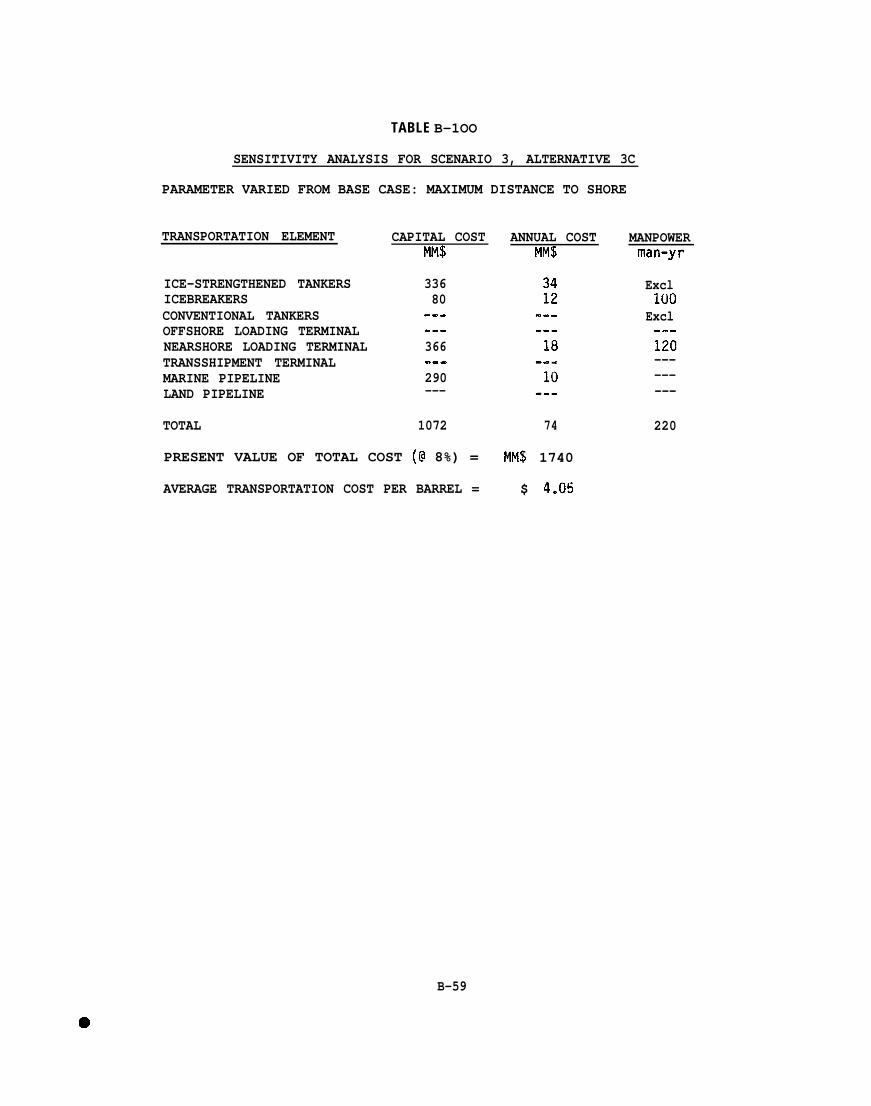
TABLE B-1OO
SENSITIVITY ANALYSIS FOR SCENARIO 3, ALTERNATIVE 3C
PARAMETER VARIED FROM BASE CASE: MAXIMUM DISTANCE TO SHORE
TRANSPORTATION ELEMENT
ICE-STRENGTHENED TANKERSICEBREAKERSCONVENTIONAL TANKERSOFFSHORE LOADING TERMINALNEARSHORE LOADING TERMINALTRANSSHIPMENT TERMINALMARINE PIPELINELAND PIPELINE
CAPITAL COST ANNUAL COSTMM$ MM$
33680
-.-..-366..-290---
---18
TOTAL 1072 74
PRESENT VALUE OF TOTAL COST (@ 8%) = MM$ 1740
MANPOWERman-yr
Excl100
Excl..-120---------
220
AVERAGE TRANSPORTATION COST PER BARREL = $ 4.05
B-59
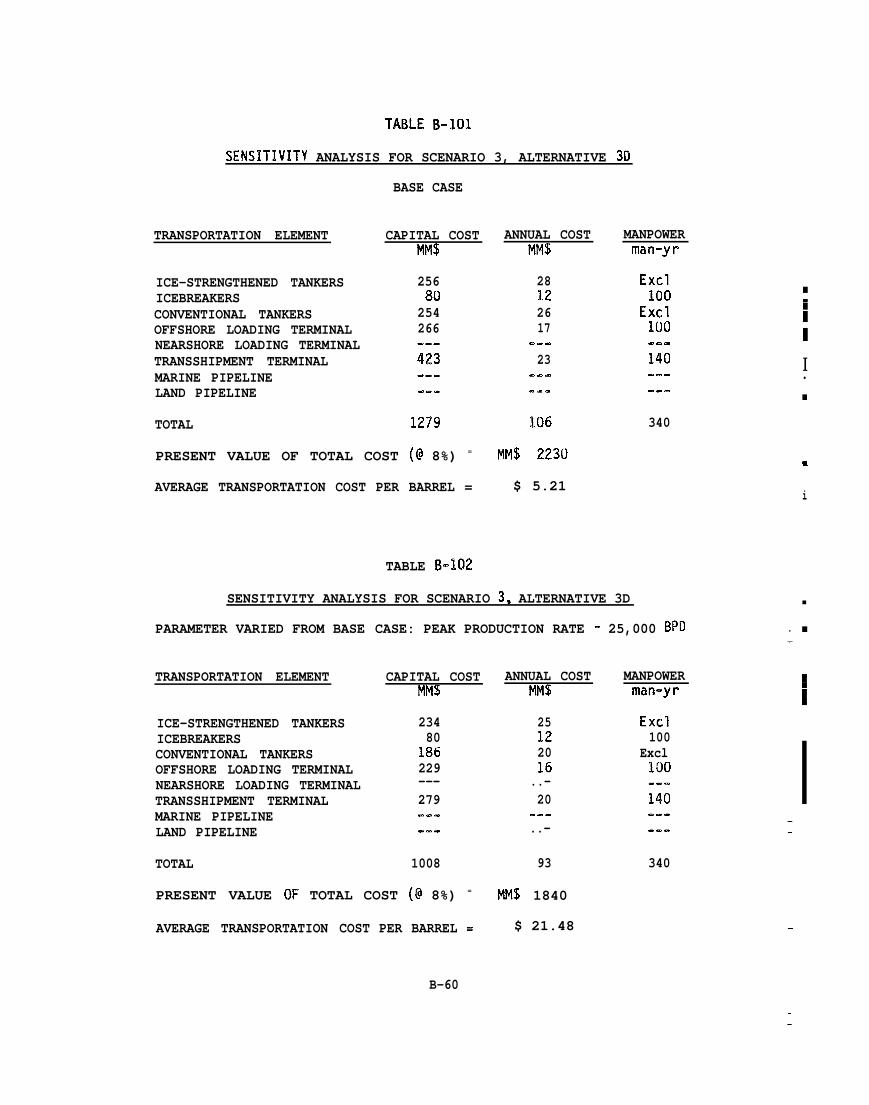
TABLE B-101
SENSITIVITY ANALYSIS FOR SCENARIO 3, ALTERNATIVE 3D
BASE CASE
CAPITAL COST ANNUAL COSTMM$ MM$
MANPOWERman-yr
TRANSPORTATION ELEMENT
ICE-STRENGTHENED TANKERSICEBREAKERSCONVENTIONAL TANKERSOFFSHORE LOADING TERMINALNEARSHORE LOADING TERMINALTRANSSHIPMENT TERMINALMARINE PIPELINELAND PIPELINE
TOTAL
2568(I
254266
28122617
--.23
Excl100
Excl100.-m140 I.
. . .
1279 106 340
PRESENT VALUE OF TOTAL COST (@ 8%) = MM$ 2230 m
AVERAGE TRANSPORTATION COST PER BARREL = $ 5.21i
TABLE B-102
SENSITIVITY ANALYSIS FOR SCENARIO 3, ALTERNATIVE 3D
PARAMETER VARIED FROM BASE CASE: PEAK PRODUCTION RATE - 25,000 BPD .
■
■
CAPITAL COSTMM$
ANNUAL COST MANPOWERMM$ man-yr
TRANSPORTATION ELEMENT
ICE-STRENGTHENED TANKERSICEBREAKERSCONVENTIONAL TANKERSOFFSHORE LOADING TERMINALNEARSHORE LOADING TERMINALTRANSSHIPMENT TERMINALMARINE PIPELINELAND PIPELINE
TOTAL
Excl100
Excl100
25122016
..-20
..-
..-
23480
18ti229---279.--.--
140
3401008 93
PRESENT VALUE OF TOTAL COST (@ 8%) = MM$ 1840
AVERAGE TRANSPORTATION COST PER BARREL = $ 21.48
B-60
—
——
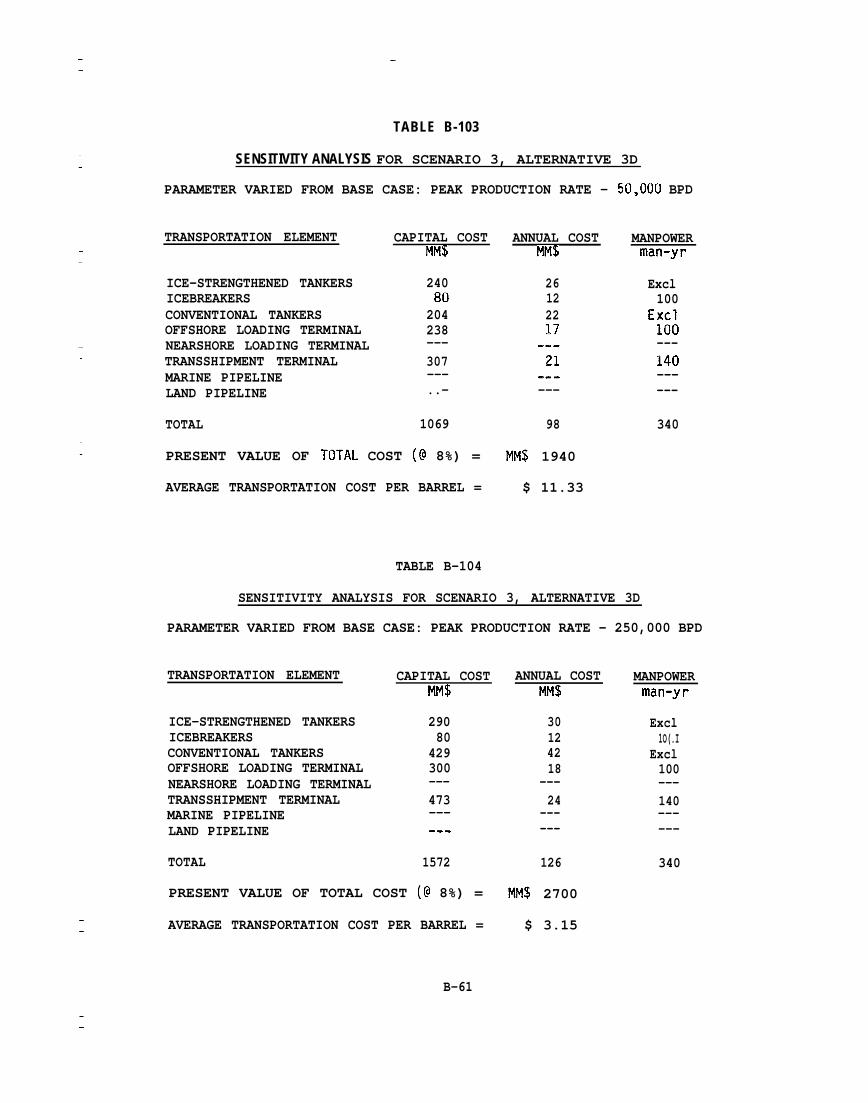
—
TABLE B-103
SENSITIVITY ANALYSIS FOR SCENARIO 3, ALTERNATIVE 3D
PARAMETER VARIED FROM BASE CASE: PEAK PRODUCTION RATE - 50,000 BPD
TRANSPORTATION ELEMENT
ICE-STRENGTHENED TANKERSICEBREAKERSCONVENTIONAL TANKERSOFFSHORE LOADING TERMINALNEARSHORE LOADING TERMINALTRANSSHIPMENT TERMINALMARINE PIPELINELAND PIPELINE
TOTAL
CAPITAL COSTMM$
24080
204238---307---..-
1069
ANNUAL COSTMM$
26122217
..-21
--.---
98
MANPOWERman-yr
Excl100
Excl100---140------
340
PRESENT VALUE OF TOTAL COST (@ 8%) = MM$ 1940
AVERAGE TRANSPORTATION COST PER BARREL = $ 11.33
TABLE B-104
SENSITIVITY ANALYSIS FOR SCENARIO 3, ALTERNATIVE 3D
PARAMETER VARIED FROM BASE CASE: PEAK PRODUCTION RATE - 250,000 BPD
TRANSPORTATION ELEMENT
ICE-STRENGTHENED TANKERSICEBREAKERSCONVENTIONAL TANKERSOFFSHORE LOADING TERMINALNEARSHORE LOADING TERMINALTRANSSHIPMENT TERMINALMARINE PIPELINELAND PIPELINE
TOTAL
CAPITAL COSTMM$
29080
429300---473------
1572
ANNUAL COSTMM$
30124218
---24
------
126
MANPOWERman-yr
Excl1O(.I
Excl100---140------
340
PRESENT VALUE OF TOTAL COST (@ 8%) = MM$ 2700
AVERAGE TRANSPORTATION COST PER BARREL = $ 3.15
B-61
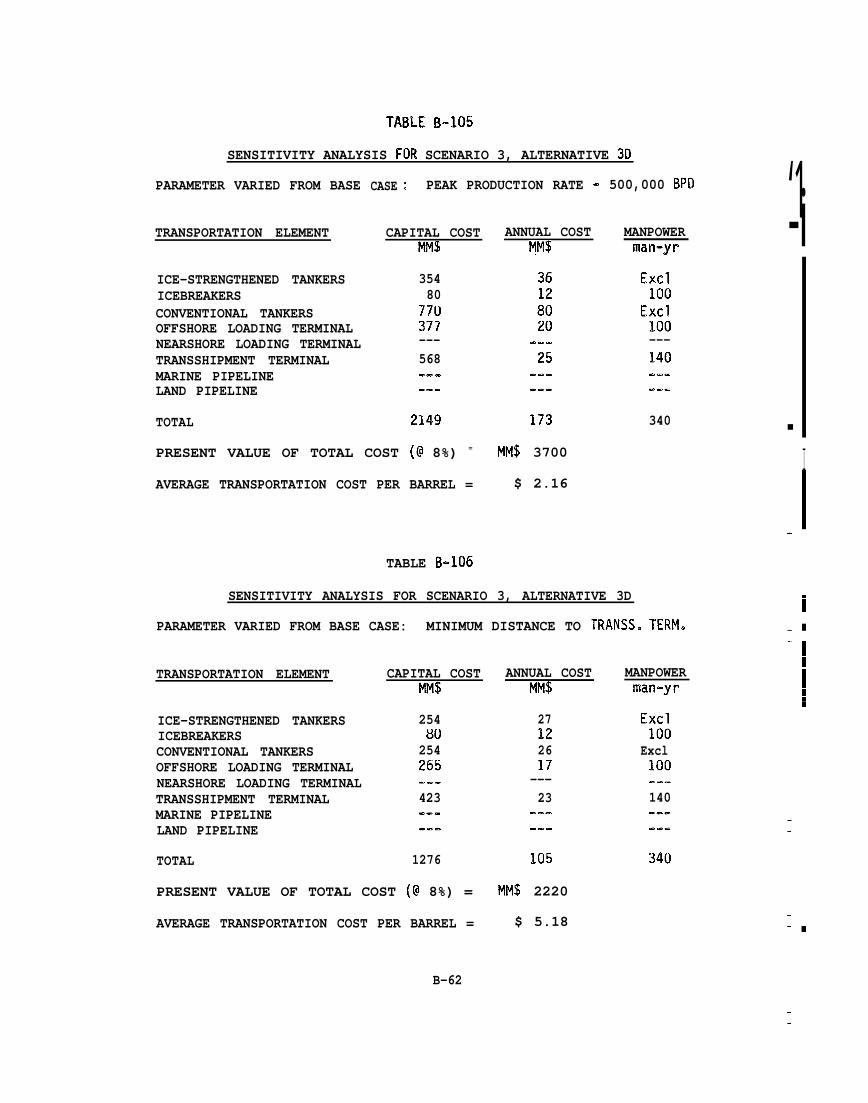
TABLE B-=105
SENSITIVITY ANALYSIS FOR SCENARIO 3, ALTERNATIVE 3D
‘1-i
—I
1
500,000 BPCI
MANPOWERman-yr
Excl100
Excl100---140-..-..
340
PARAMETER VARIED FROM BASE CASE : PEAK PRODUCTION RATE -
TRANSPORTATION ELEMENT CAPITAL COSTMM$
ANNUAL COSTMM$
35480
77’(J377---568.--.-.
ICE-STRENGTHENED TANKERSICEBREAKERSCONVENTIONAL TANKERSOFFSHORE LOADING TERMINALNEARSHORE LOADING TERMINALTRANSSHIPMENT TERMINALMARINE PIPELINELAND PIPELINE
TOTAL 214’3 173
PRESENT VALUE OF TOTAL COST (@ 8%) = MM$ 3700
AVERAGE TRANSPORTATION COST PER BARREL = $ 2.16
TABLE B==I06
SENSITIVITY ANALYSIS FOR SCENARIO 3, ALTERNATIVE 3D
PARAMETER VARIED FROM BASE CASE: MINIMUM DISTANCE TO TRANSSo TERM.i
‘1III:
TRANSPORTATION ELEMENT CAPITAL COSTMM$
ANNUAL COSTMM$
MANPOWERman-yr
ICE-STRENGTHENED TANKERSICEBREAKERSCONVENTIONAL TANKERSOFFSHORE LOADING TERMINALNEARSHORE LOADING TERMINALTRANSSHIPMENT TERMINALMARINE PIPELINELAND PIPELINE
254w
254265
27122617
---23
..--..
Excl100
Excl100
---423.-.
---140
TOTAL 1276 105 340
PRESENT VALUE OF TOTAL COST (@ 8%) = MM$ 2220
AVERAGE TRANSPORTATION COST PER BARREL = $ 5.18
B-62
.—
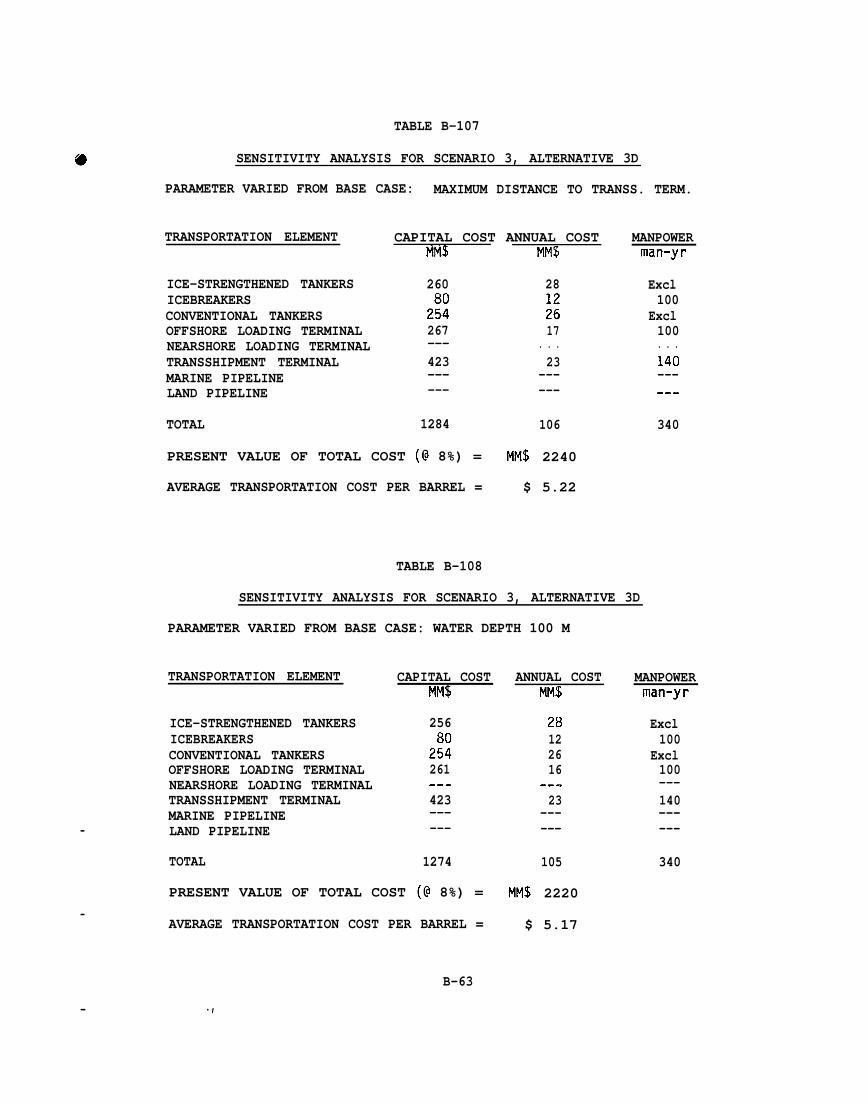
TABLE B-107
SENSITIVITY ANALYSIS FOR SCENARIO 3, ALTERNATIVE 3D
PARAMETER VARIED FROM BASE CASE: MAXIMUM DISTANCE TO TRANSS. TERM.
TRANSPORTATION ELEMENT
ICE-STRENGTHENED TANKERSICEBREAKERSCONVENTIONAL TANKERSOFFSHORE LOADING TERMINALNEARSHORE LOADING TERMINALTRANSSHIPMENT TERMINALMARINE PIPELINELAND PIPELINE
TOTAL
CAPITAL COST ANNUAL COSTMM$ MM$
260 28
2:: ;:267 17--- . . .423 23--- ------ ---
1284 106
MANPOWERman-yr
PRESENT VALUE OF TOTAL COST (@ 8%) = MM$ 2240
AVERAGE TRANSPORTATION COST PER BARREL = $ 5.22
TABLE B-108
SENSITIVITY ANALYSIS FOR SCENARIO 3, ALTERNATIVE 3D
PARAMETER VARIED FROM BASE CASE: WATER DEPTH 100 M
TRANSPORTATION ELEMENT
ICE-STRENGTHENED TANKERSICEBREAKERSCONVENTIONAL TANKERSOFFSHORE LOADING TERMINALNEARSHORE LOADING TERMINALTRANSSHIPMENT TERMINALMARINE PIPELINE
— LAND PIPELINE
TOTAL
CAPITAL COSTMM$
256
2::261--.423------
1274
ANNUAL COSTMM$
28122616
--.23
------
105
PRESENT VALUE OF TOTAL COST (L+ 8%) = MM$ 2220—
AVERAGE TRANSPORTATION COST PER BARREL = $ 5.17
Excl100
Excl100. . .140------
340
MANPOWERman-yr
Excl100
Excl100---140------
340
B-63
.,—
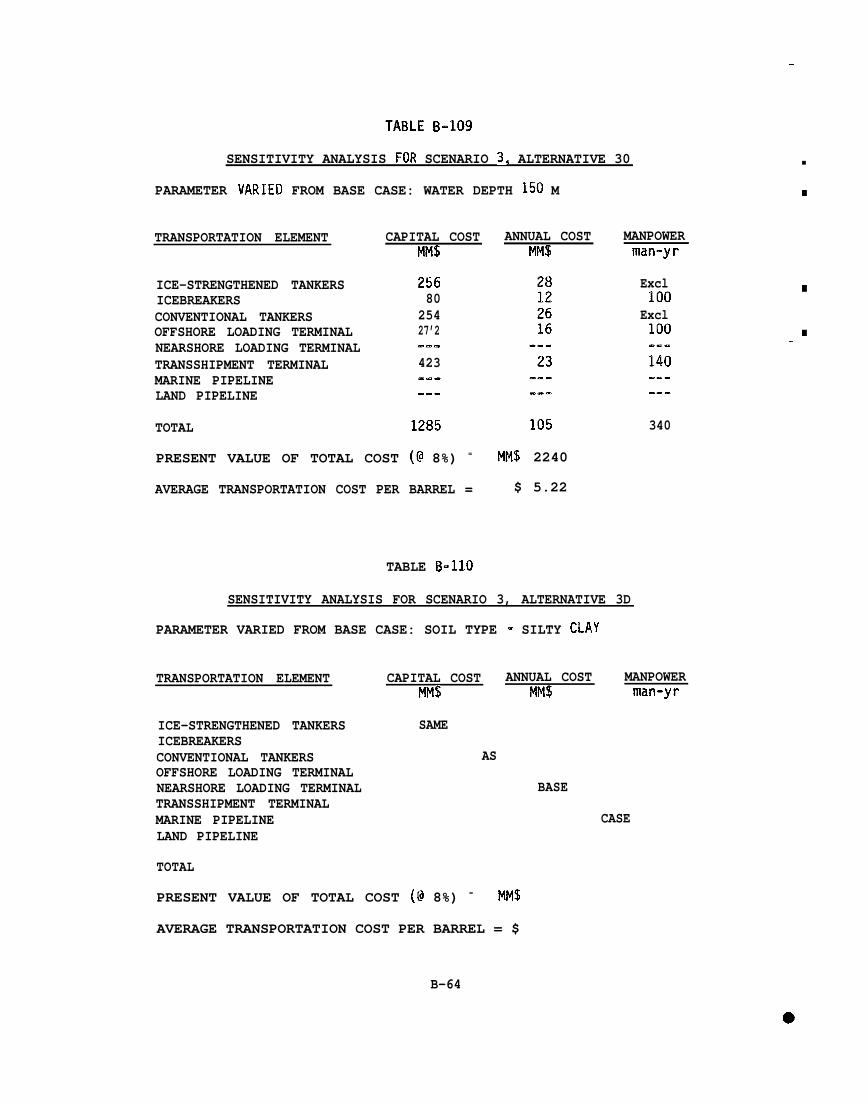
—
TABLE B==I09
SENSITIVITY ANALYSIS FOR SCENARIO 3, ALTERNATIVE 30
PARAMETER VARIED FROM BASE CASE: WATER DEPTH 150 M
TRANSPORTATION ELEMENT
ICE-STRENGTHENED TANKERSICEBREAKERSCONVENTIONAL TANKERSOFFSHORE LOADING TERMINALNEARSHORE LOADING TERMINALTRANSSHIPMENT TERMINALMARINE PIPELINELAND PIPELINE
TOTAL
CAPITAL COSTMM$
25680
25427’2.-.423
.--
1285
ANNUAL COSTMM$
105
MANPOWERman-yr
Excl100
Excl100---
140-..-.-
340
PRESENT VALUE OF TOTAL COST (@ 8%) = MM$ 2240
AVERAGE TRANSPORTATION COST PER BARREL = $ 5.22
TABLE B-110
SENSITIVITY ANALYSIS FOR SCENARIO 3, ALTERNATIVE 3D
PARAMETER VARIED FROM BASE CASE: SOIL TYPE - SILTY CLAY
TRANSPORTATION ELEMENT
ICE-STRENGTHENED TANKERSICEBREAKERSCONVENTIONAL TANKERSOFFSHORE LOADING TERMINALNEARSHORE LOADING TERMINALTRANSSHIPMENT TERMINALMARINE PIPELINELAND PIPELINE
TOTAL
CAPITAL COST ANNUAL COST MANPOWERMM$ MM$ man-yr
SAME
AS
BASE
CASE
PRESENT VALUE OF TOTAL COST (@ 8%) = MM$
AVERAGE TRANSPORTATION COST PER BARREL = $
B-64
—■
—
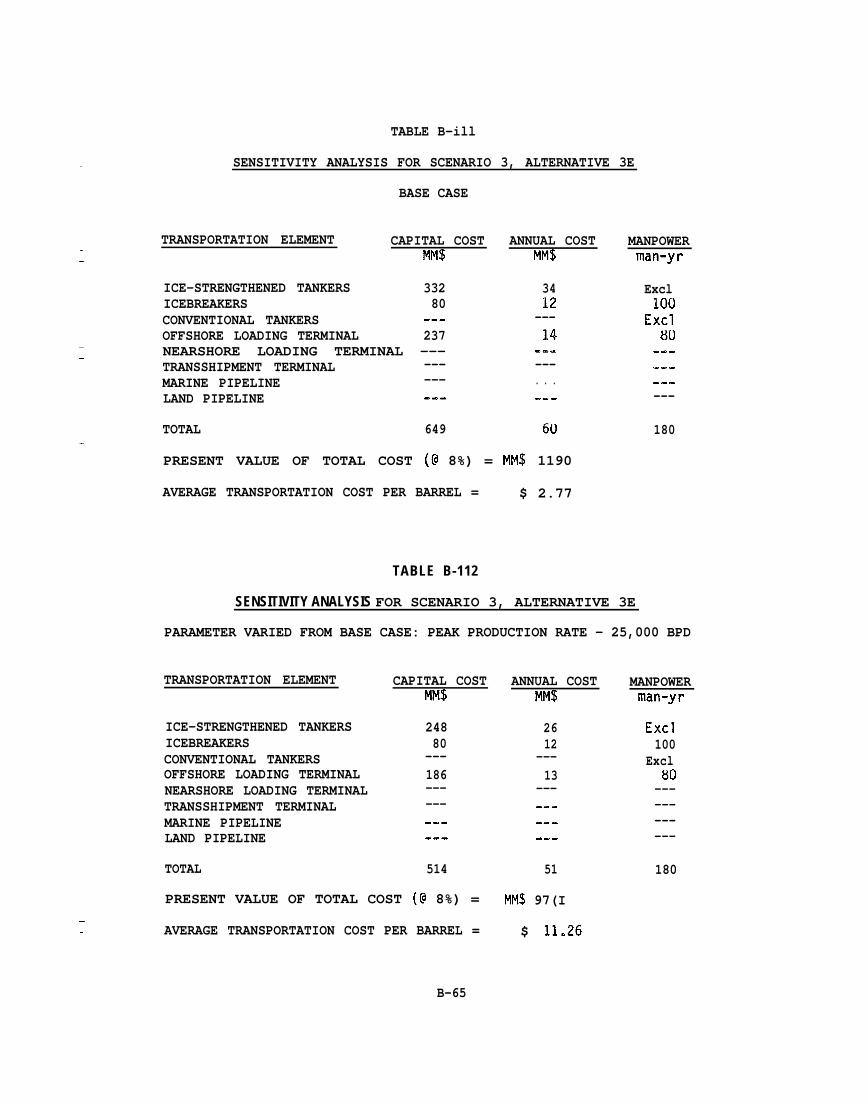
TABLE B-ill
SENSITIVITY ANALYSIS FOR SCENARIO 3, ALTERNATIVE 3E
BASE CASE
TRANSPORTATION ELEMENT CAPITAL COST ANNUAL COSTMM$ MM$
ICE-STRENGTHENED TANKERS 332 34ICEBREAKERS 80 12CONVENTIONAL TANKERS ..c ---OFFSHORE LOADING TERMINAL 237 14NEARSHORE LOADING TERMINAL --- ..-TRANSSHIPMENT TERMINAL --- ---MARINE PIPELINE --- . . .LAND PIPELINE ..- ..-
TOTAL 649 60
PRESENT VALUE OF TOTAL COST (@ 8%) = MM$ 1190
AVERAGE TRANSPORTATION COST PER BARREL = $ 2.77
MANPOWERman-yr
Excl100
Excl80
-..--.--a---
180
TABLE B-112
SENSITIVITY ANALYSIS FOR SCENARIO 3, ALTERNATIVE 3E
PARAMETER VARIED FROM BASE CASE: PEAK PRODUCTION RATE - 25,000 BPD
TRANSPORTATION ELEMENT CAPITAL COST ANNUAL COSTMM$ MM$
ICE-STRENGTHENED TANKERSICEBREAKERSCONVENTIONAL TANKERSOFFSHORE LOADING TERMINALNEARSHORE LOADING TERMINALTRANSSHIPMENT TERMINALMARINE PIPELINELAND PIPELINE
24880
---186------------
2612
---13
------------
TOTAL 514 51
PRESENT VALUE OF TOTAL COST (@ 8%) = MM$ 97(I—— AVERAGE TRANSPORTATION COST PER BARREL = $ 11.26
MANPOWERman-yr
Excl100
Excl80
------------
180
B-65
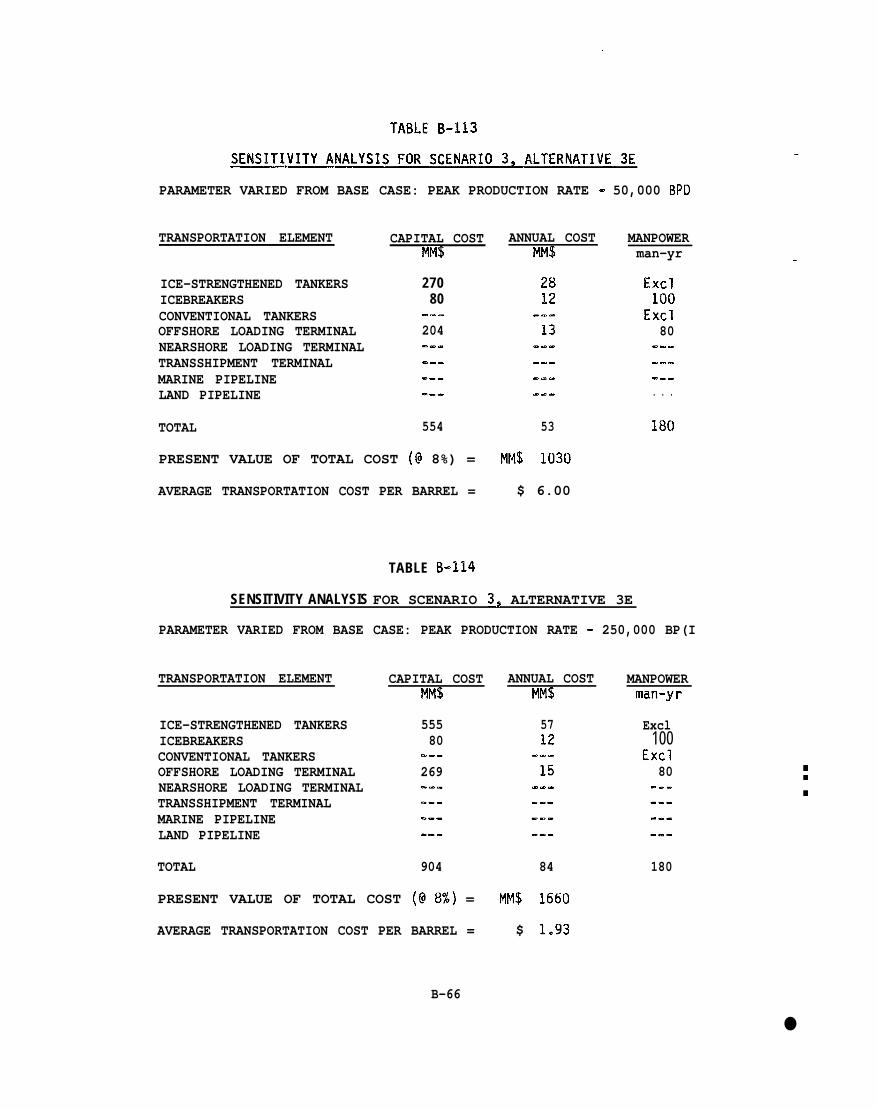
—
PARAMETER VARIED FROM BASE CASE: PEAK PRODUCTION RATE - 50,000 BPD
TRANSPORTATION ELEMENT CAPITAL COSTMM$
ANNUAL COSTMM$
MANPOWERman-yr
EXcl100
Exc.180
..=
..=
..-
. . .
180
—
ICE-STRENGTHENED TANKERSICEBREAKERSCONVENTIONAL TANKERSOFFSHORE LOADING TERMINALNEARSHORE LOADING TERMINALTRANSSHIPMENT TERMINALMARINE PIPELINELAND PIPELINE
27080
---204
.-.-.--
TOTAL 554 53
PRESENT VALUE OF TOTAL COST (@ 8%) = MM$ 1030
AVERAGE TRANSPORTATION COST PER BARREL = $ 6.00
TABLE B-114
SENSITIVITY ANALYSIS FOR SCENARIO 3, ALTERNATIVE 3E
PARAMETER VARIED FROM BASE CASE: PEAK PRODUCTION RATE - 250,000 BP(I
TRANSPORTATION ELEMENT CAPITAL COSTMM$
ANNUAL COSTMM$
MANPOWERman-yr
ICE-STRENGTHENED TANKERSICEBREAKERSCONVENTIONAL TANKERSOFFSHORE LOADING TERMINALNEARSHORE LOADING TERMINALTRANSSHIPMENT TERMINALMARINE PIPELINELAND PIPELINE
TOTAL
555 57 Excl100
Excl80
80
269.-- . . .-..
--- -..
904 84 180
PRESENT VALUE OF TOTAL COST (@8%) = MM$ 1660
AVERAGE TRANSPORTATION COST PER BARREL = $ 1.93
B-66
●
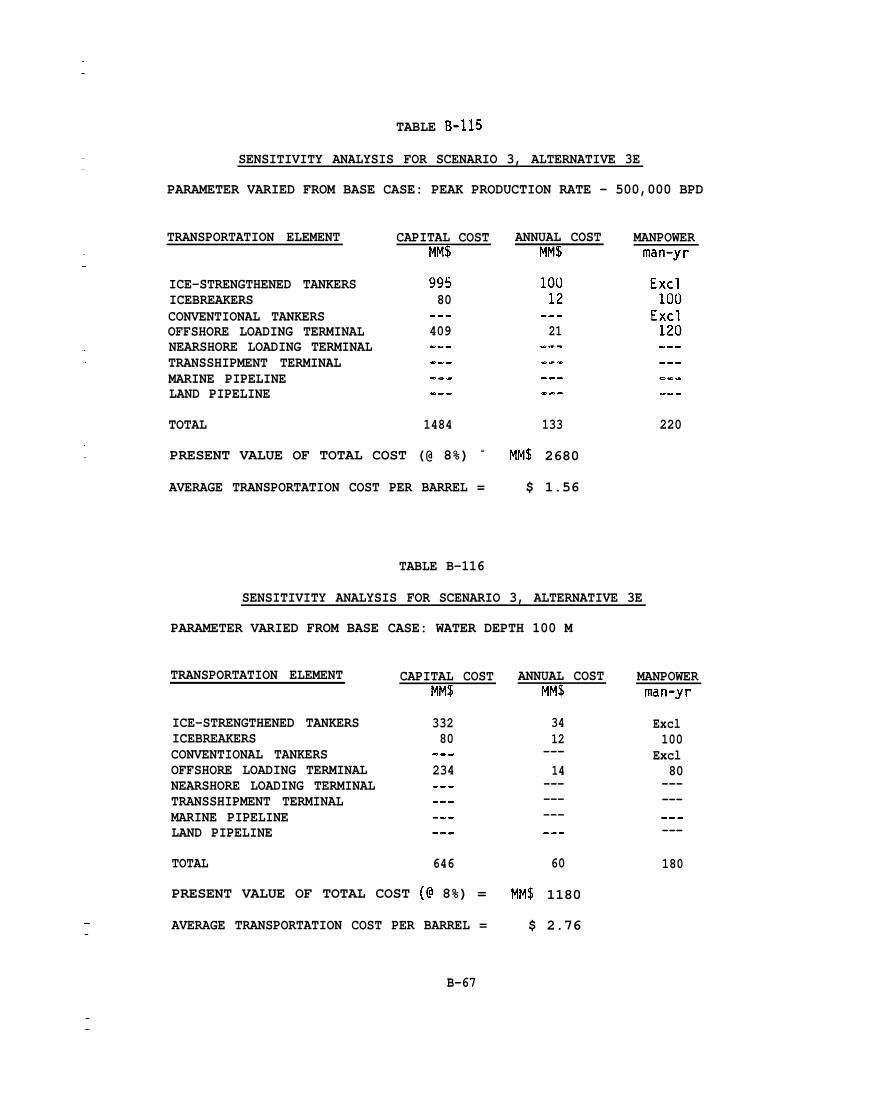
TABLE B-115
SENSITIVITY ANALYSIS FOR SCENARIO 3, ALTERNATIVE 3E
PARAMETER VARIED FROM BASE CASE: PEAK PRODUCTION RATE - 500,000 BPD
TRANSPORTATION ELEMENT CAPITAL COSTMM$
ANNUAL COSTMM$
MANPOWERman-yr
ICE-STRENGTHENED TANKERSICEBREAKERSCONVENTIONAL TANKERSOFFSHORE LOADING TERMINALNEARSHORE LOADING TERMINALTRANSSHIPMENT TERMINALMARINE PIPELINELAND PIPELINE
TOTAL
995 10080
--- ---409 21
..-
.-. ------ ---
1484 133 220
PRESENT VALUE OF TOTAL COST (@ 8%) = MM$ 2680
AVERAGE TRANSPORTATION COST PER BARREL = $ 1.56
TABLE B-116
SENSITIVITY ANALYSIS FOR SCENARIO 3, ALTERNATIVE 3E
PARAMETER VARIED FROM BASE CASE: WATER DEPTH 100 M
TRANSPORTATION ELEMENT CAPITAL COST ANNUAL COSTMM$ MM$
MANPOWERman-yr
Excl100
Excl80
-------..---
180
ICE-STRENGTHENED TANKERSICEBREAKERSCONVENTIONAL TANKERSOFFSHORE LOADING TERMINALNEARSHORE LOADING TERMINALTRANSSHIPMENT TERMINALMARINE PIPELINELAND PIPELINE
TOTAL
33280
3412
---14
---------
---234---------
---
646 60
PRESENT VALUE OF TOTAL COST (@ 8%) = MM$ 1180
AVERAGE TRANSPORTATION COST PER BARREL = $ 2.76
B-67
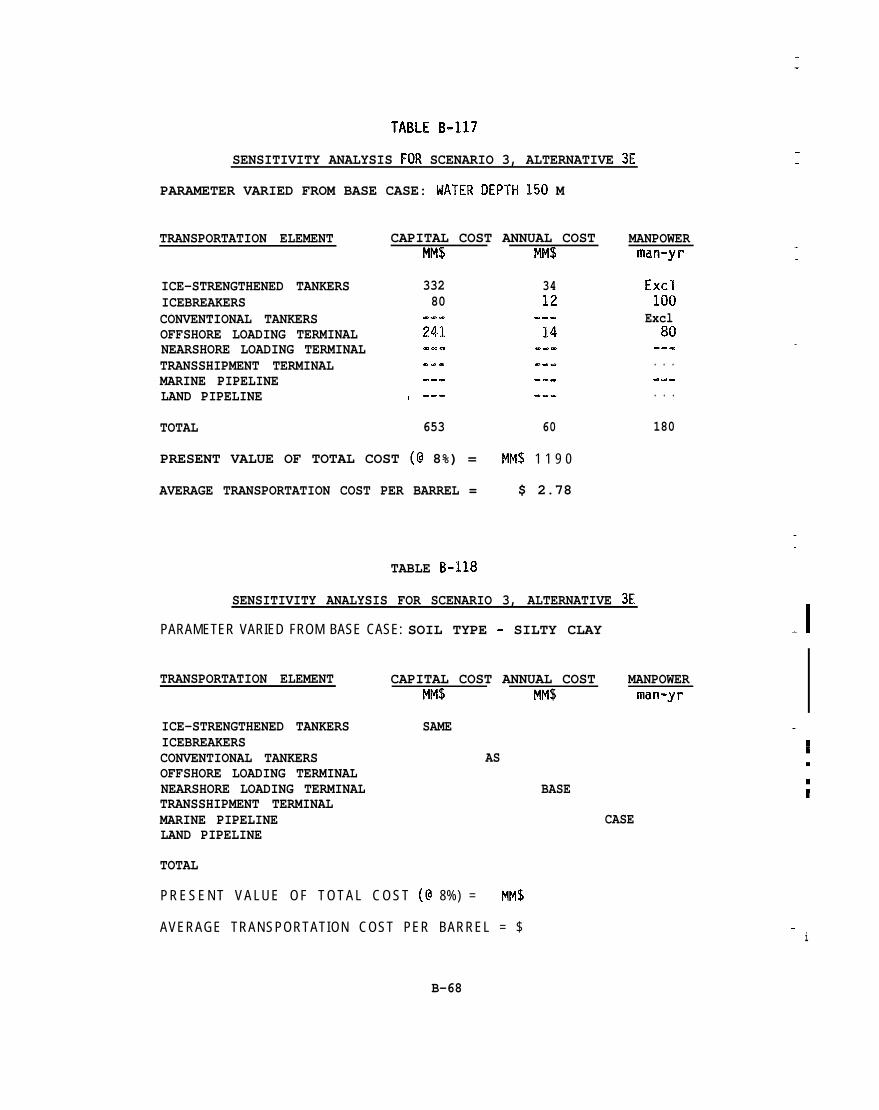
TABLE B-117
SENSITIVITY ANALYSIS FOR SCENARIO 3, ALTERNATIVE X
PARAMETER VARIED FROM BASE CASE: MATER DEPTH 150 M
TRANSPORTATION ELEMENT CAPITAL COST ANNUAL COSTMM$ MM$
ICE-STRENGTHENED TANKERSICEBREAKERSCONVENTIONAL TANKERSOFFSHORE LOADING TERMINALNEARSHORE LOADING TERMINALTRANSSHIPMENT TERMINALMARINE PIPELINELAND PIPELINE
33280
241.-.. . .
1. . .
34
-.-
TOTAL 653 60
PRESENT VALUE OF TOTAL COST (@ 8%) = MM$ 1 1 9 0
AVERAGE TRANSPORTATION COST PER BARREL = $ 2.78
TABLE B-118
SENSITIVITY ANALYSIS FOR SCENARIO 3, ALTERNATIVE 3E
PARAMETER VARIED FROM BASE CASE: SOIL TYPE - SILTY CLAY
MANPOWERman-yr
Excl100
Excl80
..-
. . .
..S
. . .
180
TRANSPORTATION ELEMENT
ICE-STRENGTHENED TANKERSICEBREAKERSCONVENTIONAL TANKERSOFFSHORE LOADING TERMINALNEARSHORE LOADING TERMINALTRANSSHIPMENT TERMINALMARINE PIPELINELAND PIPELINE
TOTAL
CAPITAL COST ANNUAL COST MANPOWERMM$ MM$ man-yr
SAME
AS
BASE
CASE
PRESENT VALUE OF TOTAL COST (@ 8%) = MM$
AVERAGE TRANSPORTATION COST PER BARREL = $
——
_l—
I
—i
B-68