Embed Size (px)
Citation preview
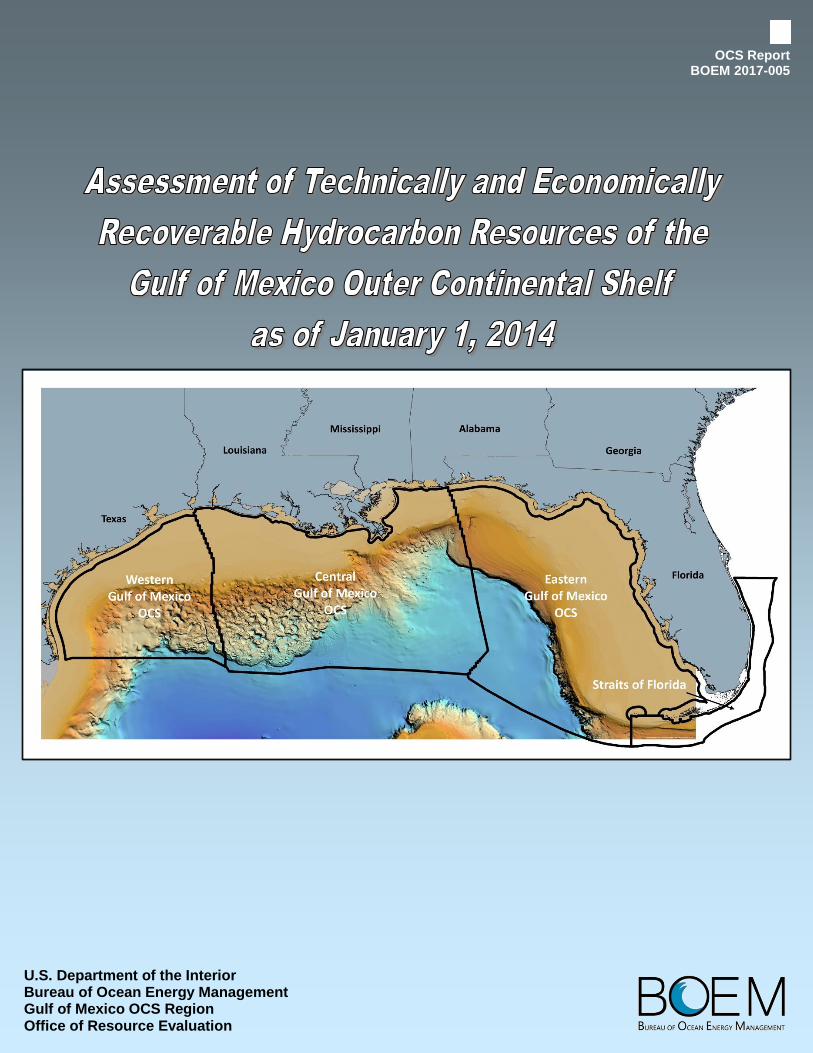
OCS Report BOEM 2017-005
U.S. Department of the Interior Bureau of Ocean Energy Management Gulf of Mexico OCS Region Office of Resource Evaluation

ON COVER—Multibeam bathymetry map of the northern Gulf of Mexico with superimposed planning area boundaries. The bathymetric map is from the U.S. National Oceanic and Atmospheric Administration, National Environmental Satellite, Data, and Information Service, National Centers for Environmental Information (formerly the National Geophysical Data Center).
OCS Report BOEM 2017-005
Assessment of Technically and Economically Recoverable Hydrocarbon Resources of the Gulf of Mexico Outer Continental Shelf as of January 1, 2014
Published by U.S. Department of the Interior Bureau of Ocean Energy Management Gulf of Mexico OCS Region New Orleans Office of Resource Evaluation January 2017
ii
TABLE OF CONTENTS TABLE OF CONTENTS ..................................................................................................................................... ii
FIGURES ........................................................................................................................................................ iii
TABLES .......................................................................................................................................................... iii
ABBREVIATIONS AND ACRONYMS ............................................................................................................... iv
INTRODUCTION ............................................................................................................................................. 1
CENOZOIC GULF OF MEXICO ......................................................................................................................... 4
Cenozoic Assessment Units ................................................................................................................. 4
Geology ................................................................................................................................................ 8
Modern Shelf ................................................................................................................................... 8
Modern Slope .................................................................................................................................. 9
MESOZOIC GULF OF MEXICO ...................................................................................................................... 12
Mesozoic Plays ................................................................................................................................... 12
Geology .............................................................................................................................................. 12
Assessed Plays ................................................................................................................................... 14
Mesozoic Deep Shelf ...................................................................................................................... 14
Mesozoic Slope .............................................................................................................................. 15
Buried Hill ...................................................................................................................................... 17
Lower Tuscaloosa ........................................................................................................................... 19
Lower Cretaceous Clastic ............................................................................................................... 19
Andrew ........................................................................................................................................... 20
James ............................................................................................................................................. 21
Sligo ................................................................................................................................................ 22
Sunniland/South Florida Basin ....................................................................................................... 23
Florida Basement Clastic ................................................................................................................ 23
Cotton Valley Clastic ...................................................................................................................... 24
Smackover ...................................................................................................................................... 26
Norphlet ......................................................................................................................................... 27
Non-Assessed Plays ........................................................................................................................... 29
Knowles Carbonate ........................................................................................................................ 29
Tuscaloosa Marine Shale ............................................................................................................... 29
Expanded Jurassic .......................................................................................................................... 31
Pre-Salt Clastic ............................................................................................................................... 31
iii
ASSESSMENT RESULTS ................................................................................................................................ 32
Undiscovered Technically Recoverable Resources ............................................................................ 32
Undiscovered Economically Recoverable Resources ........................................................................ 36
REFERENCES ................................................................................................................................................ 38
GLOSSARY.................................................................................................................................................... 42
FIGURES Figure 1. Federal OCS waters of the Gulf of Mexico delineated by planning and protraction areas. ........ 2 Figure 2. Locations of the shelf and slope assessment units in the Gulf of Mexico OCS. .......................... 4 Figure 3. Geographic distribution of assessed Cenozoic pools by assessment unit. .................................. 7 Figure 4. Generalized physiographic map of the Gulf of Mexico area. ...................................................... 9 Figure 5. Mesozoic Deep Shelf Play area. ................................................................................................. 15 Figure 6. Mesozoic Slope Play area. .......................................................................................................... 17 Figure 7. Buried Hill Play area. .................................................................................................................. 18 Figure 8. Lower Tuscaloosa Play area. ...................................................................................................... 19 Figure 9. Lower Cretaceous Clastic Play area. .......................................................................................... 20 Figure 10. Andrew Play area. ...................................................................................................................... 21 Figure 11. James and Sligo Play area. ......................................................................................................... 23 Figure 12. Sunniland/South Florida Basin and Florida Basement Clastic Play area. ................................... 24 Figure 13. Cotton Valley Clastic Play area. .................................................................................................. 25 Figure 14. Smackover Play area. ................................................................................................................. 26 Figure 15. Norphlet Play area. .................................................................................................................... 27 Figure 16. Aeolian dune type change from shallow-water to deepwater Norphlet. ................................. 28 Figure 17. Knowles Carbonate Play area. ................................................................................................... 30 Figure 18. Tuscaloosa Marine Shale Play area. ........................................................................................... 30 Figure 19. Estimated discovered resources and UTRR of the Gulf of Mexico OCS. .................................... 32 Figure 20. Assessment units/plays ranked by mean-level UTRR. ............................................................... 33 Figure 21. Portions of UTRR that are economic under three price pairs for the Gulf of Mexico OCS. ....... 36 Figure 22. Portions of UTRR that are economic under three price pairs for each planning area. ............. 36
TABLES Table 1. BOEM resource classification. ......................................................................................................... 3 Table 2. Gulf of Mexico Cenozoic chronostratigraphy and corresponding biostratigraphy. ........................ 5 Table 3. Rock units in the northeastern Gulf of Mexico and South Florida Basin. ..................................... 13 Table 4. Gulf of Mexico Mesozoic chronostratigraphy and corresponding biostratigraphy. ..................... 14 Table 5. UTRR by assessment unit/play. ..................................................................................................... 34 Table 6. UTRR by planning area and water depth. ..................................................................................... 35 Table 7. UERR with a gas market value adjustment of 0.3. ........................................................................ 37
iv
ABBREVIATIONS AND ACRONYMS 3D three dimensional Bbbl billion barrels bbl barrels BBOE billion barrels of oil equivalent BOE barrels of oil equivalent BOEM Bureau of Ocean Energy Management cf cubic feet DOI Department of the Interior ft feet GOM Gulf of Mexico km kilometers m meters Mcf thousand cubic feet mi miles mya million years ago no. number OCS Outer Continental Shelf SP spontaneous potential Tcf trillion cubic feet UERR undiscovered economically recoverable resources U.S. United States UTRR undiscovered technically recoverable resources
1
INTRODUCTION The Bureau of Ocean Energy Management (BOEM) is an agency within the Department of the
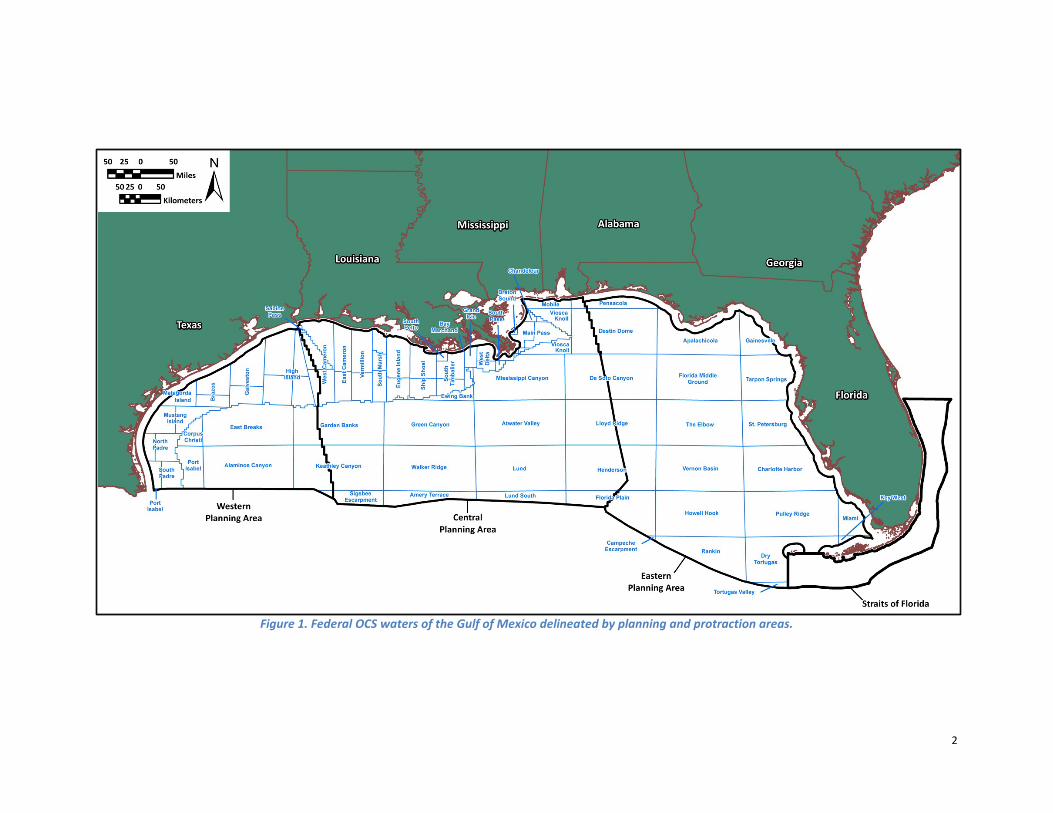
Interior (DOI) whose responsibilities include assessing the amounts of technically and economically recoverable undiscovered oil and natural gas resources located outside of known oil and gas fields for the United States (U.S.) portion of the Gulf of Mexico (GOM) Outer Continental Shelf (OCS) (Figure 1). The OCS comprises the portion of the submerged seabed whose mineral estate is subject to Federal jurisdiction.
The assessment summarized herein represents a comprehensive appraisal that (1) considered recent geophysical, geological, technological, and economic data and information available as of January 1, 2014, (2) incorporated advances in petroleum exploration and development technologies, and (3) employed new methods of resource assessment. A play-based approach to estimate the undiscovered resources of oil and gas was used. This methodology is suitable for both conceptual plays where there is little or no specific information available and for established plays where there are discovered oil and gas fields and considerable information is available. This method has a strong relationship between information derived from oil and gas exploration activities and the geologic model developed by the assessment team. An extensive effort was involved in developing play models, delineating the geographic limits of each play, and compiling data on critical geologic and reservoir engineering parameters. These parameters were crucial input in the determination of the total quantities of recoverable resources in each play.
The observed incremental increase through time in the estimates of reserves of an oil and/or gas field is known as reserves growth or appreciation. It is that part of the known resources over reserves that will be added to existing fields through extension, revision, improved recovery, and the addition of new reservoirs. The reserves growth phenomenon contributes a significant portion of the current domestic petroleum supply and must be an integral part of any resource assessment. For this assessment, a growth factor was applied to the original estimates of reserves to account for growth.
Due to the inherent uncertainties associated with an assessment of undiscovered resources, probabilistic techniques were employed and results reported as a range of values corresponding to different probabilities of occurrence. The probability model for the relative frequency distribution of hydrocarbon accumulations within each play was assumed to be lognormal. For plays in areas with sparse data, analogs were developed using subjective probabilities to cover the range of uncertainties. For mature areas with significant amounts of data, plays were analyzed using a method based on statistical parameters of discovered pools and historical trends.
The petroleum commodities assessed and reported in this inventory are crude oil, natural gas liquids (condensate), and natural gas that exist in conventional reservoirs and are producible with conventional recovery techniques. Crude oil and condensate are reported jointly as oil; associated and non-associated gas are reported jointly as gas. Oil volumes are reported as stock tank barrels (bbl) and gas as standard cubic feet (cf). Oil-equivalent gas is a volume of gas (associated and/or non-associated) expressed in terms of its energy equivalence to oil (i.e., 5,620 cubic feet of gas per barrel of oil) and is reported in barrels. The combined volume of oil and oil-equivalent gas resources is referred to as barrels of oil equivalent (BOE) and is reported in barrels. Units reported for the assessment are in billions (Bbbl and BBOE) and trillions (Tcf). This assessment does not include potentially large quantities of hydrocarbon resources that could be recovered from known and future fields by enhanced recovery techniques, gas in geopressured brines, natural gas hydrates, or oil and natural gas that may be present in insufficient quantities or quality (low permeability “tight” reservoirs) to be produced by conventional recovery techniques. In some instances the boundary between these resources is somewhat indistinct; however, any significant volume of unconventional resources are not included in this assessment.
2
Figure 1. Federal OCS waters of the Gulf of Mexico delineated by planning and protraction areas.
3
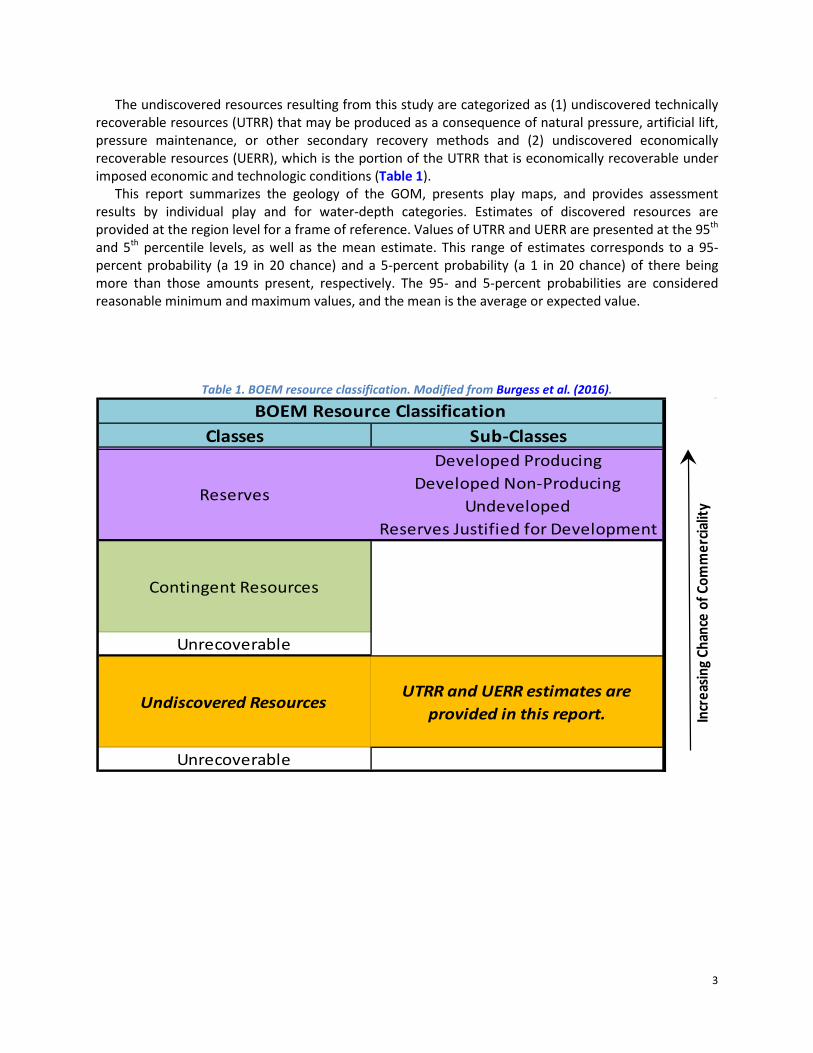
The undiscovered resources resulting from this study are categorized as (1) undiscovered technically recoverable resources (UTRR) that may be produced as a consequence of natural pressure, artificial lift, pressure maintenance, or other secondary recovery methods and (2) undiscovered economically recoverable resources (UERR), which is the portion of the UTRR that is economically recoverable under imposed economic and technologic conditions (Table 1).
This report summarizes the geology of the GOM, presents play maps, and provides assessment results by individual play and for water-depth categories. Estimates of discovered resources are provided at the region level for a frame of reference. Values of UTRR and UERR are presented at the 95th and 5th percentile levels, as well as the mean estimate. This range of estimates corresponds to a 95-percent probability (a 19 in 20 chance) and a 5-percent probability (a 1 in 20 chance) of there being more than those amounts present, respectively. The 95- and 5-percent probabilities are considered reasonable minimum and maximum values, and the mean is the average or expected value.
Table 1. BOEM resource classification. Modified from Burgess et al. (2016).
Classes Sub-ClassesDeveloped Producing
Developed Non-ProducingUndeveloped
Reserves Justified for Development
Contingent Resources
Unrecoverable
Undiscovered ResourcesUTRR and UERR estimates are
provided in this report.
Unrecoverable
BOEM Resource Classification
In
crea
sing C
hanc
e of
Com
mer
cialit
yReserves
4
CENOZOIC GULF OF MEXICO
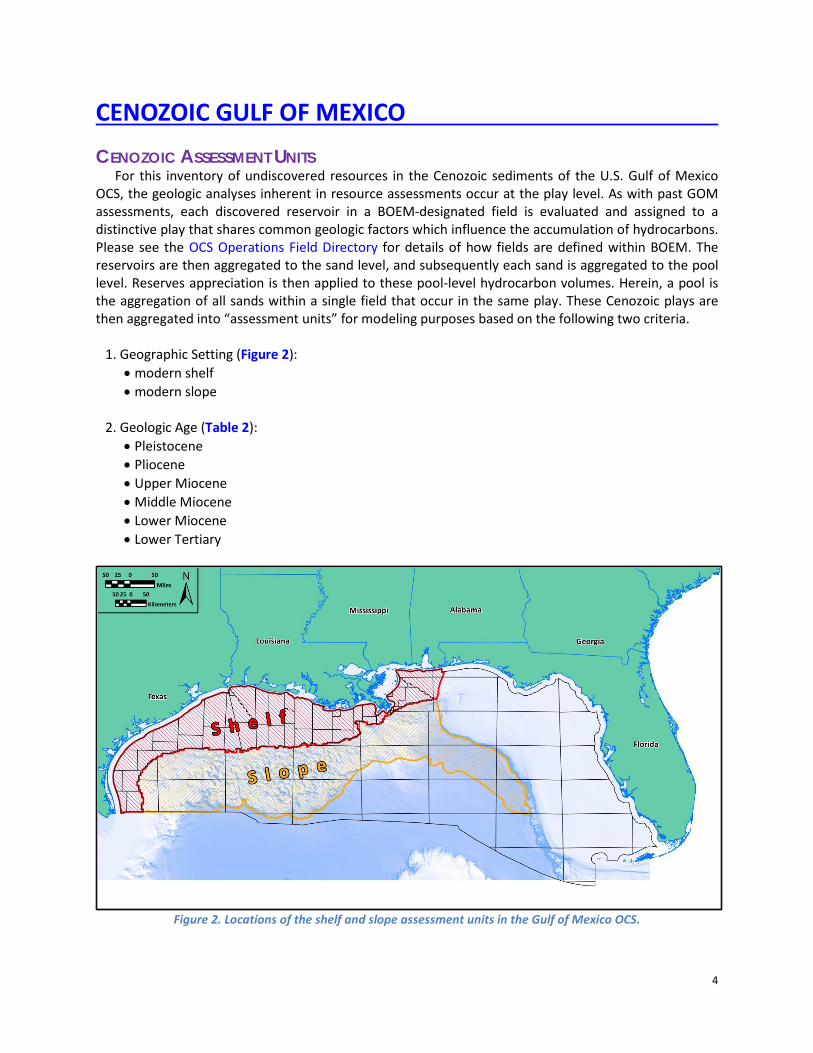
CENOZOIC ASSESSMENT UNITS For this inventory of undiscovered resources in the Cenozoic sediments of the U.S. Gulf of Mexico
OCS, the geologic analyses inherent in resource assessments occur at the play level. As with past GOM assessments, each discovered reservoir in a BOEM-designated field is evaluated and assigned to a distinctive play that shares common geologic factors which influence the accumulation of hydrocarbons. Please see the OCS Operations Field Directory for details of how fields are defined within BOEM. The reservoirs are then aggregated to the sand level, and subsequently each sand is aggregated to the pool level. Reserves appreciation is then applied to these pool-level hydrocarbon volumes. Herein, a pool is the aggregation of all sands within a single field that occur in the same play. These Cenozoic plays are then aggregated into “assessment units” for modeling purposes based on the following two criteria. 1. Geographic Setting (Figure 2):
• modern shelf • modern slope
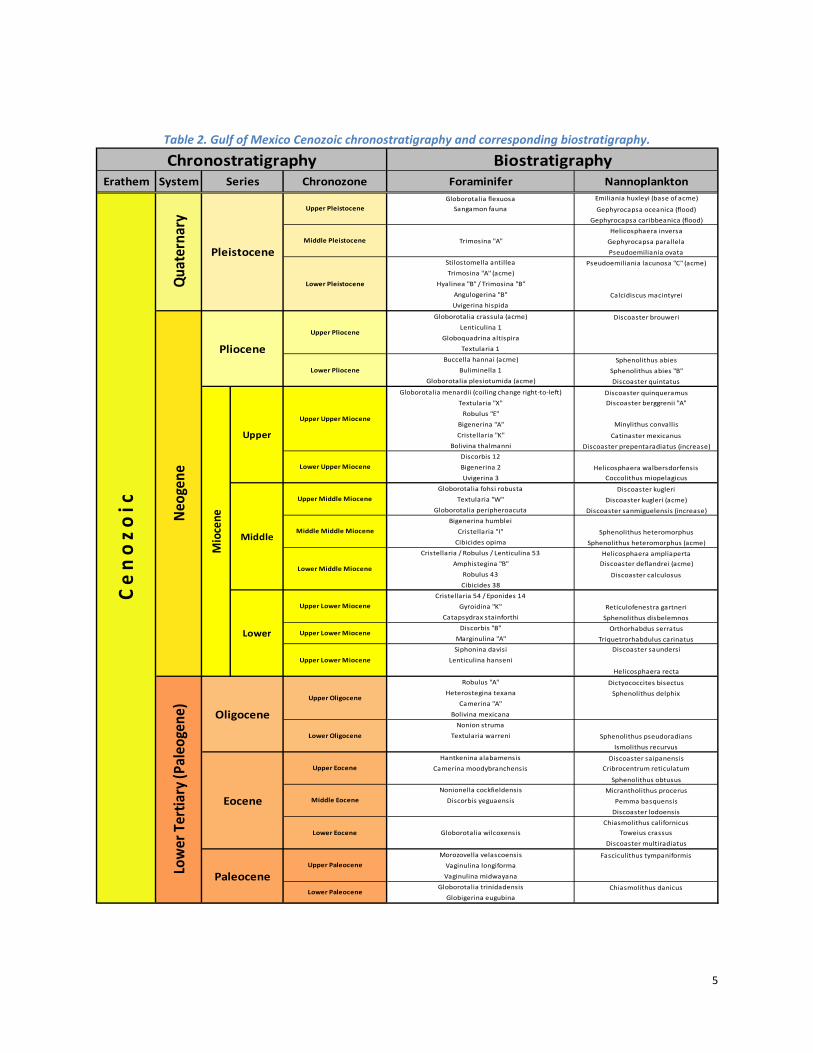
2. Geologic Age (Table 2):
• Pleistocene • Pliocene • Upper Miocene • Middle Miocene • Lower Miocene • Lower Tertiary
Figure 2. Locations of the shelf and slope assessment units in the Gulf of Mexico OCS.
5
Table 2. Gulf of Mexico Cenozoic chronostratigraphy and corresponding biostratigraphy.
Globorotalia flexuosa Emiliania huxleyi (base of acme)Sangamon fauna Gephyrocapsa oceanica (flood)
Gephyrocapsa caribbeanica (flood)Helicosphaera inversa
Trimosina "A" Gephyrocapsa parallelaPseudoemiliania ovata
Stilostomella antillea Pseudoemiliania lacunosa "C" (acme)Trimosina "A" (acme)
Hyalinea "B" / Trimosina "B"Angulogerina "B" Calcidiscus macintyreiUvigerina hispida
Globorotalia crassula (acme) Discoaster brouweriLenticulina 1
Globoquadrina altispiraTextularia 1
Buccella hannai (acme) Sphenolithus abiesBuliminella 1 Sphenolithus abies "B"
Globorotalia plesiotumida (acme) Discoaster quintatusGloborotalia menardii (coiling change right-to-left) Discoaster quinqueramus
Textularia "X" Discoaster berggrenii "A"Robulus "E"
Bigenerina "A" Minylithus convallisCristellaria "K" Catinaster mexicanus
Bolivina thalmanni Discoaster prepentaradiatus (increase)Discorbis 12Bigenerina 2 Helicosphaera walbersdorfensisUvigerina 3 Coccolithus miopelagicus
Globorotalia fohsi robusta Discoaster kugleriTextularia "W" Discoaster kugleri (acme)
Globorotalia peripheroacuta Discoaster sanmiguelensis (increase)Bigenerina humblei
Cristellaria "I" Sphenolithus heteromorphusCibicides opima Sphenolithus heteromorphus (acme)
Cristellaria / Robulus / Lenticulina 53 Helicosphaera ampliapertaAmphistegina "B" Discoaster deflandrei (acme)
Robulus 43 Discoaster calculosusCibicides 38
Cristellaria 54 / Eponides 14Gyroidina "K" Reticulofenestra gartneri
Catapsydrax stainforthi Sphenolithus disbelemnosDiscorbis "B" Orthorhabdus serratus
Marginulina "A" Triquetrorhabdulus carinatusSiphonina davisi Discoaster saundersi
Lenticulina hanseni
Helicosphaera rectaRobulus "A" Dictyococcites bisectus
Heterostegina texana Sphenolithus delphixCamerina "A"
Bolivina mexicanaNonion struma
Textularia warreni Sphenolithus pseudoradiansIsmolithus recurvus
Hantkenina alabamensis Discoaster saipanensisCamerina moodybranchensis Cribrocentrum reticulatum
Sphenolithus obtususNonionella cockfieldensis Micrantholithus procerus
Discorbis yeguaensis Pemma basquensisDiscoaster lodoensis
Chiasmolithus californicusGloborotalia wilcoxensis Toweius crassus
Discoaster multiradiatus
Morozovella velascoensis Fasciculithus tympaniformisVaginulina longiformaVaginulina midwayana
Globorotalia trinidadensis Chiasmolithus danicusGlobigerina eugubina
C e
n o
z o i
c
Quat
erna
ryNe
ogen
eLo
wer
Ter
tiary
(Pal
eoge
ne)
Middle Middle Miocene
Oligocene
Upper Lower Miocene
Upper Lower Miocene
Upper Oligocene
Lower Oligocene
Lower Middle Miocene
Upper Lower Miocene
Paleocene
Upper Eocene
Middle Eocene
Lower Eocene
Eocene
Upper Paleocene
Lower Paleocene
Pliocene
Upper Upper Miocene
Lower Upper Miocene
Upper Middle Miocene
Pleistocene
Mio
cene
Upper
Middle
Lower
Upper Pleistocene
Middle Pleistocene
Lower Pleistocene
Upper Pliocene
Lower Pliocene
Chronostratigraphy BiostratigraphyChronozoneSeriesErathem System Foraminifer Nannoplankton
6
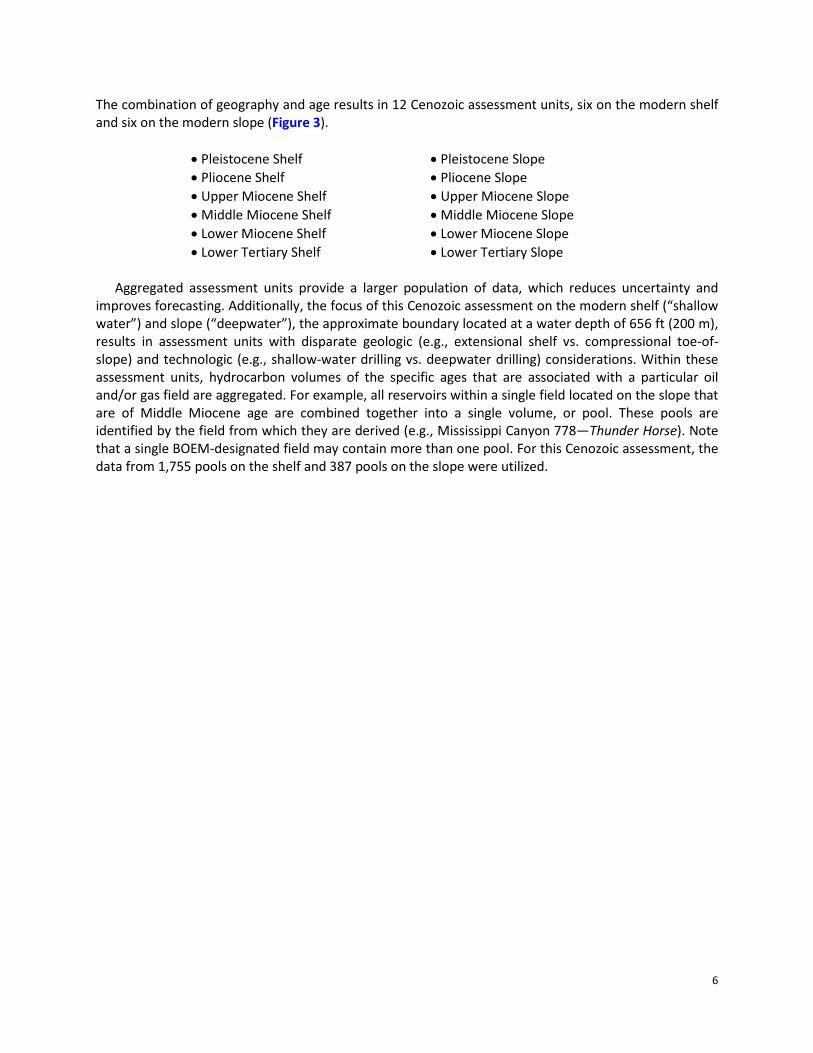
The combination of geography and age results in 12 Cenozoic assessment units, six on the modern shelf and six on the modern slope (Figure 3).
• Pleistocene Shelf • Pliocene Shelf • Upper Miocene Shelf • Middle Miocene Shelf • Lower Miocene Shelf • Lower Tertiary Shelf
• Pleistocene Slope • Pliocene Slope • Upper Miocene Slope • Middle Miocene Slope • Lower Miocene Slope • Lower Tertiary Slope
Aggregated assessment units provide a larger population of data, which reduces uncertainty and
improves forecasting. Additionally, the focus of this Cenozoic assessment on the modern shelf (“shallow water”) and slope (“deepwater”), the approximate boundary located at a water depth of 656 ft (200 m), results in assessment units with disparate geologic (e.g., extensional shelf vs. compressional toe-of-slope) and technologic (e.g., shallow-water drilling vs. deepwater drilling) considerations. Within these assessment units, hydrocarbon volumes of the specific ages that are associated with a particular oil and/or gas field are aggregated. For example, all reservoirs within a single field located on the slope that are of Middle Miocene age are combined together into a single volume, or pool. These pools are identified by the field from which they are derived (e.g., Mississippi Canyon 778—Thunder Horse). Note that a single BOEM-designated field may contain more than one pool. For this Cenozoic assessment, the data from 1,755 pools on the shelf and 387 pools on the slope were utilized.
#*
#*
#* #*
#* #*
#*
#*
#*
#*
#*
#*
#*#*#*#*
#*
#*
#*
#*
#*
#*#*
!(
!(
!(
#*
#*
#*
#*#*
#*
#*#*
#*
!(!(
!(
!(
!(!(
!(
!(
!(
!(!(
!(!(!(
!(
!(
!(
!(!(!(
!(
!(!(
!(!(
!(!(
!(
!(
!(
!(
!(
!(
!(
!( !(
!(
!(
!(
!(
!(
!(!(!(
!(
!(
!(
!(!(
!(
!(
!(
!(!(
!(
!(
!(!(
!(
!(
!(
!(
!(
!(
!(!(
!(!(
!(
!(
!(
!(
!(
!(
!(
!(!(
!(!(
!(!(
!(
!(
!(
!(
!(
!(
!(
!(
!(
!(
!( !(
!(
!(
!(
!(
!(!( !(
!(
!(
!(
!(
!(
!(!(
!(
!(
!(
!(
!(
!(!(!(
!(
!(
!(
!(
!( !(
!( !( !( !(!(
!(!(
!(
!(
!(
!(
!(
!(
!(
!(
!(!( !(
!(
!(
!(
!(!(
!(
!(
!(
!(!(
!(!(
!(!(!(
!(
!(!(!(
#*
#*#*#*
#*
#*
#*
#*
#*
#*
#*
#*#*
#*
#*
#*
#*
#*
#*
#*
#*
#*
#*
#*
#*
#*
#*
#*
#*
#*#*
#*
#*#*
#*
#*
#*#*
#*
#*
#*
#*#*
#*#*
#*#*
#*
#*
#*
#*
#*
#*
#*#*
#*
#*
#*
#*
#*
#*#*
#*
#*#* #*
#*#*
#*#*#*#*
!(
!(
!(
!(
!(
!(
!(
!(
!(
!(
!(
!(
!(
!(
!(
!(
!(
!(
!(
!(
!(!(
!(
!(
!(
!(
!(
!(
!(
!(
!(
!(
!(
!(
!(
!(
!(
!(
!(
!(
!(
!(!(
!(
!( !(
!(!(!(!(
!(
!(!(
!(
!(
!(
!(!(
!(!(
!(
!(!(
!(
!(
!(
!(
!(
!(
!(
!(
!(
!(
!(!(
!(
!(
!(
!(
!(
!(
!(!(!(
!(
!(
!(
!(
!(!(
!(!(!(!(
!(
!(!(
!(
!(
!(
!(
!(
!(
!(
!(
!(
!(
!( !(
!(
!(!(
!(
!(
!(!(
!(
!(!(
!(
!(
!(
!(
!(
!(
!(!(
!(
!(
!( !(
!(
!(
!(
!(
!(
!(
!(
!(!(
!(
!(
!(
!(
!(
!(
!(
!(
!(
!(
!(
!(
!(!(
!(
!(
!(
!(
!(
!(
!(
!(
!(
!(
!(
!(
!(
!(
!(
!( !(
!(!(
!(
!(
!(
!(
!(
!(!(
!(
!(
!(!(
!(
!(
!(
!(
!(
!(
!(
!(
!(
!( !(
!(
!(
!(
!(
!(
!(
!(!(
!(
!(
!(
!(
!(
!(!(
!(
!(
!(
!(
!(
!(
!(!(!(
!(
!(!(
!(
!(
!(
!(!(
!(!(!(
!(
!(
!(!(
!(
!(!(!(
!(
!(!(
!(
!(
!( !(
#*
#*
#*
#*
#*
#*
#*
#*
#*
#*#*
#*
#*
#*
#*
#*
#*
#*
#*
#*
#*
#*
#*
#*
#*
#*
#*
#*#*#*#*
#*
#*
#* #*#*
#*
#*
#*
#*
#*#*
#*
#*
#* #*
#*
#*
#*
#*
#*
#*#*
#*
#*#*#*
#*
#*#*
#*
#*
#*
#*#*#*
#* #*
#*
#*
#*
#*
#*
#*
#*#*#*
#*
#*
#*
#*
#*#*
#*#*
#*
!(
!(
!(
!(
!(!(
!(
!(!(!(
!(
!(!(!(
!(
!(
!(!(
!(
!(!(
!(
!(
!(
!(
!(
!(
!( !(
!(
!(
!(
!(
!( !(
!(
!(
!(
!(
!(
!(
!(
!(
!(
!(
!(
!(
!(!(
!(
!(
!(
!(
!(
!(
!( !(!(
!(
!(
!(
!(
!(
!(!(
!(
!(
!(!(
!(!(
!(
!(
!(
!(
!(
!( !(
!(
!(
!(
!(
!(
!(
!(!( !(!(
!(
!(
!(
!(!(
!(
!(
!(
!(!(
!(
!(
!(!(
!(
!(!(
!(
!(
!(
!(!(
!(
!(
!(
!(
!(
!(!(
!(
!(
!(
!(
!(
!(
!(
!(
!(!(
!(!(
!(
!(
!(!(
!(
!(!(!(!(
!(!(
!(
!(!(
!(!(
!(
!(
!(
!(
!(!(
!(
!(
!(
!(
!(
!(!( !(
!(
!(
!(
!(
!(
!(
!(!(
!(
!(!(
!(!(
!(!(
!( !(!(
!(
!(
!(
!(!(!(
!(!(
!(!(!(!(!(
!(
!(
!(
!(
!(
!(!(
!(!(!(
!(
!(
!(
!(
!(!(
!(
!(!(
!( !(
!(
!(
!(
!(
!(
!(
!(
!(!(
!(
!(
!(
!(
!(
!(
!(
!(!(
!(!(
!(!(!(!(!(
!(!(
!(!(
!(!(
!(
!(!(
!(
!(
!(
!(!(
!(
!( !(
!(
!(
!(
!(!(
!(
!(
!(
!(
!(
!(
!(
!(
!(
!(
!(
!(
!(
!(
!(
!(!(
!(
!(
!(
!(
!(
!(
!(
!(
!(
!( !(
!(
!(
!(
!(
!(
!(!(!(!(
!(
!(
!( !(
!(
!(!(
!(
!(
!(!(!(
!(
!(
!(!(
!(!(!(
!(!(
!(
!(
!(!(
!(!(
!(
!( !(
!(!(
!(!(
!(
!(
!(!( !( !(
!(
!(
!(
!(
!(
!(
!(
!(
!(
!(!(
!(
!(!(
!(
!(
!(
!(
!(
!(
!( !(!(
!(
!(
!(
!(
!( !(!(
!(
!(
!(!(
!(
!(
!(
!(!(
!(!(!(
!(!(
!(
!(
!(
!(
!(
!(
!(
!(
!( !(
!(
!(
!(
!(
!(
!(
!(!(
!(!(
!(
!(
!(
!(
!(!(
!(!(
!(
!(!(
!(
!(
!(
!(
!(
!(
!(
!(
!(
!(
!( !(
!(
!(
!(
!(
!(
!(
!(
!(
!(
!(
!(
!(!( !(
!(
!(
!(
!( !(!(
!(!(
!(
!(
!(
!(
!( !(
!(
!(
!(
!(
!(
!(!(
!(
!(
!(
!(!(
!(
!( !(
!(
!( !(
!(
!(
#*
#*
#*
#*
#*
#*
#*
#*
#*
#*#*#*
#*
#*
#*#*#*
#*
#*
#*
#* #*
#*
#*
#*#*
#*
#*
#*
#* #*#*
#*#*#*#*
#*
#*#*
#*
#*
#*#*
#*#*
#*#*
#*
#*
#*
#*
#*#*
#*#*
#*
#*
#*
#*
#*#*
#*
#*
#*
#*
#*
#*
#*
#*
#*
#*
#*
#* #*
#*#* #*
#*
#*
#*
#* #*
#*
#*
#*
#*
#*#* #* #*
#*
#*
#*#*
#*
#*
#*
#* #*
#*#*#*
#*
#*
#*
#*
#* #*#*#*
#*
#*
#*
#*
#*#*
#*
#*
#*#*#*
!(
!(
!(
!(
!(
!( !(
!(
!(
!(
!(
!(
!(
!(
!(
!(
!(
!(
!(
!(!(
!(
!(!( !(
!(
!(
!(!(
!(!(
!(
!(
!(
!(
!(
!(
!(
!(
!(
!(
!(
!(
!(
!( !(!( !(
!(
!(
!(
!(
!(
!(
!(
!(
!(!(
!(!(
!(
!(
!(!(
!(
!(
!(
!(
!(
!(
!(
!(
!(!(
!(
!(
!(
!(
!(
!(
!(
!(
!(
!(
!(
!(
!(
!(!(
!(
!(
!(
!(
!(
!(
!(
!(!(
!(
!(
!(
!(
!(!(
!(
!(
!(
!(
!(
!(
!(
!(
!(!(
!(
!(
!(
!(
!(
!(
!(!(
!(
!(
!(
!(
!(
!(
!(
!(!(
!(
!(
!(
!(
!(
!(
!(
!(
!(
!(!(
!(
!(
!(
!(!(
!(
!(
!(
!(
!(
!(
!(
!(!(!(
!(!(
!(!(
!(
!( !(!(
!(
!(
!(!(
!(
!(
!( !(
!(
!(!(
!(!(
!( !(
!(
!(
!(
!(
!(
!(
!(!(
!(
!(!(
!(
!(
!(!(
!(
!(
!(!(
!(
!(
!(
!(
!(
!(
!(
!(
!(
!(!(
!(
!(!(
!(!(!(
!(!(
!(
!(
!(
!(
!(
!(
!(
!(
!(
!(
!(
!(
!(
!(
!(
!( !(
!(
!(
!(
!(
!(
!(
!(
!(
!(
!(
!(
!(
!(
!(
!(
!(
!(
!(
!(
!(
!(
!(
!(
!( !(
!(
!(
!(
!(
!(
!(
!(
!(
!( !(
!(!(
!(
!(
!(
!(
!(
!(
!(!(
!(
!(
!( !(
!(
!(!(
!(
!(
!(
!(
!(
!(!(
!(
!(!(!(
!(
!(!(
!(
!(
!(
!(
!(!(
!(!(
!(
!(
!(!(
!(
!(
!(!( !(
!(
!(!(
!(
!(
!(!(
!(
!(!(
!(
!(
!(
!(
!(
!(
!(!( !(
!(
!(
!(
!(
!(
!(
!(
!(!(
!(
!(
!(
!(
!(
!(
!(
!(!(
!(
!(
!(!(
!(
!(
!(!(
!(!(
!(
!(
!(
!(!(!( !(
!(
!(
!(
!(
!(
!(
!(
!(!(
!(!(
!(
!( !(!(
!(
!(
!(
!(
!(
!(
!(
!(
!(
!(
!(
!(
!(
!(!(
!(!(
!(
!(
!(
!(
!(!(
!(!(
!(
!(
!(
!(
!(
!(
!(
!(
!(
!(
!(
!(!(
!(
!(
!(
!(
!(!(
!(
!(!(
!(!(
!(
!( !(
!(!(
!(!(!(
!(
!(!(!(
!(
!(
!(
!(!(!(
!(!(
!(!(
!(
!(!(
!(
!(
!(!(
!(!(
!(
!(
!(
!(
!(
!(
!(!(
!(
!(
!(!(
!(
!(!(
!( !(
!(
!(
!(
!(!(
!( !(!( !(
!(
!(
!(
!(
!(
!(
!(!(
!(
!(
!(!(
!(
#*#*
#*
#*#*#*
#*#* #*
#*
#* #*#*
#*
#*
#*
#*#*#*#*
#*
#*
#*
#*
#*
#*
#*
#*
#*
#*
#*
#*
#*#*#*
#*#*
#*
#*#*
#*#*
#*
#*#* #* #*
#*#*#* #*#*
#*
#*#*
#*#*
#*
#* #*#* #*
#* #*
#* #*#* #*#*
#*#* #*
#*
#*
#*
#*!(
!(
!(
!(
!(
!(!(
!(
!(!(
!(
!(!(
!(
!(
!(
!(
!(
!(
!(!(
!(!(
!(
!(!(!(
!(
!( !(
!(
!(!(
!(
!(
!(
!(
!(
!(!(
!(
!(
!(!( !(
!(
!(
!(
!(
!(
!(!(
!(!(
!(
!(
!(
!(!(
!(
!(!(
!(
!(
!(
!(
!(
!(
!(
!(
!(
!(!(
!(!(
!(
!(
!(
!(
!(
!(
!(
!(
!(
!(
!(
!(!(
!(
!(
!(!(
!(
!(
!(!(
!(
!(!(
!(!(
!(
!(
!(
!(
!(
!(
!(!( !(
!(!(
!( !(
!(
!(
!(
!(
!(
!(
!(
!(
!(
!(!(
!(
!(
!(
!(!(
!(
!(
!(
!(
!(
!(!(
!(
!(
!(
!(
!(
!(
!(
!(!(
!(
!(!(
!(
!(
!(
!(
!(
!(
!(
!(
!(
!(!(
!(
!(
!(
!(!(
!(
!(
!(
!(
!(
!(
!(
!(!(
!(
!(!(
!( !(
!(!(
!(
!(
!( !(
!(!(
!(
!(
!(
!(
!(
!(
!(
!(
!(
!(
!(
!(!(
!(
!(
!(
!(
!(
!(!(
!(
!(!(
!(
!(
!(!( !(
!(
!(
!(
!(
!(
!(
!(
!( !(
!(!(!(
!(
!(
!(
!(
!(
!(
!(
!( !(!(
!(
!(
!( !(
!( !(!(!(
!(
!( !(!( !(
!(!(
!(
!(!(
!(!(
!(
!(!(
!(
!(!(
!(!(!(
!(!(!(!( !(
!(
!(
!(
!(!(!( !(
!(!(
!(
!(
!(
!(!(
!(
!(
!(
!(!(
!(
!(
!(
!(
!(
!(!(
!(
!(!(
!(
!(
!(!(!(
!( !(
!(
!(
!(
!(
!(!(
!(
!(
!(
!(
!(!(
!(!(
!(
!(!(
!(
!(
!(
!(!(
!(!(
!(
!(
!(
!(
!(
!(!(
!(
!(
!(
!(
!(
!(
!( !(
!( !(
!(!( !(
!(
!(!(
!(!(
!(!(
!(
!(
!(
!(!(
!(!( !(
!(
!(
!(
!(!(
!(
!(
!( Pleistocene Shelf#* Pleistocene Slope!( Pliocene Shelf#* Pliocene Slope!( Upper Miocene Shelf#* Upper Miocene Slope
!( Middle Miocene Shelf#* Middle Miocene Slope!( Lower Miocene Shelf#* Lower Miocene Slope!( Lower Tertiary Shelf#* Lower Tertiary Slope
±50 0 5025
Miles50 0 5025
Kilometers
Figure 3. Geographic distribution of assessed Cenozoic pools by assessment unit. The pools can be toggled on or off in the layers navigation pane.
7
8
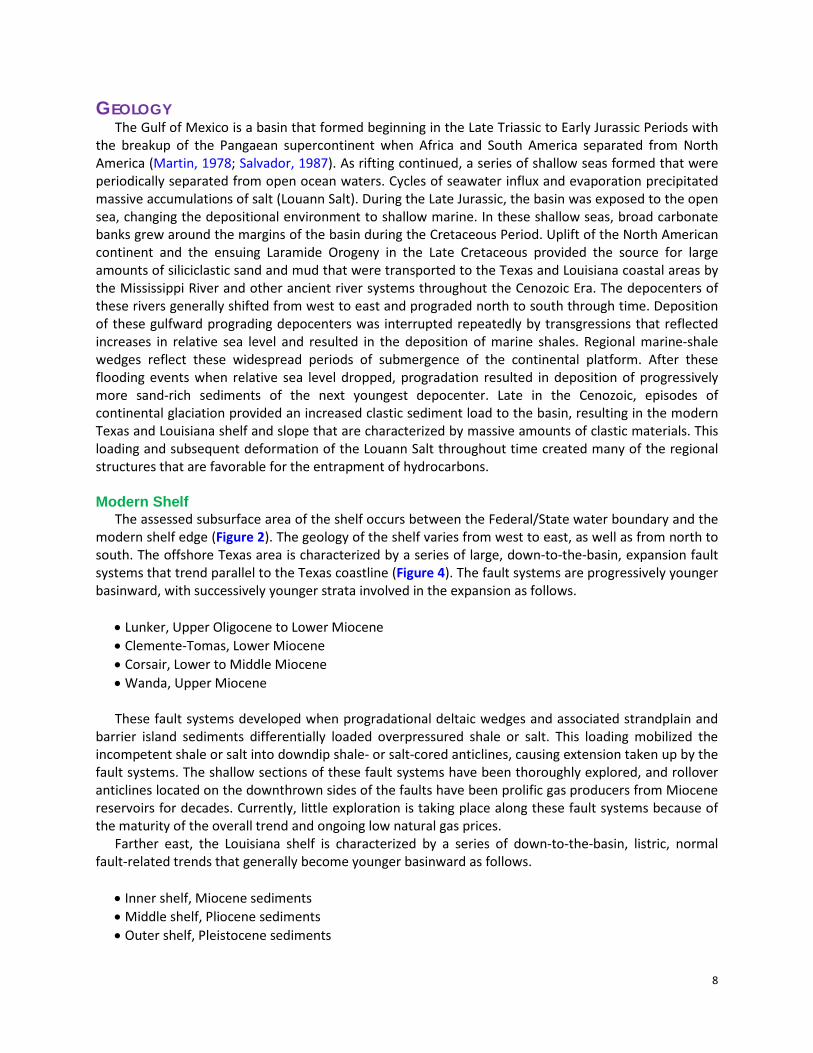
GEOLOGY The Gulf of Mexico is a basin that formed beginning in the Late Triassic to Early Jurassic Periods with
the breakup of the Pangaean supercontinent when Africa and South America separated from North America (Martin, 1978; Salvador, 1987). As rifting continued, a series of shallow seas formed that were periodically separated from open ocean waters. Cycles of seawater influx and evaporation precipitated massive accumulations of salt (Louann Salt). During the Late Jurassic, the basin was exposed to the open sea, changing the depositional environment to shallow marine. In these shallow seas, broad carbonate banks grew around the margins of the basin during the Cretaceous Period. Uplift of the North American continent and the ensuing Laramide Orogeny in the Late Cretaceous provided the source for large amounts of siliciclastic sand and mud that were transported to the Texas and Louisiana coastal areas by the Mississippi River and other ancient river systems throughout the Cenozoic Era. The depocenters of these rivers generally shifted from west to east and prograded north to south through time. Deposition of these gulfward prograding depocenters was interrupted repeatedly by transgressions that reflected increases in relative sea level and resulted in the deposition of marine shales. Regional marine-shale wedges reflect these widespread periods of submergence of the continental platform. After these flooding events when relative sea level dropped, progradation resulted in deposition of progressively more sand-rich sediments of the next youngest depocenter. Late in the Cenozoic, episodes of continental glaciation provided an increased clastic sediment load to the basin, resulting in the modern Texas and Louisiana shelf and slope that are characterized by massive amounts of clastic materials. This loading and subsequent deformation of the Louann Salt throughout time created many of the regional structures that are favorable for the entrapment of hydrocarbons.
Modern Shelf
The assessed subsurface area of the shelf occurs between the Federal/State water boundary and the modern shelf edge (Figure 2). The geology of the shelf varies from west to east, as well as from north to south. The offshore Texas area is characterized by a series of large, down-to-the-basin, expansion fault systems that trend parallel to the Texas coastline (Figure 4). The fault systems are progressively younger basinward, with successively younger strata involved in the expansion as follows.
• Lunker, Upper Oligocene to Lower Miocene • Clemente-Tomas, Lower Miocene • Corsair, Lower to Middle Miocene • Wanda, Upper Miocene These fault systems developed when progradational deltaic wedges and associated strandplain and
barrier island sediments differentially loaded overpressured shale or salt. This loading mobilized the incompetent shale or salt into downdip shale- or salt-cored anticlines, causing extension taken up by the fault systems. The shallow sections of these fault systems have been thoroughly explored, and rollover anticlines located on the downthrown sides of the faults have been prolific gas producers from Miocene reservoirs for decades. Currently, little exploration is taking place along these fault systems because of the maturity of the overall trend and ongoing low natural gas prices.
Farther east, the Louisiana shelf is characterized by a series of down-to-the-basin, listric, normal fault-related trends that generally become younger basinward as follows.
• Inner shelf, Miocene sediments • Middle shelf, Pliocene sediments • Outer shelf, Pleistocene sediments
9
The complexity and abundance of salt structures generally increase to the south and include diapirs, salt stock canopies, welds, autochthonous salt ridges and anticlines, and associated counter-regional faults. Near the modern shelf edge are significant tabular salt bodies that form the Sigsbee Escarpment (Figure 4).
The shallow sections of the Louisiana, Mississippi, and Alabama shelf have been extensively explored, with reservoir sands trapped by stratigraphy, faulted anticlines, normal faults, and salt bodies producing gas and oil for decades, dating back to 1947. As with offshore Texas, little exploration activity for natural gas is currently taking place because of low prices; however, oil prospects continue to draw interest in and around existing oil fields and deeper in the Miocene section.
Examples of reservoir sand depositional environments of the modern shelf include (1) fluvial environments such as channels and point bars; (2) lower delta plain environments such as distributary channels, distributary-mouth bars, and bays; and (3) deep-sea fan environments such as channels, channel levees and overbank, and lobes.
Figure 4. Generalized physiographic map of the Gulf of Mexico area. Salt distribution after Muehlberger (1992),
Simmons (1992), and Lopez (1995).
Modern Slope The assessed area of the slope occurs between the modern shelf edge and the (1) Sigsbee
Escarpment, (2) large compressional structures in front of the Sigsbee Escarpment, or (3) depositional limit of Louann Salt (Figure 2 and Figure 4). The Sigsbee Escarpment is the southernmost extent of where large salt bodies override the abyssal plain. The slope contains a wide variety of salt-tectonic features. Very generally, the slope is characterized by displaced salt sheets (allochthons), with a gradual transition from small, isolated salt bodies (e.g., stocks, tongues, walls) in the upper slope to large, contiguous salt canopies in the lower slope (Figure 4). Basically, as a result of load-induced evacuation, flowing Jurassic Louann Salt has climbed the Mesozoic and Cenozoic stratigraphy as allochthonous tiers and glaciers in a prograding extensional setting with a compressional toe-of-slope.
10
As previously stated, during the early geologic history of the GOM, the Louann Salt was deposited within Jurassic rift basins. The salt was thickest in the grabens and thin or absent over the horst blocks. The salt was subsequently covered by overburden, causing a loading effect. The Louann Salt reacted by flowing to form pillows within the grabens. As deposition continued, the mobilized salt flowed out of the grabens onto the neighboring horst blocks, primarily in a southerly direction away from the source of sedimentation. Over time the salt remained at a consistent isostatic level by rising through the overburden often along reverse or thrust faults. As the salt withdrew from the grabens, topographic lows formed on the seafloor providing a focus for additional sediment deposition. With time, these topographic lows became salt-withdrawal basins (“minibasins”) accumulating very thick sections of younger sediments. Some of the larger discoveries in the GOM, such as Mars-Ursa (Mississippi Canyon 807) and Auger (Garden Banks 426) , are along the flanks of such minibasins. Where the salt was entirely evacuated from its source, the synclinal flanks of the minibasins collapsed leaving an inverted sediment pile anticline, or “turtle” structure. Such a turtle structure yielded Thunder Horse (Mississippi Canyon 778), one of the largest discoveries in the GOM.
In places, actively inflating salt extruded through to the seafloor and flowed laterally as a salt glacier (Fletcher et al., 1995). As salt extrusion continued, the salt glacier flowed up and across newly deposited sediment, meaning that as it moved away from its feeder, the salt climbed over progressively younger sediment. In fact, a single allochthon can become multiple tiers ascending into higher stratigraphic levels. Eventually, the allochthon became completely isolated from its feeder and could continue flowing only by withdrawing salt from its trailing edge (Fletcher et al., 1995; Schuster, 1995). Two end member structural systems have been recognized when allochthons are loaded and evacuated (Schuster, 1995). If the salt is not completely withdrawn from its trailing edge, smaller residual salt bodies are left behind. These fault-segmented bodies, or “roho” systems, are characterized by major, listric, down-to-the-basin growth faults that sole into the horizontal salt weld left by the evacuating salt. If the salt is completely withdrawn from its trailing edge, a stepped counter-regional system results. Strata above the deflating salt subside to form a landward-dipping, shallow flat step. The step resembles a growth fault, but the step is not a true fault over most of its length and actually is the salt weld left by the evacuating salt.
The entire process of salt evacuation, minibasin formation, and allochthon emplacement can repeat through time. In fact, an extensive paleo-salt canopy covered much of the shelf and slope during the Upper Miocene. Subsequently, renewed sediment loading during the Pliocene and Pleistocene created even younger minibasins where this paleo-canopy was located, squeezing the salt upward along a new series of counter-regional faults to form the modern Sigsbee Salt Canopy.
In the southern portion of the slope, several fold and thrust belts are present, including the well-known Perdido Fold Belt and Mississippi Fan Fold Belt (Figure 4 and Figure 6). These fold belts contain classic thrust-related structural features such as large folds, thrust-fault anticlines, duplexes, and imbricate faults, and represent the downslope part of a linked system in which upslope extension results in downdip compression (Rowan et al., 2000). In the upslope part of the system, differential loading from sediment progradation causes extension. Gravity gliding and/or spreading above a salt detachment translates into the contraction that results in the downslope fold belt. Many of the structures associated with the fold belts contain large discoveries. Among these are Miocene discoveries in Atlantis (Green Canyon 743) and Green Canyon 826 (Mad Dog) and Lower Tertiary discoveries in Walker Ridge 678 (St. Malo) and Great White (Alaminos Canyon 857).
Exploration plays on the slope include Miocene and older objectives in subsalt structures associated with large compressional folds, turtle structures, and the younger Pliocene and Pleistocene minibasins situated above and between tabular salt bodies. In the southern portions of Keathley Canyon and Walker Ridge, the modern salt canopy may override Pliocene and Pleistocene sands to form subsalt
11
reservoirs. Reservoir sands of the modern slope were deposited as deep-sea fans in channels, channel-levee complexes, and sheet-sand lobes.
In the southeastern extension of the slope assessment unit area (Figure 2) along the Florida Escarpment (Figure 4), salt structure growth may occur throughout the Upper Jurassic through Pleistocene stratigraphic section. Norphlet aeolian dunes define the Mesozoic portion of the play. In the Cenozoic portion of the play, deep-sea fans may occur in hydrocarbon traps consisting of high-relief, autochthonous (in place) salt swells and vertical welds/pinnacle salt structures. These structures formed when updip extension and associated gravity gliding continued into the Cenozoic, and adequate salt volumes existed to provide salt to core them.
12
MESOZOIC GULF OF MEXICO
MESOZOIC PLAYS Unlike the aggregated assessment units of the Cenozoic sediments, for this inventory of
undiscovered resources in the Mesozoic sediments of the U.S. Gulf of Mexico OCS, most Mesozoic sediments were differentiated by specific rock units or plays. Specifically, Mesozoic sediments were divided into 19 plays, 15 of which were assessed in this study. The four non-assessed plays were either early-stage concepts or deemed to contribute insignificant volumes of resources to the GOM Basin. As of this study’s cutoff date, there were only three established Mesozoic plays (Andrew, James, and Norphlet), with a combined total of 32 pools. The assessment of the remaining 12 plays with no discoveries in OCS waters heavily relied upon analog data from onshore Gulf Coast plays for modeling.
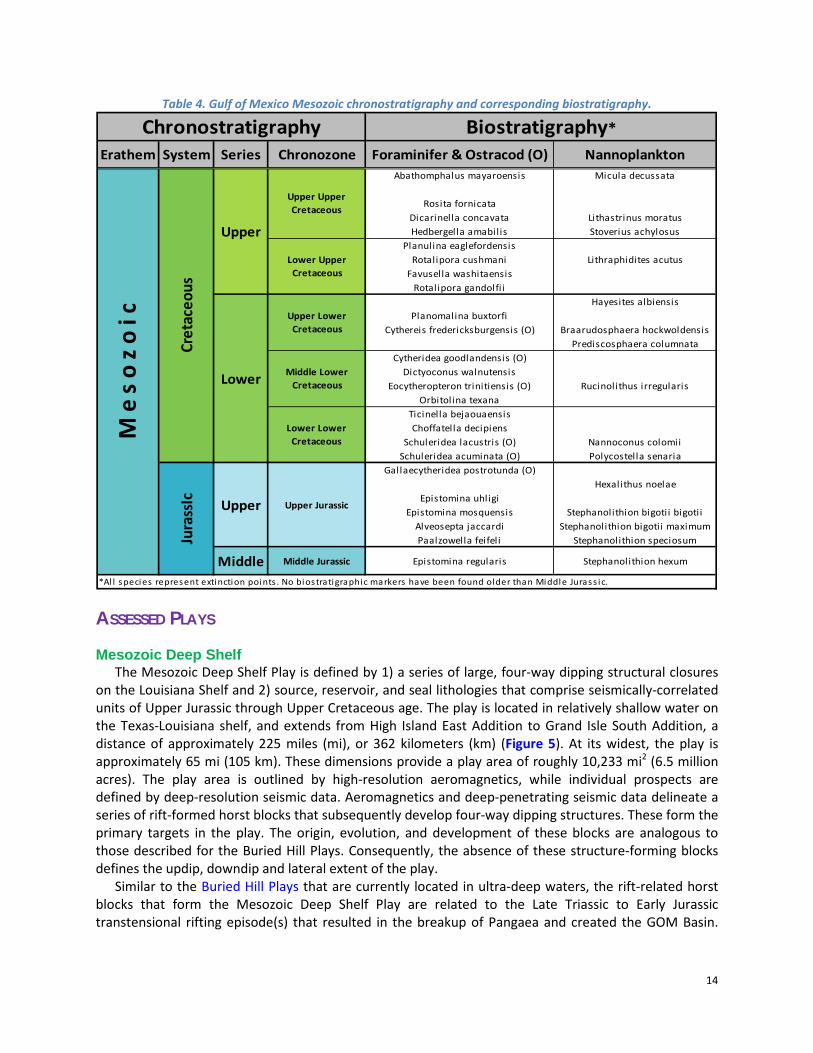
Table 3 illustrates generalized stratigraphy of Mesozoic rock groups and formations in the northeastern coastal region of the Gulf of Mexico and the South Florida Basin area of Florida. Rock units assessed in this report are highlighted. Rock unit positions between the two areas are approximations. Parts of the stratigraphic columns are modeled after onshore sections; rock units listed, therefore, may or may not be present throughout the entire northeastern GOM or Florida offshore. Detailed paleontological analyses provided the basis for the Mesozoic chronostratigraphic chart (Table 4). All species on the chart represent extinction points, and no biostratigraphic markers have been found older than Middle Jurassic in the GOM Basin.
GEOLOGY Mesozoic sediments (Table 3) initially formed during the Late Triassic to Early Jurassic rifting episode
that created the GOM Basin. This breakup event formed a series of northeast-southwest-trending rifts offset by northwest-southeast-trending transfer faults/zones. The Wiggins Arch and parts of the Sarasota Arch represent Paleozoic Era remnants left behind during the rifting stage (Figure 4). The rift grabens were active depocenters receiving lacustrine and alluvial deposits, resulting in the Eagle Mills Formation. During the Middle Jurassic, marine water sporadically entered the incipient GOM Basin, resulting in the deposition of thick evaporative deposits of the Werner Anhydrite and Louann Salt. Aeolian environments In the Late Jurassic resulted in the sand dunes of the Norphlet Formation, which were later capped by a widespread, marine-transgressive, organic-rich, carbonate mudstone (the Smackover Formation), which became a major hydrocarbon source rock for the GOM. A minor regression resulted in the evaporites and red beds of the Buckner Formation and the terrigenous clastics of the Haynesville Formation that overlie the Smackover Formation, completing the ancestral GOM Basin stratigraphic sequence. Contemporaneous with carbonate-evaporite depositional sequences (e.g., Bone Island and Pumpkin Bay Formations) south of the Sarasota Arch (Figure 4) were the first major influxes of terrigenous classic materials into the northern GOM, represented by the Late Jurassic to Early Cretaceous Cotton Valley Group and Hosston Formation. Subsequent repeated transgressions and regressions led to the deposition of high-energy siliciclastics (e.g., Paluxy, Dantzler, and Tuscaloosa Formations) and carbonates during the Cretaceous Period, which caused progradation of the shelf edge, where thick reef complexes developed (e.g., Sligo, James, Sunniland, and Andrew Limestones).
The individual play descriptions that follow pertain specifically to the offshore OCS waters of the GOM Basin. They are not meant to provide a comprehensive review of updip, onshore-equivalent plays.
13
Table 3. Rock units in the northeastern Gulf of Mexico and South Florida Basin. Rock units assessed for this report are highlighted. Modified from Faulkner and Applegate (1986), Gohrbandt (2002), Petty (2008), and
Dubiel et at. (2010).
Era Period Epoch Age
Campanian
Santonian
Bexar Shale Able Member
Upper James Limestone Twelve Mile Member/Brown Dolomite Zone
Lower James Limestone (Pine Island Shale) West Felda Shale Member
Barremian
Hauterivian
Berriasian
Triassic(basement)
(basement)
P a l e o z o I c
(unconformity)
Werner Formation
Wood River FormationBasement Clastics
Eagle Mills Formation
Cotton Valley Group
LateBuckner Formation
Smackover Formation
J u r
a s s
I c
Early
Middle
Stratigraphic UnitsNortheastern Gulf of Mexico South Florida Basin
Glades Group
Bone Island Formation
Upper
Tuscaloosa Marine Shale
Trinity Group
Pearsall Formation
Fredericksburg Group
Pine Key Formation
Atkinson Formation
(unconformity)
Lehigh Acres Formation
Ocean Reef Group
Big Cypress Group
Geochronologic Units
Aptian
Rattlesnake Hammock FormationLake Trafford Formation
Sunniland Formation
Punta Gorda Anhydrite
Corkscrew Swamp FormationRookery Bay Formation
Panther Camp FormationDollar Bay Formation
Gordon Pass FormationMarco Junction Formation
(unconformity)
Pumpkin Bay Formation
Lower
Turonian
Naples Bay Group
(unconformity)
Tuscaloosa Group
(unconformity)
Washita GroupDantzler Formation
Andrew Formation
Norphlet Formation
Louann Salt
Haynesville Formation
Valanginian
Callovian
C r e
t a
c e
o u
s
Sligo Formation
Cenomanian
ConiacianEutaw Formation
M e
s o
z o I
c
Kimmeridgian
Oxfordian
Paluxy Formation
Mooringsport FormationFerry Lake Anhydrite
Late
Maastrichtian
Late
Rodessa Formation
(unconformity)
Selma Group
Tithonian
Hosston Formation
Early
Albian
Clastics
Carbonates ("Knowles")
14
Table 4. Gulf of Mexico Mesozoic chronostratigraphy and corresponding biostratigraphy.
Abathomphalus mayaroensis Micula decussata
Rosita fornicataDicarinella concavata Lithastrinus moratusHedbergella amabilis Stoverius achylosus
Planulina eaglefordensisRotalipora cushmani Lithraphidites acutus
Favusella washitaensisRotalipora gandolfi i
Hayesites albiensisPlanomalina buxtorfi
Cythereis fredericksburgensis (O) Braarudosphaera hockwoldensisPrediscosphaera columnata
Cytheridea goodlandensis (O)Dictyoconus walnutensis
Eocytheropteron trinitiensis (O) Rucinolithus irregularisOrbitolina texana
Ticinella bejaouaensisChoffatella decipiens
Schuleridea lacustris (O) Nannoconus colomiiSchuleridea acuminata (O) Polycostella senaria
Gallaecytheridea postrotunda (O)Hexalithus noelae
Epistomina uhligiEpistomina mosquensis Stephanolithion bigotii bigotii
Alveosepta jaccardi Stephanolithion bigotii maximumPaalzowella feifeli Stephanolithion speciosum
Lower
Upper Lower Cretaceous
Lower Lower Cretaceous
Jura
ssIc Upper Upper Jurassic
Middle Lower Cretaceous
Middle Middle Jurassic Stephanolithion hexumEpistomina regularis
*Al l species represent extinction points . No biostratigraphic markers have been found older than Middle Jurass ic.
Chronostratigraphy Biostratigraphy*Erathem System Series Chronozone Foraminifer & Ostracod (O) Nannoplankton
M e
s o
z o i
c
Cret
aceo
us
Upper
Upper Upper Cretaceous
Lower Upper Cretaceous
ASSESSED PLAYS
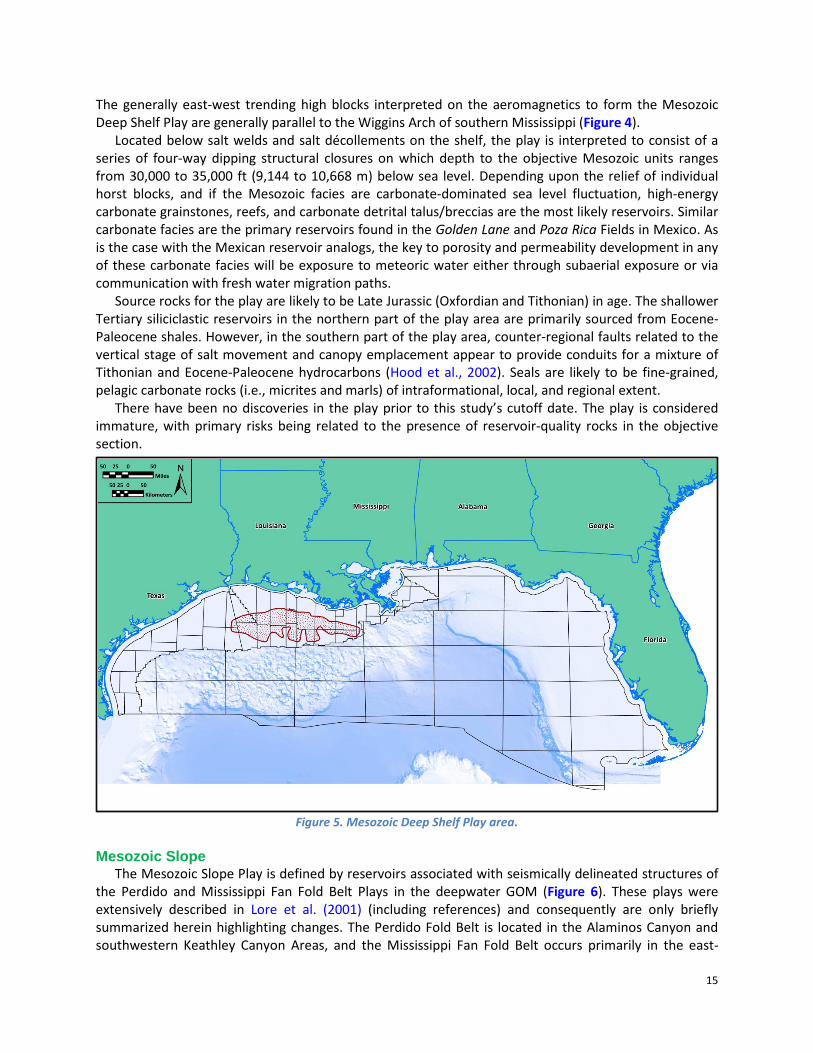
Mesozoic Deep Shelf The Mesozoic Deep Shelf Play is defined by 1) a series of large, four-way dipping structural closures
on the Louisiana Shelf and 2) source, reservoir, and seal lithologies that comprise seismically-correlated units of Upper Jurassic through Upper Cretaceous age. The play is located in relatively shallow water on the Texas-Louisiana shelf, and extends from High Island East Addition to Grand Isle South Addition, a distance of approximately 225 miles (mi), or 362 kilometers (km) (Figure 5). At its widest, the play is approximately 65 mi (105 km). These dimensions provide a play area of roughly 10,233 mi2 (6.5 million acres). The play area is outlined by high-resolution aeromagnetics, while individual prospects are defined by deep-resolution seismic data. Aeromagnetics and deep-penetrating seismic data delineate a series of rift-formed horst blocks that subsequently develop four-way dipping structures. These form the primary targets in the play. The origin, evolution, and development of these blocks are analogous to those described for the Buried Hill Plays. Consequently, the absence of these structure-forming blocks defines the updip, downdip and lateral extent of the play.
Similar to the Buried Hill Plays that are currently located in ultra-deep waters, the rift-related horst blocks that form the Mesozoic Deep Shelf Play are related to the Late Triassic to Early Jurassic transtensional rifting episode(s) that resulted in the breakup of Pangaea and created the GOM Basin.
15
The generally east-west trending high blocks interpreted on the aeromagnetics to form the Mesozoic Deep Shelf Play are generally parallel to the Wiggins Arch of southern Mississippi (Figure 4).
Located below salt welds and salt décollements on the shelf, the play is interpreted to consist of a series of four-way dipping structural closures on which depth to the objective Mesozoic units ranges from 30,000 to 35,000 ft (9,144 to 10,668 m) below sea level. Depending upon the relief of individual horst blocks, and if the Mesozoic facies are carbonate-dominated sea level fluctuation, high-energy carbonate grainstones, reefs, and carbonate detrital talus/breccias are the most likely reservoirs. Similar carbonate facies are the primary reservoirs found in the Golden Lane and Poza Rica Fields in Mexico. As is the case with the Mexican reservoir analogs, the key to porosity and permeability development in any of these carbonate facies will be exposure to meteoric water either through subaerial exposure or via communication with fresh water migration paths.
Source rocks for the play are likely to be Late Jurassic (Oxfordian and Tithonian) in age. The shallower Tertiary siliciclastic reservoirs in the northern part of the play area are primarily sourced from Eocene-Paleocene shales. However, in the southern part of the play area, counter-regional faults related to the vertical stage of salt movement and canopy emplacement appear to provide conduits for a mixture of Tithonian and Eocene-Paleocene hydrocarbons (Hood et al., 2002). Seals are likely to be fine-grained, pelagic carbonate rocks (i.e., micrites and marls) of intraformational, local, and regional extent.
There have been no discoveries in the play prior to this study’s cutoff date. The play is considered immature, with primary risks being related to the presence of reservoir-quality rocks in the objective section.
Figure 5. Mesozoic Deep Shelf Play area.
Mesozoic Slope
The Mesozoic Slope Play is defined by reservoirs associated with seismically delineated structures of the Perdido and Mississippi Fan Fold Belt Plays in the deepwater GOM (Figure 6). These plays were extensively described in Lore et al. (2001) (including references) and consequently are only briefly summarized herein highlighting changes. The Perdido Fold Belt is located in the Alaminos Canyon and southwestern Keathley Canyon Areas, and the Mississippi Fan Fold Belt occurs primarily in the east-
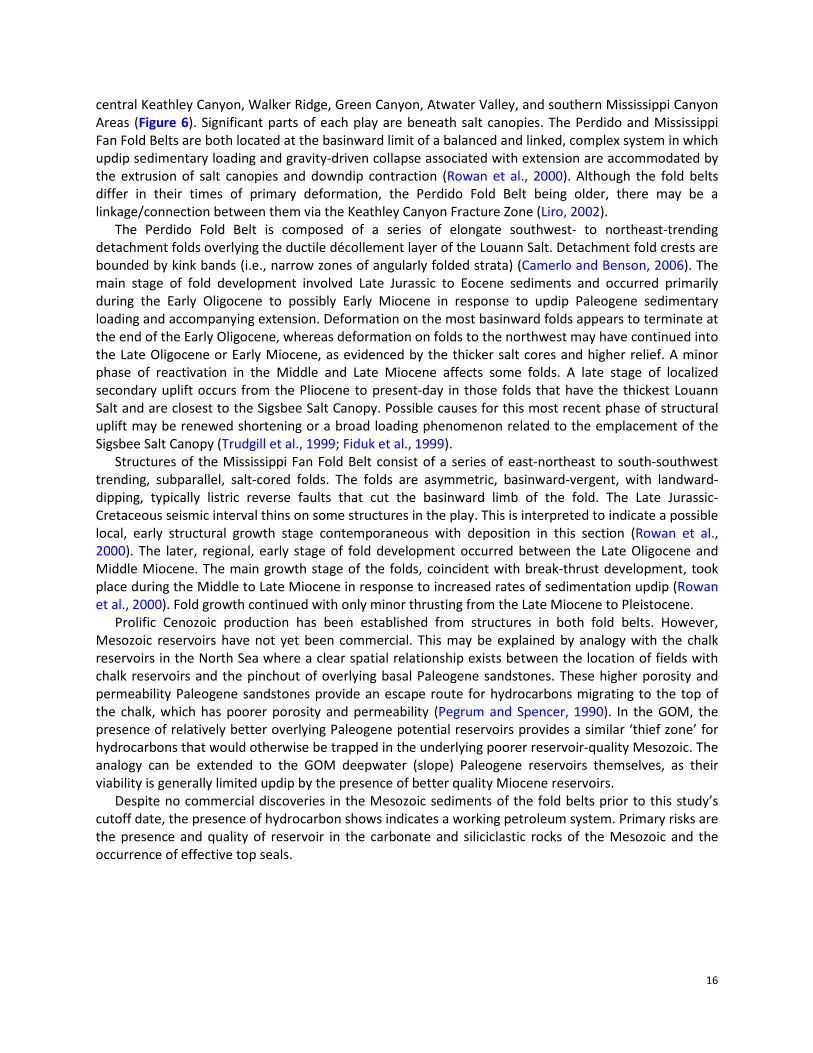
16
central Keathley Canyon, Walker Ridge, Green Canyon, Atwater Valley, and southern Mississippi Canyon Areas (Figure 6). Significant parts of each play are beneath salt canopies. The Perdido and Mississippi Fan Fold Belts are both located at the basinward limit of a balanced and linked, complex system in which updip sedimentary loading and gravity-driven collapse associated with extension are accommodated by the extrusion of salt canopies and downdip contraction (Rowan et al., 2000). Although the fold belts differ in their times of primary deformation, the Perdido Fold Belt being older, there may be a linkage/connection between them via the Keathley Canyon Fracture Zone (Liro, 2002).
The Perdido Fold Belt is composed of a series of elongate southwest- to northeast-trending detachment folds overlying the ductile décollement layer of the Louann Salt. Detachment fold crests are bounded by kink bands (i.e., narrow zones of angularly folded strata) (Camerlo and Benson, 2006). The main stage of fold development involved Late Jurassic to Eocene sediments and occurred primarily during the Early Oligocene to possibly Early Miocene in response to updip Paleogene sedimentary loading and accompanying extension. Deformation on the most basinward folds appears to terminate at the end of the Early Oligocene, whereas deformation on folds to the northwest may have continued into the Late Oligocene or Early Miocene, as evidenced by the thicker salt cores and higher relief. A minor phase of reactivation in the Middle and Late Miocene affects some folds. A late stage of localized secondary uplift occurs from the Pliocene to present-day in those folds that have the thickest Louann Salt and are closest to the Sigsbee Salt Canopy. Possible causes for this most recent phase of structural uplift may be renewed shortening or a broad loading phenomenon related to the emplacement of the Sigsbee Salt Canopy (Trudgill et al., 1999; Fiduk et al., 1999).
Structures of the Mississippi Fan Fold Belt consist of a series of east-northeast to south-southwest trending, subparallel, salt-cored folds. The folds are asymmetric, basinward-vergent, with landward-dipping, typically listric reverse faults that cut the basinward limb of the fold. The Late Jurassic-Cretaceous seismic interval thins on some structures in the play. This is interpreted to indicate a possible local, early structural growth stage contemporaneous with deposition in this section (Rowan et al., 2000). The later, regional, early stage of fold development occurred between the Late Oligocene and Middle Miocene. The main growth stage of the folds, coincident with break-thrust development, took place during the Middle to Late Miocene in response to increased rates of sedimentation updip (Rowan et al., 2000). Fold growth continued with only minor thrusting from the Late Miocene to Pleistocene.
Prolific Cenozoic production has been established from structures in both fold belts. However, Mesozoic reservoirs have not yet been commercial. This may be explained by analogy with the chalk reservoirs in the North Sea where a clear spatial relationship exists between the location of fields with chalk reservoirs and the pinchout of overlying basal Paleogene sandstones. These higher porosity and permeability Paleogene sandstones provide an escape route for hydrocarbons migrating to the top of the chalk, which has poorer porosity and permeability (Pegrum and Spencer, 1990). In the GOM, the presence of relatively better overlying Paleogene potential reservoirs provides a similar ‘thief zone’ for hydrocarbons that would otherwise be trapped in the underlying poorer reservoir-quality Mesozoic. The analogy can be extended to the GOM deepwater (slope) Paleogene reservoirs themselves, as their viability is generally limited updip by the presence of better quality Miocene reservoirs.
Despite no commercial discoveries in the Mesozoic sediments of the fold belts prior to this study’s cutoff date, the presence of hydrocarbon shows indicates a working petroleum system. Primary risks are the presence and quality of reservoir in the carbonate and siliciclastic rocks of the Mesozoic and the occurrence of effective top seals.
17
Figure 6. Mesozoic Slope Play area.
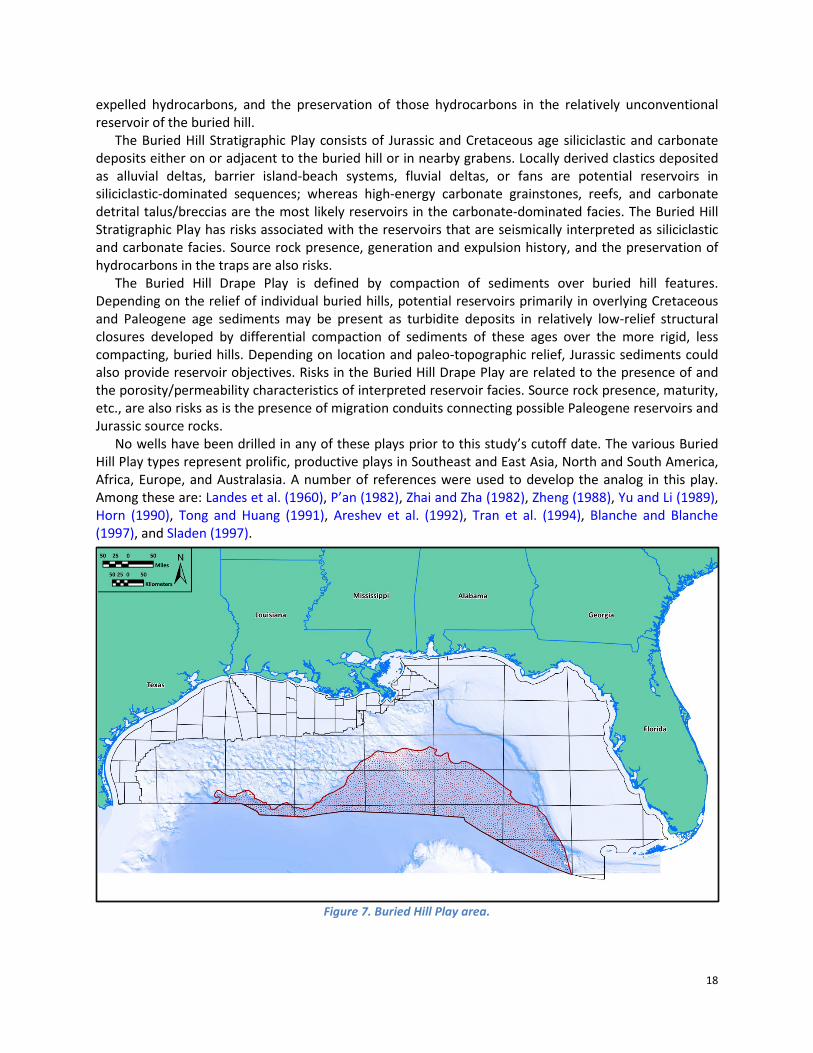
Buried Hill
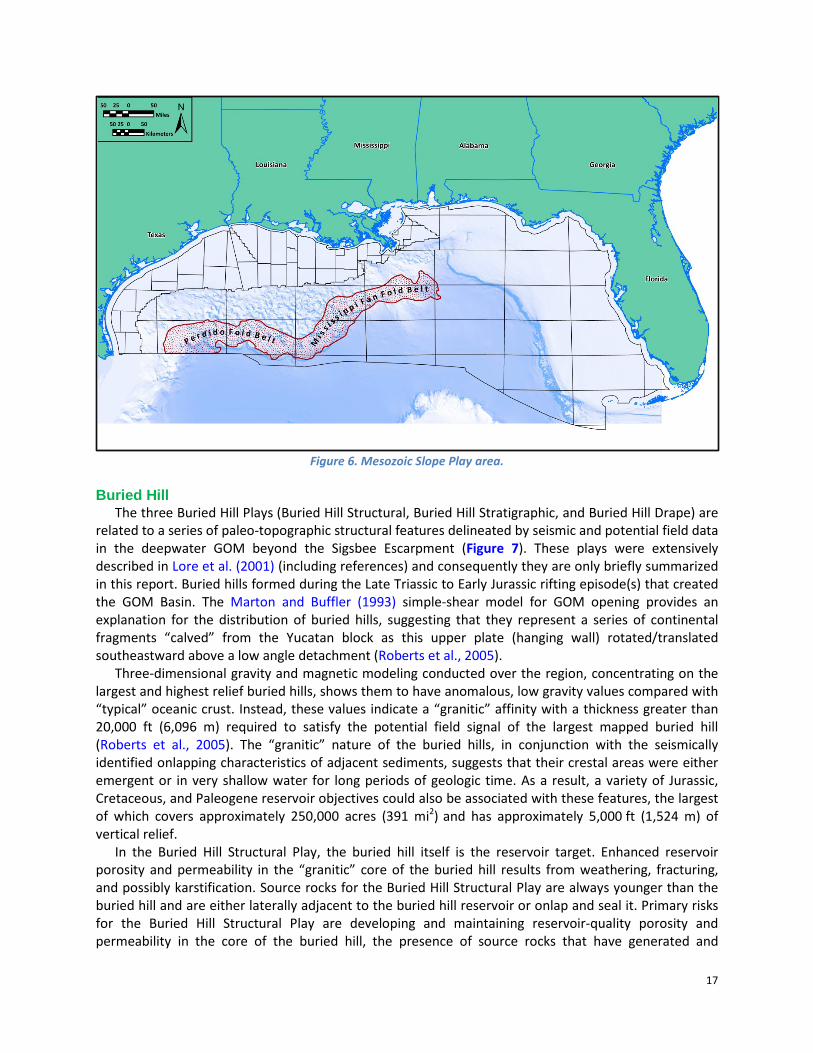
The three Buried Hill Plays (Buried Hill Structural, Buried Hill Stratigraphic, and Buried Hill Drape) are related to a series of paleo-topographic structural features delineated by seismic and potential field data in the deepwater GOM beyond the Sigsbee Escarpment (Figure 7). These plays were extensively described in Lore et al. (2001) (including references) and consequently they are only briefly summarized in this report. Buried hills formed during the Late Triassic to Early Jurassic rifting episode(s) that created the GOM Basin. The Marton and Buffler (1993) simple-shear model for GOM opening provides an explanation for the distribution of buried hills, suggesting that they represent a series of continental fragments “calved” from the Yucatan block as this upper plate (hanging wall) rotated/translated southeastward above a low angle detachment (Roberts et al., 2005).
Three-dimensional gravity and magnetic modeling conducted over the region, concentrating on the largest and highest relief buried hills, shows them to have anomalous, low gravity values compared with “typical” oceanic crust. Instead, these values indicate a “granitic” affinity with a thickness greater than 20,000 ft (6,096 m) required to satisfy the potential field signal of the largest mapped buried hill (Roberts et al., 2005). The “granitic” nature of the buried hills, in conjunction with the seismically identified onlapping characteristics of adjacent sediments, suggests that their crestal areas were either emergent or in very shallow water for long periods of geologic time. As a result, a variety of Jurassic, Cretaceous, and Paleogene reservoir objectives could also be associated with these features, the largest of which covers approximately 250,000 acres (391 mi2) and has approximately 5,000 ft (1,524 m) of vertical relief.
In the Buried Hill Structural Play, the buried hill itself is the reservoir target. Enhanced reservoir porosity and permeability in the “granitic” core of the buried hill results from weathering, fracturing, and possibly karstification. Source rocks for the Buried Hill Structural Play are always younger than the buried hill and are either laterally adjacent to the buried hill reservoir or onlap and seal it. Primary risks for the Buried Hill Structural Play are developing and maintaining reservoir-quality porosity and permeability in the core of the buried hill, the presence of source rocks that have generated and
18
expelled hydrocarbons, and the preservation of those hydrocarbons in the relatively unconventional reservoir of the buried hill.
The Buried Hill Stratigraphic Play consists of Jurassic and Cretaceous age siliciclastic and carbonate deposits either on or adjacent to the buried hill or in nearby grabens. Locally derived clastics deposited as alluvial deltas, barrier island-beach systems, fluvial deltas, or fans are potential reservoirs in siliciclastic-dominated sequences; whereas high-energy carbonate grainstones, reefs, and carbonate detrital talus/breccias are the most likely reservoirs in the carbonate-dominated facies. The Buried Hill Stratigraphic Play has risks associated with the reservoirs that are seismically interpreted as siliciclastic and carbonate facies. Source rock presence, generation and expulsion history, and the preservation of hydrocarbons in the traps are also risks.
The Buried Hill Drape Play is defined by compaction of sediments over buried hill features. Depending on the relief of individual buried hills, potential reservoirs primarily in overlying Cretaceous and Paleogene age sediments may be present as turbidite deposits in relatively low-relief structural closures developed by differential compaction of sediments of these ages over the more rigid, less compacting, buried hills. Depending on location and paleo-topographic relief, Jurassic sediments could also provide reservoir objectives. Risks in the Buried Hill Drape Play are related to the presence of and the porosity/permeability characteristics of interpreted reservoir facies. Source rock presence, maturity, etc., are also risks as is the presence of migration conduits connecting possible Paleogene reservoirs and Jurassic source rocks.
No wells have been drilled in any of these plays prior to this study’s cutoff date. The various Buried Hill Play types represent prolific, productive plays in Southeast and East Asia, North and South America, Africa, Europe, and Australasia. A number of references were used to develop the analog in this play. Among these are: Landes et al. (1960), P’an (1982), Zhai and Zha (1982), Zheng (1988), Yu and Li (1989), Horn (1990), Tong and Huang (1991), Areshev et al. (1992), Tran et al. (1994), Blanche and Blanche (1997), and Sladen (1997).
Figure 7. Buried Hill Play area.
19
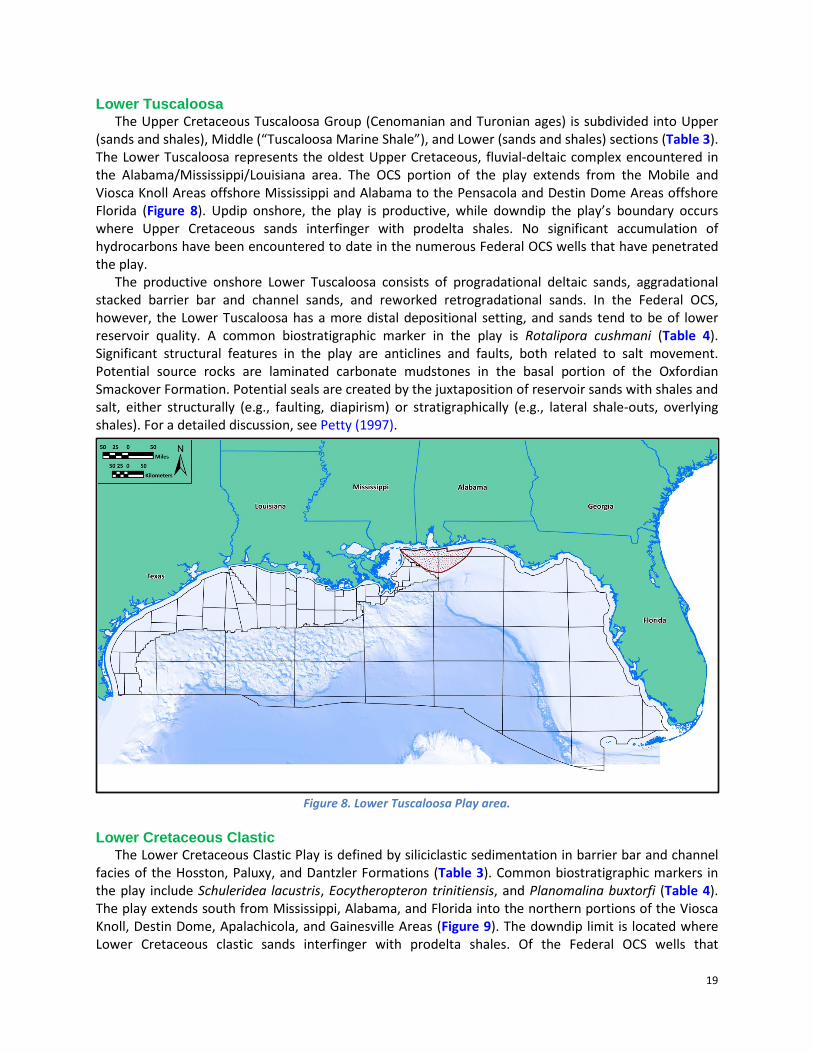
Lower Tuscaloosa The Upper Cretaceous Tuscaloosa Group (Cenomanian and Turonian ages) is subdivided into Upper
(sands and shales), Middle (“Tuscaloosa Marine Shale”), and Lower (sands and shales) sections (Table 3). The Lower Tuscaloosa represents the oldest Upper Cretaceous, fluvial-deltaic complex encountered in the Alabama/Mississippi/Louisiana area. The OCS portion of the play extends from the Mobile and Viosca Knoll Areas offshore Mississippi and Alabama to the Pensacola and Destin Dome Areas offshore Florida (Figure 8). Updip onshore, the play is productive, while downdip the play’s boundary occurs where Upper Cretaceous sands interfinger with prodelta shales. No significant accumulation of hydrocarbons have been encountered to date in the numerous Federal OCS wells that have penetrated the play.
The productive onshore Lower Tuscaloosa consists of progradational deltaic sands, aggradational stacked barrier bar and channel sands, and reworked retrogradational sands. In the Federal OCS, however, the Lower Tuscaloosa has a more distal depositional setting, and sands tend to be of lower reservoir quality. A common biostratigraphic marker in the play is Rotalipora cushmani (Table 4). Significant structural features in the play are anticlines and faults, both related to salt movement. Potential source rocks are laminated carbonate mudstones in the basal portion of the Oxfordian Smackover Formation. Potential seals are created by the juxtaposition of reservoir sands with shales and salt, either structurally (e.g., faulting, diapirism) or stratigraphically (e.g., lateral shale-outs, overlying shales). For a detailed discussion, see Petty (1997).
Figure 8. Lower Tuscaloosa Play area.
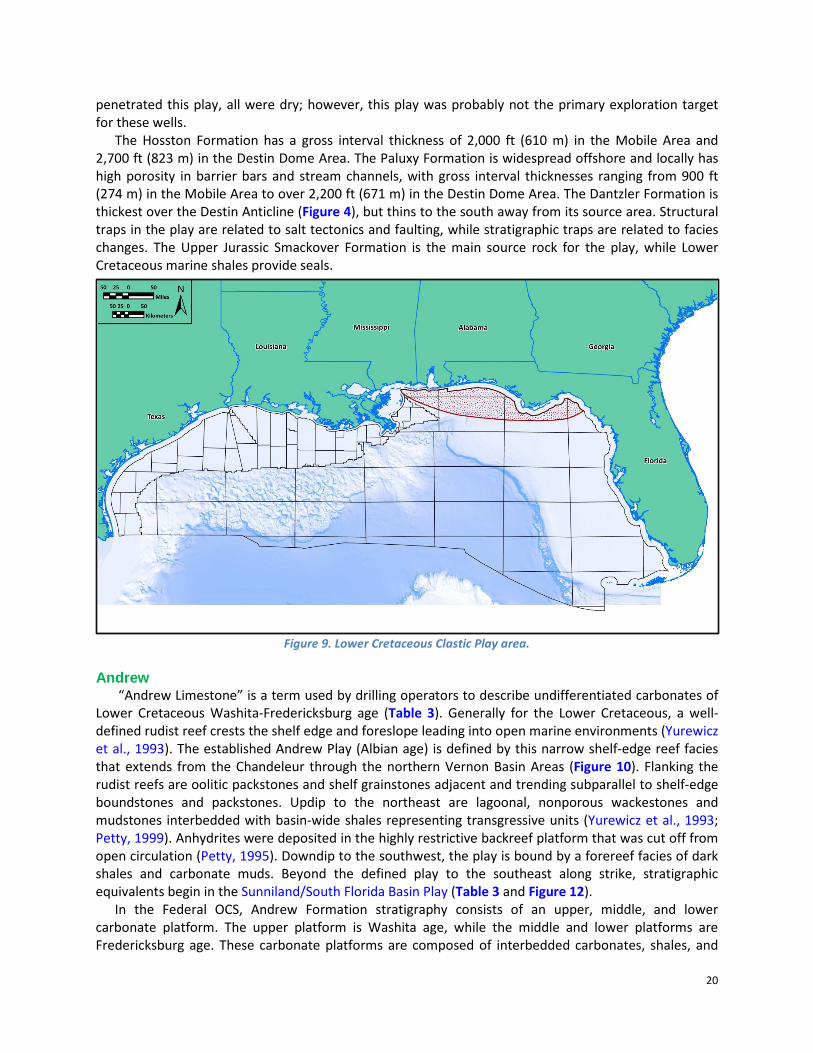
Lower Cretaceous Clastic
The Lower Cretaceous Clastic Play is defined by siliciclastic sedimentation in barrier bar and channel facies of the Hosston, Paluxy, and Dantzler Formations (Table 3). Common biostratigraphic markers in the play include Schuleridea lacustris, Eocytheropteron trinitiensis, and Planomalina buxtorfi (Table 4). The play extends south from Mississippi, Alabama, and Florida into the northern portions of the Viosca Knoll, Destin Dome, Apalachicola, and Gainesville Areas (Figure 9). The downdip limit is located where Lower Cretaceous clastic sands interfinger with prodelta shales. Of the Federal OCS wells that
20
penetrated this play, all were dry; however, this play was probably not the primary exploration target for these wells.
The Hosston Formation has a gross interval thickness of 2,000 ft (610 m) in the Mobile Area and 2,700 ft (823 m) in the Destin Dome Area. The Paluxy Formation is widespread offshore and locally has high porosity in barrier bars and stream channels, with gross interval thicknesses ranging from 900 ft (274 m) in the Mobile Area to over 2,200 ft (671 m) in the Destin Dome Area. The Dantzler Formation is thickest over the Destin Anticline (Figure 4), but thins to the south away from its source area. Structural traps in the play are related to salt tectonics and faulting, while stratigraphic traps are related to facies changes. The Upper Jurassic Smackover Formation is the main source rock for the play, while Lower Cretaceous marine shales provide seals.
Figure 9. Lower Cretaceous Clastic Play area.
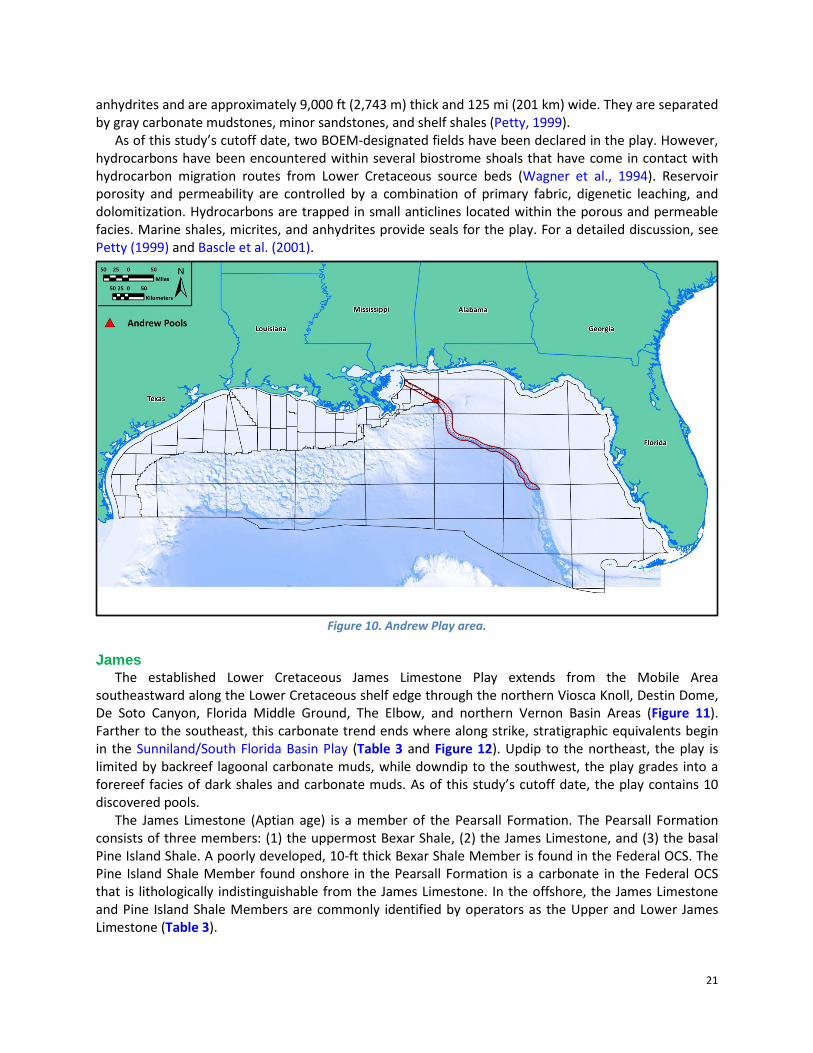
Andrew
“Andrew Limestone” is a term used by drilling operators to describe undifferentiated carbonates of Lower Cretaceous Washita-Fredericksburg age (Table 3). Generally for the Lower Cretaceous, a well-defined rudist reef crests the shelf edge and foreslope leading into open marine environments (Yurewicz et al., 1993). The established Andrew Play (Albian age) is defined by this narrow shelf-edge reef facies that extends from the Chandeleur through the northern Vernon Basin Areas (Figure 10). Flanking the rudist reefs are oolitic packstones and shelf grainstones adjacent and trending subparallel to shelf-edge boundstones and packstones. Updip to the northeast are lagoonal, nonporous wackestones and mudstones interbedded with basin-wide shales representing transgressive units (Yurewicz et al., 1993; Petty, 1999). Anhydrites were deposited in the highly restrictive backreef platform that was cut off from open circulation (Petty, 1995). Downdip to the southwest, the play is bound by a forereef facies of dark shales and carbonate muds. Beyond the defined play to the southeast along strike, stratigraphic equivalents begin in the Sunniland/South Florida Basin Play (Table 3 and Figure 12).
In the Federal OCS, Andrew Formation stratigraphy consists of an upper, middle, and lower carbonate platform. The upper platform is Washita age, while the middle and lower platforms are Fredericksburg age. These carbonate platforms are composed of interbedded carbonates, shales, and
21
anhydrites and are approximately 9,000 ft (2,743 m) thick and 125 mi (201 km) wide. They are separated by gray carbonate mudstones, minor sandstones, and shelf shales (Petty, 1999).
As of this study’s cutoff date, two BOEM-designated fields have been declared in the play. However, hydrocarbons have been encountered within several biostrome shoals that have come in contact with hydrocarbon migration routes from Lower Cretaceous source beds (Wagner et al., 1994). Reservoir porosity and permeability are controlled by a combination of primary fabric, digenetic leaching, and dolomitization. Hydrocarbons are trapped in small anticlines located within the porous and permeable facies. Marine shales, micrites, and anhydrites provide seals for the play. For a detailed discussion, see Petty (1999) and Bascle et al. (2001).
Figure 10. Andrew Play area.
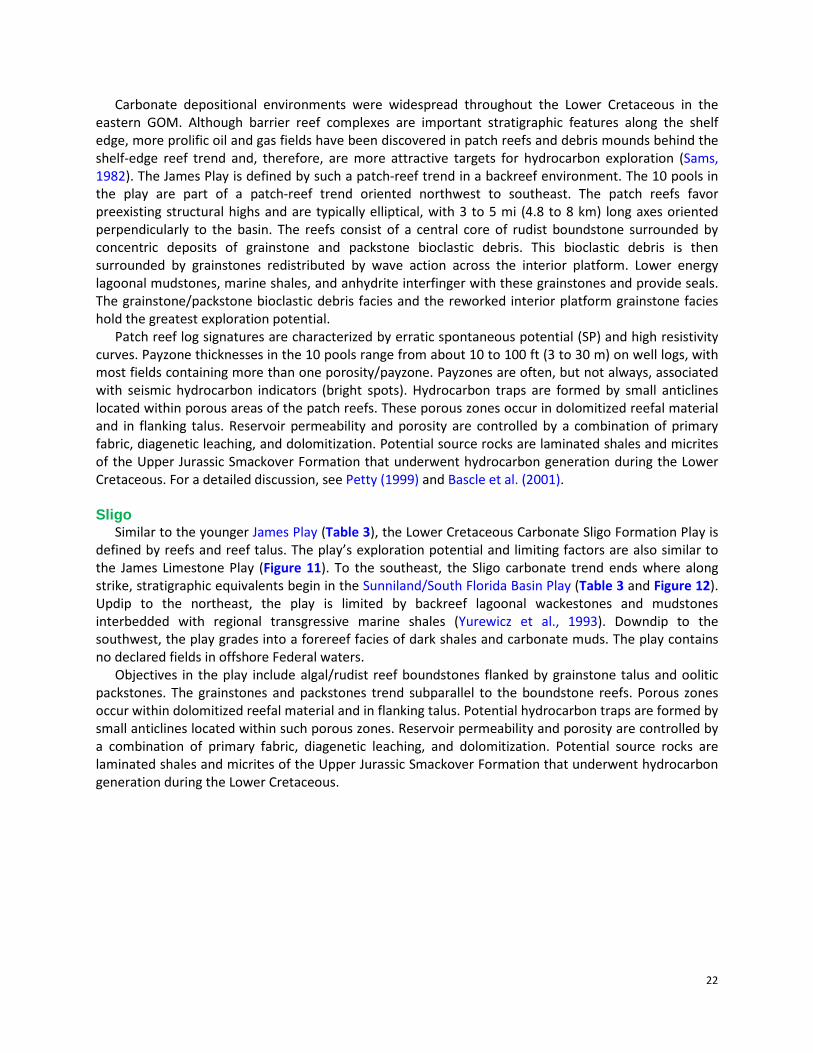
James
The established Lower Cretaceous James Limestone Play extends from the Mobile Area southeastward along the Lower Cretaceous shelf edge through the northern Viosca Knoll, Destin Dome, De Soto Canyon, Florida Middle Ground, The Elbow, and northern Vernon Basin Areas (Figure 11). Farther to the southeast, this carbonate trend ends where along strike, stratigraphic equivalents begin in the Sunniland/South Florida Basin Play (Table 3 and Figure 12). Updip to the northeast, the play is limited by backreef lagoonal carbonate muds, while downdip to the southwest, the play grades into a forereef facies of dark shales and carbonate muds. As of this study’s cutoff date, the play contains 10 discovered pools.
The James Limestone (Aptian age) is a member of the Pearsall Formation. The Pearsall Formation consists of three members: (1) the uppermost Bexar Shale, (2) the James Limestone, and (3) the basal Pine Island Shale. A poorly developed, 10-ft thick Bexar Shale Member is found in the Federal OCS. The Pine Island Shale Member found onshore in the Pearsall Formation is a carbonate in the Federal OCS that is lithologically indistinguishable from the James Limestone. In the offshore, the James Limestone and Pine Island Shale Members are commonly identified by operators as the Upper and Lower James Limestone (Table 3).
22
Carbonate depositional environments were widespread throughout the Lower Cretaceous in the eastern GOM. Although barrier reef complexes are important stratigraphic features along the shelf edge, more prolific oil and gas fields have been discovered in patch reefs and debris mounds behind the shelf-edge reef trend and, therefore, are more attractive targets for hydrocarbon exploration (Sams, 1982). The James Play is defined by such a patch-reef trend in a backreef environment. The 10 pools in the play are part of a patch-reef trend oriented northwest to southeast. The patch reefs favor preexisting structural highs and are typically elliptical, with 3 to 5 mi (4.8 to 8 km) long axes oriented perpendicularly to the basin. The reefs consist of a central core of rudist boundstone surrounded by concentric deposits of grainstone and packstone bioclastic debris. This bioclastic debris is then surrounded by grainstones redistributed by wave action across the interior platform. Lower energy lagoonal mudstones, marine shales, and anhydrite interfinger with these grainstones and provide seals. The grainstone/packstone bioclastic debris facies and the reworked interior platform grainstone facies hold the greatest exploration potential.
Patch reef log signatures are characterized by erratic spontaneous potential (SP) and high resistivity curves. Payzone thicknesses in the 10 pools range from about 10 to 100 ft (3 to 30 m) on well logs, with most fields containing more than one porosity/payzone. Payzones are often, but not always, associated with seismic hydrocarbon indicators (bright spots). Hydrocarbon traps are formed by small anticlines located within porous areas of the patch reefs. These porous zones occur in dolomitized reefal material and in flanking talus. Reservoir permeability and porosity are controlled by a combination of primary fabric, diagenetic leaching, and dolomitization. Potential source rocks are laminated shales and micrites of the Upper Jurassic Smackover Formation that underwent hydrocarbon generation during the Lower Cretaceous. For a detailed discussion, see Petty (1999) and Bascle et al. (2001).
Sligo
Similar to the younger James Play (Table 3), the Lower Cretaceous Carbonate Sligo Formation Play is defined by reefs and reef talus. The play’s exploration potential and limiting factors are also similar to the James Limestone Play (Figure 11). To the southeast, the Sligo carbonate trend ends where along strike, stratigraphic equivalents begin in the Sunniland/South Florida Basin Play (Table 3 and Figure 12). Updip to the northeast, the play is limited by backreef lagoonal wackestones and mudstones interbedded with regional transgressive marine shales (Yurewicz et al., 1993). Downdip to the southwest, the play grades into a forereef facies of dark shales and carbonate muds. The play contains no declared fields in offshore Federal waters.
Objectives in the play include algal/rudist reef boundstones flanked by grainstone talus and oolitic packstones. The grainstones and packstones trend subparallel to the boundstone reefs. Porous zones occur within dolomitized reefal material and in flanking talus. Potential hydrocarbon traps are formed by small anticlines located within such porous zones. Reservoir permeability and porosity are controlled by a combination of primary fabric, diagenetic leaching, and dolomitization. Potential source rocks are laminated shales and micrites of the Upper Jurassic Smackover Formation that underwent hydrocarbon generation during the Lower Cretaceous.
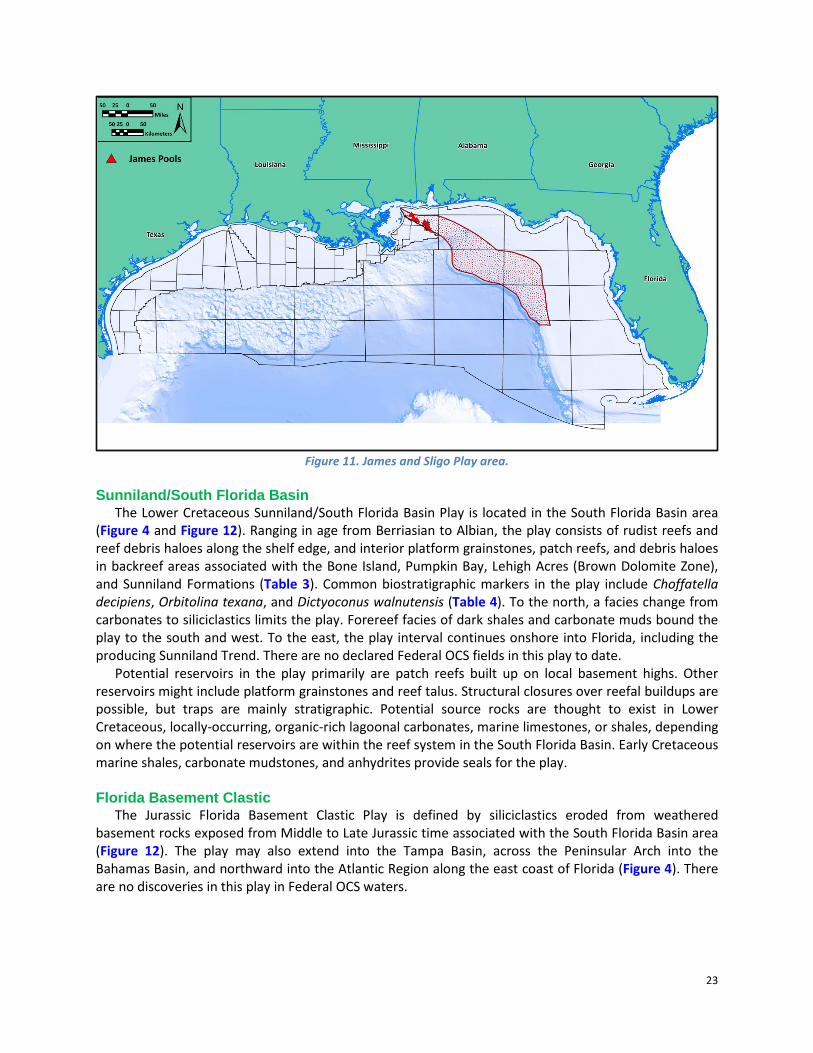
23
Figure 11. James and Sligo Play area.
Sunniland/South Florida Basin
The Lower Cretaceous Sunniland/South Florida Basin Play is located in the South Florida Basin area (Figure 4 and Figure 12). Ranging in age from Berriasian to Albian, the play consists of rudist reefs and reef debris haloes along the shelf edge, and interior platform grainstones, patch reefs, and debris haloes in backreef areas associated with the Bone Island, Pumpkin Bay, Lehigh Acres (Brown Dolomite Zone), and Sunniland Formations (Table 3). Common biostratigraphic markers in the play include Choffatella decipiens, Orbitolina texana, and Dictyoconus walnutensis (Table 4). To the north, a facies change from carbonates to siliciclastics limits the play. Forereef facies of dark shales and carbonate muds bound the play to the south and west. To the east, the play interval continues onshore into Florida, including the producing Sunniland Trend. There are no declared Federal OCS fields in this play to date.
Potential reservoirs in the play primarily are patch reefs built up on local basement highs. Other reservoirs might include platform grainstones and reef talus. Structural closures over reefal buildups are possible, but traps are mainly stratigraphic. Potential source rocks are thought to exist in Lower Cretaceous, locally-occurring, organic-rich lagoonal carbonates, marine limestones, or shales, depending on where the potential reservoirs are within the reef system in the South Florida Basin. Early Cretaceous marine shales, carbonate mudstones, and anhydrites provide seals for the play.
Florida Basement Clastic
The Jurassic Florida Basement Clastic Play is defined by siliciclastics eroded from weathered basement rocks exposed from Middle to Late Jurassic time associated with the South Florida Basin area (Figure 12). The play may also extend into the Tampa Basin, across the Peninsular Arch into the Bahamas Basin, and northward into the Atlantic Region along the east coast of Florida (Figure 4). There are no discoveries in this play in Federal OCS waters.
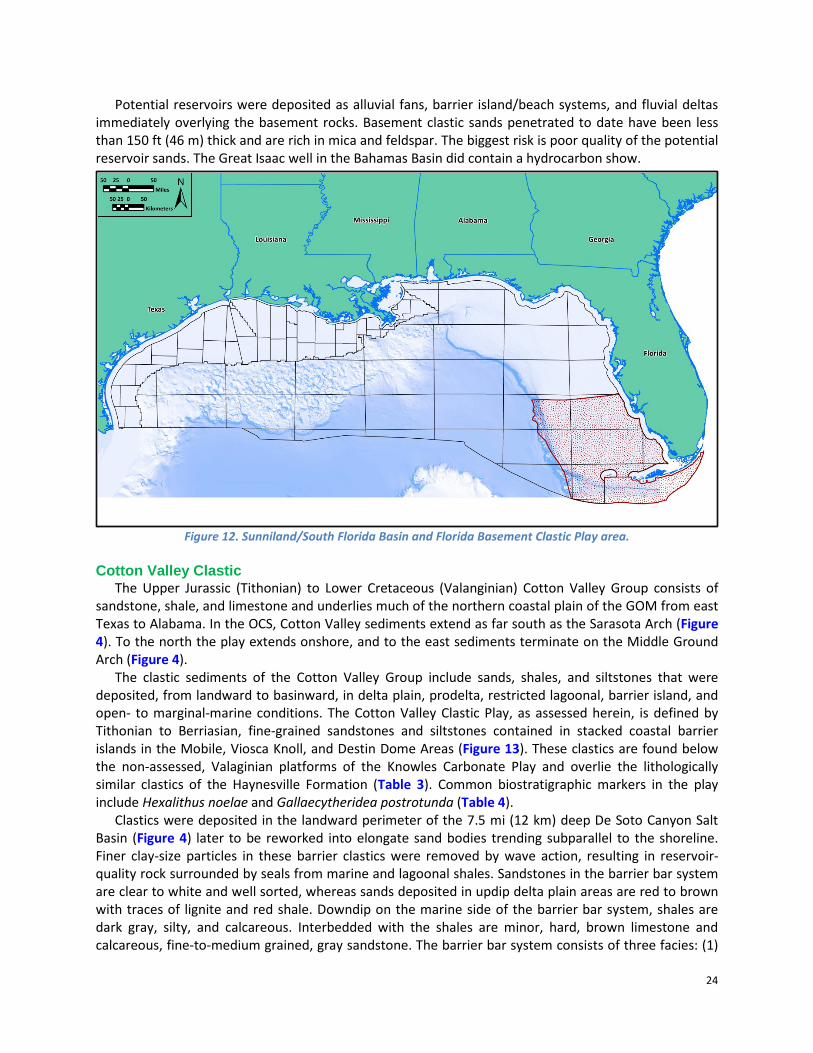
24
Potential reservoirs were deposited as alluvial fans, barrier island/beach systems, and fluvial deltas immediately overlying the basement rocks. Basement clastic sands penetrated to date have been less than 150 ft (46 m) thick and are rich in mica and feldspar. The biggest risk is poor quality of the potential reservoir sands. The Great Isaac well in the Bahamas Basin did contain a hydrocarbon show.
Figure 12. Sunniland/South Florida Basin and Florida Basement Clastic Play area.
Cotton Valley Clastic
The Upper Jurassic (Tithonian) to Lower Cretaceous (Valanginian) Cotton Valley Group consists of sandstone, shale, and limestone and underlies much of the northern coastal plain of the GOM from east Texas to Alabama. In the OCS, Cotton Valley sediments extend as far south as the Sarasota Arch (Figure 4). To the north the play extends onshore, and to the east sediments terminate on the Middle Ground Arch (Figure 4).
The clastic sediments of the Cotton Valley Group include sands, shales, and siltstones that were deposited, from landward to basinward, in delta plain, prodelta, restricted lagoonal, barrier island, and open- to marginal-marine conditions. The Cotton Valley Clastic Play, as assessed herein, is defined by Tithonian to Berriasian, fine-grained sandstones and siltstones contained in stacked coastal barrier islands in the Mobile, Viosca Knoll, and Destin Dome Areas (Figure 13). These clastics are found below the non-assessed, Valaginian platforms of the Knowles Carbonate Play and overlie the lithologically similar clastics of the Haynesville Formation (Table 3). Common biostratigraphic markers in the play include Hexalithus noelae and Gallaecytheridea postrotunda (Table 4).
Clastics were deposited in the landward perimeter of the 7.5 mi (12 km) deep De Soto Canyon Salt Basin (Figure 4) later to be reworked into elongate sand bodies trending subparallel to the shoreline. Finer clay-size particles in these barrier clastics were removed by wave action, resulting in reservoir-quality rock surrounded by seals from marine and lagoonal shales. Sandstones in the barrier bar system are clear to white and well sorted, whereas sands deposited in updip delta plain areas are red to brown with traces of lignite and red shale. Downdip on the marine side of the barrier bar system, shales are dark gray, silty, and calcareous. Interbedded with the shales are minor, hard, brown limestone and calcareous, fine-to-medium grained, gray sandstone. The barrier bar system consists of three facies: (1)
25
an aeolian section where barrier tops were exposed, (2) a sand-rich shoreface in the center of the barrier, and (3) siltstones on the outer flanks interbedded with shales. Adjacent to the landward side are lagoonal shales indicating the barrier system is a regressive system.
The Main Pass block 154 well no. 1 penetrated 500 ft (152 m) of marine gray shale and small sand stringers. To the east, Destin Dome block 529 well no. 1 penetrated the toe portion of the barrier island system, where the clastics coarsen upward and have an identity that affects wave behavior and consequently reservoir rock development. Updip in Viosca Knoll block 251 well no. 1, 1,450 ft (442 m) of sand-rich barrier islands were penetrated. These sands are blockier in SP development than sands in delta plain regions and are located in seismically well-defined stratified regions of the De Soto Canyon Salt Basin. Viosca Knoll block 117 well no. 1 penetrated a complete section of Cotton Valley clastics deposited on the edge of the De Soto Canyon Salt Basin, with a thickness of 1,950 ft (594 m). The sands in this section are interbedded with marine carbonates and shales. Farther eastward and updip in Mobile block 991 well no. 2, a wide variety of environments is displayed as defined by kerogen type ranging from nonmarine, fluvial, lagoonal, marginal marine to marine. This area represents a transitional zone between the barrier island system and the lagoonal/delta plain areas.
The Cotton Valley Group produces from several onshore fields in northern Louisiana, southern Mississippi, and southern Alabama, with the nearest onshore production to the offshore Cotton Valley from the Catahoula Creek Field in Hancock County, Mississippi. Reservoir sands at the Catahoula Creek Field were deposited in a barrier island environment that can be traced offshore into the Destin Dome Area (Ericksen and Thieling, 1993). Even though there are no commercial discoveries thus far in the Federal OCS, gas potential has been demonstrated in the barrier islands sands of the Cotton Valley Group (e.g., Viosca Knoll block 117 well no. 1). With a demonstrated working petroleum system, additional hydrocarbon exploration in the Federal OCS within the Cotton Valley clastics is warranted. For a detailed discussion, see Petty (2008).
Figure 13. Cotton Valley Clastic Play area.
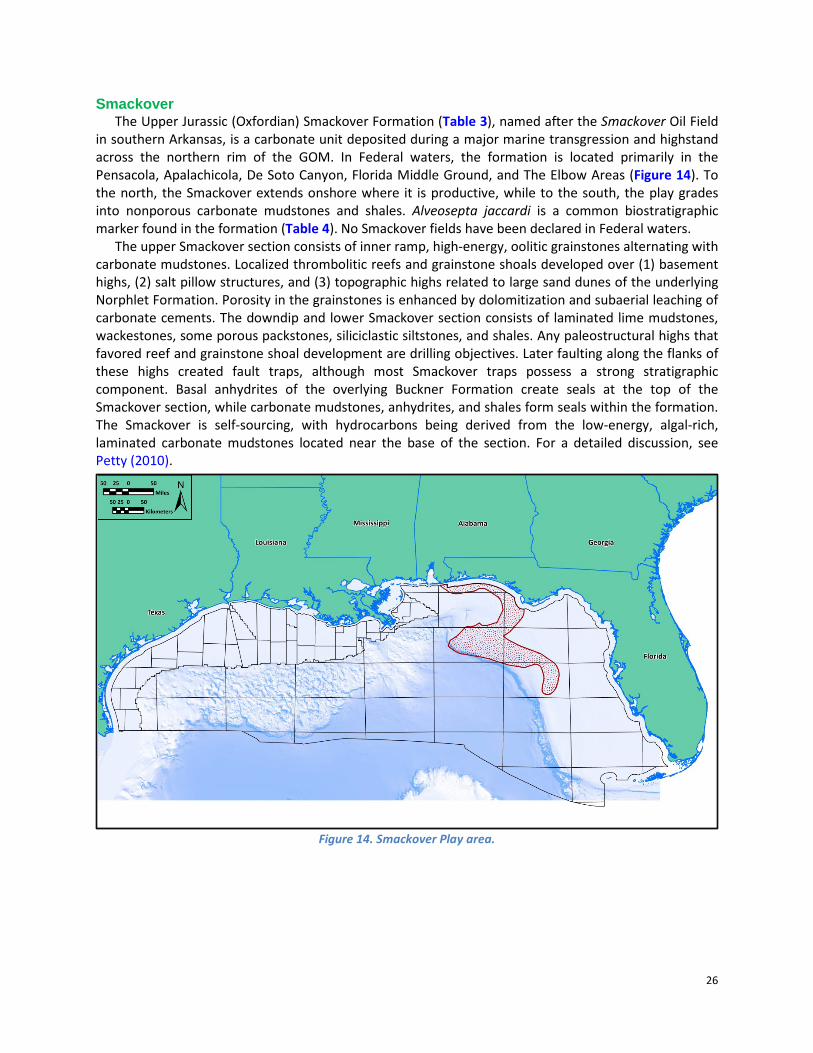
26
Smackover The Upper Jurassic (Oxfordian) Smackover Formation (Table 3), named after the Smackover Oil Field
in southern Arkansas, is a carbonate unit deposited during a major marine transgression and highstand across the northern rim of the GOM. In Federal waters, the formation is located primarily in the Pensacola, Apalachicola, De Soto Canyon, Florida Middle Ground, and The Elbow Areas (Figure 14). To the north, the Smackover extends onshore where it is productive, while to the south, the play grades into nonporous carbonate mudstones and shales. Alveosepta jaccardi is a common biostratigraphic marker found in the formation (Table 4). No Smackover fields have been declared in Federal waters.
The upper Smackover section consists of inner ramp, high-energy, oolitic grainstones alternating with carbonate mudstones. Localized thrombolitic reefs and grainstone shoals developed over (1) basement highs, (2) salt pillow structures, and (3) topographic highs related to large sand dunes of the underlying Norphlet Formation. Porosity in the grainstones is enhanced by dolomitization and subaerial leaching of carbonate cements. The downdip and lower Smackover section consists of laminated lime mudstones, wackestones, some porous packstones, siliciclastic siltstones, and shales. Any paleostructural highs that favored reef and grainstone shoal development are drilling objectives. Later faulting along the flanks of these highs created fault traps, although most Smackover traps possess a strong stratigraphic component. Basal anhydrites of the overlying Buckner Formation create seals at the top of the Smackover section, while carbonate mudstones, anhydrites, and shales form seals within the formation. The Smackover is self-sourcing, with hydrocarbons being derived from the low-energy, algal-rich, laminated carbonate mudstones located near the base of the section. For a detailed discussion, see Petty (2010).
Figure 14. Smackover Play area.
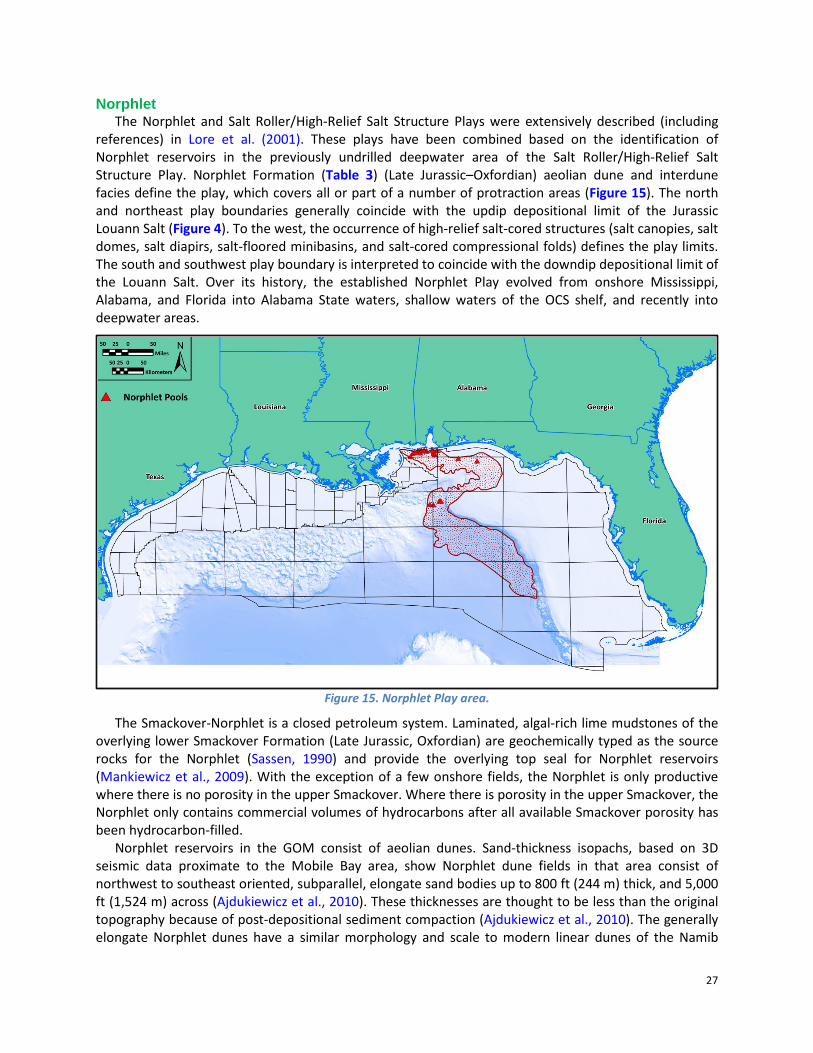
27
Norphlet The Norphlet and Salt Roller/High-Relief Salt Structure Plays were extensively described (including
references) in Lore et al. (2001). These plays have been combined based on the identification of Norphlet reservoirs in the previously undrilled deepwater area of the Salt Roller/High-Relief Salt Structure Play. Norphlet Formation (Table 3) (Late Jurassic–Oxfordian) aeolian dune and interdune facies define the play, which covers all or part of a number of protraction areas (Figure 15). The north and northeast play boundaries generally coincide with the updip depositional limit of the Jurassic Louann Salt (Figure 4). To the west, the occurrence of high-relief salt-cored structures (salt canopies, salt domes, salt diapirs, salt-floored minibasins, and salt-cored compressional folds) defines the play limits. The south and southwest play boundary is interpreted to coincide with the downdip depositional limit of the Louann Salt. Over its history, the established Norphlet Play evolved from onshore Mississippi, Alabama, and Florida into Alabama State waters, shallow waters of the OCS shelf, and recently into deepwater areas.
Figure 15. Norphlet Play area.
The Smackover-Norphlet is a closed petroleum system. Laminated, algal-rich lime mudstones of the overlying lower Smackover Formation (Late Jurassic, Oxfordian) are geochemically typed as the source rocks for the Norphlet (Sassen, 1990) and provide the overlying top seal for Norphlet reservoirs (Mankiewicz et al., 2009). With the exception of a few onshore fields, the Norphlet is only productive where there is no porosity in the upper Smackover. Where there is porosity in the upper Smackover, the Norphlet only contains commercial volumes of hydrocarbons after all available Smackover porosity has been hydrocarbon-filled.
Norphlet reservoirs in the GOM consist of aeolian dunes. Sand-thickness isopachs, based on 3D seismic data proximate to the Mobile Bay area, show Norphlet dune fields in that area consist of northwest to southeast oriented, subparallel, elongate sand bodies up to 800 ft (244 m) thick, and 5,000 ft (1,524 m) across (Ajdukiewicz et al., 2010). These thicknesses are thought to be less than the original topography because of post-depositional sediment compaction (Ajdukiewicz et al., 2010). The generally elongate Norphlet dunes have a similar morphology and scale to modern linear dunes of the Namib
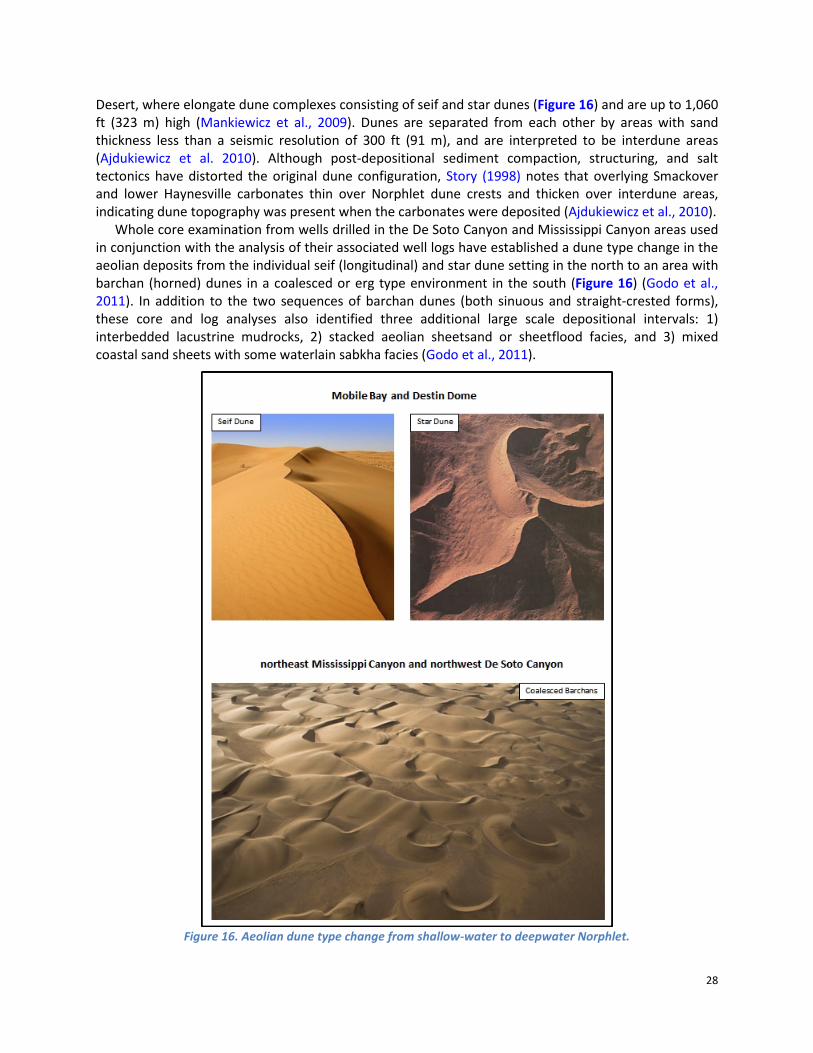
28
Desert, where elongate dune complexes consisting of seif and star dunes (Figure 16) and are up to 1,060 ft (323 m) high (Mankiewicz et al., 2009). Dunes are separated from each other by areas with sand thickness less than a seismic resolution of 300 ft (91 m), and are interpreted to be interdune areas (Ajdukiewicz et al. 2010). Although post-depositional sediment compaction, structuring, and salt tectonics have distorted the original dune configuration, Story (1998) notes that overlying Smackover and lower Haynesville carbonates thin over Norphlet dune crests and thicken over interdune areas, indicating dune topography was present when the carbonates were deposited (Ajdukiewicz et al., 2010).
Whole core examination from wells drilled in the De Soto Canyon and Mississippi Canyon areas used in conjunction with the analysis of their associated well logs have established a dune type change in the aeolian deposits from the individual seif (longitudinal) and star dune setting in the north to an area with barchan (horned) dunes in a coalesced or erg type environment in the south (Figure 16) (Godo et al., 2011). In addition to the two sequences of barchan dunes (both sinuous and straight-crested forms), these core and log analyses also identified three additional large scale depositional intervals: 1) interbedded lacustrine mudrocks, 2) stacked aeolian sheetsand or sheetflood facies, and 3) mixed coastal sand sheets with some waterlain sabkha facies (Godo et al., 2011).
Figure 16. Aeolian dune type change from shallow-water to deepwater Norphlet.
29
Along with the change in dune geometry, the primary hydrocarbon associated with the play also changes. The gas with associated liquids in the shallow waters of the northern part of the play changes to oil with associated gas in the deeper water to the south. As of this study’s cutoff date, the Norphlet Play in the OCS waters contains 20 discovered pools. Sixteen are associated with the shallow-water, gas-prone portion of the play, and four are in deepwater, with oil as the primary hydrocarbon. Discoveries in the deepwater oil portion of the play include Appomattox (Mississippi Canyon 392) and Vicksburg “B” (De Soto Canyon 353). Shell Offshore and their partners have submitted a preliminary development plan for the Appomattox-Vicksburg complex. The plan calls for 44 total wells to be drilled over a 10-year period starting in 2016 (4 exploratory, 24 development, and 16 pressure maintenance injectors).
Within the deepwater area, primary play risks found to date include the presence of a reservoir, reservoir quality, and hydrocarbon properties including the presence of asphaltenes, which can restrict hydrocarbon flow. Additional risks include timing (trap creation relative to hydrocarbon creation and expulsion) and trap seal (vertical and horizontal) for hydrocarbon preservation.
NON-ASSESSED PLAYS
Knowles Carbonate The Cotton Valley Group (Table 3) in Federal OCS waters consists of siliciclastics and carbonates
(“Knowles”) and ranges in age from Upper Jurassic (Tithonian) to Lower Cretaceous (Valanginian). Within the group, the Knowles Carbonate Play is composed of Tithonian/Berriasian ramps and Valanginian platforms. The Valanginian platforms cap the assessed Cotton Valley Clastic Play (Figure 13).
Carbonate development initiated along the Tithonian shelf edge. Reefs grew along the shelf edge into the Berriasian, while clastics were deposited in backreef shelf areas. Penecontemporaneously, clastics prograded beyond the Tithonian/Berriasian shelf edge extending the shelf seaward. Three carbonate platforms developed over the seaward prograding clastic wedge during the early Valanginian, with the uppermost platform extending 100 mi (161 km) landward of the shelf edge. This extensive marker was later subaerially exposed. The packstones and grainstones of the three platforms are separated by intra-platform gray shales and gray mudstones. Each ramp and platform is thicker along the prograding shelf edge and interfingers landward with delta plain clastics. Combined thickness of the carbonates ranges from 2,200 ft (670 m) at the shelf edge to zero over the Destin Anticline (Figure 4). Shoreward, carbonates have less-developed SP signatures in all inner ramps and platforms, reflecting a change from the better-developed SP outer ramp and platform bioclasts to less-developed SP inner ramp and platform mudstones (Finneran et al., 1984; Cregg and Ahr, 1983). The best development of the outer ramp and platform bioclasts is in the Viosca Knoll and western Destin Dome Areas (Figure 17).
There has been no production from the Knowles Carbonate Play in the Federal offshore. The nearest production to the OCS extends onshore from the southern Arkansas-northern Louisiana area to the southwestern edge of the East Texas Basin (Cregg and Ahr, 1983). Even though there are no commercial discoveries thus far in the Federal OCS, gas shows have been encountered (e.g., Main Pass block 154 well no. 1 and Viosca Knoll block 202 well no. 1). However, because it has been explored without significant volumes of oil and gas found, undiscovered resources were not assessed for the Knowles Carbonate Play. For a detailed discussion, see Petty (2008).
Tuscaloosa Marine Shale
The Tuscaloosa Marine Shale of southern Louisiana and Mississippi, along with the Eagle Ford and Woodbine Shales of southern Texas, is part of a trend of Upper Cretaceous shale units that trend parallel behind the Lower Cretaceous shelf edge. The Tuscaloosa Marine Shale extends into Federal waters in the Mobile and Viosca Knoll Protraction Areas (Figure 18). This marine shale is depositionally younger than the assessed sandstones in the Lower Tuscaloosa Play (Table 3 and Figure 8).
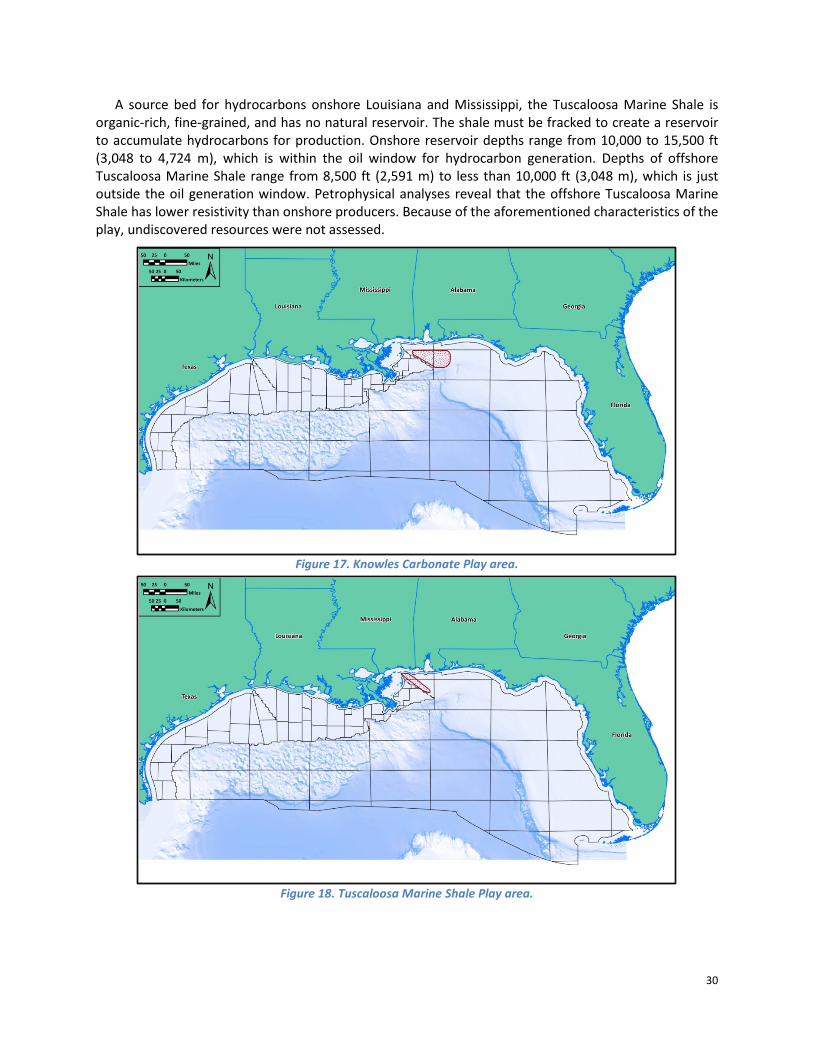
30
A source bed for hydrocarbons onshore Louisiana and Mississippi, the Tuscaloosa Marine Shale is organic-rich, fine-grained, and has no natural reservoir. The shale must be fracked to create a reservoir to accumulate hydrocarbons for production. Onshore reservoir depths range from 10,000 to 15,500 ft (3,048 to 4,724 m), which is within the oil window for hydrocarbon generation. Depths of offshore Tuscaloosa Marine Shale range from 8,500 ft (2,591 m) to less than 10,000 ft (3,048 m), which is just outside the oil generation window. Petrophysical analyses reveal that the offshore Tuscaloosa Marine Shale has lower resistivity than onshore producers. Because of the aforementioned characteristics of the play, undiscovered resources were not assessed.
Figure 17. Knowles Carbonate Play area.
Figure 18. Tuscaloosa Marine Shale Play area.
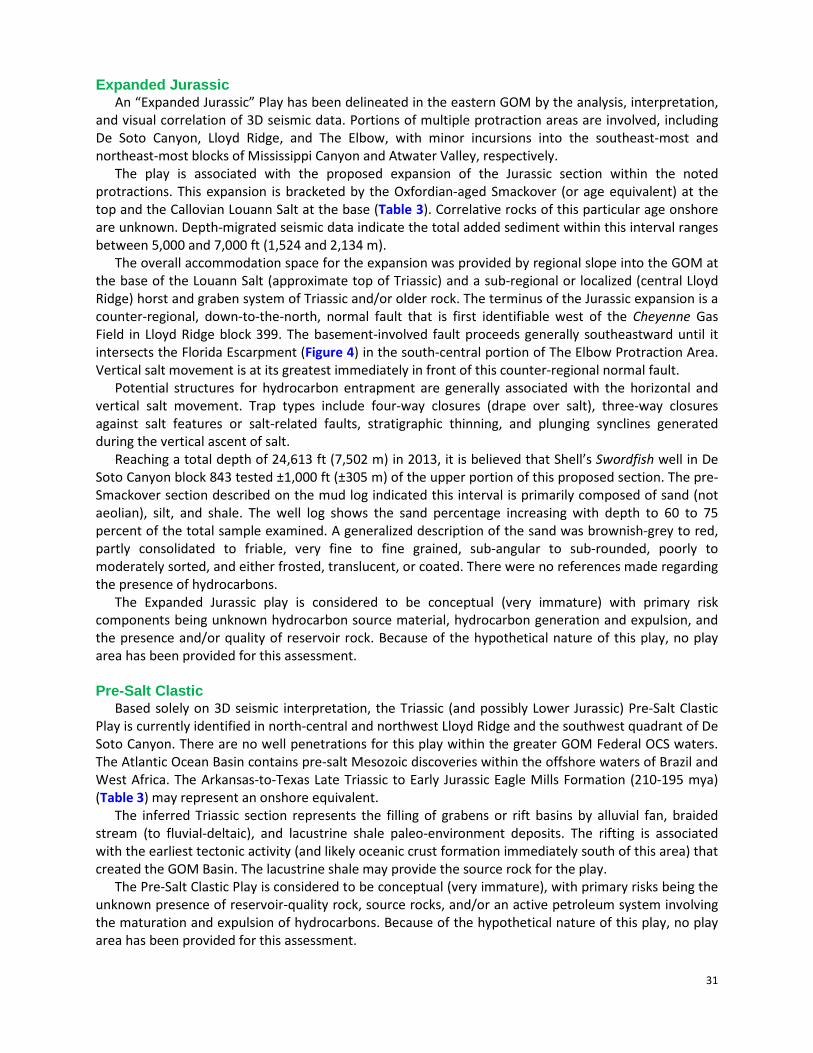
31
Expanded Jurassic An “Expanded Jurassic” Play has been delineated in the eastern GOM by the analysis, interpretation,
and visual correlation of 3D seismic data. Portions of multiple protraction areas are involved, including De Soto Canyon, Lloyd Ridge, and The Elbow, with minor incursions into the southeast-most and northeast-most blocks of Mississippi Canyon and Atwater Valley, respectively.
The play is associated with the proposed expansion of the Jurassic section within the noted protractions. This expansion is bracketed by the Oxfordian-aged Smackover (or age equivalent) at the top and the Callovian Louann Salt at the base (Table 3). Correlative rocks of this particular age onshore are unknown. Depth-migrated seismic data indicate the total added sediment within this interval ranges between 5,000 and 7,000 ft (1,524 and 2,134 m).
The overall accommodation space for the expansion was provided by regional slope into the GOM at the base of the Louann Salt (approximate top of Triassic) and a sub-regional or localized (central Lloyd Ridge) horst and graben system of Triassic and/or older rock. The terminus of the Jurassic expansion is a counter-regional, down-to-the-north, normal fault that is first identifiable west of the Cheyenne Gas Field in Lloyd Ridge block 399. The basement-involved fault proceeds generally southeastward until it intersects the Florida Escarpment (Figure 4) in the south-central portion of The Elbow Protraction Area. Vertical salt movement is at its greatest immediately in front of this counter-regional normal fault.
Potential structures for hydrocarbon entrapment are generally associated with the horizontal and vertical salt movement. Trap types include four-way closures (drape over salt), three-way closures against salt features or salt-related faults, stratigraphic thinning, and plunging synclines generated during the vertical ascent of salt.
Reaching a total depth of 24,613 ft (7,502 m) in 2013, it is believed that Shell’s Swordfish well in De Soto Canyon block 843 tested ±1,000 ft (±305 m) of the upper portion of this proposed section. The pre-Smackover section described on the mud log indicated this interval is primarily composed of sand (not aeolian), silt, and shale. The well log shows the sand percentage increasing with depth to 60 to 75 percent of the total sample examined. A generalized description of the sand was brownish-grey to red, partly consolidated to friable, very fine to fine grained, sub-angular to sub-rounded, poorly to moderately sorted, and either frosted, translucent, or coated. There were no references made regarding the presence of hydrocarbons.
The Expanded Jurassic play is considered to be conceptual (very immature) with primary risk components being unknown hydrocarbon source material, hydrocarbon generation and expulsion, and the presence and/or quality of reservoir rock. Because of the hypothetical nature of this play, no play area has been provided for this assessment.
Pre-Salt Clastic
Based solely on 3D seismic interpretation, the Triassic (and possibly Lower Jurassic) Pre-Salt Clastic Play is currently identified in north-central and northwest Lloyd Ridge and the southwest quadrant of De Soto Canyon. There are no well penetrations for this play within the greater GOM Federal OCS waters. The Atlantic Ocean Basin contains pre-salt Mesozoic discoveries within the offshore waters of Brazil and West Africa. The Arkansas-to-Texas Late Triassic to Early Jurassic Eagle Mills Formation (210-195 mya) (Table 3) may represent an onshore equivalent.
The inferred Triassic section represents the filling of grabens or rift basins by alluvial fan, braided stream (to fluvial-deltaic), and lacustrine shale paleo-environment deposits. The rifting is associated with the earliest tectonic activity (and likely oceanic crust formation immediately south of this area) that created the GOM Basin. The lacustrine shale may provide the source rock for the play.
The Pre-Salt Clastic Play is considered to be conceptual (very immature), with primary risks being the unknown presence of reservoir-quality rock, source rocks, and/or an active petroleum system involving the maturation and expulsion of hydrocarbons. Because of the hypothetical nature of this play, no play area has been provided for this assessment.
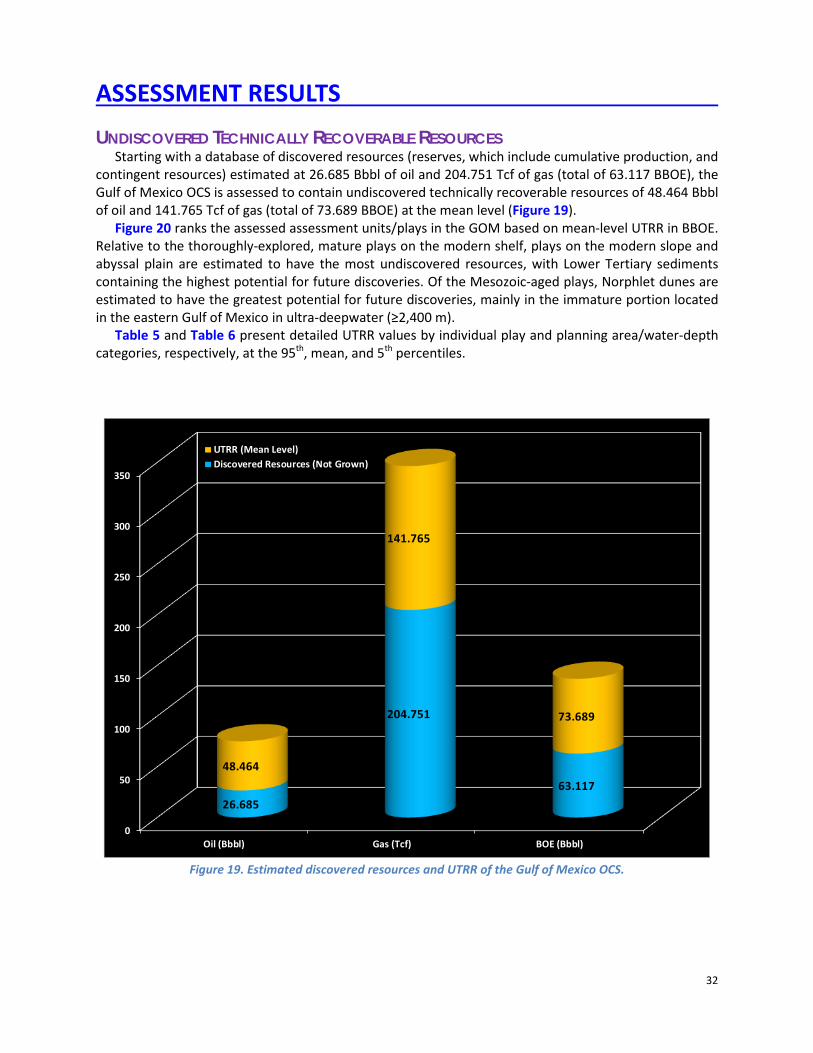
32
ASSESSMENT RESULTS
UNDISCOVERED TECHNICALLY RECOVERABLE RESOURCES Starting with a database of discovered resources (reserves, which include cumulative production, and
contingent resources) estimated at 26.685 Bbbl of oil and 204.751 Tcf of gas (total of 63.117 BBOE), the Gulf of Mexico OCS is assessed to contain undiscovered technically recoverable resources of 48.464 Bbbl of oil and 141.765 Tcf of gas (total of 73.689 BBOE) at the mean level (Figure 19).
Figure 20 ranks the assessed assessment units/plays in the GOM based on mean-level UTRR in BBOE. Relative to the thoroughly-explored, mature plays on the modern shelf, plays on the modern slope and abyssal plain are estimated to have the most undiscovered resources, with Lower Tertiary sediments containing the highest potential for future discoveries. Of the Mesozoic-aged plays, Norphlet dunes are estimated to have the greatest potential for future discoveries, mainly in the immature portion located in the eastern Gulf of Mexico in ultra-deepwater (≥2,400 m).
Table 5 and Table 6 present detailed UTRR values by individual play and planning area/water-depth categories, respectively, at the 95th, mean, and 5th percentiles.
0
50
100
150
200
250
300
350
Oil (Bbbl) Gas (Tcf) BOE (Bbbl)
26.685
204.751
63.11748.464
141.765
73.689
UTRR (Mean Level)Discovered Resources (Not Grown)
Figure 19. Estimated discovered resources and UTRR of the Gulf of Mexico OCS.
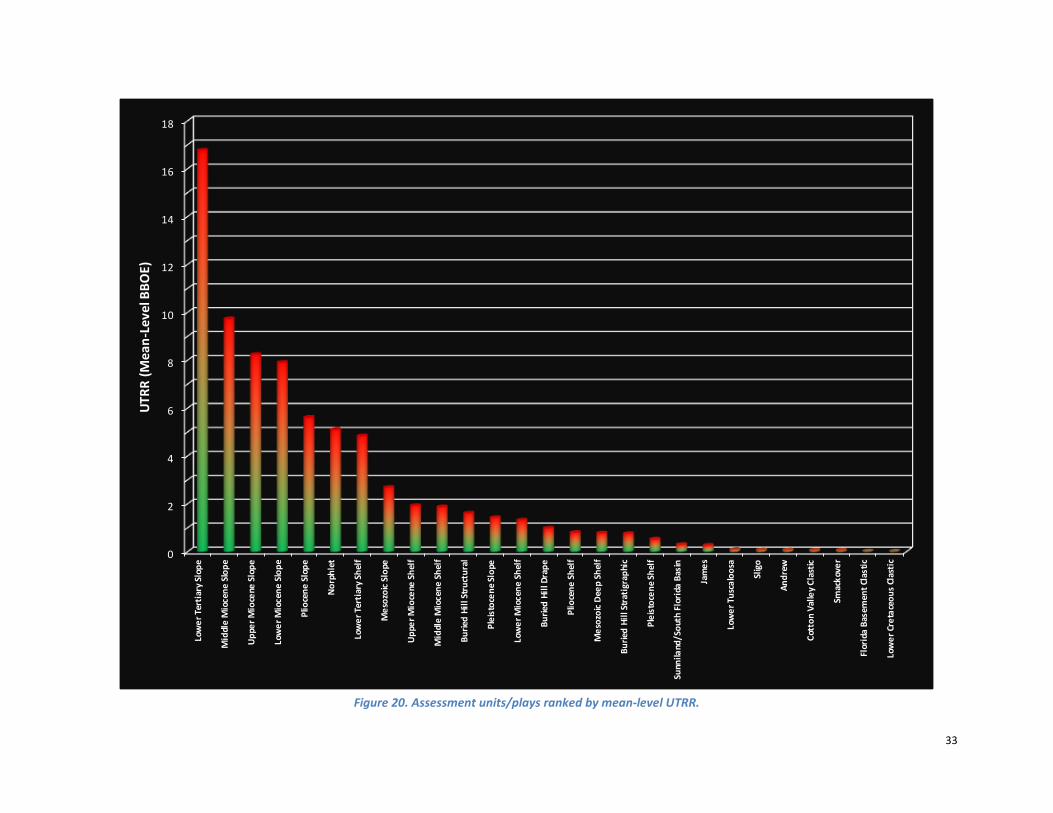
33
0
2
4
6
8
10
12
14
16
18
Low
er T
erti
ary
Slop
e
Mid
dle
Mio
cene
Slo
pe
Upp
er M
ioce
ne S
lope
Low
er M
ioce
ne S
lope
Plio
cene
Slo
pe
Nor
phle
t
Low
er T
erti
ary
Shel
f
Mes
ozoi
c Sl
ope
Upp
er M
ioce
ne S
helf
Mid
dle
Mio
cene
She
lf
Burie
d Hi
ll St
ruct
ural
Plei
stoc
ene
Slop
e
Low
er M
ioce
ne S
helf
Burie
d Hi
ll Dr
ape
Plio
cene
She
lf
Mes
ozoi
c D
eep
Shel
f
Burie
d Hi
ll St
rati
grap
hic
Plei
stoc
ene
Shel
f
Sunn
iland
/Sou
th F
lori
da B
asin
Jam
es
Low
er T
usca
loos
a
Slig
o
Andr
ew
Cott
on V
alle
y Cl
astic
Smac
kove
r
Flor
ida
Base
men
t Cla
stic
Low
er C
reta
ceou
s Cl
asti
c
UTRR
(Mea
n-Le
vel B
BOE)
Figure 20. Assessment units/plays ranked by mean-level UTRR.
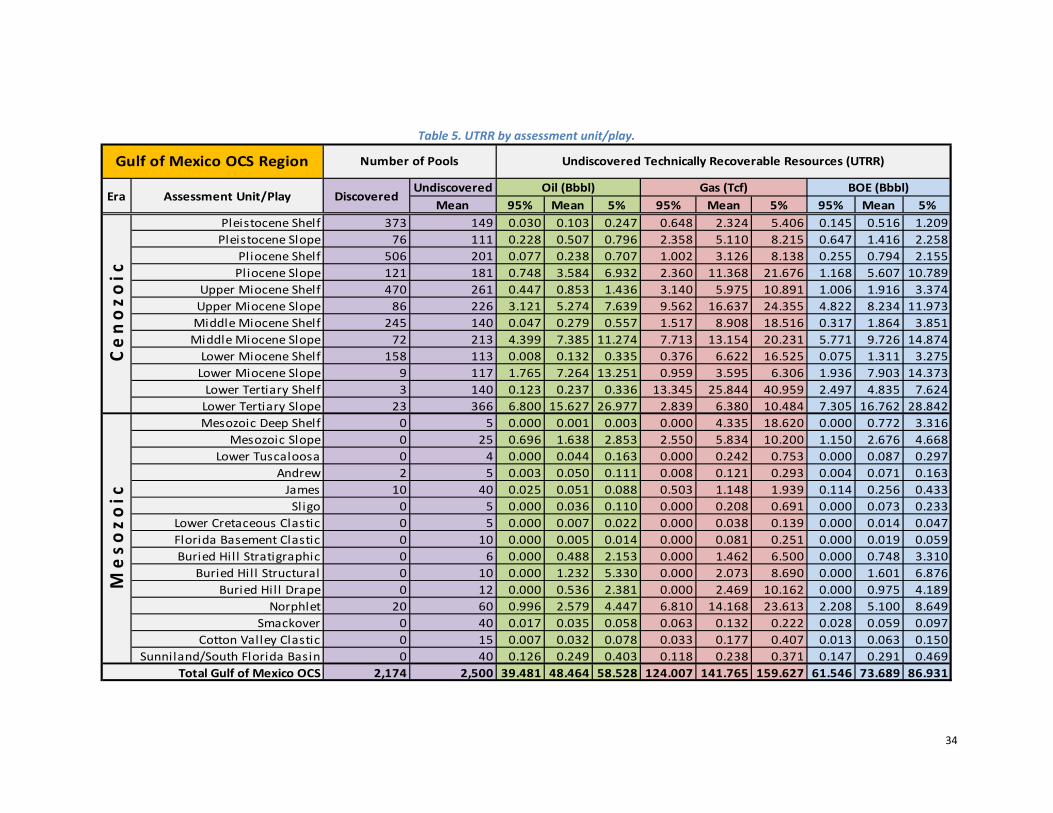
34
Table 5. UTRR by assessment unit/play.
UndiscoveredMean 95% Mean 5% 95% Mean 5% 95% Mean 5%
Pleistocene Shelf 373 149 0.030 0.103 0.247 0.648 2.324 5.406 0.145 0.516 1.209Pleistocene Slope 76 111 0.228 0.507 0.796 2.358 5.110 8.215 0.647 1.416 2.258
Pliocene Shelf 506 201 0.077 0.238 0.707 1.002 3.126 8.138 0.255 0.794 2.155Pliocene Slope 121 181 0.748 3.584 6.932 2.360 11.368 21.676 1.168 5.607 10.789
Upper Miocene Shelf 470 261 0.447 0.853 1.436 3.140 5.975 10.891 1.006 1.916 3.374Upper Miocene Slope 86 226 3.121 5.274 7.639 9.562 16.637 24.355 4.822 8.234 11.973
Middle Miocene Shelf 245 140 0.047 0.279 0.557 1.517 8.908 18.516 0.317 1.864 3.851Middle Miocene Slope 72 213 4.399 7.385 11.274 7.713 13.154 20.231 5.771 9.726 14.874
Lower Miocene Shelf 158 113 0.008 0.132 0.335 0.376 6.622 16.525 0.075 1.311 3.275Lower Miocene Slope 9 117 1.765 7.264 13.251 0.959 3.595 6.306 1.936 7.903 14.373
Lower Tertiary Shelf 3 140 0.123 0.237 0.336 13.345 25.844 40.959 2.497 4.835 7.624Lower Tertiary Slope 23 366 6.800 15.627 26.977 2.839 6.380 10.484 7.305 16.762 28.842Mesozoic Deep Shelf 0 5 0.000 0.001 0.003 0.000 4.335 18.620 0.000 0.772 3.316
Mesozoic Slope 0 25 0.696 1.638 2.853 2.550 5.834 10.200 1.150 2.676 4.668Lower Tuscaloosa 0 4 0.000 0.044 0.163 0.000 0.242 0.753 0.000 0.087 0.297
Andrew 2 5 0.003 0.050 0.111 0.008 0.121 0.293 0.004 0.071 0.163James 10 40 0.025 0.051 0.088 0.503 1.148 1.939 0.114 0.256 0.433
Sligo 0 5 0.000 0.036 0.110 0.000 0.208 0.691 0.000 0.073 0.233Lower Cretaceous Clastic 0 5 0.000 0.007 0.022 0.000 0.038 0.139 0.000 0.014 0.047Florida Basement Clastic 0 10 0.000 0.005 0.014 0.000 0.081 0.251 0.000 0.019 0.059Buried Hil l Stratigraphic 0 6 0.000 0.488 2.153 0.000 1.462 6.500 0.000 0.748 3.310
Buried Hil l Structural 0 10 0.000 1.232 5.330 0.000 2.073 8.690 0.000 1.601 6.876Buried Hil l Drape 0 12 0.000 0.536 2.381 0.000 2.469 10.162 0.000 0.975 4.189
Norphlet 20 60 0.996 2.579 4.447 6.810 14.168 23.613 2.208 5.100 8.649Smackover 0 40 0.017 0.035 0.058 0.063 0.132 0.222 0.028 0.059 0.097
Cotton Valley Clastic 0 15 0.007 0.032 0.078 0.033 0.177 0.407 0.013 0.063 0.150Sunniland/South Florida Basin 0 40 0.126 0.249 0.403 0.118 0.238 0.371 0.147 0.291 0.469
2,174 2,500 39.481 48.464 58.528 124.007 141.765 159.627 61.546 73.689 86.931Total Gulf of Mexico OCS
C e
n o
z o i c
M e
s o
z o i c
Era Assessment Unit/Play
Gulf of Mexico OCS Region
Discovered
Undiscovered Technically Recoverable Resources (UTRR)Number of Pools
Oil (Bbbl) Gas (Tcf) BOE (Bbbl)
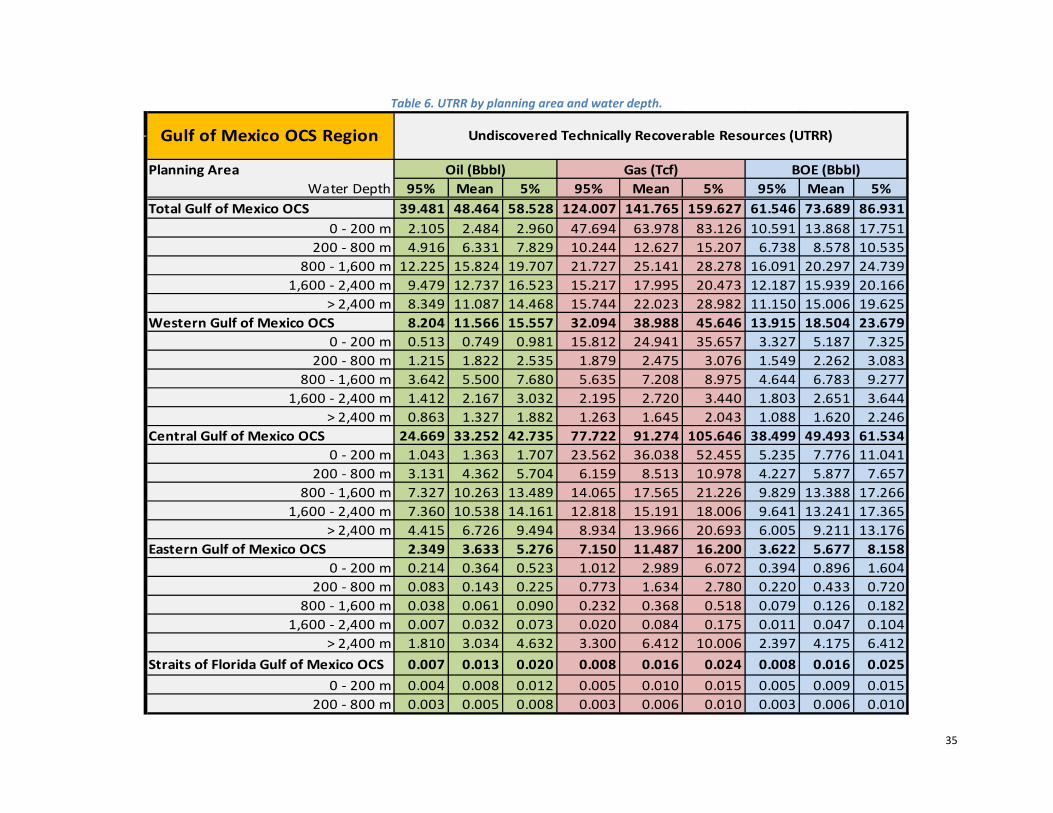
35
Table 6. UTRR by planning area and water depth.
Planning AreaWater Depth 95% Mean 5% 95% Mean 5% 95% Mean 5%
Total Gulf of Mexico OCS 39.481 48.464 58.528 124.007 141.765 159.627 61.546 73.689 86.9310 - 200 m 2.105 2.484 2.960 47.694 63.978 83.126 10.591 13.868 17.751
200 - 800 m 4.916 6.331 7.829 10.244 12.627 15.207 6.738 8.578 10.535800 - 1,600 m 12.225 15.824 19.707 21.727 25.141 28.278 16.091 20.297 24.739
1,600 - 2,400 m 9.479 12.737 16.523 15.217 17.995 20.473 12.187 15.939 20.166> 2,400 m 8.349 11.087 14.468 15.744 22.023 28.982 11.150 15.006 19.625
Western Gulf of Mexico OCS 8.204 11.566 15.557 32.094 38.988 45.646 13.915 18.504 23.6790 - 200 m 0.513 0.749 0.981 15.812 24.941 35.657 3.327 5.187 7.325
200 - 800 m 1.215 1.822 2.535 1.879 2.475 3.076 1.549 2.262 3.083800 - 1,600 m 3.642 5.500 7.680 5.635 7.208 8.975 4.644 6.783 9.277
1,600 - 2,400 m 1.412 2.167 3.032 2.195 2.720 3.440 1.803 2.651 3.644> 2,400 m 0.863 1.327 1.882 1.263 1.645 2.043 1.088 1.620 2.246
Central Gulf of Mexico OCS 24.669 33.252 42.735 77.722 91.274 105.646 38.499 49.493 61.5340 - 200 m 1.043 1.363 1.707 23.562 36.038 52.455 5.235 7.776 11.041
200 - 800 m 3.131 4.362 5.704 6.159 8.513 10.978 4.227 5.877 7.657800 - 1,600 m 7.327 10.263 13.489 14.065 17.565 21.226 9.829 13.388 17.266
1,600 - 2,400 m 7.360 10.538 14.161 12.818 15.191 18.006 9.641 13.241 17.365> 2,400 m 4.415 6.726 9.494 8.934 13.966 20.693 6.005 9.211 13.176
Eastern Gulf of Mexico OCS 2.349 3.633 5.276 7.150 11.487 16.200 3.622 5.677 8.1580 - 200 m 0.214 0.364 0.523 1.012 2.989 6.072 0.394 0.896 1.604
200 - 800 m 0.083 0.143 0.225 0.773 1.634 2.780 0.220 0.433 0.720800 - 1,600 m 0.038 0.061 0.090 0.232 0.368 0.518 0.079 0.126 0.182
1,600 - 2,400 m 0.007 0.032 0.073 0.020 0.084 0.175 0.011 0.047 0.104> 2,400 m 1.810 3.034 4.632 3.300 6.412 10.006 2.397 4.175 6.412
Straits of Florida Gulf of Mexico OCS 0.007 0.013 0.020 0.008 0.016 0.024 0.008 0.016 0.0250 - 200 m 0.004 0.008 0.012 0.005 0.010 0.015 0.005 0.009 0.015
200 - 800 m 0.003 0.005 0.008 0.003 0.006 0.010 0.003 0.006 0.010
Undiscovered Technically Recoverable Resources (UTRR)
Oil (Bbbl) Gas (Tcf) BOE (Bbbl)
Gulf of Mexico OCS Region
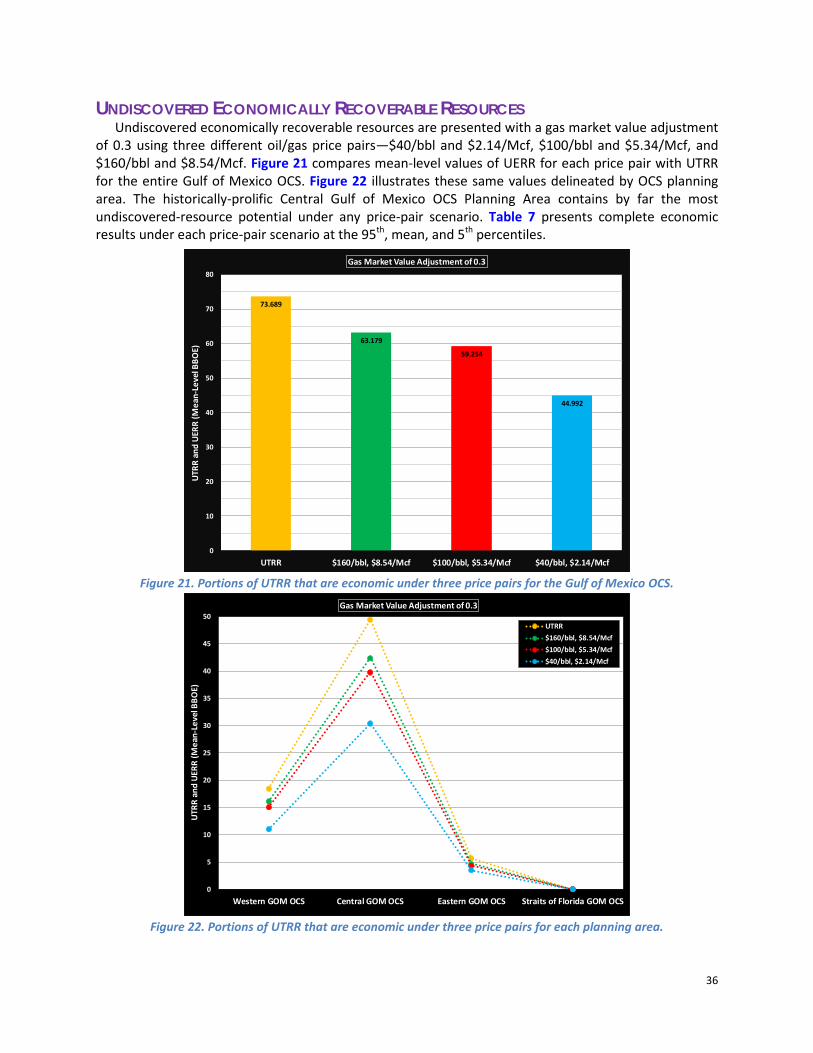
36
UNDISCOVERED ECONOMICALLY RECOVERABLE RESOURCES Undiscovered economically recoverable resources are presented with a gas market value adjustment
of 0.3 using three different oil/gas price pairs—$40/bbl and $2.14/Mcf, $100/bbl and $5.34/Mcf, and $160/bbl and $8.54/Mcf. Figure 21 compares mean-level values of UERR for each price pair with UTRR for the entire Gulf of Mexico OCS. Figure 22 illustrates these same values delineated by OCS planning area. The historically-prolific Central Gulf of Mexico OCS Planning Area contains by far the most undiscovered-resource potential under any price-pair scenario. Table 7 presents complete economic results under each price-pair scenario at the 95th, mean, and 5th percentiles.
73.689
63.179
59.254
44.992
0
10
20
30
40
50
60
70
80
UTRR $160/bbl, $8.54/Mcf $100/bbl, $5.34/Mcf $40/bbl, $2.14/Mcf
UTRR
and
UER
R (M
ean-
Leve
l BBO
E)
Gas Market Value Adjustment of 0.3
Figure 21. Portions of UTRR that are economic under three price pairs for the Gulf of Mexico OCS.
0
5
10
15
20
25
30
35
40
45
50
Western GOM OCS Central GOM OCS Eastern GOM OCS Straits of Florida GOM OCS
UTRR
and
UER
R (M
ean-
Leve
l BBO
E)
Gas Market Value Adjustment of 0.3
UTRR$160/bbl, $8.54/Mcf$100/bbl, $5.34/Mcf$40/bbl, $2.14/Mcf
Figure 22. Portions of UTRR that are economic under three price pairs for each planning area.
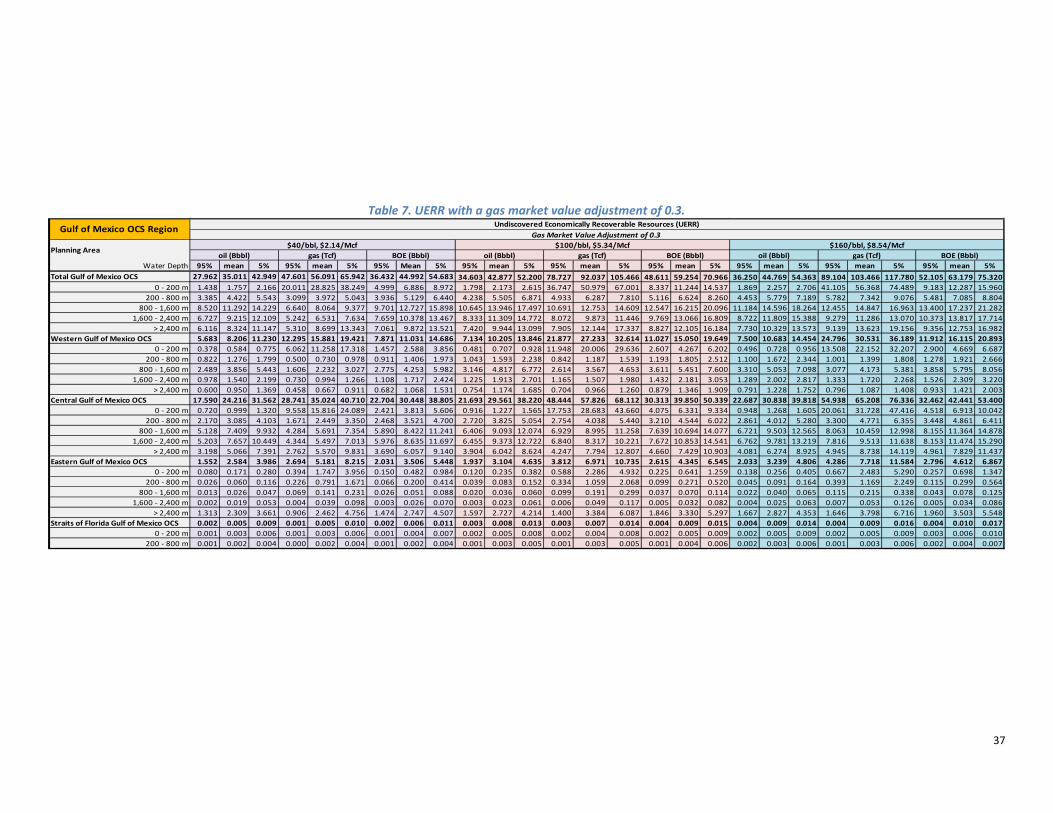
37
Table 7. UERR with a gas market value adjustment of 0.3.
Water Depth 95% mean 5% 95% mean 5% 95% Mean 5% 95% mean 5% 95% mean 5% 95% mean 5% 95% mean 5% 95% mean 5% 95% mean 5%Total Gulf of Mexico OCS 27.962 35.011 42.949 47.601 56.091 65.942 36.432 44.992 54.683 34.603 42.877 52.200 78.727 92.037 105.466 48.611 59.254 70.966 36.250 44.769 54.363 89.104 103.466 117.780 52.105 63.179 75.320
0 - 200 m 1.438 1.757 2.166 20.011 28.825 38.249 4.999 6.886 8.972 1.798 2.173 2.615 36.747 50.979 67.001 8.337 11.244 14.537 1.869 2.257 2.706 41.105 56.368 74.489 9.183 12.287 15.960200 - 800 m 3.385 4.422 5.543 3.099 3.972 5.043 3.936 5.129 6.440 4.238 5.505 6.871 4.933 6.287 7.810 5.116 6.624 8.260 4.453 5.779 7.189 5.782 7.342 9.076 5.481 7.085 8.804
800 - 1,600 m 8.520 11.292 14.229 6.640 8.064 9.377 9.701 12.727 15.898 10.645 13.946 17.497 10.691 12.753 14.609 12.547 16.215 20.096 11.184 14.596 18.264 12.455 14.847 16.963 13.400 17.237 21.2821,600 - 2,400 m 6.727 9.215 12.109 5.242 6.531 7.634 7.659 10.378 13.467 8.333 11.309 14.772 8.072 9.873 11.446 9.769 13.066 16.809 8.722 11.809 15.388 9.279 11.286 13.070 10.373 13.817 17.714
> 2,400 m 6.116 8.324 11.147 5.310 8.699 13.343 7.061 9.872 13.521 7.420 9.944 13.099 7.905 12.144 17.337 8.827 12.105 16.184 7.730 10.329 13.573 9.139 13.623 19.156 9.356 12.753 16.982Western Gulf of Mexico OCS 5.683 8.206 11.230 12.295 15.881 19.421 7.871 11.031 14.686 7.134 10.205 13.846 21.877 27.233 32.614 11.027 15.050 19.649 7.500 10.683 14.454 24.796 30.531 36.189 11.912 16.115 20.893
0 - 200 m 0.378 0.584 0.775 6.062 11.258 17.318 1.457 2.588 3.856 0.481 0.707 0.928 11.948 20.006 29.636 2.607 4.267 6.202 0.496 0.728 0.956 13.508 22.152 32.207 2.900 4.669 6.687200 - 800 m 0.822 1.276 1.799 0.500 0.730 0.978 0.911 1.406 1.973 1.043 1.593 2.238 0.842 1.187 1.539 1.193 1.805 2.512 1.100 1.672 2.344 1.001 1.399 1.808 1.278 1.921 2.666
800 - 1,600 m 2.489 3.856 5.443 1.606 2.232 3.027 2.775 4.253 5.982 3.146 4.817 6.772 2.614 3.567 4.653 3.611 5.451 7.600 3.310 5.053 7.098 3.077 4.173 5.381 3.858 5.795 8.0561,600 - 2,400 m 0.978 1.540 2.199 0.730 0.994 1.266 1.108 1.717 2.424 1.225 1.913 2.701 1.165 1.507 1.980 1.432 2.181 3.053 1.289 2.002 2.817 1.333 1.720 2.268 1.526 2.309 3.220
> 2,400 m 0.600 0.950 1.369 0.458 0.667 0.911 0.682 1.068 1.531 0.754 1.174 1.685 0.704 0.966 1.260 0.879 1.346 1.909 0.791 1.228 1.752 0.796 1.087 1.408 0.933 1.421 2.003Central Gulf of Mexico OCS 17.590 24.216 31.562 28.741 35.024 40.710 22.704 30.448 38.805 21.693 29.561 38.220 48.444 57.826 68.112 30.313 39.850 50.339 22.687 30.838 39.818 54.938 65.208 76.336 32.462 42.441 53.400
0 - 200 m 0.720 0.999 1.320 9.558 15.816 24.089 2.421 3.813 5.606 0.916 1.227 1.565 17.753 28.683 43.660 4.075 6.331 9.334 0.948 1.268 1.605 20.061 31.728 47.416 4.518 6.913 10.042200 - 800 m 2.170 3.085 4.103 1.671 2.449 3.350 2.468 3.521 4.700 2.720 3.825 5.054 2.754 4.038 5.440 3.210 4.544 6.022 2.861 4.012 5.280 3.300 4.771 6.355 3.448 4.861 6.411
800 - 1,600 m 5.128 7.409 9.932 4.284 5.691 7.354 5.890 8.422 11.241 6.406 9.093 12.074 6.929 8.995 11.258 7.639 10.694 14.077 6.721 9.503 12.565 8.063 10.459 12.998 8.155 11.364 14.8781,600 - 2,400 m 5.203 7.657 10.449 4.344 5.497 7.013 5.976 8.635 11.697 6.455 9.373 12.722 6.840 8.317 10.221 7.672 10.853 14.541 6.762 9.781 13.219 7.816 9.513 11.638 8.153 11.474 15.290
> 2,400 m 3.198 5.066 7.391 2.762 5.570 9.831 3.690 6.057 9.140 3.904 6.042 8.624 4.247 7.794 12.807 4.660 7.429 10.903 4.081 6.274 8.925 4.945 8.738 14.119 4.961 7.829 11.437Eastern Gulf of Mexico OCS 1.552 2.584 3.986 2.694 5.181 8.215 2.031 3.506 5.448 1.937 3.104 4.635 3.812 6.971 10.735 2.615 4.345 6.545 2.033 3.239 4.806 4.286 7.718 11.584 2.796 4.612 6.867
0 - 200 m 0.080 0.171 0.280 0.394 1.747 3.956 0.150 0.482 0.984 0.120 0.235 0.382 0.588 2.286 4.932 0.225 0.641 1.259 0.138 0.256 0.405 0.667 2.483 5.290 0.257 0.698 1.347200 - 800 m 0.026 0.060 0.116 0.226 0.791 1.671 0.066 0.200 0.414 0.039 0.083 0.152 0.334 1.059 2.068 0.099 0.271 0.520 0.045 0.091 0.164 0.393 1.169 2.249 0.115 0.299 0.564
800 - 1,600 m 0.013 0.026 0.047 0.069 0.141 0.231 0.026 0.051 0.088 0.020 0.036 0.060 0.099 0.191 0.299 0.037 0.070 0.114 0.022 0.040 0.065 0.115 0.215 0.338 0.043 0.078 0.1251,600 - 2,400 m 0.002 0.019 0.053 0.004 0.039 0.098 0.003 0.026 0.070 0.003 0.023 0.061 0.006 0.049 0.117 0.005 0.032 0.082 0.004 0.025 0.063 0.007 0.053 0.126 0.005 0.034 0.086
> 2,400 m 1.313 2.309 3.661 0.906 2.462 4.756 1.474 2.747 4.507 1.597 2.727 4.214 1.400 3.384 6.087 1.846 3.330 5.297 1.667 2.827 4.353 1.646 3.798 6.716 1.960 3.503 5.548Straits of Florida Gulf of Mexico OCS 0.002 0.005 0.009 0.001 0.005 0.010 0.002 0.006 0.011 0.003 0.008 0.013 0.003 0.007 0.014 0.004 0.009 0.015 0.004 0.009 0.014 0.004 0.009 0.016 0.004 0.010 0.017
0 - 200 m 0.001 0.003 0.006 0.001 0.003 0.006 0.001 0.004 0.007 0.002 0.005 0.008 0.002 0.004 0.008 0.002 0.005 0.009 0.002 0.005 0.009 0.002 0.005 0.009 0.003 0.006 0.010200 - 800 m 0.001 0.002 0.004 0.000 0.002 0.004 0.001 0.002 0.004 0.001 0.003 0.005 0.001 0.003 0.005 0.001 0.004 0.006 0.002 0.003 0.006 0.001 0.003 0.006 0.002 0.004 0.007
BOE (Bbbl)
Gulf of Mexico OCS Region Undiscovered Economically Recoverable Resources (UERR) Gas Market Value Adjustment of 0.3
Planning Area $40/bbl, $2.14/Mcf $100/bbl, $5.34/Mcf $160/bbl, $8.54/Mcfoil (Bbbl) gas (Tcf) BOE (Bbbl) oil (Bbbl) gas (Tcf) BOE (Bbbl) oil (Bbbl) gas (Tcf)
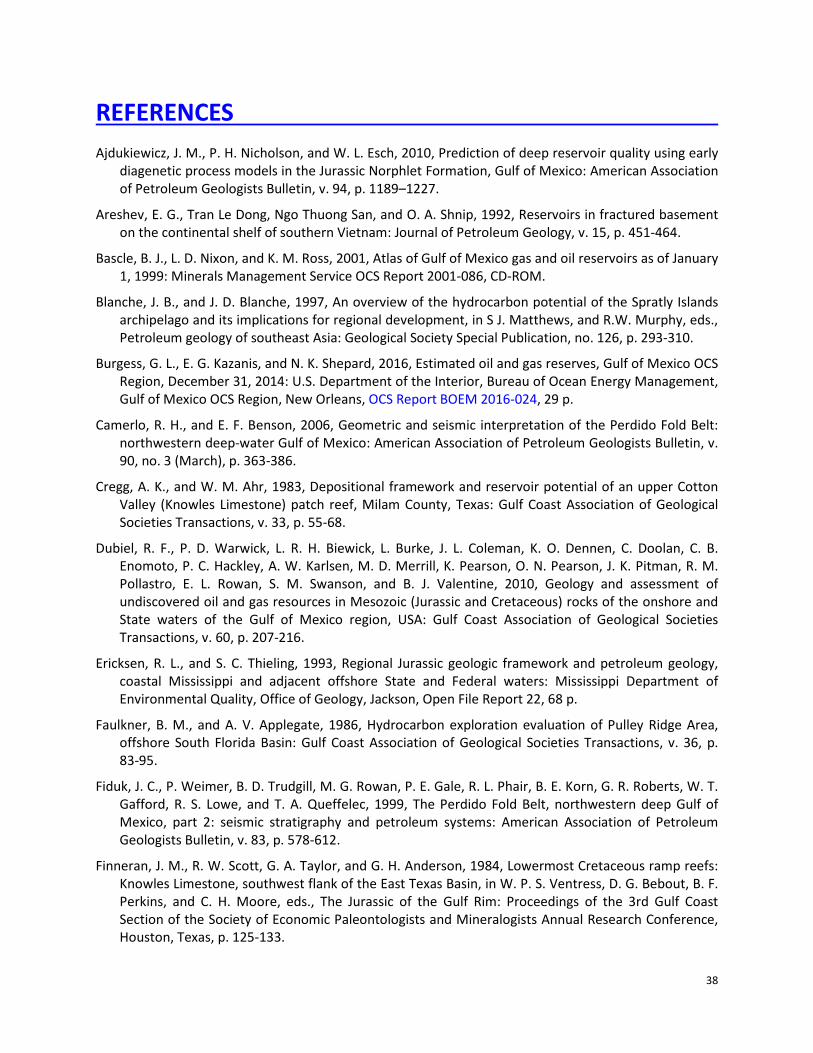
38
REFERENCES Ajdukiewicz, J. M., P. H. Nicholson, and W. L. Esch, 2010, Prediction of deep reservoir quality using early
diagenetic process models in the Jurassic Norphlet Formation, Gulf of Mexico: American Association of Petroleum Geologists Bulletin, v. 94, p. 1189–1227.
Areshev, E. G., Tran Le Dong, Ngo Thuong San, and O. A. Shnip, 1992, Reservoirs in fractured basement on the continental shelf of southern Vietnam: Journal of Petroleum Geology, v. 15, p. 451-464.
Bascle, B. J., L. D. Nixon, and K. M. Ross, 2001, Atlas of Gulf of Mexico gas and oil reservoirs as of January 1, 1999: Minerals Management Service OCS Report 2001-086, CD-ROM.
Blanche, J. B., and J. D. Blanche, 1997, An overview of the hydrocarbon potential of the Spratly Islands archipelago and its implications for regional development, in S J. Matthews, and R.W. Murphy, eds., Petroleum geology of southeast Asia: Geological Society Special Publication, no. 126, p. 293-310.
Burgess, G. L., E. G. Kazanis, and N. K. Shepard, 2016, Estimated oil and gas reserves, Gulf of Mexico OCS Region, December 31, 2014: U.S. Department of the Interior, Bureau of Ocean Energy Management, Gulf of Mexico OCS Region, New Orleans, OCS Report BOEM 2016-024, 29 p.
Camerlo, R. H., and E. F. Benson, 2006, Geometric and seismic interpretation of the Perdido Fold Belt: northwestern deep-water Gulf of Mexico: American Association of Petroleum Geologists Bulletin, v. 90, no. 3 (March), p. 363-386.
Cregg, A. K., and W. M. Ahr, 1983, Depositional framework and reservoir potential of an upper Cotton Valley (Knowles Limestone) patch reef, Milam County, Texas: Gulf Coast Association of Geological Societies Transactions, v. 33, p. 55-68.
Dubiel, R. F., P. D. Warwick, L. R. H. Biewick, L. Burke, J. L. Coleman, K. O. Dennen, C. Doolan, C. B. Enomoto, P. C. Hackley, A. W. Karlsen, M. D. Merrill, K. Pearson, O. N. Pearson, J. K. Pitman, R. M. Pollastro, E. L. Rowan, S. M. Swanson, and B. J. Valentine, 2010, Geology and assessment of undiscovered oil and gas resources in Mesozoic (Jurassic and Cretaceous) rocks of the onshore and State waters of the Gulf of Mexico region, USA: Gulf Coast Association of Geological Societies Transactions, v. 60, p. 207-216.
Ericksen, R. L., and S. C. Thieling, 1993, Regional Jurassic geologic framework and petroleum geology, coastal Mississippi and adjacent offshore State and Federal waters: Mississippi Department of Environmental Quality, Office of Geology, Jackson, Open File Report 22, 68 p.
Faulkner, B. M., and A. V. Applegate, 1986, Hydrocarbon exploration evaluation of Pulley Ridge Area, offshore South Florida Basin: Gulf Coast Association of Geological Societies Transactions, v. 36, p. 83-95.
Fiduk, J. C., P. Weimer, B. D. Trudgill, M. G. Rowan, P. E. Gale, R. L. Phair, B. E. Korn, G. R. Roberts, W. T. Gafford, R. S. Lowe, and T. A. Queffelec, 1999, The Perdido Fold Belt, northwestern deep Gulf of Mexico, part 2: seismic stratigraphy and petroleum systems: American Association of Petroleum Geologists Bulletin, v. 83, p. 578-612.
Finneran, J. M., R. W. Scott, G. A. Taylor, and G. H. Anderson, 1984, Lowermost Cretaceous ramp reefs: Knowles Limestone, southwest flank of the East Texas Basin, in W. P. S. Ventress, D. G. Bebout, B. F. Perkins, and C. H. Moore, eds., The Jurassic of the Gulf Rim: Proceedings of the 3rd Gulf Coast Section of the Society of Economic Paleontologists and Mineralogists Annual Research Conference, Houston, Texas, p. 125-133.
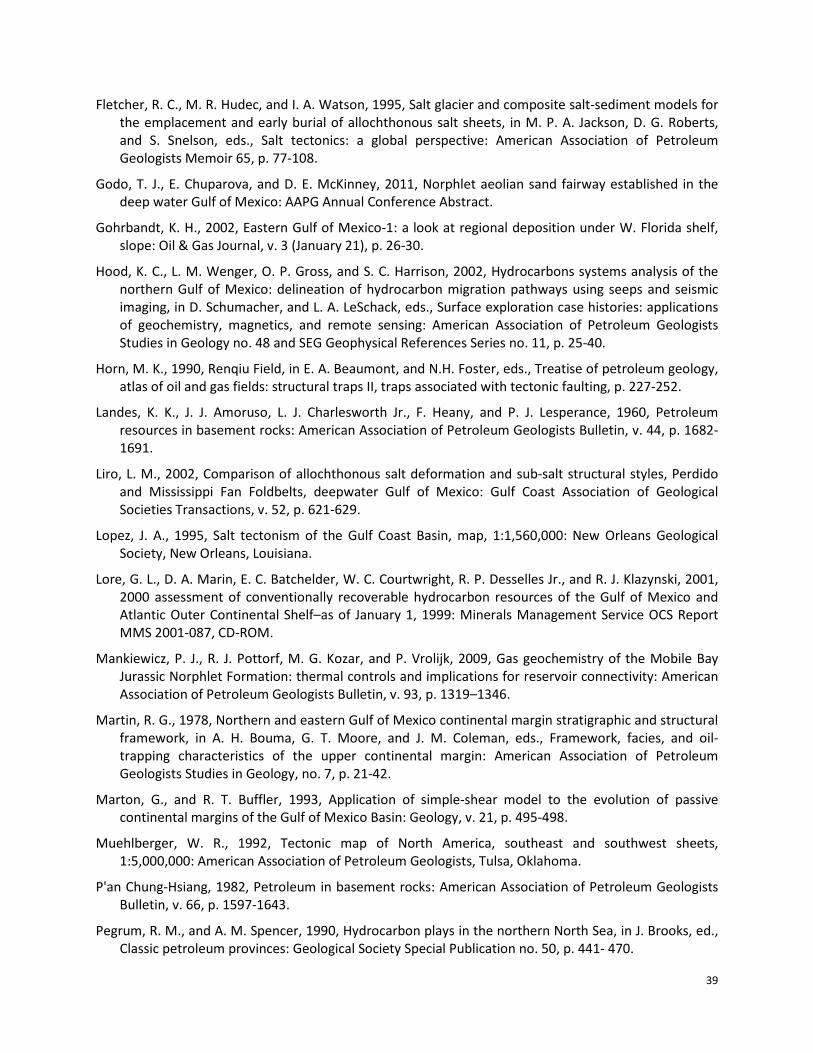
39
Fletcher, R. C., M. R. Hudec, and I. A. Watson, 1995, Salt glacier and composite salt-sediment models for the emplacement and early burial of allochthonous salt sheets, in M. P. A. Jackson, D. G. Roberts, and S. Snelson, eds., Salt tectonics: a global perspective: American Association of Petroleum Geologists Memoir 65, p. 77-108.
Godo, T. J., E. Chuparova, and D. E. McKinney, 2011, Norphlet aeolian sand fairway established in the deep water Gulf of Mexico: AAPG Annual Conference Abstract.
Gohrbandt, K. H., 2002, Eastern Gulf of Mexico-1: a look at regional deposition under W. Florida shelf, slope: Oil & Gas Journal, v. 3 (January 21), p. 26-30.
Hood, K. C., L. M. Wenger, O. P. Gross, and S. C. Harrison, 2002, Hydrocarbons systems analysis of the northern Gulf of Mexico: delineation of hydrocarbon migration pathways using seeps and seismic imaging, in D. Schumacher, and L. A. LeSchack, eds., Surface exploration case histories: applications of geochemistry, magnetics, and remote sensing: American Association of Petroleum Geologists Studies in Geology no. 48 and SEG Geophysical References Series no. 11, p. 25-40.
Horn, M. K., 1990, Renqiu Field, in E. A. Beaumont, and N.H. Foster, eds., Treatise of petroleum geology, atlas of oil and gas fields: structural traps II, traps associated with tectonic faulting, p. 227-252.
Landes, K. K., J. J. Amoruso, L. J. Charlesworth Jr., F. Heany, and P. J. Lesperance, 1960, Petroleum resources in basement rocks: American Association of Petroleum Geologists Bulletin, v. 44, p. 1682-1691.
Liro, L. M., 2002, Comparison of allochthonous salt deformation and sub-salt structural styles, Perdido and Mississippi Fan Foldbelts, deepwater Gulf of Mexico: Gulf Coast Association of Geological Societies Transactions, v. 52, p. 621-629.
Lopez, J. A., 1995, Salt tectonism of the Gulf Coast Basin, map, 1:1,560,000: New Orleans Geological Society, New Orleans, Louisiana.
Lore, G. L., D. A. Marin, E. C. Batchelder, W. C. Courtwright, R. P. Desselles Jr., and R. J. Klazynski, 2001, 2000 assessment of conventionally recoverable hydrocarbon resources of the Gulf of Mexico and Atlantic Outer Continental Shelf–as of January 1, 1999: Minerals Management Service OCS Report MMS 2001-087, CD-ROM.
Mankiewicz, P. J., R. J. Pottorf, M. G. Kozar, and P. Vrolijk, 2009, Gas geochemistry of the Mobile Bay Jurassic Norphlet Formation: thermal controls and implications for reservoir connectivity: American Association of Petroleum Geologists Bulletin, v. 93, p. 1319–1346.
Martin, R. G., 1978, Northern and eastern Gulf of Mexico continental margin stratigraphic and structural framework, in A. H. Bouma, G. T. Moore, and J. M. Coleman, eds., Framework, facies, and oil-trapping characteristics of the upper continental margin: American Association of Petroleum Geologists Studies in Geology, no. 7, p. 21-42.
Marton, G., and R. T. Buffler, 1993, Application of simple-shear model to the evolution of passive continental margins of the Gulf of Mexico Basin: Geology, v. 21, p. 495-498.
Muehlberger, W. R., 1992, Tectonic map of North America, southeast and southwest sheets, 1:5,000,000: American Association of Petroleum Geologists, Tulsa, Oklahoma.
P'an Chung-Hsiang, 1982, Petroleum in basement rocks: American Association of Petroleum Geologists Bulletin, v. 66, p. 1597-1643.
Pegrum, R. M., and A. M. Spencer, 1990, Hydrocarbon plays in the northern North Sea, in J. Brooks, ed., Classic petroleum provinces: Geological Society Special Publication no. 50, p. 441- 470.
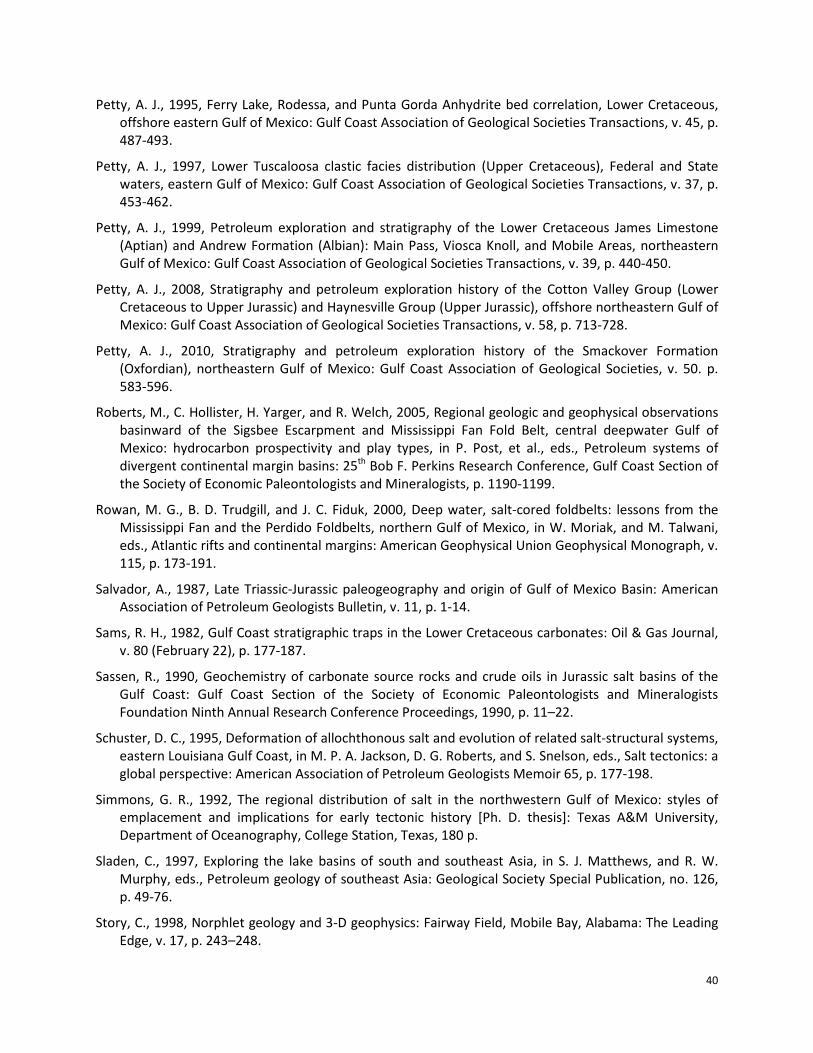
40
Petty, A. J., 1995, Ferry Lake, Rodessa, and Punta Gorda Anhydrite bed correlation, Lower Cretaceous, offshore eastern Gulf of Mexico: Gulf Coast Association of Geological Societies Transactions, v. 45, p. 487-493.
Petty, A. J., 1997, Lower Tuscaloosa clastic facies distribution (Upper Cretaceous), Federal and State waters, eastern Gulf of Mexico: Gulf Coast Association of Geological Societies Transactions, v. 37, p. 453-462.
Petty, A. J., 1999, Petroleum exploration and stratigraphy of the Lower Cretaceous James Limestone (Aptian) and Andrew Formation (Albian): Main Pass, Viosca Knoll, and Mobile Areas, northeastern Gulf of Mexico: Gulf Coast Association of Geological Societies Transactions, v. 39, p. 440-450.
Petty, A. J., 2008, Stratigraphy and petroleum exploration history of the Cotton Valley Group (Lower Cretaceous to Upper Jurassic) and Haynesville Group (Upper Jurassic), offshore northeastern Gulf of Mexico: Gulf Coast Association of Geological Societies Transactions, v. 58, p. 713-728.
Petty, A. J., 2010, Stratigraphy and petroleum exploration history of the Smackover Formation (Oxfordian), northeastern Gulf of Mexico: Gulf Coast Association of Geological Societies, v. 50. p. 583-596.
Roberts, M., C. Hollister, H. Yarger, and R. Welch, 2005, Regional geologic and geophysical observations basinward of the Sigsbee Escarpment and Mississippi Fan Fold Belt, central deepwater Gulf of Mexico: hydrocarbon prospectivity and play types, in P. Post, et al., eds., Petroleum systems of divergent continental margin basins: 25th Bob F. Perkins Research Conference, Gulf Coast Section of the Society of Economic Paleontologists and Mineralogists, p. 1190-1199.
Rowan, M. G., B. D. Trudgill, and J. C. Fiduk, 2000, Deep water, salt-cored foldbelts: lessons from the Mississippi Fan and the Perdido Foldbelts, northern Gulf of Mexico, in W. Moriak, and M. Talwani, eds., Atlantic rifts and continental margins: American Geophysical Union Geophysical Monograph, v. 115, p. 173-191.
Salvador, A., 1987, Late Triassic-Jurassic paleogeography and origin of Gulf of Mexico Basin: American Association of Petroleum Geologists Bulletin, v. 11, p. 1-14.
Sams, R. H., 1982, Gulf Coast stratigraphic traps in the Lower Cretaceous carbonates: Oil & Gas Journal, v. 80 (February 22), p. 177-187.
Sassen, R., 1990, Geochemistry of carbonate source rocks and crude oils in Jurassic salt basins of the Gulf Coast: Gulf Coast Section of the Society of Economic Paleontologists and Mineralogists Foundation Ninth Annual Research Conference Proceedings, 1990, p. 11–22.
Schuster, D. C., 1995, Deformation of allochthonous salt and evolution of related salt-structural systems, eastern Louisiana Gulf Coast, in M. P. A. Jackson, D. G. Roberts, and S. Snelson, eds., Salt tectonics: a global perspective: American Association of Petroleum Geologists Memoir 65, p. 177-198.
Simmons, G. R., 1992, The regional distribution of salt in the northwestern Gulf of Mexico: styles of emplacement and implications for early tectonic history [Ph. D. thesis]: Texas A&M University, Department of Oceanography, College Station, Texas, 180 p.
Sladen, C., 1997, Exploring the lake basins of south and southeast Asia, in S. J. Matthews, and R. W. Murphy, eds., Petroleum geology of southeast Asia: Geological Society Special Publication, no. 126, p. 49-76.
Story, C., 1998, Norphlet geology and 3-D geophysics: Fairway Field, Mobile Bay, Alabama: The Leading Edge, v. 17, p. 243–248.
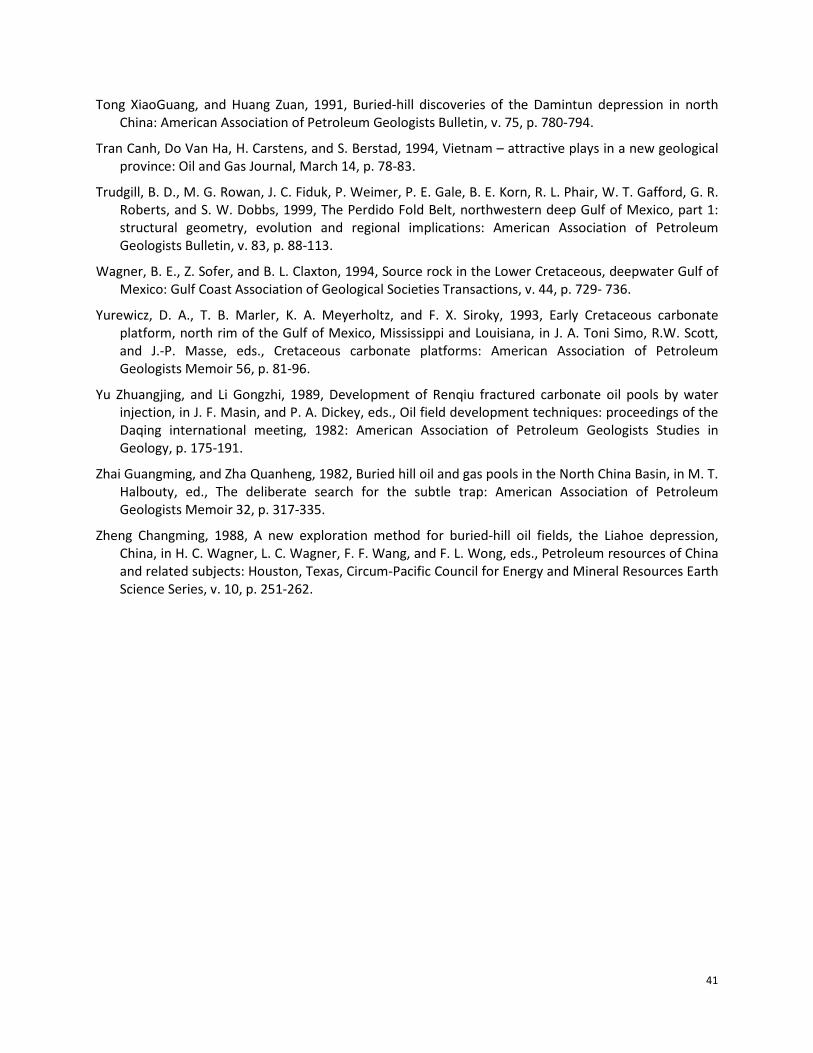
41
Tong XiaoGuang, and Huang Zuan, 1991, Buried-hill discoveries of the Damintun depression in north China: American Association of Petroleum Geologists Bulletin, v. 75, p. 780-794.
Tran Canh, Do Van Ha, H. Carstens, and S. Berstad, 1994, Vietnam – attractive plays in a new geological province: Oil and Gas Journal, March 14, p. 78-83.
Trudgill, B. D., M. G. Rowan, J. C. Fiduk, P. Weimer, P. E. Gale, B. E. Korn, R. L. Phair, W. T. Gafford, G. R. Roberts, and S. W. Dobbs, 1999, The Perdido Fold Belt, northwestern deep Gulf of Mexico, part 1: structural geometry, evolution and regional implications: American Association of Petroleum Geologists Bulletin, v. 83, p. 88-113.
Wagner, B. E., Z. Sofer, and B. L. Claxton, 1994, Source rock in the Lower Cretaceous, deepwater Gulf of Mexico: Gulf Coast Association of Geological Societies Transactions, v. 44, p. 729- 736.
Yurewicz, D. A., T. B. Marler, K. A. Meyerholtz, and F. X. Siroky, 1993, Early Cretaceous carbonate platform, north rim of the Gulf of Mexico, Mississippi and Louisiana, in J. A. Toni Simo, R.W. Scott, and J.-P. Masse, eds., Cretaceous carbonate platforms: American Association of Petroleum Geologists Memoir 56, p. 81-96.
Yu Zhuangjing, and Li Gongzhi, 1989, Development of Renqiu fractured carbonate oil pools by water injection, in J. F. Masin, and P. A. Dickey, eds., Oil field development techniques: proceedings of the Daqing international meeting, 1982: American Association of Petroleum Geologists Studies in Geology, p. 175-191.
Zhai Guangming, and Zha Quanheng, 1982, Buried hill oil and gas pools in the North China Basin, in M. T. Halbouty, ed., The deliberate search for the subtle trap: American Association of Petroleum Geologists Memoir 32, p. 317-335.
Zheng Changming, 1988, A new exploration method for buried-hill oil fields, the Liahoe depression, China, in H. C. Wagner, L. C. Wagner, F. F. Wang, and F. L. Wong, eds., Petroleum resources of China and related subjects: Houston, Texas, Circum-Pacific Council for Energy and Mineral Resources Earth Science Series, v. 10, p. 251-262.
42
GLOSSARY Assessment Unit: All reservoirs of a specific geologic age in a specified geographic area.
Shelf: An assessment unit in water depths less than 656 ft (<200 m). Synonymous with “shallow water” as used herein.
Slope: An assessment unit in water depths greater than or equal to 656 ft (≥200 m). Synonymous with “deepwater” as used herein.
Field: A producible accumulation of hydrocarbons consisting of a single or multiple reservoirs all related to the same geologic structure and/or stratigraphic condition. In general usage this term refers to a commercial accumulation.
Pool: A discovered or undiscovered hydrocarbon accumulation, typically within a single stratigraphic interval. As utilized in this report, it is the aggregation of all sands within a field that occur in the same play.
Sand: The aggregation of all fault-block portions (reservoirs) of an originally continuous sandstone body.
Reservoir: A subsurface, porous, permeable rock body in which an isolated accumulation of oil and/or gas has accumulated.
Play: A group of known and/or postulated pools that share common geologic, geographic, and temporal properties, such as history of hydrocarbon generation, migration, reservoir development, and entrapment.
Conceptual Play: A play hypothesized on the basis of subsurface geophysical data and regional geologic knowledge of the area. It is still a hypothesis, and the play concept has not been verified.
Established Play: A play in which hydrocarbons have been discovered in one or more pools for which reserves have been estimated.
Reserves Growth: The observed incremental increase through time in the volumetric estimates of hydrocarbons in an oil and/or gas field. It is that part of the discovered resources over and above estimated volumes that will be added to existing fields through extension, revision, improved recovery, and the addition of new reservoirs. Also referred to as reserves appreciation or field growth.
43
Resources: Concentrations in the earth’s crust of naturally occurring liquid or gaseous hydrocarbons that can conceivable by discovered and recovered. Normal usage encompasses both Discovered Resources and Undiscovered Resources.
Undiscovered Resources: Hydrocarbons postulated, on the basis of geologic knowledge and theory, to exist outside of known fields or accumulations (Table 1).
Undiscovered Technically Recoverable Resources (UTRR): Oil and gas that may be produced as a consequence of natural pressure, artificial lift, pressure maintenance, or other secondary recovery methods, but without any consideration of economic viability.
Undiscovered Economically Recoverable Resources (UERR): The portion of the Undiscovered Technically Recoverable Resources that is economically recoverable under imposed economic and technologic conditions.
Discovered Resources: Hydrocarbons in which the location and quantity are known or estimated from specific geologic evidence. Included are Reserves and Contingent Resources (Table 1) depending upon economic, technical, contractual, or regulatory criteria.
Reserves: Those quantities of petroleum anticipated to be commercially recoverable by application of development projects to known accumulations from a given date forward under defined conditions. Reserves must further satisfy four criteria: They must be discovered, recoverable, commercial, and remaining (as of a given date) based on the development project(s) applied. Reserves are further sub-classified based on economic certainty (Table 1).
Cumulative Production: The sum of all produced volumes of oil and gas prior to a specified date.
Contingent Resources: Those quantities of hydrocarbons estimated, as of a given date, to be potentially recoverable from known accumulations by application of development projects but which are not currently considered to be commercially recoverable due to one or more contingencies.
Department of the Interior (DOI)
As the Nation's principal conservation agency, the Department of the Interior has responsibility for most of our nationally owned public lands and natural resources. This includes fostering sound use of our land and water resources; protecting our fish, wildlife and biological diversity; preserving the environmental and cultural values of our national parks and historical places; and providing for the enjoyment of life through outdoor recreation. The Department assesses our energy and mineral resources and works to ensure that their development is in the best interests of all our people by encouraging stewardship and citizen participation in their care. The Department also has a major responsibility for American Indian reservation communities and for people who live in island communities.
Bureau of Ocean Energy Management (BOEM) The Bureau of Ocean Energy Management works to manage the exploration and development of the Nation's offshore resources in a way that appropriately balances economic development, energy independence, and environmental protection through oil and gas leases, renewable energy development, and environmental reviews and studies.