Embed Size (px)
Citation preview
OCN 623 – Chemical Oceanography
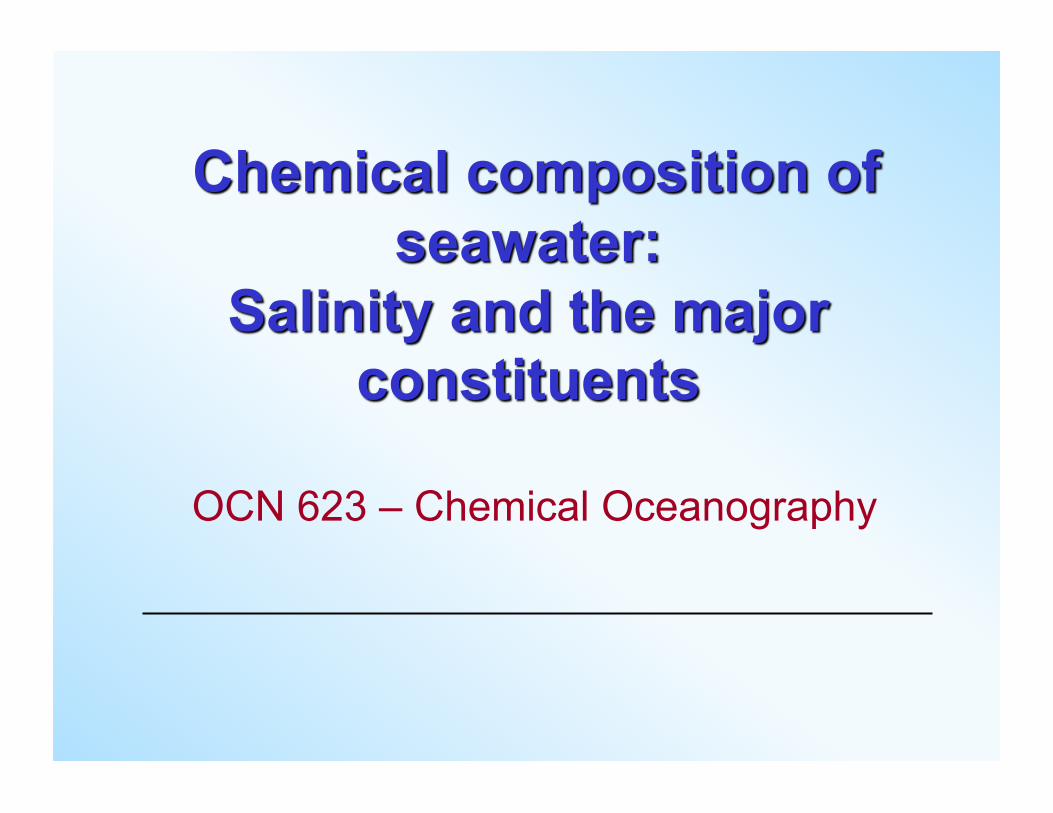
Salt dissolved in ocean water alters the properties of water
Freezing point of seawater is ~ -1.8˚C
Density continually increases to freezing point
(see Libes, Fig 2.10)
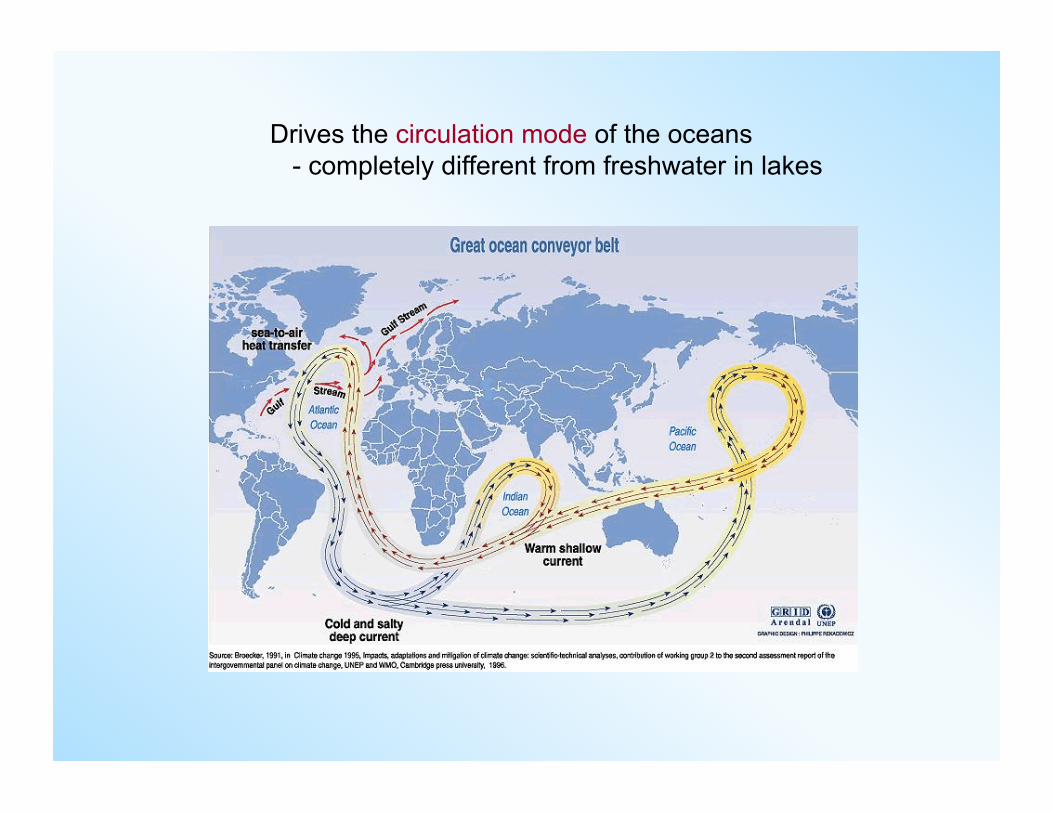
Drives the circulation mode of the oceans - completely different from freshwater in lakes
Outline • SI units
• Residence time
• Elements in seawater
• Measuring salinity • Marcet’s Principle
• Salinity variability
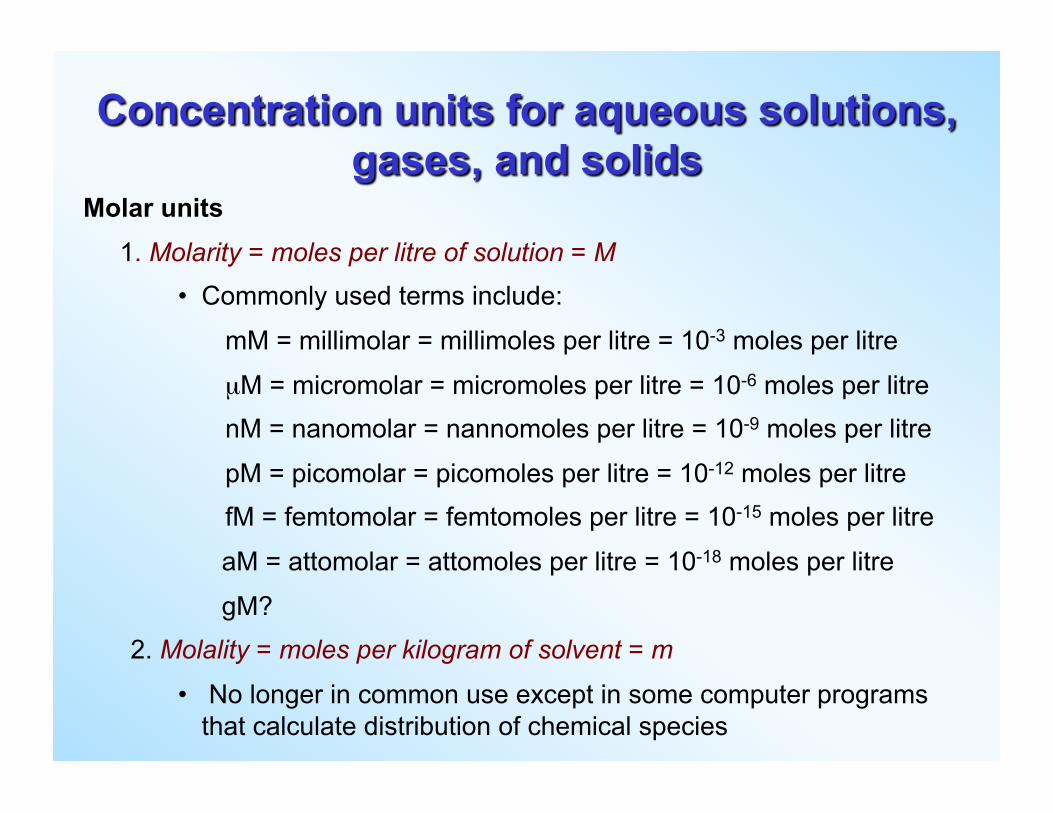
Molar units 1. Molarity = moles per litre of solution = M
• Commonly used terms include:
mM = millimolar = millimoles per litre = 10-3 moles per litre
µM = micromolar = micromoles per litre = 10-6 moles per litre nM = nanomolar = nannomoles per litre = 10-9 moles per litre
pM = picomolar = picomoles per litre = 10-12 moles per litre fM = femtomolar = femtomoles per litre = 10-15 moles per litre
aM = attomolar = attomoles per litre = 10-18 moles per litre
gM? 2. Molality = moles per kilogram of solvent = m
• No longer in common use except in some computer programs that calculate distribution of chemical species
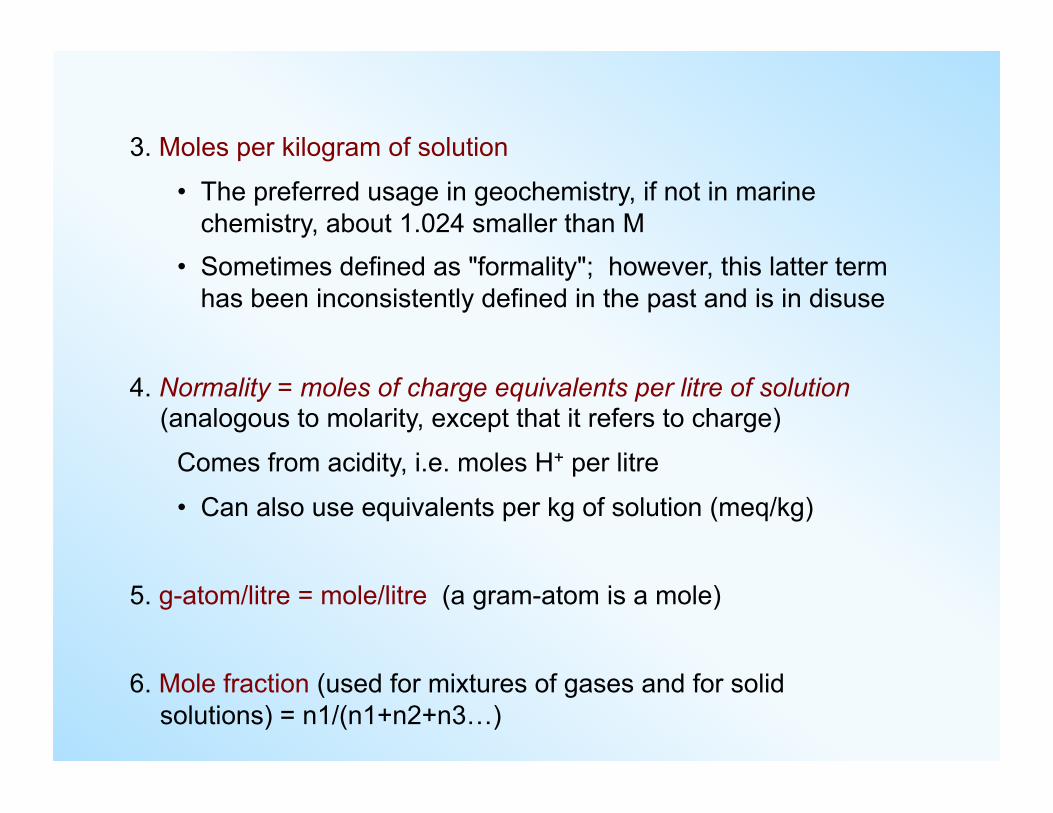
3. Moles per kilogram of solution
• The preferred usage in geochemistry, if not in marine chemistry, about 1.024 smaller than M
• Sometimes defined as "formality"; however, this latter term has been inconsistently defined in the past and is in disuse
4. Normality = moles of charge equivalents per litre of solution (analogous to molarity, except that it refers to charge)
Comes from acidity, i.e. moles H+ per litre
• Can also use equivalents per kg of solution (meq/kg)
5. g-atom/litre = mole/litre (a gram-atom is a mole)
6. Mole fraction (used for mixtures of gases and for solid solutions) = n1/(n1+n2+n3…)
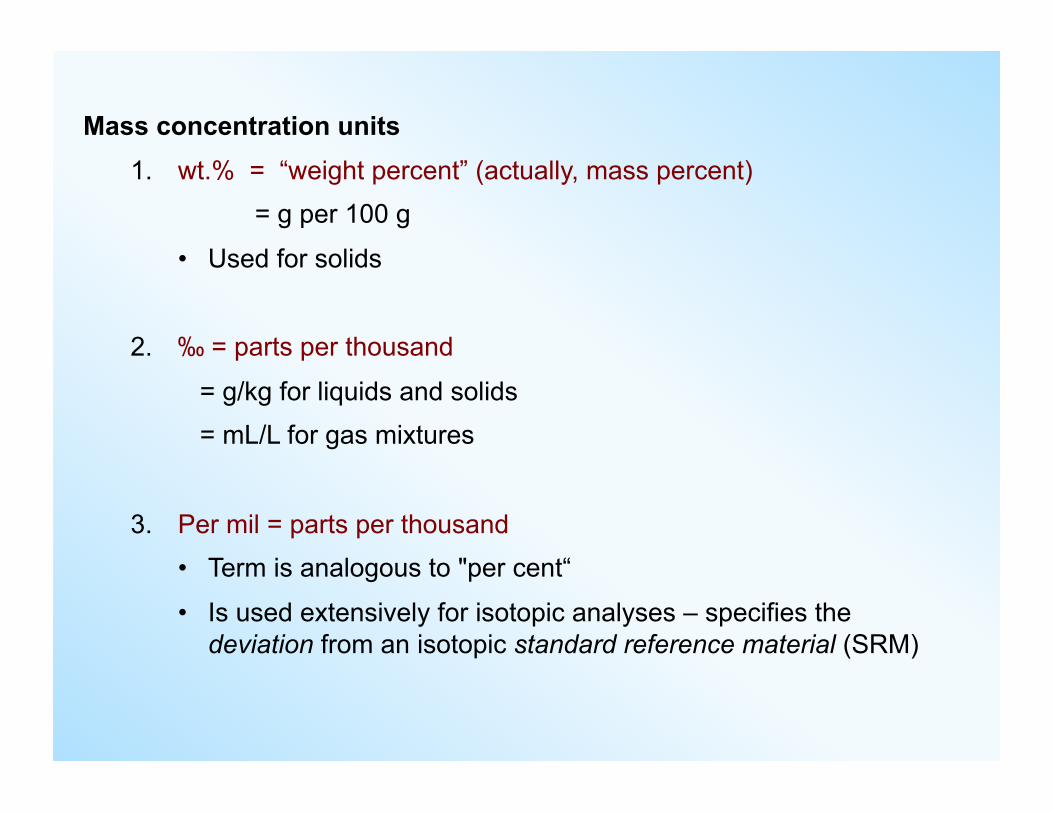
Mass concentration units 1. wt.% = “weight percent” (actually, mass percent) = g per 100 g
• Used for solids
2. ‰ = parts per thousand
= g/kg for liquids and solids = mL/L for gas mixtures
3. Per mil = parts per thousand • Term is analogous to "per cent“
• Is used extensively for isotopic analyses – specifies the deviation from an isotopic standard reference material (SRM)
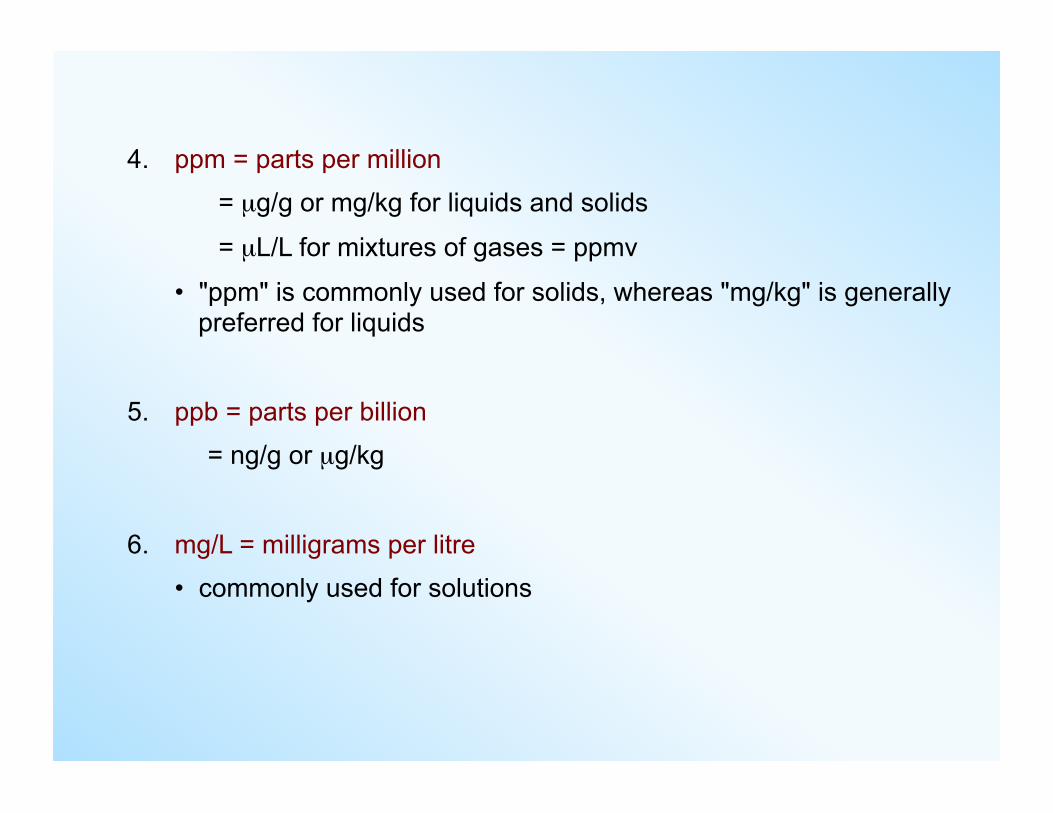
4. ppm = parts per million = µg/g or mg/kg for liquids and solids
= µL/L for mixtures of gases = ppmv
• "ppm" is commonly used for solids, whereas "mg/kg" is generally preferred for liquids
5. ppb = parts per billion = ng/g or µg/kg
6. mg/L = milligrams per litre • commonly used for solutions
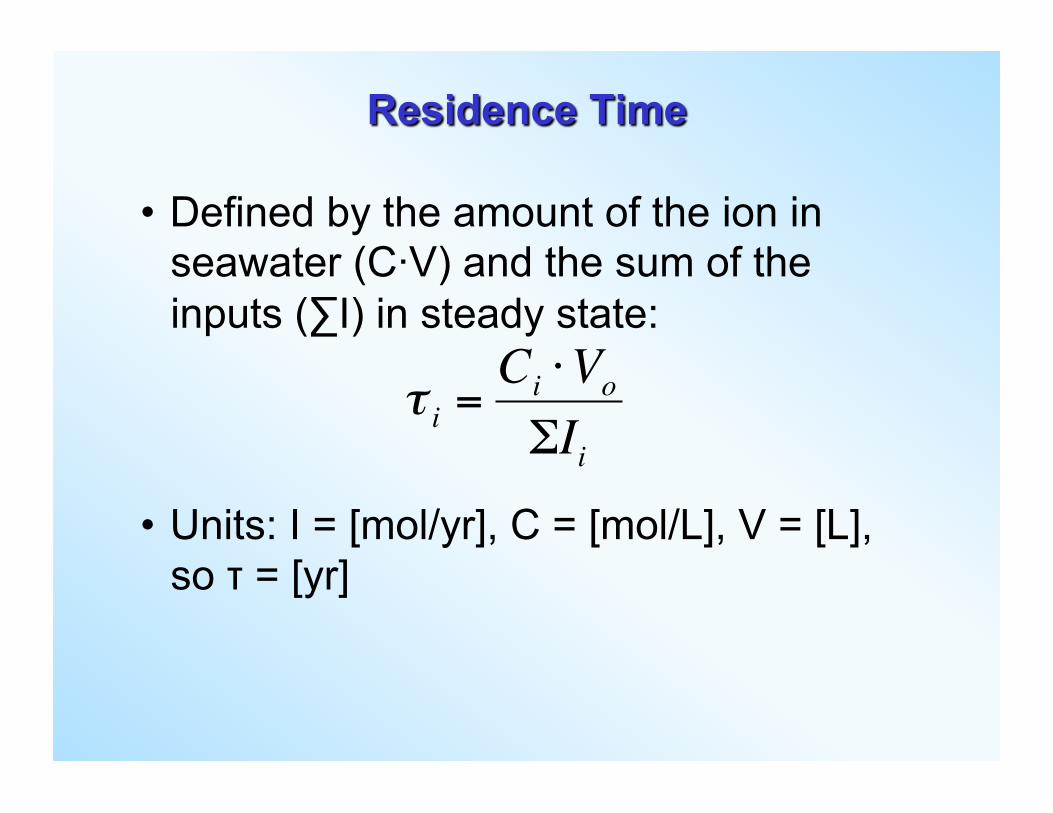
• Defined by the amount of the ion in seawater (C·V) and the sum of the inputs (∑I) in steady state:
• Units: I = [mol/yr], C = [mol/L], V = [L], so τ = [yr]
€
τ i =Ci ⋅Vo
ΣIi
• Example: Mg2+
• Inputs:
• Ocean inventory:
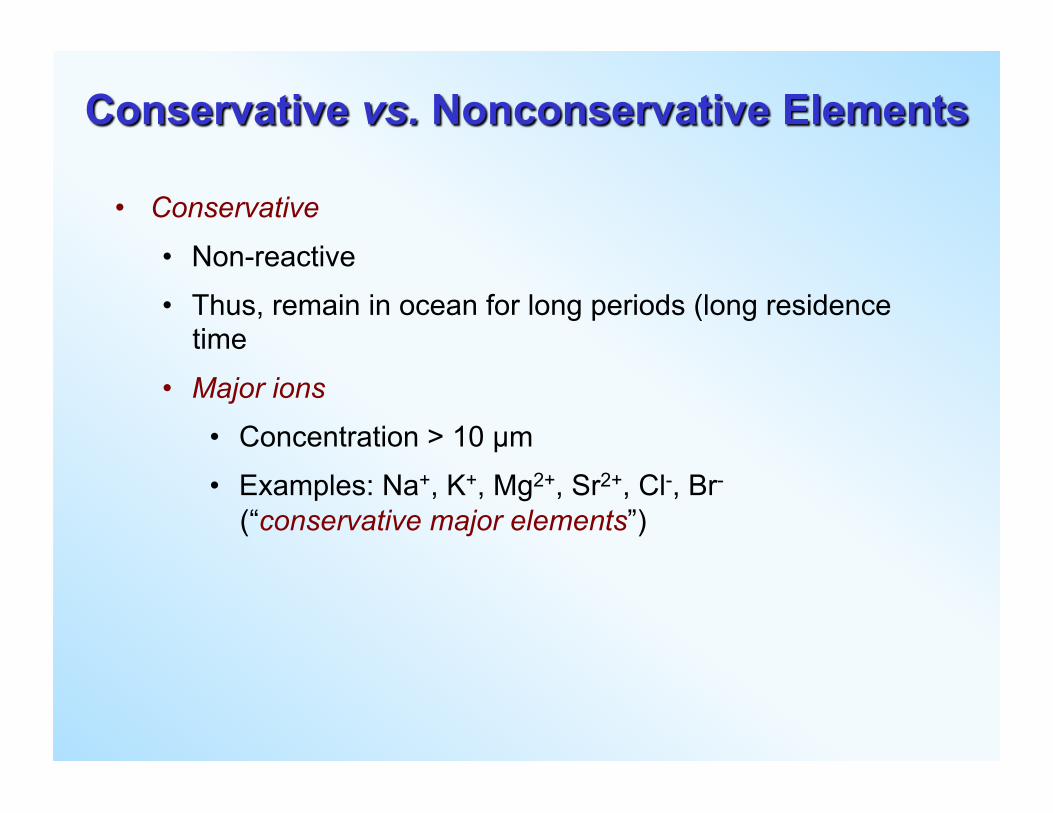
• Conservative
• Non-reactive
• Thus, remain in ocean for long periods (long residence time
• Major ions
• Concentration > 10 µm
• Examples: Na+, K+, Mg2+, Sr2+, Cl-, Br- (“conservative major elements”)
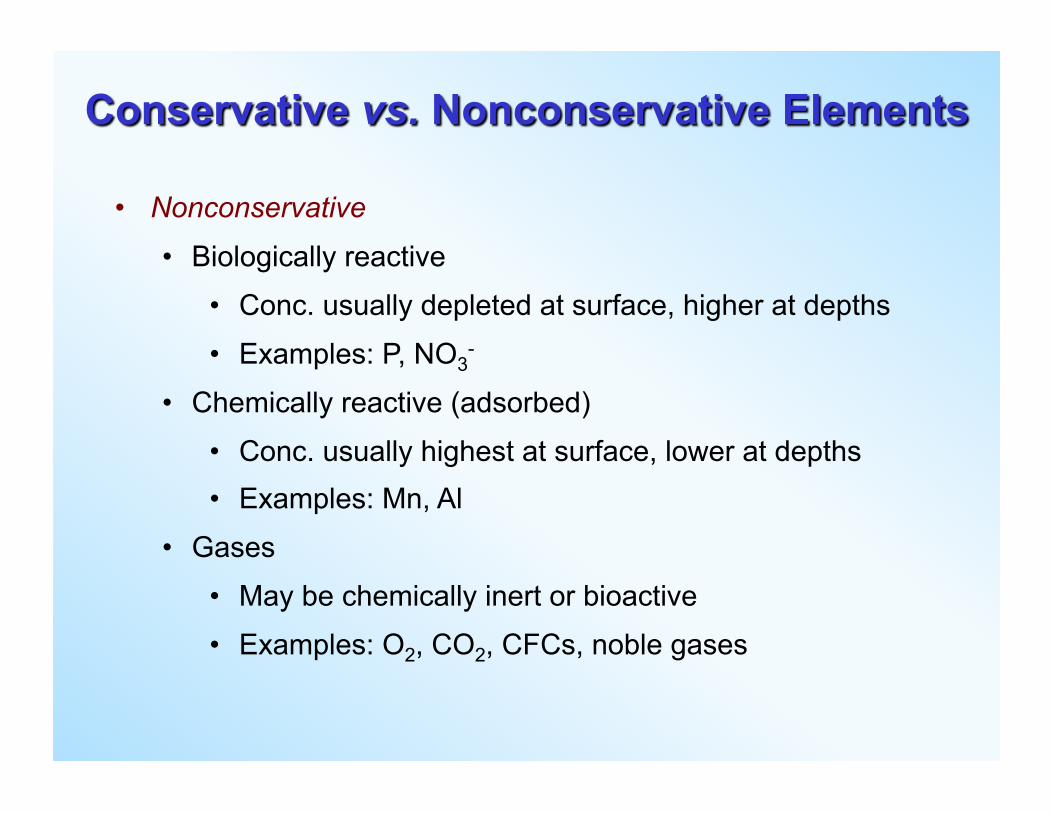
• Nonconservative
• Biologically reactive
• Conc. usually depleted at surface, higher at depths
• Examples: P, NO3-
• Chemically reactive (adsorbed)
• Conc. usually highest at surface, lower at depths • Examples: Mn, Al
• Gases
• May be chemically inert or bioactive
• Examples: O2, CO2, CFCs, noble gases
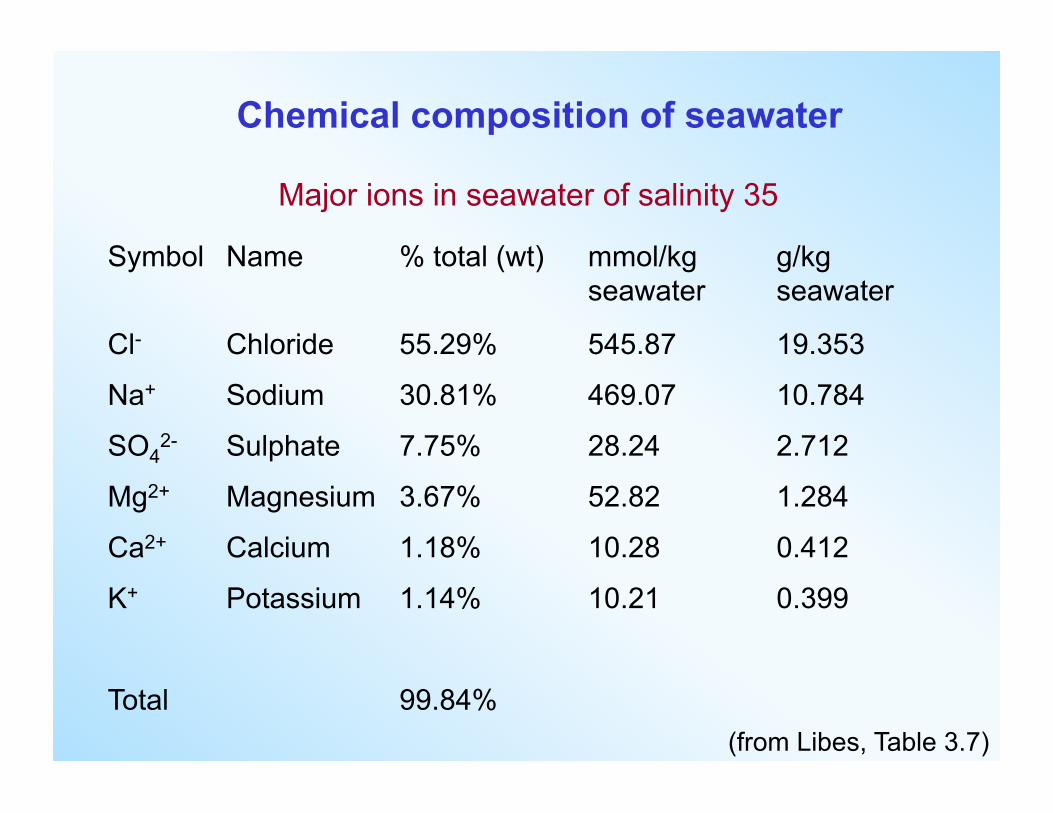
Major ions in seawater of salinity 35
Chemical composition of seawater
Symbol Name % total (wt) mmol/kg seawater
g/kg seawater
Cl- Chloride 55.29% 545.87 19.353
Na+ Sodium 30.81% 469.07 10.784
SO42- Sulphate 7.75% 28.24 2.712
Mg2+ Magnesium 3.67% 52.82 1.284
Ca2+ Calcium 1.18% 10.28 0.412
K+ Potassium 1.14% 10.21 0.399
Total 99.84% (from Libes, Table 3.7)
Salinity
• Salinity is the amount of dissolved solids in seawater
• Used for determining the density of seawater
• Affects the freezing point of seawater
• Affects the temperature of maximum density of seawater
• Changes in salinity drive thermohaline circulation
• Temperature and salinity characteristics allow determination of origin of water masses
• Accuracy of determination needed is a function of the problem being addressed, e.g. estuaries vs. deep ocean
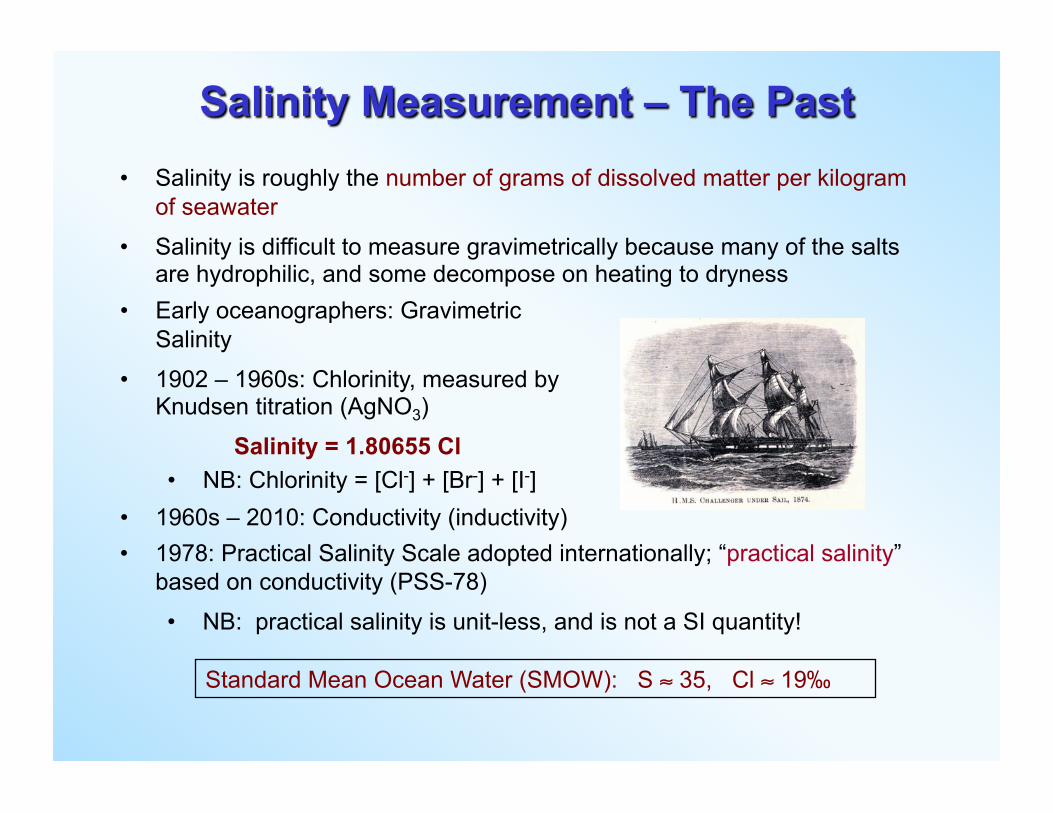
• Salinity is roughly the number of grams of dissolved matter per kilogram of seawater
• Salinity is difficult to measure gravimetrically because many of the salts are hydrophilic, and some decompose on heating to dryness
• 1978: Practical Salinity Scale adopted internationally; “practical salinity” based on conductivity (PSS-78)
• NB: practical salinity is unit-less, and is not a SI quantity!
Standard Mean Ocean Water (SMOW): S ≈ 35, Cl ≈ 19‰
• Early oceanographers: Gravimetric Salinity
• 1902 – 1960s: Chlorinity, measured by Knudsen titration (AgNO3)
Salinity = 1.80655 Cl • NB: Chlorinity = [Cl-] + [Br-] + [I-]
• 1960s – 2010: Conductivity (inductivity)
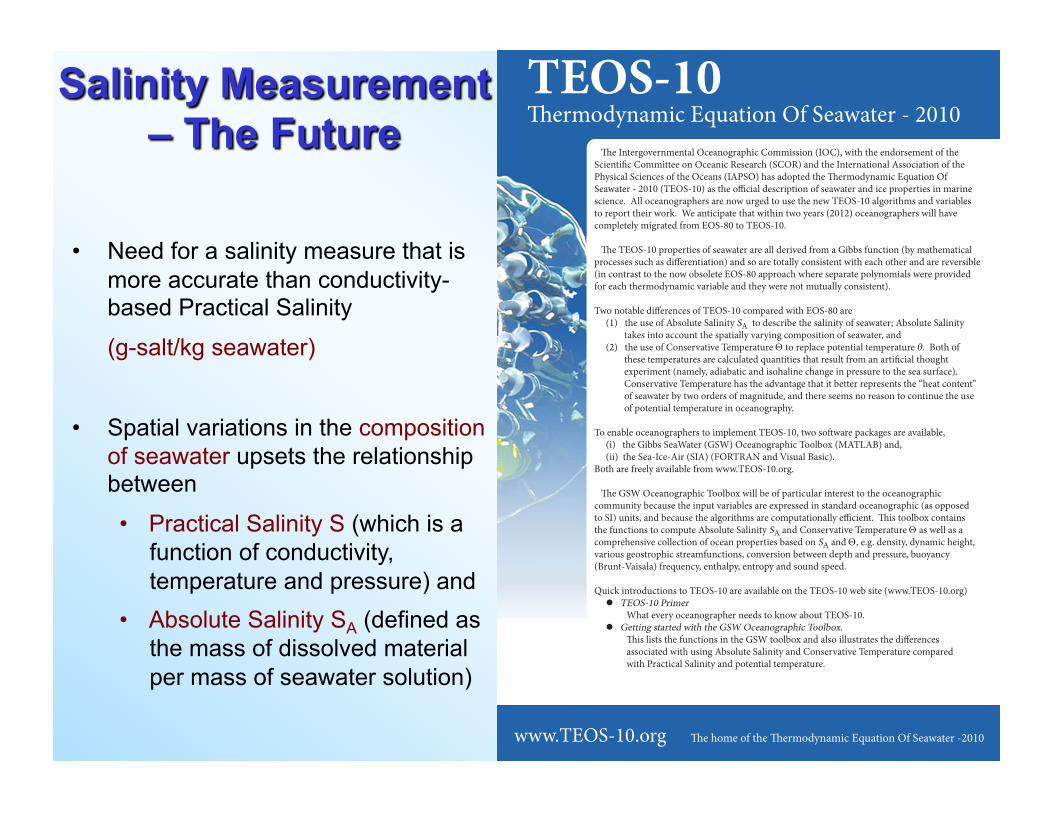
• Need for a salinity measure that is more accurate than conductivity-based Practical Salinity
(g-salt/kg seawater)
• Spatial variations in the composition of seawater upsets the relationship between
• Practical Salinity S (which is a function of conductivity, temperature and pressure) and
• Absolute Salinity SA (defined as the mass of dissolved material per mass of seawater solution)
!e Intergovernmental Oceanographic Commission (IOC), with the endorsement of the Scienti"c Committee on Oceanic Research (SCOR) and the International Association of the Physical Sciences of the Oceans (IAPSO) has adopted the !ermodynamic Equation Of Seawater - 2010 (TEOS-10) as the o#cial description of seawater and ice properties in marine science. All oceanographers are now urged to use the new TEOS-10 algorithms and variables to report their work. We anticipate that within two years (2012) oceanographers will have completely migrated from EOS-80 to TEOS-10.
!e TEOS-10 properties of seawater are all derived from a Gibbs function (by mathematical processes such as di$erentiation) and so are totally consistent with each other and are reversible (in contrast to the now obsolete EOS-80 approach where separate polynomials were provided for each thermodynamic variable and they were not mutually consistent).
Two notable di$erences of TEOS-10 compared with EOS-80 are (1) the use of Absolute Salinity SA to describe the salinity of seawater; Absolute Salinity takes into account the spatially varying composition of seawater, and (2) the use of Conservative Temperature ! to replace potential temperature ". Both of these temperatures are calculated quantities that result from an arti"cial thought experiment (namely, adiabatic and isohaline change in pressure to the sea surface). Conservative Temperature has the advantage that it better represents the “heat content” of seawater by two orders of magnitude, and there seems no reason to continue the use of potential temperature in oceanography.
To enable oceanographers to implement TEOS-10, two so%ware packages are available, (i) the Gibbs SeaWater (GSW) Oceanographic Toolbox (MATLAB) and, (ii) the Sea-Ice-Air (SIA) (FORTRAN and Visual Basic). Both are freely available from www.TEOS-10.org.
!e GSW Oceanographic Toolbox will be of particular interest to the oceanographic community because the input variables are expressed in standard oceanographic (as opposed to SI) units, and because the algorithms are computationally e#cient. !is toolbox contains the functions to compute Absolute Salinity SA and Conservative Temperature ! as well as a comprehensive collection of ocean properties based on SA and !, e.g. density, dynamic height, various geostrophic streamfunctions, conversion between depth and pressure, buoyancy (Brunt-Vaisala) frequency, enthalpy, entropy and sound speed.
Quick introductions to TEOS-10 are available on the TEOS-10 web site (www.TEOS-10.org) ! TEOS-10 Primer What every oceanographer needs to know about TEOS-10. ! Getting started with the GSW Oceanographic Toolbox. !is lists the functions in the GSW toolbox and also illustrates the di$erences associated with using Absolute Salinity and Conservative Temperature compared with Practical Salinity and potential temperature.
www.TEOS-10.org !e home of the !ermodynamic Equation Of Seawater -2010
TEOS-10!ermodynamic Equation Of Seawater - 2010
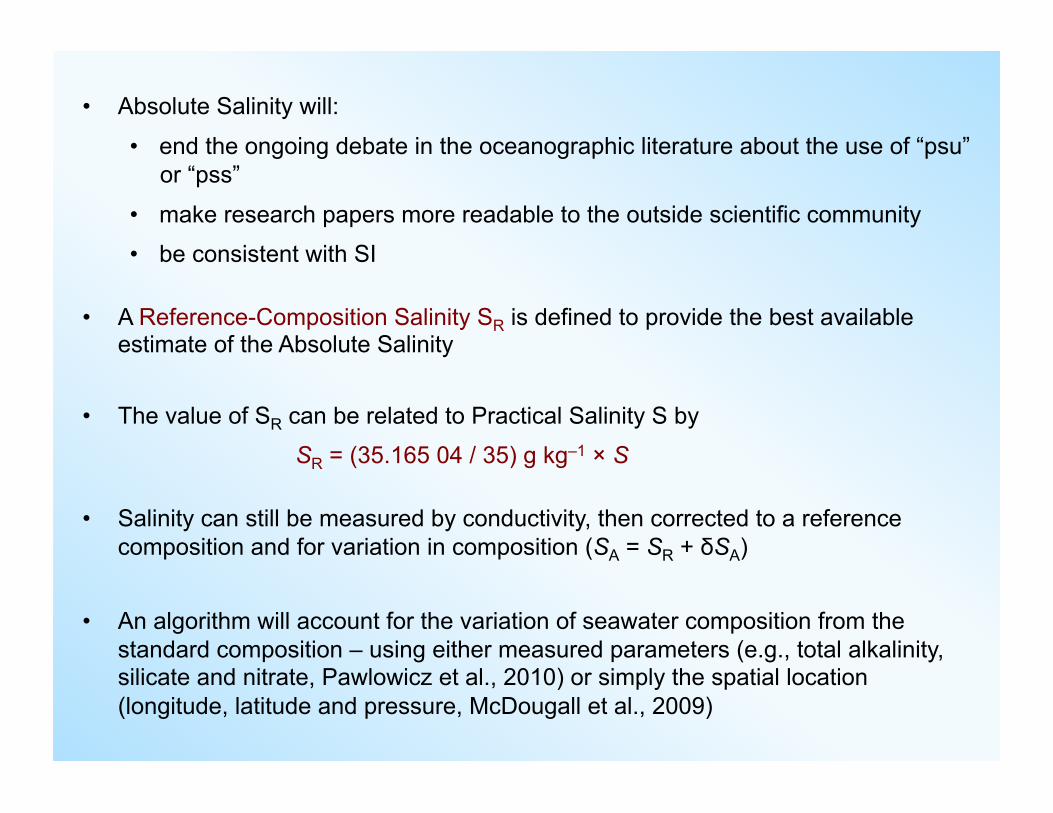
• Absolute Salinity will:
• end the ongoing debate in the oceanographic literature about the use of “psu” or “pss”
• make research papers more readable to the outside scientific community
• be consistent with SI
• A Reference-Composition Salinity SR is defined to provide the best available estimate of the Absolute Salinity
• The value of SR can be related to Practical Salinity S by
SR = (35.165 04 / 35) g kg–1 × S
• Salinity can still be measured by conductivity, then corrected to a reference composition and for variation in composition (SA = SR + δSA)
• An algorithm will account for the variation of seawater composition from the standard composition – using either measured parameters (e.g., total alkalinity, silicate and nitrate, Pawlowicz et al., 2010) or simply the spatial location (longitude, latitude and pressure, McDougall et al., 2009)
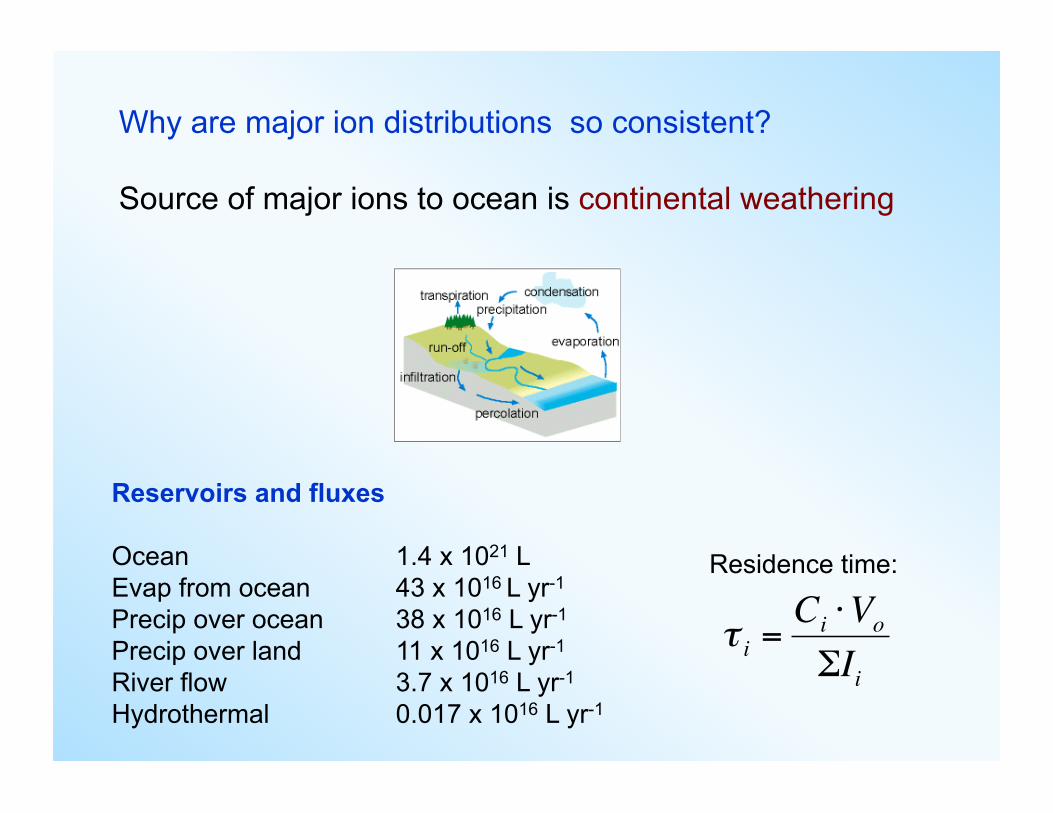
Why are major ion distributions so consistent?
Source of major ions to ocean is continental weathering
Reservoirs and fluxes
Ocean 1.4 x 10²¹ L Evap from ocean 43 x 1016 L yr-1
Precip over ocean 38 x 1016 L yr-1 Precip over land 11 x 1016 L yr-1 River flow 3.7 x 10¹⁶ L yr-1 Hydrothermal 0.017 x 10¹⁶ L yr-1
Residence time:
€
τ i =Ci ⋅Vo
ΣIi
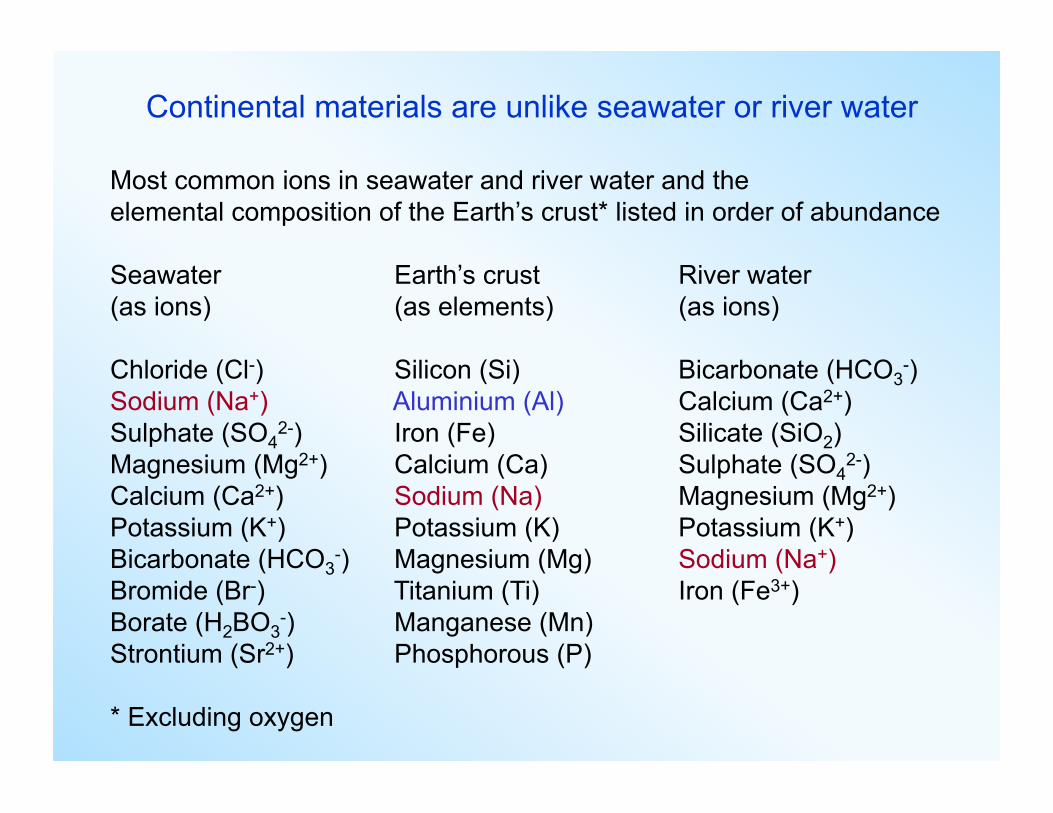
Continental materials are unlike seawater or river water
Most common ions in seawater and river water and the elemental composition of the Earth’s crust* listed in order of abundance
Seawater Earth’s crust River water (as ions) (as elements) (as ions) Chloride (Cl-) Silicon (Si) Bicarbonate (HCO3
-) Sodium (Na+) Aluminium (Al) Calcium (Ca2+) Sulphate (SO4
2-) Iron (Fe) Silicate (SiO2) Magnesium (Mg2+) Calcium (Ca) Sulphate (SO4
2-) Calcium (Ca2+) Sodium (Na) Magnesium (Mg2+) Potassium (K+) Potassium (K) Potassium (K+) Bicarbonate (HCO3
-) Magnesium (Mg) Sodium (Na+) Bromide (Br-) Titanium (Ti) Iron (Fe3+) Borate (H2BO3
-) Manganese (Mn) Strontium (Sr2+) Phosphorous (P)
* Excluding oxygen
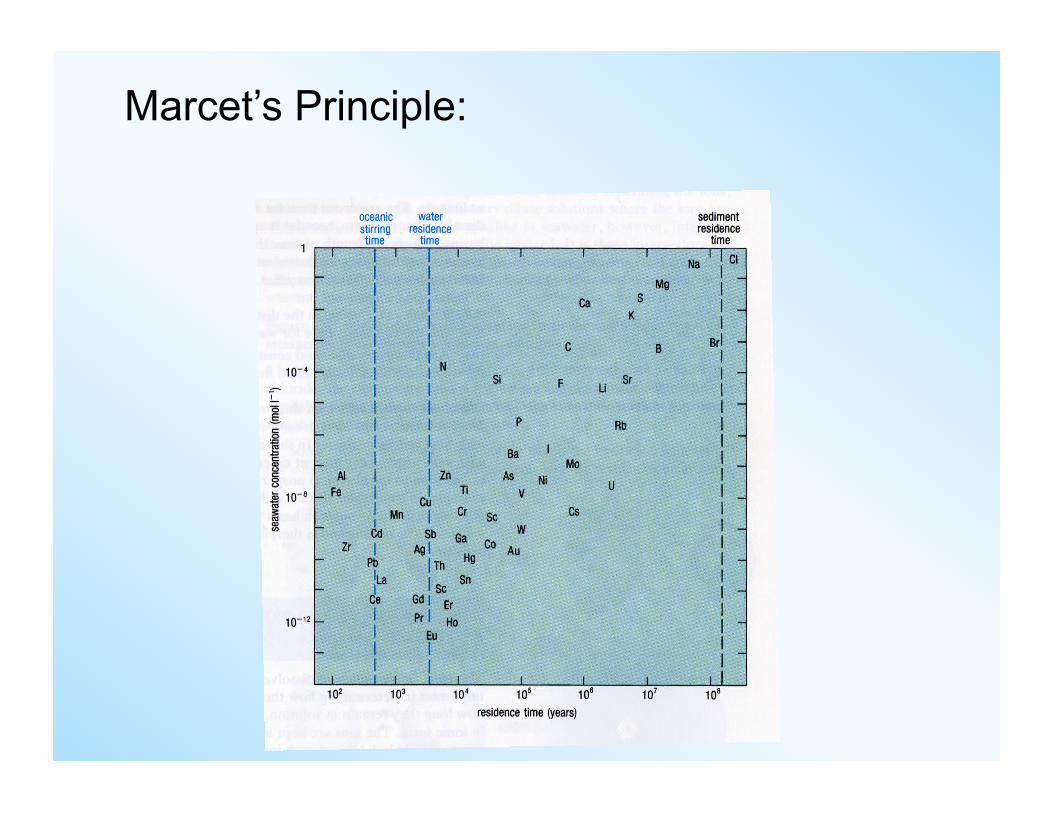
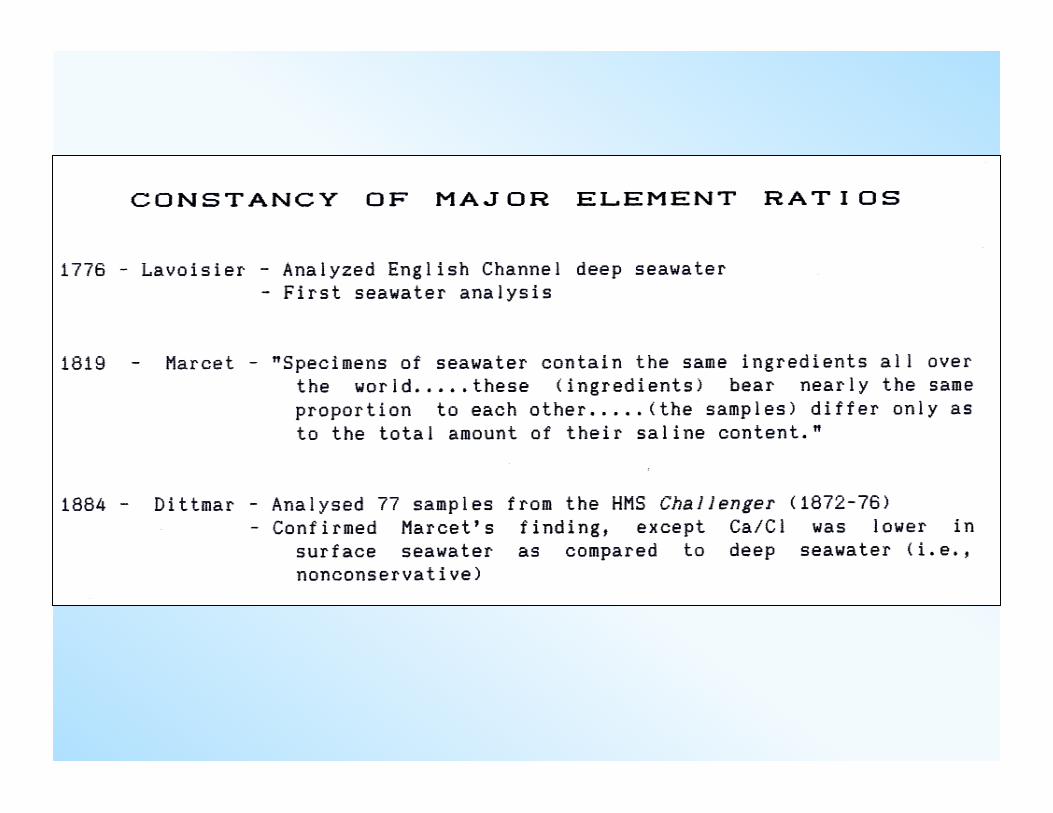
Marcet’s Principle:
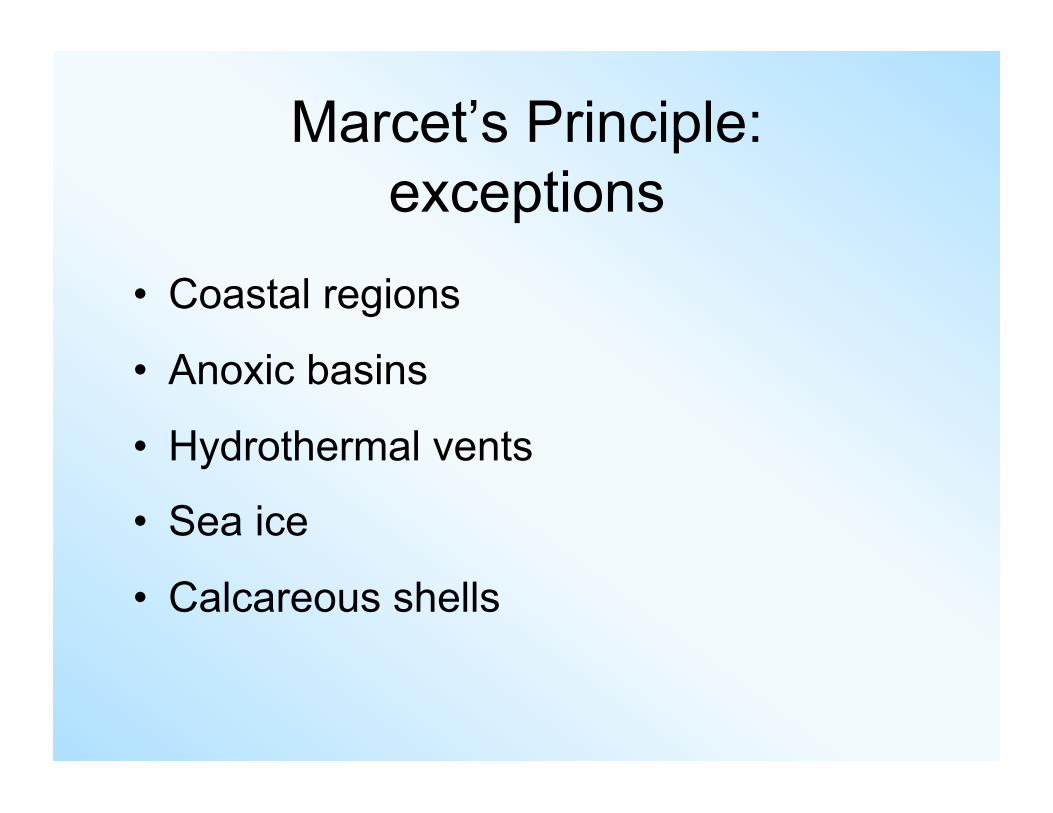
Marcet’s Principle: exceptions
• Coastal regions
• Anoxic basins
• Hydrothermal vents
• Sea ice
• Calcareous shells
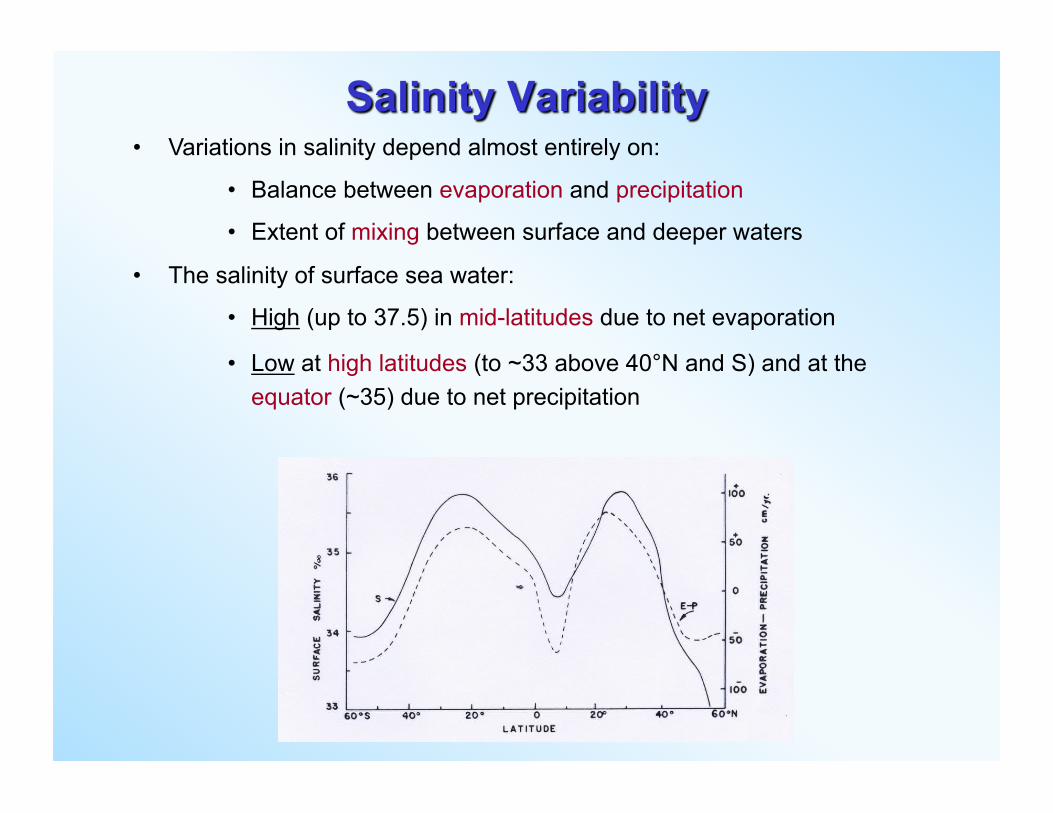
• Variations in salinity depend almost entirely on:
• Balance between evaporation and precipitation
• Extent of mixing between surface and deeper waters
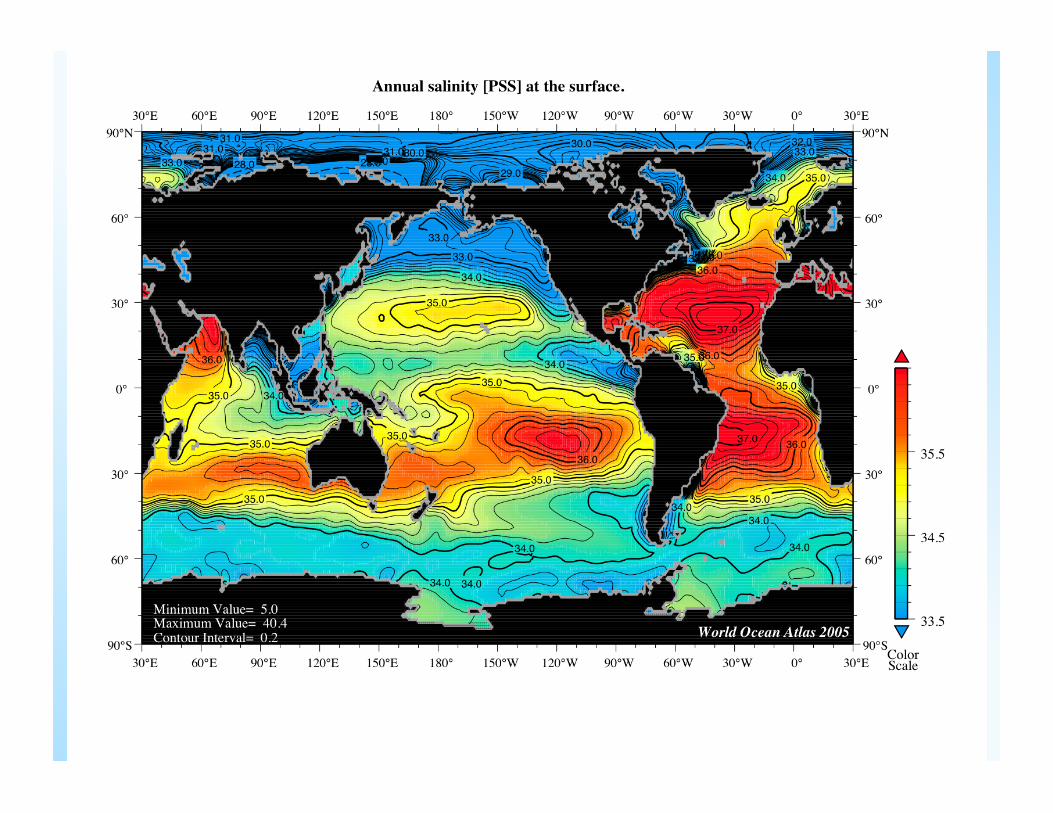
• The salinity of surface sea water:
• High (up to 37.5) in mid-latitudes due to net evaporation
• Low at high latitudes (to ~33 above 40°N and S) and at the equator (~35) due to net precipitation
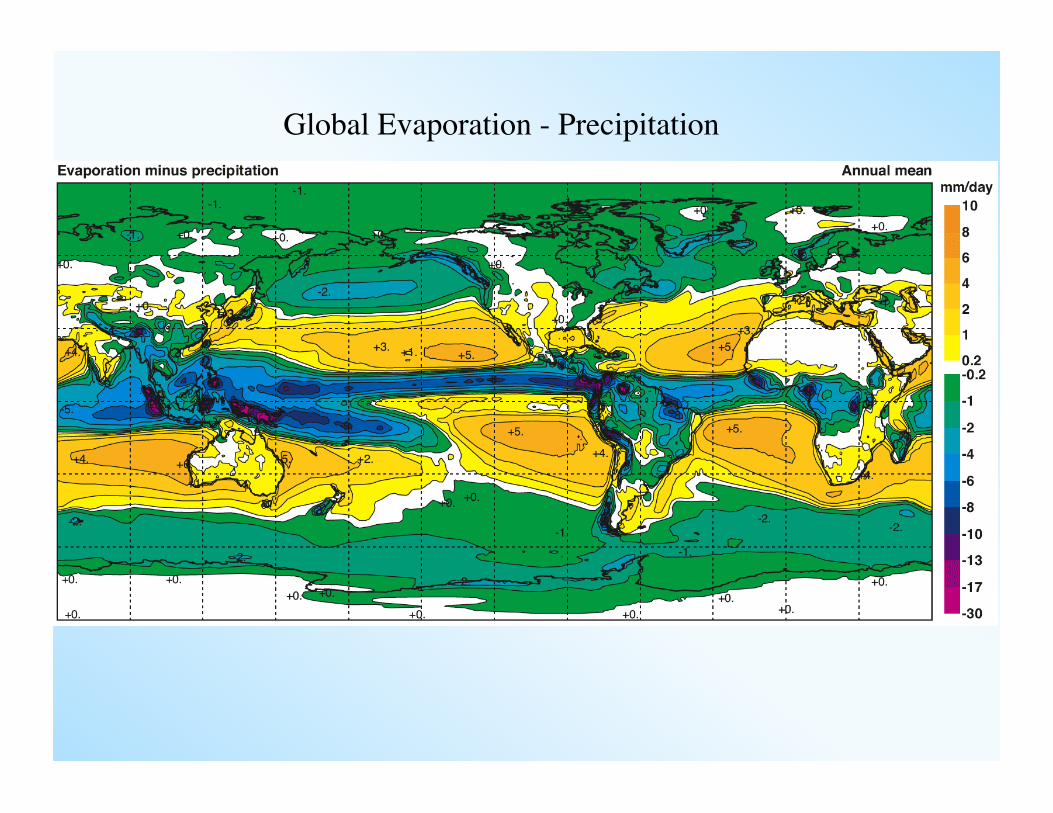
Global Evaporation - Precipitation
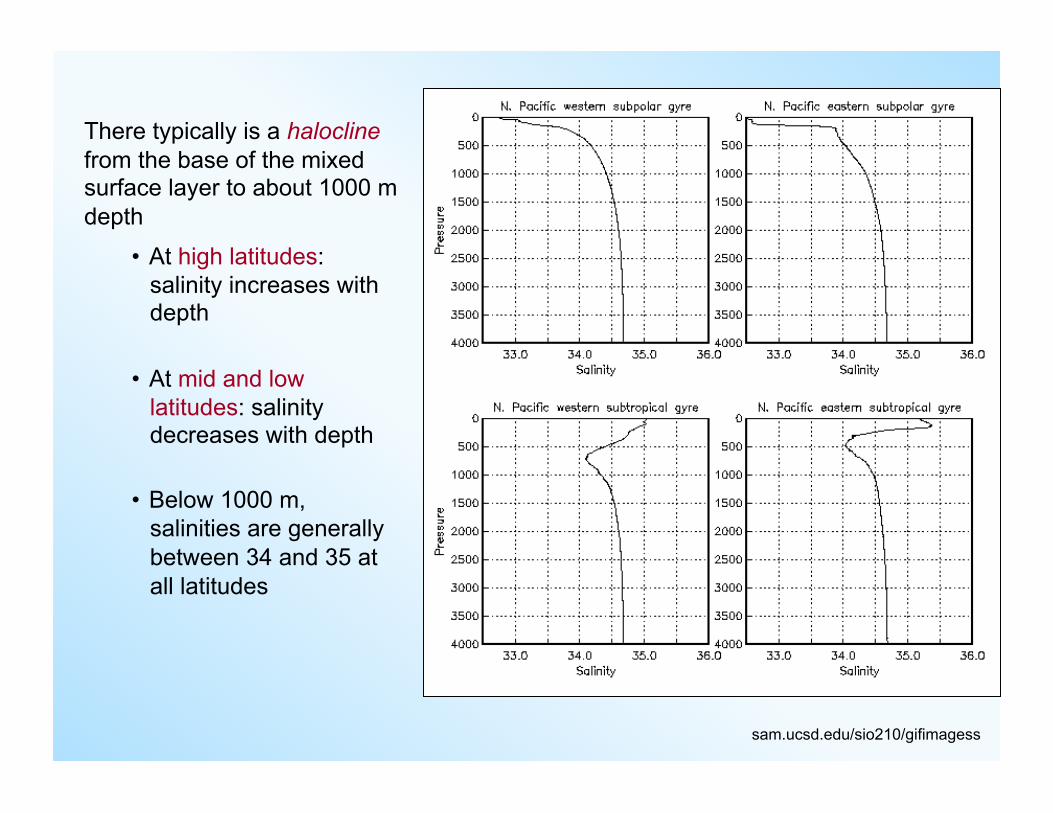
There typically is a halocline from the base of the mixed surface layer to about 1000 m depth
• At high latitudes: salinity increases with depth
• At mid and low latitudes: salinity decreases with depth
• Below 1000 m, salinities are generally between 34 and 35 at all latitudes
sam.ucsd.edu/sio210/gifimagess
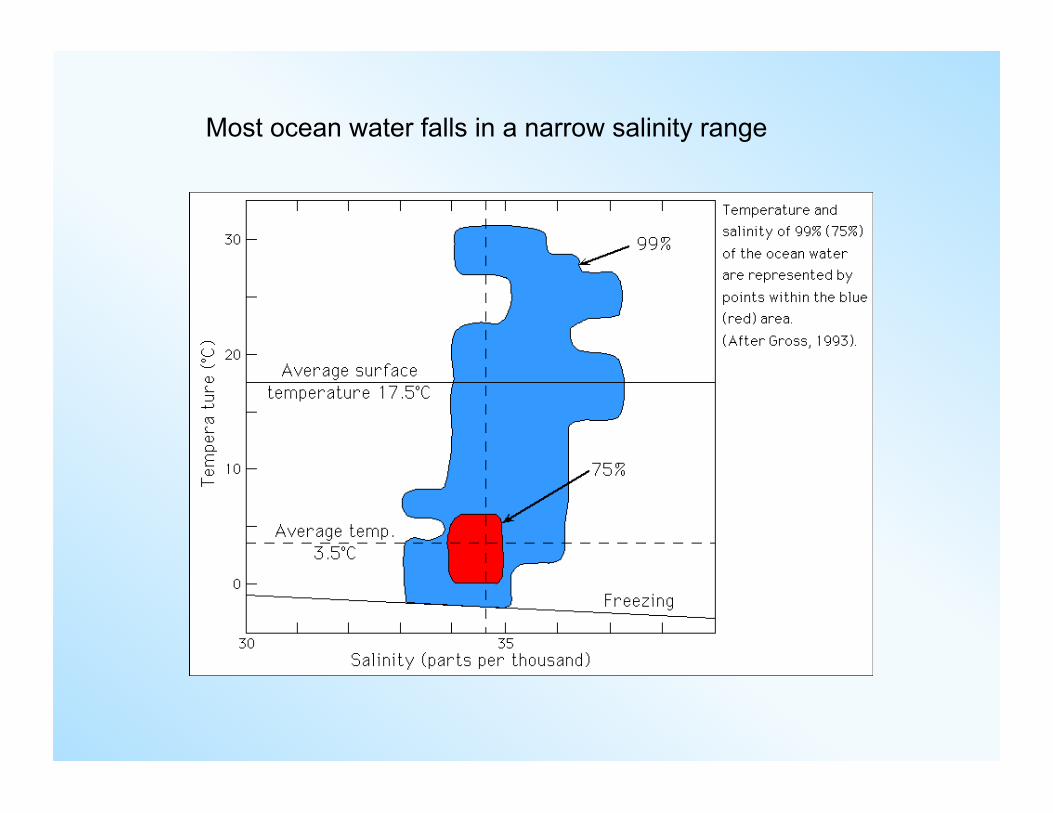
Most ocean water falls in a narrow salinity range
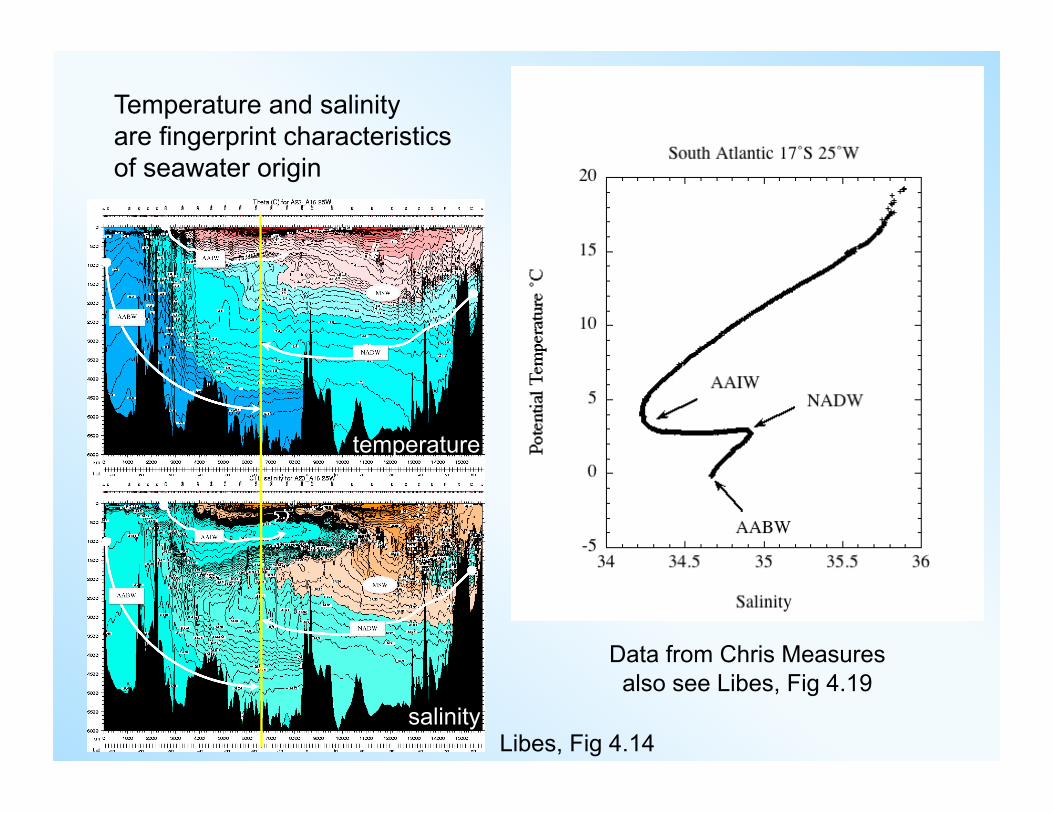
Temperature and salinity are fingerprint characteristics of seawater origin
Libes, Fig 4.14
Data from Chris Measures also see Libes, Fig 4.19
temperature
salinity
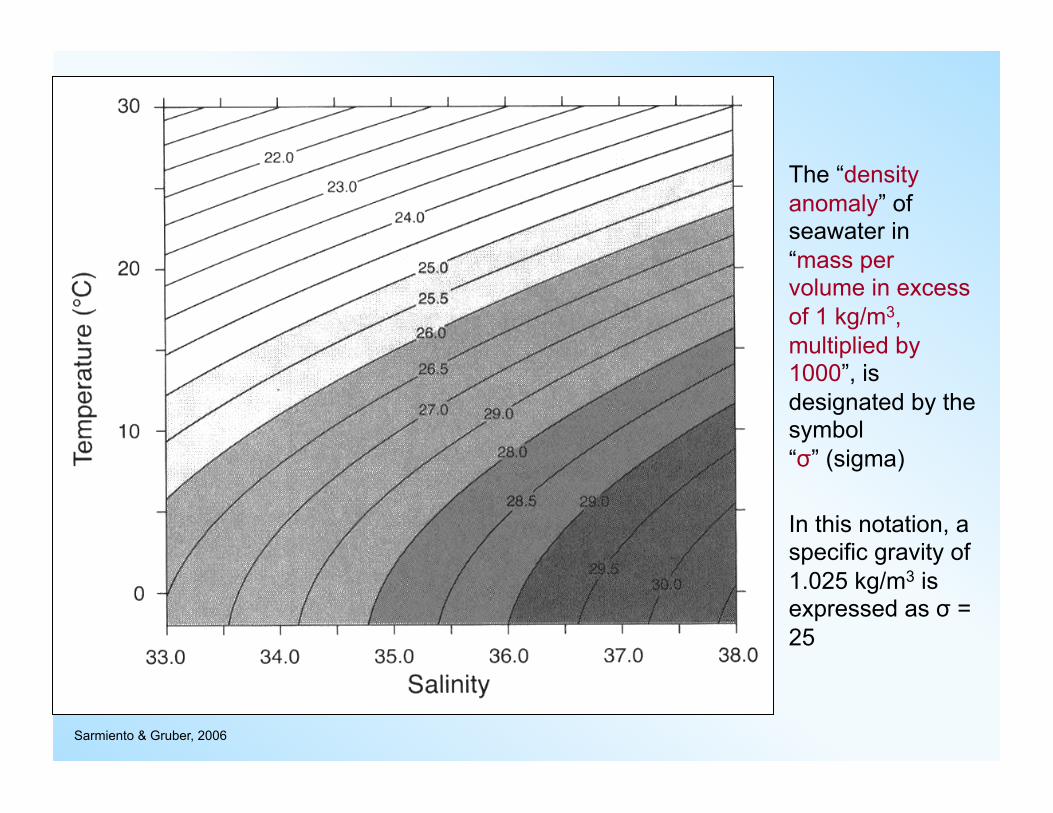
Sarmiento & Gruber, 2006
The “density anomaly” of seawater in “mass per volume in excess of 1 kg/m3, multiplied by 1000”, is designated by the symbol “σ” (sigma)
In this notation, a specific gravity of 1.025 kg/m3 is expressed as σ = 25
Summary • Residence time (inventory/inputs)
• Major ions in seawater: found in constant proportions (Marcet’s Principle)
• Techniques of measuring salinity
• Absolute salinity (SI units)
• Evaporation/precipitation and salinity variability