Embed Size (px)
Citation preview
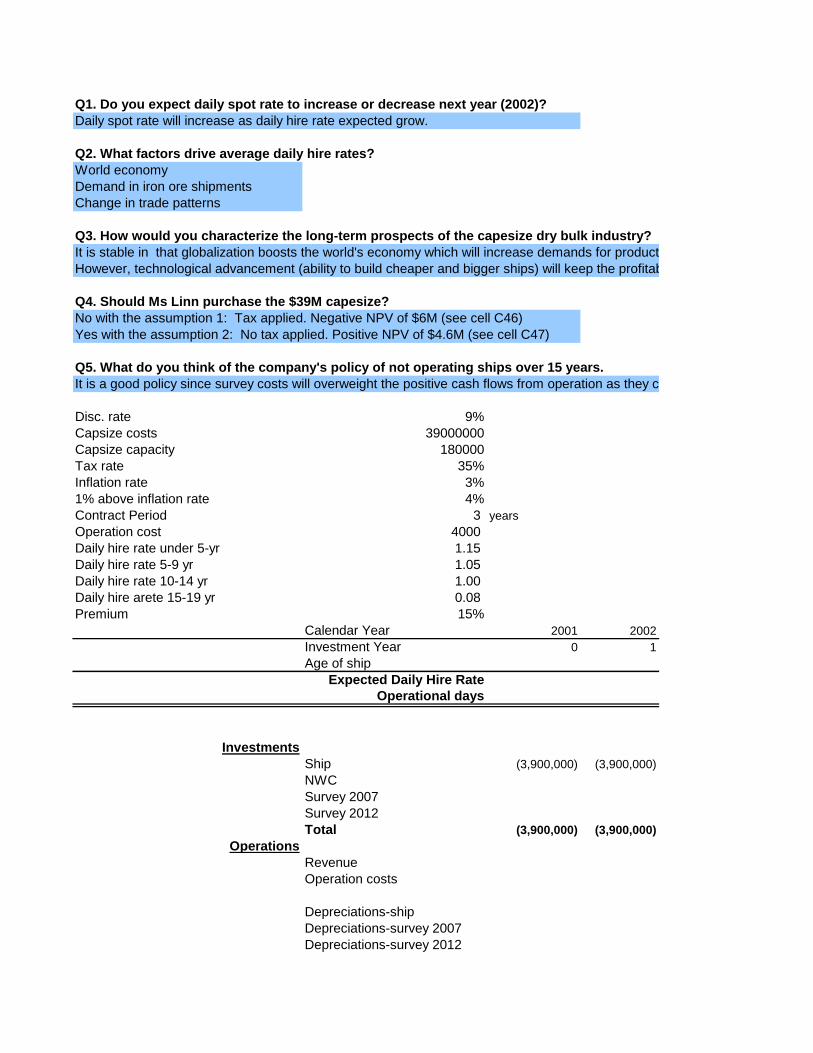
Q1. Do you expect daily spot rate to increase or decrease next year (2002)?
Daily spot rate will increase as daily hire rate expected grow.
Q2. What factors drive average daily hire rates?
World economy
Demand in iron ore shipments
Change in trade patterns
Q3. How would you characterize the long-term prospects of the capesize dry bulk industry?
It is stable in that globalization boosts the world's economy which will increase demands for production/shipment of raw materials.
However, technological advancement (ability to build cheaper and bigger ships) will keep the profitability of the industry in the long term.
Q4. Should Ms Linn purchase the $39M capesize?
No with the assumption 1: Tax applied. Negative NPV of $6M (see cell C46)
Yes with the assumption 2: No tax applied. Positive NPV of $4.6M (see cell C47)
Q5. What do you think of the company's policy of not operating ships over 15 years.
It is a good policy since survey costs will overweight the positive cash flows from operation as they continue to operate the old ship after 15 years.
Disc. rate 9%
Capsize costs 39000000
Capsize capacity 180000
Tax rate 35%
Inflation rate 3%
1% above inflation rate 4%
Contract Period 3 years
Operation cost 4000
Daily hire rate under 5-yr 1.15
Daily hire rate 5-9 yr 1.05
Daily hire rate 10-14 yr 1.00
Daily hire arete 15-19 yr 0.08
Premium 15%
Calendar Year 2001 2002
Investment Year 0 1
Age of ship
Expected Daily Hire Rate
Operational days
Investments
Ship (3,900,000) (3,900,000)
NWC
Survey 2007
Survey 2012
Total (3,900,000) (3,900,000)
Operations
Revenue
Operation costs
Depreciations-ship
Depreciations-survey 2007
Depreciations-survey 2012

Operation Income
Tax
Net Income
Net Income w/o tax
Add back (non-cash transaction)
Depreciations-ship
Depreciations-survey 2007
Depreciations-survey 2012
Total Add back
Cash flows w/Tax (3,900,000) (3,900,000)
Cash flows w/o Tax (3,900,000) (3,900,000)
NPV w/Tax 6% disc. Rate (6,069,545)
NPV w/o Tax 6% disc. Rate 4,623,672

It is stable in that globalization boosts the world's economy which will increase demands for production/shipment of raw materials.
However, technological advancement (ability to build cheaper and bigger ships) will keep the profitability of the industry in the long term.
It is a good policy since survey costs will overweight the positive cash flows from operation as they continue to operate the old ship after 15 years.
2003 2004 2005 2006 2007 2008 2009 2010
2 3 4 5 6 7 8 9
1 2 3 4 5 6 7 8
20,000 20,200 20,400 18,714 17,283 17,481 17,682 17,886
357 357 357 357 357 353 353 353
(46,800,000)
(500,000)
300,000
(47,300,000) 0 0 0 300,000 0 0 0
7,140,000 7,211,400 7,282,800 7,683,033 7,095,536 7,096,412 7,178,008 7,260,822
(1,460,000) (1,474,600) (1,489,346) (1,504,239) (1,519,282) (1,534,475) (1,549,819) (1,565,318)
(1,560,000) (1,560,000) (1,560,000) (1,560,000) (1,560,000) (1,560,000) (1,560,000) (1,560,000)
(60,000) (60,000) (60,000) (60,000)

4,120,000 4,176,800 4,233,454 4,618,793 3,956,254 3,941,937 4,008,188 4,075,504
(1,442,000) (1,461,880) (1,481,709) (1,616,578) (1,384,689) (1,379,678) (1,402,866) (1,426,426)
2,678,000 2,714,920 2,751,745 3,002,216 2,571,565 2,562,259 2,605,323 2,649,078
4,120,000 4,176,800 4,233,454 4,618,793 3,956,254 3,941,937 4,008,188 4,075,504
1,560,000 1,560,000 1,560,000 1,560,000 1,560,000 1,560,000 1,560,000 1,560,000
60,000 60,000 60,000 60,000
1,560,000 1,560,000 1,560,000 1,560,000 1,620,000 1,620,000 1,620,000 1,620,000
(43,062,000) 4,274,920 4,311,745 4,562,216 4,491,565 4,182,259 4,225,323 4,269,078
(41,620,000) 5,736,800 5,793,454 6,178,793 5,876,254 5,561,937 5,628,188 5,695,504

2011 2012 2013 2014 2015 2016 2017 2018
10 11 12 13 14 15 16 17
9 10 11 12 13 14 15 16
18,092 17,428 17,628 17,831 18,036 18,243 14,762 14,932
353 353 349 349 349 349 349
5,000,000
500,000
750,000
0 750,000 0 0 0 0 5,500,000
7,344,447 7,074,897 7,074,998 7,156,472 7,238,749 7,321,828 5,924,729
(1,580,971) (1,596,780) (1,612,748) (1,628,876) (1,645,165) (1,661,616) (1,678,232)
(1,560,000) (1,560,000) (1,560,000) (1,560,000) (1,560,000) (1,560,000) (17,160,000)
(60,000)
(150,000) (150,000) (150,000) (150,000) (150,000)

4,143,477 3,768,116 3,752,249 3,817,596 3,883,584 3,950,212 (12,913,504) 0
(1,450,217) (1,318,841) (1,313,287) (1,336,159) (1,359,254) (1,382,574) 4,519,726 0
2,693,260 2,449,275 2,438,962 2,481,437 2,524,330 2,567,638 (8,393,777) 0
4,143,477 3,768,116 3,752,249 3,817,596 3,883,584 3,950,212 (12,913,504) 0
1,560,000 1,560,000 1,560,000 1,560,000 1,560,000 1,560,000 17,160,000 0
60,000
150,000 150,000 150,000 150,000 150,000
1,620,000 1,710,000 1,710,000 1,710,000 1,710,000 1,710,000 17,160,000 0
4,313,260 4,909,275 4,148,962 4,191,437 4,234,330 4,277,638 14,266,223 0
5,763,477 6,228,116 5,462,249 5,527,596 5,593,584 5,660,212 9,746,496

2019 2020 2021 2022 2023 2024 2025 2026
18 19 20 21 22 23 24 25
17 18 19 20 21 22 23 24
15,104 15,278 15,454 14,654 14,823 14,993 15,166 15,341

0 0 0 0 0 0 0 0
0 0 0 0 0 0 0 0
0 0 0 0 0 0 0 0
0 0 0 0 0 0 0 0
0 0 0 0 0 0 0 0
0 0 0 0 0 0 0 0
0 0 0 0 0 0 0 0

2027
26
25
13,448 16,834
(49,600,000)
0
300,000
750,000
107,084,129
(23,501,467)
0
(39,000,000)
(300,000)
(750,000)

0 43,532,661
0 (15,236,431)
0 28,296,230
0 43,532,661
0
0 39,000,000
300,000
750,000
0 40,050,000
0

Exhibit 1 Capital Expenditures Anticipated in Preparation for Special Surveys
2007 2012 2017 2022 2027
300,000 350,000 750,000 850,000 1,250,000

Exhibit 3 Current order book for dry bulk capesizes by delivery date
2001 2002 2003 2004
Number of vessels 63 33 21 9

Exhibit 4 Daily Hire Rate Adjustment Factor for Dry Bulk Capesizes Based on Age of Vessel
Over 24 years 20 to 24 years 15 to 19 years 10 to 14 years 5 to 9 years Under 5 years
0.65 0.75 0.8 1 1.05 1.15
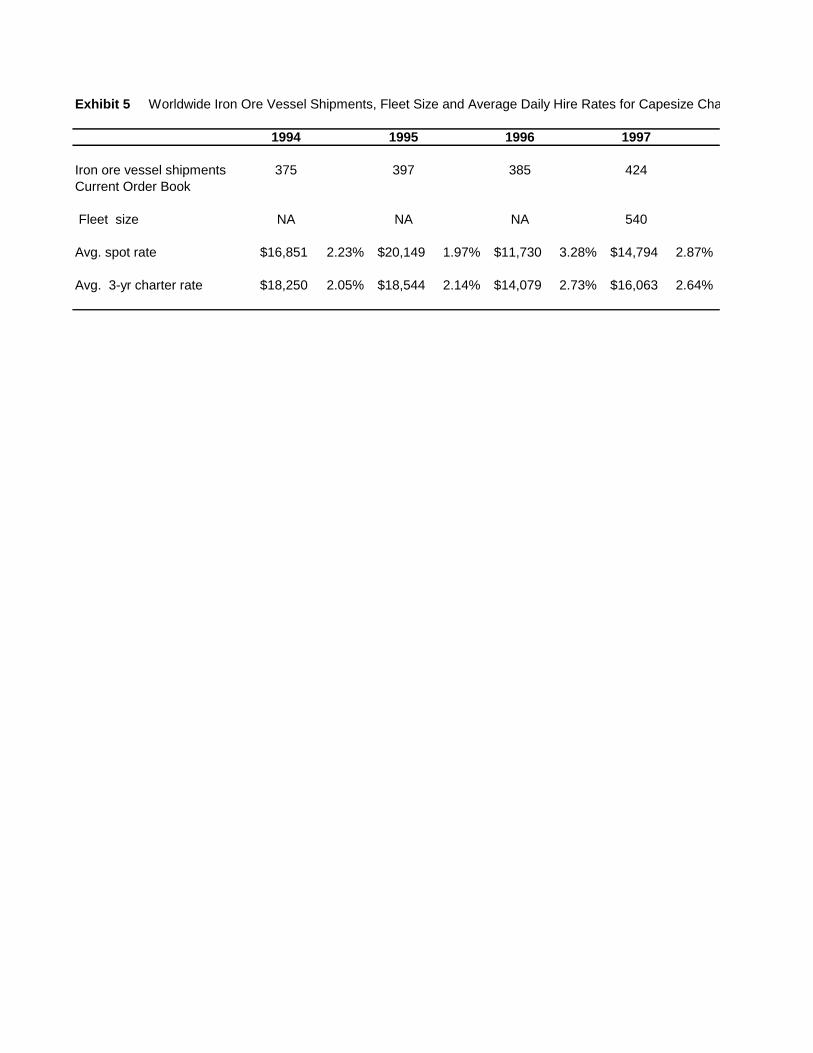
Exhibit 5 Worldwide Iron Ore Vessel Shipments, Fleet Size and Average Daily Hire Rates for Capesize Charters, 1994-2001
1994 1995 1996 1997
Iron ore vessel shipments 375 397 385 424
Current Order Book
Fleet size NA NA NA 540
Avg. spot rate $16,851 2.23% $20,149 1.97% $11,730 3.28% $14,794 2.87%
Avg. 3-yr charter rate $18,250 2.05% $18,544 2.14% $14,079 2.73% $16,063 2.64%
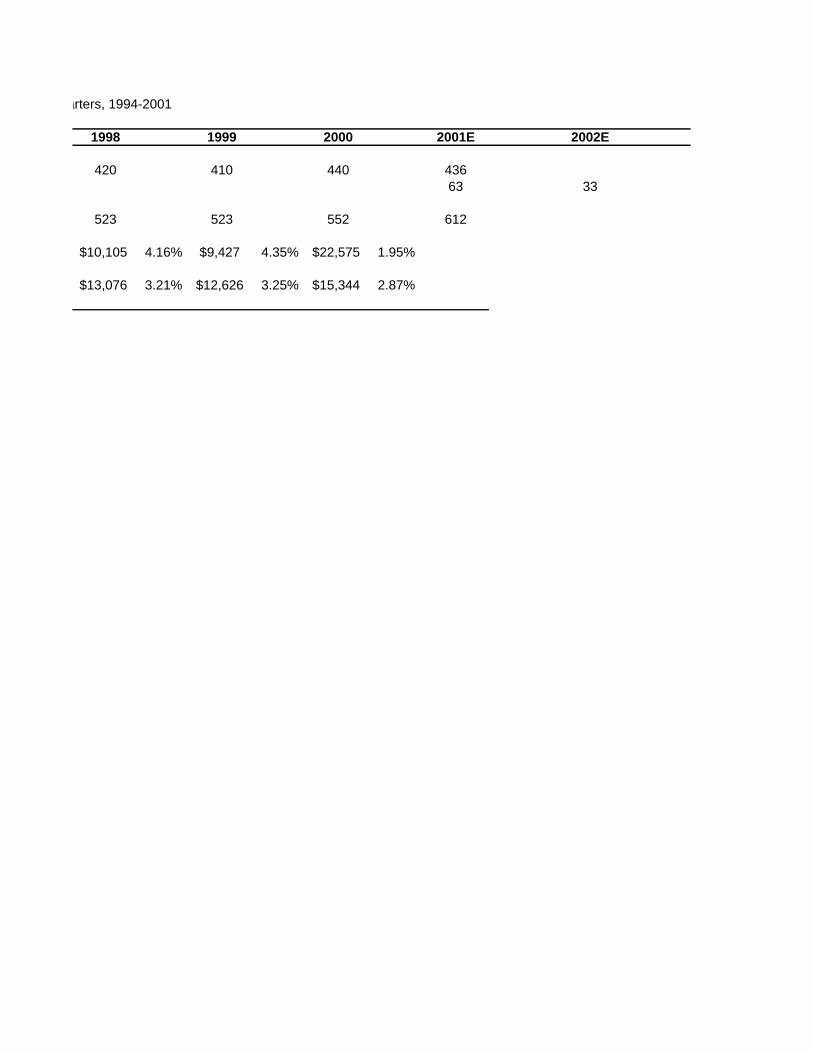
Exhibit 5 Worldwide Iron Ore Vessel Shipments, Fleet Size and Average Daily Hire Rates for Capesize Charters, 1994-2001
1998 1999 2000 2001E 2002E
420 410 440 436
63 33
523 523 552 612
$10,105 4.16% $9,427 4.35% $22,575 1.95%
$13,076 3.21% $12,626 3.25% $15,344 2.87%

2003E 2004E
21 9

Exhibit 6 Forecasted Daily Time Charter Rates for New Capesize Vessel
Age of Ship Event Year Calendar Year
Iron Ore
Shipments
(Millions of Tons) % Growth
Avg Daily Charter
Rate
0 2000 440 7.30% 15,344
1 2001 436 -0.90% 14,747
2 2002 445 2.00% 15,072
1 3 2003 454 2.00% 15,403
2 4 2004 463 2.00% 15,742
3 5 2005 472 2.00% 16,088
4 6 2006 479 1.50% 16,273
5 7 2007 486 1.50% 16,460
6 8 2008 493 1.50% 16,650
7 9 2009 501 1.50% 16,841
8 10 2010 508 1.50% 17,035
9 11 2011 516 1.50% 17,231
10 12 2012 524 1.50% 17,429
11 13 2013 532 1.50% 17,629
12 14 2014 540 1.50% 17,832
13 15 2015 548 1.50% 18,037
14 16 2016 556 1.50% 18,245
15 17 2017 564 1.50% 18,454
16 18 2018 573 1.50% 18,667
17 19 2019 581 1.50% 18,881
18 20 2020 590 1.50% 19,098
19 21 2021 599 1.50% 19,318
20 22 2022 608 1.50% 19,540
21 23 2023 617 1.50% 19,765
22 24 2024 626 1.50% 19,992
23 25 2025 636 1.50% 20,222
24 26 2026 645 1.50% 20,455
25 27 2027 655 1.50% 20,690
Age of Ship 1
Event Year 0 1 2 3
Calendar Year 2000 2001 2002 2003Iron Ore
Shipments
(Millions of Tons) 440 436 445 454
Avg Daily Charter
Rate 15,344 14,747 15,072 15,403

Adjustment Factor
for Hire Rate 1.15
Adjusted Daily
Hire Rate 17,713
Expected Daily
Hire Rate 20,000

% Growth
Adjustment
Factor for
Hire Rate
Adjusted
Daily Hire
Rate
Expected
Daily Hire
Rate
21.50%
-3.90%
2.20%
2.20% 1.15 17,713 20,000
2.20% 1.15 18,103 20,200
2.20% 1.15 18,501 20,400
1.20% 1.15 18,714 18,714
1.20% 1.05 17,283 17,283
1.20% 1.05 17,481 17,481
1.20% 1.05 17,682 17,682
1.20% 1.05 17,886 17,886
1.20% 1.05 18,092 18,092
1.20% 1.00 17,428 17,428
1.20% 1.00 17,628 17,628
1.20% 1.00 17,831 17,831
1.20% 1.00 18,036 18,036
1.20% 1.00 18,243 18,243
1.20% 0.80 14,762 14,762
1.20% 0.80 14,932 14,932
1.20% 0.80 15,104 15,104
1.20% 0.80 15,278 15,278
1.20% 0.80 15,454 15,454
1.20% 0.75 14,654 14,654
1.20% 0.75 14,823 14,823
1.20% 0.75 14,993 14,993
1.20% 0.75 15,166 15,166
1.20% 0.75 15,341 15,341
1.20% 0.65 13,448 13,448
2 3 4 5 6 7 8 9
4 5 6 7 8 9 10 11
2004 2005 2006 2007 2008 2009 2010 2011
463 472 479 486 493 501 508 516
15,742 16,088 16,273 16,460 16,650 16,841 17,035 17,231
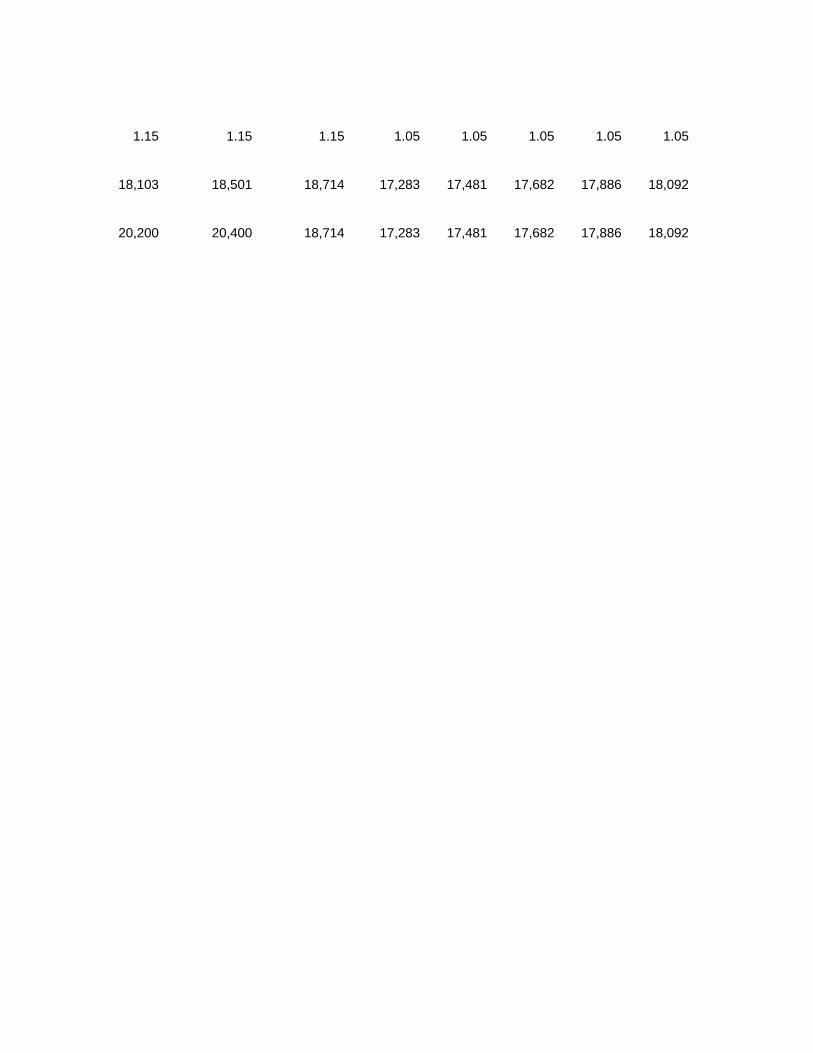
1.15 1.15 1.15 1.05 1.05 1.05 1.05 1.05
18,103 18,501 18,714 17,283 17,481 17,682 17,886 18,092
20,200 20,400 18,714 17,283 17,481 17,682 17,886 18,092

10 11 12 13 14 15 16 17 18
12 13 14 15 16 17 18 19 20
2012 2013 2014 2015 2016 2017 2018 2019 2020
524 532 540 548 556 564 573 581 590
17,429 17,629 17,832 18,037 18,245 18,454 18,667 18,881 19,098

1.00 1.00 1.00 1.00 1.00 0.80 0.80 0.80 0.80
17,428 17,628 17,831 18,036 18,243 14,762 14,932 15,104 15,278
17,428 17,628 17,831 18,036 18,243 14,762 14,932 15,104 15,278

19 20 21 22 23 24 25
21 22 23 24 25 26 27
2021 2022 2023 2024 2025 2026 2027
599 608 617 626 636 645 655
19,318 19,540 19,765 19,992 20,222 20,455 20,690

0.80 0.75 0.75 0.75 0.75 0.75 0.65
15,454 14,654 14,823 14,993 15,166 15,341 13,448
15,454 14,654 14,823 14,993 15,166 15,341 13,448