Embed Size (px)
Citation preview
Ocean Carrier Issues and Perspectives Shifting International Trade Routes, January 23 rd
Introduction
Dean Rodin
Managing Director – Maersk Line Caribbean Sea Cluster
page 2
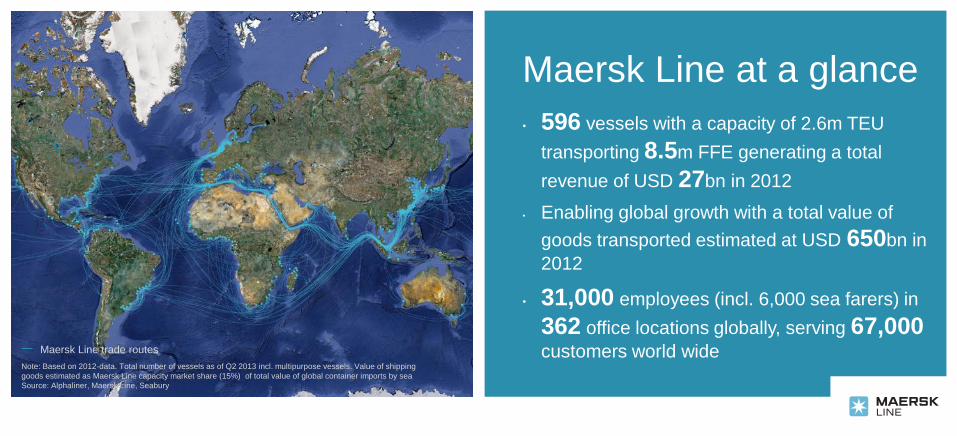
Maersk Line at a glance
• 596 vessels with a capacity of 2.6m TEU
transporting 8.5m FFE generating a total
revenue of USD 27bn in 2012
• Enabling global growth with a total value of
goods transported estimated at USD 650bn in
2012
• 31,000 employees (incl. 6,000 sea farers) in
362 office locations globally, serving 67,000
customers world wide Note: Based on 2012-data. Total number of vessels as of Q2 2013 incl. multipurpose vessels. Value of shipping
goods estimated as Maersk Line capacity market share (15%) of total value of global container imports by sea
Source: Alphaliner, Maersk Line, Seabury
Maersk Line trade routes
page 3
page 4
Liner Shipping is today a
Commoditized Industry and Low
Cost is the Key to Success
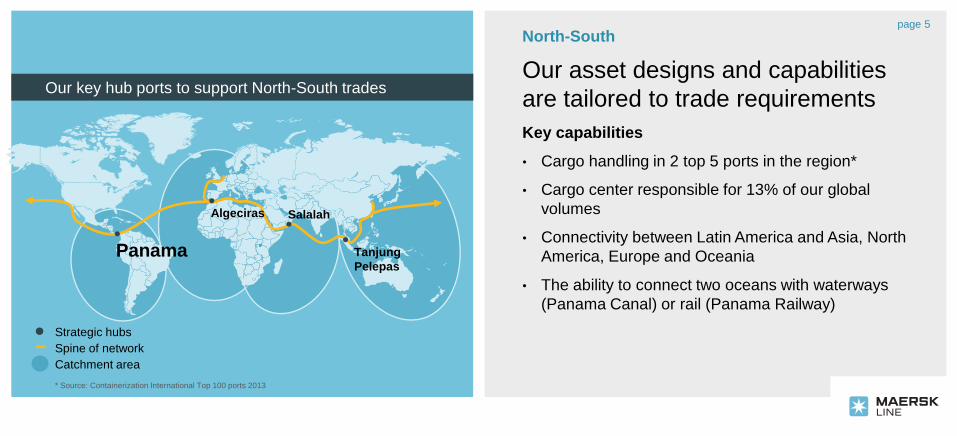
Key capabilities
• Cargo handling in 2 top 5 ports in the region*
• Cargo center responsible for 13% of our global
volumes
• Connectivity between Latin America and Asia, North
America, Europe and Oceania
• The ability to connect two oceans with waterways
(Panama Canal) or rail (Panama Railway)
Salalah
Tanjung
Pelepas Panama
Algeciras
Catchment area
Spine of network
Strategic hubs
North-South
Our key hub ports to support North-South trades
Our asset designs and capabilities
are tailored to trade requirements
* Source: Containerization International Top 100 ports 2013
page 5
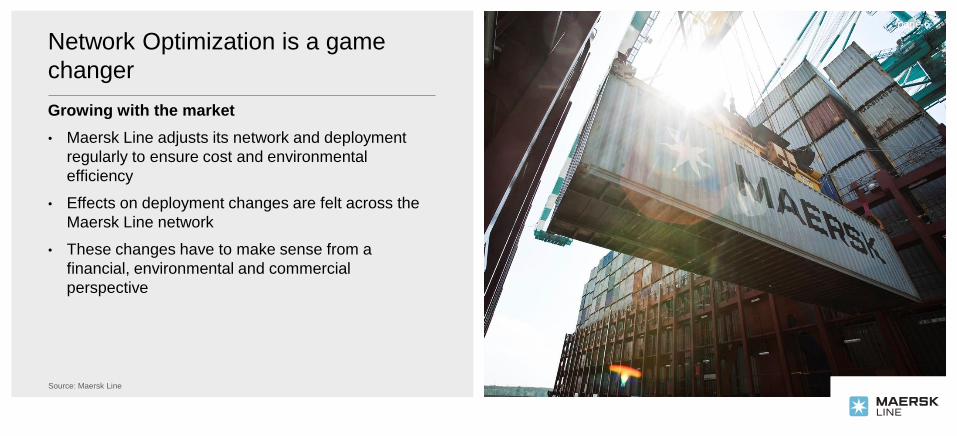
Network Optimization is a game
changer
Growing with the market
• Maersk Line adjusts its network and deployment
regularly to ensure cost and environmental
efficiency
• Effects on deployment changes are felt across the
Maersk Line network
• These changes have to make sense from a
financial, environmental and commercial
perspective
Source: Maersk Line
page 6
Source: Maersk Line
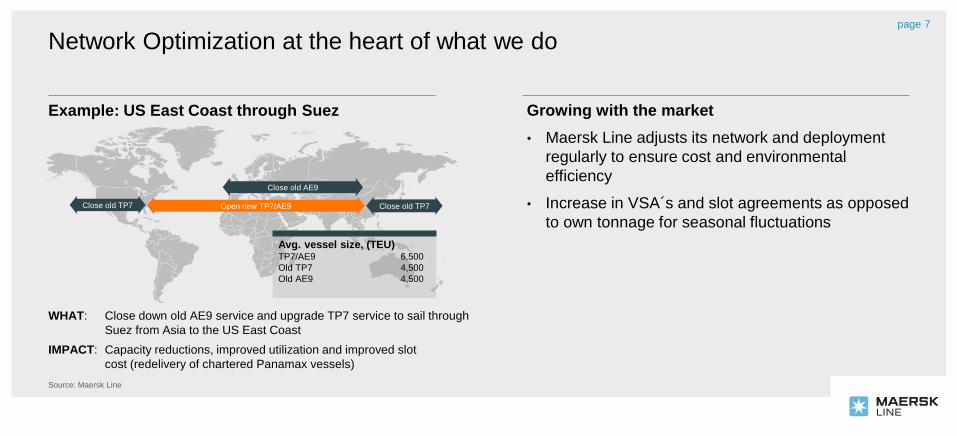
Close old TP7 Close old TP7
Close old AE9
Open new TP7/AE9
Example: US East Coast through Suez
WHAT: Close down old AE9 service and upgrade TP7 service to sail through
Suez from Asia to the US East Coast
IMPACT: Capacity reductions, improved utilization and improved slot
cost (redelivery of chartered Panamax vessels)
Avg. vessel size, (TEU) TP7/AE9 6,500
Old TP7 4,500
Old AE9 4,500
Network Optimization at the heart of what we do page 7
Growing with the market
• Maersk Line adjusts its network and deployment
regularly to ensure cost and environmental
efficiency
• Increase in VSA´s and slot agreements as opposed
to own tonnage for seasonal fluctuations
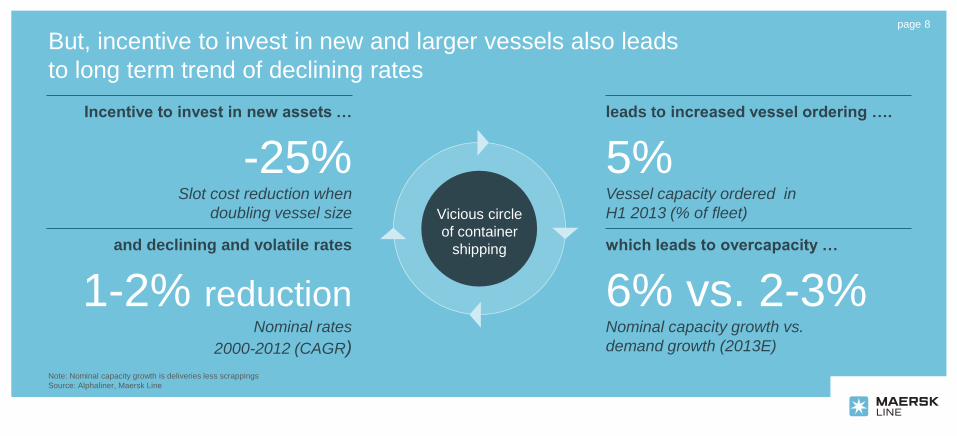
Incentive to invest in new assets … leads to increased vessel ordering ….
and declining and volatile rates which leads to overcapacity …
But, incentive to invest in new and larger vessels also leads
to long term trend of declining rates
-25% Slot cost reduction when
doubling vessel size
5% Vessel capacity ordered in
H1 2013 (% of fleet)
6% vs. 2-3% Nominal capacity growth vs.
demand growth (2013E)
1-2% reduction Nominal rates
2000-2012 (CAGR)
Note: Nominal capacity growth is deliveries less scrappings
Source: Alphaliner, Maersk Line
Vicious circle
of container
shipping
page 8
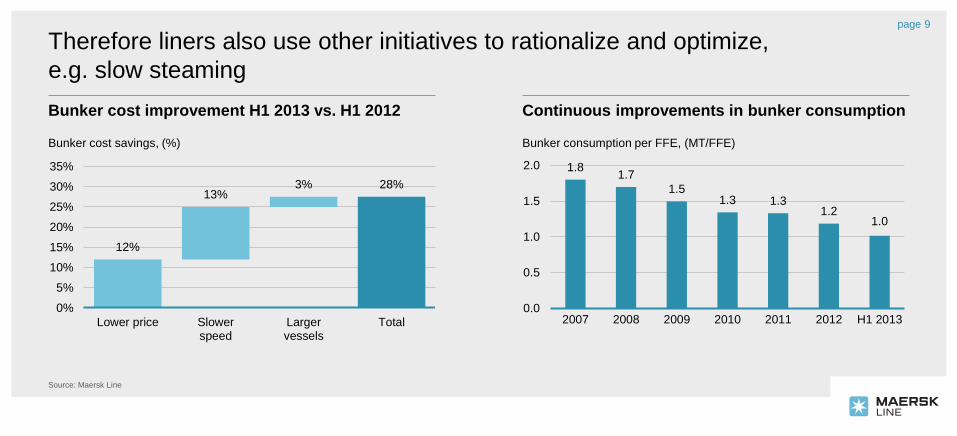
Therefore liners also use other initiatives to rationalize and optimize,
e.g. slow steaming
Source: Maersk Line
1.8 1.7
1.5 1.3 1.3
1.2 1.0
0.0
0.5
1.0
1.5
2.0
2007 2008 2009 2010 2011 2012 H1 2013
Continuous improvements in bunker consumption
Bunker consumption per FFE, (MT/FFE)
Bunker cost improvement H1 2013 vs. H1 2012
12%
13% 3% 28%
Lower price Slowerspeed
Largervessels
Total
0%
5%
10%
15%
20%
25%
30%
35%
Bunker cost savings, (%)
page 9
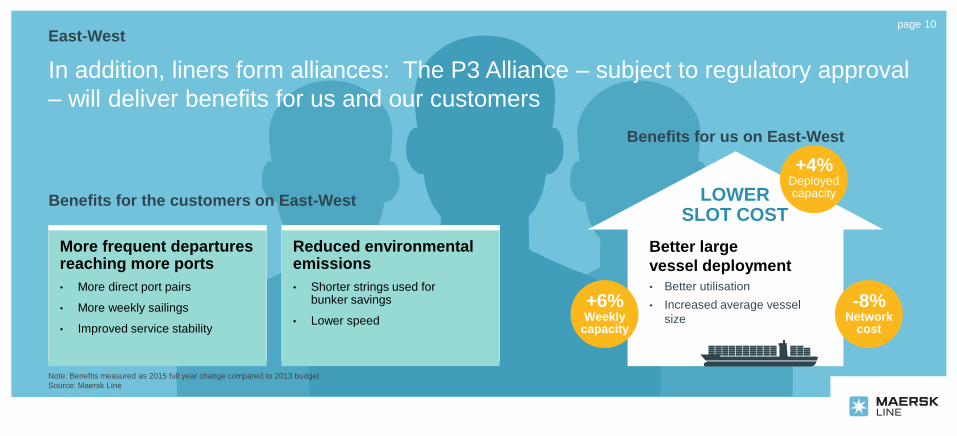
Better large
vessel deployment
• Better utilisation
• Increased average vessel
size
In addition, liners form alliances: The P3 Alliance – subject to regulatory approval
– will deliver benefits for us and our customers
East-West
Benefits for the customers on East-West
Benefits for us on East-West
LOWER SLOT COST
More frequent departures reaching more ports
• More direct port pairs
• More weekly sailings
• Improved service stability
Reduced environmental emissions
• Shorter strings used for bunker savings
• Lower speed
Note: Benefits measured as 2015 full year change compared to 2013 budget.
Source: Maersk Line
+4% Deployed capacity
-8% Network
cost
+6% Weekly
capacity
page 10
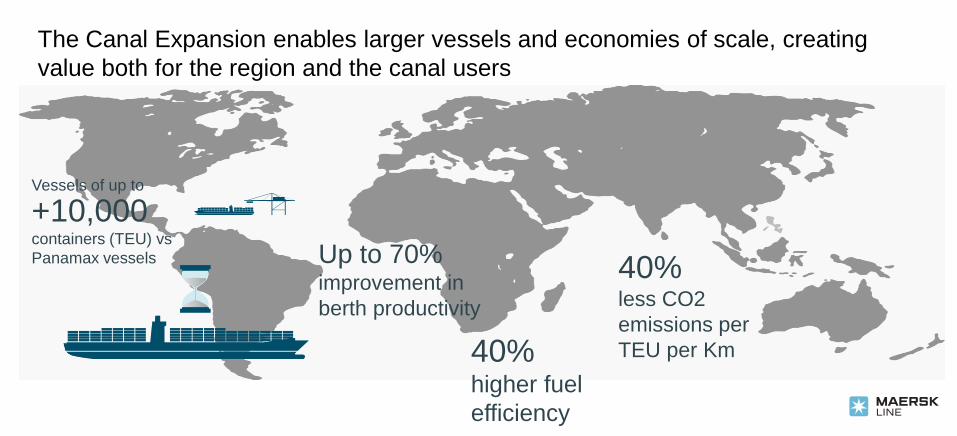
The Canal Expansion enables larger vessels and economies of scale, creating
value both for the region and the canal users
Up to 70% improvement in
berth productivity
Vessels of up to
+10,000
containers (TEU) vs
Panamax vessels
40% higher fuel
efficiency
40% less CO2
emissions per
TEU per Km
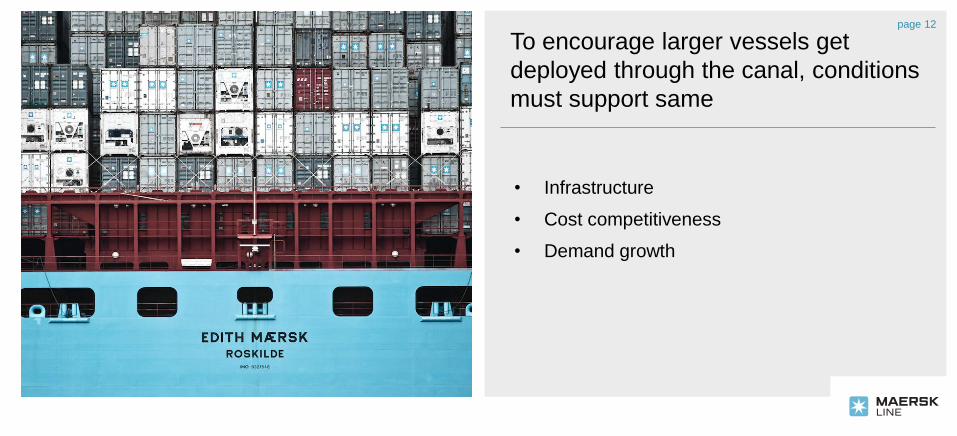
page 12
To encourage larger vessels get
deployed through the canal, conditions
must support same
• Infrastructure
• Cost competitiveness
• Demand growth
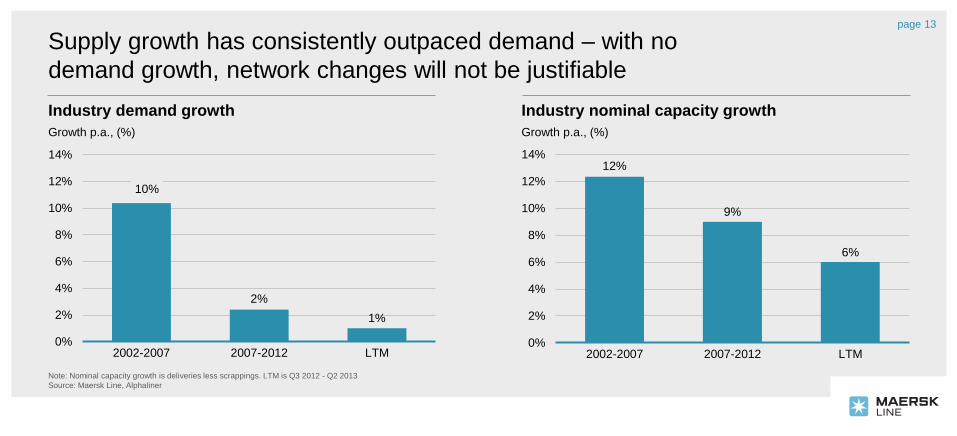
12%
9%
6%
0%
2%
4%
6%
8%
10%
12%
14%
2002-2007 2007-2012 LTM
10%
2%
1%
0%
2%
4%
6%
8%
10%
12%
14%
2002-2007 2007-2012 LTM
Industry demand growth
Note: Nominal capacity growth is deliveries less scrappings. LTM is Q3 2012 - Q2 2013
Source: Maersk Line, Alphaliner
Growth p.a., (%)
Industry nominal capacity growth
Growth p.a., (%)
page 13
Supply growth has consistently outpaced demand – with no
demand growth, network changes will not be justifiable
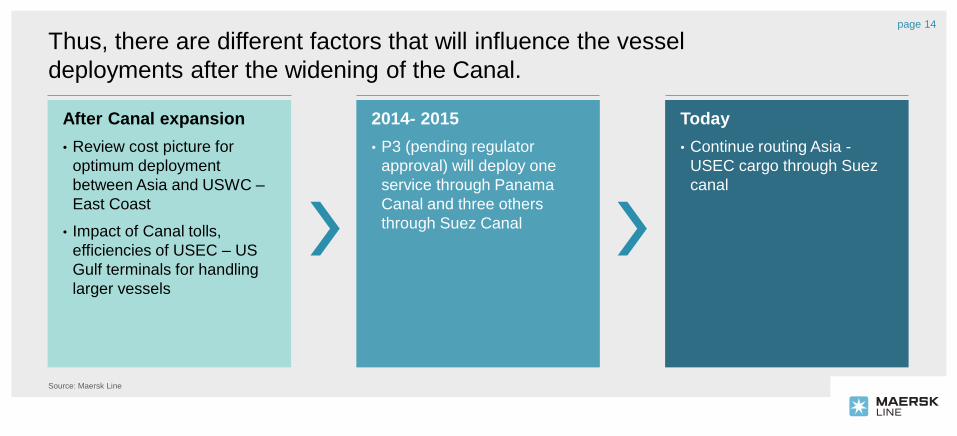
Thus, there are different factors that will influence the vessel
deployments after the widening of the Canal.
Source: Maersk Line
After Canal expansion
• Review cost picture for
optimum deployment
between Asia and USWC –
East Coast
• Impact of Canal tolls,
efficiencies of USEC – US
Gulf terminals for handling
larger vessels
Today
• Continue routing Asia -
USEC cargo through Suez
canal
2014- 2015
• P3 (pending regulator
approval) will deploy one
service through Panama
Canal and three others
through Suez Canal
page 14
Thank you


![T82 - Ocean Carrier Booking: Outbound Process Port to Portsapidp/012002523100005931022015E/... · Send Booking to Ocean Carrier [NWBC]; SAP TM Menu: NWBC Freight Order Management](https://img.pdfslide.us/doc/110x75/5a9f7b9c7f8b9a62178cc80d/t82-ocean-carrier-booking-outbound-process-port-to-port-sapidp012002523100005931022015esend.jpg)