Embed Size (px)
Citation preview
Ocean Carbonates: Global Budgets and Models
Michael Schulz
(Research Center Ocean Margins, Bremen)

9:15 - 10:45
1. The Role of marine calcium carbonate in the global carbon cycle- "Carbonate-compensation" mechanism
- Response times of the carbonate system
- Carbonate chemistry, alkalinity and control of pH
- Biological "carbonate pump"
2. The modern oceanic calcium carbonate budget- Quantifying carbonate sinks
- Quantifying carbonate sources (flux-based vs. alkalinity-based estimates)- Dissolution in the water column
- Dissolution in sediments
10:45 - 11:00 break

11:00 – 12:30
2. cont'd- Global budgets- Plankton group-specific budgets
3. Modeling the oceanic calcium carbonate budget- Glacial-interglacial cycles- Response to changes in ocean gateways

Course Material (this presentation)
www.geo.uni-bremen.de/geomod
English Pages
Teaching
European Graduate College in Marine Sciences
(at the bottom of the page)
“Script” (Powerpoint File)

Basic LiteratureIglesias-Rodriguez et al., 2002: Progress made in study of ocean's
calcium carbonate budget. EOS Transactions, American Geophysical Union, 83(34), 365-375.http://usjgofs.whoi.edu/mzweb/caco3_rpt.html
Milliman, J. D. and A. W. Droxler, 1996: Neritic and pelagic carbonate sedimentation in the marine environment: ignorance is not bliss. Geologische Rundschau, 85, 496-504.
Schneider, R. R. et al., 2000: Marine carbonates: their formation and destruction. Marine Geochemistry, H. D. Schulz and M. Zabel, Eds., Springer Verlag, 283-307.

1. The Role of Marine Calcium Carbonate in the Global Carbon Cycle
Ruddiman (2001)
Weathering feedback probably stabilizes atmospheric pCO2 at timescales ≥ 106 years

CaCO3 Compensation
River Input R(Ca2+, HCO3
-)
Production P
Dissolution D
Burial B
Today:P = 4 × RD = 3 × R
B = R
The burial rate of CaCO3 in deep-sea sediments is ultimately controlled by the dissolution rate, which adjusts to maintain steady state between river input (weathering) and burial.
Broecker and Peng, 1987: The role of CaCO3 compensation in the glacial to interglacial atmospheric CO2 change. Global Biogeochemical Cycles, 1, 15-29.
Example: (P = const.)
R ↓ → B initially too high (imbalance) → D ↑ → B ↓ until B = R

Sundquist (1993, Science)
Reservoir Sizes in [Gt C]Fluxes in [Gt C / yr]
Carbon-Cycle – Characteristic Timescales

CaCO3 Solubility and Saturation State of Seawater
• Saturation state
ksp: solubility product = f(pressure, T ,
S)
> 1: supersaturated
< 1: undersaturated
• Seawater: Changes in [Ca2+] are small changes in largely
controlled by [CO32-]
Zeebe and Wolf-Gladrow, 2001: CO2 in Seawater: Equilibrium, kinetics, isotopes. Elsevier.
2 2sw 3 sw
sp
[Ca ] [CO ] =
k
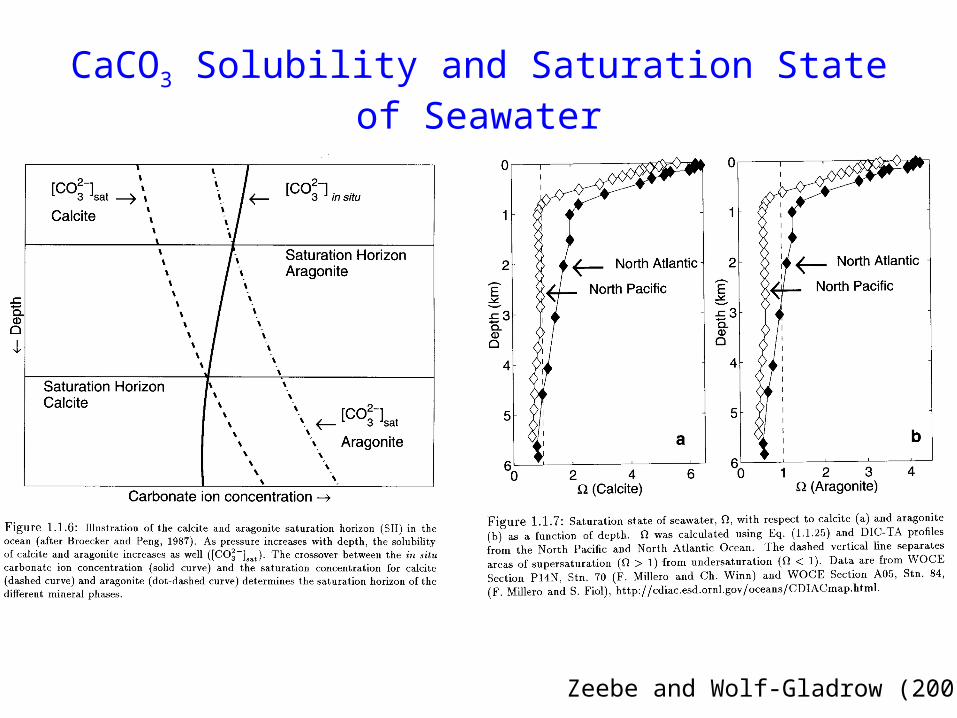
CaCO3 Solubility and Saturation State of Seawater
Zeebe and Wolf-Gladrow (2001)

Oceanic Carbonate Buffering System
Average surface-Water composition
CO2 0.5 %HCO3
- 89.0 %CO3
2- 10.5 %
-2 -2 2 3 3H Reaction: CO + H O + CO 2HCOp
Open Univ. “Seawater”

The Concept of Alkalinity• Chemical definition: Total Alkalinity (TA) measures the charges of the ions of
weak acids:
• Physical definition (based on principle of electroneutrality): Alkalinity = charge difference between conservative anions and cations:
• TA is a conservative quantity concentration unaffected by changes in temperature, pressure or pH
Zeebe and Wolf-Gladrow, 2001: CO2 in Seawater: Equilibrium, kinetics, isotopes. Elsevier.
22(ec) + 2+ 2+ +4 3TA = [Na ] + [Mg ] + 2[Ca ] + [K ] + ... [Cl ] 2[SO ] [NO ] ... = PA
2 +3 3 4TA PA = [HCO ] + 2[CO ]+ [B(OH) ] + [OH ] [H ]
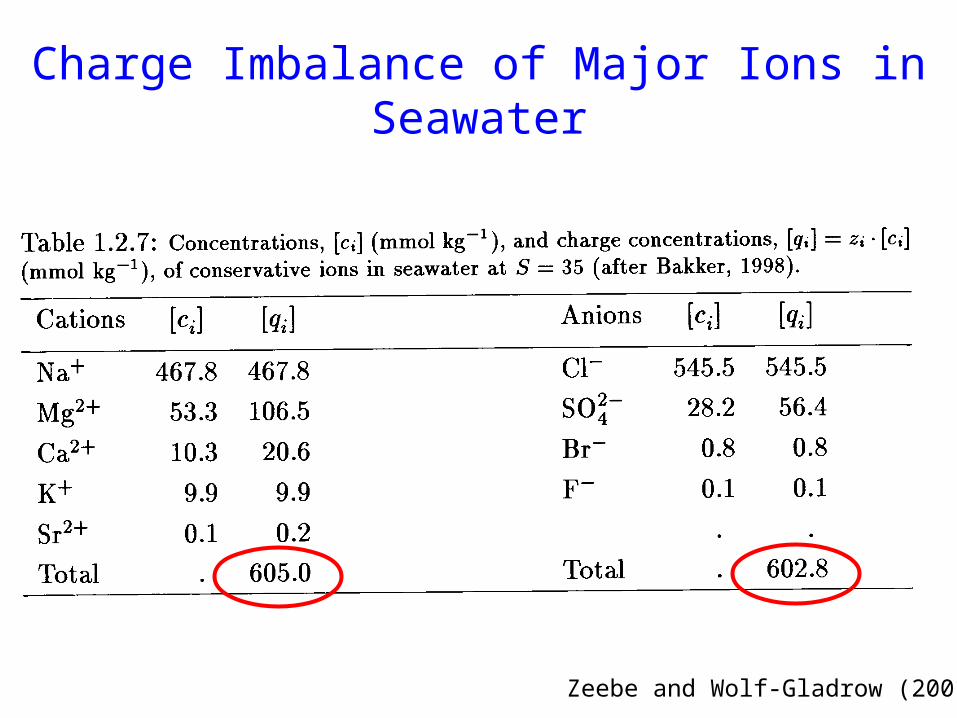
Charge Imbalance of Major Ions in Seawater
Zeebe and Wolf-Gladrow (2001)

Alkalinity as a Master Variable
• From Total Alkalinity (TA) and CO2 together with T and
S, all other quantities of the carbonate system can be quantified
From measurements of TA and CO2 the CaCO3
saturation state can be inferred
- -
- -
-
23 3
22 3 3
23 2
TA [HCO ] + 2[CO ]
CO [HCO ] + [CO ]
[CO ] TA - CO
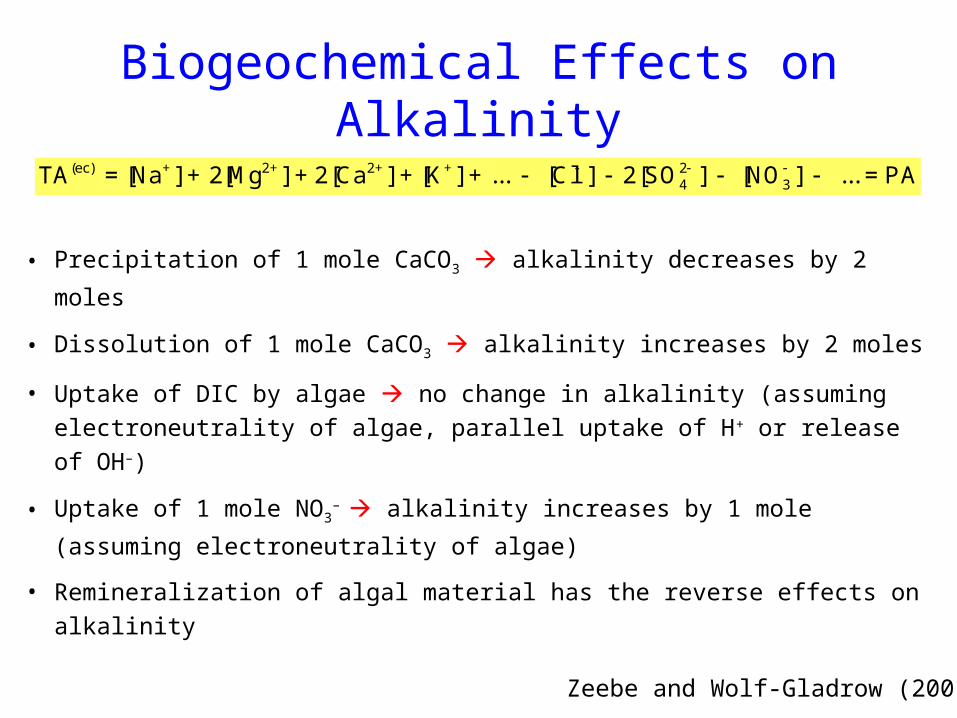
Biogeochemical Effects on Alkalinity
• Precipitation of 1 mole CaCO3 alkalinity decreases by 2 moles
• Dissolution of 1 mole CaCO3 alkalinity increases by 2 moles
• Uptake of DIC by algae no change in alkalinity (assuming
electroneutrality of algae, parallel uptake of H+ or release of OH–)
• Uptake of 1 mole NO3– alkalinity increases by 1 mole (assuming
electroneutrality of algae)
• Remineralization of algal material has the reverse effects on
alkalinity
22(ec) + 2+ 2+ +4 3TA = [Na ] + [Mg ] + 2[Ca ] + [K ] + ... [Cl ] 2[SO ] [NO ] ... = PA
Zeebe and Wolf-Gladrow (2001)

Biogenic Calcium Carbonate Production Raises Dissolved CO2 Concentration
2- -2 2 3 3CO + H O + CO 2HCO
pH Reaction:
(1) Biogenic carbonate uptake
(2) More bicarbonatedissociates
(3) More CO2 is formed
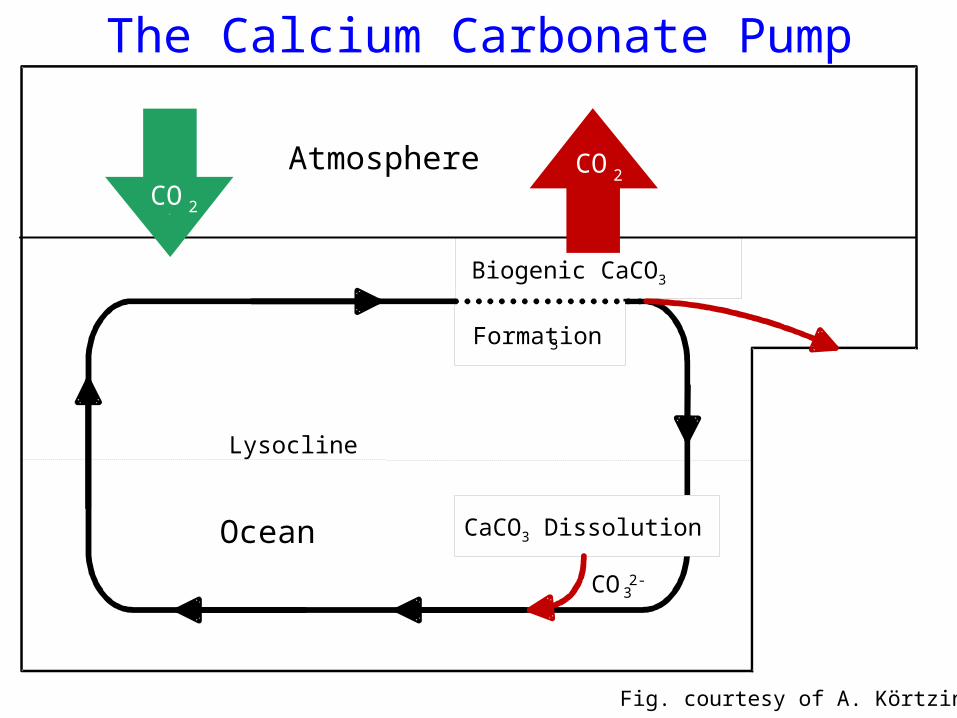
Atmosphere
Ocean
CO2
The Calcium Carbonate Pump
CaCO3 Dissolution
Lysocline
Biogenic CaCO3
Formation3
CO32-
CO2
Fig. courtesy of A. Körtzinger

Carbonate Concentration and CO2
• CaCO3 dissolution [CO32-] ↑ reacts with
CO2 to form HCO3- [CO2] ↓
• CaCO3 precipitation [CO32-] ↓ HCO3
-
dissociates [CO2] ↑
• As [CO32-] rises [CO2] drops and vice versa
2- -2 2 3 3CO + H O + CO 2HCO
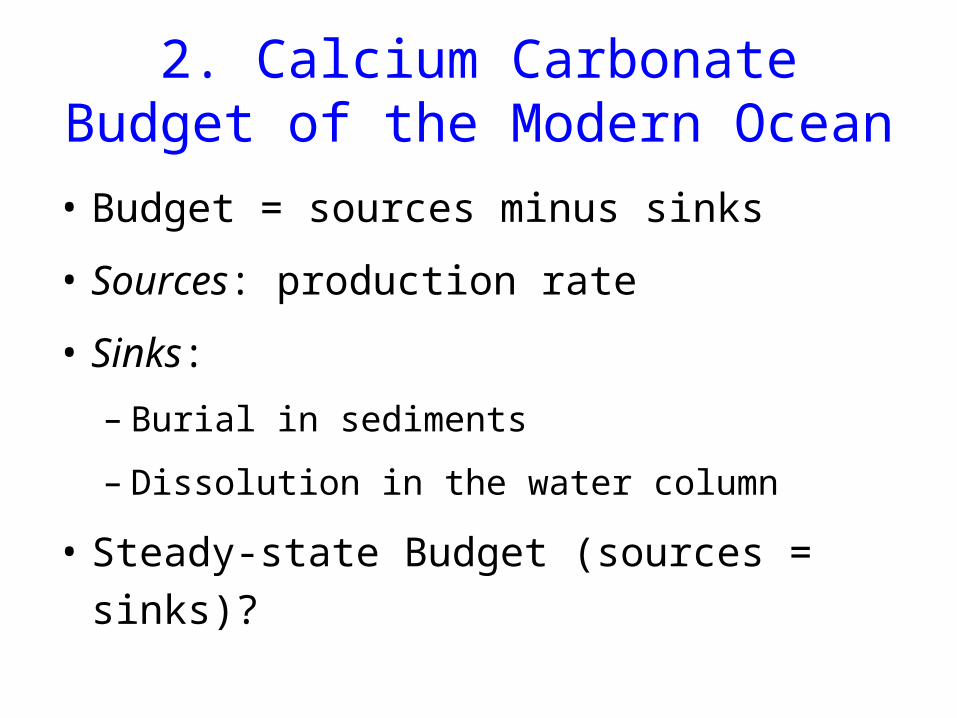
2. Calcium Carbonate Budget of the Modern Ocean
• Budget = sources minus sinks
• Sources: production rate
• Sinks:
– Burial in sediments
– Dissolution in the water column
• Steady-state Budget (sources = sinks)?
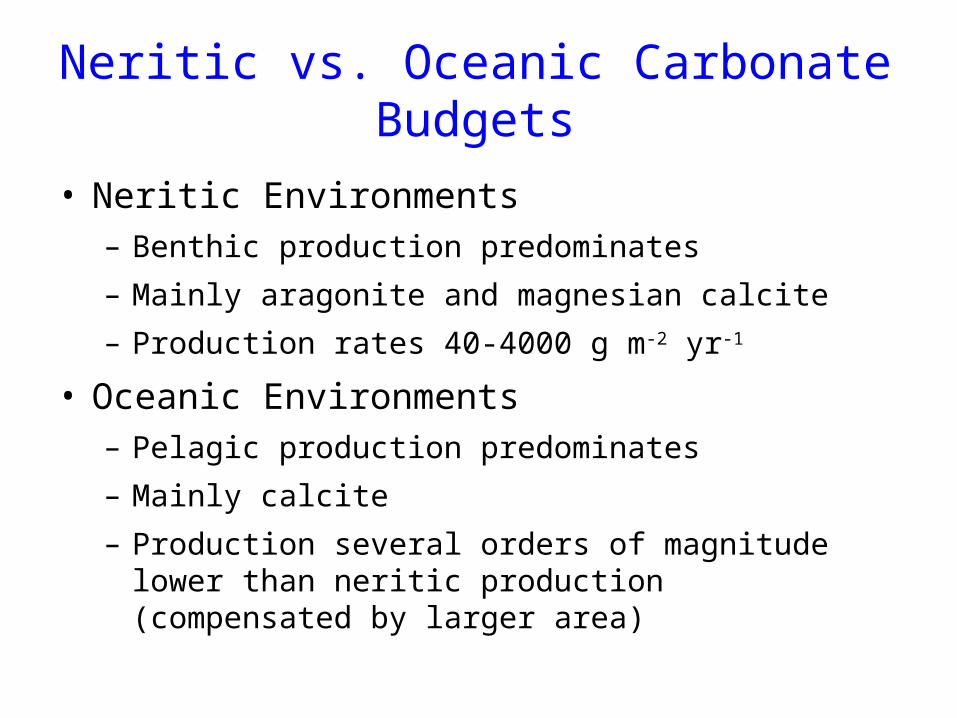
Neritic vs. Oceanic Carbonate Budgets
• Neritic Environments– Benthic production predominates
– Mainly aragonite and magnesian calcite
– Production rates 40-4000 g m-2 yr-1
• Oceanic Environments– Pelagic production predominates
– Mainly calcite
– Production several orders of magnitude lower than neritic production (compensated by larger area)

Deep-Ocean CaCO3 Burial Rate
• Catubig, N. R., D. E. Archer, R. Francois, P.
deMenocal, W. Howard, and E. F. Yu, 1998:
Global deep-sea burial rate of calcium carbonate
during the last glacial maximum.
Paleoceanography, 13, 298-310.
• Approach: Estimate CaCO3 burial from sediment
mass-accumulation rates (MAR)
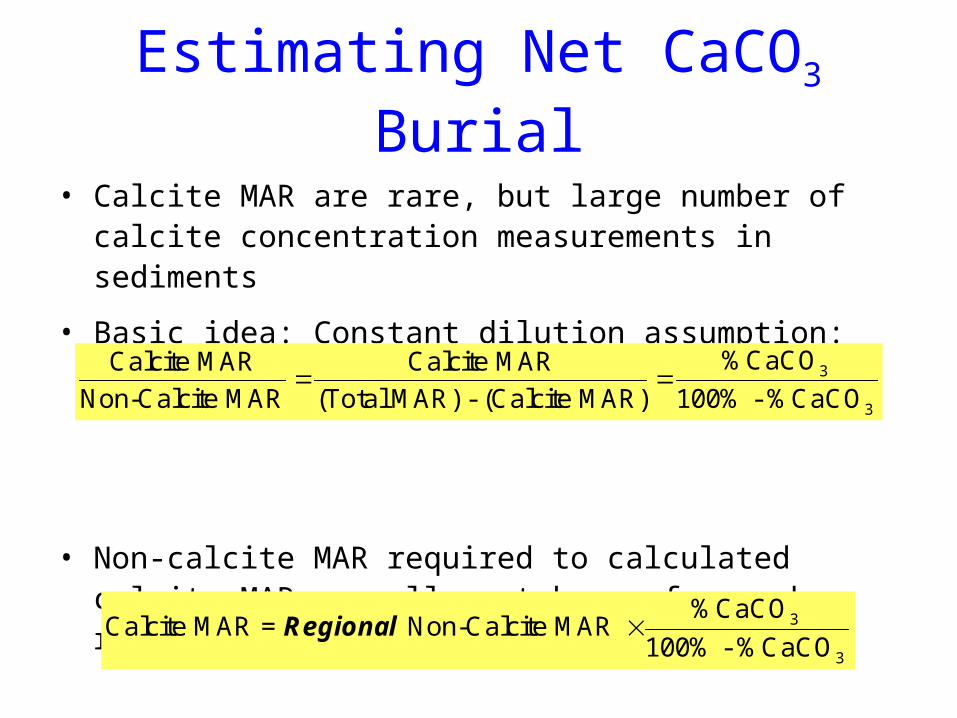
Estimating Net CaCO3 Burial
• Calcite MAR are rare, but large number of calcite concentration measurements in sediments
• Basic idea: Constant dilution assumption:
• Non-calcite MAR required to calculated calcite MAR; usually not known for each record use regional estimate instead
3
3
%CaCOCalcite MAR Calcite MAR
Non-Calcite MAR (Total MAR) - (Calcite MAR) 100% - %CaCO
3
3
%CaCOCalcite MAR = Non-Calcite MAR
100% - %CaCORegional

Percent Calcite Data –Locations of Modern Core Tops
• Note poor coverage in Indian and Southern Ocean• To obtain global coverage Extrapolation via regional
%CaCO3-depth relationshipsCatubig et al. (1998)

Mass-Accumulation Rate Data: Locations of Modern Core Tops
• Note poor data coverage.• Only 191 out of 349 data are utilized. Criterion: non-CaCO3 MAR uncorrelated with %CaCO3 in specified regions (otherwise violation of constant-dilution assumption)
Catubig et al. (1998)
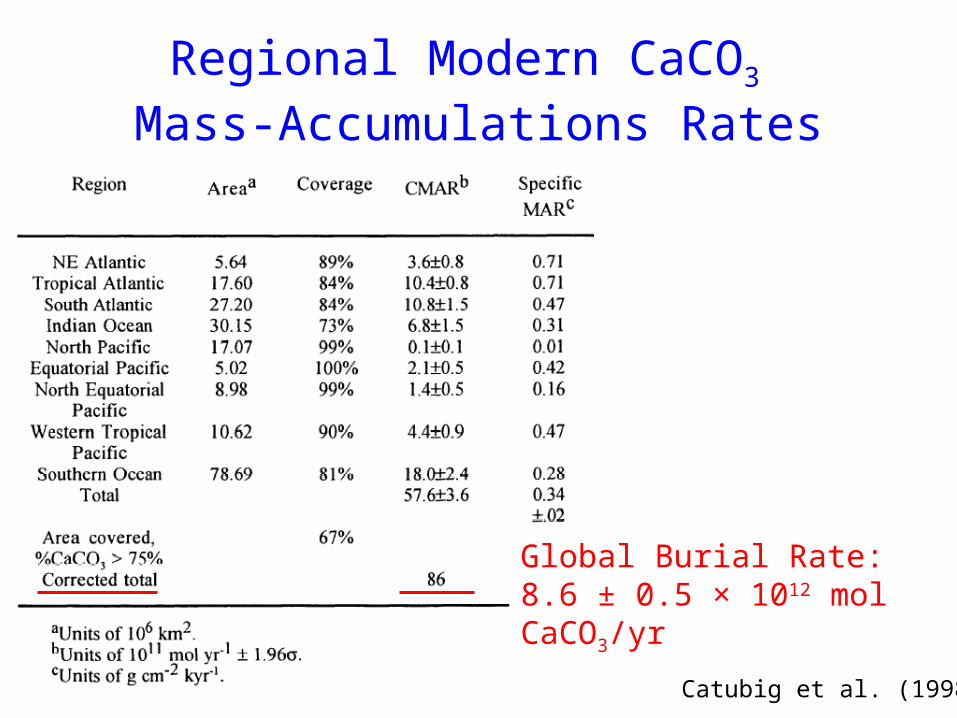
Regional Modern CaCO3 Mass-Accumulations Rates
Catubig et al. (1998)
Global Burial Rate:8.6 ± 0.5 × 10¹² mol CaCO3/yr
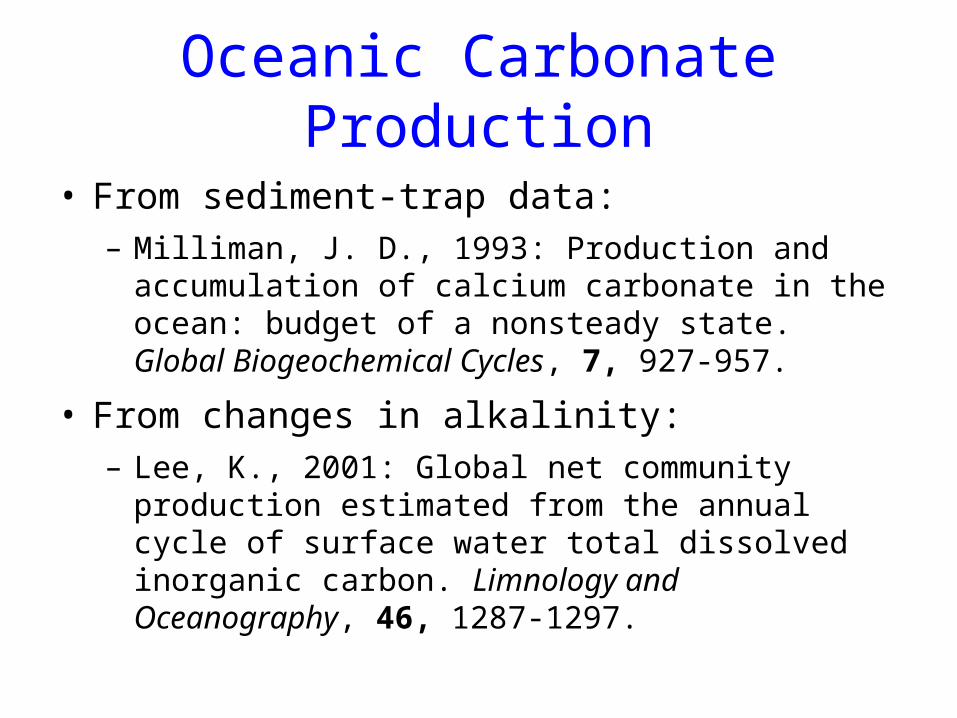
Oceanic Carbonate Production
• From sediment-trap data:– Milliman, J. D., 1993: Production and accumulation of
calcium carbonate in the ocean: budget of a nonsteady state. Global Biogeochemical Cycles, 7, 927-957.
• From changes in alkalinity: – Lee, K., 2001: Global net community production
estimated from the annual cycle of surface water total dissolved inorganic carbon. Limnology and Oceanography, 46, 1287-1297.

CaCO3 Production from Sediment Traps
• Sediment traps at > 500-1000 m depth monitor
CaCO3 production in overlying mixed layer
– Mooring well below mixed-layer to minimize effects of
turbulent mixing, horizontal advection and “swimmers”
• Key assumption: No dissolution in upper water
column
• Database: ~ 100 sediment traps with deployment
time ≥ 1 year

Modern CaCO3 Production from Sediment Traps (at 1000 m depth)
Milliman (1993); Milliman & Droxler (1996)
• Note poor data coverage• Isolines based on primary production contours (Berger, 1989)
TrapPosition
Global:24 × 1012 mol CaCO3/yr

Net CaCO3 Production from Alkalinity Data
• Basic idea: Biological CaCO3 precipitation reduces alkalinity in the surface water (Lee, 2001)
• Data: Global monthly surface-water alkalinity
– Derived from SST-alkalinity relationship (Millero et al., 1998; Mar. Chem.) [too few direct measurements]
– Mixed-layer depth (Levitus climatology ) and surface area for integration
• Corrections for:
– Freshwater exchange at sea-surface ( salinity normalized alkalinity)
– Mixing of water masses ( vertical diffusion)
– Biological NO3- uptake ( Derived from SST-NO3
- relation; Lee et al. 2000 GBC)

Modern Alkalinity-Based CaCO3 Production
Lee (2001)

Modern Alkalinity-Based Oceanic CaCO3 Production
Lee (2001)
Global:92 ± 25 × 1012 mol CaCO3/yr

CaCO3 Dissolution in the Water Column
• Discrepancy between sediment-trap and alkalinity-
based production rates
24 vs. 92 × 1012 mol CaCO3 / year
• Suggests 74 % dissolution in the upper 1000 m of
the ocean, i.e., well above the lysocline!
Sediment trap based fluxes ≠ Production rates

CaCO3 Dissolution in the Water Column – Possible Mechanisms
• Milliman, J. D. et al., 1999: Biologically mediated dissolution of calcium carbonate above the chemical lysocline? Deep - Sea Research Part I - Oceanographic Research Papers, 46, 1653-1669.
• Dissolution within
– guts and feces of grazers
– microenvironments with microbial oxidation of organic matter (e.g. in marine snow)
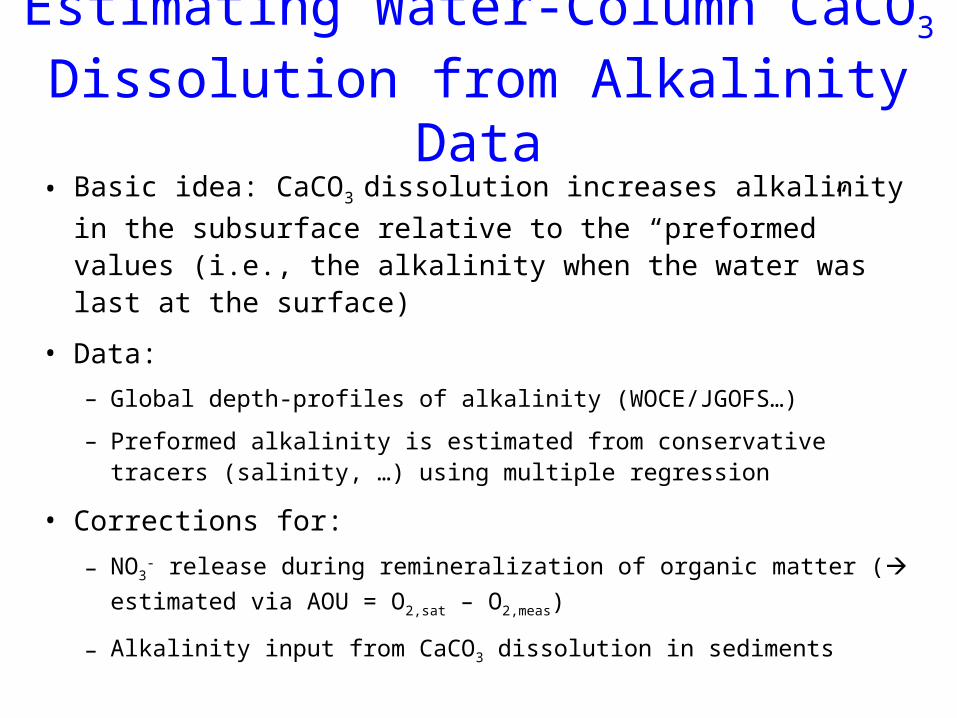
Estimating Water-Column CaCO3 Dissolution from Alkalinity Data
• Basic idea: CaCO3 dissolution increases alkalinity in the
subsurface relative to the “preformed” values (i.e., the alkalinity when the water was last at the surface)
• Data:
– Global depth-profiles of alkalinity (WOCE/JGOFS…)
– Preformed alkalinity is estimated from conservative tracers (salinity, …) using multiple regression
• Corrections for:
– NO3- release during remineralization of organic matter (
estimated via AOU = O2,sat – O2,meas)
– Alkalinity input from CaCO3 dissolution in sediments

Alkalinity Datain the
Atlantic Ocean
Chung et al. (2003)
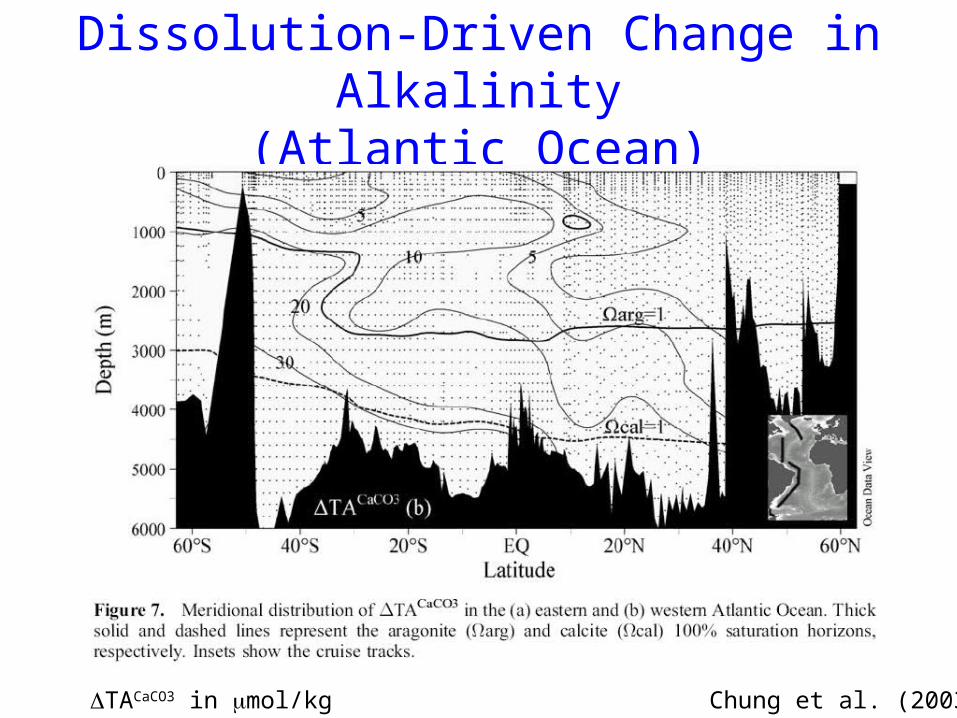
Dissolution-Driven Change in Alkalinity(Atlantic Ocean)
Chung et al. (2003)TACaCO3 in mol/kg

Water-Column Dissolution Rates of CaCO3
• Atlantic Ocean: 11.1 × 10¹² mol CaCO3 / yr (31 % of net production)
– Chung, S.-N. et al., 2003: Calcium carbonate budget in the Atlantic Ocean based on water column inorganic carbon chemistry. Global Biogeochemical Cycles, 17, 1093, doi:10.1029/2002GBC002001.
• Pacific Ocean: 25.8 × 10¹² mol CaCO3 / yr (74 % of net production)
– Feely, R. A. et al., 2002: In situ calcium carbonate dissolution in the Pacific Ocean. Global Biogeochemical Cycles, 16, 1144, doi:10.129/2002GBC001866.
• Indian Ocean: 8.3 × 10¹² mol CaCO3 / yr (~100 % of net production)
– Sabine, C. L. et al., 2002: Inorganic carbon in the Indian Ocean: Distribution and dissolution processes. Global Biogeochemical Cycles, 14, 1067, doi:10.129/2002GBC001869.
• Total: 45.2 × 10¹² mol CaCO3 / yr (~ 50 % of net production)

A Global Oceanic CaCO3 Budget
Modified after Milliman et al. (1999)
9
38
4592
96
(92-45-9)

CaCO3 Dissolution at the Seafloor
• Basic idea: Oxidation of organic matter in sediments releases metabolic CO2 and
promotes CaCO3 dissolution – even above
the seawater lysocline (Emerson, S. and M. Bender, 1981:
Carbon fluxes at the sediment-water interface of the deep-sea: calcium carbonate preservation. Journal of Marine Research, 39, 139-162.)

CaCO3 Dissolution at the Seafloor
Jahnke et al. (1997 GBC)OM = Organic Matter

Quantifying CaCO3 in Sediments
• Diagenetic model of calcium carbonate preservation (Archer, D., 1996: A data-driven model of the global calcite lysocline. Global Biogeochemical Cycles, 10, 511-526.)
• Input: Global distributions of:
– CaCO3 mass accumulation rates
– Organic carbon accumulation rates (“rain ratio”)
– [CO32-] and [O2] at sediment-water interface
• Total dissolution flux: 24-40 × 1012 mol CaCO3 / yr
Consistent with global budget (requires 38 × 1012 mol CaCO3 / yr)
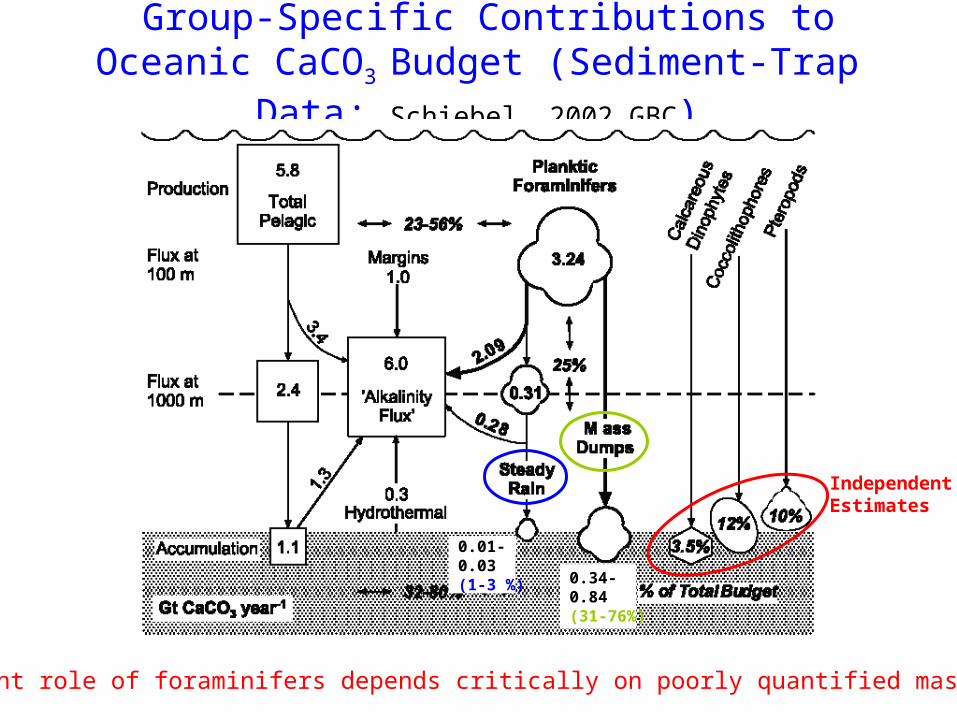
Group-Specific Contributions to Oceanic CaCO3
Budget (Sediment-Trap Data; Schiebel, 2002 GBC)
IndependentEstimates
0.01-0.03(1-3 %) 0.34-
0.84(31-76%)
Paramount role of foraminifers depends critically on poorly quantified mass dumps
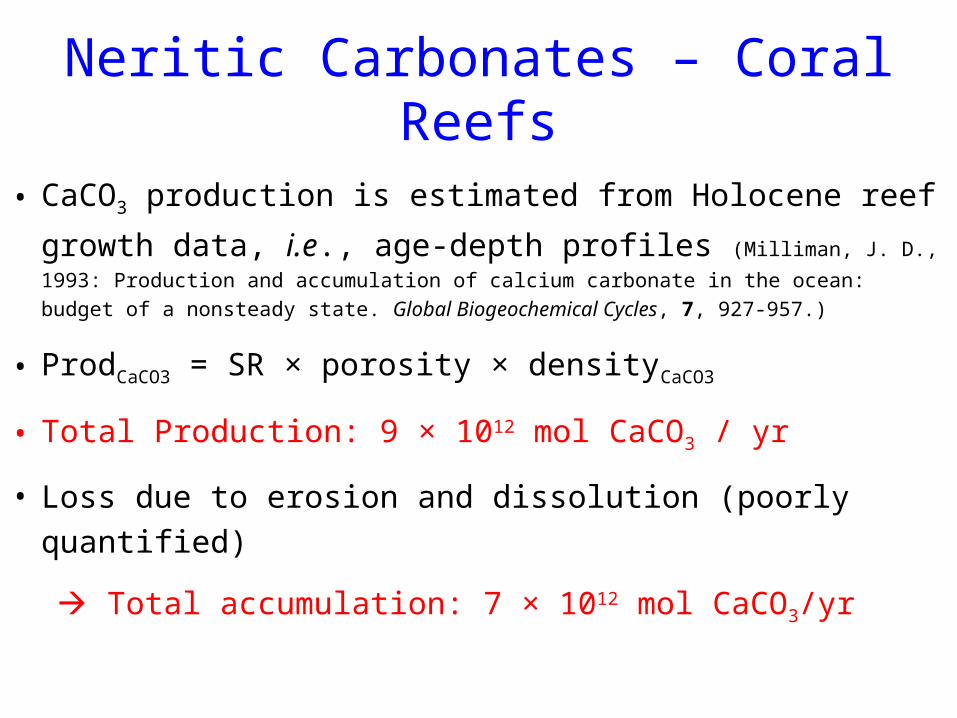
Neritic Carbonates – Coral Reefs
• CaCO3 production is estimated from Holocene reef
growth data, i.e., age-depth profiles (Milliman, J. D., 1993:
Production and accumulation of calcium carbonate in the ocean: budget of a
nonsteady state. Global Biogeochemical Cycles, 7, 927-957.)
• ProdCaCO3 = SR × porosity × densityCaCO3
• Total Production: 9 × 10¹² mol CaCO3 / yr
• Loss due to erosion and dissolution (poorly quantified)
Total accumulation: 7 × 10¹² mol CaCO3/yr

Neritic Carbonate Budget
Estimation of CaCO3 production similar to reefs (Milliman, 1993)
Milliman and Droxler (1996)
Total Production: ~ 25 × 1012 mol CaCO3 / yrTotal Accumulation: ~ 15 × 1012 mol CaCO3 / yr

Slope-Carbonate Budget
• “In terms of carbonate production and accumulation, however, [the slope environment] is practically undocumented” (Milliman, 1993)
• Estimates based on shallow sediment-trap data (Milliman and Droxler, 1996):
– Total Production: 5 × 10¹² mol CaCO3 / yr
– Import from shallower depths: 3.5 × 10¹² mol CaCO3 / yr
– Total accumulation: 6 × 10¹² mol CaCO3 / yr (based on the
assumption that 20 % of the slope and 40 % of the imported CaCO3 is dissolved)

Iglesias-Rodriguez et al. (2002; EOS 83(34))
A Global Marine CaCO3 Budget
Total Neritic Accumulation ≈ Total Oceanic (“Pelagic”) Accumulation
(Higher neritic production compensates for smaller area)

3. Modeling the Oceanic CaCO3 Budget
Aims:
• Consistent budget at a global scale
• Quantifying the interaction of the oceanic
carbonate budget with the remaining
carbon cycle
• Estimating past budget variations
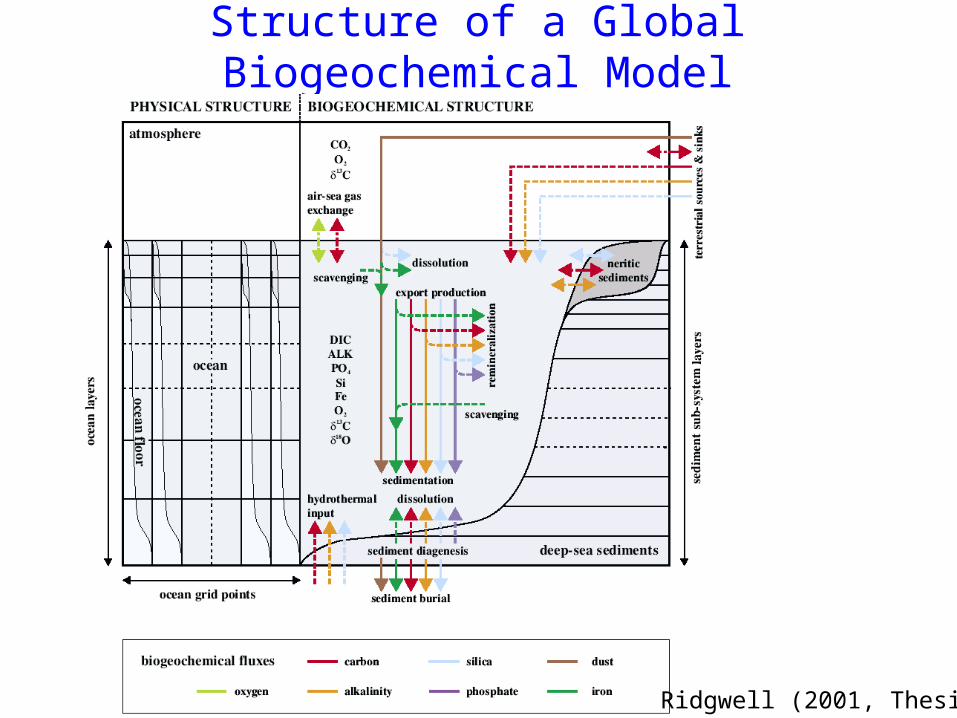
Structure of a Global Biogeochemical Model
Ridgwell (2001, Thesis)

Ridgwell (2001, Thesis)
Modeling Deep-Sea Sediments

A Modeled Sediment Stack in the North Atlantic
Heinze, C. et al., 1999: A global oceanic sediment model for long-term climate studies. Global Biogeochemical Cycles, 13, 221-250.

Modeled and Observed Modern CaCO3 Content of Deep-Sea Sediments
Heinze et al. (1999)
Even the most sophisticated biogeochemical models allow only for a crude approximation of the real world. Discrepancies are largely due to an inadequate resolution (e.g. MOR) and a lack of knowledge of the processes being involved.
Model Observations
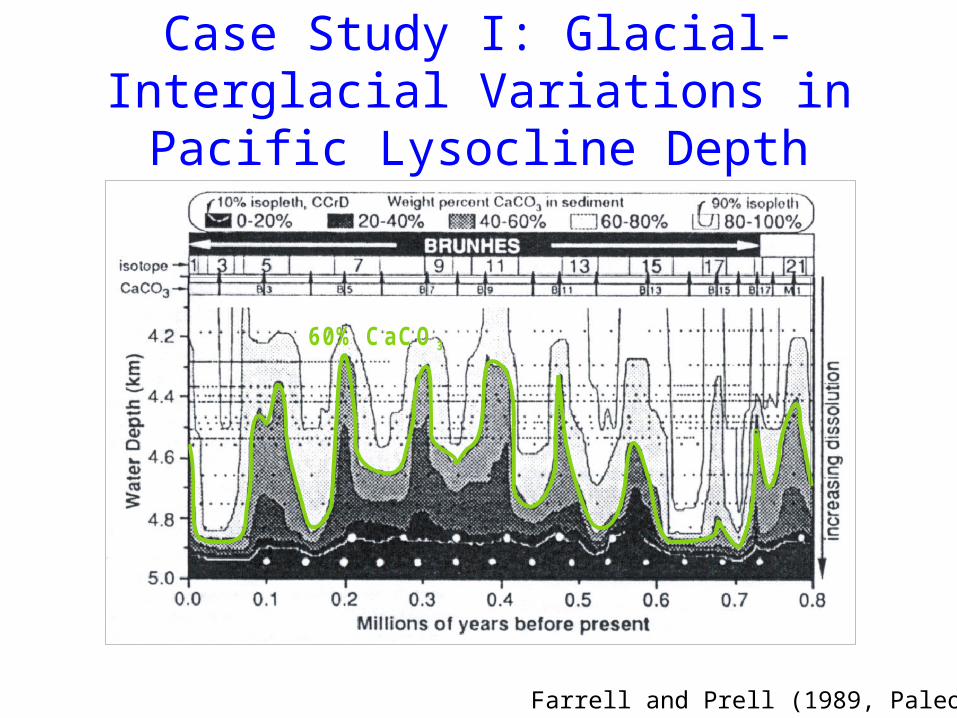
source: F a rre ll, J . W ., and W . L . P re ll, C lim atic change and C aC O preserva tion :A n 800 ,000 yea r ba thym etric recons truc tion from the cen tra l equa toria l P ac ific O cean,
, 4 , 447-466 , 1989
3
P a leoceanography
60% CaCO 3
Case Study I: Glacial-Interglacial Variations in Pacific Lysocline Depth
Farrell and Prell (1989, Paleoc.))

Modeled vs. Reconstructed Glacial-Interglacial Lysocline Variations
South Atlantic South Pacific
60 % (Farrell & Prell, 1989)
Model-Forcing: Prescribed changes in NADW formation, terrestrial carbon storage, neritic CaCO3 storage, among others (Ridgwell, 2001)
Glac. Deposition Reduced
Glac. Deposition Enhanced

Evolution of Ocean Gateways Since the Eocene
Fig. courtesy of W. W. Hay (GEOMAR, Kiel)

Heinze, C. and T. J. Crowley, 1997: Sedimentary response to ocean gateway circulation changes. Paleoceanography, 12, 742-754.
×
Change in Lysocline Depth [m]
Shallowing Deepening
Modelled Lysocline Response to Closing of the Panama Gateway
Reduced CaCO3 Preservation

Farrell, J. W. and W. L. Prell, 1991: Pacific CaCO3 preservation and 18O since 4 Ma: Paleoceanic and paleoclimatic implications. Paleoceanography, 6, 485-498.
Reconstructed Lysocline Response in the Easter Equatorial Pacific
Enhanced (!) CaCO3 Preservation
During Closure of Panama Gateway

Outlook• Convergence of independent oceanic budget estimates
seems achievable.
• Neritic budget still not better known than during the late 70’s.
• Within the uncertainties of the estimates, the modern budget is consistent with a steady state.
• The relative contributions of the various oceanic CaCO3
producers to the oceanic budget remains elusive.
• Initial model studies provide interesting results. However, discrepancies with reconstructions clearly warrant further investigations and model improvements.