Embed Size (px)
Citation preview

Resources and Energy Quarterly September 2016
Further Information
For more information on data or government initiatives please access the report from the Department’s website at:
www.industry.gov.au/oce
Chapter Authors
Macroeconomic outlook: Kristy Krautler and Ana Porta Cubas
Resources and energy overview: Marco Hatt and Kieran Bernie
Steel, iron ore and nickel: Monica Philalay
Metallurgical and thermal coal: Gayathiri Bragatheswaran
Oil and gas: Nikolai Drahos
Uranium: Mark Gibbons
Gold and copper: Joseph Moloney
Aluminium, alumina, bauxite and zinc: Thuong Nguyen
Acknowledgements
The authors would like to acknowledge the contributions of:
Mark Cully
Tim Bradley
Ross Lambie
Nicole Thomas
David Whitelaw
Laura Ling
Katya Golobokova
Cover image source: Shutterstock
Error! No text of specified style in document.OCE Report Template 1

© Commonwealth of Australia 2016
ISSN 1839-5007 [ONLINE]
Vol. 5, no. 5
This work is copyright. Apart from any use as permitted under the Copyright Act 1968, no part may be reproduced or altered by any process without prior written permission from the Australian Government. Requests and inquiries concerning reproduction and rights should be addressed to:
Department of Industry, Innovation and Science, GPO Box 9839, Canberra ACT 2601 or by emailing [email protected]
Creative Commons Licence
With the exception of the Coat of Arms, this publication is licensed under a Creative Commons Attribution 3.0 Australia Licence.Creative Commons Attribution 3.0 Australia Licence is a standard form license agreement that allows you to copy, distribute, transmit and adapt this publication provided that you attribute the work.
A summary of the licence terms is available from: http://creativecommons.org/licenses/by/3.0/au/deed.en
The full licence terms are available from: http://creativecommons.org/licenses/by/3.0/au/legalcode
The Commonwealth’s preference is that you attribute this publication (and any material sourced from it) using the following wording:Source: Licensed from the Commonwealth of Australia under a Creative Commons Attribution 3.0 Australia Licence.
Error! No text of specified style in document.OCE Report Template 2

ContentsForward
Executive summary
Macroeconomic outlook
Resource and energy overview
Steel
Iron ore
Metallurgical coal
Thermal coal
Gas
Oil
Uranium
Gold
Aluminium, alumina and bauxite
Copper
Nickel
Zinc
Trade summary charts
Appendix
Error! No text of specified style in document.OCE Report Template 3

ForewordPrices for most construction and steel making raw materials continued to grow in the last three months — despite expectations of decline — because of unexpectedly resilient demand from China’s construction sector and unforeseen supply disruptions.
The speculative activity in China’s commodity futures markets that led to high spot price volatility in the first half of 2016 has tapered off. This was supported by measures to reduce speculative trading, including increased commission fees, margin requirements and trading restrictions. Commodity prices should therefore better reflect market fundamentals going forward.
China’s economy — and its demand for construction raw materials — is slowing as it transitions away from investment-led growth to consumption-led growth. While any slowdown in the short term remains sensitive to government policy and stimulus measures, the likelihood of significant increases in demand from China for resource commodities is limited.
Australia’s suppliers are well-placed to satisfy demand for resources and energy over the next fifteen months, despite difficult operating conditions. In particular, production of most bulk commodities is forecast to increase, even as prices decline. As a result, Australia’s earnings from resources and energy exports are forecast to increase by 12 per cent to $176 billion in 2016–17.
Mark CullyChief EconomistDepartment of Industry, Innovation and Science
Error! No text of specified style in document.OCE Report Template 4

1. Macroeconomic Outlook
1.1 World economy
World economic conditions were generally softer in the June quarter of 2016. Europe experienced better-than-expected growth, while growth in the United States was weak. Productivity growth in most advanced economies remains slow. Global industrial activity and trade have also been lacklustre. In July, the volume of world trade fell 0.9 per cent year-on-year.
Poor trade outlooks and the continued uncertainty following the Brexit have led the International Monetary Fund (IMF) to make downward revisions to economic growth forecasts. The global economic growth outlook was marked down by 0.1 percentage point to 3.1 per cent in 2016 and 3.4 per cent in 2017. This is attributed to a weakened outlook for advanced economies, which are forecast to grow by 1.8 per cent in 2016 and 2017. The outlook remains unchanged for emerging markets and developing countries, at 4.1 per cent in 2016 and 4.6 per cent in 2017.
A number of ongoing risks continue to keep global economic prospects low. These include continued uncertainty for Europe and the United Kingdom following the recent Brexit referendum, China’s continued reliance on borrowing to increase growth, and weak trade patterns coupled with growing protectionist sentiment around the world.
1.2 Outlook for key economies
China’s outlook remains steady despite weak private investment
Chinese growth remained unchanged in the June quarter, growing 6.7 per cent, year-on-year. Despite steady growth figures, investment and new construction has slowed as the stimulus from earlier in the year fades. The outlook for residential construction is discussed in Box 1. Private fixed asset investment grew only 2.1 per cent from January to July, due to weak non-state firm investment which fell by 1.0 per cent year-on-year.
In an effort to stimulate growth through private investment, the Chinese Government has made cost cutting a key policy goal. By financing local government debt, the central government intends to help boost revenues so local governments can cut business taxes. In addition to the central bank reducing financing costs, the labour ministry has lowered social pension payment obligations for business. The shift from business taxes to value-added taxes reduces the burden for business by 500 billion yuan (US$75 billion) a year. This should significantly cut business costs and encourage private non-state firm investment, allowing the economy to pursue growth in areas outside the housing market.
Figure 1.1: World trade volumes vs world trade values
Recent data suggests that while state-firm investment is weak, investment growth remains strong for state-owned enterprises. Competition with state firms and restricted access to some markets, particularly in the services
Error! No text of specified style in document.OCE Report Template 5

sector, is preventing private investment from taking full advantage of these reforms.
China’s imports from the rest of the world performed unexpectedly well in August, rising 1.5 per cent year-on-year, marking the first increase in 22 months. The rise was largely attributed to a stockpiling of resources as Chinese producers are expecting commodity prices may start to pick up in some areas. This follows a better-than-expected result for China’s manufacturing activity in August with the official index of manufacturing activity reaching 50.4 indicating the sector is expanding. These positive indicators for both imports and manufacturing may indicate domestic demand is improving.
Box 1.1: The outlook for the Chinese housing sector
The Chinese housing sector has experienced marked growth since its liberalisation in the late 1990s, when the government decision to abolish employer-allocated housing spurred a residential construction boom. Much of this growth in the sector has continued to be policy driven, and there are questions about the future sustainability of growth in the absence of policy interventions. Any slowdown in housing construction poses risks for exports of commodities used in construction, including iron ore, metallurgical coal and copper. Australia is highly dependent on the Chinese demand for construction raw materials—over 80 per cent of Australia’s iron ore exports go to China.
Chinese governments have traditionally been highly involved in modulating demand in the housing sector, including managing differences in demand between cities. One of the Central Government’s five goals for 2016 was to reduce housing inventories and stabilise the housing market. In early 2016, it undertook a number of steps, most notably lowering interest rates and business taxes in cities other than the more desirable cities of Beijing, Shanghai, Guangzhou and Shenzhen. The Central Bank also eased lending standards, lowering the necessary mortgage down-payment for first homes from 25 to 20 per cent and from 40 to 30 per cent for second home buyers. These stimulus measures resulted in a spike in construction completions growth in early 2016, following a decline post 2012.
The future growth of the Chinese housing sector is uncertain. The Chinese Central Government is focussed on moving from investment to consumption-led growth, and earlier this year stated no excessive stimulus would be required to achieve their growth targets in the immediate future. Additionally, the housing market has now matured and there is oversupply in the less desirable smaller and inland cities. It is therefore likely that the Chinese government will provide only a light touch in modulating housing construction in the medium term. As a result, the current uptick in China’s construction activity and commodity demand is unlikely to be sustained, which will place downward pressure on commodity export volumes over the outlook period. The outlook is sensitive to Central Government policy, and could change if the Government decides to once again stimulate housing demand through monetary and fiscal measures.
Figure 1.2: Floor space of completed residential buildings, annual growth
Error! No text of specified style in document.OCE Report Template 6

However, weakness in exports (which dropped 2.8 per cent year-on-year in August) and overcapacity in many sectors will continue to be a challenge for China’s economic transition.
China’s economic growth outlook remains steady from previous forecasts at 6.6 per cent for 2016 and 6.2 per cent in 2017. The growth forecast for 2016 falls within the government’s target of between 6.5 and 7.5 per cent.
1.3 Indian manufacturing continues to grow strongly
India’s GDP growth slowed to 7.1 per cent year-on-year in the June quarter. Strong growth in government spending and net exports were offset by slowdowns in both private consumption and investment growth. Consumption growth dropped to 6.7 per cent year-on-year, compared to the previous quarter result of 8.3 per cent. Private investment fell by 3.1 per cent year-on-year.
Sectors that contributed to lower-than-expected growth include mining and construction. Mining sector output declined by 0.4 per cent due to falls in the production of crude oil and natural gas. This is a significant drop for the mining sector, compared to previous growth of 8.3 per cent in the same quarter last year. Growth in construction slowed to 1.5 per cent, compared to growth of 5.6 per cent in same quarter last year.
Manufacturing continued to grow strongly. The sector grew 9.1 per cent in the June quarter year-on-year. This result was also reflected in the official index of factory activity which reached 52.6 in August, the highest level since July 2015. The index measures manufacturing performance with a result above 50 indicating that the sector is expanding.
Despite slowing growth in the June quarter, the forecast for India’s economy remains robust. Economic growth will be supported by a number of structural reforms, including the passing of a bill introducing a national Goods and Services Tax (GST) which is expected to commence in April 2017. It is expected this reform will add between 0.8 per cent and 1.7 per cent to economic growth following implementation in April 2017. The Indian economy is expected to grow by 7.4 per cent in both 2016 and 2017.
Figure 1.3: China’s imports and manufacturing activity
Figure 1.4: India’s construction and manufacturing gross value added
1.4 Japan’s exports remain weak amidst an appreciating yen
Japan’s economy grew 0.6 per cent year-on-year in the June quarter. Net exports and business investment remained weak as a higher yen hurt exporters, and businesses remained cautious. Japan remained in deflation, with consumer prices falling 0.5 per cent year-on-year in July. Meanwhile, industrial production fell 3.8 per cent year-on-year.
At the Bank of Japan’s September meeting, the governor chose not to further lower the -0.1 per cent interest rate on bank deposits. The governor noted that ultra-low long-term interest rates were hurting the investment returns of insurance and pension companies and damaging business sentiment.
Error! No text of specified style in document.OCE Report Template 7

The Japanese Government has announced stimulus measures of 13.5 trillion yen (US$13 billion) in the form of cash payouts to low-income earners and infrastructure spending. In doing so, the government hopes to encourage greater spending to reverse the trend of deflation and encourage economic growth.
These measures have supported an appreciation of the yen, which make Japan’s exports more expensive for other countries. Exports fell 14 per cent year-on-year in July, marking the tenth month in a row for falling exports. As a result, the IMF’s growth forecast for Japan in 2016 has been reduced by about 0.2 percentage points to 0.3 per cent.
A delay in the increase of the consumption tax from April 2017 to October 2019 has improved growth prospects for Japan in 2017. However, any benefit to growth will be moderated by a higher yen that continues to hurt exports.
1.5 South Korea faces increased competition from Chinese manufacturing
South Korea’s economy picked up in the June quarter, growing 3.1 per cent year-on-year. Both private consumption and investment increased, though exports growth remained soft due to weak global demand.
Slowing demand from China has also hurt South Korean exporters. As Chinese manufacturers move up the value chain and produce higher quality goods, this could result in increased competition for South Korean exports in the future.
Figure 1.5: Growth in Japan’s exports
Figure 1.6: South Korea’s trade price indices
In an effort to stimulate growth, the South Korean government announced an 11 trillion won (US$10 billion) supplementary budget in August. The stimulus package is intended to help reduce the negative impact of corporate restructuring on the job market and complement the rate cut from the Bank of Korea in June.
South Korea’s economy is forecast to grow by 2.7 per cent in 2016, and 2.9 per cent in 2017. An unexpectedly sharp slowdown in China remains the biggest risk for South Korea, as China accounts for one quarter of South Korean exports. A planned restructuring of major industries may also lead to higher unemployment in the short run, and growing household debt could constrain private consumption.
1.6 United States shows gradual improvement
The United States (US) economy grew by 1.2 per cent year-on-year in the June quarter—the slowest in three years—although other economic indicators suggest stronger economic conditions. In particular, the labour market continues to show improvement.
Error! No text of specified style in document.OCE Report Template 8

US interest rates remain low with the Federal Reserve choosing not to increase interest rates at their September meeting. However, we expect a rate increase to be announced later in 2016.
An increase in the real US interest rate is generally associated with falling commodity prices (when denominated in US dollars) and an increase in the value of the US dollar. While a decline in commodity prices is negative for Australia’s commodity export revenue, an increase in the value of the US dollar is positive. These two effects are expected to broadly cancel out when considering the impact on Australian dollar commodity export revenues.
The US economy is forecast to grow by 2.2 per cent in 2016 and 2.5 per cent in 2017. Conditions in the US labour market are expected to remain relatively strong and should continue to support growth of consumption. This is likely to offset the ongoing weakness in overall business investment.
Figure 1.7: Unemployment rate and growth in personal incomes in the US
1.7 Europe faces uncertainty following Brexit decision
Economic growth in the European Union was 0.4 per cent in the June quarter, 1.8 per cent year-on-year. Economic growth is forecast to average 1.8 per cent in 2016, before increasing slightly to 1.9 per cent in 2017.
Heightened uncertainty following the United Kingdom’s (UK) decision to leave the European Union (EU) is putting downward pressure on growth. The UK’s decision is unlikely to have significant implications outside the EU. However, the decision led to the IMF downgrading growth prospects for the UK by 0.2 per cent in 2016 and 0.9 per cent in 2017.
Continued global uncertainties, weakening exports, and low consumer confidence are expected to continue to put pressure on the growth outlook. Fiscal constraints or reluctance to increase fiscal stimulus will put greater pressure on the European Central Bank to provide additional support to increase inflation and boost growth. In September, the Bank left rates unchanged, but the market continues to expect there will be further stimulus announced, most likely in December.
Error! No text of specified style in document.OCE Report Template 9

Table 1.1: Key world macroeconomic assumptions
Per cent 2013 2014 2015 2016 a 2017 a
Economic growth b
Advanced economies 1.2 1.9 1.9 1.8 1.8United States 1.5 2.4 2.4 2.2 2.5Japan 1.4 0.0 0.5 0.3 0.1European Union 28 0.3 1.4 2.0 1.8 1.9
Germany 0.4 1.6 1.5 1.6 1.2France 0.7 0.6 1.3 1.5 1.2United Kingdom 2.2 3.1 2.2 1.7 1.3
South Korea 2.9 3.3 2.6 2.7 2.9New Zealand 1.7 3.0 3.4 2.0 2.5Chinese Taipei 2.2 3.9 0.7 1.5 2.2
Emerging economies 4.9 4.6 4.0 4.1 4.6Non-OECD Asia 6.9 6.8 6.6 6.4 6.3
South East Asia d 5.1 4.6 4.8 4.8 5.1China e 7.7 7.3 6.9 6.6 6.2India 6.6 7.2 7.6 7.4 7.4
Latin America & Caribbean 3.0 1.3 0.0 –0.4 1.6Middle East 2.1 2.6 2.3 2.9 3.3
World c 3.3 3.4 3.1 3.1 3.4
Inflation rate b
United States 1.5 2.2 0.1 1.1 1.8Notes: a Assumption; b Change from previous period; c Weighted using 2012 purchasing power parity (PPP) valuation of country gross domestic product by IMF; d Indonesia, Malaysia, Philippines, Thailand and Vietnam; e Excludes Hong Kong Source: IMF (2016) World Economic Outlook
Error! No text of specified style in document.OCE Report Template 10

2. Resources and energy overview
2.1 Revisions to the outlook
The value of Australia’s resources and energy exports is forecast to increase by 12 per cent to $176 billion in 2016–17, revised up from the previous forecast of $163 billion. The upward revision in export values reflects revisions to the underlying price forecasts, not volumes.
This set of forecasts has been prepared against a backdrop of slightly higher prices than in the June quarter. The increase in prices primarily reflects unexpected persistence in the effects from the housing stimulus in China, in addition to weather and infrastructure related supply disruptions.
The most material revisions to the outlook for 2016–17 have been made to metallurgical coal and iron ore. The price of metallurgical coal has been revised up from US$85 a tonne to US$118 in 2016–17, adding $8 billion to Australia’s resource and energy export earnings over the year. The price of iron ore has been revised up from US$43 a tonne (FOB Australia) to US$47 a tonne adding US$4.7 billion to export revenues.
However, the recent price increases in metallurgical coal and iron ore are driven by temporary factors. The price of both commodities is expected to decline from current levels over the outlook period to the end of 2017.
Figure 2.1: Export earnings
2.2 Market summary
Conditions for Australian producers remained challenging in the first half of 2016, despite some lift in commodity prices driven by increased activity in China’s construction sector. Australia’s production of LNG and bulk commodities is forecast to increase over the outlook period as significant investments in new capacity undertaken over the last decade begin to deliver additional output. As a result, export earnings are forecast to increase by 12 per cent in 2016–17, to $176 billion.
2.3 Prices
Resource and energy commodity prices unexpectedly continued to grow since the release of June edition of the Resources and Energy Quarterly. While prices remain well below their mining boom peaks, most commodity spot prices are now higher than they were a year ago.
A resurgence in demand from China’s residential construction sector has supported higher prices for raw construction materials such as iron ore, metallurgical coal, copper and zinc; while the consolidation of China’s domestic coal mines has driven increased seaborne demand for thermal and metallurgical coal. Recent spikes in coal prices were also supported by production disruptions in Queensland. Gold prices also rose, fuelled by increased global economic uncertainty.
Error! No text of specified style in document.OCE Report Template 11

Prices for Australia’s resource and energy commodity exports reached 13 month highs in August 2016. Prices for bulk commodities and base metals both increased, although the increase was most pronounced in the bulks. The RBA commodity price index (non-rural component) increased 16 per cent in the first 8 months of the year in US dollar terms. However, an appreciation in the value of the Australian dollar has seen the index increase by only 11 per cent in Australian dollar terms.
Bulk commodity prices are generally forecast to remain relatively flat or fall slightly over the next 15 months, as weaker consumption growth compounds the effect of ample supply. The outlook for metals is slightly more positive, largely as a result of a relatively stronger consumption forecast. Prices for energy commodities are forecast to increase slightly over the outlook period, but excess capacity on the supply-side is likely to continue to constrain the pace and extent of any increases.
Figure 2.2: Commodity price movements
Also putting downward pressure on US dollar denominated commodity prices is the growing potential for the US Federal Reserve to raise interest rates. However, with the Australian dollar expected to decline from an US interest rate hike, Australian dollar commodity revenues are likely to be relatively unaffected by any such decision.
Risks to commodity prices over the outlook period remain linked to developments in China, where the full effect of efforts to remove excess production capacity in the thermal coal and steelmaking sectors remains unclear. In the near term, commodity price risks are also likely to depend on uncertainty surrounding the resilience of recent growth in the Chinese construction sector. More generally, commodity prices are expected to remain sensitive to the pace of the broader economic transition occurring within the Chinese economy.
Outside China, uncertainty about prospects for economic growth and the consequences of recent developments in Europe are also likely continue to influence commodity price risks.
2.4 Consumption
Consumption of commodities used in construction—including iron ore, metallurgical coal and copper—continues to be supported by a resurgence in demand from China’s residential construction sector. In the first seven months of 2016, the volume of newly started residential floor space in China grew 13 per cent year-on-year, largely as a result of increases associated with government stimulus measures introduced earlier in the year.
However, the uptick in China’s construction activity is unlikely to persist, and the use of commodities in the sector is forecast to decline over the outlook period. Despite a modest draw down in inventories in the first half of 2016, the residential property market remains oversupplied. Efforts by the Chinese Government to reduce excess steelmaking capacity may also see some reduction in demand for iron ore and metallurgical coal.
Error! No text of specified style in document.OCE Report Template 12

In general, metals consumption is forecast to increase over the next 15 months, driven by investments in electricity infrastructure and growing demand for household appliances. Growth in metals consumption will continue to be concentrated in emerging economies, and remains sensitive to changes in economic conditions.
Growth in global energy consumption is also expected to be driven by increased consumption in developing economies. However, the prospects for trade in energy commodities are mixed. Global thermal coal imports are forecast to decline in 2016 and 2017, as India reduces its dependence on imports and demand growth in China eases. In contrast, global imports of LNG are forecast to increase strongly, growing to 288 million tonnes in 2017, supplied by increased export capacity in Australia and the United States.
2.5 Production
Lower commodity prices have caused global production growth to slow markedly in recent years, with producers deferring or cancelling investment in additional capacity to reduce costs.
Although the price recovery in the first half of 2016 delivered some support to producers, the generally subdued outlook for prices means producers are likely to remain under financial pressure in the near-term.
In general, global bulk commodities markets are likely to remain well-supplied over the outlook period as major investments undertaken over the last decade reach full production capacity. However, there may be some tightness in global coal supply in the near-term due to production constraints in Indonesia and further declines in the volume of exports from the United States.
Production volumes for metals commodities are also generally expected to grow over the next 15 months. Gold production is forecast to increase, supported by further growth in recycled supply. Copper supply is also expected to grow, as additional supply from new investments in Peru and Kazakhstan offsets declines elsewhere.
In contrast, world nickel production is forecast to fall over the remainder of 2016 as a result of shut-downs in the Philippines. Nickel production is forecast to increase again in 2017 in line with returning capacity in the Philippines and Indonesia.
Markets for energy commodities are expected to remain well-supplied over the outlook period due to additional LNG production associated with new projects, and elevated stocks of crude oil and petroleum products.
2.6 Australia’s exploration, production and exports
Exploration
Although higher than a year ago, the price of most of Australia’s mineral commodities have declined considerably from their mining boom peaks. With the notable exception of gold, this has reduced the incentive for further minerals exploration. Similarly, the incentive for further petroleum exploration
Error! No text of specified style in document.OCE Report Template 13

has been dampened by weak oil prices. The Brent oil price increased in the first half of 2016, but remains less than half of what it was three years ago.
Mineral exploration expenditure increased 3 per cent year-on-year in the June quarter, growing to $354 million. However, petroleum exploration expenditure declined by 59 per cent year-on-year, to reach $283 million for the June quarter.
Figure 2.3 Australia’s exploration expenditure
Figure 2.4: Mineral exploration expenditure by state and territory
Figure 2.5: Mineral exploration by deposit type
Figure 2.6: Minerals exploration, metres drilled
The decline was most pronounced in the onshore sector, which recorded a 76 per cent year-on-year fall, to $59 million. Offshore exploration fell by 51 per cent year-on-year to $224 million, accounting for a larger share of the absolute decline.
The increase in mineral exploration expenditure in the June quarter was almost entirely attributable to increased gold exploration, which rose 40 per cent year-on-year, to reach $157 million. Gold prices have held up much better than most other mineral commodities in recent years with margins supporting further exploration.
A smaller contribution to increased mineral exploration was from copper, which increased 15 per cent year-on-year in the June quarter, to $32 million. Exploration for other mineral commodities continued to decline in the June quarter.
Mineral exploration expenditure increased in South Australia (up 62 per cent to $19 million), Victoria (up 27 per cent to $8 million), New South Wales (up 22 per cent to $31 million) and Western Australia (up 11 per cent to $228 million). This was partially offset by lower exploration expenditure in all other states and territories.
Mineral exploration expenditure targeting existing deposits increased 9 per cent year-on-year to $250 million, while expenditure at new deposits declined 9 per cent, to $104 million.
The generally subdued outlook for growth in commodities prices make increases in exploration expenditure over the outlook period unlikely.
Capital expenditure
The environment for investment in new mining projects remains challenging due to lower prices and tighter access to finance. Private capital expenditure in the mining sector declined by 30 per cent in 2015–16, to $53 billion. This was the lowest level in five years, although it remains well above levels observed prior to the onset of the mining boom. In the 10 years to 2002–03, annual capital expenditure in the mining sector averaged only $7.7 billion, around 14 per cent of current levels.
Error! No text of specified style in document.OCE Report Template 14

However, the pace of decline in mining investment is expected to slow. Mining businesses are planning capital expenditure of $42 billion in 2016–17, 22 per cent lower than in 2015–16.
Figure 2.7: Year-on-year change in petroleum exploration
Figure 2.8: Private mining capital expenditure
Employment
Employment in the mining sector declined in the September quarter, falling 9 per cent year-on-year to 222,300 people. The largest fall in occurred in Queensland, where employment contracted 11 per cent year-on-year to 61,100 people. Employment is likely to decline further over the outlook period as major projects move into the less labour-intensive production phase.
Production
The outlook for Australia’s production of bulk commodities remains generally positive, despite challenging conditions facing most producers. Production of iron ore is forecast to grow over the next year, supported by additional supply from the Roy Hill, Nammuldi and Jimblebar projects. Domestic production of metallurgical coal is also forecast to increase in 2016–17, as production returns to normal following outages in May. In contrast, thermal coal production is forecast to remain relatively flat over the next 9 months, as closures and suspensions just outweigh the effect of increasing production at a number of remaining mines.
Metals production is largely expected to increase over the outlook period, led by growth in gold, copper and alumina. Gold production is forecast to increase to 293 tonnes in 2016–17, mainly as a result of higher expected ore grades and additional supply from the new Matilda mine. Production of copper is also forecast to increase, in line with the expansion of the Olympic Dam project and additional output from the Mount Lyell mine. In contrast, Australia’s nickel production is forecast to decline over the outlook period, as lower mined output compounds the effect of falling refined production.
The outlook for Australia’s energy commodities is mixed. LNG production is forecast to continue to increase in line with growth in export capacity, supported by additional supply from the Gorgon project and stronger coal seam gas production on the east coast. In contrast, uranium production is forecast to decline over the outlook period. Oil production is also expected to fall in 2016–17 as natural decline outweighs increased condensate production.
Figure 2.9: Mining sector employment
Figure 2.10: Quarterly mining sector employment by state
Exports
The volume of Australia’s exports of resources and energy commodities generally increased year-on-year in the June quarter 2016, as growth in
Error! No text of specified style in document.OCE Report Template 15

exports of iron ore, metallurgical coal, gold, copper and LNG contrasted with declines in thermal coal, alumina, and crude oil.
The value of Australia’s exports increased in line with generally higher volumes, to reach $40 billion for the June quarter, led by strong year-on-year growth in earnings from exports of gold, iron ore and LNG.
The outlook for Australia’s resources and energy exports remains broadly positive, with export earnings forecast to increase 12 per cent in 2016–17, to $176 billion. The strongest growth in export earnings is expected to come from LNG, which is forecast to increase 41 per cent, from $17 billion in 2015–16 to $23 billion in 2016–17, supported by additional production at the Gorgon project and new capacity coming online on the east coast.
Continued growth in the volume of most bulk commodities exports is also expected to contribute to higher export earnings over the outlook period. The value of Australia’s exports of iron ore are forecast to increase 13 per cent, to reach $54 billion in 2016–17.
Figure 2.11 Australia’s resources and energy export earnings
Figure 2.12: Australia’s major resources and energy commodity exports
Error! No text of specified style in document.OCE Report Template 16

Table 2.1: Outlook for Australia’s resources and energy commodities
unit 2013–14 2014–15 2015–16 2016–17 f Per cent change
Value of exports
Resources and energy A$m 194,881 171,971 157,130 175,782 12.2
– real b A$m 205,500 178,286 160,682 175,782 9.7
Energy A$m 71,455 66,831 59,500 72,629 22.1
– real b A$m 75,348 69,285 60,845 72,629 19.4
Resources A$m 123,426 105,140 97,630 103,153 6.2
– real b A$m 130,152 109,001 99,837 103,153 3.8Notes: b In current financial year Australian dollars; f ForecastSource: ABS (2016) International Trade in Goods and Services, 5368.0; Department of Industry, Innovation and Science (2016)
Table 2.2: Australia’s resources and energy commodity exports, selected commodities
Volume Value
unit 2015–16 2016–17 f Per cent change 2015–16 2016–17 f Per cent change
Alumina kt 17,676 18,158 2.7 5,995 6,006 0.2Aluminium kt 1,441 1,399 -2.9 3,237 3,669 13.3Copper kt 1,055 1,056 0.1 8,124 7,992 –1.6Gold t 306 306 -0.2 15,674 16,277 3.8Iron ore Mt 786 851 8.2 47,766 53,570 12.2Nickel kt 216 178 -17.6 2,477 2,134 –13.8Zinc kt 1,509 921 -38.9 2,621 2,321 –11.5LNG Mt 37 51 39.6 16,557 23,357 41.1Metallurgical coal Mt 188 189 0.6 19,533 26,400 35.2Thermal coal Mt 200 204 1.6 14,698 14,167 –3.6Oil kbd 241 235 -2.6 5,467 5,776 5.7Uranium t 7,837 7,225 -7.8 959 917 –4.4Notes: f ForecastSource: ABS (2016) International Trade in Goods and Services, 5368.0; Department of Industry, Innovation and Science (2016)
Error! No text of specified style in document.OCE Report Template 17
3. Steel
3.1 Market overview
Global steel production is forecast to decline by 0.7 per cent to 1,605 million tonnes in 2016 and then increase by 0.8 per cent in 2017 to 1,618 million tonnes, broadly unchanged from the June quarter forecast.
The pace of decline in China’s steel production is expected to pick up as the effects of stimulus measures and housing policies implemented at the start of the year wane, and capacity cuts take effect. Steel production is forecast to continue to grow strongly in India, supported by trade restrictions and ambitious plans for infrastructure projects. Despite sharp falls in 2016, anti-dumping measures in the US and the EU are expected to support steel production growth in 2017, while production growth is expected to remain subdued in Japan and South Korea.
3.2 Steel production and consumption
China steel production forecast to fall in 2016 and 2017
Despite declining steel production in early 2016, China’s steel production increased by 1.5 per cent year-on-year in the three months to August due to growth in both domestic consumption and exports. Steel production in China is forecast to decline by 1.0 per cent in 2016 and by 2.5 per cent in 2017.
Production in 2016 has been revised up slightly. Higher than expected steel production was incentivised by stronger demand from the construction sector, which put upward pressure on steel prices, following stimulus measures implemented earlier in the year.
There are signs of slowing momentum in China’s construction sector, which accounts for 73 per cent of domestic steel use. Newly started residential buildings (in terms of floor space) grew 6 per cent year-on-year in the three months to August, in contrast to 18 per cent year-on-year growth earlier in the year in the three months to May.
China’s export growth remained strong in the three months to August, up 7 per cent year-on-year. Export growth was largely driven by the Philippines, Thailand and Vietnam. Partially offsetting this was steel products exports to the US, which fell by 69 per cent year-on-year through 2016 to July, dampened by anti-dumping measures.
Figure 3.1: Annual growth in world steel production
Figure 3.2: China’s steel consumption and residential construction
Overcapacity in the Chinese steel sector remains a key issue. Mandated capacity cuts are behind schedule, with firms and local governments reluctant to reduce steel capacity due to higher steel prices and concerns of mass unemployment.
Error! No text of specified style in document.OCE Report Template 18

Nevertheless, the central government has reaffirmed its commitment to achieving the 45 million tonne reduction target for the year, in part motivated by its case for being granted market economy status in the World Trade Organisation. In late August, the National Development and Reform Commission dispatched inspectors to steel producing provinces to monitor progress and ensure the completion of planned capacity cuts.
However, even if the annual target is achieved, it is unclear the extent to which capacity cuts will translate to a reduction in production, if higher prices encourage production growth at remaining plants.
There are moderate risks to the outlook though to 2017. A faster pace of capacity closures and increasingly stringent environmental regulations to lower emissions and improve local air quality present a downside risk to the outlook. On the upside, there is the possibility of further stimulus measures to boost the domestic construction industry.
India’s steel production forecast to grow in 2016 and 2017
Growth in India’s steel production accelerated to 7 per cent year-on-year in the three months to July, as major producers continued to ramp up production at newly commissioned plants or utilisation rates of existing capacity increased.
Increased steel production has been supported by a range of policy measures to protect the domestic industry. In March 2016, safeguard duty was extended on some steel products for two years, and in August 2016, the minimum import price mechanism was extended until October, and an anti-dumping tax levy on hot-rolled flat steel was imposed for six months. The effect of these measures are reflected in substantially reduced steel imports, down 26 per cent year-on-year in the three months to July.
Figure 3.3: China’s exports of iron and carbon steel products, by destination
Figure 3.4: India’s monthly steel production and imports, year-on-year change
The forecast for steel production in India remains unchanged, growing at 6 per cent in 2016 and 7 per cent in 2017. Growth in steel production will be supported by government policy targeting the expansion and improvement of both infrastructure and the manufacturing industry. The forecast for India’s consumption growth remains at 8 per cent in 2017.
Japan’s steel production forecast to be steady through outlook period
In contrast to the declines seen in the first quarter of 2016, Japan’s steel production increased 1.1 per cent year-on-year in the three months to July, despite soft domestic demand indicators, supported by higher exports and lower import competition.
The trend of international competition displacing Japan’s domestic steel production observed earlier in the year has eased, with steel exports up 2.6 per cent year-on-year in May and June, while imports were down 1.5 per cent
Error! No text of specified style in document.OCE Report Template 19

over the same period. On the domestic front, industrial production was down 1.7 per cent in the June quarter, while housing starts barely grew at 0.3 per cent.
Japan’s steel production forecasts have remained broadly unchanged for 2016 and 2017, at around 104 million tonnes.
South Korea’s steel production adversely affected by global overcapacity in ship building
South Korea’s steel production decreased 2.7 per cent year-on-year in the four months to July, because of weak demand from China and falling demand from South Korea’s ship building and automobile industry. South Korea’s ship building industry is a large consumer of steel, and has been weakened by soft global demand. South Korea’s automobile production has declined as a result of labour strikes and falling domestic sales due to the end of a temporary consumption tax cut in June.
South Korea’s steel production is forecast to decline by slightly more than previously forecast, down 2.7 per cent in 2016, due to a larger than expected decline in the first seven months of 2016. Steel production is forecast to moderately increase by 0.9 per cent in 2017.
Figure 3.5: Japan’s monthly steel production, exports and imports, year-on-year change
Figure 3.6: South Korea’s monthly steel production and vehicle production, year-on-year change
US steel production forecast to grow in 2017
US steel production fell by 0.2 per cent year-on-year in the three months to July, because of subdued domestic demand conditions. The Dodge construction index was down 11 per cent and industrial production was down 1.1 per cent year-on-year in the three months to July. The fall in production occurred despite a decline in imports of 8 per cent year-on-year in the three months to July, as a result of high anti-dumping duties on hot-rolled, cold-rolled and corrosion resistant steel products.
Steel production in the US is forecast to remain stable in 2016 at 79 million tonnes, lower than previously forecast due to weaker than expected domestic demand. The forecast for 2017 remains unchanged, with steel production increasing 3.4 per cent, supported by ongoing import duties.
Steel production in the EU continues to decline in 2016, forecast to grow in 2017
EU steel production continued to fall—down 5 per cent in the three months to July—because of international competition.
Steel imports increased 21 per cent year-on-year in the first five months of 2016, while steel exports decreased 9 per cent. As a result, the EU has implemented 37 anti-dumping duties on steel products over the past year, and is scheduled to rule on preliminary anti-dumping duties on plate and hot
Error! No text of specified style in document.OCE Report Template 20

rolled coil from China in November 2016. In addition, the potential for the EU to further pursue policies to protect domestic steelmakers has increased following the United Kingdom’s decision to leave the EU, as the United Kingdom has historically lead a small minority of countries that opposed trade restrictions.
Domestic demand conditions have been soft in the first half of 2016. Industrial production increased 1.3 per cent in the first half of the year compared to a year earlier, while construction remained broadly stable.
With steel production falling further than previously anticipated, the forecast for EU steel production in 2016 has been revised down to 160 million tonnes, a 3.5 per cent decline. The forecast for 2017 remains unchanged, for growth of 2.5 per cent, supported by improving demand conditions.
Figure 3.7: United States monthly steel production, inventory and imports, year-on-year change
Figure 3.8: European Union monthly steel production, exports and imports, year-on-year change
Australia’s steel exports fall in the June quarter due to a decrease in exports to the US
Australia’s steel production in 2015–16 increased by 4.8 per cent to 5 million tonnes, while apparent steel consumption (steel production plus imports less exports) increased 0.9 per cent. Australia represents 0.3 per cent of global steel production.
Australia’s imports of crude steel declined 53 per cent year-on-year in the June quarter to 415,000 tonnes, while unit values declined 66 per cent. Imports from Japan were down 94 per cent to 22,000 tonnes, while imports from China increased 3 per cent to 77,000 tonnes.
Australia’s exports of crude steel declined 15 per cent year-on-year in the June quarter to 205,000 tonnes. The fall in exports was primarily due to a fall in exports to the US—Australia’s largest steel export market. Exports to the US were down 97 per cent year-on-year in the June quarter by 92,000 tonnes, as a result of subdued demand and a preliminary ruling on hot-rolled steel products from Australia under an anti-dumping investigation.
Final determinations on hot-rolled steel products from Australia, amongst other countries, were affirmed in August by the US Department of Commerce. As a result, Australian steel producers could face dumping margins of 29 per cent, up from 23 per cent in the preliminary ruling, and Australian steel could potentially become uncompetitive in the US market. The impact on Australian steel exports will depend on whether new arrangements can be made with US importers, and whether Australian steel exports can be redirected to other markets in an environment of global oversupply in the steel sector.
Figure 3.9: Australia’s steel exports
Figure 3.10: Australia’s quarterly steel imports, production and apparent consumption
Error! No text of specified style in document.OCE Report Template 21

Error! No text of specified style in document.OCE Report Template 22

Table 3.1: World steel consumption
Million tonnes 2014 2015 2016 f 2017 f Per cent change
European Union 28 162 167 171 175 2.9
United States 122 109 112 118 5.2
Brazil 28 24 16 14 –11.7
Russia 49 45 41 39 –3.0
China 740 698 677 664 –2.0
Japan 73 68 67 66 –1.5
South Korea 58 58 57 56 –1.5
India 84 88 92 99 7.7
World steel consumption 1,663 1,611 1,598 1,610 0.8
Notes: f Forecast Source: Bloomberg (2016) World Steel Association; Department of Industry, Innovation and Science (2016)
Table 3.2: World steel production
Million tonnes 2014 2015 2016 f 2017 f Per cent change
European Union 28 169 166 160 164 2.5
United States 88 79 79 81 3.4
Brazil 34 33 29 27 –6.7
Russia 71 71 70 70 –0.7
China 823 801 793 773 –2.5
Japan 111 105 104 104 –0.5
South Korea 72 70 68 68 0.9
India 87 90 95 102 7.0
World steel production 1,670 1,616 1,605 1,618 0.8
Notes: f Forecast Source: Bloomberg (2016) World Steel Association; Department of Industry, Innovation and Science (2016)
Error! No text of specified style in document.OCE Report Template 23

4. Iron ore
4.1 Market overview
Australia’s iron ore export volumes are forecast to increase by 8 per cent to reach 851 million tonnes in 2016–17, supported by operational improvements and the ramp up of production at new mines and expansions. Export earnings are forecast to increase by 12 per cent to $54 billion in 2016–17, revised up from the previous forecast of $49 billion. The revision reflects persistently high prices in the September quarter.
However, the iron ore price is forecast to decline later in 2016 and average 6 per cent lower in 2017, at US$45 a tonne (FOB Australia).
4.2 Prices
The iron ore spot price (FOB Australia) unexpectedly rallied through July and August to average US$54 a tonne, up 14 per cent year-on-year. As a result, the forecast has been revised up, to average US$49 for 2016 as a whole. However, the price is still expected to decline, and the forecast of US$45 a tonne in 2017 remains unchanged.
Higher iron ore prices since the June edition have been supported by strong demand from China’s steel sector, underpinned by stimulus-driven resurgence of the construction sector.
The speculative activity on the Dalian Commodities Exchange that contributed to high volumes being traded and high spot price volatility in the first half of the year has tapered off. This was supported by measures to reduce speculative trading, including increased commission fees, margin requirements and trading restrictions.
As a result of reduced speculative activity, the iron ore price going forward will likely better reflect market fundamentals of slow consumption growth, and further growth in production volumes at low costs.
Risks to the outlook are considered moderate. In particular, the price outlook remains sensitive to the amount of loss making that producers in the market may tolerate. Additionally, there remains the potential for producers to further cut costs enabling them to operate profitably at lower market prices.
Figure 4.1: Iron ore price, free on board Australia
Figure 4.2: Daily volume of iron ore futures contracts traded and the iron ore spot price, free on board Australia
There is also the potential for steel production, and therefore iron ore demand, in China to hold up for longer than anticipated, presenting an upside risk to the outlook. This is dependent on the both the effectiveness of government plans to cut steel-making capacity and the potential for further stimulus measures.
Error! No text of specified style in document.OCE Report Template 24

4.3 World trade
World trade in iron ore is forecast to grow by 0.7 per cent and 4.5 per cent in 2016 and 2017, respectively. Despite subdued global demand, growing trade will be supported by the continuing substitution of China’s declining domestic production of iron ore with imports, predominantly from Australia and Brazil.
The seaborne market is forecast to remain well-supplied, with several large, low cost operations in Australia and Brazil ramping up production through 2017.
China’s iron ore imports to grow through the outlook period
China’s run of mine iron ore production (unadjusted for ore quality) fell 8 per cent year-on-year in the three months to July due to the closure of high cost capacity, with many of China’s iron ore mines uncompetitive against imports due to declining ore grades. Quality adjusted iron ore production is forecast to fall by 12 per cent in 2016 and by a further 20 per cent in 2017. The fall in domestic production is driven by the continuing closure of high cost mines and the closure of unprofitable state-owned steel plants, which tend to be vertically integrated with domestic iron ore mines.
China’s iron ore imports are forecast to grow by 4 per cent in 2016 to 988 million tonnes. This has been revised upwards since the June edition to reflect the unexpected resurgence of domestic steel production, which drove import growth of 11 per cent year-on-year in the three months to July.
China’s iron ore imports are forecast to grow 0.7 per cent to 995 million tonnes in 2017, displacing domestic production. There are risks to this outlook:
• On the upside, the pace of closures of China’s iron ore mines is subject to government policy and could occur faster than expected; and
• On the downside, small-scale iron ore mines in China are able to restart operations relatively quickly in response to a recovery in price, and as a result, reductions may not occur as rapidly as currently anticipated.
India’s iron ore production forecast to grow through outlook period
India’s iron ore production grew 43 per cent year-on-year in the June quarter, supported by the lifting of some mining restrictions. However, production caps in the states of Odisha and Goa continue to constrain growth.
India’s production of iron ore is forecast grow by 25 per cent in 2016 and 4 per cent in 2017 to meet higher domestic demand. The domestic steel industry has been buoyed by ambitious infrastructure projects and policies to expand the manufacturing sector, along with protection from international competition through import duties.
Increased domestic production has resulted in decreased iron ore imports, down 67 per cent year-on-year in the first five months of 2016. Over the same
Error! No text of specified style in document.OCE Report Template 25

period, there was a substantially large growth in exports, primarily to China, up 485 per cent to 6 million tonnes. However, this export growth has been from a low base, and with relatively small, high cost mines and growing domestic consumption, India is not expected to become a major exporter of iron ore.
Figure 4.4: China’s quarterly iron ore production and imports
Figure 4.5: India’s monthly iron ore exports and imports
Australia and Brazil to increase share of global trade
Australia and Brazil are forecast to increase their share of global seaborne trade in 2017 to 58 per cent and 27 per cent, respectively. Export growth in both countries will be supported by the ramping up of production at new, low cost mines and expansions of existing operations at the end of 2016 and through 2017. The additional supply from Australia and Brazil will put downward pressure on prices over the outlook period.
Production growth in Brazil is expected to be largely underpinned by Vale’s S11D expansion project, currently in its final stages of development. S11D is expected to produce 75 million tonnes of high quality iron ore annually, with more than half of production planned to be exported to Asia. Vale has indicated that the mine will ramp up production over a period of four years, slower than previously expected.
Export growth from Australia and Brazil is also expected to be supported by a growing preference from China’s steel mills for higher grade ore to reduce emissions, as operations face more stringent environmental regulations. In contrast to an average proven reserve grade of 34 per cent iron content in China, the average reserve grade in Australia and Brazil is approximately 58 per cent and 53 per cent, respectively, with even higher grades at particular deposits. For example, Vale’s S11D deposit has an estimated reserve grade of 67 per cent, and BHP Billiton’s Jimblebar deposit has an estimated reserve grade of 63 per cent.
4.4 Australia’s exploration, production and exports
Exploration activity
Iron ore exploration expenditure in Australia remained relatively steady year-on-year in the June quarter 2016 following over three years of declines. However, for 2015–16 as a whole, iron ore exploration expenditure declined 35 per cent, as a result of cost cutting activities and the substantial falls in prices, which reduced the feasibility of new iron ore projects and reduced incentives to explore.
A recovery in iron ore exploration expenditure in the next few years remains unlikely, given that iron ore prices are forecast to remain low.
Figure 4.6: Share of total iron ore exports
Figure 4.7: Forecast iron ore production and cash costs in 2017
Error! No text of specified style in document.OCE Report Template 26

Australia’s export volumes forecast to grow in 2016–17
Australia’s iron ore production grew 9 per cent year-on-year to 218 million tonnes in the June quarter, while exports grew 6 per cent to 202 million tonnes. Production and exports growth were supported by continued ramping up of Hancock Prospecting’s Roy Hill mine, expansions of existing operations, and favourable weather conditions. For 2015–16 as a whole, Australia’s iron ore exports increased by 5 per cent to 786 million tonnes.
Australia’s iron ore production is forecast to increase 4.8 per cent to 891 million tonnes in 2016–17, supported by operational improvements and further ramp up of production. While ramp up at Roy Hill has been slower than expected due to technical issues at the ore processing plant, production is still expected to reach nameplate capacity of 55 million tonnes in early 2017. Rio Tinto’s Nammuldi Incremental Tonnes project is expected to start production in the December quarter 2016, doubling capacity to 10 million tonnes. In addition, improved utilisation rates and the installation of a new crusher at BHP Billiton’s Jimblebar hub is expected to add to production. Beyond the outlook period, Rio Tinto has confirmed a US$338 million investment to complete the development of the Silvergrass mine, expected to have an annual capacity of 20 million tonnes.
There are minimal risks to the outlook. Australia’s largest iron ore companies, Rio Tinto, BHP Billiton, Fortescue Metals Group and Hancock Prospecting—which are forecast to represent a combined 92 per cent of total production in 2016–17—all have low cost operations and are expected to remain competitive at prices below US$50 a tonne.
Australia’s export values revised to 12 per cent growth in 2016–17
Despite increased volumes, the value of Australia’s iron ore exports decreased 13 per cent to $48 billion in 2015–16, as a result of lower prices.
Australia’s iron ore export earnings are forecast to increase 12 per cent to $54 billion in 2016–17, revised up from the previous forecast of $49 billion because of persistently high prices in the September quarter
Figure 4.8: Australia’s iron ore production
Figure 4.9: Australia’s quarterly iron ore export volumes and values
Error! No text of specified style in document.OCE Report Template 27

Table 4.1: World iron ore imports
Million tonnes 2014 2015 2016 f 2017 f Per cent change
European Union 28 158 142 128 128 0.1
Japan 136 130 127 127 –0.5
China 933 951 988 995 0.7
South Korea 74 73 66 67 0.9
Notes: f ForecastSource: Bloomberg (2016) World Steel Association; Department of Industry, Innovation and Science (2016)
Table 4.2: World iron ore exports
Million tonnes 2014 2015 2016 f 2017 f Per cent change
Australia 717 767 813 877 7.9
Brazil 344 371 389 411 5.9
India (net exports) 10 3 10 6 –34.3
Canada 40 37 32 29 –9.7
South Africa 65 64 49 45 –8.1
Notes: f ForecastSource: Bloomberg (2016) World Steel Association; Department of Industry, Innovation and Science (2016)
Table 4.3: Iron ore outlook
Error! No text of specified style in document.OCE Report Template 28
unit 2014 2015 2016 f 2017 f Per cent change
World
Prices b
Iron ore c
– nominal US$/t 88.0 50.3 48.5 44.8 –7.5
– real d US$/t 89.0 50.8 48.5 44.1 –8.9
2013–14 2014–15 2015–16 2016–17 f Per cent change
Australia
Production
Iron and steel gs Mt 4.57 4.74 4.97 4.73 –4.7
Iron ore Mt 680.1 786.6 850.3 891.3 4.8
Exports
Iron and steel gs Mt 0.57 0.92 0.77 0.88 15.0
– nominal value A$m 616 719 601 666 10.7
– real value h A$m 650 745 615 666 8.3
Iron ore Mt 651.4 747.7 786.3 851.0 8.2
– nominal value A$m 74,671 54,519 47,766 53,570 12.2
– real value h A$m 78,740 56,521 48,846 53,570 9.7
Notes: b fob Australian basis c Spot price, 62 per cent iron content basis; d In current calendar year US dollars; g Crude steel equivalent. Crude steel is defined as the first solid state of production after melting. In ABS Australian Harmonized Export Commodity Classification, crude steel equivalent includes most items from 7206 to 7307, excluding ferrous waste and scrap and ferroalloys; h In current Australian financial year dollars; s Estimate; f ForecastSource: ABS (2016) International Trade in Goods and Services, 5368.0; World Steel Association (2016); AME Group (2016); Company Reports;Department of Industry, Innovation and Science (2016)
Error! No text of specified style in document.OCE Report Template 29

5. Metallurgical coal
5.1 Market summary
Global metallurgical coal prices rallied to four year highs in the September quarter, driven by increased import demand from China and production disruptions in Australia.
Australia’s coal production is expected to recover as weather and infrastructure returns to normal and other mines ramp up production. In addition, while prices are forecast to decline from early 2017, the recent price spike is expected to see 2016–17 prices average higher than 2015–16 prices. As a result, Australia’s export earnings are forecast to increase by 35 per cent in 2016–17.
5.2 Prices
Spot prices rally to 4 year highs
Australian hard prime coking coal spot prices started rallying from the beginning of the June quarter, hitting US$100 a tonne in late April. The rally has gained momentum since late July, with spot prices in mid September reaching US$210, a four year high. The rally has been longer and sharper than forecast in the June edition of the Resources and Energy Quarterly, because of larger than expected import demand from China and a number of supply disruptions.
Government-mandated coal mine closures and weather related supply disruptions in China’s main coal producing region of Shanxi have supported the recent surge in metallurgical coal prices. These supply constraints were further exacerbated by wet weather related production disruptions in Australia and increased demand from China’s steel sector, compounding the impact on price. Production at Anglo America’s Capcoal operation in Queensland was disrupted due to prolonged industrial action and geological issues. Infrastructure disruptions also contributed with a derailment on the train line to the Abbott Point port, a major coal export terminal with an annual capacity of 50 million tonnes.
Prices in the September quarter averaged US$133 a tonne, the highest since December quarter 2013. Low volatility pulverised coal injection (PCI) and semi–soft coking coal prices also increased, but not at the same magnitude as hard coking coal.
Figure 5.1: 2016 surge in metallurgical coal prices to four year high
Figure: 5.2 Benchmark contract prices for Australian metallurgical coal
Benchmark contract prices for the September quarter were settled between Australian metallurgical coal producers and Japanese steel producers at US$92.50 a tonne. This is 10 per cent higher than the June quarter, but relatively unchanged year-on-year. Due to the large increases in metallurgical
Error! No text of specified style in document.OCE Report Template 30

coal prices it is likely that a December quarter contract price will not be settled in advance of the December quarter, as per usual.
Australian benchmark metallurgical coal contract prices are forecast to decline 2.6 per cent to average US$99 a tonne in 2016, and to increase 8 per cent to average US$108 a tonne in 2017. The forecast for increasing prices is partly attributable to continued supply constraints, in late 2016, early 2017.
5.3 World trade
World metallurgical coal trade is forecast to increase 3.3 per cent to 285 million tonnes in 2016, driven by increased import demand from China and India. Similar trade levels are forecast for 2017, where declining metallurgical coal demand for steel production in China will be offset by increasing import demand from India.
China’s metallurgical coal imports grew in the first half of 2016
China’s metallurgical coal imports are forecast to increase 8 per cent to 52 million tonnes in 2016. China’s metallurgical coal imports increased 11 per cent year-on-year in the first seven months of 2016, supported by Government-mandated coal mine capacity closures as the Government seeks to reduce the coal industry to a more sustainable size. Increased imports were also driven by infrastructure constraints brought on by bad weather in China’s Shanxi province, which is China’s biggest coal producing region. Reports indicate that there was a shortage of railway wagons available for transport of metallurgical coal in the June quarter, as a result of increased haulage of thermal coal resulting from a surge in electricity generation needs over China’s summer.
Higher coal imports were also supported by demand from China’s steel sector, which was boosted by the Government’s stimulus package from earlier in the year. China’s steel production increased 2 per cent year-on-year in the three months to July, driven by stronger demand from the construction sector.
Figure 5.3: Major metallurgical coal importers
Figure 5.4: China and India's monthly metallurgical coal imports
China’s metallurgical coal import demand in 2017 will be highly dependent on the resilience of its construction sector and its appetite for steel. Imports are forecast to decline 5 per cent to 50 million tonnes in 2017, in line with declining domestic steel production. However, there is some upside risk as to the magnitude of the rate of decline of China’s coal capacity cuts, especially given the Government’s concerns relating to the recent price spikes.
India’s metallurgical coal imports are forecast to increase
India’s metallurgical coal imports increased 1.8 per cent year-on-year in the first half of 2016. Imports are forecast to increase 3.9 per cent to 53 million tonnes in 2016, driven by increased steel production. Reports indicate that China’s strong interest in coking coal has caught Indian steel makers by
Error! No text of specified style in document.OCE Report Template 31

surprise, with price-sensitive end users prepared to pay higher prices to secure supply, at the beginning of the price rally.
In 2017, India’s metallurgical coal imports are forecast to increase 4 per cent to 55 million tonnes. Government policies are expected to continue to discourage steel imports, which increases the need for more metallurgical coal to support local production, given India’s very small domestic coking coal reserves. In an attempt to secure affordable imports, Coal India (the country’s largest coal producer) continues to seek coal reserves abroad. The state-owned company’s board recently approved the signing of a Memorandum of Understanding with South Africa’s state-owned African Exploration Mining and Finance Corporation, to explore and potentially exploit South Africa’s metallurgical coal reserves.
Japan’s metallurgical coal imports are forecast to remain stable in 2016 and 2017
Japan’s metallurgical coal imports increased 3.1 per cent year-on-year in the first six months of 2016, aided by higher steel production in the June quarter. Imports in 2017 are forecast to stay broadly the same as 2016, at 50 million tonnes.
Error! No text of specified style in document.OCE Report Template 32
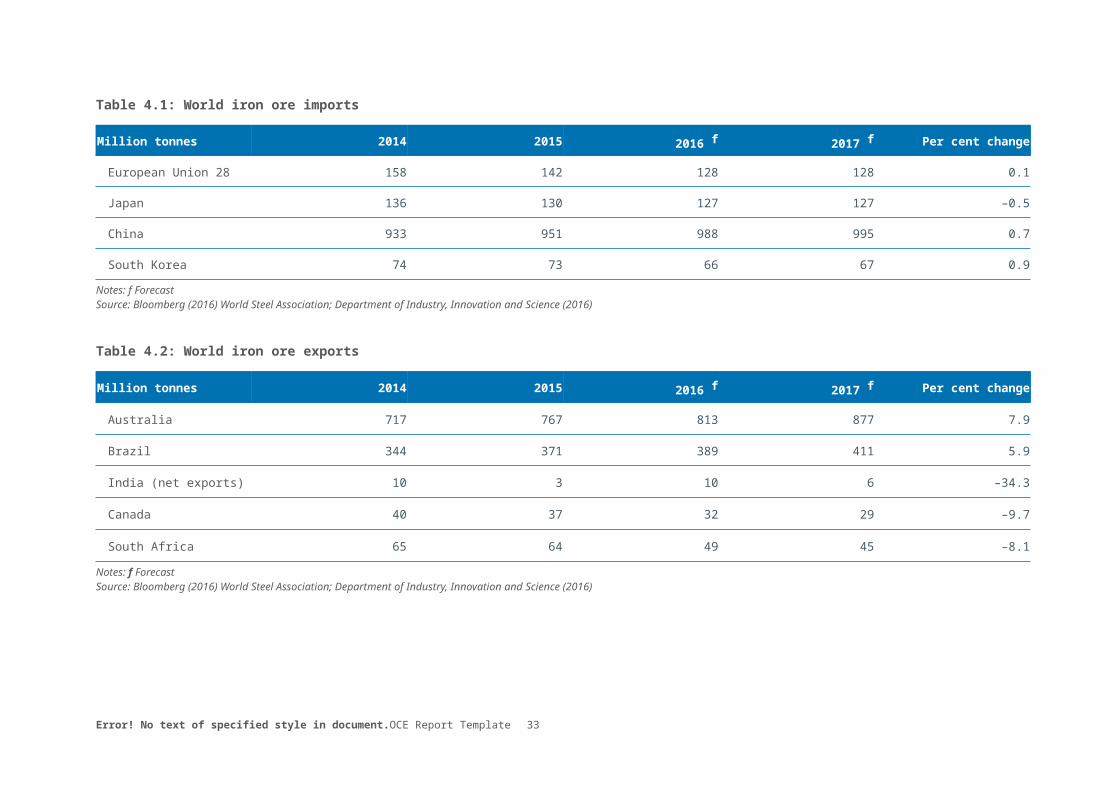
Table 5.1: World metallurgical coal trade
2014 2015 s 2016 f 2017 f Per cent change
Metallurgical coal imports
European Union 28 45 42 42 43 2.5
Japan 51 50 50 50 –0.3
China 62 48 52 50 –5.0
South Korea 33 37 38 38 0.0
India 52 51 53 55 4.0
Metallurgical coal exports
Australia 186 186 184 188 2.4
Canada 31 28 26 24 –5.0
United States 54 42 32 30 –6.0
Russia 21 18 20 22 7.0
World trade 292 276 285 285 0.2Notes: f Forecast; s EstimateSource: IEA (2015) Coal Information 2015; Department of Industry, Innovation and Science (2016)
Error! No text of specified style in document.OCE Report Template 33

5.4 World exports
North America’s metallurgical coal exports continue to decline
Metallurgical coal exports from the US declined 30 per cent year-on-year in the first six months of 2016. Overall, exports for 2016 are forecast to decline 24 per cent to 32 million tonnes. The decline in coal prices in recent years has put pressure on many US coal producers, leading to mine closures and capacity cuts, which in turn have affected exports.
In addition to weak coal prices, US metallurgical coal export competitiveness has been affected by distance to major markets and an appreciating US dollar. US metallurgical coal exports are forecast to decline a further 6 per cent in 2017 to 30 million tonnes, as the attractiveness of coal exports relative to competitors is likely to continue to decline. This reflects the expectation of a further appreciation in the US exchange rate towards the end of 2016 and into 2017, with expectations of interest rate hikes by the US Federal Reserve.
Figure 5.5: Major metallurgical coal exporters
Canada’s metallurgical coal exports declined 11 per cent year-on-year in the first six months of 2016, reflecting mine closures and a downgraded coal mining labour force on the back of sustained lower prices before the rally. Metallurgical coal exports are expected to stay low for the remainder of 2016, estimated to be 26 million tonnes, 7 per cent lower than 2015. Exports in 2017 are forecast to decline a further 5 per cent to 24 million tonnes.
5.5 Australia’s production and exports
Australia’s metallurgical coal production was an estimated 48 million tonnes in the June quarter, up 11 per cent quarter-on-quarter, but down 7 per cent year-on-year. Australia’s metallurgical coal production is estimated to have declined 4.2 per cent to 186 million tonnes in 2015–16, as a result of disruptions hampering production at mines in Queensland.
Production trends varied across companies and mines. Vale’s Carborough Downs mine suffered production disruptions due to geological instability and roof fall events associated with the restart of operations after a longwall move in May 2016. This reduced the mine’s June quarter production by 66 per cent year-on-year. In contrast, although Australian miner Yancoal suffered financial losses in 2015–16 due to lower prices and reduced output, construction work on stage 2 of its Moolarben mine went ahead. Coal from its new underground mine was extracted in April.
Australia’s metallurgical coal production in 2016–17 is forecast to increase 3.4 per cent to 192 million tonnes, as overall production returns to normal. Continued production disruptions are affecting metallurgical coal production at a number of mines, including Anglo American’s Capcoal operation. Production at the operation has been hampered by prolonged industrial action and geological instability, with longwall moves curtailing output at the Grasstree underground mine. There is also likely to be a gradual decline in production by financially distressed coal producer, Peabody Energy, who
Error! No text of specified style in document.OCE Report Template 34

plans to reduce its Australian metallurgical coal production by more than half by 2021.
However, these declines are expected to be outweighed by increases in production across the board for the remainder of the year. Increased mine production is expected at large mines such as Whitehaven’s Maules Creek mine (a thermal and semi-soft coking coal mine), which achieved higher than expected production rates in the June quarter and is expected to ramp up production in 2016–17. Anglo American’s Grosvenor mine achieved first coal earlier than scheduled, and the sale of the mine is unlikely to cause much disruption to production, with plans to eventually become a 7.5 million tonne per annum operation.
Australia’s export earnings to increase significantly amidst global metallurgical coal price rally
Australia’s metallurgical coal export volumes in 2015–16 remained broadly unchanged at 188 million tonnes. Export values, however, declined 10 per cent to around $20 billion because of lower prices. India was the largest importer of Australia’s metallurgical coal, accounting for 23 per cent of Australia’s exports for the year.
Metallurgical coal exports are forecast to increase marginally to 189 million tonnes in 2016–17, supported by increased import demand from India’s steel industry, while Japan’s import demand is expected to remain steady. Export earnings are forecast to increase 35 per cent to around $26 billion in 2016–17, supported by higher prices, particularly in the first half of the year.
Figure 5.6: Australia’s metallurgical coal exports
Error! No text of specified style in document.OCE Report Template 35

Table 5.2: Australia’s metallurgical coal outlook
Units 2014 2015 2016 f 2017 f Per cent change
Contract prices d
– nominal US$/t 125.5 102.1 99.4 107.5 8
– real e US$/t 126.8 103.0 99.4 105.9 7
Units 2013–14 2014–15 2015–16 2016–17 f Per cent change
Australia
Production Mt 183.1 194.1 186 192.3 3.4
Export volume Mt 180 188 188 189 0.6
– nominal value A$m 23,254 21,813 19,533 26,400 35
– real value h A$m 23,979 22,114 19,533 25,817 32
Notes: f Forecast; s Estimate d Contract price assessment for high-quality hard coking coal; e In current calendar year US dollars; h In current financial year Australian dollarsSource: ABS (2016) International Trade in Goods and Services, 5368.0; Department of Industry, Innovation and Science (2016)
Error! No text of specified style in document.OCE Report Template 36

6. Thermal coal
6.1 Market summary
Thermal coal prices rose further than anticipated in the September quarter to two year highs, driven by government mandated cuts to supply in China, weather-related supply disruptions in Indonesia and increased demand attributed to high temperatures through China’s summer. Continued capacity cuts in China are likely to maintain upward pressure on prices over the outlook period. However, Australia’s export values are expected to stay steady over the outlook period, with higher prices offsetting a small decline in export volumes.
6.2 Prices
Prices spike on the back of capacity cuts in China
Thermal coal spot prices recovered in the September quarter, counter to the downward trend since early 2011. Australia’s benchmark Newcastle free on board (FOB) spot price reached over US$70 a tonne in mid-September, the highest in over two years. Benchmark coal prices in the third quarter increased across the board relative to the previous quarter and year. The Newcastle FOB spot price increased 29 per cent to US$66 a tonne, up from US$51 a tonne in the previous quarter.
Increases in thermal coal prices can largely be attributed to increased Chinese demand for imports, driven by the government-mandated closure of coal mine capacity and a spike in electricity demand over China’s hot summer. Weather-related production disruptions and mine closures in Indonesia (the world’s largest thermal coal exporter) over the same period also placed upward pressure on prices.
The current contract price covering the 2016 Japanese fiscal year (JFY, April 2016–March 2017) is US$61.60 a tonne Newcastle FOB. The JFY 2017 benchmark price, to be negotiated early next year, is forecast to increase to US$64 a tonne, given the expectation of continued capacity closures in China. However, there are uncertainties surrounding the extent and timing of these closures, given they are having a significant impact on prices and import costs for Chinese consumers. A likely slowdown in closures of coal mines, combined with a decline in India’s import growth, are expected to support a gradual decline in spot prices in late 2016 and early 2017, and ease upward pressure on the benchmark price.
Figure 6.1: Thermal coal spot prices
Figure 6.2: JFY thermal coal contract prices
6.3 World trade
World thermal coal trade is forecast to decline to 1.0 billion tonnes in 2016, supressed by a decline in demand in India and developed economies. Global trade in 2017 is forecast to remain broadly unchanged from 2016.
Error! No text of specified style in document.OCE Report Template 37

6.4 World imports
China’s thermal coal imports bounce back in 2016
China’s thermal coal imports have been in decline since 2014. This can be attributed to China’s slowing economic growth and its focus on lowering carbon emissions and air pollution levels, consistent with the transition from an industrial economy to a less energy intensive services economy.
Against this trend, China’s imports of thermal coal increased by 0.2 per cent year-on-year in the first seven months of 2016. This was largely driven by cuts in coal mine capacity as part of the government’s supply-side reforms, and also by increased import demand because of high summer temperatures. Total industry and residential electricity consumption over the warmer months of May to August was up 7 per cent year on year, and thermal coal imports between May and July were up 14 per cent year-on-year.
Reports indicate that by the end of July, China had cut 38 per cent of the 250 million tons of coal capacity it pledged to reduce in 2016. The Government is committed to meeting its annual target, however this may be ambitious given the current price rally, which may encourage a restart of closed capacity or at least slow the rate of future closures. On balance, China’s imports are expected to remain stable over the year, an upwards revision from the June edition, where Chinese thermal coal imports were expected to decline in 2016.
In 2017, China’s thermal coal imports are forecast to remain relatively stable at 157 million tonnes. The Chinese Government is expected to continue to cut capacity to attempt to meet its target of closing 500 million tonnes of coal production over the next three to five years. However, the political sensitivity of closures where there is large employment in coal mines, combined with a continued favourable price environment, are likely to limit any increase in imports.
Figure 6.3: Major thermal coal importers
Figure 6.4: China’s electricity consumption
India seeks to reduce dependence on imports
The forecast for India’s thermal coal imports in 2016 has been revised downwards since the June edition, largely due to Coal India’s strong performance and the build-up of coal stocks at domestic power utilities.
State-owned Coal India—responsible for more than 80 per cent of India’s coal production—reported record levels of production and dispatches during the year ended 31 March 2016, with production steady since then. In addition, Indian Government reforms of the power sector have been slower than anticipated, with around 35 per cent of installed power capacity estimated to be stranded due to financial issues plaguing power distributors.
As a result of these two factors, coal stocks have been building at Indian power utilities, dampening thermal coal import demand. In 2015, India’s thermal coal imports declined for the first time since 2003, and the decline is
Error! No text of specified style in document.OCE Report Template 38

expected to continue into 2016. India’s imports are expected to be subdued for the remainder of 2016, with overall imports for the year forecast to be 166 million tonnes, 2.9 per cent lower than 2015.
Imports in 2017 are forecast to remain broadly unchanged. Beyond the outlook period, India’s growing energy needs and Government plans to gradually expand its fleet of coal fired power plants will drive import demand, supported by a shift to more efficient super critical or ultra-super critical coal plants that would use a higher grade of coal not readily available in India. However, growth in imports in 2017 are likely to be restricted by continued strong production from Coal India and delays in power sector reform.
Figure 6.5: China and India’s thermal coal imports
Figure 6.6: India’s under construction electricity capacity, expected to come online in 2016 and 2017
Nuclear restarts in Japan slower to come online than expected
Japan’s thermal coal imports remained stable year-on-year in the first six months of 2016, reflecting the slower than expected restart of nuclear power capacity post Fukushima, and steady use of coal-fired power generation as a substitute for nuclear power.
Shikoku Electric Power Company resumed operations of the No. 3 reactor at its Ikata facility in August, making it the third operational nuclear reactor out of a total forty two reactors, nationally. Despite the restart of the No. 3 reactor, the return of nuclear capacity in Japan has been marred by delays and obstructions, with two operating reactors in western Japan being shut down because of a court injunction. This represents the first time a local court has forced the shutdown of an operating nuclear plant in Japan.
Japan’s thermal coal imports in 2017 are forecast to stay similar to 2016, at 142 million tonnes. This is expected to be supported by further delays to nuclear restarts.
South Korea imports decline in 2016 but expected to increase in 2017
South Korea’s thermal coal imports declined by 6 per cent year-on-year in the first half of 2016. However, exports are forecast to increase 2 per cent from these levels, to 97 million tonnes in 2017, driven by increased investment in coal fired generation plants.
ASEAN’s coal imports rise amidst plans to increase coal fired power generation
Vietnam’s thermal coal imports are estimated to have increased 368 per cent year-on-year in the first six months of 2016. Traditionally a coal exporter, Vietnam has become an importer amid rising domestic demand, particularly from the power sector. Consumption in Vietnam is projected to increase in 2017, driven by forecast growth in GDP and plans to significantly increase the share of coal fired generation in the electricity mix, with total installed capacity set to increase to a target of 53 per cent by 2030.
Error! No text of specified style in document.OCE Report Template 39

Thailand’s imports increased by 9 per cent year-on-year, in the first half of 2016. Reports indicate that coal-fired power plants in Thailand consumed 12 million tonnes of coal and lignite over this period, up 10 per cent year-on-year. Thailand’s coal fired generation is expected to continue to increase in 2017 as economic activity increases.
6.5 World thermal coal exports
Indonesia’s producers unable to respond to price rally in the near term
Indonesia’s thermal coal exports declined 9 per cent year-on-year in the first half of 2016. Despite the recent price rally, producers in Indonesia are not in a position to respond quickly to the increase in price, due to logistical constraints and debt obligations, especially for smaller mines. Exports over 2016 are expected to stay lower than 2015 levels, largely due to bad weather and loading delays. The La Niña weather pattern has caused heavy rain since early July, a typically dry period, resulting in significant production disruptions for many miners. Flooding was reported at deeper pits, and though larger miners have the infrastructure and capacity to deal with such disruptions, production and hauling activity is still exposed.
Exports from Indonesia are expected to decline in 2017, by 15 per cent to 282 million tonnes. However, there may be a positive supply response if high prices continue and weather conditions return to normal.
Figure 6.7: Major thermal coal exporters
Thermal coal exports from US nearly halve
Thermal coal exports from the US (the world’s fourth largest exporter) nearly halved (46 per cent) year-on-year in the first six months of 2016. Imports are expected to remain subdued over the remainder of 2016 as US producers continue to struggle to deal with lower prices, environmental regulations, domestic competition from natural gas, and local retirements of coal-fired power plants. The bankruptcy of US based Peabody Energy, the world’s largest private-sector coal company, in April, has forced some of its global coal assets to close or be placed on care and maintenance.
Challenging conditions are likely to continue in the US for the foreseeable future. US thermal coal exports are forecast to decline 10 per cent to 18 million tonnes in 2017.
Figure 6.8: Indonesia and US thermal coal exports
6.6 Australia’s exploration, production and trade
Coal exploration continues to decline
Despite the price rally in recent months, coal exploration remained subdued in the June quarter, declining 40 per cent year-on-year to $30 million. Total exploration for 2015–16 declined 31 per cent year on year to $173 million.
Error! No text of specified style in document.OCE Report Template 40

Australia’s coal production remained steady despite strong increases at some mines
It is estimated that Australia produced 251 million tonnes of thermal coal in 2015–16, broadly unchanged from 2014–15. Australia’s thermal coal production in the June quarter increased 3.4 per cent to 64 million tonnes. Production increases were recorded at most mines, such as Whitehaven’s Maules Creek mine in NSW, which reached a 9 million tonne a year operating rate for the first half of 2016, above its expected annual rate of 8.5 million tonnes. Thermal and semi-soft coking coal production at the mine increased 19 per cent quarter-on-quarter, to 2.4 million tonnes.
However, these increases were partially offset by mine closures, largely due to challenging market conditions. Yancoal’s Donaldson operation and BHP Billiton’s Gregory mine were placed into care and maintenance in June.
In 2016–17, Australia’s production is forecast to decline marginally, to 250 million tonnes. Production at most mines are forecast to increase in line with productivity gains, through efficiency measures implemented by producers to minimise the effects of lower prices on their bottom line. However, increases are expected to be slightly outweighed by the above mine closures, and suspensions of production at other medium sized mines such as Glencore’s West Wallsend and Newlands mines in 2016. Any major expansions or capacity increases are anticipated to occur beyond the outlook period.
Figure 6.9: Australia’s coal exploration expenditure
6.7 Australia’s export earnings forecast to recover in 2016–17
Australia’s thermal coal exports are estimated to have declined 2.1 per cent in 2015–16, to 200 million tonnes. The decline can be attributed to lower demand from key consumers such as China for the majority of the year. Export values declined 9 per cent to $14.7 billion, reflecting lower export volumes and thermal coal prices.
Export volumes in 2016–17 are forecast to increase 1.6 per cent year-on-year to 204 million tonnes, with China’s spike in import demand in the first half of the year more than offsetting declines in India. Export earnings are forecast to decline 3.6 per cent to $14.2 billion in 2016–17. This is largely because of a forecast 6 per cent decline in the contract price in 2016–17.
Figure 6.10: Australia’s thermal coal exports
Error! No text of specified style in document.OCE Report Template 41
Table 6.1: Thermal coal
unit 2014 2015 s 2016 f 2017 f Per cent change
World
Contract prices b
– nominal US$/t 82 68 62 64 3.9– real c US$/t 83 69 62 63 2.0Coal trade Mt 1,125 1,051 1,043 1,043 0.0
Imports
Asia Mt 786 709 714 722 1.2China Mt 229 156 157 157 0.0Chinese Taipei Mt 59 59 60 60 0.0India Mt 186 171 166 166 0.0Japan Mt 137 141 142 142 0.0South Korea Mt 98 98 95 97 2.0
Europe Mt 246 246 232 220 –5European Union 27 Mt 196 194 176 160 –9other Europe Mt 49 53 56 60 8
Exports
Australia Mt 201 202 197 206 4.7Colombia Mt 80 81 83 87 4.8Indonesia Mt 407 366 330 282 –15Russia Mt 132 133 135 140 3.7South Africa Mt 68 77 78 81 3.8United States Mt 34 25 20 18 –10
2013–14 2014–15 2015–16 2016–17 f Per cent change
Australia
Production Mt 247.1 251.5 250.8 250.3 –0.2Export volume Mt 194.6 204.5 200.3 203.6 1.6– nominal value A$m 16,705 16,057 14,698 14,167 –3.6
Error! No text of specified style in document.OCE Report Template 42

– real value d A$m 17,615 16,647 15,030 14,167 –6Notes: b Japanese Fiscal Year (JFY), starting 1 April, fob Australia basis. Australia–Japan average contract price assessment for steaming coal with a calorific value of 6700 kcal/kg gross air dried; c In current JFY dollars; d In current financial year Australian dollars, s estimate, f forecastSources: ABS (2016) International Trade in Goods and Services, 5368.0; IEA (2016) Coal Information 2016; Coal Services Pty Ltd (2016); Queensland Department of Natural Resources and Mines (2016) Quarterly Coal Production; Company Reports; Department of Industry, Innovation and Science (2016)
Error! No text of specified style in document.OCE Report Template 43

7. Gas
7.1 Market summary
The value of Australia’s LNG exports is forecast to increase by 41 per cent to $23 billion in 2016–17, supported by higher LNG prices and export volumes. LNG contract prices, under which most Australian LNG is sold, are forecast to increase in line with oil prices. Higher export volumes will be driven by the addition of around 15 million tonnes of LNG export capacity, bringing total operational capacity to around 66 million tonnes by mid-2017.
The downward revision to the forecast for export earnings in 2016–17 reflects a more conservative view of the ramp up of LNG exports at several projects, as well as the lagged effect of lower than expected oil prices.
7.2 Prices
After declining over the first five months of 2016, prices for Australian LNG delivered to markets in North East Asia increased in June. The average price of LNG into Japan, Australia’s largest market and the world’s largest importer, increased by 18 per cent to US$6.51 a gigajoule. The recent uptick in prices reflects the effect of the oil price rally in early 2016, with most LNG delivered into Asia sold under contracts linked to the Japanese Customs-cleared Crude (JCC) oil price, by a time lag of three to four months. The North East Asian spot price has increased over the past few months, averaging US$5.80 a gigajoule in August, but remains around historic lows, as a result of growing excess capacity in the market.
Prices for LNG delivered to North East Asia are expected to rise in the September quarter before flattening out towards the end of the year, as the lagged response of LNG contract prices to recent oil price movements plays out. LNG contract prices are then expected to rise further in 2017, consistent with the forecast recovery of oil prices to US$55 a barrel.
In contrast, spot prices are forecast to remain low, as the entry of new capacity in the US and Australia ensures that the market remains well supplied. The implications of a potential divergence between contract and spot LNG prices remain to be seen, with one scenario that buyers begin to reduce LNG purchases to take-or-pay levels and seek to buy larger volumes on the spot market.
Figure 7.1: Price of Australian LNG delivered to key markets
Figure 7.2: North East Asian spot price
Another issue that could affect spot markets relates to the future of destination clauses in contracts, which prevent buyers from re-directing LNG to other ports. China, Japan and South Korea have agreed to contracts for imports starting over the next few years that will likely exceed their needs. Against this backdrop, Japan’s Fair Trade Commission has recently launched
Error! No text of specified style in document.OCE Report Template 44

an investigation into whether destination clauses in contracts are uncompetitive. A move to loosen destination restrictions in contracts would make it easier for over-contracted buyers to enter the spot market as sellers, adding to downward pressure on spot prices.
7.3 World trade
After several years of flat or declining LNG trade, growth in world trade is expected to increase by 7 per cent in 2016 and 10 per cent in 2017 to reach 285 million tonnes. Growth will be driven by demand in emerging Asia and Europe and supported by a major expansion of LNG export infrastructure in Australia and the US.
7.4 World imports
Prospects for import growth in traditional demand centres remain subdued
Japan’s LNG imports declined by 5 per cent over the first half of 2016, continuing the downward trend which began in mid-2015. LNG imports continue to be squeezed by relatively low coal prices, subdued energy demand, nuclear reactor restarts, and the expansion of renewable energy capacity.
Japan’s LNG imports are forecast to fall by 3.2 per cent to 80 million tonnes in 2017. Most of Japan’s LNG imports are used in electricity generation, where they will continue to face competition from renewables, coal and the restart of some nuclear capacity. Japan restarted a third nuclear reactor (out of its 42) in August, and more are expected to return to operation within the outlook period. In late August, there were applications for 26 reactor restarts before the Nuclear Regulation Authority.
Figure 7.3: LNG import forecasts
Figure 7.4: Growth in the LNG imports of key markets
Nevertheless, the timing and scale of nuclear restarts remains a key uncertainty affecting the outlook. Two reactors that restarted in early 2016 were forced to shut down in June following a court injunction, and Japanese utilities seeking to restart reactors continue to face opposition from local communities.
South Korea and Taiwan’s LNG imports also declined over the first six months of 2016, falling by 2.5 per cent and 2.2 per cent year-on-year respectively. Prospects for growth in overall LNG imports of both countries remain limited over the short term. In South Korea, LNG will increasingly compete with other energy sources, with 10 coal-fired power plants and 2 nuclear reactors scheduled for completion in 2016 and 2017—a total 13 gigawatts of capacity.
Emerging Asia and Europe and will be key sources of growth
After contracting in 2015, China’s LNG imports rebounded over the first 6 months of 2016, increasing 13 per cent year-on-year. LNG imports grew
Error! No text of specified style in document.OCE Report Template 45

alongside pipeline imports and domestic production, suggesting robust growth in consumption.
China’s LNG imports are forecast to increase by 21 per cent to 32 million tonnes in 2017. China is aiming to increase the share of gas in the energy mix from 5 per cent to 10 per cent by 2020, with policy efforts directed at the electricity generation and transport sectors. While China will also draw on both domestic reserves and pipeline imports to meet future gas demand, the commencement of long-term LNG contracts will support increased LNG imports.
This trend is expected to continue as expectations of persistent low spot prices encourage countries in Asia to continue to expand LNG import infrastructure. In August, Pakistan signed a deal to purchase a Floating Storage and Regasification Unit (FSRU) for its second LNG import terminal, which will begin operations in mid-2017. Imports of LNG by emerging Asian economies are expected to rise by 42 per cent to 31 million tonnes in 2017.
Europe is expected to be another key source of demand growth to 2017. LNG imports are forecast to increase by 25 per cent to 60 million tonnes in 2017. Indigenous production in Europe is expected to fall sharply, partly resulting from lower production at Europe’s largest natural gas field, Groningen in the Netherlands. In July, the Dutch government announced it would lower the annual production cap at the Groningen gas field from 27 to 24 billion cubic metres from October 2016, continuing efforts to reduce the frequency and intensity of earthquakes associated with production from the field.
7.5 World supply
World LNG supply to increase
The global LNG market is going through a period of significant transformation, with a major expansion of liquefaction capacity underway. Global liquefaction capacity is on track to increase by 5 per cent to 282 million tonnes in 2016. In the September quarter, the second of five trains at Cheniere Energy’s Sabine Pass facility in the US was commissioned, doubling US capacity to 9 million tonnes per annum.
Global liquefaction capacity is forecast to increase a further 14 per cent to 322 million tonnes in 2017. The majority of new capacity will be added in Australia, although the US will also make a significant contribution. Of the five LNG export terminals currently under construction in the US, two are expected to add to capacity over the outlook period. Cheniere Energy plans to add a third and fourth train (each with 4.5 million tonnes of annual capacity) at its Sabine Pass facility in June and August of 2017. In addition, Dominion Energy’s Cove Point LNG export terminal, with an initial capacity of 5.3 million tonnes per annum, is due for completion towards the end of 2017.
By the end of 2017, the US is expected to be the seventh largest LNG exporter in the world. The completion of LNG projects in a number of other countries, such as Malaysia and Angola, will also contribute to growth in global LNG supply over the outlook period.
Error! No text of specified style in document.OCE Report Template 46

Figure 7.7: World liquefaction capacity
7.6 Australia
Exploration activity declines for a sixth consecutive quarter
Australia’s petroleum exploration expenditure declined to $283 million in the June quarter, down 34 per cent quarter-on-quarter and 59 per cent year-on-year. This is the sixth consecutive quarterly decline, and exploration activity is now at its lowest level since the March quarter 2006.
Coal seam gas drives increased gas production
Australian gas production is estimated to have increased 23 per cent in 2015–16 to around 82 billion cubic metres. The increase was driven by higher coal seam gas (CSG) production, which continues to expand to support new LNG export capacity on the east coast, while conventional gas production also rose. Australia’s gas production is forecast to rise to 104 billion cubic metres in 2016–17, as LNG export capacity continues to increase.
Australia’s LNG export earnings and volumes to increase
The value of Australia’s LNG exports declined by 22 per cent in the June quarter to $3.4 billion, but remained 10 per cent higher than a year earlier. The decline was driven by a modest decline in export volumes and lower LNG prices. Australia’s LNG export volumes fell by 1.4 per cent in the June quarter to 9.8 million tonnes. Production at Woodside’s North West Shelf Venture declined because of a month of planned maintenance. The Gorgon project in Western Australia halted operations for two months after its first shipment in March, due to problems with one of its cooling systems. Despite relatively flat export volumes in June quarter, Australia’s LNG exports have expanded rapidly over the past year. In 2015–16 Australia exported 37 million tonnes of LNG, an increase of 47 per cent on the previous financial year.
The value of Australia’s LNG exports is forecast to increase by 41 per cent to $23 billion in 2016–17, as a result of higher export volumes and increasing LNG prices. Australia’s LNG export volumes are forecast to increase by 40 per cent to 51 million tonnes in 2016–17. An additional 15 million tonnes of LNG export capacity is expected to be completed by mid-2017, bringing total operational capacity to around 66 million tonnes. This includes the second and third trains at the Gorgon project in Western Australia, and the second train at the Australia Pacific LNG project in Queensland. Increased exports to Japan, South Korea and China are expected to drive the rise in Australia’s export volumes. While prospects for total import growth in Japan and South Korea are subdued, Australian producers are expected to capture an increasing share of both country’s imports with the commencement of a number of long-term contracts over the outlook period.
Figure 7.8: Australia’s gas production
Figure 7.9: Australia’s LNG exports
Error! No text of specified style in document.OCE Report Template 47
Meanwhile, LNG contract prices, under which most Australian LNG is sold, are expected to increase as oil prices recover. While this should drive up the average price of Australian LNG, persistent low spot prices are expected to weigh on the value of uncontracted production.
The downward revision to the forecast for 2016–17 reflects a more conservative view of the ramp up of LNG exports at several projects. Statements from Santos executives in August indicate that GLNG may operate both trains below capacity for some time, with company releases noting that the low price environment is restricting capital expenditure and that the cost of third party gas has risen. Overall, the forecast for LNG export volumes has been revised down by 2 million tonnes from the June edition.
Lower than expected JCC oil prices in the June quarter, which will see LNG contract prices increase less quickly than previously expected in the second half of 2016, and a small downward revision to the oil price forecast have also affected the outlook for export earnings.
Figure 7.10: Australia’s LNG export capacity
Error! No text of specified style in document.OCE Report Template 48

Table 7.1: LNG outlookunit 2013–14 2014–15 2015–16 2016–17 f Per cent change
Australia
Production b Bcm 62.9 66.4 81.8 104.3 27.5
– Eastern market Bcm 22.2 25.3 38.6 51.2 32.7
– Western market Bcm 40.1 40.4 42.5 52.4 23.1
– Northern market c Bcm 0.7 0.7 0.6 0.7 4.4
LNG export volume d Mt 23.2 25.0 36.9 51.5 39.6
– nominal value A$m 16,305 16,895 16,557 23,357 41.1
– real value e A$m 17,193 17,515 16,931 23,357 38.0
LNG export unit value g
– nominal value US$/MMBtu 12.9 11.3 6.5 6.7 2.2
– real value e US$/MMBtu 13.6 11.7 6.7 6.7 –0.0
– nominal value A$/GJ 13.3 12.8 8.5 8.6 1.0
– real value e A$/GJ 14.0 13.2 8.7 8.6 –1.2
Notes: b Production includes both sales gas and gas used in the production process (i.e. plant use) as well as ethane; c Gas production from Bayu-Undan Joint Production Development Area is not included in Australia’s production. Browse basin production associated with the Ichthys project is classified as Northern market; d 1 million tonnes of LNG is equivalent to approximately 1.36 billion cubic metres of gas; e In current financial year Australian dollars.; g 1 MMBtu is equivalent to 1.055 GJ; f ForecastSource: ABS (2016) International Trade, cat. no. 5368.0; Company reports; Department of Industry, Innovation and Science (2016)
Error! No text of specified style in document.OCE Report Template 49

8. Oil
8.1 Market summary
The value of Australia’s crude oil and condensate exports is forecast to increase by 6 per cent in 2016–17 to $6 billion, as the effect of rising prices more than offsets a decline in export volumes. While oil prices remain well below levels seen a few years ago, they are forecast to increase as growth in global consumption outpaces production growth. Non-OECD economies are expected to lead increased demand for oil, while falling production in a number of non-OPEC countries is expected to constrain global supply.
8.2 Prices
Price rally stalls in the September quarter
The oil price rally, which began in early 2016, stalled in the September quarter. The price of Brent crude oil is estimated to have averaged US$46 a barrel, the same as in the preceding quarter, while the average price of West Texas Intermediate (WTI) also remained unchanged, at around US$45 a barrel. Oil prices received support from statements by OPEC members and Russia indicating the possibility of a production freeze from late September. However, a number of other factors weighed on prices over the quarter, including the recovery of Canadian production following wildfires in May, strong Middle Eastern production, subdued growth in global consumption, and rising stocks of crude oil and petroleum products in the United States.
Oil prices are forecast to rise
Oil prices are forecast to average around US$44 a barrel in 2016, with high oil stocks and solid supply growth expected to keep a lid on prices for the remainder of the year. In 2017, oil prices are forecast to average US$55 a barrel as consumption growth, led by non-OECD economies such as China and India, outpaces increases in production. Persistent low prices have seen producers reduce investment or exit the industry, sowing the seeds for tighter future supply conditions.
The outlook remains sensitive to a number of factors, particularly demand growth in emerging economies in Asia and the competitiveness of US shale oil production. While prices are forecast to rise, the course of the price rally to date suggests that the recovery could be characterised by further volatility.
Figure 8.1: Recent movements in oil prices
Figure 8.2: Annual oil prices
8.3 World consumption
World oil consumption is forecast to increase to 97.6 million barrels a day in 2017, with growth of 1.6 per cent in 2016 slowing to 1.3 per cent in 2017.
Error! No text of specified style in document.OCE Report Template 50

Non-OECD economies to drive global consumption growth
Growth in world oil consumption is expected to continue to be driven by increased consumption in non-OECD economies, led by China and India. Increased consumption will be driven by the transport sector, as vehicle fleets expand across emerging economies, and to a lesser extent, by the petrochemicals sector.
Despite this, growth in non-OECD consumption is expected to slow. Economic growth in many emerging economies remains subdued, and China is transitioning from heavy industries towards a consumption-based growth model which will use oil less intensively. Growth in non-OECD oil consumption slowed sharply to 1.7 per cent year-on-year in the September quarter. Non-OECD consumption is forecast to increase by 2.6 per cent in 2016 and 2.3 per cent in 2017.
OECD oil consumption is forecast to rise more slowly, increasing by 0.6 per cent in 2016 and remaining relatively stable in 2017. Improving vehicle efficiency and a subdued economic outlook, particularly in Europe following the Brexit, are expected to constrain growth.
8.4 World production
World oil supply remained largely unchanged in the first eight months of 2016 relative to the same period last year, with declining non-OPEC production offset by higher OPEC production. Global oil production is forecast to remain broadly stable at 96.7 million barrels a day in 2016, before edging up by 0.9 per cent to 97.5 million barrels a day in 2017—a marked slowdown compared with the growth seen over the past two years.
Figure: 8.3: Change in world oil consumption
Figure: 8.4: Year-on-year change in world production
OPEC production continues to increase
OPEC production increased year-on-year over the first eight months of 2016, with Iran and Iraq the largest sources of supply growth. Iranian crude oil production has increased quickly since sanctions related to its nuclear programme were lifted in January, rising from around 3 million barrels a day to around 3.6 million. Saudi Arabia has continued to defend market share by maintaining production. OPEC oil output is forecast to increase 3 per cent in 2016, to around 40 million barrels a day.
OPEC output is forecast to increase to around 41 million barrels a day in 2017, with annual growth slowing to 1.3 per cent. Production increases are possible over the next 15 months across a number of member countries. While it is difficult to assess the true state of Iran’s oil infrastructure, Iranian officials have recently suggested Iran could increase production to 4.3 million barrels a day in early 2017. Libya is also aiming to ramp up output, which is currently 300,000 barrels a day compared to 1.6 million before the fall of the Gaddafi regime, with negotiations between the government and local groups to reopen critical infrastructure currently underway. A number of other OPEC
Error! No text of specified style in document.OCE Report Template 51

countries, including Saudi Arabia, Iraq, Venezuela and Nigeria, are operating below current capacity.
Nevertheless, the outlook remains sensitive to political developments in OPEC member countries, and the outcome of any negotiations between OPEC and Russia.
Non-OPEC production constrained by falling US output
Non-OPEC supply declined year-on-year in the first eight months of 2016. Output continues to be affected by declines in US oil production, which has been falling since late 2015. Shale oil output in the seven key producing regions in the United States was down 14 per cent year-on-year in the September quarter. Despite the recent rally, low prices continue to place pressure on the US shale oil sector. At the start of August, 48 North American petroleum companies had filed for bankruptcy in 2016 (compared to 42 for the whole of 2015) and many other producers remain heavily indebted.
Major bushfires in the Canadian province of Alberta in May, and declining production in China as a result of the shut-in of high cost projects and natural decline at older fields, have also weighed on non-OPEC output. Non-OPEC production is forecast to decline by 1.8 per cent to 56.5 million barrels a day in 2016.
Non-OPEC production is forecast to remain broadly stable in 2017. Higher production in Brazil and Canada is expected to offset decreasing production in countries such as China and Mexico.
US shale oil production is forecast to fall further, as declining output at existing wells outweighs new investment. Nevertheless, the pace of decline is expected to moderate. After nine months of decline, the rig count in shale producing regions increased for a third consecutive month in August, suggesting that prices of around US$45 are attracting some producers back to the market. However, US shale oil production is not expected to stabilise and reverse course unless prices rise to around US$60 a barrel.
Figure 8.5: Output and rig count in US shale oil regions
8.5 Australia’s production and trade
Exploration activity at its lowest level in over a decade
Petroleum exploration expenditure declined for a sixth consecutive quarter in June, falling by 34 per cent to $283 million. Petroleum exploration expenditure was 59 per cent lower than a year earlier and 80 per cent below its peak of $1.4 billion in the December quarter 2012. Exploration activity now stands at its lowest level since the March quarter 2006.
Upstream production is forecast to decline
Australia produced 274,000 barrels of crude and condensate a day in the June quarter, down 9 per cent on a year earlier. While condensate production remained broadly stable, crude production fell sharply. The largest fall in crude production was recorded in the Carnarvon Basin off the coast of
Error! No text of specified style in document.OCE Report Template 52

Western Australia, with no production from the North West Shelf project, as a result of planned maintenance. Australia’s production averaged 317,000 barrels of crude and condensate a day in 2015–16, a decline of 3.5 per cent.
Australia’s output is expected to fall by 5 per cent in 2016–17 to 301,000 barrels a day as natural decline at established fields outweighs new supply, such as condensate production from the Gorgon project in Western Australia.
Australia’s exports earnings to increase
The value of Australia’s exports of crude oil and condensate declined by 26 per cent quarter-on-quarter in June. The fall was driven by a combination of lower export volumes and lower prices. In 2015–16, Australia’s export earnings declined by 37 per cent to $5.5 billion. Oil prices averaged just over US$40 a barrel in 2015–16, down from over US$70 a barrel in 2014–15.
The value of Australia’s exports of crude oil and condensate is forecast to increase by 6 per cent to $5.8 billion in 2016–17. The increase in export earnings is expected to be driven by rising oil prices, which will more than offset the anticipated decline in export volumes.
Figure 8.6: Australia’s petroleum exploration expenditure
Figure 8.7: Australia’s exports of crude and condensate
Australia’s refined production continues to decline while imports of refined products rise
Australia’s imports of refined products increased by 18 per cent to 593,000 barrels a day in 2015–16. Imports of refined products represented 62 per cent of domestic consumption, up from 53 per cent in 2014–15.
The increase was driven by declining domestic production of refined products, which fell by 16 per cent to 445,000 barrels a day in 2015–16, because of the closure of the Kurnell and Bulwer Island facilities. This represented the third consecutive year of falling refinery production.
Australian refineries are expected to remain under pressure over the outlook period as global refining capacity expands, driven by investments in non-OECD economies in the Middle East and Asia, particularly China.
Figure 8.8: Australia’s refined imports as a share of consumption
Error! No text of specified style in document.OCE Report Template 53

Table 8.1: Oil outlook
World Unit 2014 2015 2016 f 2017 f Per cent change
Production b mb/d 93.8 96.5 96.7 97.5 0.9
Consumption b mb/d 93.2 94.8 96.4 97.6 1.3
WTI crude oil price
Nominal US$/bbl 93.5 48.9 42.7 53.2 24.7
Real c US$/bbl 94.5 49.3 42.7 52.4 22.8
Brent crude oil price
Nominal US/$bbl 99.3 52.5 44.1 54.9 24.7
Real c US$/bbl 100.3 52.9 44.1 54.1 22.8
Australia Unit 2013–14 2014–15 2015–16 2016–17 f Per cent change
Crude and condensate
Production b kb/d 347 328 317 301 –5.2
Export volume b kb/d 255 261 241 235 –2.6
Nominal value A$m 11,115 8,656 5,467 5,776 5.7
Real value d A$m 11,720 8,974 5,590 5,776 3.3
Imports b kb/d 488 426 342 329 –3.9
LPG
Production be kb/d 64 57 53 51 –4.9
Export volume b kb/d 42 36 34 33 –4.2
Nominal value A$m 1,265 807 546 592 8.4
Real value d A$m 1,334 836 558 592 6.0
Error! No text of specified style in document.OCE Report Template 54

Australia Unit 2013–14 2014–15 2015–16 2016–17 f Per cent change
Refined products
Refinery production b kb/d 592 527 445 423 –5.0
Exports bg kb/d 11 12 10 9 –9.6
Imports b kb/d 430 504 593 595 0.5
Consumption bh kb/d 951 951 955 955 –0.1
Notes: b Number of days in a year is assumed to be exactly 365. A barrel equals 158.987 litres; c In current calendar year US dollars; d In current financial year Australian dollars; e Naturally
occurring; g Excludes LPG; f forecast; h Domestic sales of marketable products
Source: ABS (2016) International Trade in Goods and Services, Australia, cat. no. 5368.0; IEA (2016) Monthly Oil Market Report; Department of Industry, Innovation and Science (2016)
Error! No text of specified style in document.OCE Report Template 55

9. Uranium
9.1 Market summary
Australian uranium production is forecast to decrease by 6 per cent in 2016–17 in an environment of persistently low uranium prices. Domestic exploration for uranium deposits continued to decline in the June quarter as low prices and uncertainty weighed on investment.
While suppliers may face tough conditions in the short term, there are indications that uranium markets could improve in the second half of 2017. Significant investment in new reactors is currently underway in China, India, Russia and South America. Abundant supply and high inventories may restrain prices for a time, but given the structural trend towards higher global demand it is likely that prices will begin rising late in 2017.
9.2 Prices
High inventories and abundant supply will hold prices low in the short term
The uranium spot price has fallen steadily over 2016 as a result of excess supply, inventory accumulation, and slow progress in bringing Japanese reactors back online. At the end of August, the uranium spot price was US$25 a pound—down 7 per cent quarter-on-quarter and 27 per cent since the start of the year. The long-term contract price also fell quarter-on-quarter, declining 7 per cent to US$38 a pound.
For 2016 as a whole, the uranium spot price is forecast to decrease 22 per cent, to average US$29 a pound. However, price pressure created by a gradual run-down of inventories is expected to result in a 10 per cent increase in prices in 2017, when prices are forecast to average US$32 a pound.
This upward pressure on prices is likely to start building in late 2017. Eight new reactors were commissioned in the first three quarters of 2016: four of these were in China, with the rest being in South Korea, India, Russia and the US. One reactor in Japan also resumed operation in August. Further reactors will commence operation in China and India in 2017, and some existing reactors in Japan are also expected to return to operation in 2017.
Figure 9.1: Uranium prices, monthly
Figure 9.2: Outlook, quarterly uranium prices
Additional fuel demand has thus far had little effect on the spot price, with demand being largely met from inventories. However, as inventories wind down and longer-term contracts expire, there is likely to be more demand pressure. Some downside risk remains, however, due to uncertainty over how long Japanese reactors will remain offline.
Error! No text of specified style in document.OCE Report Template 56

The volume of trade in spot markets is likely to increase over the outlook period due to historically low spot prices, which are now significantly below most long-term contract prices.
9.3 Consumption
China, India, Russia and South Korea to drive consumption growth
Growth in uranium consumption is driven by the development of new nuclear power generation capacity. Commissioning a new reactor requires substantially more uranium for its initial core than refuelling operating plants. Subsequent annual requirements decrease as a reactor reaches a steady state level of operation. Most reactors are refuelled every one to two years, when a quarter to a third of the fuel assemblies are replaced.
World uranium consumption in 2016 is forecast to increase 9 per cent to 83,400 tonnes, underpinned by the start-up of new reactors in China, India, Russia, South Korea and the United States. Some uplift is also expected from potential reactor restarts in Japan, as well as moderate output increases at existing reactors in advanced economies.
China is expected to bring 10 new reactors with a combined capacity of 10,690 megawatts into commercial operation in 2016. Four have already commenced operation over the year to date.
Outside China, there are 10 additional reactors scheduled for completion in 2016—six in India, and one each in Russia, the US, Pakistan, and South Korea. These reactors will have a combined capacity of 8,072 megawatts.
Japan successfully restarted units 1 and 2 at the Sendai nuclear plant in 2015. However, progress in restarting the remaining 24 reactors that have applied for approval has been very slow. The timetable for further restarts is likely to be slow and difficult to predict, due to uncertainties related to political and legal decisions and the effect of public opinion. It is anticipated that between three and six reactors will re-open over the next two years.
World uranium consumption is forecast to increase by 6 per cent to 88,300 tonnes in 2017. Higher demand reflects an array of new capacity under construction. A total of 22 new reactors are scheduled for completion in 2017 with a total capacity of 22,444 megawatts. These include eight new reactors in China totalling 8,510 megawatts, two new reactors in South Korea totalling 2,680 megawatts and two new reactors in Russia totalling 2,199 megawatts. Other new reactors are scheduled for completion in India, Pakistan, Slovakia, and the United Arab Emirates (UAE).
Figure 9.3: World nuclear power generation
Figure 9.4: New nuclear capacity
Error! No text of specified style in document.OCE Report Template 57

9.4 Production
Mine production to increase in 2016 and 2017
World uranium production in 2016 is forecast to increase by 1.6 per cent to 72,800 tonnes. Higher production is expected in key US mines including the Peninsula Energy’s Lance mine, the Nichols Range mine, and the White Mesa mine in Utah. The Cameco’s Cigar Lake mine in Canada is also expanding production significantly, as are the Inkai and Budenovakoye mines in Kazakhstan.
World uranium supply is increasingly being driven by uranium inventories held by nuclear utilities and secondary market supplies (where existing stocks are traded). In late 2015 Ux Consulting estimated that there were sufficient inventories held by nuclear utilities to cover forward demand for around five years in Japan, two and a half years in both the United States and Europe, and around seven years in China. It is expected that uranium producers will focus on reducing production and cutting costs over the next eighteen months, with high cost mines likely to scale back or close. New projects are expected to remain on hold until price increases improve their commercial viability.
World uranium production in 2017 is forecast to increase 3.6 per cent to 75,400 tonnes, underpinned by continued increases in production at CGN/Swakop Uranium’s Husab mine in Namibia, and the Lance and Cigar Lake mines in North America.
Figure 9.5: World uranium consumption (U3O8)
Figure 9.6: World uranium production (U3O8)
9.5 Australia’s exploration, production and exports
Exploration expenditure continues to fall rapidly
Australia’s uranium exploration expenditure fell to $4.3 million in the June quarter, down 46 per cent from $7.9 million in the March quarter. The fall largely reflected declines in Western Australia, where exploration expenditure fell from $6.8 million to $2.3 million amidst uncertainty around future support for uranium mining in the state following the upcoming state election.
Over 2015–16 as a whole, exploration expenditure was $38.3 million. This is a 6 per cent fall on expenditure from 2014–15.
Australia’s production to fall in 2016–17
Australia’s uranium production is forecast to decrease by around 6 per cent to 7,225 tonnes in 2016–17, as production returns to average levels at the Olympic Dam and ERA Ranger facilities. These facilities had previously recorded spikes in production following disruptions to operations in 2014–15.
In September, the Western Australian Environmental Protection Authority approved Toro Energy’s proposal to expand its proposed uranium mine near Wiluna. The expansion will unlock large uranium deposits around Millipede
Error! No text of specified style in document.OCE Report Template 58
and Lake Maitland, with ore to be transported by road to Darwin and Adelaide for export. Due to the complexity of the supply chain and need to create new open pit mines, it is likely that a long-term price of around $50 per pound will be needed to make the project viable, and some delay may be experienced as a result.
Australian producers may face tighter conditions in the medium term as long-term supply contracts expire. It is likely that a greater share of global demand will be met from the spot market in 2017 due to the historical low in prices, which currently sit below the cost for most suppliers to bring uranium to market.
Figure 9.7: Uranium supply–demand balance (U3O8)
Figure 9.8: Australia’s uranium exploration
Nuclear power growth across Asia to drive Australia’s uranium exports
Australia is estimated to have exported 7,837 tonnes of U3O8 in 2015–16 — a 42 per cent increase on 2014–15. Export earnings are also estimated to have increased, by 80 per cent to around $959 million, supported by higher volumes and a lower exchange rate.
Exports are expected to ease slightly in 2016–17, to 7,225 tonnes. Export earnings are also forecast to decline over the outlook period, falling to $917 million in line with lower volumes and prices.
Although the outlook for exports remains tight in the short term, there is still strong potential for future growth in key regions, including North America, Western Europe, and Southeast Asia. In particular, future export growth is likely to be supported by increasing demand in China, where consumption is expected to rise strongly in coming years as a string of new reactors commence operation.
Although exports to Japan are expected to remain subdued, there could be risks to the upside in the event that the pace of re-opening reactors is faster than anticipated. Australia may also have greater opportunities to export uranium to Ukraine in the future, as the two governments have recently concluded a new supply agreement.
Figure 9.9: Australia’s uranium production
Figure 9.10: Australia’s uranium exports
Error! No text of specified style in document.OCE Report Template 59

Table 9.1: Uranium outlook
World unit 2014 2015 2016 f 2017 f Per cent change
Production kt 66.0 71.6 72.8 75.4 3.6
Africa b kt 9.7 8.9 9.5 11.3 19.0
Canada kt 10.7 15.7 15.9 16.2 2.1
Kazakhstan kt 26.9 28.1 28.1 28.1 0.2
Russia kt 3.6 3.6 3.6 4.0 9.4
Consumption kt 73.1 76.3 83.4 88.3 5.9
China kt 9.1 10.6 13.8 17.1 24.0
European Union 28 kt 22.7 22.7 22.2 22.4 1.0
Japan kt 0.0 0.2 0.5 1.2 162.9
Russia kt 6.4 6.0 6.1 6.6 7.0
United States kt 22.2 22.7 23.0 22.5 –1.9
Spot price
– nominal US$/lb 33.2 36.5 28.6 31.9 11.8
– real c US$/lb 33.6 36.8 28.6 31.4 10.1
Australia unit 2013–14 2014–15 2015–16 2016–17 f Per cent change
Production t 5,947 6,496 7,889 7,225 –8.4
Error! No text of specified style in document.OCE Report Template 60

Export volume t 6,596 5,515 7,837 7,225 –7.8
– nominal value A$m 614 532 959 917 –4.4
– real value d A$m 648 551 981 917 –6.5
Average nominal price A$/kg 93.1 96.4 122.4 126.9 3.7
– real d A$/kg 98.2 100.0 125.2 126.9 1.4
b Includes Niger, Namibia, South Africa, Malawi and Zambia. c In current calendar year US dollars. d In current financial year Australian dollars. f forecast.Source: Department of Industry, Innovation and Science (2016); Cameco Corporation (2016); Company reports (2016); Ux Consulting (2016) Uranium Market Outlook
Error! No text of specified style in document.OCE Report Template 61

10. Gold
10.1 Market summary
After rising rapidly in the first half of the year, gold prices stabilised in July and August, remaining close to the two year high recorded after the unexpected Brexit decision in June. Since then, a strong rebound in major world equity markets and an increasing likelihood of a US interest rate rise have both weighed against further increases.
Jewellery consumption and industrial fabrication both declined in response to the higher prices, while world gold supply increased moderately in the first half of the year, boosted by higher recycled supply. Higher gold prices and a generally lower Australian dollar continued to favour Australian producers. Australia’s export earnings from gold are forecast to increase 1.8 per cent to $16 billion in 2016–17.
10.2 Prices
Gold prices remain elevated around a two year high
After declining steadily since February 2013, the London Bullion Market Association (LBMA) price rebounded strongly in the first half of 2016, and now remains around the level of the two year high observed in July. The price of gold ranged between US$1,310 and US$1,370 per troy ounce during the month of July, before declining 2.8 per cent in August.
Several factors that made gold a popular safe-haven with investors in the first half of the year are likely to continue to drive demand over the outlook period, including slowing Chinese growth, post-Brexit uncertainty and the impending US election. Negative and low interest rate policies, which remain prevalent across Europe and Japan, are also likely to support investment demand, by continuing to lower the opportunity cost of holding gold.
In September, the US Federal Reserve’s Federal Open Market Committee decided to maintain the Federal Funds rate at 0.5 per cent while announcing the prospect of gradual increases in the future. Rising interest rates discourage investment in gold as they improve the return on other interest yielding assets. Higher US interest rates also put upward pressure on the US dollar, which reduces demand for gold as it is priced in US dollars.
Figure 10.1: Quarterly LBMA gold prices
Figure 10.2: Recent movement in gold prices
US interest rates are forecast to remain at historically low levels over the outlook period, rising modestly to 1.25 per cent by the end of 2017. This is expected to have a modest effect on gold demand over the short term.
Gold prices are likely to remain elevated over the remainder of 2016, in response to investor uncertainty and remarkably accommodative monetary policies in many developed economies. The LBMA gold price is forecast to
Error! No text of specified style in document.OCE Report Template 62

average US$1,280 per troy ounce in 2016, in part reflecting comparatively low prices early in the first quarter before prices rose rapidly.
Gold prices are expected to drift lower over the next eighteen months, as economic conditions improve. Investment demand for gold is expected to fall in response to higher world interest rates and stronger returns on alternative assets. The gold price is forecast to revert to a lower average of around US$1,260 per troy ounce in 2017.
10.3 World consumption
Jewellery consumption falls, while investment demand remains strong
Global gold consumption increased in the first half of 2016 due to strong investor demand, which more than offset declines in industrial and jewellery consumption. Investor demand continues to be driven by higher demand for bullion-backed Exchange Traded Funds (ETFs), with inventories increasing to over 568 tonnes in the first half of the year.
Investor demand for ETF’s—the most cost efficient and liquid way to invest in gold—accounted for 28 per cent of total gold consumption in the first half of 2016. Investor demand for gold has been driven by political and economic uncertainty in the first half of 2016, combined with widespread prevalence of low and negative interest rates. Retail investment in gold coins and bars remains 4 per cent lower in the first half of 2016, compared to the same period last year.
Jewellery consumption has declined sharply, falling to the lowest level in over 16 years. The decline in jewellery consumption reflects the combination of higher gold prices, depreciating exchange rates and weaker consumer sentiment in key markets such as India and China.
Figure 10.3: Gold price and US Federal Reserve interest rates
Figure 10.4: ETF gold holdings and gold spot price
Jewellery consumption has been particularly weak in India, where the domestic price rose to a two and a half year high. Jewellery consumption in India has also been impacted by lower consumption by people living in rural areas which accounts for half of India’s jewellery demand. Rural incomes have declined substantially after two years of unfavourable rainfall.
Gold consumption in electronics declined 11 per cent year-on-year in the first half of 2016, but rose by 1 per cent in the June quarter. The decline in the first half of the year reflects higher gold prices, which provide an incentive for producers to substitute gold for other metals in industrial applications.
Fabricated gold consumption is likely to remain subdued in 2016 as higher prices deter industrial use and reduce discretionary spending on jewellery. Fabricated gold consumption is forecast to increase by 2 per cent in 2017. Jewellery consumption is projected to increase by 3 per cent, more than offsetting a forecast 6 per cent decline in technology use. Jewellery consumption, which accounts for 80 per cent of total fabricated demand, is
Error! No text of specified style in document.OCE Report Template 63

expected to be supported by continued economic growth in India and China over the outlook period.
Figure 10.5: Global gold consumption
10.4 World production
World mine production rises moderately in early 2016
Total gold supply increased moderately in the first half of 2016 as an increase in recycled output boosted flat mine production. World mine production increased by just 1 per cent year-on-year in the first half of 2016, to reach 1,523 tonnes. In contrast, recycled output increased by 9 per cent year on year to 648 tonnes.
Trends in mine production have varied across countries and regions, but is notably higher in South America. Peru and Argentina also increased production year-on-year in the first half of 2016. Peru increased output by 15 per cent, to 81 tonnes, while Argentina increased by 25 per cent to just under 40 tonnes over the same period. This more than offset a decline in output in Columbia, where production was 33 per cent lower year-on-year as a result of the government’s continued efforts to address illegal mining.
The largest declines in production were in Asia, due to lower production in Kyrgyzstan and Mongolia, which both declined by 4 tonnes each year-on-year in the first half of 2016. At Oyu Tolgoi in Mongolia, operated by Turquoise Hill Resources, production was 100 tonnes lower year-on-year for the first half of 2016, due to lower grades. Production in China, the world’s largest producer, has been flat year-on-year, with output totalling just under 230 tonnes in the first half of 2016.
World mine production in 2016 is forecast to increase by 1.3 per cent to 3,263 tonnes. In 2017, world mine production is forecast to increase by 1.7 per cent, to just over 3,318 tonnes.
Gold recycling boosts world supply
World recycled supply increased 9 per cent in the first half of 2016, to reach 648 tonnes, the highest first half production since 2013. The gold recycling industry recorded strong production during 2009 to 2012, in line with growing prices, which reached record highs in December 2012. Since then the output from recycling activities has fallen. While scrap yards have taken advantage of recent higher prices, the overall supply of recycled gold remains below 2012 levels. Nonetheless, the increase in recycled gold has meant total world supply rose in the first half of 2016. Recycled supply is expected to continue to rise in the second half of 2016 and in 2017, in line with historically high prices.
Error! No text of specified style in document.OCE Report Template 64

10.5 Australia’s production and exports
Exploration expenditure improves
Australia’s gold exploration expenditure increased 35 per cent year-on-year to $276 million in the first half of 2016. Gold exploration expenditure as a share of total national mineral exploration expenditure has steadily increased, from 19 per cent in December 2011 to over 44 per cent in June 2016. The increase in the share of total mineral exploration expenditure is partly due to higher profit margins for gold producers and a comparatively smaller decline in prices compared to other minerals over the last 4 years.
Exploration expenditure increased strongly to $195 million in Western Australia in the first half of 2016. Western Australia remains the largest centre of gold exploration activity in Australia, attracting 70 per cent of total national gold exploration expenditure. The Northern Territory and Queensland also recorded strong increases in expenditure in the first half of 2016. Expenditure in the Northern Territory increased 52 per cent, to $27 million, while expenditure in Queensland rose 28 per cent, to just over $22 million.
Production remains steady in the June quarter
Australia’s gold production increased by 2.1 per cent year-on-year in the first half of 2016. Gold production increased to just over 70 tonnes in the June quarter, as several new mines offset declines at some of Australia’s larger mines.
Output from Newcrest’s Cadia Valley fell to just under 5.6 tonnes in the second quarter, after producing a record 6.3 tonnes in March quarter. The decline was due to increased downtime on key milling equipment as part of maintenance works and lower grades. Production at the Kalgoorlie Super Pit, operated as a joint venture by Barrick and Newmont, increased in the June quarter. Output increased to over 6 tonnes due to better ore grades, the highest quarterly production in five years.
Figure 10.6: Australia’s gold exploration expenditure
Exports of refined gold
Australia’s gold exports increased 27 per cent to $8.2 billion in the first half of 2016, supported by an increase in production, higher gold prices and a lower Australian dollar. Export volumes increased 19 per cent over the same period, to 155 tonnes.
The majority of Australia’s gold exports in the June quarter went to China and the UK, each receiving 68 tonnes. China’s consumption of Australian gold remains at historically high levels but declined by 11 per cent year-on-year in the first half of 2016. In contrast, exports to the UK increased by 122 per cent in the June quarter to just over 46.8 tonnes, as investor demand for UK based gold ETF’s increased leading into the Brexit referendum.
Australia’s gold exports are estimated to have increased to 306 tonnes in 2015–16, supported by higher domestic production. The combination of higher domestic production and higher imported ore for processing is
Error! No text of specified style in document.OCE Report Template 65

expected to maintain exports at the current five year high, with an increase of 0.1 per cent to 307 tonnes expected in 2016–17.
Figure 10.7: Australia’s gold exports
Figure 10.8: US dollar versus Australian dollar gold price
Error! No text of specified style in document.OCE Report Template 66

Table 10.1: Gold outlook
World unit 2014 2015 2016 f 2017 f per cent change
Fabrication
Consumption b t 2,830 2,731 2,786 2,845 2.1
Mine production t 3,260 3,221 3,263 3,318 1.7
Price c
– Nominal US$/oz 1,266 1,160 1,280 1,260 –1.6
– real d US$/oz 1,279 1,170 1,280 1,241 –3.1
Australia unit 2013–14 2014–15 2015–16 2016–17 f per cent change
Mine production t 274 275 282 293 1.8
Export volume t 279 278 306 307 1.7
– nominal value A$m 13,010 13,048 15,674 16,323 4.1
– real value e A$m 13,719 13,527 16,028 16,323 1.8
Price
– nominal A$/oz 1,410 1,468 1,602 1,696 5.9
– real e A$/oz 1,487 1,522 1,638 1,696 3.6Notes: b Includes jewellery consumption and industrial applications; c London Bullion Market Association PM price; d In current calendar year US dollars; e In current financial year Australian
dollars; f Forecast.
Source: Sources: ABS (2016) International Trade, 5465.0; London Bullion Market Association (2016) gold price PM; World Gold Council (2016); Department of Industry, Innovation and Science.
Error! No text of specified style in document.OCE Report Template 67

11. Aluminium, alumina, bauxite
Aluminium
11.1 Market summary
The outlook for Australia’s aluminium exports remains positive because of the increased use of aluminium in the global automotive sector, as automakers are using more aluminium to reduce vehicle weight and improve fuel efficiency. This is despite a forecast reduction in Australia’s aluminium demand attributable to a number of automotive plant closures scheduled over the next 18 months.
Australia’s aluminium production is forecast to remain steady, with an increased proportion being exported to growing markets. Australia’s aluminium exports are forecast to increase 2 per cent in 2016–17 to 1.5 million tonnes, while export earnings are forecast to increase by 2 per cent to $3.4 billion in 2016–17.
11.2 Prices
Aluminium prices to continue to rise
The London Metals Exchange (LME) aluminium prices have increased 9 per cent year-to-date to average US$1,566 a tonne, mainly in response to production cuts in China and other large producing countries such as Russia and the US. As a result, stocks declined more than 23 per cent in the first half of 2016, to around 2.2 million tonnes. However, growth in prices is likely to be limited by an expected rebound in supply from China, where higher aluminium prices are likely to encourage facility restarts over the remainder of the year.
For 2016 as a whole, prices are forecast to average US$1,558 a tonne, around 3 per cent lower than forecast in the June edition of the Resources and Energy Quarterly. Aluminium prices are forecast to increase 2 per cent in 2017, to average US$1,587 a tonne, as stronger demand in the automotive sector outweighs increased production associated with capacity restarts in China.
Figure 11.1: Annual aluminium prices and stocks
Figure 11.2: World aluminium consumption
11.3 Consumption
World aluminium consumption to remain strong
In the first half of 2016, world aluminium consumption was steady year-on-year, at 28.5 million tonnes, reflecting growing consumption in China and major automotive producing countries. In China, economic activity in aluminium-intensive industries continues to drive growth in consumption, most notably real estate construction. Aluminium consumption in Italy and
Error! No text of specified style in document.OCE Report Template 68

South Korea also increased in the first half of the year, by 26 and 14 per cent, to 478 and 730 thousand tonnes respectively. In contrast, Japan’s consumption dropped 15 per cent year-on-year, to 850 thousand tonnes. Over the remainder of 2016, consumption is forecast to increase as demand from automotive producers continues to rise. For 2016 as a whole, global aluminium consumption is forecast to remain unchanged from the previous forecast of 60 million tonnes.
World aluminium consumption is forecast to rise by 4 per cent in 2017, to nearly 62 million tonnes, largely supported by increased consumption in China and the global automotive sector, which is estimated to constitute close to 50 per cent of demand. China’s aluminium demand is forecast to grow by 18 per cent in the next three years as a result of increased use of high-end products in transportation and construction.
11.4 Production
New and restart capacity to boost global production
World aluminium production decreased 1 per cent year-on-year in the first half of 2016 to just over 28 million tonnes, as major aluminium producers such as China and Russia cut production. Russian aluminium smelters responded to weak demand from the car manufacturing industry, while Chinese smelters curtailed production in response to the government’s ’supply-side reform’ policy. Despite this, production in China is forecast to increase in the second half of 2016, as the recovery of aluminium prices in 2016 provides incentives to restart idled capacity and boost output. As a result, the estimate for China’s production in 2016 has been revised upwards by around 4 per cent since the June edition, to 34 million tonnes. New smelting capacity commencing operation in 2016 and 2017, which will replace old and inefficient capacity under China’s ‘new for old’ policy will also increase production.
Figure 11.3: World aluminium production
Outside of China, the Jharsuguda and Korba expansion projects in India began to ramp-up production in April 2016, and are expected to reach full capacity of 800 thousand tonnes and 230 thousand tonnes respectively before the end of 2016. In Malaysia, the expansion of the Press Metals Bintulu 220 thousand tonnes project is expected to be completed in the December quarter 2016. Global aluminium production is forecast to increase 5 per cent in 2016 to 60.5 million tonnes, 3 per cent higher than forecast in the June 2016 edition.
In 2017, new capacity in China will continue to provide additional output. Production in other countries such as Russia and India is also forecast to increase to meet growing demand from global automakers. In Russia, the expansion of the Boguchansk 150 thousand tonnes project is scheduled to complete in 2017. Capacity in the Middle East is projected to increase by more than 4 per cent in 2017, to nearly 7 million tonnes. Saudi Arabia’s aluminium production is forecast to increase 15 per cent, to over 900 thousand tonnes in 2017 before exceeding 1 million tonnes in 2018.
Error! No text of specified style in document.OCE Report Template 69

As a result, world aluminium production is forecast to rise another 5 per cent over the outlook period, to 64 million tonnes, 700 thousand tonnes higher than previously forecast.
11.5 Consumption
World aluminium consumption to remain strong
In the first half of 2016, world aluminium consumption was steady year-on-year, at 28.5 million tonnes, reflecting growing consumption in China and major automotive producing countries. In China, economic activity in aluminium-intensive industries continues to drive growth in consumption, most notably real estate construction. Aluminium consumption in Italy and South Korea also increased in the first half of the year, by 26 and 14 per cent, to 478 and 730 thousand tonnes respectively. In contrast, Japan’s consumption dropped 15 per cent year-on-year, to 850 thousand tonnes. Over the remainder of 2016, consumption is forecast to increase as demand from automotive producers continues to rise. For 2016 as a whole, global aluminium consumption is forecast to remain unchanged from the previous forecast of 60 million tonnes.
World aluminium consumption is forecast to rise by 4 per cent in 2017, to nearly 62 million tonnes, largely supported by increased consumption in China and the global automotive sector, which is estimated to constitute close to 50 per cent of demand. China’s aluminium demand is forecast to grow by 18 per cent in the next three years as a result of increased use of high-end products in transportation and construction.
11.6 Production
New and restart capacity to boost global production
World aluminium production decreased 1 per cent year-on-year in the first half of 2016 to just over 28 million tonnes, as major aluminium producers such as China and Russia cut production. Russian aluminium smelters responded to weak demand from the car manufacturing industry, while Chinese smelters curtailed production in response to the government’s ’supply-side reform’ policy. Despite this, production in China is forecast to increase in the second half of 2016, as the recovery of aluminium prices in 2016 provides incentives to restart idled capacity and boost output. As a result, the estimate for China’s production in 2016 has been revised upwards by around 4 per cent since the June edition, to 34 million tonnes. New smelting capacity commencing operation in 2016 and 2017, which will replace old and inefficient capacity under China’s ‘new for old’ policy will also increase production.
Figure 11.3: World aluminium production
Outside of China, the Jharsuguda and Korba expansion projects in India began to ramp-up production in April 2016, and are expected to reach full capacity of 800 thousand tonnes and 230 thousand tonnes respectively before the end of 2016. In Malaysia, the expansion of the Press Metals Bintulu 220 thousand tonnes project is expected to be completed in the
Error! No text of specified style in document.OCE Report Template 70
December quarter 2016. Global aluminium production is forecast to increase 5 per cent in 2016 to 60.5 million tonnes, 3 per cent higher than forecast in the June 2016 edition.
In 2017, new capacity in China will continue to provide additional output. Production in other countries such as Russia and India is also forecast to increase to meet growing demand from global automakers. In Russia, the expansion of the Boguchansk 150 thousand tonnes project is scheduled to complete in 2017. Capacity in the Middle East is projected to increase by more than 4 per cent in 2017, to nearly 7 million tonnes. Saudi Arabia’s aluminium production is forecast to increase 15 per cent, to over 900 thousand tonnes in 2017 before exceeding 1 million tonnes in 2018.
As a result, world aluminium production is forecast to rise another 5 per cent over the outlook period, to 64 million tonnes, 700 thousand tonnes higher than previously forecast.
11.7 Australia’s production and exports
Production to remain steady
In 2015–16, Australia’s aluminium production remained unchanged at 1.65 million tonnes. A 2 per cent increase in production at the Tomago facility offset lower production at Bell Bay, which was affected by the March power shortage in Tasmania.
Australia’s aluminium production is forecast to remain at 1.65 million tonnes in 2016–17. Alcoa’s Portland smelter recently negotiated a power contract with AGL Australia to supply power from November 2016. However, the contract is likely to be terminated before its commencement due to a financial loss from AGL’s Loy Yang A power plant in Latrobe Valley. In addition, the possible closure of Hazelwood power station in Latrobe Valley is likely to add further pressure to the Portland smelter’s operation. Without a new favourable power agreement in place before the end of the year, Portland’s production is likely to be affected, reducing Australia’s production.
Increased aluminium demand from the automotive industry provides more ore opportunities for Australia’s exports
Australia’s aluminium exports remained steady in 2015–16 at 1.4 million tonnes. Exports to Japan and Taiwan, Australia’s major aluminium export markets, dropped 45 and 27 per cent to 302 and 132 thousand tonnes, respectively, due to strong competition from China and Russia. The falls in Japan and Taiwan were offset by a 76 per cent rise in exports to South Korea, to reach 507 thousand tonnes, as a result of a discounted car sales tax encouraging local car production and sales. Export values declined by 17 per cent to $3.2 billion, driven by lower aluminium prices in the first half of the financial year.
In 2016–17, increased use of aluminium in the automobile sector in the US, Europe and China is likely to provide more opportunities for aluminium exporters. Australia’s domestic aluminium consumption is forecast to decrease 2 per cent in 2016–17 due to closures of automotive manufacturing
Error! No text of specified style in document.OCE Report Template 71

capacity, which will provide additional capacity for exports. As a result, Australia’s exports of aluminium are forecast to increase 2 per cent in 2016–17 to 1.5 million tonnes. Export earnings are forecast to increase 2 per cent to $3.4 billion.
Figure 11.4: Australia’s aluminium production
Figure 11.5: Australia’s aluminium exports
Alumina
11.8 Market summary
The outlook for Australia’s alumina exports remains positive, supported by expected restarts of aluminium production capacity in China. As the principal supplier of alumina to China, forecast increases in China’s aluminium production are expected to further increase Australia’s export opportunities. In 2016–17, alumina exports are forecast to increase 5 per cent to 18.5 million tonnes as a result of increased demand from China. Over this forecast period, export earnings are forecast to increase 2 per cent to $6.2 billion, supported by higher alumina prices.
11.9 Prices
Aluminium production supports alumina prices in 2017
The FOB Australia alumina price reached a 10-month high in May 2016, averaging US$259 a tonne over the month, driven by reduced supply from China, the world’s largest alumina producer. However, prices have fallen in the September quarter of 2016 as a result of increased supply from China. The recent recovery in aluminium and alumina prices have encouraged a number of refinery restarts in China and other parts of the world, putting downward pressure on prices. For 2016 as a whole, alumina prices are forecast to average US$237 a tonne.
In 2017, growth in global aluminium production is expected to support higher alumina prices, which are forecast to increase to an average of US$245 a tonne.
11.10 Consumption
Growth in global alumina consumption continues
World alumina consumption remained subdued in the first half of 2016, due to lower output from major aluminium producing countries such as China and Russia. However, consumption is forecast to increase in the second half of 2016 in response to the recovery in aluminium prices. Higher prices provide aluminium smelters with greater incentive to boost aluminium production and thus, alumina demand. In China, refinery capacity restarts continue to gather momentum, despite the government attempts to restrain supply growth. In India, alumina demand is expected to increase to around 1.5 million tonnes per annum as Vedanta expands aluminium production at Jharsuguda and
Error! No text of specified style in document.OCE Report Template 72

Korba. In the Middle East, Saudi Arabia is forecast to increase its alumina consumption to around 1.5 and 1.7 million tonnes in 2016 and 2017 respectively. The forecast increase in consumption largely reflects the Government’s plan to expand the aluminium sector and diversify the economy away from oil.
For 2016 as a whole, world alumina consumption is forecast to rise 4 per cent to 116 million tonnes. Global alumina consumption is forecast to increase 6 per cent in 2017 to 124 million tonnes, supported by aluminium production growth in China and the Middle East.
Figure 11.6: Annual alumina price
11.11 Production
Alumina production to rise in response to high prices
World alumina production decreased 3 per cent year-on-year in the first half of 2016, to 52 million tonnes, as China, the world’s largest alumina producer, cut production by 2 per cent to 27.5 million tonnes. However, the recent recovery in alumina prices in response to production cuts is expected to be a catalyst for increased production over the remainder of the year, particularly in China, where Chinese producers have been very quick to bring idled capacity back into production. Globally, more than 5 million tonnes per annum of new aluminium smelting capacity is expected to come online in 2016, which is likely to encourage alumina refineries to boost their production.
Other additions to global alumina production are from the Southeast Asian region. The 1 million tonnes per annum Well Harvest plant in Indonesia commenced operation in the June quarter 2016. The 600 thousand tonnes per annum Nhan Co project in Vietnam is expected to come online in the December quarter 2016. For 2016 as a whole, world alumina production is forecast to increase to nearly 115 million tonnes, 3 per cent higher than the previous forecast, driven by restarts and new capacity.
In 2017, world alumina production is forecast to increase by 5 per cent to 125 million tonnes, supported by continued capacity restarts in China and new capacity in other parts of the world. The 2 million tonnes per annum Al Taweelah refinery project in the Middle East, which is owned and operated by Emirates Global Aluminium, is expected to begin operation in the December quarter 2017. The 2 million tonnes per annum Lanjigarh refinery project in India is also expected to be operating in 2017, subject to bauxite availability.
11.12 Australia’s production and exports
Australia’s alumina production remains steady
Steady production increases in each quarter of the year contributed to a 3 per cent rise in Australia’s alumina production in 2015-16, with production increasing to 20.5 million tonnes. Over this period, Yarwun’s production was a standout, rising 13 per cent, to over 3 million tonnes. In 2016–17, Australia’s alumina production is forecast to increase 2.4 per cent to 21 million tonnes as recent expansions have more than doubled production at Rio Tinto’s Yarwun
Error! No text of specified style in document.OCE Report Template 73

operation to 3.4 million tonnes. Moreover, production at Alcoa’s Kwinana, Pinjarra and Wagerup operations is likely to increase should the recovery of alumina prices continues.
Aluminium smelting capacity restarts in China to improve Australia’s alumina exports
Australia’s alumina exports increased 2 per cent in 2015–16 to 17.6 million tonnes as aluminium smelting capacity restarts in China increased demand for alumina. Australia is the principal alumina supplier to China, accounting for 62 per cent of China’s total imported alumina. However, over this period, export earnings decreased 7 per cent to just below $6 billion, because of a 9 per cent fall in alumina prices in 2015.
Australia’s alumina export volumes for 2016–17 are forecast to increase 5 per cent to 18.5 million tonnes, underpinned by increased demand from China following aluminium smelter restarts during 2016. Over the forecast period, export earnings are forecast to increase 2 per cent to $6.2 billion, supported by higher alumina prices.
Figure 11.7: World alumina consumption
Figure 11.8: World alumina production
Figure 11.9: Australia’s alumina production
Figure 11.10: Australia’s alumina exports
Bauxite
11.13 Market summary
Although Australia is the current principal supplier of bauxite to China, its position will be challenged by Guinea, which is an emerging key bauxite exporter in 2017. As a result, Australia’s bauxite export volumes are forecast to decline 8 per cent in 2016–17, to 19 million tonnes. Export earnings are also forecast to decrease 13 per cent, to $882 million.
11.14 Production
Guinea and Australia to be the key drivers of production growth
World bauxite production decreased 1 per cent year-on-year in the first half of 2016, falling to 136 million tonnes because of supply reductions from Malaysia. Over this period, Malaysia’s production decreased 32 per cent as the government limited supply growth to address socio-environmental concerns. The ban on bauxite mining in Pahang, the largest producing state, which has been in place since early 2016, is to be extended until September 2016.
The decline in Malaysia’s production was offset by increased output from Australia and Guinea, and steady production from China. Over this period, production in Australia, the world’s largest bauxite producer, increased 2 per
Error! No text of specified style in document.OCE Report Template 74

cent to 41 million tonnes to meet alumina capacity restarts in China. Guinea, a newly emerged key global bauxite producer, recorded very strong growth, with production increasing by 29 per cent, to 12 million tonnes. Production in China, the world’s second largest bauxite producer, remained steady at 32.5 million tonnes. Driven by strong growth of production from Guinea, global bauxite production is now forecast to increase 4 per cent in 2016 to 299 million tonnes, 1 per cent higher than forecast in the June edition.
World bauxite production is forecast to increase 13 per cent in 2017, to 339 million tonnes, driven by continued increases to production in Guinea, and to a lesser extent, Australia.
Figure 11.11: World bauxite production
11.15 Australia’s production and exports
Australia’s bauxite production to grow modestly
Australia’s bauxite production increased 2 per cent in 2015–16 to 82 million tonnes, driven by strong production at Gove (up 21 per cent) and Weipa (up 3 per cent). The growth in production is expected to continue in 2016–17, increasing 2 per cent to 83 million tonnes, as world alumina production is forecast to rise 5 per cent. Further supply from Australian Bauxite’s Bald Hill mine in Tasmania and increased production from major producers are likely to support this forecast.
Despite reduced Australian exports, the increased bauxite production is expected to be consumed domestically, associated with the growth in domestic alumina production and increased demand from China for aluminium smelting.
Guinea to challenge Australia in 2017
Australian bauxite producers have employed new technologies over the last few years to reduce the cost of bauxite mining, passing that on in the form of competitive export prices. As a result, Australia’s bauxite exports increased 4 per cent in 2015–16, to 21 million tonnes, supported by strong growth in exports to China. During the 2016 June quarter, exports to China rose 5 per cent to 5.4 million tonnes. Export earnings also increased, by 6 per cent to nearly $1billion in 2015–16.
In 2016–17, Australia’s bauxite exports are forecast to decline by 8 per cent to 19 million tonnes. Although China is expected to remain they key destination for Australia’s bauxite exports, Australia’s market share in China is likely to be challenged by increased volumes from Guinea. In the June quarter 2016, Guinea exported 2.9 million tonnes of bauxite to China, a figure which is expected to increase into the future. China’s Ministry of Finance expects Guinea to replace Australia as China’s top bauxite supplier by 2017. In addition, Weiqiao Group, the company responsible for more than half of China’s bauxite imports in 2015, has planned to import 15 million tonnes of bauxite from Guinea in 2016, with the potential for an increase in volumes in 2017. For this reason, export earnings are estimated to decrease 13 per cent to $882 million.
Error! No text of specified style in document.OCE Report Template 75

Figure 11.12: Australia’s bauxite production
Figure 11.13: Australia’s bauxite exports
Error! No text of specified style in document.OCE Report Template 76

Table 11.1: Aluminium, alumina and bauxite
World unit 2014 2015 2016f 2017 f Per cent changePrimary aluminiumProduction kt 53,248 57,361 60,497 63,683 5.3Consumption kt 53,978 57,120 59,630 61,939 3.9Closing stocks b kt 6,428 6,668 7,535 9,279 23.1– weeks of consumption 6.2 6.1 6.6 7.8 18.6Prices
World aluminium c– nominal US$/t 1,865 1,663 1,558 1,587 1.9
USc/lb 84.7 75.4 71.4 74.8 4.8
– real d US$/t 1,889 1,682 1,558 1,559 0.1
USc/lb 86.6 75.4 69.8 73.5 5.3Alumina spot– nominal US$/t 331 301 237 245 3.6
– real d US$/t 335 304 237 241 1.7
Australia 2013–14 2014–15 2015–16 2016–17 f Per cent changeProductionPrimary aluminium kt 1,773 1,647 1,647 1,644 –0.2Alumina kt 21,532 19,895 20,498 20,970 2.3Bauxite Mt 80.3 80.3 81.7 83.4 2.0ConsumptionPrimary aluminium kt 197 214 206 174 9.0ExportsPrimary aluminium kt 1,576 1,432 1,441 1,470 2.0– nominal value A$m 3,479 3,823 3,237 3,367 4.0– real value e A$m 3,669 3,963 3,311 3,367 1.7Alumina kt 18,614 17,363 17,676 18,504 4.7– nominal value A$m 5,711 6,353 5,995 6,235 4.0
– real value e A$m 6,022 6,586 6,131 6,235 1.7
Bauxite kt 15,146 20,204 20,971 19,197 –8.5– nominal value A$m 546 934 992 882 -11.1– real value e A$m 576 968 1,014 882 –13.0
Error! No text of specified style in document.OCE Report Template 77

Total value– nominal A$m 9,737 11,110 10,225 10,484 2.5
– real e A$m 10,267 11,518 10,456 10,484 0.3
Notes: b Producer and LME stocks; c LME cash prices for primary aluminium; d In current calendar year US dollars; e In current financial year Australian dollars; f Forecast
Sources: ABS (2016) International Trade in Goods and Services, 5368.0; AME Group (2016); Department of Industry, Innovation and Science (2016); World Bureau of Metal Statistics (2016)
Error! No text of specified style in document.OCE Report Template 78

12. Copper
12.1 Market summary
World copper prices are forecast to remain subdued during the remainder of 2016, as rising supply continues to outpace historically high global consumption. While the majority of new supply is from Asia and South America, Australia also produced a record 511 thousand tonnes of copper in the first half of 2016. Australia’s copper exports increased 5 per cent to over 1 million tonnes (in metal content terms) in 2015–16, while earnings declined 4 per cent to $8 billion because of lower prices.
12.2 Prices
Copper prices to remain low in 2016
The long-term downwards trend in the London Metal Exchange (LME) copper price started to flatten out during 2016. The LME price averaged US$4,730 a tonne over the first three quarters of the year, down 17 per cent year-on-year and more than 50 per cent below the February 2011 peak of US$10,148 a tonne. Copper prices have fluctuated between US$4,300 and US$5,100 a tonne in 2016 and remain close to seven year lows.
The fall in copper prices since 2011 is the result of slowing consumption growth and increased production capacity. Copper consumption in Europe remains 25 per cent lower than 2006 levels, suppressed by lower industrial production. Consumption growth in China, which represents half of global consumption, has also slowed to the lowest levels since the global financial crisis. Meanwhile, declining production in Chile, the world’s largest producer, has been more than offset by increasing supply elsewhere, mainly in South America and Asia.
World stocks of copper declined by 3 per cent year-on-year in the first half of 2016. However, copper stocks are expected to increase in the short term as further supply comes onto the market. The average daily copper inventory at the LME in September is over 40 per cent above June quarter 2016 levels.
Over the remainder of 2016, copper prices are forecast to stabilise. Most producers can supply copper to the market for less than US$4,400 a tonne. Nonetheless, the decline in copper prices will tighten profit margins and several high cost mines are likely to reduce production.
In 2016, the LME copper price is forecast to average US$4,760, 16 per cent lower than the average in 2015.
The LME copper price is forecast to average US$5,200 in 2017, as consumption growth improves, supported by stronger economic growth in emerging economies.
Figure 12.1: Annual copper prices and stocks
Figure 12.2: Recent movement in copper prices
Error! No text of specified style in document.OCE Report Template 79

12.3 World consumption
Copper consumption increases
World refined copper consumption increased 7 per cent year-on-year, to just under 12 million tonnes in the first half of 2016. Over this period, China consumed more than 5.8 million tonnes, a 10 per cent increase year-on-year. Construction in China continued to increase in the first half of 2016, rising 5.6 per cent to almost 32 billion square meters of floor space under construction. The construction sector accounts for over 60 per cent of China’s copper consumption and was boosted by government stimulus earlier in the year which is expected to moderate in the second half of 2016.
Elsewhere in Asia, trends in copper consumption were mixed, with large increases recorded in Thailand and Taiwan more than offsetting a decline in Japan, the world’s fourth largest consumer. Copper consumption fell in Japan, largely due to continued weakness in the manufacturing sector. The number of machinery orders—an important indicator of Japan’s manufacturing sector—declined almost 8 per cent year-on-year in the first half of 2016.
Copper consumption was lower in the US in the first half of 2016, declining 4 per cent to 892 thousand tonnes. Consumption continues to be weighed down by sluggish economic growth, slowing activity in the construction sector and a decline in the production of power equipment, which fell 16 per cent in the first half of 2016. The US Geological Survey leading index for copper demand has declined slightly over the last 12 months from a 10 year high in May 2015, suggesting marginally weaker consumption in the US over the short term.
Figure 12.3: China copper consumption and new floor space
Figure 12.4: Copper consumption selected regions
Europe’s refined copper consumption increased in by 6 per cent year-on-year in the first half of 2016. The increase was led by strong demand in Germany and Russia, which more than offset declines in Belgium and Spain. Copper consumption increased 9 per cent in Germany in the first half of 2016, supported by continuing growth in the construction sector.
Increased investment in infrastructure, construction and industrial capacity in emerging economies is expected to drive much of the growth in copper consumption over the next two years. Copper consumption in 2016 is forecast to reach 23 million tonnes, before increasing by a further 3 per cent to reach 24 million tonnes in 2017.
12.4 World production
World mine copper production continues to grow
World mine production increased by 6 per cent year-on-year in the first half of 2016 to just under 10 million tonnes. Over much of the past decade, copper producers received historically high prices, which encouraged investment and further supply is expected over the short term.
Error! No text of specified style in document.OCE Report Template 80

Peru increased production by 51 per cent year-on-year to just over 700 thousand tonnes in the first six months. The recently expanded Cerro Verde copper mine in Peru operated by Freeport-McMoRan is expecting to produce over 272 thousand tonnes of copper annually, while MMG’s Las Bambas mine produced over 119 thousand tonnes of copper concentrate in the first half of 2016.
Copper production also increased substantially in Kazakhstan, rising 107 per cent year-on-year to over 449 thousand tonnes in the first half of 2016. KAZ Minerals continues to develop two large open pit mines in Kazakhstan, Bozshakol and Aktogay, which are expected to produce 100 and 90 thousand tonnes of copper concentrate a year, respectively.
Production in Chile, the world’s largest producer of copper, continued to decline in the first half of 2016, decreasing over 5 per cent year-on-year. BHP Billiton’s Escondida copper mine in Chile declined 20 per cent year-on-year, producing 268 thousand tonnes of copper in the June quarter due to lower ore grades.
Figure 12.5: USGS Copper Industry Leading Index and US industrial production
Figure 12.6: Global mine and refined production
Over the remainder of 2016, world mine output is forecast to continue to increase as new projects developed over the past few years approach full capacity. As a result, world mined copper production is forecast to increase by 5 per cent to 20 million tonnes in 2016. As further new mines commence production and others are set to expand, copper mine production is forecast to reach 22 million tonnes in 2017.
World refined copper forecast to rise
World refined copper production increased by 3 per cent year-on-year to over 11 million tonnes in the first half of 2016. Refined copper production in China increased 7 per cent year-on-year to over 4 million tonnes in the first half of 2016, as higher imports of concentrate have offset a 4 per cent decline in Chinese mine supply. Refined copper production increased in the US, Chile and Brazil in the first half of 2016. Brazil increased refined copper output by 70 per cent to 222 thousand tonnes, while the US increased production by 18 per cent to 625 thousand tonnes. World refined production is forecast to exceed 23 million tonnes in 2016, before increasing by a further 2.3 per cent to 24 million tonnes in 2017.
12.5 Australia’s production and exports
Exploration expenditure increases from subdued levels
Australia’s copper exploration expenditure increased 16 per cent year-on-year in the first half of 2016, to over $68 million. The increase was largely due to increased expenditure in New South Wales and Western Australia, which more than offset lower expenditure in Queensland and South Australia. Expenditure in Western Australia has more than doubled compared to the first
Error! No text of specified style in document.OCE Report Template 81

half of 2015, increasing from $10 million to $24 million. Despite the rise, copper exploration remains at historically low levels. Current copper exploration expenditure is around 70 per cent lower than the peak recorded in the first half of 2012, when expenditure reached $219 million.
Production set to increase in 2016
Australia’s copper mine production increased by 5.4 per cent in 2015–16, to over 1 million tonnes (in metal content terms). Australia’s largest copper mine, Olympic Dam, increased production by 63 per cent to 203 thousand tonnes in line with improved smelter and mill utilisation and higher grades.
Figure 12.7: Australia’s copper exploration expenditure
Figure 12.8: Australia’s copper production
Glencore’s Mount Isa mine in Queensland recorded a modest fall in production of 2 per cent year-on-year in the first half of 2016. The decline was due to the continued short-term impact of the Aurizon train derailment between Mount Isa and the Townsville refinery in late December 2015, which was partially offset by improved grades at their Cobar operations.
CuDeco delivered the first copper concentrates from its Rocklands operation to the Port of Townsville and is expected to ramp up production over the September quarter. The mine is expected to produce an average of 16 thousand tonnes per year over the next ten years.
Production is expected to increase over the outlook period in line with the expansion of Olympic Dam and additional supply from the Mount Lyell copper mine which is expected to produce 25 thousand tonnes of copper when it re-opens in 2017. Australia’s copper production is forecast to increase by 2.1 per cent to just over 1 million tonnes (in metal content terms) in 2016–17.
Refined copper exports surge in first half of 2016
Australia’s copper export earnings increased by 1.1 per cent year-on-year to $3.8 billion in the first half of 2016, as higher volumes offset lower copper prices. Export volumes (in metal content terms) increased by 4 per cent due to higher refined copper exports, which increased 32 per cent year-on-year.
Exports to China, which account for 47 per cent of Australia’s copper exports, increased by 9 per cent year-on-year, to over 544 thousand tonnes for the first half of 2016. Copper exports to Japan and India fell in the first half of 2016, by 26 and 10 per cent respectively. Consumption in Japan declined due to weak industrial production, while India has benefited from higher domestic production.
Australia’s copper exports (in metal content terms) reached more than 1 million tonnes in 2015–16. Australia’s copper exports are forecast to increase by 4.7 per cent in 2016–17, supported by historically high consumption in China, which accounts for 47 per cent of Australia’s copper exports. However, the value of Australia’s copper exports are forecast to decrease by 2.9 per cent to $8 billion in 2016–17, due to dampened copper prices.
Figure 12.9: Australia’s annual copper exports
Error! No text of specified style in document.OCE Report Template 82

Figure 12.10: US dollar versus Australian dollar copper price
Error! No text of specified style in document.OCE Report Template 83

Table 12.1: Copper outlook
World unit 2014 2015 2016 f 2017 f per cent changeProduction
– mine c kt 18,479 19,322 20,294 21,670 6.8
– refined kt 22,905 23,052 23,452 23,993 2.3
Consumption kt 22,802 22,690 23,034 23,811 3.4
Closing stocks kt 768 924 1,342 1,524 13.6
– weeks of consumption kt 1.8 2.1 3.0 3.3 9.9
Price c
– Nominal US$/t 6,860 5,678 4,760 5,200 9.2
US$/lb 311 258 216 236 9.2
– real b US$/t 6,931 5,725 4,760 5,121 7.6
US$/lb 314 260 216 232 7.6
Australia unit 2013–14 2014–15 2015–16 2016–17 f per cent changeMine output c kt 988 955 1,007 1,029 2.2
Refined output kt 500 454 509 496 –2.6
Exports
– ores and conc c kt 2,122 2,056 1,889 1,978 4.7
– refined kt 456 423 507 492 –2.9
Export value
– nominal A$m 8,707 8,468 8,124 7,992 –1.6
– real d A$m 9,181 8,779 8,308 7,992 –3.8
Notes: b In current calendar year US dollars; c Quantities refer to gross weight of all ores and concentrates; d In current financial year Australian dollars; e Estimate; f Forecast.
Source: Sources: ABS (2016) International Trade, 5465.0; LME (2016) spot price; World Bureau of Metal Statistics (2016) World Metal Statistics; Department of Industry, Innovation and Science
Error! No text of specified style in document.OCE Report Template 84

13. Nickel
13.1 Market summary
Australia’s nickel export earnings are forecast to decline 14 per cent to $2.1 billion in 2016–17. Despite the recent rally, the forecast decline in Australia’s export earnings is underpinned by constrained domestic production, as a result of a number of operations being placed in care and maintenance due to low prices at the start of the year. The nickel price is forecast to increase in 2017, supported by constrained supply, but it is not expected to be high enough to incentivise the resumption of high cost operations in Australia.
13.2 Prices
Price to be supported by constrained production, despite subdued demand
The London Metal Exchange (LME) nickel price steadily increased over two months to reach a 12 month high of US$10,815 a tonne on 10 August. The recent rally was primarily sentiment driven, following concerns of a nickel shortage after the suspension of operations at eight nickel mines in the Philippines. The actual impact of the suspensions to date have not had a big effect on China’s nickel imports, with mined nickel from the Philippines largely replaced with ferronickel imports from Indonesia and mined nickel imports from New Caledonia.
As a result, the nickel price is forecast to moderate towards the end of the year to average US$9,364 a tonne for 2016 as a whole, and to average US$10,125 a tonne in 2017, revised up to reflect the effect of ongoing mine suspensions in the Philippines and seasonal nature of the Philippines’ mined nickel exports, which tend to peak mid-year.
Relatively high stocks and forecast subdued demand are expected to weigh on the price outlook, with combined LME and SHFE (Shanghai Futures Exchange) stocks up 1.9 per cent from the start of the year to 482,700 tonnes at the end of August, equivalent to about 3 months of consumption. However, the potential for mine closures in the Philippines to proceed faster and at a greater magnitude than expected presents a substantial upside risk to the forecast, particularly if this cannot be offset by a sustained increase in ferronickel production from Indonesia and the resumption of ore exports from New Caledonia following the lifting of the ban on exports.
Figure 13.1: Nickel LME spot price
Figure 13.2: Nickel stocks and price
13.3 World consumption
World consumption to grow in 2016 and 2017
World refined nickel consumption grew 8 per cent year-on-year in the June quarter 2016 to 529,300 tonnes, primarily driven by increased consumption
Error! No text of specified style in document.OCE Report Template 85

from China, up 10 per cent to 285,300 tonnes. World consumption of refined nickel for 2016 as a whole is forecast to increase 6 per cent to 2 million tonnes.
Increased nickel consumption in China has also been supported by higher overall steel production during the first 7 months of 2016, and, in particular, the increased production of nickel-bearing stainless steel. Nickel-bearing stainless steel production increased by 12 per cent year-on-year in the three months to July. 300 series stainless steels, containing around eight to ten per cent nickel (around four times more than lower quality 200 series) have more aesthetic surface appearances and better corrosion and heat resistance qualities, and are used in construction and kitchen fixtures. Higher production of nickel-bearing stainless steel has been supported by an increased demand for these higher quality stainless steels.
Nickel consumption has also increased in the United States, up 14 per cent year-on-year to 40,400 tonnes in the June quarter. Increased stainless steel production in the United States has been supported by anti-dumping measures on a range of stainless steel products, with imports of stainless steel down 28 per cent year-on-year in the three months to July.
Consumption of nickel is forecast to increase by a more moderate 1.8 per cent in 2017. While nickel consumption is expected to be weighed down by slowing construction activity in China, it is not expected to follow the same trajectory as steel due to its more diverse uses in high value goods, batteries of electric vehicles, alloys used in specialist engineering, energy generation, military and aerospace equipment, and transport.
Figure 13.3: World refined nickel consumption
Figure 13.4: China’s quarterly nickel-based stainless steel and crude steel production
13.4 World production
World mined production constrained by declines in the Philippines
World mined nickel production is forecast to decline 7 per cent in 2016 and to increase 3.7 per cent in 2017. Growth in world mined nickel production in 2017 is expected to be supported by increased production in Indonesia and New Caledonia, and despite the suspension of operations at nickel mines in the Philippines.
World mined nickel production decreased 9 per cent year-on-year in the June quarter, driven by declines in production from the Philippines, down 28 per cent to 122,000 tonnes as a result of an extended rainy season and ore depletion. There has been a 29 per cent year-on-year decline in nickel ore imports to China from the Philippines in the four months to July —previously China’s largest source of imported mined nickel.
The loss in supply from the Philippines has in part been met by increased supply from other countries. Total ferronickel imports to China were up 42 per cent year-on-year in the three months to July. The increase in ferronickel imports came largely from Indonesia, where total ferronickel exports
Error! No text of specified style in document.OCE Report Template 86

increased 41 per cent. China’s mined nickel imports from New Caledonia increased 27 per cent year-on-year in the first seven months of 2016. Earlier in the year, the New Caledonian government ended a ban on ore exports, initially implemented to protect its domestic smelting and refining industry, and allowed two companies to export nickel ore to China.
Mined nickel production in the Philippines is expected to further decline through the remainder of the outlook period. An environmental audit that began in July has resulted in the suspension of operations at eight nickel mines which were found to be not complying with environmental regulations, with another ten mines recommended for suspension. Together, the 18 mines account for 56 per cent of the country’s mined nickel output.
The overall effect of the Philippines’ mine suspensions on world production in 2017 is expected to be offset by increased production in Indonesia and New Caledonia.
Figure 13.5: World mined nickel production
Figure 13.6: China’s quarterly nickel imports
World refined production down in China but up in Indonesia
World production of refined nickel decreased 2.4 per cent year-on-year in the June quarter 2016. While production in Indonesia increased 90 per cent to 26,100 tonnes, this was offset by declining production elsewhere.
Refined nickel production in China, the world’s largest nickel producer, declined 10 per cent to 152,700 tonnes. China’s production of nickel pig iron, which is largely dependent on imports of nickel ore, has been partly displaced by increased imports of ferronickel from Indonesia. Both nickel pig iron and ferronickel are a form of primary nickel product, containing less nickel than class I refined nickel, but ready for use by consumers.
Refined production in Russia, the second largest producer, declined 11 per cent to 49,800 tonnes, due to the Norilsk nickel plant being decommissioned to modernise and upgrade facilities.
In 2016, refined production is forecast to decline 1.1 per cent to 2 million tonnes, and remain steady in 2017, broadly unchanged from the June edition.
Figure 13.7: World refined nickel production
13.5 Australia’s exploration, production and exports
Exploration expenditure declines due to historically low nickel prices
Nickel and cobalt expenditure declined 36 per cent year-on-year in the June quarter, and remained largely stable from the March quarter at $11 million. For 2015–16 as a whole, exploration expenditure was $51 million, down 39 per cent from the previous year. The substantial decline in exploration expenditure comes as a result of historically low nickel prices at the start of the year, which reduced the feasibility of new projects and incentives to explore.
Error! No text of specified style in document.OCE Report Template 87

Figure 13.8: Australia’s nickel and cobalt exploration expenditure
Mined production to decline in 2016–17 as mine suspensions due to low prices take effect
Australia’s mined nickel production (metal content) declined 13 per cent year-on-year in the June quarter to 48,500 tonnes. A ramp up in mining at BHP Billiton’s Nickel West Leinster mines was offset by several mines being placed in care and maintenance due to low prices, including Panoramic Resources’ Lanfranchi mine and Mincor Resources’ mines. Production also declined at Ravensthorpe because of a lower than anticipated ore grade. For 2015–16 as a whole, mined nickel production decreased 12 per cent to 216,000 tonnes.
Mined nickel production is forecast to decline by a further 11 per cent in 2016–17. While mined nickel production is expected to increase at BHP Billiton’s Nickel West operations due to higher grade ore at the Mt Keith mine and a ramp up in mining at Leinster, this will be more than offset by the full effect of mines being placed on care and maintenance that started at the beginning of 2016. Ongoing low prices will place pressure on high-cost operations in the short term. Beyond the outlook period, BHP Billiton announced in August that Nickel West would restart development work at the Venus deposit, with an estimated capacity of 200,000 tonnes.
Refined production to decline in 2016–17
Australia’s refined nickel production decreased 5 per cent year-on-year in the June quarter. While there was higher production at Nickel West, supported by additional third party concentrate purchases, and at Minara Resources’ Murrin Murrin, supported by operational improvements, this was more than offset by Queensland Nickel’s Yabulu refinery being placed on care and maintenance due to unresolved financial issues. For 2015–16 as a whole, refined nickel production increased 7 per cent. Refined nickel production is forecast to decline 15 per cent in 2016–17 as the full effect of Yabulu’s suspension of operations take effect, despite expected higher utilisation rates at Nickel West’s Kalgoorlie smelter and Kwinana refinery.
Export volumes and values weighed down by constrained production
The effects of several mines and refineries being placed in care and maintenance due to low prices at the start of the year has been reflected in declining nickel exports. Australia’s nickel exports declined 21 per cent year-on-year in the June quarter to 45,000 tonnes (metal content) and the value of Australia’s exports declined 43 per cent to $427 million. For 2015–16 as a whole, the volume of nickel exports declined 20 per cent to 216,000 tonnes, while nickel export earnings declined 31 per cent to $2.5 billion.
In 2016–17, nickel exports are forecast to continue to be weighed down by constrained production. Export volumes are forecast to decline by 18 per cent to 178,000 tonnes, while export earnings forecast to further decline 14 per cent to $2.1 billion.
Figure 13.9: Australia’s nickel exports
Error! No text of specified style in document.OCE Report Template 88

Table 13.1: Nickel outlook
World unit 2014 2015 2016 f 2017 f Per cent changeProduction
– mine kt 2,188 2,147 2,000 2,075 3.7
– refined kt 1,976 1,979 1,956 1,962 0.3
Consumption kt 1,865 1,890 2,007 2,043 1.8
Stocks kt 464 554 503 422 –16.0
– weeks of consumption 12.9 15.2 13.0 10.8 –17.5
Price LME
– nominal US$/t 16,872 11,839 9,364 10,125 8.1
USc/lb 765 537 425 459 8.1
– real b US$/t 17,046 11,937 9,364 9,972 6.1
USc/lb 773 541 425 452 6.1
Australia unit 2013–14 2014–15 2015–16 2016–17 f Per cent changeProduction
– mine cs kt 275 245 216 192 –11.3
– refined kt 137 115 123 104 –15.4
– intermediate kt 65 82 53 41 –22.1
Export volume ds kt 265 255 216 178 –17.6
– nominal value s A$m 3,216 3,583 2,477 2,134 –14.0
– real value es A$m 3,391 3,715 2,533 2,134 –15.9
Notes: b In current calendar year US dollars; c Nickel content of domestic mine production; d Includes metal content of ores and concentrates, intermediate products and nickel metal;
e In current financial year Australian dollars; f forecast; s estimate
Source: ABS (2016) International Trade in Goods and Services, cat. No. 5368.0; Company reports and presentations; International Nickel Study Group (2016); Bloomberg (2016) London Metal
Exchange; World Bureau of Metal Statistics (2016); Department of Industry, Innovation and Science (2016)
Error! No text of specified style in document.OCE Report Template 89

14. Zinc
14.1 Market summary
The outlook for Australia’s zinc exports remains weak following the closure of MMG’s Century mine in late 2015. In 2015–16, mined zinc production in Australia decreased 31 per cent. Export volumes fell by 12 per cent to 1.5 million tonnes (metal content), and export earnings declined 15 per cent to $2.6 billion. Affected by reduced supply availability, Australia’s zinc exports are forecast to decrease by a further 39 per cent to 921 thousand tonnes in 2016–17, while export earnings are forecast to decline by 11 per cent to $2.3 billion.
The current rally in zinc prices partially offsets the impact of reduced production on export values, and provides Australian miners with a greater incentive to restart idle capacity and lift output for exports.
14.2 Prices
Zinc prices outperform as demand outstrips supply
LME zinc prices have increased 49 per cent in the first eight months of 2016, to average US$1,901 a tonne. Higher prices were supported by supply constraints, following production cuts and mine closures in 2015.
As a result, LME and SHFE zinc stocks have declined 2 and 5 per cent year-on-year in the first eight months of 2016 to 454,175 and 190,579 tonnes respectively. LME stocks reached a 7-year low in early June 2016 at 378,725 tonnes, and the SHFE stocks reached a 9-month low at the end of August at 190,579 tonnes.
Prices are expected to continue to rally over the remainder of 2016, to average US$2,017 a tonne over the year. This represents an upward revision from the June edition, factoring in that zinc prices have increased faster than previously anticipated.
Zinc’s price rally is forecast to continue in 2017, rising more than 18 per cent to average US$2,383 a tonne driven by growth in demand. The risks to the price outlook are on the downside, with the potential for a supply response from new or existing mines.
Figure 14.1: Zinc daily price
Figure 14.2: Annual zinc prices and weeks of stocks
14.3 World consumption
Global zinc consumption to grow moderately
In the first half of 2016, world refined zinc consumption remained steady at 7 million tonnes, as strong consumption growth in China (the world’s largest zinc consumer) was offset by falling consumption in other countries. Given
Error! No text of specified style in document.OCE Report Template 90

zinc is widely used as an anticorrosive agent in steel manufacturing process, China’s increased steel output in the first half of 2016 provided support for zinc demand. Over this period, zinc consumption in China increased 7 per cent to 3.3 million tonnes, while in the US consumption decreased 25 per cent to 371 thousand tonnes, and South Korea’s consumption decreased 8 per cent to 302 thousand tonnes.
Over the remainder of the year, consumption in China is expected to decline, as there are signs of slowing momentum in China’s construction sector. In contrast, demand from India is expected to increase because of forecast rise in steel production. Furthermore, increased demand globally for zinc as an alloy for automotive, electrical and household materials will also support increased zinc consumption. As a result, global zinc consumption is forecast to increase 2.7 per cent to 14.3 million tonnes in 2016.
In 2017, zinc consumption is forecast to grow 1.7 per cent to 14.6 million tonnes as galvanised sheet production in the US, India and Japan is expected to continue driving demand. This is expected to offset decreased demand from China for steel production.
14.4 World production
Global mined zinc production to increase in 2017
In the first half of 2016, global mined zinc production decreased nearly 7 per cent year-on-year to 6 million tonnes because of mine closures and production cuts by major zinc producers. Glencore’s decision to close 500 thousand tonnes of zinc capacity at its operations in Australia and the US from the second half of 2015, contributed to a 4 per cent fall in global output. Production in Australia, the world’s second largest mined zinc producer, decreased 51 per cent to just 412 thousand tonnes in the first half of 2016.
World mined zinc production is forecast to increase 2 per cent to 13.7 million tonnes in 2016, with the risks balanced to the upside. Should Glencore resume production at its partially closed mines in response to the strong rally of zinc prices during 2016, an additional 500 thousand tonnes of capacity may re-enter the market.
In 2017, world mined zinc production is forecast to rise 3 per cent to 14.1 million tonnes, supported by increased production from existing mines, and additional capacity from new and restarted capacity. Major new capacity expected to commence production in 2017 will come from the 96 thousand tonne Dairi project in Indonesia and the 33 thousand tonne Wolitu project in China. Notable restarts anticipated over the outlook period include the 61 thousand tonne Balmat operation and 30 thousand tonne Montana Tunnels operation in the US.
Recovering ore and concentrate supply supports refined production
World refined zinc production decreased 5 per cent year-on-year in the first half of 2016 to 7 million tonnes, because of reduced availability of zinc ore and concentrates. In particular, production in India fell by 36 per cent, as a result of low output from Vedanta’s mines and smelters. Over this period,
Error! No text of specified style in document.OCE Report Template 91

production in China, the world’s largest refined zinc producer, decreased 1 per cent to 3 million tonnes. The recovery of zinc prices is expected to be the main catalyst for increased zinc ore and concentrates production for the remainder of 2016. As a result, global refined zinc output is forecast to increase 2 per cent in 2016 to 14.2 million tonnes. China is expected to contribute most of this additional output.
In 2017, world refined zinc is forecast to grow 2 per cent to 14.5 million tonnes, supported by increased supply of zinc ore and concentrates.
14.5 Australia’s zinc exploration, production and exports
Price rally to support exploration expenditure
Australia’s expenditure on silver, lead and zinc exploration in the June quarter 2016 decreased 9 per cent year-on-year, but increased 30 per cent from the previous quarter to $12 million. The strong rally in zinc prices in 2016 may have renewed appetite for exploration in the June quarter 2016. However, zinc exploration expenditure decreased 4 per cent in 2015–16 as a whole, as substantial falls in zinc prices in the second half of 2015 reduced incentives to explore.
Australia’s mined zinc production reduced with Century mine closure
Australia’s mined zinc production fell by 31 per cent in 2015–16, to 1.15 million tonnes (metal content) following the final processing of ores from the Century mine in January 2016, and as a result of the curtailment of production at other mines in response to low prices.
Production in the June quarter decreased 10 per cent quarter on quarter to 193 thousand tonnes. CBH’s Endeavor mine production decreased 44 per cent. Glencore’s Mount Isa mine production decreased 23 per cent in this quarter.
In 2016–17, Australia’s mined zinc production is forecast to decrease 3 per cent to 1.11 million tonnes, as the full effects of MMG’s Century mine closure and curtailed production at other mines are realised. Risks are balanced to the upside, with the potential for Glencore to boost its capacity in Australia in response to higher prices.
Australia’s refined production remains flat
Australia’s refined zinc production decreased 4 per cent in the June quarter 2016 to 110 thousand tonnes, because of the closure of Nyrstar’s Port Pirie smelter for redevelopment. As a result, refined production for 2015-16 declined 5 per cent to nearly 459 thousand tonnes.
Australia’s refined zinc production is forecast to remain constant in 2016–17, as the redevelopment of Nyrstar’s Port Pirie smelter is not expected to be completed until the first quarter of 2017–18.
Error! No text of specified style in document.OCE Report Template 92

Australia’s zinc exports are constrained due to mine closure
Australia’s zinc exports decreased 24 per cent in the June quarter 2016 to 244 thousand tonnes (metal content) as mine closures and production cuts constrained export capacity. Over this period, export earnings fell by 10 per cent to $493 million, due to low prices in the first half of 2015–16. In the second half of the year, Australia’s zinc export earnings reached $1.5 billion, an increase of 49 per cent, supported by a strong rally in zinc prices in 2016. For 2015–16 as a whole, Australia’s zinc exports decreased 12 per cent to 1.5 million tonnes (metal content), and export earnings declined 15 per cent to $2.6 billion.
In 2016–17, Australia’s zinc exports are forecast to decline 39 per cent to 921 thousand tonnes because of supply constraints. Export earnings are also forecast to decline, but by a lesser extent given the rally in price, down by around 11 per cent to $2.3 billion. Nevertheless, Australia’s zinc export volumes and earnings may increase should Glencore resume activity at its Australian mines, where production has been curtailed since the December quarter 2015.
Figure 14.3: Australia’s silver, lead and zinc exploration expenditure
Figure 14.4: Australia’s mine production by state
Figure 14.5: Australia’s zinc exports
Error! No text of specified style in document.OCE Report Template 93

Table 14.1: Zinc outlook
World unit 2014 2015 2016 f 2017 f Per cent change
Production
– mine kt 13,522 13,465 13,734 14,144 3.0– refined kt 13,553 13,971 14,169 14,659 3.5Consumption kt 13,519 13,940 14,310 14,552 1.7Stocks kt 1,570 1,694 1,604 1,593 –0.7– weeks of consumption 6.0 6.3 5.8 5.7 –2.4Price LME
– nominal US$/t 2,162 1,950 2,017 2,383 18USc/lb 98 88 91 108 18
– real b US$/t 2,185 1,966 2,017 2,347 16USc/lb 99 89 91 106 16
Australia unit 2013–14 2014–15 2015–16 2016–17 f Per cent changeMined output kt 1,487 1,679 1,155 1,116 –3.4Refined output kt 492 501 459 461 8Export volume
– ore and conc. c kt 2,329 2,919 2,226 999 –55– refined kt 433 329 497 454 –9– total metallic content kt 1,527 1,720 1,509 921 –39Export value
– nominal A$m 2,363 3,073 2,621 2,321 –11
– real d A$m 2,491 3,186 2,681 2,321 –13
Notes: b In current calendar year US dollars; c Quantities refer to gross weight of all ores and concentrates; d In current financial year Australian dollars; f Forecast
Source: ABS (2016) International Trade in Goods and Services, 5368.0; Company reports; International Lead Zinc Study Group (2016); London Metal Exchange (2016); World Bureau of Metal
Statistics (2016); Department of Industry, Innovation and Science (2016
Error! No text of specified style in document.OCE Report Template 94

15. Trade summary chartsFigure 15:1: Contribution to GDP
Figure 15.2: Principal markets for Australia's total imports, 2016–17 dollars
Figure 15.3: Principal markets for Australia’s resources and energy imports, 2016–17 dollars
Figure 15.4: Principal markets for Australia's total exports, 2016–17 dollars
Figure 15.5: Principal markets for Australia’s resources exports, 2016–17 dollars
Figure 15.6: Principal markets for Australia’s energy exports, 2016–17 dollars
Figure 15.7: Proportion of merchandise exports by sector
Figure 15.8: Proportion of goods and services exports by sector
Error! No text of specified style in document.OCE Report Template 95

Table 15.1: Principal markets for Australia’s thermal coal exports, 2016–17 dollars
unit 2011–12 2012–13 2013–14 2014–15 2015–16
Japan $m 9,101 8,377 8,088 7,360 6,994
South Korea $m 3,236 2,929 2,909 2,755 2,564
China $m 3,011 3,096 3,643 2,837 1,771
Taiwan $m 2,013 1,803 1,742 1,832 1,611
Malaysia $m 394 294 363 605 491
Thailand $m 189 256 304 283 321
Total $m 18,963 17,513 17,615 16,647 15,030
Source: ABS (2016) International Trade in Goods and Services, 5368.0
Table 15.2: Principal markets for Australia’s metallurgical coal exports, 2016–17 dollars
unit 2011–12 2012–13 2013–14 2014–15 2015–16
India $m 7,158 4,968 5,073 5,200 4,628
Japan $m 9,772 6,451 5,800 4,783 4,443
China $m 3,969 4,987 6,176 4,949 3,896
South Korea $m 4,243 2,632 2,592 2,468 2,121
Taiwan $m 2,036 1,250 1,228 1,182 987
Netherlands $m 1,404 1,053 1,058 863 905
Total $m 34,008 24,299 24,521 22,614 19,974
Source: ABS (2016) International Trade in Goods and Services, 5368.0Table 15.3: Principal markets for Australia’s oil and gas exports, 2016–17 dollars
Error! No text of specified style in document.OCE Report Template 96

unit 2011–12 2012–13 2013–14 2014–15 2015–16
Japan $m 14,287 15,630 16,774 15,956 11,715
China $m 4,022 2,936 1,910 2,053 4,071
South Korea $m 1,930 2,349 1,466 1,925 2,339
Singapore $m 3,022 2,914 2,422 2,231 930
Thailand $m 1,082 891 1,731 1,314 730
India $m 328 191 264 201 343
Total $m 27,564 27,950 30,247 27,325 23,079
Source: ABS (2016) International Trade in Goods and Services, 5368.0
Table 15.4: Principal markets for Australia’s gold exports, 2016–17 dollars
unit 2011–12 2012–13 2013–14 2014–15 2015–16
China $m 4,721 6,482 8,525 7,209 8,962
United Kingdom $m 5,010 2,833 675 604 4,028
Singapore $m 1,243 1,023 2,397 3,228 1,223
Thailand $m 1,780 1,377 469 930 260
Switzerland $m 37 310 363 15 76
Turkey $m 71 505 567 163 49
Total $m 17,128 16,307 13,719 13,527 16,028
Source: ABS (2016) International Trade in Goods and Services, 5368.0Table 15.5: Principal markets for Australia’s iron ore exports, 2016–17 dollars
unit 2011–12 2012–13 2013–14 2014–15 2015–16
Error! No text of specified style in document.OCE Report Template 97

China $m 48,148 45,423 60,136 43,649 39,617
Japan $m 12,047 9,331 10,191 6,942 4,794
South Korea $m 7,164 5,337 6,430 4,196 3,118
Taiwan $m 1,988 1,621 1,803 1,345 1,044
Indonesia $m 0 0 116 221 185
India $m 0 51 43 113 6
Total $m 69,451 61,818 78,740 56,521 48,846
Source: ABS (2016) International Trade in Goods and Services, 5368.0
Table 15.6: Principal markets for Australia’s aluminium exports, 2016–17 dollars
unit 2011–12 2012–13 2013–14 2014–15 2015–16
South Korea $m 649 734 718 796 1,137
Japan $m 1,465 1,087 1,175 1,510 712
Taiwan $m 412 494 468 507 305
Thailand $m 363 395 320 297 275
China $m 210 162 245 52 96
Indonesia $m 335 269 206 142 96
Total $m 4,206 3,549 3,669 3,963 3,311Source: ABS (2016) International Trade in Goods and Services, 5368.0Table 15.7: Principal markets for Australia’s copper exports, 2016–17 dollars
unit 2011–12 2012–13 2013–14 2014–15 2015–16
China $m 2,765 3,289 4,153 3,779 3,672
Japan $m 1,646 1,749 1,713 2,063 1,438
Error! No text of specified style in document.OCE Report Template 98

Malaysia $m 777 733 644 546 631
India $m 1,608 1,202 997 833 525
South Korea $m 953 475 616 379 511
Philippines $m 21 152 300 266 226
Total $m 9,417 8,712 9,181 8,779 8,308
Source: ABS (2016) International Trade in Goods and Services, 5368.0
Error! No text of specified style in document.OCE Report Template 99
Appendix
Key assumptions
The forecast export values presented in this report are dependent on assumptions about the Australian dollar-US dollar exchange rate, the Reserve Bank of Australia (RBA) cash rate and the inflation rate over the outlook period.
Australian dollar-US dollar exchange rate
There are several factors that affect the exchange rate assumption. The most important are the interest rate differential between Australia and the US, commodity prices and the rate of inflation in Australia and the US.
The Australian dollar has depreciated against the US dollar in response to declining commodity prices and improved economic conditions in the US.
The Australian dollar averaged around US73 cents in 2015–16, down from US84 cents in 2014–15. The Australian dollar is assumed to increase slightly to US74 cents in 2016–17.
RBA cash rate
The RBA cash rate has declined over the past few years because of weak domestic economic conditions. The RBA cash rate is assumed to decline to average 1.7 per cent in 2016–17.
Inflation
The RBA targets an inflation band of between 2–3 per cent on average over the economic cycle. The inflation rate is assumed to increase to 2.3 per cent in 2016–17.
Error! No text of specified style in document.OCE Report Template 100

Table 16.1: Key macroeconomic assumptions for Australia
unit 2012–13 2013–14 2014–15 2015–16 2016–17 a
Inflation rate b per cent 2.3 2.7 1.7 1.4 2.3
Interest rate c per cent 3.1 2.5 2.4 2.0 1.7
Exchange rate d US$/A$ 1.03 0.92 0.84 0.73 0.74
Notes: a assumption; b Change from previous period; c Median RBA cash rate; d Average of daily ratesSource: ABS (2016) Consumer Price Index, 6401.0; RBA (2016) Reserve Bank of Australia Bulletin; Department of Industry, Innovation and Science (2016)
Error! No text of specified style in document.OCE Report Template 101