Embed Size (px)
Citation preview

Bulletin of Insectology 56 (2): 225-251, 2003ISSN 1721-8861
Occurrence of diapause in Orius laevigatusMaria Grazia TOMMASINI1, Joop C. VAN LENTEREN2
1CRPV, Diegaro di Cesena (FC), Italy2Laboratory of Entomology, Wageningen University, The Netherlands
Abstract
One of the main problems in biological control of thrips in the Mediterranean area is that Frankliniella occidentalis (Pergande)does not undergo diapause. Therefore, finding a non-diapausing species or strain of the genus Orius would be very useful for sea-sonal inoculative releases to control this species of thrips. Both the palearctic O. majusculus (Reuter) and the nearctic O. insidio-sus (Say) show a reproductive diapause that is induced by photoperiod. No data were available about the occurrence of diapausein O. laevigatus (Fieber). The possibility of inducing a reproductive diapause in this palearctic species was therefore investigatedin the laboratory using two strains: strain N collected in northern Italy (Po Valley; ca. 44° N latitude) and strain S collected insouthern Italy (Sicily; ca. 37° N latitude). The influence of photoperiod on eggs at 18±1°C, RH=75±10% and at several light re-gimes varying between 16L:8D and 8L:16D (experiment 1) and between 13L:11D and 11L:13D (experiment 2) was studied. O.laevigatus were fed on Ephestia kuehniella (Zeller) frozen eggs.
Development time, adult emergence, sex ratio, pre-oviposition period, fecundity up to day 29 of adult life, and the presence ofmature oocytes were recorded. Photoperiods of 11.5L:12.5D and 12L:12D induced a longer development time, a longer pre-oviposition period and a lower oviposition rate than the other photoperiods for both populations. The percentage of egg-layingfemales at 18°C was higher for strain S (70%) than for strain N (44%). Termination of diapause was investigated by exposing theOrius strains to an higher temperature (26°C) and a longer day-length (16L:8D). The females of both strains supposedly indiapause, rapidly started to lay a high amount of eggs independently from the environmental conditions to which they were previ-ously exposed. Next, the two strains of O. laevigatus were reared at five temperature regimes (24°C/12.5°C; 26°C/15°C;21.5°C/6°C; 22°C/12.5°C; 18°C constant) that matched the photoperiod which induced the lowest oviposition (11.5L:12.5D ) inthe previous experiments. The longest development time was found for both strains at 26.5°C/6°C and the shortest at 26°C/15°C.A constant temperature of 18°C induced a slightly shorter development than the thermoperiod of 26.5°C/6°C in both populations.The lowest fecundity was recorded at 26.5°C/6°C and at 18°C constant for both strains, and 26°C/15°C induced the highest fe-cundity in the females of strain N. When the females were moved from thermoperiods of 18°C to 26°C and 16L:8D, ovipositiondid increase, and more than 80% of females of both strains laid eggs. In all the experiments the two strains of O. laevigatus gavedifferent results.
Wild populations of O. laevigatus were collected in the field in August-November in Sicily and in the Po Valley and maintainedin cages in the field in northern Italy (44° latitude N). During the winter, once a month females were taken from the field cagesand put into a climatic chamber at 26±1°C, RH 75±10%. A high percentage of females laid eggs, particularly those of the Sicilianpopulation.
In conclusion, the two strains of O. laevigatus have a different way to overwinter: in the northern strain part of the populationundergoes a weak reproductive diapause, while for the southern strain overwintering can be better described as quiescence.
Key words: Orius laevigatus, strain, diapause, quiescence, photoperiod, thermoperiod, rearing, Italy, Po Valley, Sicily.
Introduction
An important feature of insect life is their behaviouraladaptation to the ubiquitous, seasonally changing envi-ronment. In many regions of the world, the biologicalconditions suitable for growth, development, and repro-duction generally prevail only during part of the year.Many authors have studied diapause as a biologicalphase which occurs in many arthropods in order to sur-vive when unfavourable seasonal conditions are present,even though not all forms of seasonal adaptations areassociated with diapause (De Wilde, 1956; Mansingh,1971; Hodek, 1973; Beck, 1980; Tauber et al., 1986;Danks, 1987; Leather et al., 1993). In general, the ar-restment in development that enables living organismsto synchronise their life cycle with favourable environ-mental conditions and that avoids unfavourable condi-tions is called dormancy, and it can occur during all sea-sons. Two types of dormancy are usually distinguishedin insects: quiescence and diapause. But intermediateconditions are also found and dormancy does not neces-
sarily mean diapause.Quiescence is a reversible state, characterised by a re-
duction in metabolism as a direct response to exposureto environmental extremes, such as temperature orphotoperiod, and which ends immediately when favour-able conditions resume. Diapause is an active responseof individuals resulting in a dynamic state of low meta-bolic activity for adaptation to seasonal cycles, so topredictable conditions. It can be divided into threephases: diapause induction or pre-diapause (in the sen-sitive stage of the insect), diapause maintenance (re-sponsive stage) and diapause termination or post-diapause. The term ‘diapause syndrome’, coined by DeWilde (1959), is a general term for the species-specificset of behavioural and physiological symptoms ofdiapause, referring initially to pre-diapause preparationfor the future seasonal conditions. This concept of‘diapause syndrome’ has recently been enlarged to in-clude all pre-diapause, diapause, and post-diapause pro-cesses to seasonal changes (Tauber et al., 1986).Diapause is a physiologically dynamic developmental

226
stage and it occurs during genetically determinedstage(s) of metamorphosis which are species-specific.Many factors (biotic and abiotic) can function as the to-ken stimulus to induce diapause. In fact, the insects cantranslate the token stimuli in neurohormonal changeswhich lead to diapause (Williams, 1952). Often, themost common and reliable token stimulus is photo-period. In many cases photoperiod and temperature in-teract, although other environmental factors such asfood and water may also interfere (Beck, 1980; Saun-ders, 1982; Tauber et al., 1986; Gullan and Cranston,1994).
Beck (1980) defined four types of diapause responsecurves based on the photoperiod effects (figure 1). TypeI is the long-day type of response which is typical of in-sects that reproduce, grow and develop under the longday conditions. Such insects go into diapause after ex-periencing the short days of late Summer and Autumn.Type II, the short-day type of response, is less commonand is characteristic of insects that grow and reproduceunder short day-length and that undergo aestivaldiapause. Type III is the photoperiodic response of spe-cies with both long-day and short-day responses show-ing two well-defined critical day-lengths. Type IV isdemonstrated in only a few species, and is characterisedby the absence of diapause incidence over a very re-stricted range of relatively long day-lengths. All otherphotoperiodic conditions result in a high incidence ofdiapause. This type of response might be termed a long-day-short-day response.
During the course of diapause, there is generally a de-crease in diapause intensity and these changes can occureven if the insects are held under constant conditions.Photoperiod is one of the major factors which acts to
maintain diapause. Even the diapause termination canbe dependent upon outside stimuli the insect receives,which generally are demonstrated by the return of suit-able environmental conditions, such as light and tem-perature. Diapause intensity is generally inversely pro-portional to biological characteristics such as oxygenconsumption, development rate, and the pre-ovipositionperiod (Beck, 1980; Hodek and Honek, 1970). An indi-cation of the intensity of diapause can be given by thedifficulty of interrupting the diapause itself.
It is often not easy to describe the diapause syndromeof an insect species. According to many authors (e.g.Tauber et al., 1986; Danks, 1987) there is no single‘correct’ classification for diapause, as there is a seriesof cases in a continuum and adaptive responses to a va-riety of circumstances. A synthesis of the main diapausedescriptions is shown in table 1. The classification ofdiapause most used in Europe is still that of M ü ller(1970), based chiefly on the concept of the intensity ofdormancy as related to climate and geography.
Few data are available on the diapause syndrome inthe predatory Heteroptera. Heteropteran predators fromtemperate climates generally show a seasonal activitytypical of many insect species: they appear in spring orearly summer and disappear in autumn (Ruberson et al.,1998). All the Anthocoridae species studied overwinteras adults and those which undergo diapause in very dif-ferent overwintering sites (leaf litter, organic material inwooded areas, in winter grasses or under tree bark)show reproductive diapause. Overwintering in the adultstage may provide the greatest flexibility for location of,and movement within overwintering sites, as well asmovement towards food and reproductive resources inthe spring.
0
20
40
60
80
100
0 12 24
Dia
paus
e in
cide
nce
(%)
Type I
0
20
40
60
80
100
0 6 12 18 24
Type II
0
20
40
60
80
100
0 6 12 18 24
Hours of light per day
Type III
0
20
40
60
80
100
0 6 12 18 24
Type IV
Figure 1. Different types of diapause incidence-day-length relationship observed among insects (modified fromBeck, 1980).

227
Table 1. Summary of terminology concerning diapause and quiescence.
Terminology Main features Induced by Terminated Author
D i a p a u s e
Parapausa no clear induction phase genetically fixed forunivoltine species Genetically Müller, 1970
long preparation before adversesituation
extreme and long-termadversity (i.e. photoperiod)
____ Mansingh, 1971Diapause
deep and continuos diapause extreme and long-termadversity (i.e. photoperiod)
____ Ushatnskaya,1976
Obligatorydiapause
present in every individual ineach generation
regardless environmentalconditions ____ Beck, 1980
Univoltinediapause
present in every individual ineach generation
regardless environmentalconditions
____ Tauber et al.,1986
I n t e r m e d i a t e f o r m s o f d i a p a u s e
Eudiapause clear induction phasefacultative and due to
unfavourable condition(usually photoperiod)
a different factor than theinduction stimulus
(for example temperature)Müller, 1970
facultative appears and endswith a delay relative to
unfavourable conditions
unfavourableenvironmental conditions
end of unfavourableconditions Müller, 1970
short preparationbefore adversity
mild and long-termadversity
end of unfavourableconditions Mansingh, 1971Oligopausa
intermediate betweenquiescence and diapause
unfavourableenvironmental conditions
end of unfavourableconditions
Ushatnskaya,1976
Facultativediapause
on an irregular basis in responseto unpredictable exigencies
unfavourableenvironmental conditions
end of unfavourableconditions Beck, 1980
Multivoltinediapause
on an irregular basis in responseto unpredictable exigencies
unfavourableenvironmental conditions
end of unfavourableconditions
Tauber et al.,1986
Q u i e s c e n c e
Quiescence immediate facultative retardationor stop of development unfavourable conditions end of unfavourable
conditions Müller, 1970
Some Orius spp., such as the nearctic species O. in-sidiosus (Iglinsky and Rainwater, 1950; Kingsley andHarrington, 1982; Ruberson et al., 1991; van den Mei-racker, 1994) and O. tristicolor (White) (Anderson,1962; Askari and Stern, 1972; Gillespie and Quiring,1993; van den Meiracker, 1994), as well as the palearc-tic species O. majusculus (Fischer et al., 1992; van denMeiracker, 1994) undergo reproductive diapause underphotoperiodic stimuli (type I of diapause induction, seefigure 1). The palearctic O. albidipennis (Reuter) col-lected on the Canary Islands does not undergo repro-ductive diapause at photoperiods varying from 8:16 to16:8 (L:D) (van den Meiracker, 1994). The palearcticspecies O. niger Wolff is known to overwinter (Bailov,1929), even though van de Veire and Degheele (1992)found that this species is not affected by short day-length in contrast with O. insidiosus, but no specificstudies were carried out with this predator. Péricart(1972) recorded that the palearctic O. laevigatus over-winters as an adult, but no data are available about theexistence of a reproductive diapause in this species.However, Rudolf et al. (1993) wrote that O. laevigatusappears to show quiescence and not diapause, becausewhen the individuals collected during the winter wereput at favourable climatic conditions, they immediatelystarted to lay eggs.
Differences in the response to overwintering cuesamong insects of the same species from different geo-graphical areas have been found and critical photoperi-ods for diapause induction often appear related to lati-tude (Tauber et al., 1986; Leather et al., 1993). Two dif-ferent populations of O. tristicolor undergo diapause atdifferent critical photoperiods according to their differ-ent geographical distribution in USA (Gillespie andQuiring, 1993). Parker (1975) showed genetically con-trolled differences in the diapause induction of twopopulations of another species belonging to the familyAnthocoridae, Anthocoris nemorum (L.), collected inScotland (56° N) and in southern England (51° N).
One of the main problems in the biological control ofthrips is the synchronisation between prey and preda-tors. In a large part of the southern Mediterranean areawhere temperature rarely decreases below 5-6°C duringwinter, F. occidentalis remains active in winter (DelBene and Gargani, 1989; Lacasa, 1990; Marullo, 1991).Non-diapausing natural enemies are, of course, moresuitable for control of thrips by seasonal inoculative re-leases during short-day-length periods in winter. Brøds-gaard (1994) studied the influence of photoperiod on F.occidentalis and found that this thrips species showedonly slight differences in development time, longevity,and fecundity when exposed to short vs long day-length.

228
The choice of methods for analysing the sensitivestage of an insect depends on the stage that entersdiapause. In some species, both the sensitive stage anddiapause stage occur in the same stage, but more fre-quently they are distinct (Tauber et al., 1986). When thesentitive stage that undergoes diapause is the adult, thiskind of dormancy is usually called reproductivediapause: the key arrestment in development in adultstakes place in the ovaries (Beck, 19880; Saunders, 1982;Danks, 19887). From the literature it is known that theOrius species that show diapause, show a reproductivediapause (Péricart, 1972). The sensitive stage(s) of theHeteropterans that overwinter in diapause as adults, cancomprise a large segment of the insect’s lifespan (Ru-berson et al., 1998). Generally, the lack of juvenilehormone induces diapause in the adults (Tauber et al.,1986). O. sauteri (Poppius) was found to undergodiapause at a short day-length (between 13 and 14 hoursof light) and the sensitive stage here was the nymph(personal communication, E. Yano, 1996). In many in-sects that have a reproductive diapause, the sensitivestages are the last instars, e.g. A. nemorum andChrysoperla carnea (Stephens) (Danks, 1987).
The aim of this study was to investigate the effect ofphotoperiod, as well as its interaction with temperature,on the life cycle of two strains of O. laevigatus, in orderto determine the existence of diapause.
Materials and Methods
The sensitivity of O. laevigatus to photoperiod andtemperature was tested in three laboratory and one field-laboratory experiment using two strains: strain N[northern strain, collected in northern Italy at ca. 44° Nlatitude (Po Valley)] and, strain S [southern strain, col-lected in southern Italy at ca. 37° N latitude (Sicily)].For the first three laboratory experiments, both strainswere reared in the laboratory for ca. 12 generationsstarting from a few hundred individuals per strain. Theywere fed with Ephestia kuehniella (Zeller) frozen eggsand could oviposit on bean pods (Phaseolus vulgarisL.). During all four experiments predators were fed adlibitum on E. kuehniella frozen eggs glued onto card-board. Water was supplied by wet cotton. In the firstthree experiments sex ratio was determined at adultemergence. Newly-emerged adults were kept in groupsduring five days for mating. Pairs were then isolatedinto cylindrical cages (4 cm high and 4 cm diameter)and supplied with a piece of bean pod for oviposition.Dead males were regularly removed and replaced withliving ones.
During all the experiments, random samples of O.laevigatus eggs (n > 100/exposure/strain) were checkedfor hatching. The bean pods were kept in glass tubes at26°C (16L:8D) and hatching was checked after oneweek by counting the open opercules under a stereomi-croscope.
At the end of each experiment, the surviving femaleswere maintained for 24 hours without bean pods, thenthey were killed and dissected in order to count thenumber of mature oocytes. The relationship between
fecundity and the number of mature oocytes per femalewas investigated in all experiments apart from test 1 inexperiment 1.
Influence of photoperiodE x p e r i m e n t 1
Induction of diapause by photoperiod was tested at afixed temperature of 18±1°C, at a light intensity of ca.1,800 lx and RH = 75±10%. Bean pods with 0-6 h oldO. laevigatus eggs were put into 5 incubators set at dif-ferent photoperiods: 8L:16D, 10L:14D, 12L:12D,14L:10D, and 16L:8D (number of eggs >800/photoperiod). Eighteen degrees Celsius was chosenbecause it is the mean temperature in Italy during Octo-ber-November in the Po Valley, and November-December in southern Italy, when potential diapauseinduction of O. laevigatus may occur. Furthermore,18°C is the mean temperature recorded in the northernEuropean greenhouses early in the season (van den Mei-racker, 1994a). The incubators were placed in a darkchamber to prevent light interference during checks.After hatching, groups of nymphs were kept in transpar-ent cylindrical plexiglass cages (9 cm high and 9 cm di-ameter) covered with gauze for aeration until adultemergence. During 24 days after isolation of adults inpairs, mortality and fecundity were checked. A period of24 days is about 7 days longer than the estimated pre-ovipositional period of O. laevigatus reared at 18°C and16L:8D (Alauzet et al., 1994) and 8 times longer thanthe pre-oviposition period recorded at 26°C which is theoptimal temperature for O. laevigatus (Tommasini, 2003).Females which did not lay eggs within 29 days afteremergence were excluded from the calculation of thepre-oviposition period.
In test 1 of experiment 1, only strain N was consid-ered, and hatching and adult emergence was checkedevery 4 hours. The number of pairs tested ranged from47 to 72 per photoperiod and oviposition was deter-mined daily. In test 2 of experiment 1, both strain N andstrain S were considered and adult emergence waschecked twice a day. The number of pairs tested rangedfrom 28 to 44 per photoperiod and oviposition was re-corded three times a week.
E x p e r i m e n t 2Five intermediate day-lengths were set up (13L:11D;
12.5L:11.5D; 12L:12D; 11.5L:12.5D; 11L:13D) basedon the results obtained during experiment 1 and close tothe natural photoperiod in autumn and spring. The sameprocedure adopted in test 2 of experiment 1 was fol-lowed. The development time (n = 500 eggs) per photo-period and the pre-oviposition period were checkeddaily and every two days respectively. Females whichdid not lay eggs within 29 days after emergence wereexcluded from the calculation of the pre-oviposition pe-riod. For each photoperiod survival and fecundity werechecked three times a week for 24 days after isolation ofpairs (44 to 50 pairs per photoperiod). After this period,pairs were moved to another climatic chamber at26±1°C and photoperiod 16L:8D where the samechecks were continued for 24 additional days.

229
Table 2. Correspondence of thermoperiods with theseasonal periods in the Po Valley and Sicily.
Thermoperiod(°C)
Correspondence with theseasonal period
(from - to)
Meantemperature
(°C)24 / 12.5 Po Valley: Sept. 20 - Oct. 10 1826 / 15 Sicily: Oct. 1 - Oct. 20 2021.5 / 6 Po Valley: Oct. 1 - Oct. 20 16.5
22 / 12.5 Sicily: Oct. 20 - Nov. 20 17
18 constant Po Valley: Sep. - Oct.Sicily: Nov. - Dec. 18
Influence of temperatureE x p e r i m e n t 3
Five temperature regimes were tested (24/12.5°C;26/15°C; 21.5/6°C; 22/12.5°C; 18°C constant) thatmatched the photoperiods that induced the lowest ovi-position in both strains in the previous experiments(11.5L:12.5D). The higher temperatures of the thermo-periods coincided with the photophase and the lowertemperatures with the scotophase. The autumn tem-peratures of five years (1989-1992) and two years (1992and 1993) recorded at several metereological cabinsplaced respectively in the Po Valley (ca. 44°N) and onSicily (ca. 37°N), were analysed to choose the thermo-periods for the experiment (table 2).
The same procedure as in test 2 of experiment 1 wasfollowed and more than 500 eggs per thermoperiod wereused for testing. The development time and pre-oviposition period were recorded. Females which did notlay eggs within 29 days after emergence were excludedfrom the calculation of the pre-oviposition period. Forty-eight to 51 pairs per temperature regime were isolatedfive days after emergence. Female survival and fecunditywere determined during 24 days after pairs were isolated,and the pairs were observed for an additional 24 days af-ter being transferred to 26°C and 16L:8D.
Incidence of diapause in field collected populationsE x p e r i m e n t 4
The egg-laying tendency of O. laevigatus femalescollected in nature during autumn and winter at two dif-ferent latitudes were measured. Wild populations of O.laevigatus were collected in autumn on Sicily (August-
November 1994) and in the Po Valley (August-October1994). The adults collected were phenotypically identi-fied (Tommasini, in press) and maintained in glassjars put in a meteorological cabin in open air innorthern Italy (ca. 44° N), with possibility to feed onE. kuehniella frozen eggs and with bean pods foroviposition. Absorbent paper was added as shelter andto prevent excessive humidity. New bean pods and preywere provided weekly. From August 1994 up to Febru-ary 1995 some females were isolated every month inplexiglass cylinders (4 cm high, 4 cm diameter) with E.kuehniella frozen eggs and a piece of bean pod for ovi-position in a climatic chamber at 26±1°C, RH=75±10%and photoperiod 16L:8D. Thirteen to 55 females permonth per population were observed with the exclusionof September for strain S and February for strain N be-cause an insufficient number of females was found inthe field. The beginning of oviposition of each femalewas recorded three times a week for a maximum periodof three weeks.
Statistical AnalysisFor each condition tested in the different experiments,
development time (from egg to adult emergence), pre-oviposition period, percentage of ovipositing females,fecundity, and fertility of eggs, data were statisticallyanalysed. To obtain normal distributions, data were logtransformed before analysis when necessary.
E x p e r i m e n t 1Pre-imaginal development times, pre-oviposition
times and female longevity during the experiment, werecompared using one-way analysis of variance(ANOVA) and Tukey’s test (P < 0.05). Total ovipositionwas compared using the Kruskal-Wallis test followedby Dunn's procedure for multiple comparison. Percent-age of emerged adults as well as the sex ratio, the per-centage of egg-laying females, the percentage of fe-males (ovipositing and non-ovipositing) with and with-out mature oocytes and percentages of surviving fe-males at the end of the experiment were compared withχ2 test (P < 0.05). A linear correlation was establishedbetween the number of mature oocytes in the female’sabdomen at day 30 and the total oviposition during theinitial 29 days of adult life.
Table 3. Development time, pre-imaginal mortality and sex ratio of O. laevigatus (strain N) reared at 18°C and atfive photoperiods (experiment 1, test 1). Same letters indicate no significant differences by ANOVA and Tukey’stest (P < 0.05) (Means ± SE).
Photoperiod(L:D)
Embryonicdevelopment
(days)
No. ofnymphstested
Post-embryonicdevelopment
(days)
Totaldevelopment
(days)
% Pre-imaginalmortality
Sex ratio(% females)
8:16 8.2 ± 0.1 a 462 22.7 ± 0.4 a 30.9 ± 0.3 a 51.1 43.410:14 8.1 ± 0.1 a 375 23.7 ± 0.3 a 31.8 ± 0.3 a 59.2 51.612:12 9.2 ± 0.1 b 449 28.5 ± 0.2 c 37.7 ± 0.2 c 64.4 45.614:10 9.6 ± 0.1 b 326 28.2 ± 0.3 c 37.8 ± 0.3 c 69.9 58.216:8 8.5 ± 0.2 a 476 25.6 ± 0.5 b 34.1 ± 0.3 b 60.7 47.6

230
E x p e r i m e n t 2 a n d 3Development time and fecundity were analysed by
one-way analysis of variance (ANOVA), as well as forpre-oviposition time and females longevity during theexperiment. When significant differences were foundwith ANOVA, means were separated using Tukey’s test(P < 0.05). A covariance analysis (ANCOVA) was car-ried out for both strains on the total fecundity (exposure1+2), considering the fecundity during the first 29 daysafter emergence at different photoperiods or thermo-periods (exposure 1) as covariate. When differenceswere found, Tukey’s test was performed (P < 0.05). Thepercentages of hatching, of pre-imaginal mortality, thesex ratio as well as the percentages of egg-laying fe-males, of surviving females and of fertile and infertilefemales with and without oocytes were compared withχ2 test (P < 0.05). A correlation between total fecundityand mature oocytes in the females abdomen at day 54after emergence was calculated assuming y = a + bx.
E x p e r i m e n t 4The percentages of the females that laid eggs after three
days and three weeks was compared with χ2 test (P < 0.05).
Results
Influence of photoperiodE x p e r i m e n t 1Test 1:
Table 3 reports the pre-imaginal development times ofstrain N of O. laevigatus exposed to different photo-periods. No differences were found in the sex ratio ofemerged adults, so all the data were considered together.The longest development times were recorded at12L:12D and 14L:10D. The shortest development timeswere recorded at the shortest day-lengths (8L:16D and10L:14D). Differences in pre-imaginal mortality werefound among all the photoperiods tested (χ2, P < 0.05).The highest mortality was recorded at 14L:10D, whilethe lowest was at the shortest day-length. No differencesamong the pre-oviposition period were recorded byANOVA, thus the photoperiod did not seem to influ-ence strain N (table 4). Significant differences were re-
corded in the number of eggs laid per female betweenphotoperiods 12L:12D and 16L:8D (table 5), as well asin the percentage of egg-laying females, where the low-est percentages were found at photoperiods 12L:12D(χ2, P < 0.05) (table 4). However, none of the photoperi-ods tested induced diapause in all females. At the pho-toperiods 16L:8D, 14L:10D and 12L:12D significantdifferences in the percentage of females with matureoocytes were found at the end of the experiment (χ2,P < 0.05) (table 5). Figure 2 indicates that the intermedi-ate photoperiod induced a low oviposition activity of O.laevigatus. At the end of the experiment no differenceswere recorded in numbers of surviving females amongphotoperiods (χ2, P > 0.05).
Table 4. Pre-oviposition period and percentage of egg-laying females of O. laevigatus (strain N) during ex-periment 1, test 1 (18°C and five photoperiods). Nosignificant differences were recorded by ANOVA (P >0,05) (Means ± SD).
Photoperiod(L:D)
No. ofpairs
Pre-ovipositionperiod (days)
% Egg-layingfemales
8:16 38 11.1 ± 4.9 52.810:14 36 13.2 ± 5.8 58.112:12 19 13.3 ± 5.1 31.714:10 24 11.5 ± 4.4 48.916:8 46 11.3 ± 4.1 65.7
Table 5. Fecundity of females and percentage of fe-males with mature oocytes of O. laevigatus (strain N)during experiment 1, test 1 (18°C and five photoperi-ods). Same letters indicate no significant differencesby Kruskal-Wallis test (Means ± SD) (P < 0.05).
Photoperiod(L:D)
No. ofpairs
No. ofeggs/female
% females withmature oocytes
8:16 72 16.2 ± 23.1 ab 56.110:14 62 13.1 ± 19.3 ab 59.312:12 60 5.9 ± 12.9 a 43.614:10 47 15.1 ± 20.8 ab 68.916:8 70 21.6 ± 23.3 b 75.8
Table 6. Pre-imaginal development (egg-adult), pre-imaginal mortality and sex ratio of O. laevigatus (strains S andN) at different photoperiods (experiment 1 test 2). Same letters indicate no significant differences by ANOVA andTukey’s test (P < 0.05) (Means ± SE).
Strain N Strain S
Photoperiod(L:D)
Totaldevelopment
(days)
% Pre-imaginalmortality
Sex ratio(% female)
Totaldevelopment
(days)
% Pre-imaginalmortality
Sex ratio(% female)
8:16 34.3 ± 0.4 a 82.3 60.4 34.7 ± 0.3 a 80.5 55.210:14 37.6 ± 0.4 b 83.9 61.8 37.1 ± 0.3 bc 85.3 57.312:12 41.7 ± 0.4 c 87.9 61.5 38.8 ± 0.4 d 85.0 55.814:10 37.5 ± 0.3 b 85.6 49.4 36.2 ± 0.4 b 74.2 51.916:8 34.2 ± 0.3 a 77.3 54.1 38.3 ± 0.5 cd 85.2 59.5

231
0
20
40
60
80
100
1 3 5 7 9 11 13 15 17 19 21 23 25 27 29 310
20
40
60
80
100
1 3 5 7 9 11 13 15 17 19 21 23 25 27 29 31
8L:16D
0
20
40
60
80
100
1 3 5 7 9 11 13 15 17 19 21 23 25 27 29 310
20
40
60
80
100
1 3 5 7 9 11 13 15 17 19 21 23 25 27 29 31
0
20
40
60
80
100
1 3 5 7 9 11 13 15 17 19 21 23 25 27 29 31
0
20
40
60
80
100
1 3 5 7 9 11 13 15 17 19 21 23 25 27 29 31
0
20
40
60
80
100
1 3 5 7 9 11 13 15 17 19 21 23 25 27 29 310
20
40
60
80
100
0
20
40
60
80
100
1 3 5 7 9 11 13 15 17 19 21 23 25 27 29 310
20
40
60
80
100
1 3 5 7 9 11 13 15 17 19 21 23 25 27 29 31
8L:16D
10L:14D
10L:14D
12L:12D
12L:12D
14L:10D
14L:10D
16L:8D
16L:8D
days
Figure 2. Cumulative percentage of egg-laying (on the left) and surviving (on the right) females of O. laevigatus(strain N) reared at different photoperiods and 18°C (Experiment 1, test 1).
The percentage of females with mature oocytes at day30 from adult emergence shows significant differences(χ2 test, P < 0.05) among photoperiods. The highest per-centage was observed at 16L:8D and the lowest one at12L:12D, although it did not differ from that recorded atphotoperiods 8L:16D and 10L:14D.
E x p e r i m e n t 1Test 2:
The total development times of both strains of O.laevigatus are reported in table 6. No differences werefound in the sex ratio of emerged adults, so both sexeswere considered together for development time (χ2,

232
P > 0.05). The longest development times were recordedat 12L:12D for both strains and 16L:8D for strain Sonly. Intermediate development times were recorded at10L:14D and 14L:10D for both strains. Compared totest 1, a higher pre-imaginal mortality at all photoperiodregimes was observed and no differences were recordedamong strains and regimes by the χ2 test (P > 0.05).
The pre-oviposition periods showed neither differ-ences at the five photoperiod regimes (ANOVA,P = 0.07), nor between strains and the interaction ofstrains and photoperiods. This result is strongly influ-
enced by the limited data recorded for strain N at thephotoperiod 12L:12D (tables 7 and 8). Only one femalelaid eggs during exposure 1 at photoperiod 12L:12D.Therefore, to detect a possible difference, anotherANOVA was carried out and all the females (egg-layingand not) were considered. For no-egg-laying females,the pre-oviposition time was taken at 29 days (the pe-riod of the experiment) (table 7). Now, a difference wasrecorded among regimes. Photoperiod 12L:12D inducedthe longest pre-oviposition period in strain N of O.laevigatus (figure 3).
Table 7. ANOVA summary of the main effects on the pre-oviposition period of O. laevigatus (strains N) during theexposure at five photoperiods and 18°C (experiment 1, test 1) considering only egg-laying females, and all the fe-males respectively.
Only egg-laying females All femalesEffect df F P-level F P-levelStrain (1) 1 0.08 0.77 0.78 0.37Regimes (2) 4 2.25 0.07 2.80 0.02*Interaction (1 x 2) 4 2.03 0.10 1.98 0.09
Table 8. Pre-oviposition period of O. laevigatus (strains S and N) in experiment 1, test 2 (18°C and different photo-periods). No significant differences were found by ANOVA (P > 0.05) (Means ± SD). Percentage of egg-laying fe-males of O. laevigatus of the entire population exposed to different photoperiods (χ² test; P < 0.05).
Strain N Strain S
Photoperiod (L:D) No. of pairs Pre-ovipositionperiod (days)
% Egg-layingfemales No. of pairs Pre-oviposition
Period (days)% Egg-laying
females8:16 4 12.0 ± 2.9 11.1 7 15.0 ± 5.4 15.9
10:14 7 14.7 ± 2.5 20.6 3 17.0 ± 5.9 12.112:12 1 25.0 ± 0.0 3.5 5 17.4 ± 4.6 13.214:10 8 19.3 ± 3.6 28.6 7 15.9 ± 5.6 17.516:8 13 14.0 ± 4.7 39.4 5 17.6 ± 4.9 16.7
±Std. Dev.±Std. Err.Mean
Day
s
Strain N
6
10
14
18
22
26
30
1 2 3 4 5Strain S
1 2 3 4 5
Figure 3. Pre-oviposition period of O. laevigatus (strains N and S) at different photoperiods (1, 8L:16D; 2, 10L:14D;3, 12L:12D; 4, 14L:10D; 5, 16L:8D) and 18°C. (Experiment 1, test 2).

233
The percentage of egg-laying females is given in table8, the number of eggs laid per female in table 9. An in-crease in the oviposition from day 15 to day 29 of adultlife was observed (figure 4). Compared to test 1, strainN showed a lower oviposition rate, but the previoustrend found for the oviposition activity was confirmed.
Presumably, the lower oviposition in test 2 is due tothe reduction in the number of checks. The lowernumber of checks was done to keep low temperature(18°C) more constant. The number of eggs laid perfemale at 12L:12D was lower than that at 16L:8D, and
the percentage of egg-laying females was lower at12L:12D and at 8L:16D compared to the other photo-periods tested. In strain N, only 1 female laid eggs 23days after emergence at 12 hours photophase. Strain Sshowed no differences among groups exposed to dif-ferent day-lengths, indicating a lower sensitivity to in-fluence of photoperiod than strain N, although eachgroup showed a lower percentage of egg-laying fe-males compared to strain N reared at 16L:8D (χ² test;P < 0.05). Almost all the eggs checked during experi-ment 1 were fertile (hatching rate >90%).
0
20
40
60
80
100
1 3 5 7 9 11 13 15 17 19 21 23 25 27 29
Strain N Strain S
8L:16D
0
20
40
60
80
100
1 3 5 7 9 11 13 15 17 19 21 23 25 27 29
Strain N Strain S
10L:14D
0
20
40
60
80
100
1 3 5 7 9 11 13 15 17 19 21 23 25 27 29
Strain N Strain S
12L:12D
0
20
40
60
80
100
1 3 5 7 9 11 13 15 17 19 21 23 25 27 29
Strain N Strain S
14L:10D
0
20
40
60
80
100
1 3 5 7 9 11 13 15 17 19 21 23 25 27 29
Strain N Strain S
0
20
40
60
80
100
1 3 5 7 9 11 13 15 17 19 21 23 25 27 29
Strain N Strain S
10L:14D
0
20
40
60
80
100
1 3 5 7 9 11 13 15 17 19 21 23 25 27 29
Strain N Strain S
12L:12D
0
20
40
60
80
100
1 3 5 7 9 11 13 15 17 19 21 23 25 27 29
Strain N Strain S
14L:10D
8L:16D
0
20
40
60
80
100
1 3 5 7 9 11 13 15 17 19 21 23 25 27 29
16L:8D
0
20
40
60
80
100
1 3 5 7 9 11 13 15 17 19 21 23 25 27 29
Strain N Strain S
16L:8D
days
Figure 4. Cumulative percentage of egg-laying (on the left) and surviving (on the right) females of O. laevigatus(strains N and S) at different photoperiods and 18°C (Experiment 1, test 2).
234
Table 9. Fecundity of O. laevigatus females, during the initial 29 days of adult life at different photoperiods inexperiment 1, test 2. Same letters indicate no significant differences by ANOVA and Tukey’s test (P < 0.05)(Means ± SE).
Strain N Strain SPhotoperiod (L:D) No. of pairs No. of eggs/female No. of pairs No. of eggs/female
8:16 36 3.6 ± 2.0 ab 44 4.0 ± 1.7 ab10:14 34 3.2 ± 1.3 ab 33 2.5 ± 1.6 ab12:12 29 0.1 ± 0.1 a 38 2.4 ± 1.1 ab14:10 28 5.2 ± 1.8 ab 40 3.4 ± 1.7 ab16:8 33 11.2 ± 3.4 b 30 2.7 ± 1.7 ab
Table 10. Percentage of fertile and infertile females with mature oocytes, and unfertile females without oocytescounted in the entire population, 24 hours after the end of test 2 of experiment 1 (day 30 after adult emergence).
Strain N Strain S
Photoperiod (L:D) No. offemales
% Fertilefemale with
oocytes
% Infertilefemale with
oocytes
% Infertilefemalewithoutoocytes
No. offemales
% Fertilefemale with
oocytes
% Infertilefemale with
oocytes
% Infertilefemalewithoutoocytes
8:16 35 11.4 11.5 77.1 37 18.9 33.0 48.110:14 33 18.2 30.3 51.5 31 12.9 36.5 50.612:12 29 0 10.3 89.7 36 11.1 32.2 56.714:10 28 28.6 28.6 42.9 37 16.2 43.3 40.516:8 29 37.9 32.1 30.0 29 17.2 25.5 57.3χ2 test P<0.001 P>0.05 P<0.005 P>0.05 P>0.05 P>0.05
The cumulative percentages of surviving females ofthe two strains of O. laevigatus at the five photoperiodsare shown in figure 4. No differences in survival wererecorded among photoperiods for each strain, as well asbetween strains for each photoperiod (χ² test; P > 0.05).
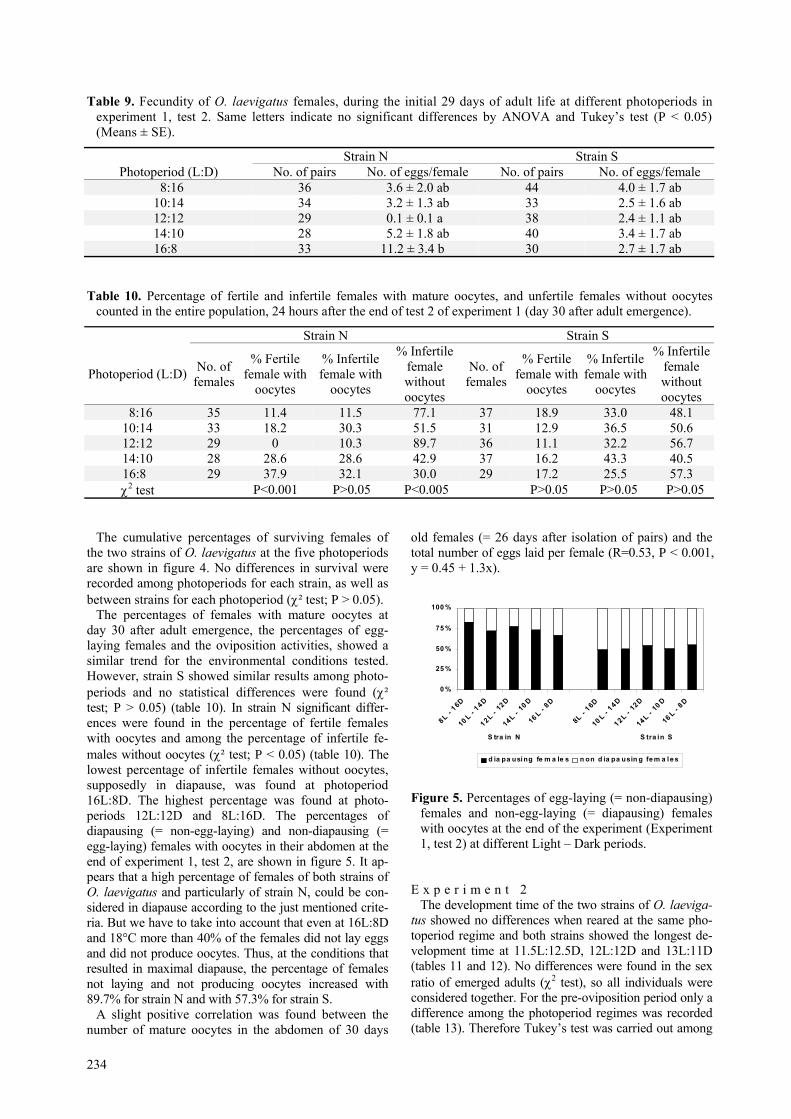
The percentages of females with mature oocytes atday 30 after adult emergence, the percentages of egg-laying females and the oviposition activities, showed asimilar trend for the environmental conditions tested.However, strain S showed similar results among photo-periods and no statistical differences were found (χ²test; P > 0.05) (table 10). In strain N significant differ-ences were found in the percentage of fertile femaleswith oocytes and among the percentage of infertile fe-males without oocytes (χ² test; P < 0.05) (table 10). Thelowest percentage of infertile females without oocytes,supposedly in diapause, was found at photoperiod16L:8D. The highest percentage was found at photo-periods 12L:12D and 8L:16D. The percentages ofdiapausing (= non-egg-laying) and non-diapausing (=egg-laying) females with oocytes in their abdomen at theend of experiment 1, test 2, are shown in figure 5. It ap-pears that a high percentage of females of both strains ofO. laevigatus and particularly of strain N, could be con-sidered in diapause according to the just mentioned crite-ria. But we have to take into account that even at 16L:8Dand 18°C more than 40% of the females did not lay eggsand did not produce oocytes. Thus, at the conditions thatresulted in maximal diapause, the percentage of femalesnot laying and not producing oocytes increased with89.7% for strain N and with 57.3% for strain S.
A slight positive correlation was found between thenumber of mature oocytes in the abdomen of 30 days
old females (= 26 days after isolation of pairs) and thetotal number of eggs laid per female (R=0.53, P < 0.001,y = 0.45 + 1.3x).
0 %
25 %
50 %
75 %
100 %
8L - 16D
10 L - 14D
12L - 12D
14L - 10 D
16 L - 8D
8L - 16D
10 L - 14D
12L - 12D
14L - 10 D
16 L - 8D
S tra in N S tra in S
d ia pa using fe m a le s n on d ia pa usin g fe m a le s
Figure 5. Percentages of egg-laying (= non-diapausing)females and non-egg-laying (= diapausing) femaleswith oocytes at the end of the experiment (Experiment1, test 2) at different Light – Dark periods.
E x p e r i m e n t 2The development time of the two strains of O. laeviga-
tus showed no differences when reared at the same pho-toperiod regime and both strains showed the longest de-velopment time at 11.5L:12.5D, 12L:12D and 13L:11D(tables 11 and 12). No differences were found in the sexratio of emerged adults (χ2 test), so all individuals wereconsidered together. For the pre-oviposition period only adifference among the photoperiod regimes was recorded(table 13). Therefore Tukey’s test was carried out among

235
the means pooled without distinguishing the strains. Forboth strains the pre-oviposition time was shorter at pho-toperiods 12.5L:11.5D and 13L:11D, when compared tothat at photoperiod 11.5L:12.5D (tables 13, 14 and 15).
Table 11. Summary of the main effects found byANOVA on the development time of O. laevigatus(strains N and S) during experiment 2.
Effect df F P-levelStrain (1) 1 4.02 0.06Regimes (2) 4 15.28 0.001 *Interaction (1 x 2) 4 1.07 0.41
During the initial 29 days of adult life at 18°C, the fe-cundity of the two strains of O. laevigatus showed dif-ferences related to both the strain and the photoperiod,as well as to the interaction of both photoperiod andstrain (ANOVA, P < 0.01) (table 13). No differences inthe fecundity were recorded among the photoperiods forstrain N, while strain S showed a higher rate of oviposi-
tion at 12.5L:11.5D compared to 11.5L:12.5D,12L:12D, and the data recorded for strain N at all thephotoperiods tested (table 16). During exposure 1, thepercentage of egg-laying females increased progres-sively at all photoperiods and at the last day at this ex-posure, strain S showed a higher percentage of fertilefemales compared to strain N, respectively at photoperi-ods 11L:13D, 12.5L:11.5D and 13L:11D (χ2 test,P < 0.001) (table 15). However, no differences were re-corded in the percentage of egg-laying females at theend of the experiment (χ2 test, P > 0.05) (table 19). Theoptimal climatic conditions during exposure 2, led to anincrease in oviposition and in the percentage of fertilefemales (figure 7) for all groups of females, with no dif-ferences on total fecundity (exposure 1 + 2) among thefive photoperiod regimes (ANCOVA, P > 0.05) (table19). Because the environmental conditions werechanged in exposure 2 (26°C, 16L:8D), a covarianceanalysis was carried out and the fecundity during expo-sure 1 was taken as covariate. Significant differenceswere recorded only between strains and their interactionwith the photoperiods (ANCOVA, P < 0,05) (table 17).
Table 12. Development time (days) of two strains of O. laevigatus reared at 18°C and five photoperiods (experiment 2),starting from more than 500 eggs/strain/photoperiod. Different letters on the same line indicate a significant differ-ence using Tukey’s test on the means pooled (P < 0.05) (Means ± SD).
Photoperiod (L:D) 11:13 11.5:12.5 12:12 12.5:11.5 13:11Strain N 34.5 ± 0.7 39.5 ± 0.7 36.5 ± 0.7 32.0 ± 2.6 35.7 ± 1.5Strain S 34.0 ± 1.4 39.5 ± 0.7 39.5 ± 0.7 33.5 ± 0.7 38.0 ± 0.8Means pooled 34.3 ± 1.0 ab 39.5 ± 0.7 c 38.0 ± 0.7 c 32.8 ± 1.6 a 36.9 ± 1.1 bc
Table 13. Summary of the main effects found by ANOVA on the pre-oviposition period and on the fecundity of O.laevigatus (strains N and S) when exposed to five photoperiods and 18°C (experiment 2).
Pre-oviposition period FecundityEffect df F P-level F P-levelStrain (1) 1 2.24 0.13 25.72 0.001 *Regimes (2) 4 4.23 0.05* 5.84 0.001 *Interaction (1 x 2) 4 0.67 0.62 3.35 0.01 *
Table 14. Comparison of pooled means of the pre-oviposition period of the two strains of O. laevigatus (Tukey’stest, P < 0.05) (experiment 2).
Photoperiod (L:D) 11:13 11.5:12.5 12:12 12.5:11.5 13:11Strains N and S 13.8 ± 4.5 ab 14.6 ± 6.0 b 14.2 ± 4.8 ab 11.5 ± 4.4 a 11.6 ± 5.2 a
Table 15. Pre-oviposition period and percentage of fertile females of two strains of O. laevigatus reared at 18°C andfive photoperiods (experiment 2). Different letters indicate a significant difference using ANOVA and Tukey’s test(P < 0.05) (Means±SD).
Strain N Strain S
Photoperiod (L:D) No. of fertilefemales
Pre-ovipositionperiod (days)
% Fertilefemales
No. of fertilefemales
Pre-ovipositionperiod (days)
% Fertilefemales
11:13 13 14.5 ± 5.0 ab 31.0 30 13.0 ± 4.0 ab 62.511.5:12.5 22 14.6 ± 6.1 b 52.4 22 14.6 ± 5.9 b 55.0
12:12 18 14.6 ± 4.7 ab 40.9 24 13.8 ± 5.0 ab 64.912.5:11.5 27 12.9 ± 4.5 a 61.4 42 10.2 ± 4.4 a 95.5
13:11 14 11.7 ± 5.9 a 34.1 29 11.6 ± 4.5 a 70.7

236
Table 16. Fecundity of two strains of O. laevigatus reared at 18°C and five photoperiods (experiment 2). Differentletters indicate a significant difference using ANOVA and Tukey’s test (P < 0.05) (Means±SD).
Strain N Strain SPhotoperiod (L:D) No. of pairs No. of eggs/female No. of pairs No. of eggs/female
11:13 42 3.8 ± 7.7 a 48 11.5 ± 12.6 ab11.5:12.5 42 7.3 ± 10.8 a 40 5.8 ± 7.0 a
12:12 44 3.9 ± 7.9 a 37 8.5 ± 10.1 a12.5:11.5 44 8.3 ± 10.7 a 44 19.3 ± 16.0 b
13:11 41 3.3 ± 7.1 a 41 12.2 ± 13.7 ab
Table 17. Summary of the main effects found by AN-COVA on the fecundity of O. laevigatus (strains Nand S) during experiment 2, considering fecundityduring exposure 1 as covariate; the entire femalepopulation was included.
Effect df F P-levelStrain (1) 1 12.10 0.001 *Regimes (2) 4 1.39 0.2Interaction (1 x 2) 4 2.85 0.02 *
The covariance analysis was carried out either consid-ering the full population tested or only the egg-laying fe-male population for both strains as shown in table 18.Similar differences were recorded for fecundity betweenO. laevigatus strains and their interaction with environ-mental conditions (regimes) (tables 17 and 18) and a testof parallelism confirmed those results. The main effectsfound by ANCOVA on the full populations are shown infigure 6, which gives a clear idea of the behaviour of thetwo strains of O. laevigatus at the different regimes tested.
Table 18. Summary of the main effects found by ANCOVA on the fecundity of O. laevigatus (strains N and S) dur-ing experiment 2, considering fecundity during exposure 1 as covariate; only fertile females of the populationswere included.
Test of parallelismEffect df F P-level F P-levelStrain (1) 1 14.11 0.001 * 16.44 0.001 *Regimes (2) 4 1.60 0.1 0.94 0.44Interaction (1 x 2) 4 2.49 0.04 * 2.20 0.02 *
Table 19. Number of eggs laid per female by two strains of O. laevigatus at the end of exposure 1 and at the end ofthe experiment 2. Only fertile females were considered. Different letters indicate significant differences found byANCOVA and Tukey’s test (P < 0.05) (Means±SD).
Strain N Strain S
Photoperiod(L:D)
No. ofpairs
No. of eggs/fem.Exposuse 1
No. of eggs/fem.exposure 1+2
Adjustedmeans
Fertilefemales (%)
exposure1+2
No. ofpairs
No. of eggs/fem.exposure 1
No. of eggs/fem.exposure 1+2
Adjustedmeans
Fertilefemales (%)
exposure1+2
11:13 35 4.5 ± 8.1 a 50.5 ± 30.4 a 58.5 91.9 39 11.2 ± 11.9 ab 48.0 ± 41.2 a 43.6 91.711.5:12.5 38 7.7 ± 10.8 a 54.0 ± 31.0 a 56.1 100 29 6.6 ± 6.9 a 25.3 ± 27.1 a 29.5 96.3
12:12 39 4.2 ± 7.7 a 40.6 ± 28.2 a 49.1 94.7 27 9.3 ± 9.5 a 29.5 ± 34.6 a 28.6 95.712.5:11.5 41 7.8 ± 10.4 a 36.4 ± 31.5 a 38.2 100 43 19.7 ± 15.8 b 62.4 ± 54.0 a 42.2 100
13:11 30 5.3 ± 7.8 a 40.8 ± 40.2 a 47.3 88.5 37 11.8 ± 12.6 ab 44.6 ± 42.8 a 39.1 96.8
Table 20. Percentages of fertile and infertile females with mature oocytes 24 hours after the end of the experiment 2.
Strain N Strain S
Photoperiod (L:D) No. offemales
% Fertilefemale with
oocytes
% Infertilefemale with
oocytes
% Infertilefemalewithoutoocytes
No. offemales
% Fertilefemale with
oocytes
% Infertilefemale with
oocytes
% Infertilefemalewithoutoocytes
11:13 40 65.0 25.0 10.0 42 61.9 7.1 011.5:12.5 40 55.0 0 5.0 31 51.6 3.2 6.5
12:12 43 58.1 2.3 7.0 31 35.5 3.2 9.712.5:11.5 43 55.8 4.6 0 43 83.7 0 0
13:11 35 54.3 5.7 8.6 37 48.6 0 0χ2 P>0.05 P>0.05 P>0.05 P<0.001 * P>0.05 P<0.05 *

237
A
FECT.FEC1
STRAIN Main EffectF(1, 347)=14.11; P < .0002
Strains
Dep
ende
nt v
aria
bles
0
5
10
15
20
25
30
35
40
45
50
N S
B
FECT.FEC1
REGIME Main EffectF(4, 347)=1.60; P < .1741
Regimes
Dep
ende
nt v
aria
bles
0
10
20
30
40
50
60
1 2 3 4 5
C
FECT. FEC1
2-way interactionF(4, 347)=2.49; P < .0432
1Regime
Dep
ende
nt v
aria
bles
���������������������
���������������������
0
10
20
30
40
50
60
70
Strains N S
2Regime
���������������������
���������������������
N S
3Regime
���������������������
���������������������
N S
4Regime
���������������������
���������������������
N S
5Regime
���������������������
���������������������
N S
Figure 6. Main effects of strain (A), photoperiod (B) and their interaction (C), found in experiment 2 in the covarian-ce analysis (ANCOVA, table 17). (N = northern strain; S = southern strain) (FECT total fecundity, FEC1 the fe-cundity during exposure 1 at different photoperiods used as covariate) (Regimes: 1 = 11L:13D; 2 = 11.5L:12.5D;3 = 12L:12D; 4 = 12.5L:11.5D; 5 = 13L:11D).

238
0
20
40
60
80
100
1 4 7 10 13 16 19 22 25 28 31 34 37 40 43 46 49 52
Strain N Strain S
11L:13D
0
20
40
60
80
100
1 4 7 10 13 16 19 22 25 28 31 34 37 40 43 46 49 52
Strain N Strain S
11.5L:12.5D
0
20
40
60
80
100
1 4 7 10 13 16 19 22 25 28 31 34 37 40 43 46 49 52
Strain N Strain S
12L:12D
0
20
40
60
80
100
1 4 7 10 13 16 19 22 25 28 31 34 37 40 43 46 49 52
Strain N Strain S
0
20
40
60
80
100
1 4 7 10 13 16 19 22 25 28 31 34 37 40 43 46 49 52
Strain N Strain S
11.5L:12.5D
11L:13D
12L:12D
13L:11D
13L:11D
0
20
40
60
80
100
1 4 7 10 13 16 19 22 25 28 31 34 37 40 43 46 49 52
12.5L:11.5D
0
20
40
60
80
100
1 4 7 10 13 16 19 22 25 28 31 34 37 40 43 46 49 52
Strain N Strain S
0
20
40
60
80
100
1 4 7 10 13 16 19 22 25 28 31 34 37 40 43 46 49 52
Strain N Strain S
12.5L:11.5D
0
20
40
60
80
100
1 4 7 10 13 16 19 22 25 28 31 34 37 40 43 46 49 520
20
40
60
80
100
1 4 7 10 13 16 19 22 25 28 31 34 37 40 43 46 49 52
Strain N Strain S days
13L:11D
13L:11D
12L:12D
Figure 7. Cumulative percentages of egg-laying (on the left) and surviving (on the right) females of two strains(S=southern and N=northern) of O. laevigatus reared at different photoperiods and 18°C for 29 days and then forfurther 24 days at 16L:8D and 26°C (Experiment 2).
The adjusted means of the oviposition recorded duringexposure 2 (when the environmental conditions wereswitched from 18°C and different photoperiods to 26°Cand 16L:8D) show an increase compared to exposure 1(see figure 7). The highest increase is found for strain Nexposed to the photoperiods 11L:13D and 11.5L:12.5D(table 19).
When we compare fertile females with oocytes with in-fertile females with oocytes and with infertile females
without oocytes for both strains, differences in the percent-ages of fertile females with oocytes and infertile femaleswithout oocytes for the various photoperiods were re-corded only for strain S (χ2 test, P < 0.05) (table 20).
Absence of oocytes in the fertile females could be dueto their old age at the end of the experiment, but absenceof oocytes in the infertile females could be the result ofdiapause induction. In any case, only at the photoperiods11.5L:12.5D and 12L:12D a few infertile females were

239
found without oocytes, two and three respectively. Afterexposition for three weeks at 26°C and 16L:8D (exposure2), none of the females seemed to show diapause in strainS and only a very small number in strain N (table 20). Atthe end of the experiment a very low percentage of fe-males for both strains appeared to be in diapause for eachphotoperiod, based on the percentages of egg-laying andnon-egg-laying females with oocytes (figure 8).
0%
25%
50%
75%
100%
11L -1
3D
11.5L
- 12
.5D
12L - 12D
12.5L
- 11
.5D
13L - 1
1D
11L -1
3D
11.5L -
12.5D
12L - 1
2D
12.5L
- 11
.5D
13L - 1
1D
S tra in N Stra in S
d ia pa using fe m a le s n on d ia pa usin g fem a les
Figure 8. Percentage of egg-laying (= non-diapausing)females and non-egg-laying (= diapausing) femaleswith oocytes at the end of the experiment 2, at differ-ent Light – Dark periods.
The cumulative percentages of egg-laying and sur-viving females during experiment 2 are shown in figure7. Different effects of photoperiods were found on thepercentage of surviving females for both strains at theend of exposure 1 (29th day) (table 21) (χ2 test, P < 0.01).At the end of the experiment (exposure 1 and 2) asignificant difference in egg-laying and survival was re-
corded only for strain S (χ2 test, P < 0.01). Furthermore, adifference in egg-laying and survival was found be-tween the strains at photoperiod 12L:12D at the end ofexposure 1, and at photoperiod 11.5L:12.5D at the endof the experiment 2 (χ2 test, P < 0.01) (table 21). So,photoperiod can influence female survival.
Total fecundity (exposure 1+2) and the number of matureoocytes per female at the end of the experiment appearedto be weakly correlated (y = 39.97 + x; R=0.13, P < 0.05).
Influence of temperatureE x p e r i m e n t 3
This experiment was carried out to study the influenceof temperature combined with a critical photoperiod(11.5L:12.5D) on diapause induction of O. laevigatus.The ANOVA test showed differences among the re-gimes of temperatures, but no differences were recordedbetween strains or their interaction with the regimes onthe development time of O. laevigatus (tables 22 and23). The slowest embryonic development and longestdevelopment time were recorded for both O. laevigatusstrains at a thermoperiod 21.5°C/6°C, while the fastestdevelopment was at 26°C/15°C (table 23). Furthermore,the development time is shorter at a thermoperiod of24°C/12.5°C with an average temperature of 18°C thanat a constant temperature of 18°C. The pre-imaginalmortality was high at all the regimes tested becausegroups of ten nymphs were reared together in a cylinderand mortality may be a result of cannibalism. The high-est mortality was recorded at 21.5°C/6°C for strain S,while the lowest mortality was observed for both strainsat 26°C/15°C (χ2 test, P < 0.05) (table 24). No differenceswere recorded for the sex ratio (χ2 test, P > 0.05), thus allthe individuals were considered together for the calcu-lation of the development time.
Table 21. χ2 test on the percentages of surviving females at various photoperiods and of the two strains at the end ofexposure 1 and exposure 2.
Strain χ2 test (P-level) at the end of exposure 1 χ2 test (P-level) at the end of exposure 2N P<0.005 * P>0.05S P<0.01 * P<0.001 *
Photoperiod (P-level) (P-level)11L:13D P>0.05 P>0.05
11.5L:12.5D P>0.05 P<0.001 *12L:12D P<0.01 * P>0.05
12.5L:11.5D P>0.05 P>0.0513L:11D P>0.05 P>0.05
Table 22. Summary of the main effects by ANOVA on the development time of O. laevigatus (strains N and S)during experiment 3.
Embryonic period Total developmentEffect df F P-level F P-levelStrain (1) 1 0.44 0.52 4.01 0.07Regimes (2) 4 45.49 0.001 * 15.28 0.001*Interaction (1 x 2) 4 0.23 0.92 1.06 0.41

240
Table 23. Pooled means (± SD) of embryonic development time and total development time, considering togetherthe strains N and S of O. laevigatus. Different letters on the same line indicate significant differences usingANOVA (P < 0.001) and Tukey’s test (P < 0.05) (Experiment 3).
Temperature regime (°C) 24/12.5 26/15 21.5/6 22/12.5 18 constantEmbryonic development 10.0 ± 0 b 8.0 ± 0 a 12.3 ± 0.4 c 10.6 ± 1.0 b 10.0 ± 0 bTotal development time 32.6 ± 0.7 b 28.3 ± 0.9 a 51.3 ± 1.7 d 35.0 ± 2.2 c 36.5 ±1.5 c
Table 24. Embryonic development time and total development time (days ± SD) of two strains of O. laevigatusreared at five temperature regimes matched to the 11.5L:12.5D photoperiod (experiment 3). More than 500 eggswere observed per strain and temperature regime. Pre-imaginal mortality and sex ratio are shown as percentages (χ2
test, P < 0.05 for mortality; P > 0.05 for sex ratio).
Strain N Strain S
Temperatureregime (°C)
Embryonicdevelopment
(days)
Totaldevelopment
(days)
%Pre-imaginal
mortality
Sexratio
(% fem.)
Embryonicdevelopment
(days)
Totaldevelopment
(days)
%Pre-imaginal
mortality
Sexratio
(% fem.)24/12.5 10.0 ± 0.0 32.4 ± 0.5 71.2 47.0 10.0 ± 0.0 32.7 ± 0.8 79.7 54.026/15 8.0 ± 0.0 27.0 ± 0.0 68.9 47.0 8.0 ± 0.0 29.6 ± 1.7 48.9 53.821.5/6 12.0 ± 0.0 52.0 ± 0.8 83.3 47.3 12.5 ± 0.7 50.5 ± 2.6 88.6 54.8
22/12.5 10.5 ± 0.7 35.5 ± 1.3 83.7 52.3 10.7 ± 1.2 34.5 ± 3.1 83.9 46.218 const. 10.0 ± 0.0 35.9 ± 2.0 82.3 45.9 10.0 ± 0.0 37.0 ± 0.9 82.5 47.1
Table 25. Summary of the main effects found by ANOVA on the pre-oviposition period and fecundity of O. laevi-gatus (strains N and S) during the exposure at five temperature regimes and 11.5L:12.5D (Experiment 3).
Pre-oviposition FecundityEffect df F P-level F P-levelStrain (1) 1 7.42 0.05 * 72.16 0.001 *Regimes (2) 4 19.67 0.001 * 22.89 0.001 *Interaction (1 x 2) 4 1.71 0.15 6.97 0.001 *
Table 26. Pooled means (± SD) of pre-oviposition peri-ods of all the temperature regimes to which the twostrains of O. laevigatus were exposed. Different lettersindicate significant difference by ANOVA (P < 0.05)(Experiment 3).
Strain N Strain S
Pre-ovipositionperiod (days) 13.3 ± 5.8 b 11.4 ± 5.1 a
The ANOVA (table 25) indicated that strain N had apre-oviposition period longer than strain S (table 26).Differences were recorded also among the temperatureregimes, although the interaction between strains andregimes was not significant. The longest pre-ovipositionperiod was recorded for both strains at 18°C constant, butthis was not significantly different from the data recordedat 21.5°C/6°C and at 22°C/12.5°C (tables 27 and 28).
Strain S showed a higher percentage of egg-layingfemales than strain N, particularly at 24°C/12.5°C,26°C/15°C and 22°C/12.5°C (χ2 test, P < 0.05) (table 28).When environmental conditions were changed to 26°Cand 16L:8D (exposure 2), sudden increases in the per-centage of egg-laying females as well as in the number ofeggs laid per female were recorded (figure 9 and tables31, 32). No differences were recorded for the percentageof fertile females at the end of the experiment, betweenthe strains and temperature regimes (χ2 test, P > 0.05).
During the initial 29 days of adult life (exposure 1)strain and temperature as well as their interaction seemto have a strong influence on the fecundity of O. laevi-gatus (table 25). The S strain showed a higher fecunditycompared to the N strain. For both strains the tempera-ture regime least suitable for oviposition appears to be21.5°C/6°C and 18°C constant. No differences for thefecundity were observed at 24°C/12.5°C and22°C/12.5°C for strain N. The highest fecundity forboth strains was recorded at 6°C/15°C (table 31).
Table 27. Pooled means (± SD) of pre-oviposition periods of all data of the strains N and S of O. laevigatus. Differ-ent letters indicate significant differences by ANOVA and Tukey’s test (P < 0.05) (Experiment 3).
Temperature regime (°C) 24/12.5 26/15 21.5/6 22/12.5 18 constantPre-oviposition
development (days) 8.6 ± 4.4 a 9.1 ± 4.9 a 15.1 ± 5.4 b 13.1 ± 6.2 b 15.7 ± 6.4 b

241
Table 28. Pre-oviposition period and percentage of fertile females at 29 days after adult emergence (χ2 test, P < 0.05)of O. laevigatus (strains N and S) reared at five temperature regimes and 11.5L:12.5D.
Strain N Strain S
Temperature regime(°C)
No. ofFertilefemales
Pre-ovipositionperiod (days)
% Fertilefemales
No. offertile
females
Pre-ovipositionperiod (days)
% Fertilefemales
24/12.5 21 8.6 ± 4.7 30.6 49 8.5 ± 4.0 96.126/15 31 11.4 ± 6.4 64.6 41 6.8 ± 3.4 85.421.5/6 17 15.4 ± 5.2 39.5 17 14.8 ± 5.5 43.6
22/12.5 17 14.5 ± 6.6 35.4 38 11.7 ± 5.8 80.818 constant 18 16.4 ± 6.0 39.1 28 15.0 ± 6.8 58.3
Table 29. Summary of the main effects found by ANCOVA on the fecundity of O. laevigatus (strain N and S) con-sidering the fecundity during exposure 1 as covariate. All populations were included (Experiment 3).
Test of parallelismEffect df F P-level F P-levelStrain (1) 1 6.40 0.01 * 4.24 0.04 *Regimes (2) 4 6.92 0.001 * 1.16 0.33Interaction (1 x 2) 4 1.09 0.36 1.25 0.27
Table 30. Summary of the main effects found by ANCOVA and test of parallelism on the fecundity of O. laevigatus(strains N and S) considering fecundity during exposure 1 as covariate; only fertile females were included (Ex-periment 3).
Test of parallelismEffect df F P-level F P-levelStrain (1) 1 3.24 0.07 5.74 0.02 *Regimes (2) 4 8.08 0.001 * 1.60 0.17Interaction (1 x 2) 4 1.49 0.21 2.05 0.03 *
Table 31. Number of eggs laid per female at the end of exposure 1, and at the end of the experiment of the twostrains of O. laevigatus. All populations were considered. Different letters in column with the same description in-dicate significant difference by ANOVA and Tukey’s test (P < 0.05) (Means ± SD) (Experiment 3).
Strain N Strain STemperatureregime (°C)
No. ofpairs
No. of eggs/femaleexposure 1
No. of eggs/femaleexposure 1+2
No. ofpairs
No. of eggs/femaleexposure 1
No. of eggs/femaleexposure 1+2
24/12.5 50 7.2 ± 15.0 a 58.8 ± 58.2 b 51 30.4 ± 20.9 b 76.7 ± 64.4 b26/15 42 17.7 ± 25.6 b 54.5 ± 57.4 b 39 45.7 ± 30.9 c 92.5 ± 74.6 b21.5/6 38 5.4 ± 9.1 a 43.4 ± 48.4 a 39 7.8 ± 14.1 a 47.5 ± 57.5 a
22/12.5 48 7.9 ± 14.7 a 65.4 ± 51.5 b 46 24.5 ± 23.1 b 85.7 ± 68.4 b18 constant 45 5.3 ± 10.1 a 60.6 ± 55.0 b 47 11.6 ± 14.5 a 68.3 ± 57.7 b
Table 32. Number of eggs laid per female at the end of exposure 1, and at the end of the experiment of the twostrains of O. laevigatus. Only the fertile females were considered. The different letters given in the columns indi-cate significant differences by ANCOVA and Tukey’s test (P < 0.05) (Means ± SD). Percentages of egg-laying fe-males at the end of the experiment (χ2 test, P > 0.05) (Experiment 3).
Strain N Strain STemperatureregime (°C)
No. ofpairs
No. ofeggs/femaleexposure 1
No. ofeggs/female
exposure 1+2
Adjusted
means
%Fertile
females
No. ofpairs
No. ofeggs/femaleexposure 1
No. ofeggs/female
exposure 1+2
Adjusted
means
%Fertilefemales
24/12.5 37 8.8 ± 16.2 a 71.7 ± 56.6 ab 88.5 74.0 49 31.6 ± 20.4 b 79.8 ± 63.8 b 59.2 96.126/15 37 19.2 ± 25.7 b 59.0 ± 56.8 a 58.7 87.5 35 51.2 ± 27.3 c 100.0 ± 66.6 b 47.2 89.621.5/6 26 8.9 ± 10.2 a 63.7 ± 48.3 ab 80.3 67.5 25 12.2 ± 16.2 a 74.1 ± 56.4 b 85.4 64.122/12.5 39 9.7 ± 15.8 a 80.5 ± 45.1 b 95.8 81.2 42 27.0 ± 22.6 b 95.0 ± 65.5 b 81.8 91.1
18 constant 36 6.5 ± 10.8 a 73.7 ± 52.1 ab 94.3 80.4 35 15.2 ± 14.9 a 89.2 ± 49.6 b 95.5 75.0

242
Since the environmental conditions were changed inexposure 2 (26°C, 16L:8D), a covariance analysis onfecundity was carried out and the fecundity during ex-posure 1 was taken as covariate. A covariance analysiswas done considering either all females or only fertilefemales (tables 29 and 30). Differences were found inboth cases among the temperature regimes tested. Only
when all females were compared a difference was ob-served between strains (P = 0.01), although the P-levelwas almost significant even when only fertile femaleswere considered (P = 0.07). No differences on the inter-action of regimes and strains were found. Figure 10shows the main effects of the ANCOVA undertaken onthe entire population of females.
0
20
40
60
80
100
120
1 4 7 10 13 16 19 22 25 28 31 34 37 40 43 46 49 52
Strain N Strain S
24/12.5°C
0
20
40
60
80
100
1 4 7 10 13 16 19 22 25 28 31 34 37 40 43 46 49 52
Strain N Strain S
26/15°C
0
20
40
60
80
100
1 4 7 10 13 16 19 22 25 28 31 34 37 40 43 46 49 52
Strain N Strain S
21.5/6°C
0
20
40
60
80
100
1 4 7 10 13 16 19 22 25 28 31 34 37 40 43 46 49 52
Strain N Strain S
0
20
40
60
80
100
1 4 7 10 13 16 19 22 25 28 31 34 37 40 43 46 49 52
Strain N Strain S
26/15°C
24/12.5°C
12L:12D
13L:11D
13L:11D
0
20
40
60
80
100
1 4 7 10 13 16 19 22 25 28 31 34 37 40 43 46 49 52
22/12.5°C
0
20
40
60
80
100
1 4 7 10 13 16 19 22 25 28 31 34 37 40 43 46 49 52
Strain N Strain S
0
20
40
60
80
100
1 4 7 10 13 16 19 22 25 28 31 34 37 40 43 46 49 52
Strain N Strain S
22/12.5°C
0
20
40
60
80
100
1 4 7 10 13 16 19 22 25 28 31 34 37 40 43 46 49 520
20
40
60
80
100
1 4 7 10 13 16 19 22 25 28 31 34 37 40 43 46 49 52
Strain N Strain S days
18°C
18°C
21.5/6°C
Figure 9. Cumulative percentages of egg-laying (on the left) and surviving (on the right) females of two strains of O.laevigatus reared at five temperature regimes and matched photoperiod (11.5L:12.5D; exposure 1, χ2 test, P < 0.05)and transferred to 26°C (16L:8D) after 29 days (exposure 2, χ2 test, P > 0.05) (Experiment 3).

243
A
FECT. FEC1
STRAIN Main EffectF(1, 457)=5.83; P < .0162
Strains
Dep
ende
nt v
aria
bles
0
10
20
30
40
50
60
70
80
N S
B
FECT.FEC1
REGIMES Main EffectF(4, 457)=7.94; P < .0000
Regimes
Dep
ende
nt v
aria
bles
-10
0
10
20
30
40
50
60
70
80
90
1 2 3 4 5
C
FECT. FEC1
2-way interactionF(4, 457)=1.15; P < .3344
1Regime
Dep
ende
nt v
aria
bles
0
20
40
60
80
100
Strains N S
2Regime
N S
3Regime
N S
4Regime
N S
5Regime
N S
Figure 10. Main effects of strain (A), thermoperiod (B) and their interaction (C), found in experiment 3 in the co-variance analysis (ANCOVA, table 29). (N = northern strain, S = southern strain) (FECT total fecundity, FEC1fecundity during exposure 1 at different thermoperiods used as covariate) (Regimes: 1 = 24/12.5°C; 2 = 26/15°C;3 = 21.5/6°C; 4 = 22/12.5°C; 5 = 18°C constant).

244
Table 33. Pooled means (± SD) of total fecundity (ex-posure 1 + 2) considering all the temperature regimesto which the two strains of O. laevigatus were ex-posed. The full populations were considered. Differentletters indicate significant differences by ANCOVA(P < 0.01) (Experiment 3).
Strain N Strain STotal fecundity(exposure 1+2) 45.7 ± 54.1 a 74.1 ± 64.5 b
The lowest fecundity was found for O. laevigatusstrains N previously reared at 26°C/15°C and then trans-ferred to 26°C (exposure 2). It was, however, not sig-nificantly different from that of the females of the samestrain reared before at 18°C constant, at 24°C/12.5°Cand at 21.5°C/6°C (table 32). The adjusted meansshowed that the smallest effects of a change in exposi-tion were recorded respectively at the temperature re-gimes 26°C/15°C for strain N and 26°C/15°C and24°C/12.5°C for strain S. This is the effect of a higherfecundity during the first exposition, which is confirmedby the test of parallelism that correlates the trend of thetotal fecundity with the covariate (fecundity at exposure1) (table 29). The total fecundity of strain S at the end ofthe experiment (exposure 1+2) is significantly higherthan that of strain N (table 33). The thermoperiod of21.5°C/6°C induced the females to lay the lowestamount of eggs (table 34).
At the end of the experiment, no differences amongthe percentages of fertile females and the infertile fe-males (both groups only with mature oocytes) were re-corded (χ2 test, P > 0.05), while a significant differencewas recorded among the percentages of infertile females
without mature oocytes of strain S (table 35). The per-centages of diapausing females at the end of experiment3 were very low (figure 11).
The percentages of egg-laying and of surviving fe-males are shown in figure 9. At the end of the experi-ment, the percentages of surviving females are similarfor both strains at all temperature regimes. No differ-ences in the percentages of surviving females were re-corded either at the end of exposure 1 or at the end ofexposure 2 between strains as well as among tempera-ture regimes (χ2 test, P > 0.05).
The correlation between fecundity and mature oocytesper females was significant (P < 0.001), but weak (R =0.44). All females were considered together, independ-ently from strain and the exposure (y = 43.6 + 6.7x).
0%
25%
50%
75%
100 %
24/12 .5 °C
26 /15°C
21 .5 /6°C
22/12.5°C18°C
24/12.5°C
26 /15°C
21 .5 /6°C
22/12.5°C18°C
Stra in N Stra in S
dia pau sing fe m a le s no n d ia pa usin g fe m a le s
Figure 11. Percentages of egg-laying (= non-diapausing)females and non-egg-laying (= diapausing) femaleswith oocytes at the end of the experiment (Experiment3), at different Temperature regimes.
Table 34. Pooled means (± SD) of total fecundity (exposure 1 + 2) of all data of strains N and S of O. laevigatus.Different letters indicate significant differences by ANCOVA (P < 0.05) (Experiment 3).
Temperature regime(°C) 24/12.5 26/15 21.5/6 22/12.5 18 constant
Total fecundity(exposure 1+2) 67.7 ± 61.3 b 73.5 ± 66.0 b 45.4 ± 52.9 a 75.5 ± 59.9 b 64.4 ± 56.3 b
Table 35. Percentages of fertile and infertile females with mature oocytes 24 hours after the end of the experiment 3(χ2 test) (Experiment 3).
Strain N Strain S
Temperatureregime (°C)
No. offemales
% Fertilefemale with
oocytes
% Infertilefemale with
oocytes
% Infertilefemalewithoutoocytes
No. offemales
% Fertilefemale with
oocytes
% Infertilefemale with
oocytes
% Infertilefemalewithoutoocytes
24/12.5 48 56.3 4.2 18.8 51 52.9 0 3.926/15 48 56.3 4.2 8.3 48 60.4 0 10.4
21.5/6 42 47.6 2.4 28.6 38 34.2 2.6 31.622/12.5 48 70.8 0 18.8 47 48.9 0 8.5
18 constant 45 60.0 0 17.8 47 61.7 4.3 19.1χ2 P>0.05 P>0.05 P>0.05 P>0.05 P>0.05 P<0.005 *

245
Table 36. Cumulative percentage of egg-laying females of two strains of O. laevigatus (N = strain N and S = strainS) collected in nature in Italy and checked monthly at different intervals in the laboratory (26°C; 75% RH; 16L:8D)(Experiment 4).
Cumulative percentage of egg-laying females after a certainnumber of days from isolation at 26°C and 16L:8D
Strain Test period No. offemales day 3 day 7 day 10 day 12 day 21 (total
%)N August 9 77.8 77.8 77.8 77.8 77.8N September 11 100 100 100 100 100N October 20 45.0 60.0 65.0 70.0 70.0N November 38 2.6 39.5 42.1 47.4 47.4N December 18 16.7 55.6 61.1 61.1 61.1N January 13 38.5 84.6 92.3 100 100
χ² test P<0.001 P<0.001 P<0.001 P<0.001 P<0.005S August 20 100 100 100 100 100S October 39 87.2 89.7 89.7 89.7 89.7S November 33 42.4 72.7 78.8 78.8 78.8S December 46 41.3 82.6 84.8 84.8 84.8S January 55 58.2 89.1 90.9 90.9 90.9S February 62 80.6 100 100 100 100
χ² test P<0.001 P<0.001 P<0.01 P<0.01 P<0.01
Incidence of diapause in field collected populationsE x p e r i m e n t 4
Adult females collected in nature and kept in a mete-orological cabin continued to lay eggs up to mid-November. After that the mean daily temperature de-creased to ca. 7.5°C (range 0°C-12.8°C) and many fe-males stopped laying eggs. Some egg-laying occurredagain in February when the temperature was around10°C (range 0°C-17.6°C).
At all times, high percentages of egg-laying femaleswere obtained within a few days after moving themfrom low temperature regime to optimal environmentalconditions. Only in November, strain N did not exceed48% egg-laying females within 21 days (table 36).When females were transferred from the field to thelaboratory during experiment 4, differences in the per-centage of egg-laying females of both strains of O.laevigatus were recorded (χ² test; P < 0.001 and P < 0.01)(table 36). The lowest percentages egg-laying femaleswere observed during the period October-December forstrain N and November-December for strain S.
Discussion
Tauber et al. (1986) report that the successful entryinto dormancy is determined by the insect's ability toreach the stage sensitive to diapause - inducing - stimuliat the appropriate time of the year. If it reaches thatstage too soon, diapause will not be induced and an en-tire life cycle must take place before diapause can beinduced. By contrast, if development is too slow, theinsect may not reach the diapausing stage soon enoughto avoid the effects of unfavourable conditions.
Because all the Orius species known to undergodiapause show a reproductive diapause, the criteria usedto diagnose diapausing or non-diapausing females in thepresent experiments were the same as those used by other
authors (Ali and Ewiess, 1977; Ruberson et al., 1991; vanden Meiracker, 1994). This means that if females did notstart to lay eggs within 29 days after emergence, or if fe-males did not have mature oocytes at the end of the ex-periment, they were considered in diapause.
Influence of photoperiodD e v e l o p m e n t t i m e
For insects which are sensitive to the photoperiod, the‘critical photoperiod’ is defined as the length of the day atwhich 50% of the sensitive stages of the insect will enterdiapause (Tauber et al., 1986; Danks, 1987). The criticalphotoperiod varies from species to species as well aswithin the same species for strains occurring at differentgeographical areas. Some insects perceive the photo-period just as long or short-day (all or none) (Tauber andTauber, 1976; Tauber et al., 1986). Therefore, the varia-tions in day-length below or above the critical photo-period are not appreciated by some arthropods, as re-corded for example for Panonychus ulmi (Koch) (Lees,1953) and for Wyeomyia smithii (Coquillet) (Smith andBrust, 1971; Tauber and Tauber, 1975). The contrary wasobserved for other arthropods such as Chrysopa harrisiiFitch (Tauber and Tauber, 1974) and Adalia bipunctata(L.) (Obrycki et al., 1983). Their reaction to a criticalphotoperiod decreases as diapause progresses. These ex-amples show the limits of the concept of critical photo-period, because for some insects not only the criticalphotoperiod but also the gradual change in day-length caninfluence diapause induction and termination as observedfor C. carnea (Tauber and Tauber, 1972; 1973; Tauberet al., 1986).
The influence of photoperiod on the development timeand adult lifespan of insects was studied by manyauthors (e.g. Danilevskii, 1961; 1970; De Wilde, 1962;Tauber and Tauber, 1976; 1978; Beck, 1980; Saunders,1982; Principi, 1992). Insects can use photoperiods toregulate their pre-diapause developmental rates, and to

246
keep growth and development synchronous with theprogression of the seasons (Tauber et al., 1986). Inmany examples, a slow down in development occursduring the actively feeding pre-diapause stages. At thesame time, accelerated feeding rates were observed re-sulting in storage of energy. In some species, short-day-lengths accelerate development and long-day-lengthsdecelerate it, but in other species it is short-day-lengthwhich causes a deceleration (Tauber et al., 1986).
In the studies described in this paper, the preimaginaldevelopment time of O. laevigatus was shortened byshort day-lengths compared to that occurring at long day-lengths. A similar relationship for preimaginal develop-ment has been observed for O. insidiosus (Ruberson etal., 1991), but it is not always the same among Heterop-tera and for Orius species (van den Mairacker, 1994).
O. laevigatus, as well as other Orius species (Ruber-son et al., 1991) and many other insects which enter re-productive diapause during winter, show a long-dayphotoperiodic response curve.
Under each experimental condition, a low percentage ofO. laevigatus was able to complete pre-imaginal devel-opment, and the differences recorded indicate that photo-period can influence both strains of O. laevigatus. In ex-periment 1, the longest developmental times were re-corded mainly around the photoperiod 12L:12D for bothstrains, while the short-day photoperiod of 8L:16D in-duced a faster development in both strains. At a long-dayphotoperiod of 16L:8D, the two strains showed an oppo-site response: deceleration of development for strain Sand acceleration for strain N. When short day-lengthswere compared in experiment 2, the intermediate photo-periods 11.5L:12.5D and 12L:12D also induced the long-est development time in both strains. An acceleration ofthe development time induced by intermediate day-lengthcompared to long day-length (16L:8D) was recorded forsome Orius species which undergo hibernation (McGre-gor and McDonough, 1917) such as O. insidiosus at10L:14D (Ruberson et al., 1991) and O. tristicolor at12L:12D (Askari and Stern, 1972). This accelerating ef-fect of the development time at short day-length wasdemonstrated for other Hemiptera, e.g. Pyrrhocoris ap-terus (L.) (Saunders, 1983), Palomena angulosaMotschulsky (Hori, 1986; 1987; 1988), Eysarcoris lewisiDistant (Hori and Inamura, 1991) and Podisus maculi-ventris Say (Chloridis et al., 1997). However, van denMeiracker (1994) did not find a strict relationship be-tween photoperiod and development time in the speciesO. insidiosus and O. majusculus. Also, there are exam-ples of diapausing insects which show a deceleration ofthe development time at short day-length as Nezaraviridula L. (Ali and Ewiess, 1977) and Harmonia axy-ridis (Pallas) (Ongagna and Iperti, 1994). For O. laevi-gatus, as well as for O. insidiosus (Ruberson et al., 1991),photoperiod induced changes in development time maynot necessarily be symptomatic of diapause, but rathermay be used to prepare the insect for diapause. O. laevi-gatus shows an opposite behaviour which is very differ-ent from other Orius species that undergo diapause. Atthe hypothetical critical photoperiod, this species showedan increase of the development time. Experiments 1 and 2were carried out at 18°C and this temperature was low
enough to increase the development time and to induce ahigher pre-imaginal mortality of O. laevigatus (Tommasini,in press; Vacante and Tropea Garzia, 1993).
P r e - o v i p o s i t i o n a n d r e p r o d u c t i o nThe pre-oviposition period is a good indicator for how
an adult population reacts to external stimuli and it isoften significantly influenced by photoperiod. In fertilefemales a great variability was recorded, mainly in ex-periment 1. The longest pre-oviposition periods wererecorded at the intermediate photoperiod 11.5L:12.5Dfor both strains. The variability of the data within thesame strain observed during the experiments is similarto the common intra-specific variability which occurs inother insects (Tauber et al., 1986; Danks, 1987).
Photoperiod showed no influence on the ovipositionactivity of strain S compared to strain N in experiment1. However, all groups of strains S and N showed alower percentage of egg-laying females in comparisonto strain N reared at 16L:8D. Photoperiod strongly af-fected oviposition of strain N. A photoperiod 12L:12Dinduced a reduction in both the number of eggs laid perfemale and the percentage of egg-laying females, com-pared with 16L:8D. Experiment 1 showed that a criticalphotoperiod for diapause induction could be around12L:12D hours. This induced a long development timein both O. laevigatus strains and a low oviposition ratein strain N. In test 1 of experiment 1, only 31.7% of fe-males of the strain N laid eggs and in test 2 of the sameexperiment only one female of the same strain laid eggsafter 23 days of adult life. The low percentages of egg-laying females in strain S (all day-lengths) and in strainN (short and intermediate day-lengths) could indicate ahigh incidence of reproductive diapause, according tothe criteria of van den Meiracker (1994). The lack of aphotoperiodical response in the oviposition activity ofstrain S suggests, however, that in Sicily or at lowerlatitudes, O. laevigatus may overwinter in quiescence,or that only a low percentage of the population under-goes diapause.
Furthermore, a low temperature such as 18°C reducesthe oviposition capability of O. laevigatus like in otherOrius species (Alauzet et al., 1994; Tommasini andBenuzzi, 1996) even at a long photoperiod. This de-creased oviposition does not mean that diapause induc-tion has occurred. Short day-lengths between 8L:16Dand 12L:12D strongly influenced strain N to initiatediapause, but not in strain S.
Therefore, to study the existence of diapause in strainS, further studies were needed. These studies concernedthe influence of photoperiods around 12L:12D. The ef-fect of the increase of temperature after a period at18±1°C (pre-imaginal development and part of adultlife) were tested also for O. majusculus and O. insidio-sus (van den Meiracker, 1994). In experiment 2, thecritical photoperiod for strains S appeared to be between11.5L:12.5D and 12L:12D, with a longer developmenttime, lower fecundity and mainly lower percentage ofegg-laying females during the initial 29 days of adultlife. But when the environmental condition wereswitched to 26°C and 16L:8D, most females (>90%)suddenly started to lay eggs. During adult life, the two

247
strains of O. laevigatus reacted differently to the differ-ent photoperiods. In particular the fecundity of strain Nseemed to be less influenced by a narrow range of pho-toperiods compared to that of strain S. In fact, somespecies of insects living in southern areas (mainly nearthe tropics) frequently react much more to smallchanges of photoperiod than the same species living innorthern areas, which are exposed to a much largervariation in photoperiod during the year (Beck, 1980).Among insects reared at an intermediate photoperiod,the incidence of diapause was higher when temperaturewas relatively low than if it was relatively high(Danilevski, 1961; Beck, 1980).
The beginning of oviposition of hibernating femalesunder diapause-promoting photoperiods has been con-sidered to indicate the completion of diapause (Tauberand Tauber, 1976). The length of the pre-ovipositionperiod could be a parameter to study the intensity of re-productive diapause in long-day conditions, as consid-ered by Hodek and Honek (1970) for another heterop-teran, Aelia acuminata (L.).
It is known that latitude and altitude can have an effecton the photoperiodic response of insects. Saunders(1982) and Danks (1987) report that the critical photo-period changes to longer values with increasing latitude.The intensity of diapause was found to be greater innorthern than in southern populations of several insectsspecies (Beck, 1980).
In experiment 2 differences in fecundity were re-corded between the two strains of O. laevigatus, butthey were not caused by a difference in photoperiods.Only strain N showed differences in the percentage offertile and infertile females with mature oocytes at theend of the experiment. It appears that for O. laevigatusalso the geographical origin plays a specific role in thediapause induction or at least on some biological pa-rameters. Several authors made a list of species whichshowed differences in critical photoperiod betweenpopulations from different latitudes (Masaki, 1961;Beck, 1080; Danks, 1987). A low incidence of diapausein more southern populations was observed in severalinsect species exposed to a short photoperiod (Danks,1987). Geographical differences in the photoperiodicresponse at different localities at the same latitude havebeen investigated for a number of species. Populationsof Laodelphax striatellus (Fallén) occurring in morenorthern areas have evolved a geographical strain en-tering diapause in earlier instars compared to that ofmore southern regions (Kisimoto, 1989). Mamestrabrassicae (L.) as well as C. carnea showed a shortercritical photoperiod at more northern than more south-ern latitudes (Danilevskii, 1961; Tauber and Tauber,1972).
Influence of temperatureD e v e l o p m e n t t i m e a n d r e p r o -d u c t i v e p e r i o dThe interaction between temperature and photoperiodmay be important for diapause induction and intensifi-cation (Honek, 1969; Beck, 1980; Volkovich et al.,1992). Kingsley and Harrington (1982) as well as vanden Mairacker (1994) demonstrated this interaction also
for diapause termination of O. insidiosus. Temperaturecan influence the critical photoperiod, and a high tem-perature generally prevents diapause induction (Beck,1980; Danks, 1987; Volkovich et al., 1992). Undernatural conditions, insects are exposed to thermoperiodsin combination with photoperiods, where night-timetemperatures are generally lower than daytime tem-peratures. For this reason, thermoperiods were usedduring experiment 3 instead of constant temperatureused in the past by many authors to study this phenome-non. A mean temperature of 20°C (thermoperiod26°C/15°C) combined with a short-day-length, seemsenough to prevent diapause in at least 64.6% of femalesof strain N and in more than 85% of strain S of O.laevigatus. This was also found for other insects likeCorythucha cydoniae (Fitch) where diapause did notoccur in at least 25% of the population at high tem-peratures and short daylength. Neal et al. (1992) are ofthe opinion that a mean temperature of about 20°Ccombined with a short-day-length can reduce diapauseintensity. Thermal modification of photoperiod is rathercommon in insects.
The influence which the temperature can have on thebiology of O. laevigatus, (mainly on strain S), is dem-onstrated by the high pre-imaginal mortality and lowpercentage of fertile females recorded at the mean tem-perature regime of 16.5°C. As already discussed, Oriusspp. are rather sensitive to low temperatures independ-ently from photoperiod. Chyzik et al. (1995) studied anIsraelian strain of O. albidipennis and found that a meantemperature below 15°C leads to an interruption of ovi-position irrespective to day-length until the temperatureincreases. High temperatures can avert diapause in long-day insects. De Wilde (1962) and Masaki (1984) re-ported a great variation in reaction types of diapausewhich can occur among different geographic popula-tions of the same species at the same temperature stim-uli. Commonly, higher environmental temperatures arerequired to avert diapause induction among the northernforms than among the southern forms of the same spe-cies (Beck, 1980). In fact, strain S of O. laevigatusshowed to be less sensitive to the different temperatureregimes tested with, on average, a shorter pre-oviposition period (9.4 days) than strain N (13.3 days),as well as a higher percentage of egg-laying females. Ina variety of species adaptation to low latitude is relatedmore closely to environmental temperature patterns thanto day-length effects associated with differences in lati-tude (Beck, 1980). Low temperature did induce diapausein several species of flies close to the equator, when day-length changed by only a few minutes throughout theyear and, therefore, photoperiod was not found to play arole in diapause induction (Saunders, 1982).
In O. laevigatus a difference in diapause reaction wasrecorded for both strains when tested at the temperatureof 18°C constant or at thermoperiod 24°C/12.5°C with amean temperature of 18°C. The constant temperatureregime induced a pre-oviposition period almost twotimes longer than that at the varying temperature re-gime. A similar result was found by Rudolf et al.(1993), who observed reduced longevity and fecundityof both O. laevigatus and O. majusculus at low constant

248
temperatures, compared to a thermoperiod with thesame average. These results are not in agreement withthe theory put forward by Beck (1977), in which thegrowth-rates produced at the thermoperiods are rathersimilar to those produced at comparable average tem-peratures.
The results of the dissection of females at the end ofthe third experiment made clear that the conclusionstating that females which did not lay eggs were indiapause, was incorrect. These results allow us to con-clude (1) that O. laevigatus is influenced by short day-length and low temperature regimes to initiate diapause,(2) that only part of the population reacts to these tokenstimuli by entering diapause, and (3) that the northernstrains are more sensitive to these stimuli than thesouthern strains.
Incidence of diapause in field collected populationsBoth strains of O. laevigatus used in experiment 4
were collected in the field and immediately tested inlaboratory. This was done to prevent the possibility ofselecting a strain where the sensitivity to a short-day-length is lost under laboratory conditions, like Hodekand Honek (1970) found for A. acuminata. When col-lecting O. laevigatus, only a low number of males werefound (sex ratio of 1 male to 10 females), but males ofO. laevigatus commonly live shorter than females.When collecting O. tristicolor and O. insidiosus, maleswere also rarely found in the field during winter (An-derson, 1962; Iglinsky and Rainwater, 1950; Kingsleyand Harrington, 1982). Frequent mating was observedduring our experiments at different environmental con-ditions. Because mating usually does not occur duringdiapause (Tauber et al., 1986) an observation of matingcould suggest the absence of diapause for at least part ofthe population of O. laevigatus. Although mating wasobserved also by Ruberson et al. (1991) for O. insidio-sus in the laboratory under short day-length, recentstudies failed to recover males of O. insidiosus duringthe late winter and early spring (Elkassabany et al.,1996) and overwintering females appear to be insemi-nated before winter (Elkassabany, 1994).
Iglinsky and Rainwater (1950) showed that females ofO. insidiosus collected during winter in the USA laidonly ten eggs during the 45 days they were alive. Morerecently, Elkassabany et al. (1996) demonstrated that allthe females of O. insidiosus collected in Arkansas(USA) at the beginning of November were in diapause.This confirms Ruberson et al.’s (1991) data, since O.insidiosus showed a critical photoperiod which corre-sponded with that of mid-October in the same area. Arecent laboratory study carried out in Brasil from Ar-golo et al. (2002) showed that O. insidiosus did not en-ter in reproductive diapause at any of 6 photoperiodswith ranged from 9L:15D to 14L:10D, at the constanttemperature of 25±1°C and RH 70±10%. This resultscan be due to the behaviour of a strain of O. insidiosuscollected in Brasil respect those studied by other authorswhom collected the predators in North America.
O. laevigatus has a different behaviour compared tothat of O. insidiosus or other Orius species. In particu-lar, the females of strain S of O. laevigatus collected in
winter reacted quite suddenly to an increased tempera-ture by starting to lay eggs. A quicker reaction of strainS to begin laying eggs was found during almost the en-tire winter compared to strain N. The geographical ori-gin of the two strains strongly influenced the start of theoviposition. Throughout autumn and winter, at least79% of females of strain S started to lay eggs ten daysafter moving the females from the field (low tempera-ture) to the laboratory (26°C), while in strain N onlyabout 48% of the females moved to 26°C laid eggs inNovember. This suggests that in nature, diapause is in-duced in strain N of O. laevigatus when day-length andtemperature decrease in autumn. The differences in re-action to critical photoperiod between these strains arelarge enough to propose the existence of two ecotypesof O. laevigatus. Further, it seams reasonable to con-clude that in both strains of O. laevigatus, only part ofthe population undergoes diapause and an intensive,obligatory diapause seems to lack.
It is not easy to define the overwintering behaviour ofO. laevigatus with one of the descriptions of diapausegiven by different authors. However, according toMü ller’s classification (1970), which is used by manyauthors in Europe, it is possible to say that the northernstrain of O. laevigatus shows an oligopause while thesouthern strain shows only a quiescence form of over-wintering. Other authors prefer to describe this oli-gopause as ‘facultative diapause’ (Beck, 1980), whereasTauber et al. (1986) point out that for ‘non-diapause’overwintering forms the definition ‘multivoltinediapause’ is more reliable than ‘facultative diapause’.
Conclusions
The presence or absence of diapause is an importantcriterion to select a good natural enemy, mainly whenthe pest can overwinter without undergoing diapause.This is true for both predatory insects and mites. For ex-ample, when diapausing strains of Amblyseius (=Neoseiulus) cucumeris (Oudemans) were released inwinter or early in spring, they were not successful incontrolling WFT (van Houten and van Stratum, 1993).
Diapause appears to be a widespread phenomenonamong Heteropteran predators in temperate areas. It hasan important function in enhancing survival during ad-verse seasons and in synchronizing the predators withprey in spring. However, when such predators are usedagainst prey lacking diapause (i.e. F. occidentalis), theimportance of understanding if a species or a strain cansynchronize its behaviour with that of the target prey isvery important and useful for biological control.
No specific studies were previously carried out on theinfluence of photoperiod and temperature on thediapause induction of strains of O. laevigatus. Onlysome information was available on a southern Italianstrain (Vacante et al., 1995) where photoperiod did notseem to influence fecundity.
One of the main findings of these studies is that anorthern (N) and a southern strains (S) of O. laevigatusare different. The difference in behaviour observed al-lows us to distinguish two ecotypes of this species.

249
Northern strains showed a weak diapause, while thesouthern population demonstrated a very low incidenceof diapause and most of the individuals seem to haveonly a quiescence form of overwintering. However, alsothe southern strain of O. laevigatus appeared to bestrongly influenced by low temperature.
Adults of O. laevigatus of both N and S strain, col-lected in nature in autumn-winter, then kept under fieldconditions, and eventually transferred after a certain pe-riod to controlled and optimal environmental conditions,showed that part of the females of strain N undergo re-productive diapause during November. However, theirdiapause could be considered rather short, because thepercentage of egg-laying females increased a lot just amonth later, in December.
The southern strain (strain S) collected on Sicilyshowed no evident response to the photoperiod, indi-cating that they can overwinter in quiescence or thattheir eventual diapause, if any, is weak. Therefore, itseems that strains collected at low latitudes can remainactive also during short-day-length periods, if tempera-ture is high enough, confirming the finding of Chamberset al. (1993). Moreover, the natural distribution of O.laevigatus in areas with marine influence (Péricart,1972) and the good performances at high temperatures(Alauzet et al., 1994) indirectly explain the effective-ness of this species also during the hot season in boththe Mediterranean area and northern Europe.
The intrinsic variation among individuals that wefound seems to be a characteristic of many diapause re-sponses in other species (Danks, 1987). Commonlydiapause incidence and intensity tend to increase with ahigher latitude and altitude and the intrinsic features ofthe diapause response interact with environmental factors.Often the critical photoperiod is longer and the initiatingtemperature is lower for northern strains (Danks, 1987).
While an insect’s diapause response is geneticallybased, environmental conditions determine the expres-sion of diapause (Tauber et al., 1986). Other stimuli,e.g. food abundance and quality or changing versusstatic photoperiods, can influence diapause in interac-tion with photoperiod and temperature (Tauber et al.,1986). Low quality food can shift the critical photo-period for predatory Heteroptera, but only slightly (Ru-berson et al., 1998). Because we did not compare sev-eral food resources, we do not know how food influ-ences diapause in O. laevigatus. The importance offeeding for diapausing adult predators is unclear, al-though diapausing Heteropteran predators without preydid not survive better than starved non-diapausingpredators. It could be that Heteropteran species mustlocate overwintering areas where some prey is available(Ruberson et al., 1998).
To correctly describe the diapause of O. laevigatus isnot an easy task. When we summarise the important ele-ments of diapause given by several authors, it is possibleto distinguish two main criteria to define the intermediateform of diapause that we found for O. laevigatus:• presence or absence of a physiological adaptation• degree of reaction to the environmental conditions
that induce and terminate dormancy (diapause).
Interpretation of these criteria results in the conclusionthat the N strain of O. laevigatus shows a dormancysimilar to an ‘oligopause’(according to Müller, 1970) ora diapause with a low intensity (according to Mansingh,1971). For strain S we may speak of a ‘quiescence’mainly influenced by temperature.
The applied importance of this diapause study in O.laevigatus is the following. For natural enemies used inbiological control of thrips during winter and earlyspring, it is essential that they do not enter diapause.This resulted in a search for non-diapausing naturalenemies of thrips for winter and spring when seasonalinoculative releases are necessary. The finding thatsouthern (in this case Sicilian) strains of O. laevigatusdoes not show diapause but quiescence is an importantresult to improve biological control of thrips.
The southern Italian strain of O. laevigatus is cur-rently produced and commercially used on large scale inEurope to control thrips species in vegetable and orna-mental crops, mostly in protected crops.
Acknowledgements
This research was financially supported by the EC-project CAMAR (n. 8001-CT90-0026). The late Dr G.Nicoli and Prof. S. Maini are thanked for critical read-ing of the manuscript and Dr G. Burgio is thanked forhis support on statistical analysis.
References
ALAUZET C., DARGAGNON D., MALAUSA J. C., 1994.- Bi-onomics of a polyphagous predator: Orius laevigatus (Het.:Anthocoridae).- Entomophaga, 39 (1): 33-40.
ANDERSON N. H., 1962.- Anthocoridae of the Pacific North-west with notes on distributions, life history, and habits(Heteroptera).- The Canadian Entomologist, 94: 1325-1334.
ARGOLO V. M., BUENO V. H. P., SILVEIRA L. C. P., 2002.-Influencia do fotoperiodo na reproducao e longevidade deOrius insidiosus (Say) (Heteroptera: Anthocoridae).- Neo-tropical Entomology, 31 (2): 257-261.
BAILOV D., 1929.- Contribution to the study of the control oftobacco thrips in Bulgaria.- Rev. Inst. Rech. agron. Bulgarie,4 (4/5): 21.86 (in Bulgarian), in: Review of Applied Ento-mology A, 18: 153 (1930).
BECK, D., 1980.- Insect photoperiodism.- Academic Press,New York.
BRØDSGAARD H. F., 1994.- Insecticide resistance in Europeanand African strains of western flower thrips (Thysanoptera:Thripidae) tested in a new residue-on-glass test.- Journal ofEconomic Entomology, 87 (5): 1141-1146.
CHAMBERS R. J., LONG S., HELYER N. L., 1993.- Effectivenessof Orius laevigatus (Hem.: Anthocoridae) for the control ofFrankliniella occidentalis on cucumber and pepper in theUK.- Biocontrol Science and Technology, 3: 295-307.
CHLORIDIS A. S., KOVEOS D. S., STAMOPOULOS D. C., 1997.-Effect of photoperiod on the induction and maintenance ofdiapause and development of the predatory bug Podisusmaculiventris (Het.: Pentatomidae).- Entomophaga, 42 (3):427-434.
CHYZIK R., KLEIN M., BEN-DOV Y., 1995.- Overwintering bi-ology of the predatory bug Orius albidipennis (Hemiptera:Anthocoridae) in Israel.- Biocontrol Science and Technol-

250
ogy, 5 (3): 287-296.DANKS H. V., 1987.- Insect dormancy: An ecological per-
spective.- Biological Survey of Canada, Ottawa.DANILEVSKII A. S., 1961.- Photoperiodism and seasonal de-
velopment of insects.- Oliver & Boyd, London.DE WILDE J., 1962.- Photoperiodism in insects and mites.-
Annual Review of Entomology, 7: 1-26.DEL BENE G., GARGANI E., 1989.- Contributo alla conoscenza
di Frankliniella occidentalis (Pergande) (ThysanopteraThripidae).- Redia, 72 (2): 403-420.
ELKASSABANY N., RUBERSON J. R., KRING T. J., 1996.- Sea-sonal distribution and overwintering of Orius insidiosus(Say) in Arkansas.- Journal of Entomological Science, 31:76-88.
GILLESPIE D. R., QUIRING D. M. J., 1993.- Extending seasonallimits on biological control.- IOBC/wprs Bulletin, 16 (2):43-45.
GORYSHIN N. I., 1964.- The influence of diurnal light andtemperature rhythms on diapause in Lepidoptera.- Entomo-logical Review, 43: 43-46.
HODEK I., 1973.- Biology of Coccinellidae.- Junk, The Hague;Academia, Prague.
HODEK I., HONEK A., 1970.- Incidence of diapause in Aeliaacuminata (L.) population from southwest Slovakia (Heter-optera).- Vestnìk Ceskoslovenské Spolecnosti Zoologické,34: 170-183.
HONEK A., 1969.- Induction of diapause in Aelia acuminata(L.) (Heteroptera, Pentatomide).- Acta Entomologica Bohe-moslovaca, 66: 345-351.
VAN HOUTEN Y. M., VAN STRATUM P., 1993.- Biological con-trol of western flower thrips in greenhouse sweet pepperusing non-diapausing predatory mites.- Proceedings of theSection Experimental and Applied Entomology of the Net-herlands Entomological Society, N.E.V. Amsterdam, 4: 229-234.
IGLINSKY W. JR., RAINWATER C. F., 1950.- Orius insidiosus,an enemy of spider mite on cotton.- Journal of EconomicEntomology, 43: 567-568.
IMMARAJU J. A., PAINE T. D., BETHKE J. A., ROBB K. L.,NEWMAN J. P., 1992.- Western flower thrips (Thysanoptera:Thripidae) resistance in coastal California greenhouses.-Journal of Economic Entomology, 85 (1): 9-14.
KINGSLEY P. C., HARRINGTON B. J., 1982.- Factors influenc-ing termination of reproductive diapause in Orius insidiosus(Hemiptera: Anthocoridae).- Environmental Entomology, 11(2): 461-462.
KISIMOTO R., 1989.- Flexible diapause response to photo-period of a laboratory selected line in the small brownplanthopper, Laodelphax striatellus Fallén.- Applied Ento-mology and Zoology, 24 (1): 157-159.
LACASA A., 1990.- Datos de taxonomia, biologia y comporta-mento de Frankliniella occidentalis.- Phytoma España, 14(4): 9-15.
LEATHER S. R., WALTERS K. F. A., BALE J. S., 1993.- Theecology of insect overwintering.- Cambridge UniversityPress, Cambridge.
LEES A. D., 1953.- Environmental factors controlling the evo-cation and termination of diapuse in the fruit tree and redspider mite Metatetranychus ulmi Kock (Acarina: Tetrany-chidae).- Annals of Applied Biology, 40: 449-486.
LEES A. D., 1955.- The physiology of diapause in Arthropods.-Cambridge University Press, Cambridge.
MANSINGH A., 1971.- Physiological classification of dorman-cies in insects.- The Canadian Entomologist, 103: 983-1009.
MARULLO R., 1991.- Frankliniella, biologia e strategie di dife-sa.- Terra e Vita, 31 (15): 72-73.
VAN DEN MEIRACKER R. A. F., 1994.- Induction and termina-tion of diapause in Orius predatory bugs.- Entomologia Ex-perimentalis et Applicata, 73: 127-137.
MITCHELL R., 1981.- Insect behavior, resource exploitation,and fitness.- Annual Review of Entomology, 26: 373-396.
MÜLLER H. J., 1970.- Formen der dormanz bei insekten.-Nova Acta Leopold, 35: 7-27.
NAKASHIMA Y., HIROSE Y., 1997.- Temperature effects ondevelopment of Orius tantillus (Het.: Anthocoridae), apredator of Thrips palmi (Thys.: Thripidae).- Entomophaga,42 (3): 337-342.
NASRUDDIN A., SMITLEY D. R., 1991.- Relationship of Frank-liniella occidentalis (Thysanoptera: Thripidae) populationdensity and feeding injury to the frequency of insecticideapplications to gloxinia.- Journal of Economic Entomology,84 (6): 1812-1817.
NEAL J. W., TAUBER M. J., TAUBER C. A., 1992.- Photoperi-odic induction of reproductive diapause in Corythucha cy-doniae (Heteroptera: Tingidae).- Environmental Entomol-ogy, 21 (6): 1414-1418.
OBRYCKI J. J., TAUBER M. J., TAUBER C. A., GOLLANDS B.,1983.- Environmental control of the seasonal life cycle ofAdalia bipunctata (Coleoptera: Coccinellidae).- Environ-mental Entomology, 12: 416-421.
ONGAGNA P., IPERTI G., 1994.- Influence of temperature andphotoperiod in Harmonia axyiridis Pall. (Col., Coccinelli-dae): rapidly obtaining fecund adults or in dormancy.- Jour-nal of Applied Entomology, 117 (3): 314-317.
PARKER N. J. B., 1975.- An investigation of reproductivediapause in two British populations of Anthocoris nemorum(Hemiptera: Anthocoridae).- Journal of Entomology, -A, 49:173-178.
PERICART J., 1972.- Hémiptères: Anthocoridae, Cimicidae etMicrophysidae de l'Ouest-paléarctique.- Masson, Paris.
PRINCIPI M. M., 1992.- Lo stato di diapausa negli insetti ed ilsuo manifestarsi in alcune specie di Crisopidi (Insecta, Neu-roptera) in dipendenza dell'azione fotoperiodica.- Bollettinodell’Istituto di Entomologia "G.Grandi" della Universitàdegli Studi di Bologna, 46: 1-30.
RUBERSON J. R., BUSH L., KRING T. J., 1991.- Photoperiodiceffect on diapause induction and development in the preda-tor Orius insidiosus (Heteroptera: Anthocoridae).- Environ-mental Entomology, 20 (3): 786-789.
RUBERSON J. R., KRING T. J., ELKASSABANY N., 1998.- Over-wintering and diapause syndrome of predatory Heteroptera,pp. 49-69. In: Predatory Heteroptera: their ecology and usein biological control. (COLL M., RUBERSON J. R., Eds).-Thomas Say Publications in Entomology, ESA, Lanham.
RUDOLF E., MALAUSA J. C., MILLOT P., PRALAVORIO R.,1993.- Influence des basses températures sur les potentialitésbiologiques d’Orius laevigatus et Orius majusculus (Het.Anthocoridae).- Entomophaga, 38 (3): 317-325.
SAUNDERS D. S., 1982.- Insect clocks.- Pergamon Press, Ox-ford.
SAUNDERS D. S., 1983.- A diapause induction-terminationasymmetry in the photoperiodic responses of the linden bug,Pyrrhocoris apterus and an effect of near-critical photoperi-ods on development.- Journal of Insect Physiology, 29 (5):399-405.
SMITH S. M., BRUST R. A., 1971.- Photoperiodic control of themantainance and termination of larval diapause in Wyeo-myia smithii (Coq.) with notes on oogenesis in the adult fe-male.- Canadian Journal of Zoology, 49: 1065-1073.
TAUBER M. J., TAUBER C. A., 1972.- Geographical variationin critical photoperiod and in diapause intensity of Chrysopacarnea (Neuroptera).- Journal of Insect Physiology, 19: 729-736.
TAUBER M. J., TAUBER C. A., 1974.- Thermal accumulation,diapause, and oviposition in a conifer-inhabiting predator,Chrysopa harrisii (Neuroptera).- The Canadian Entomolo-gist, 106: 969-978.
TAUBER M. J., TAUBER C. A., 1975.- Natural daylengths

251
regulate insect seasonality to two mechanisms.- Nature, 258:711-712.
TAUBER M. J., TAUBER C. A., 1976.- Insect seasonality:Diapause maintenance, termination, and postdiapause de-velopment.- Annual Review of Entomology, 21: 81-107.
TAUBER M. J., TAUBER C. A., MASAKI S., 1986.- Seasonaladaptations of insects.- Oxford University Press, Oxford.
THIELE H. U., 1973.- Remarks about Mansingh’s and Muller’sclassifications of dormancies in insects.- The Canadian En-tomologist, 105: 925-928.
TOMMASINI M. G..- Collection of Orius species in Italy.- Bul-letin of Insectology, in press.
TOMMASINI M. G., 2003.- Evaluation of Orius species forbiological control of Frankliniella occidentalis (Pergrande)(Thysanoptera: Thripidae).- Thesis Wageningen University,Ponsen & Looijen b. v., Wageningen.
TOMMASINI M. G., BENUZZI M., 1996.- Influence of tempera-ture on the development time and adults activity of Oriuslaevigatus.- IOBC/wprs Bulletin, 19 (1): 179-182.
TOMMASINI M. G., NICOLI G., 1993.- Adult activity of fourOrius species reared on two preys.- IOBC/wprs Bulletin, 16(2): 181-184.
TOMMASINI M. G., NICOLI G., 1994.- Pre-imaginal activity offour Orius species reared on two preys.- IOBC/wprs Bulle-tin, 17 (5): 237-241.
USHATINSKAYA R. S., 1976.- Insect dormancy and its classifi-cation.- Zoologische Jahrbücher. Abteilung für Systematik,Ökologie und Geographie der Tiere, 103 (1): 76-97.
VACANTE V., TROPEA GARZIA G., PUCCI C., CUCUZZA G. E.,1995.- Notes sur la biologie d’Orius laevigatus (Fieber). I.Influence de la photoperiode.- Mededelingen van de Facul-
teit van de Landbouwwetenschappen. Rijksuniversiteit Gent,60 (3a): 631-633.
VAN DE VEIRE M., DEGHEELE D., 1992.- Biological control ofthe western flower thrips, Frankliniella occidentalis (Per-gande) (Thysanoptera: Thripidae), in glasshouse sweet pep-per with Orius spp. (Hemiptera: Anthocoridae). A com-parative study between O. niger (Wolff) and O. insidiosus(Say).- Biocontrol Science and Technology, 2: 281-283.
VOLKOVICH T. A., SAULICH A. K., GORYSHIN N. I., 1992.-Day-length sensitive stage and accumulation of photoperi-odic information in the predatory bug Podisus maculiventrisSay (Heteroptera, Pentatomide).- Entomological Review, 70:159-167.
WILLIAMS C. M., 1952.- Physiology of insect diapause. Thebrain and prothoracic glands as an endocrine system in thececropia silk worm.- Biological Bulletin, 103: 120-138.
YANO E., 1996.- Biology of Orius sauteri (Poppius) and itspotential as a biocontrol agent for Thrips palmi Karny.-IOBC/wprs Bulletin, 19 (1): 203-206.
Authors’ addresses: Maria Grazia TOMMASINI (correspon-ding author, e-mail: [email protected]), CRPV - Centro Ri-cerche Produzioni Vegetali, via Vicinale Monticino 1969,4702 Diegaro di Cesena (FC), Italy; Joop C. VAN LENTEREN(e-mail: [email protected]) Laboratory of Entomol-ogy, Wageningen University, P.O. Box 8031, 6700 EHWageningen, The Netherlands.
Received May 5, 2003. Accepted September 30, 2003.