Embed Size (px)
Citation preview

OCCUPATIONAL HEALTH AND SAFETY AT THREE LOCAL SUGAR
FACTORIES
ASSESSING KNOWLEDGE, ATTITUDE AND PRACTICE OF FACTORY WORKERS
A Research PaperSubmitted in Partial Fulfillment of the Requirements for the Degree of Master of Science in Occupational & Environmental Health and Safety
AtThe University of the West Indies

BACKGROUND• This study assessed the knowledge,
attitude and practice of occupational health and safety of factory workers at three local sugar factories:- Two government owned and one
privately owned.- Two of the factories were rural and
one urban.
• The survey was conducted over the period March to May 2008.

Aim of Research• The research aimed to establish
differences, similarities, relationships and general trends among factory workers in terms of their knowledge, attitude and practice of health and safety, at all three locations.

THEORIES• It is widely believed that a worker’s attitude to
occupational safety and health is usually improved with increased awareness and knowledge of the risks and hazards present in his surroundings.
• Employees are more committed to health and safety if they have a say in setting work goals and controlling safety. (Richard Kelley, Worker Psychology and Safety Attitudes, July 1996, 14 -17)
• In theory, safety practice of workers depends on their attitude towards the risks associated with the various types of hazards that exists in their work place. Safe work practice also depends on knowledge about the danger and harmful effects of those hazards.
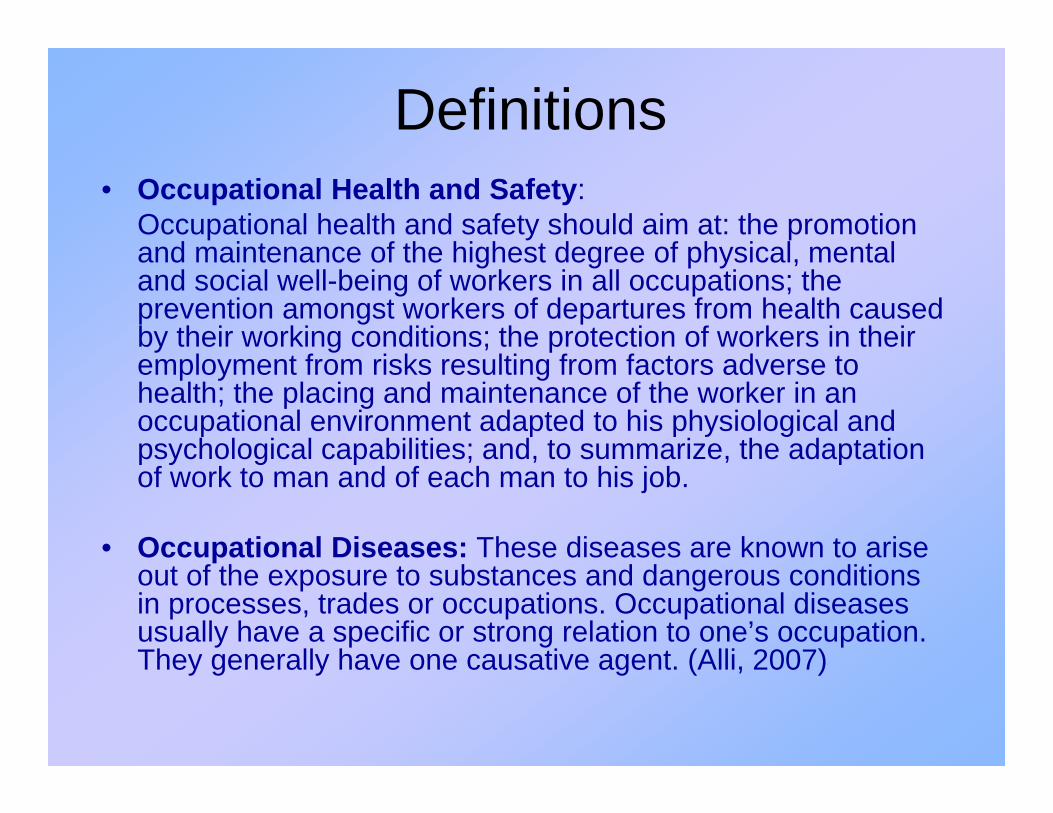
Definitions• Occupational Health and Safety:
Occupational health and safety should aim at: the promotion and maintenance of the highest degree of physical, mental and social well-being of workers in all occupations; the prevention amongst workers of departures from health caused by their working conditions; the protection of workers in their employment from risks resulting from factors adverse to health; the placing and maintenance of the worker in an occupational environment adapted to his physiological and psychological capabilities; and, to summarize, the adaptation of work to man and of each man to his job.
• Occupational Diseases: These diseases are known to arise out of the exposure to substances and dangerous conditions in processes, trades or occupations. Occupational diseases usually have a specific or strong relation to one’s occupation. They generally have one causative agent. (Alli, 2007)

Definitions cont’d
• Hazardous Substance: A hazardous substance is any material that poses a threat to human health and/or the environment. Typical hazardous substances are toxic, corrosive, ignitable, explosive, or chemically reactive.
• Occupational Hazard: An occupational or workplace hazard is a thing or situation with the potential to harm a worker. Occupational hazards can be divided into two categories: safety hazards that cause accidents that physically injure workers, and health hazards that result in the development of diseases. It is important to note that a "hazard" only represents a potential to cause harm.

Hypotheses Tested• The study was also designed to test the
following hypotheses.1. Factory workers’ knowledge of occupational health
and safety does not differ significantly among factories.
2. Attitude to health and safety among workers at government-owned sugar factories is notsignificantly different from those at a privately owned factory.
3. Safety practices among sugar factory workers are directly related to their knowledge of health and safety at the workplace.

RESEARCH DESIGN AND METHODOLOGY
• Study Population and Sampling
Factory workers at three sugarcane factories in Jamaica.
A total of 192 workers below the supervisory level participated in the study. - 101 (out of a possible 180) at factory A,- 61 (out of a possible 100) from factory B and - 30 (out of a possible) 55 from factory C.
The response rates were 56%, 61% and 55% from factories A, B and C, respectively.

RESEARCH DESIGN AND METHODOLOGY Cont’d
• Data Collection
- Both qualitative and quantitative. - Documentary review, observation, interviews (open-ended, in-depth) and questionnaire.
Main Data Collection Instrument - Questionnaire
This was developed and implemented to collect data on the knowledge, attitudes and safety practice of sugar factory workers.
Workers’ age, gender, job title, number of years in the position, number of years in the sugar industry, were ascertained.
The main portion of the survey included questions on the workers’ knowledge, attitude and practice of health and safety.
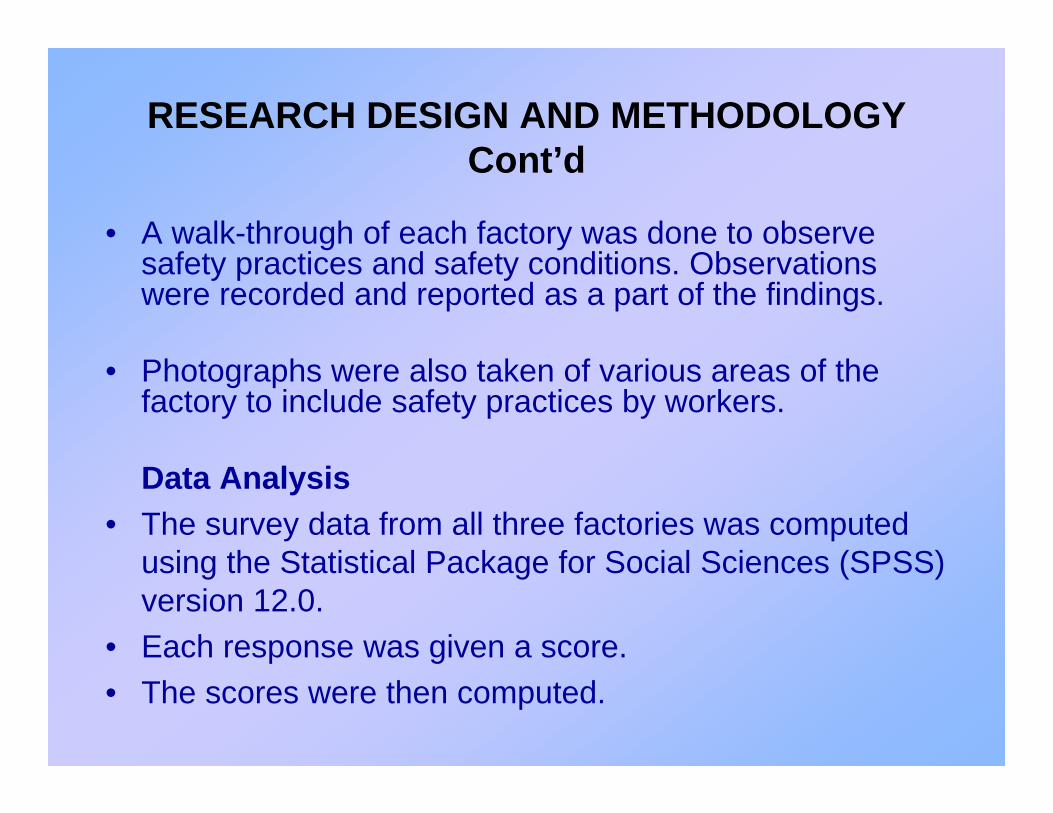
RESEARCH DESIGN AND METHODOLOGY Cont’d
• A walk-through of each factory was done to observe safety practices and safety conditions. Observations were recorded and reported as a part of the findings.
• Photographs were also taken of various areas of the factory to include safety practices by workers.
Data Analysis• The survey data from all three factories was computed
using the Statistical Package for Social Sciences (SPSS) version 12.0.
• Each response was given a score. • The scores were then computed.

RESEARCH DESIGN AND METHODOLOGY Cont’d
Computations done include:• Cross tabulation of the data - Number of observations (n) and
- Percentage of the responses(%)
• A comparison of the Difference of the Mean scores (Post Hoc Test)
• Correlation between knowledge and practice scores (Spearmen rank correlation coefficient test)
• One Way Analysis of Variance (ANOVA) of the scores for the three factories (determine the differences between and among the factories).
• Chi square analysis - establish whether differences between the factories were significant.

RESULTS

Demographics of Factory Workers Surveyed
0
10
20
30
40
50
60
18 – 25 26 – 35 36 – 45 46 – 55 56 – 64 65 and over
% Workers
Age Group
Age of Factory Workers Surveyed
Factory A
Factory B
Factory C

Demographics of Factory Workers SurveyedCont’d
0
10
20
30
40
50
60
70
Primary Secondary Tertiary Vocational On the Jobtraining
BasicEducation
Lab TechCourse
% Workers
Level of Education and Training
Education of Factory Workers Surveyed
Factory A
Factory B
Factory C
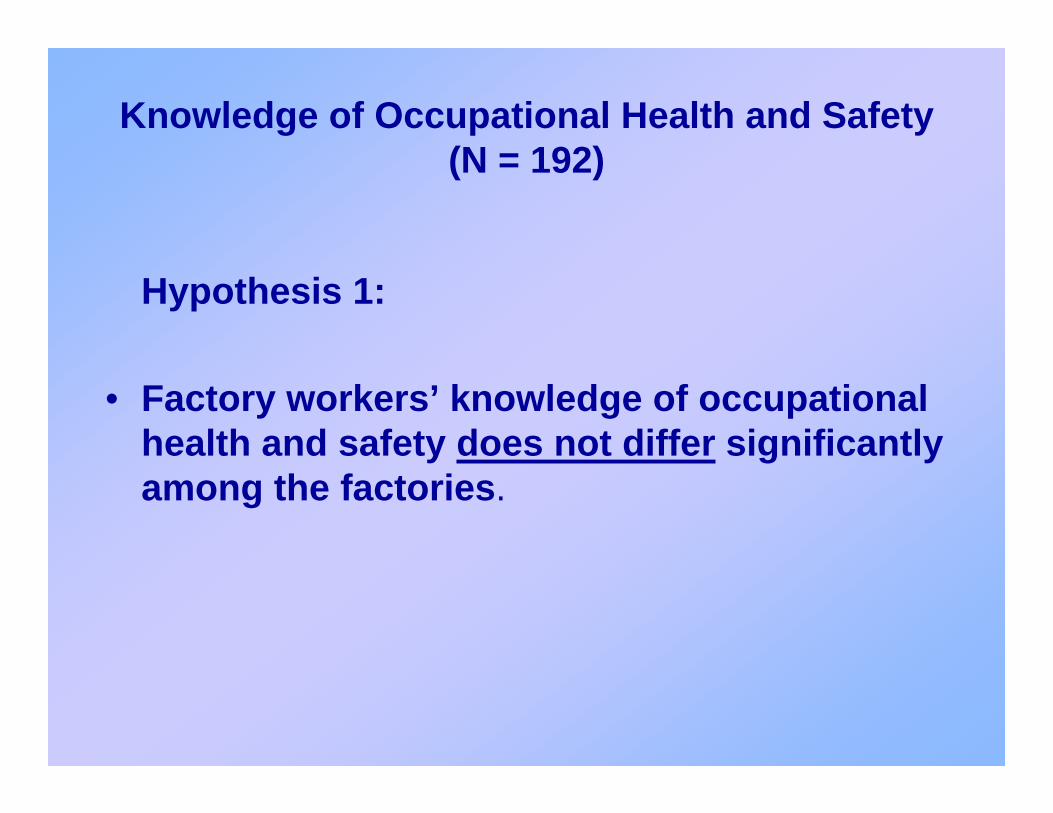
Knowledge of Occupational Health and Safety (N = 192)
Hypothesis 1:
• Factory workers’ knowledge of occupational health and safety does not differ significantly among the factories.

Knowledge of Occupational Health and Safety (N = 192)
VARIABLES FACTORY A FACTORY B FACTORY C TOTALn (%) n (%) n (%) n (%)
Factories ActYes 51 (54.3%) 25 (42.4%) 12 (46.2%) 88 (49.2%)No 43 (45.7%) 34 (57.6%) 14 (53.8%) 91 (50.8%)
Knowledge of JOSHAYes 44 (48.9%) 20 (33.9%) 11 (40.7%) 75 (42.6%)No 46 (51.1%) 39 (66.1%) 16 (59.3%) 101(57.4%)
Identification of an HazardousSubstanceYes 86 (85.1%) 40 (65.6%) 28 (93.3%) 154(80.2%)No 15 (14.9%) 21 (34.4%) 2 (6.7%) 38 (19.8%)
Knowledge of BagassosisYes 47 (48.5%) 13 (21.3%) 5 (17.9%) 65 (34.9%)No 50 (51.5%) 48 (78.7%) 23 (82.1%) 121 (65.1%)Knowledge of EmergencyExit RoutesYes 91 (91.9%) 41 (67.2%) 27 (96.4%) 159 (84.6%)No 8 (8.1%) 20 (32.8%) 1 (3.6%) 29 (15.4%)n, Number of factory workers responding(%), Percentage response within factory

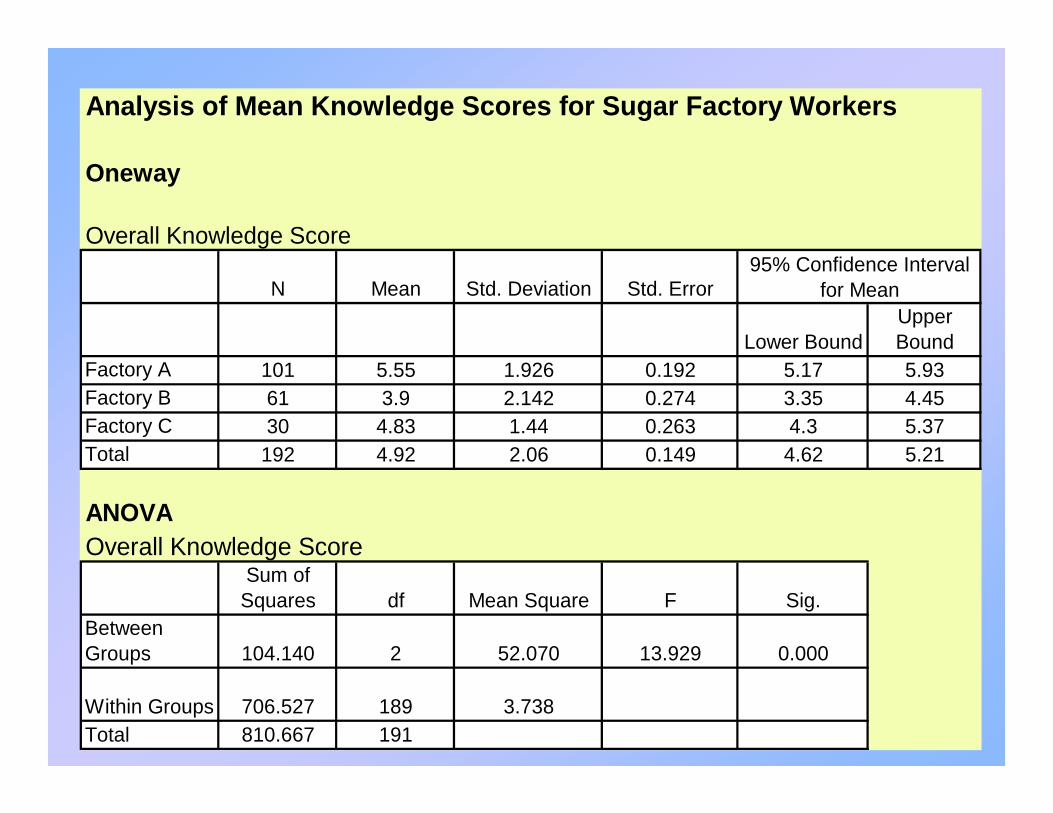
Analysis of Mean Knowledge Scores for Sugar Factory Workers
Oneway
Overall Knowledge Score
N Mean Std. Deviation Std. Error
Lower BoundUpper Bound
Factory A 101 5.55 1.926 0.192 5.17 5.93Factory B 61 3.9 2.142 0.274 3.35 4.45Factory C 30 4.83 1.44 0.263 4.3 5.37Total 192 4.92 2.06 0.149 4.62 5.21
ANOVA Overall Knowledge Score
Sum of
Squares df Mean Square F Sig.Between Groups 104.140 2 52.070 13.929 0.000
Within Groups 706.527 189 3.738Total 810.667 191
95% Confidence Interval for Mean

Post Hoc Tests of Overall Knowledge Scores for Sugar Factories
Multiple Comparisons
Dependent Variable: Overall Knowledge Score Tukey HSD
(I) Name of Factory (J) Name of Factory
Mean Difference (I-
J) Std. Error Sig.
Lower BoundUpper Bound
Factory A Factory B 1.653(*) 0.314 0.000 0.91 2.39 Factory C 0.721 0.402 0.174 -0.23 1.67Factory B Factory A -1.653(*) 0.314 0.000 -2.39 -0.91 Factory C -0.932 0.431 0.081 -1.95 0.09Factory C Factory A -0.721 0.402 0.174 -1.67 0.23 Factory B 0.932 0.431 0.081 -0.09 1.95
* The mean difference is significant at the .05 level.
95% Confidence Interval

Factory Workers’ Attitude to Health and Safety (N = 192)
• Hypothesis 2:
Attitude to health and safety among workers at government-owned sugar factories is not significantly differentfrom those at a privately owned sugar factory

Factory Workers’ Perception of Safety and Health (N = 192)
VARIABLES FACTORY A FACTORY B FACTORY C TOTALn (%) n (%) n (%) n (%)
Responsibility for Workplace SafetyEmployer 14 (14.0%) 6 (9.8%) 2 (6.9%) 22 (11.6%)Employee 30 (30.0%) 10 (16.4%) 7 (24.1%) 47 (24.7%)Safety Officer (s) 49 (49.0%) 34 (55.7%) 6 (20.7%) 89 (46.8%)Government 0 (0%) 0 (0%) 1 (3.4%) 1 (0.5%)Managers/Supervisors 4 (4.0%) 7 (11.5%) 10 (34.5%) 21 (11.1%)Don't Know 3 (3.0%) 4 (6.6%) 3 (10.3%) 10 (5.3%)
Management - Safety SeriousnessNot at all 3 (3.0%) 0 (0%) 0 (0%) 3 (1.6%)Not very seriously 8 (7.9%) 9 (14.8%) 1 (3.3%) 18 (9.4%)Fairly seriously 31 (30.7%) 13 (21.3%) 14 (46.7%) 58 (30.2%)
Very seriously 58 (57.4%) 36 (59.0%) 14 (46.7%) 108 (56.3%)Don't know 1 (1.0%) 3 (4.9%) 1 (3.3%) 5 (2.6%)
Co-workers' Safety SeriousnessNot at all 4 (4.0%) 1 (1.6%) 1 (3.3%) 6 (3.1%)Not very seriously 17 (16.8%) 9 (14.8%) 2 (6.7%) 28 (14.6%)Fairly seriously 25 (24.8%) 12 (19.7%) 12 (40.0%) 49 (25.5%)Very seriously 54 (53.5%) 37 (60.7%) 14 (46.7%) 105 (54.7%)Don't know 1 (1.0%) 2 (3.3%) 1 (3.3%) 4 (2.1%)

Factory Workers’ Attitude to Health and Safety (N = 192)GOV'T OWNED PRIVATE
FACTORY A FACTORY B FACTORY C TOTAL
VARIABLES n (%) n (%) n (%) n (%)
Attitude to Job SafetyDo it and not complain 0 (0%) 1 (1.6%) 0 (0%) 1 (0.5%)
Do it and complain 18 (18.0%) 9 (14.8%) 1 (3.3%) 28 (14.7%)
Not do it until safe to do so 73 (73.0%) 46 (75.4%) 27 (90.0%) 146 (76.4%)Not sure 9 (9.0%) 5 (8.2%) 2 (8.7%) 16 (8.4%)
Safety Important as Production
Strongly Agree 77 (77.0%) 44 (74.6%) 19 (63.3%) 140 (74.1%)
Agree 16 (16.0%) 13 (22.0%) 8 (26.7%) 37 (19.6%)
Disagree 6 (6.0%) 1 (1.7%) 1 (3.3%) 8 (4.2%)
Strongly Disagree 1 (1.0%) 1 (1.7%) 2 (6.7%) 4 (2.1%)
Same Chance of Accident
Strongly Agree 15 (16.1%) 9 (17.0%) 4 (13.3%) 28 (15.9%)
Agree 17 (18.3%) 10 (18.9%) 5 (16.7%) 32 (18.2%)
Disagree 37 (39.8%) 20 (37.7%) 12 (40.0%) 69 (39.2%)
Strongly Disagree 24 (25.8%) 14 (26.4%) 9 (30.0%) 47 (26.7%)

Factory Workers’ Attitude to Health and Safety (N = 192)
ANOVA
Overall Attitude Score
Sum of Squares df
Mean Square F Sig.
Between Groups
2.686 2 1.343 0.561 0.571Within Groups
452.293 189 2.393Total
454.979 191

Factory Workers’ Attitude to Health and Safety (N = 192)
Post Hoc Tests of Mean Attitude Scores for Sugar Factory WorkersMultiple Comparisons
Dependent Variable: Overall Attitude Score Tukey HSD
(I) Name of Factory(J) Name of Factory
Mean Difference
(I-J) Std. Error Sig.
Lower Bound
Upper Bound
Factory A Factory B -0.031 0.251 0.991 -0.62 0.56 Factory C -0.335 0.322 0.551 -1.1 0.42Factory B Factory A 0.031 0.251 0.991 -0.56 0.62 Factory C -0.304 0.345 0.653 -1.12 0.51Factory C Factory A 0.335 0.322 0.551 -0.42 1.1
Factory B 0.304 0.345 0.653 -0.51 1.12
95% Confidence Interval

Safety Practices of Sugar Factory Workers (N= 192)
• Hypothesis 3:
Safety practices among sugar factory workers are directly related to their knowledge of health and safety at the workplace.

Factory Workers' Practice of Occupational Safety and Health (N = 192)
VARIABLES FACTORY A FACTORY B FACTORY C TOTALn = 101 n = 61 n = 30
Are you provided with safety gears?Yes 101 (100%) 59 (98.3%) 29 (100%) 189 (99.5%)No 0 (0%) 1 (1.7%) 0 (0%) 1 (0.5%)
Do you wear the safety gears provided? Yes 98 (100%) 56 (100%) 30 (100%) 184 (100%)No 0 (0%) 0 (0%) 0 (0%) 0 (0%)
How often do you wear your safety gears?All the time 66 (66.7%) 45 (81.8%) 15 (51.7%) 126 (68.9%)Most Times 26 (26.3%) 8 (14.5%) 12 (41.4%) 46 (25.1%)Sometimes 6 (6.1%) 2 (3.6%) 2 (6.9%) 10 (5.5%)Very Rarely 1 (1.0%) 0 (0%) 0 (0%) 1 (0.5%)
Wearing correct gear for taskAll the time 65 (67.0%) 47 (83.9%) 19 (67.9%) 131 (72.4%)Most Times 27 (27.8%) 6 (10.7%) 6 (21.4%) 39 (21.5%)Sometimes 4 (4.1%) 2 (3.6%) 3 (10.7%) 9 (5.0%)Very Rarely 1 (1.0%) 1 (1.8%) 0 (0%) 2 (1.1%)
I use whatever tool is available to do a taskAll the time 10 (10.6%) 8 (14.8%) 4 (14.3%) 22 (12.5%)Most Times 13 (13.8%) 13 (24.1%) 3 (10.7%) 29 (16.5%)Sometimes 47 (50.0%) 21 (38.9%) 13 (46.4%) 81 (46.0%)Very Rarely 24 (25.5%) 12 (22.2%) 8 (28.6%) 44 (25.0%)
I report all accidents whether they result in an injury or notAll the time 46 (48.4%) 33 (62.3%) 13 (46.4%) 92 (52.3%)Most Times 28 (29.5%) 6 (11.3%) 6 (21.4%) 40 (22.7%)Sometimes 13 (13.7%) 9 (17.0%) 7 (25.0%) 29 (16.5%)Very Rarely 8 (8.4%) 5 (9.4%) 2 (7.1%) 15 (8.5%)

Nonparametric Correlations
Overall Knowledge
Score
Overall Practice Score
Correlation Coefficient 1 .247(**)
Sig. (2-tailed) . 0.001N 192 192Correlation Coefficient .247(**) 1Sig. (2-tailed) 0.001 .N 192 192
** Correlation is significant at the 0.01 level (2-tailed).
Spearman's rho Overall Knowledge Score
Overall Practice Score
Relationship between Knowledge and Safety Practice

Safety Practices of Sugar Factory Workers (N= 192)
Picture of Factory Worker with No Head Protection

Picture of Welder not using his protective gear correctly

Safety Practices of Sugar Factory Workers (N= 192)
Factory Worker Walking though Factory Inappropriately Dressed
CONCLUSION
• The data collected from factory workers at the factories surveyed, showed that many workers are knowledgeable of the major hazards found in a sugar factory.
• Many workers could not identify at least one hazardous substance that was used in a sugar factory.

CONCLUSION Cont’d
• The ownership of the factories does not have a significant impact on the attitudes of the workers.
• The findings indicate that there is no significant difference in attitude among sugar workers at the government owned factories compared to those at the privately owned factory.
• Workers in general displayed similar qualities in their attitude towards health and safety.
• The attitudes displayed were generally positive.

CONCLUSION Cont’d
• Importantly, factory workers’ knowledge of health and safety correlates strongly and positively with their safety practices.
• It is therefore very likely that as workers become more knowledgeable of health and safety at the workplace, the overall health and safety practices would improve.
RECOMMENDATIONS• It is recommended that a comprehensive safety program
be developed at all factories. Factory B especially, needs special attention as workers there were found to be least knowledgeable of occupational health and safety.
• A safety orientation programme needs to be incorporated into the general safety programme at all factories.
• It is highly recommended that the OSHA Hazard Communication Standard be adopted by all factories. This is important, as many workers could not accurately identify hazards present in a sugar factory.
• Further work in the area of OSH is needed and is therefore highly recommended.

ACKNOWLEDGEMENTS
• My supervisor, Mr. Jimmy Tindigarukayo - UWI
• Mr. Norbert Campbell, Course Cordinator - UWI
• Management and Staff of all three sugar factories for their warm hospitality and co-operation
• Miss Thadeen Johnson for assisting me with the data entry
• Mr. Olusegum Ismail for providing consultative services for the SPSS program
• The Director of Research, Sugar Industry Research Institute, Dr. Earle Roberts, who has unselfishly facilitated my pursuit of higher learning through well needed financial sponsorship and allowing me the necessary time off from work.
• Family, Friends and Colleagues.