Embed Size (px)
Citation preview
Available online at www.sciencedirect.com
Journal of Environmental Radioactivity 99 (2008) 1525e1529www.elsevier.com/locate/jenvrad
Occupational exposure to natural radioactivityin a zircon sand milling plant
Luisa Ballesteros, Isidoro Zarza, Josefina Ortiz, Vicente Serradell*
Laboratorio de Radioactividad Ambiental, Universidad Politecnica de Valencia, Apartado 22012, E-46071 Valencia, Spain
Available online 11 February 2008
Abstract
Raw zirconium sand is one of the substances (naturally occurring radioactive material, NORM) which is widely used in the ceramic industry.This sand contains varying concentrations of natural radionuclides: mostly U-238 but also Th-232 and U-235, together with their daughters, andtherefore may need to be regulated by Directive 96/29/EURATOM. This paper describes the method used to perform the radiological study ona zircon sand milling plant and presents the results obtained. Internal and external doses were evaluated using radioactivity readings from sand,airborne dust, intermediate materials and end products. The results on total effective dose show the need for this type of industry to be carefullycontrolled, since values near to 1 mSv were obtained.� 2007 Elsevier Ltd. All rights reserved.
Keywords: Zircon; Natural radioactivity; Ceramic industry; Worker exposure
1. Introduction
Most of the materials found on the earth’s surface containmeasurable amounts of natural radioactivity due to the pres-ence of uranium and thorium and their daughters. Neverthe-less, some minerals contain much higher levels of naturalradionuclides, whereas in others, levels rise when they are sub-jected to certain industrial processing (UNSCEAR, 1982). Theuse of naturally occurring radioactive materials (NORM) iswidespread, but they were not subject to regulation in Spainuntil the publication of Real Decreto 783/2001 (BOE, 2001).This Decree approved a new ‘‘Regulation on Health Protectionagainst Ionizing Radiation’’, as a result of the transfer of theEuropean Council Directive 96/29 (EURATOM, 1996). Inarticle 62, paragraph VII, the regulation deals with ‘‘NaturalSources of Radiation’’ and the need to study those activitiesin which workers or members of the public could be exposedto significant doses of radiation. Some of these industrial ac-tivities use zircon sand as a raw material (Martin et al.,
* Corresponding author. Tel.: þ34 963 877 636; fax: þ34 963 877 639.
E-mail addresses: [email protected] (L. Ballesteros), iszarpe@
upvnet.upv.es (I. Zarza), [email protected] (J. Ortiz), [email protected]
(V. Serradell).
0265-931X/$ - see front matter � 2007 Elsevier Ltd. All rights reserved.
doi:10.1016/j.jenvrad.2007.12.019
1997), which is milled in order to obtain end products usedin making ceramic tiles and in refractory industries.
The most abundant zirconium minerals are baddeleyite(ZrO2) and zircon (ZrSiO4). Baddeleyite mining is at presentlimited to two locations, whereas alluvial deposits are located(sand) in riverbeds and beaches. Zircon occurs naturally asso-ciated with quartz and other minerals, such as rutile (TiO2),ilmenite (FeTiO3) and monazite (phosphate of rare earth),and physical and chemical treatments are necessary to separatezircon from them. The presence of uranium and thorium in thecrystalline structure of zircon causes a sharp rise in its naturalradioactivity, compared to other sands or soils.
2. Materials and methods
2.1. Zircon processing plant
The factory involved in the study is located in the Autonomous Region of
Valencia, Spain, where 90% of Spanish ceramic tiles are produced. It has two
milling lines consisting of wet and dry milling processes. The dry milling
process is carried out on a ball mill (with silex or alumina balls), a dynamic
system of classification, which feeds back the biggest particles and extracts
zircon flour. The wet milling process also takes place on a ball mill, after
which particles are dynamically classified according to size. At the end of
the process, the product is dried and micronized zircon is obtained (Instituto
Zircon sands
Ball mills
Dryer
Dynamicclassifier
Dynamicclassifier
Ball millsSand
Zirconflour
MicronizedZircon
SandWater
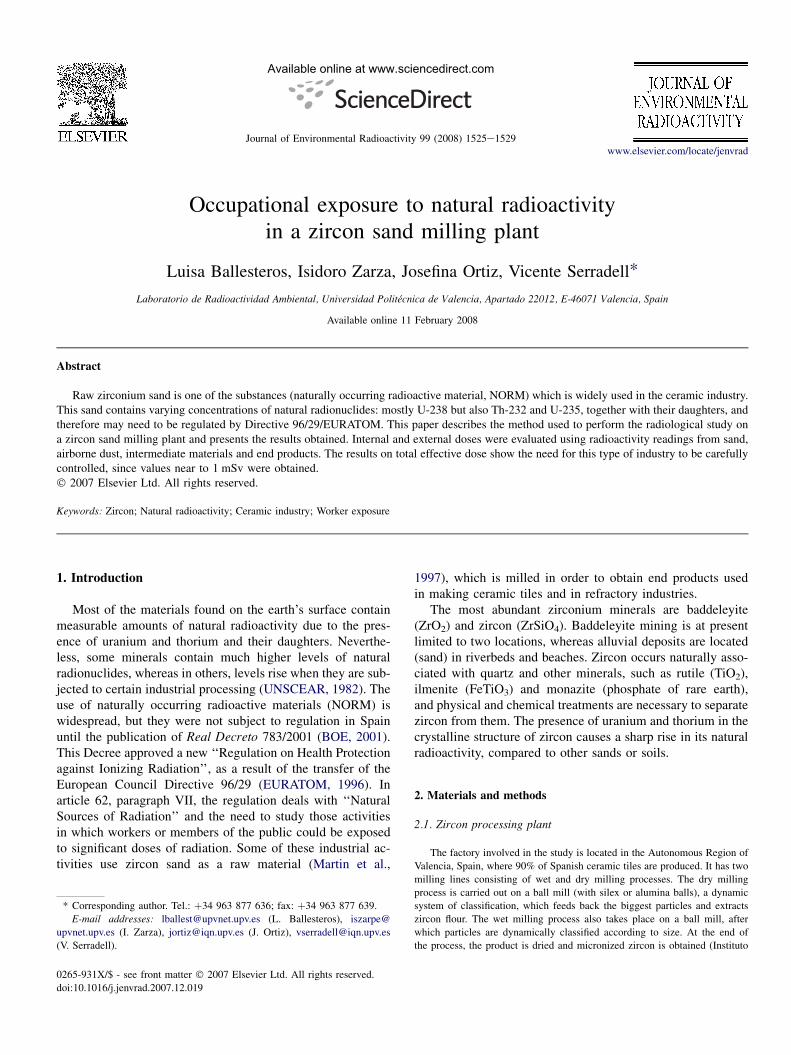
Wet millingDry milling
Fig. 1. Scheme of dry milling and wet milling processes.
1526 L. Ballesteros et al. / Journal of Environmental Radioactivity 99 (2008) 1525e1529
de Tecnologıa Ceramica (ITC), 2005. Estudio de radiactividad en la industria
ceramica (II). Descripcion de la Industria ceramica y auxiliares en Espa~na.
Informe no. CO50893. Internal report). Fig. 1 shows a simplified scheme of
both processes. The following zones in the plant were studied:
e raw material store,
e dry milling,
e wet milling,
e decantation tanks,
e micronized bagging area and
e end products store.
2.2. Experimental
Table 2�3
The plant obtains its raw materials from Australia and South Africa.
These zircon sands have a particle size of 100e200 mm diameter. They
are ground to a small particle size of �50 mm (zircon flour) by the dry
milling process, and to an even finer ground product (micronized zircon)
by the wet milling process (�5 mm). Zircon sands and end products used
in the factory were provided by the management. Samples were dried at
100 �C to constant weight, then sieved (size mesh 0.5 mm) and placed in
a 0.190 L cylindrical beaker for a gamma isotopic analysis in a Ge(HP) de-
tector. Readings were taken after 4 h.
U-238 was quantified by the main peaks of Bi-214 and Pb-214, assuming
that the radon emanation from the sample was negligible. The activity of Th-
232 was determined by the Ac-228 peaks. Radioactive equilibrium is assumed
in both natural series (Bruzzi et al., 2000; Righi et al., 2005; Italian National
Group, 1985). K-40 activity was determined by 1460.75 keV photon.
Airborne dust sampling was evaluated using a mobile low-volume air
sampler with an adjustable sampling gooseneck (F&J, model DF-14ME)
and supplied with nitrocellulose filters with a pore size of 0.8 mm. Sample
Table 1
Activity concentrations in raw materials and end products samples (Bq kg�1)
Material U-238 Th-232 K-40
South African zircon sand 3615� 124 604� 33 <74
Australian zircon sand-1 2681� 93 597� 5 <69
Australian zircon sand-2 3159� 108 714� 37 <71
Zircon flour 3134� 104 592� 37 <110
Zircon micronized 2908� 101 607� 34 <99
collecting times from 3 to 24 h were used at a flow rate of approximately
30 L min�1. Gross alpha and gross beta readings were carried out directly in
every filter. Finally, filters were grouped for a gamma spectrometric analysis.
Measurements were made at 250 000 s.
Radon monitoring was performed, even though there was good natural
ventilation in the factory. Activated charcoal-type EPA canisters were placed
at different points of the plant for three days. Radon was evaluated by measur-
ing every canister in the Ge(HP) detector.
External gamma dose rate levels were measured using a portable radiation
monitor (BERTHOLD LB 133) in different zones of the factory. Thermoluminis-
cence dosimeters (LiF: TLD-100) were also used to evaluate the integrated gamma
dose. The TLDs were exposed for one month in the zones where direct measure-
ments were made. A HARSHAW 4000 A reader was used for this purpose.
During the wet milling process, water and vapour water are obtained as
residuals. The water contains a high content of solids in suspension (2.6 and
3.6 g L�1). Two water samples were obtained, on which gross alpha, gross
beta and isotopic gamma analyses were carried out.
All measurements of gamma ray emitting nuclides were performed on an
ORTEC 919E multichannel analyzer equipped with a Ge(HP) detector, type
GMX. Gross alpha and gross beta measurements were carried out on a BERT-
HOLD LB 770-2 anti-coincidence proportional counter.
3. Results and discussion
3.1. Measurements
Table 1 shows the U-238, Th-232 and K-40 activity concen-trations for each type of zircon sand and end-product analyzed.
Gross alpha and gross beta activity in airborne dust samples (mBq m )
Area Filter no. Gross alpha Gross beta
Dry milling-1 1 89� 5 56� 2
Dry milling-2 2 40� 4 17� 2
3 69� 3 31� 1
Wet milling 4 62� 3 25� 1
5 38� 2 16.8� 0.8
Product bagging 6 69� 4 30� 1
7 77� 4 38� 1
End-product store 8 12.8� 0.8 5.8� 0.4
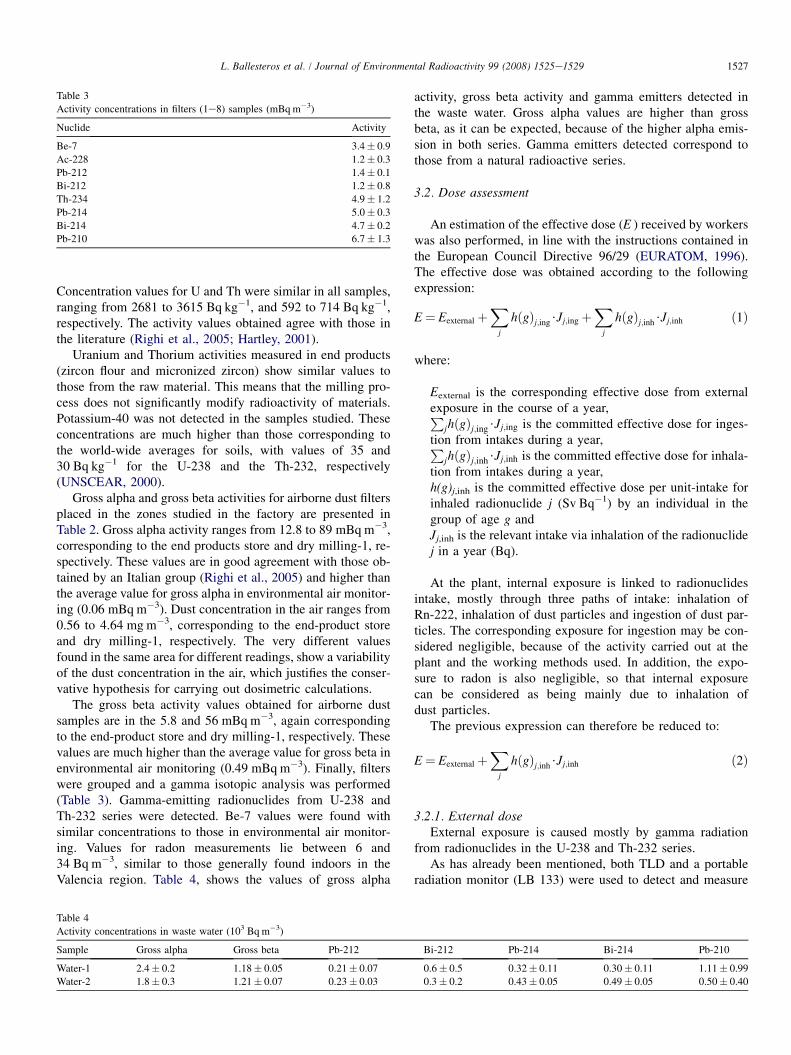
Table 3
Activity concentrations in filters (1e8) samples (mBq m�3)
Nuclide Activity
Be-7 3.4� 0.9
Ac-228 1.2� 0.3
Pb-212 1.4� 0.1
Bi-212 1.2� 0.8
Th-234 4.9� 1.2
Pb-214 5.0� 0.3
Bi-214 4.7� 0.2
Pb-210 6.7� 1.3
1527L. Ballesteros et al. / Journal of Environmental Radioactivity 99 (2008) 1525e1529
Concentration values for U and Th were similar in all samples,ranging from 2681 to 3615 Bq kg�1, and 592 to 714 Bq kg�1,respectively. The activity values obtained agree with those inthe literature (Righi et al., 2005; Hartley, 2001).
Uranium and Thorium activities measured in end products(zircon flour and micronized zircon) show similar values tothose from the raw material. This means that the milling pro-cess does not significantly modify radioactivity of materials.Potassium-40 was not detected in the samples studied. Theseconcentrations are much higher than those corresponding tothe world-wide averages for soils, with values of 35 and30 Bq kg�1 for the U-238 and the Th-232, respectively(UNSCEAR, 2000).
Gross alpha and gross beta activities for airborne dust filtersplaced in the zones studied in the factory are presented inTable 2. Gross alpha activity ranges from 12.8 to 89 mBq m�3,corresponding to the end products store and dry milling-1, re-spectively. These values are in good agreement with those ob-tained by an Italian group (Righi et al., 2005) and higher thanthe average value for gross alpha in environmental air monitor-ing (0.06 mBq m�3). Dust concentration in the air ranges from0.56 to 4.64 mg m�3, corresponding to the end-product storeand dry milling-1, respectively. The very different valuesfound in the same area for different readings, show a variabilityof the dust concentration in the air, which justifies the conser-vative hypothesis for carrying out dosimetric calculations.
The gross beta activity values obtained for airborne dustsamples are in the 5.8 and 56 mBq m�3, again correspondingto the end-product store and dry milling-1, respectively. Thesevalues are much higher than the average value for gross beta inenvironmental air monitoring (0.49 mBq m�3). Finally, filterswere grouped and a gamma isotopic analysis was performed(Table 3). Gamma-emitting radionuclides from U-238 andTh-232 series were detected. Be-7 values were found withsimilar concentrations to those in environmental air monitor-ing. Values for radon measurements lie between 6 and34 Bq m�3, similar to those generally found indoors in theValencia region. Table 4, shows the values of gross alpha
Table 4
Activity concentrations in waste water (103 Bq m�3)
Sample Gross alpha Gross beta Pb-212
Water-1 2.4� 0.2 1.18� 0.05 0.21� 0.07
Water-2 1.8� 0.3 1.21� 0.07 0.23� 0.03
activity, gross beta activity and gamma emitters detected inthe waste water. Gross alpha values are higher than grossbeta, as it can be expected, because of the higher alpha emis-sion in both series. Gamma emitters detected correspond tothose from a natural radioactive series.
3.2. Dose assessment
An estimation of the effective dose (E ) received by workerswas also performed, in line with the instructions contained inthe European Council Directive 96/29 (EURATOM, 1996).The effective dose was obtained according to the followingexpression:
E¼ EexternalþX
j
hðgÞj;ing$Jj;ingþX
j
hðgÞj;inh$Jj;inh ð1Þ
where:
Eexternal is the corresponding effective dose from externalexposure in the course of a year,P
jhðgÞj;ing$Jj;ing is the committed effective dose for inges-tion from intakes during a year,P
jhðgÞj;inh$Jj;inh is the committed effective dose for inhala-tion from intakes during a year,h(g)j,inh is the committed effective dose per unit-intake forinhaled radionuclide j (Sv Bq�1) by an individual in thegroup of age g andJj,inh is the relevant intake via inhalation of the radionuclidej in a year (Bq).
At the plant, internal exposure is linked to radionuclidesintake, mostly through three paths of intake: inhalation ofRn-222, inhalation of dust particles and ingestion of dust par-ticles. The corresponding exposure for ingestion may be con-sidered negligible, because of the activity carried out at theplant and the working methods used. In addition, the expo-sure to radon is also negligible, so that internal exposurecan be considered as being mainly due to inhalation ofdust particles.
The previous expression can therefore be reduced to:
E¼ EexternalþX
j
hðgÞj;inh$Jj;inh ð2Þ
3.2.1. External doseExternal exposure is caused mostly by gamma radiation
from radionuclides in the U-238 and Th-232 series.As has already been mentioned, both TLD and a portable
radiation monitor (LB 133) were used to detect and measure
Bi-212 Pb-214 Bi-214 Pb-210
0.6� 0.5 0.32� 0.11 0.30� 0.11 1.11� 0.99
0.3� 0.2 0.43� 0.05 0.49� 0.05 0.50� 0.40
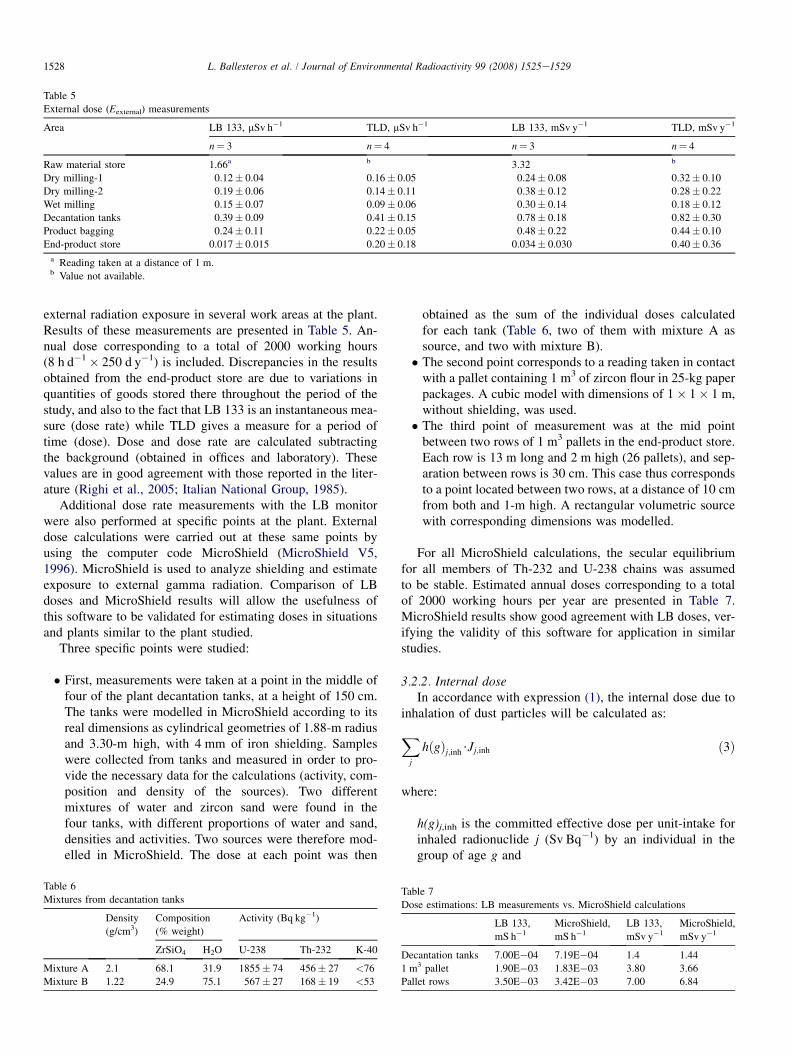
Table 5
External dose (Eexternal) measurements
Area LB 133, mSv h�1 TLD, mSv h�1 LB 133, mSv y�1 TLD, mSv y�1
n¼ 3 n¼ 4 n¼ 3 n¼ 4
Raw material store 1.66a b 3.32 b
Dry milling-1 0.12� 0.04 0.16� 0.05 0.24� 0.08 0.32� 0.10
Dry milling-2 0.19� 0.06 0.14� 0.11 0.38� 0.12 0.28� 0.22
Wet milling 0.15� 0.07 0.09� 0.06 0.30� 0.14 0.18� 0.12
Decantation tanks 0.39� 0.09 0.41� 0.15 0.78� 0.18 0.82� 0.30
Product bagging 0.24� 0.11 0.22� 0.05 0.48� 0.22 0.44� 0.10
End-product store 0.017� 0.015 0.20� 0.18 0.034� 0.030 0.40� 0.36
a Reading taken at a distance of 1 m.b Value not available.
1528 L. Ballesteros et al. / Journal of Environmental Radioactivity 99 (2008) 1525e1529
external radiation exposure in several work areas at the plant.Results of these measurements are presented in Table 5. An-nual dose corresponding to a total of 2000 working hours(8 h d�1� 250 d y�1) is included. Discrepancies in the resultsobtained from the end-product store are due to variations inquantities of goods stored there throughout the period of thestudy, and also to the fact that LB 133 is an instantaneous mea-sure (dose rate) while TLD gives a measure for a period oftime (dose). Dose and dose rate are calculated subtractingthe background (obtained in offices and laboratory). Thesevalues are in good agreement with those reported in the liter-ature (Righi et al., 2005; Italian National Group, 1985).
Additional dose rate measurements with the LB monitorwere also performed at specific points at the plant. Externaldose calculations were carried out at these same points byusing the computer code MicroShield (MicroShield V5,1996). MicroShield is used to analyze shielding and estimateexposure to external gamma radiation. Comparison of LBdoses and MicroShield results will allow the usefulness ofthis software to be validated for estimating doses in situationsand plants similar to the plant studied.
Three specific points were studied:
� First, measurements were taken at a point in the middle offour of the plant decantation tanks, at a height of 150 cm.The tanks were modelled in MicroShield according to itsreal dimensions as cylindrical geometries of 1.88-m radiusand 3.30-m high, with 4 mm of iron shielding. Sampleswere collected from tanks and measured in order to pro-vide the necessary data for the calculations (activity, com-position and density of the sources). Two differentmixtures of water and zircon sand were found in thefour tanks, with different proportions of water and sand,densities and activities. Two sources were therefore mod-elled in MicroShield. The dose at each point was then
Table 6
Mixtures from decantation tanks
Density
(g/cm3)
Composition
(% weight)
Activity (Bq kg�1)
ZrSiO4 H2O U-238 Th-232 K-40
Mixture A 2.1 68.1 31.9 1855� 74 456� 27 <76
Mixture B 1.22 24.9 75.1 567� 27 168� 19 <53
obtained as the sum of the individual doses calculatedfor each tank (Table 6, two of them with mixture A assource, and two with mixture B).� The second point corresponds to a reading taken in contact
with a pallet containing 1 m3 of zircon flour in 25-kg paperpackages. A cubic model with dimensions of 1� 1� 1 m,without shielding, was used.� The third point of measurement was at the mid point
between two rows of 1 m3 pallets in the end-product store.Each row is 13 m long and 2 m high (26 pallets), and sep-aration between rows is 30 cm. This case thus correspondsto a point located between two rows, at a distance of 10 cmfrom both and 1-m high. A rectangular volumetric sourcewith corresponding dimensions was modelled.
For all MicroShield calculations, the secular equilibriumfor all members of Th-232 and U-238 chains was assumedto be stable. Estimated annual doses corresponding to a totalof 2000 working hours per year are presented in Table 7.MicroShield results show good agreement with LB doses, ver-ifying the validity of this software for application in similarstudies.
3.2.2. Internal doseIn accordance with expression (1), the internal dose due to
inhalation of dust particles will be calculated as:
X
j
hðgÞj;inh$Jj;inh ð3Þ
where:
h(g)j,inh is the committed effective dose per unit-intake forinhaled radionuclide j (Sv Bq�1) by an individual in thegroup of age g and
Table 7
Dose estimations: LB measurements vs. MicroShield calculations
LB 133,
mS h�1MicroShield,
mS h�1LB 133,
mSv y�1MicroShield,
mSv y�1
Decantation tanks 7.00E�04 7.19E�04 1.4 1.44
1 m3 pallet 1.90E�03 1.83E�03 3.80 3.66
Pallet rows 3.50E�03 3.42E�03 7.00 6.84
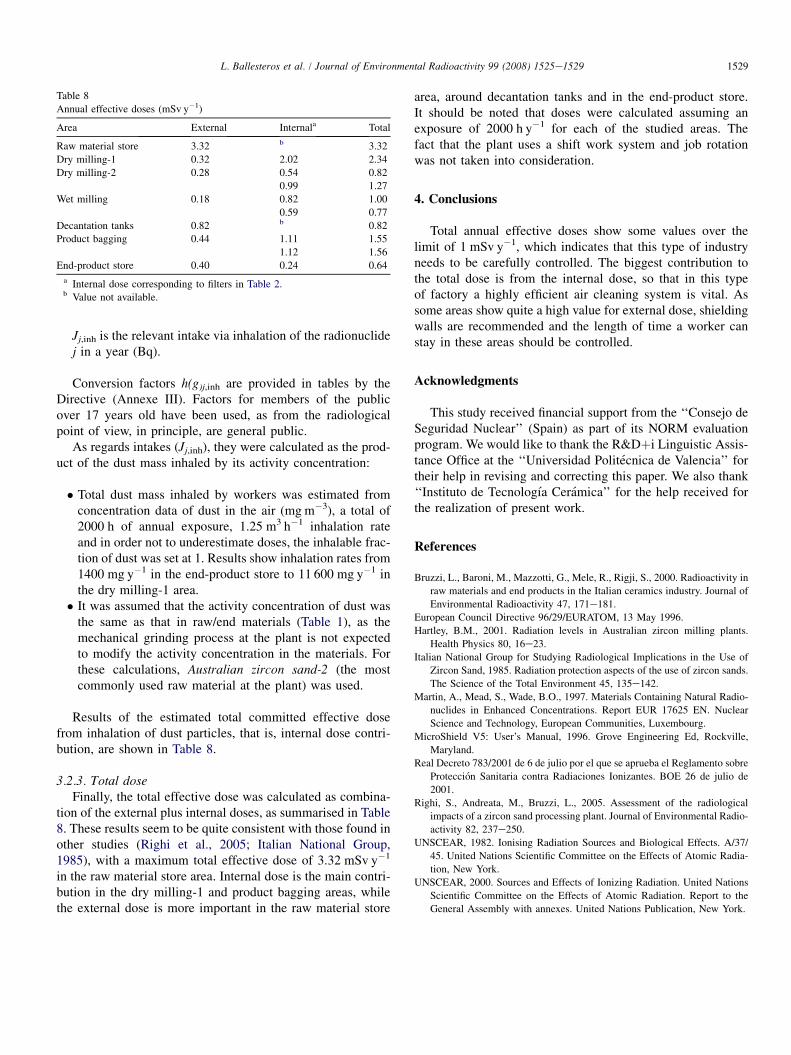
Table 8
Annual effective doses (mSv y�1)
Area External Internala Total
Raw material store 3.32 b 3.32
Dry milling-1 0.32 2.02 2.34
Dry milling-2 0.28 0.54 0.82
0.99 1.27
Wet milling 0.18 0.82 1.00
0.59 0.77
Decantation tanks 0.82 b 0.82
Product bagging 0.44 1.11 1.55
1.12 1.56
End-product store 0.40 0.24 0.64
a Internal dose corresponding to filters in Table 2.b Value not available.
1529L. Ballesteros et al. / Journal of Environmental Radioactivity 99 (2008) 1525e1529
Jj,inh is the relevant intake via inhalation of the radionuclidej in a year (Bq).
Conversion factors h(g)j,inh are provided in tables by theDirective (Annexe III). Factors for members of the publicover 17 years old have been used, as from the radiologicalpoint of view, in principle, are general public.
As regards intakes (Jj,inh), they were calculated as the prod-uct of the dust mass inhaled by its activity concentration:
� Total dust mass inhaled by workers was estimated fromconcentration data of dust in the air (mg m�3), a total of2000 h of annual exposure, 1.25 m3 h�1 inhalation rateand in order not to underestimate doses, the inhalable frac-tion of dust was set at 1. Results show inhalation rates from1400 mg y�1 in the end-product store to 11 600 mg y�1 inthe dry milling-1 area.� It was assumed that the activity concentration of dust was
the same as that in raw/end materials (Table 1), as themechanical grinding process at the plant is not expectedto modify the activity concentration in the materials. Forthese calculations, Australian zircon sand-2 (the mostcommonly used raw material at the plant) was used.
Results of the estimated total committed effective dosefrom inhalation of dust particles, that is, internal dose contri-bution, are shown in Table 8.
3.2.3. Total doseFinally, the total effective dose was calculated as combina-
tion of the external plus internal doses, as summarised in Table8. These results seem to be quite consistent with those found inother studies (Righi et al., 2005; Italian National Group,1985), with a maximum total effective dose of 3.32 mSv y�1
in the raw material store area. Internal dose is the main contri-bution in the dry milling-1 and product bagging areas, whilethe external dose is more important in the raw material store
area, around decantation tanks and in the end-product store.It should be noted that doses were calculated assuming anexposure of 2000 h y�1 for each of the studied areas. Thefact that the plant uses a shift work system and job rotationwas not taken into consideration.
4. Conclusions
Total annual effective doses show some values over thelimit of 1 mSv y�1, which indicates that this type of industryneeds to be carefully controlled. The biggest contribution tothe total dose is from the internal dose, so that in this typeof factory a highly efficient air cleaning system is vital. Assome areas show quite a high value for external dose, shieldingwalls are recommended and the length of time a worker canstay in these areas should be controlled.
Acknowledgments
This study received financial support from the ‘‘Consejo deSeguridad Nuclear’’ (Spain) as part of its NORM evaluationprogram. We would like to thank the R&Dþi Linguistic Assis-tance Office at the ‘‘Universidad Politecnica de Valencia’’ fortheir help in revising and correcting this paper. We also thank‘‘Instituto de Tecnologıa Ceramica’’ for the help received forthe realization of present work.
References
Bruzzi, L., Baroni, M., Mazzotti, G., Mele, R., Rigji, S., 2000. Radioactivity in
raw materials and end products in the Italian ceramics industry. Journal of
Environmental Radioactivity 47, 171e181.
European Council Directive 96/29/EURATOM, 13 May 1996.
Hartley, B.M., 2001. Radiation levels in Australian zircon milling plants.
Health Physics 80, 16e23.
Italian National Group for Studying Radiological Implications in the Use of
Zircon Sand, 1985. Radiation protection aspects of the use of zircon sands.
The Science of the Total Environment 45, 135e142.
Martin, A., Mead, S., Wade, B.O., 1997. Materials Containing Natural Radio-
nuclides in Enhanced Concentrations. Report EUR 17625 EN. Nuclear
Science and Technology, European Communities, Luxembourg.
MicroShield V5: User’s Manual, 1996. Grove Engineering Ed, Rockville,
Maryland.
Real Decreto 783/2001 de 6 de julio por el que se aprueba el Reglamento sobre
Proteccion Sanitaria contra Radiaciones Ionizantes. BOE 26 de julio de
2001.
Righi, S., Andreata, M., Bruzzi, L., 2005. Assessment of the radiological
impacts of a zircon sand processing plant. Journal of Environmental Radio-
activity 82, 237e250.
UNSCEAR, 1982. Ionising Radiation Sources and Biological Effects. A/37/
45. United Nations Scientific Committee on the Effects of Atomic Radia-
tion, New York.
UNSCEAR, 2000. Sources and Effects of Ionizing Radiation. United Nations
Scientific Committee on the Effects of Atomic Radiation. Report to the
General Assembly with annexes. United Nations Publication, New York.


![Zircon geochronology and ca. 400 Ma exhumation of ...hacker.faculty.geol.ucsb.edu/...Zircon...Norwegian.pdf · single zircon 238U/206Pb ages from Krogh et al. [15] define two stages](https://img.pdfslide.us/doc/110x75/5f78b0a55661600ea6216daf/zircon-geochronology-and-ca-400-ma-exhumation-of-single-zircon-238u206pb-ages.jpg)


![monazite/zircon and futile]zircon (multiple passes - downloads](https://img.pdfslide.us/doc/110x75/6231ccd013e4e240230def43/monazitezircon-and-futilezircon-multiple-passes-downloads.jpg)