Embed Size (px)
Citation preview

OCCUPATIONAL HEALTH AND SAFETY IN MALTA -
A SNAPSHOT OF PREVAILING STANDARDS
OHSA, 2011
This research was partly financed by the European Union under Operational Programme II – Cohesion Policy 2007-2013 (European Social Fund (ESF). Its contents, including any opinions and/or conclusions expressed, are those of the authors alone and do not necessarily reflect the opinion of the OHSA, Government of Malta or the EU.
This research report is a public document and may be freely distributed and used provided the source is acknowledged as OHSA (2011).
Researched and Written byInforma Consultants and M. FSADNI & Associates

OCCUPATIONAL HEALTH AND SAFETY IN MALTA - A SNAPSHOT OF PREVAILING STANDARDS
2
The Research Consultants
are indebted to all individuals
and entities for participating
and contributing essential input
towards this study
THE AUTHORS
THIS REPORT WAS RESEARCHED AND WRITTEN BY CLIVE FALZON OF INFORMA CONSULTANTS AND MARIKA FSADNI OF M. FSADNI & ASSOCIATES. THESE RESEARCH CONSULTANTS WERE RESPONSIBLE FOR THE DESIGN, CO-ORDINATION AND EXECUTION OF THE RESEARCH FIELD OPERATIONS AND ALSO FOR THE REPORTING OF THE FINDINGS OF THE ENTIRE PROJECT.
The Research Consultants are grateful to OHSA for entrusting them with this very challenging yet highly rewarding research project. Sincere thanks go to OHSA’s CEO, Dr Mark Gauci and Project Leader, Mr Silvio Farrugia for their sound direction and significant contribution during the whole course of this research project.
The Research Consultants would also like to thank to all those individuals and entities, totalling some 3,000, who participated in this research study and for rendering this project a success. Special thanks go to Government officials responsible for OHS in the public sector, namely senior officials and OHS specialists hailing from various Ministries and Government departments. The Research Consultants are also grateful for the vital input in this study by a host of a number of health practitioners ranging from occupational therapists, physiotherapists, occupational physicians, company doctors, family doctors, occupational psychologists, general medicine specialists, oncologists and respiratory specialists; and for the valuable insights given by OHS service providers, employers and workers’
representatives, namely, general secretaries of Malta’s leading trade unions and directors of specialised associations. Also, this study would not have produced conclusive results if it were not for the essential participation of 1,200 general managers, HR managers and OHS managers hailing from public sector organisations and from micro, small, medium and large companies engaged in Malta’s (and Gozo) ten leading industry sectors. Also, last but not least, sincere thanks go to the 1,600 workers, including self-employed persons who also participated in this research study and who are currently employed with public sector organisations and private sector companies hailing from the ten leading industry sectors across the whole of Malta and Gozo.
The Research Consultants are indebted to all these individuals and entities for participating and contributing essential input towards this study. Indeed, this is the first ever study on OHS of this size and detail in Malta and will undoubtedly serve as an initial platform to encourage other OHS studies to be conducted in the near future.


TABLE OF CONTENTS
1. Introduction ................................................................................................................... 01
2. Executive Summary – Salient Findings and Conclusions ............................................ 03
3. Occupational Health and Safety – A Review of Recent Literature ............................... 13
4. Research Methodology ................................................................................................. 25
5. Qualitative Research Findings – An Overview .............................................................. 29
6. The ‘Employee’ Survey – A Quantitative Perspective .................................................. 33
7. The ‘Employer’ Survey – A Quantitative Perspective ................................................... 05
8. The cost of poor occupational health and safety standards to the nation ................ 173
9. Bibliography ................................................................................................................ 191
10. Appendix A - Supplementary ‘Employee’ Survey Findings ..................................... 193
11. Appendix B - Supplementary ‘Employer’ Survey Findings ...................................... 239

OCCUPATIONAL HEALTH AND SAFETY IN MALTA - A SNAPSHOT OF PREVAILING STANDARDS
6
The overriding objective
of the Research Project was to improve
the levels of OHS in Malta by carrying
out research into the prevailing levels
of OHS, so as to assist policy makers
to make more targeted interventions

1. INTRODUCTION
IN OCTOBER 2009, THE OCCUPATIONAL HEALTH AND SAFETY AUTHORITY (OHSA), ISSUED A FORMAL PUBLIC CALL, FOR THE CARRYING OUT OF A NATIONWIDE RESEARCH PROJECT ON THE SUBJECT OF OCCUPATIONAL HEALTH AND SAFETY (OHS) IN MALTA; A PROJECT WHICH WAS CO-FINANCED BY ESF FUNDS. IN APRIL 2010, INFORMA CONSULTANTS AND M. FSADNI & ASSOCIATES, WERE AWARDED THIS RESEARCH PROJECT.
The overriding objective of the Research Project was to improve the levels of OHS in Malta by carrying out research into the prevailing levels of OHS, so as to assist policy makers to make more targeted interventions. This overriding objective was, in turn, broken down into three specific research objectives, namely: • To deliver OHS statistics on occupational injuries,
physical ill-health and psychological ill-health, while determining the root causes of such injuries and ill-health at a macro level.
• Generate data regarding the level of access of workers to internal and external OHS services.
• Calculate the cost of the prevailing risk levels of OHS to the nation.
The Research Consultants addressed these three salient objectives by conducting a thorough and robust research study, comprising a number of specific project deliverables. This research findings report presents details of the findings of each of these project deliverables. A separate chapter has been dedicated for each project deliverable.
Chapter 2 comprises an Executive Summary, which aims at giving an overview of the salient research findings and conclusions produced by the study, addressing the three specific research objectives.
Chapter 3 seeks to provide an overview of literature including any research and statistics associated with the levels of OHS in Malta. The first part attempts to define accidents at work and occupational diseases and how statistical information is obtained. The second part provides a description of different risk factors and root causes associated with accidents at work and occupational diseases and the various costs sustained. The third part aims to provide an insight into the levels of OHS in Malta, whilst the last part takes a closer look at different models
adopted in other countries to estimate the cost of poor OHS, especially the cost of work related injuries and ill-health to the nation.
Chapter 4 outlines the primary data research methodology adopts for the entire study, comprising details of the research methodologies adopted for both the preliminary qualitative research phase and the quantitative research phases, details on the interviewed stakeholders hailing from the public and private sector, local employers and employees who participated in both the qualitative and quantitative research phases. This Chapter also lists some shortcomings of the research study.
Chapter 5 attempts to give an overview of the qualitative research findings and conclusions, based on the entire qualitative research exercise for the project, including the face-to-face personal interviews with key stakeholders from the private and public sector, the interviews with health practitioners and medical consultants, and the focus group sessions held with employees hailing from various industry sectors.
Chapter 6 presents the findings from the quantitative survey conducted with employees. The study aimed at gaining into the level of health and safety among Maltese employers hailing from 10 different industry sectors, as perceived by the employees in such companies. Self-employed persons without employees were also interviewed as part of this survey. This Chapter presents detailed quantitative findings by way of statistical tables and graphical illustrations.
Chapter 7 presents the findings gathered from the survey conducted among employers, hailing from the local private and public sectors. These employers were interviewed with the aim of better understanding the level of occupational health and safety. The detailed quantitative findings are

OCCUPATIONAL HEALTH AND SAFETY IN MALTA - A SNAPSHOT OF PREVAILING STANDARDS
2
also presented by way of statistical tables and graphical illustrations.
The last Chapter attempts to estimate the cost of OHS to Malta as a nation. The methodology of this costing exercise has been based on a business model used by UK’s Health and Safety Executive.
To conclude, it is worthy of mention that this is the first time a study on OHS of this size and detail has been commissioned in Malta. Undoubtedly, apart from obtaining a clearer picture of the prevailing levels of OHS in Malta and Gozo today, the study also serves as a platform to encourage other OHS studies to be conducted in future.

2. EXECUTIVE SUMMARY – SALIENT FINDINGS AND CONCLUSIONS
THIS REPORT PRESENTS A COMPREHENSIVE STUDY ON OCCUPATIONAL HEALTH AND SAFETY IN MALTA, EXPLORING A NUMBER OF ASPECTS WITHIN THIS CONTEXT. IT PRESENTS AN OVERVIEW OF THE CURRENT LEVELS OF HEALTH AND SAFETY AT THE WORKPLACE, PROVIDING A STATISTICAL PORTRAIT OF THE LOCAL SCENARIO.
The study set out to target three specific objectives, namely:1 Deliver OHS statistics on occupational injuries, physical
ill-health and psychological ill-health, while determining the root causes of such injuries and ill-health at a macro level.
2 Generate data regarding the level of access of workers to internal and external OHS services.
3 Calculate the cost of the prevailing risk levels of OHS to the nation.
The study comprised various research approaches including both qualitative and quantitative techniques, as well as a thorough assessment of current statistics and data on occupational health and safety available at a local and European level. Throughout the course of this project, it was also evident that there is a lack of data available at a national level on issues relating to health and safety at the workplace. The availability of such statistics could otherwise facilitate the reporting on various relevant matters in this field. Enabling such a system, would primarily involve proper documentation and reporting on occupational health and safety matters particularly by employers. Such an approach would likewise require adequate coordination, consultation and enforcement by governing authorities.
One should note that this is the first time a specific study of this size and detail has been commissioned locally, thus enabling various stakeholders to obtain a clearer picture of various aspects within the occupational health and safety field. Such findings should also facilitate the development of policies, as well as further discussions on the matter. It is also worth noting that future studies and comparisons will further enhance the value of this project and any relating decisions and policy making, which is why it is recommendable to carry out similar studies in the coming 5 to 10 years.
The overall findings of the study show similar trends with studies carried out in other countries. Among others, similarities could for instance be noted when assessing health and safety practices across companies of different sizes. Findings revealed that generally larger companies are better equipped to maintain and develop safe working practices, unlike smaller enterprises. One could also note consistencies when assessing the prevalent types of injuries and ill-health at the workplace, as well as the incidence rates of injuries and work-related ill health across different industry sectors. The findings also highlight a high level of under-reporting of cases if ill-health (both physical and psychological) as also observed internationally.
2.1 Occupational Health & Safety Statistics One of the research study’s overriding objectives was to deliver OHS statistics on occupational injuries, physical ill-health and psychological ill-health. These statistics were obtained by conducting a quantitative, one-to-one personal interview survey with employed and self-employed individuals, purposely conducted for this study. At least 1,600 survey respondents participated in this study.
The 1,600-count cohort was asked whether they had sustained an occupational injury, which led to at least one day of absence from work in 2010. As many as 94 respondents (6%) stated that they had suffered such an injury while 94% said they had not and 2 respondents refused to answer the question.
Consistent with results registered across the EU (Eurostat 2009), the highest number of occupational injuries was registered by employees hailing from the Construction (14%) and Manufacturing (13%) sectors, while the lowest rates were registered in Renting and Business Activities (1%).

OCCUPATIONAL HEALTH AND SAFETY IN MALTA - A SNAPSHOT OF PREVAILING STANDARDS
4
The 94 employed and self-employed survey respondents who sustained an occupational injury in 2010, were then asked whether they obtained a certificate verifying that their injury was caused at work. Around a third of the 94 respondents gave a negative response (32%) but the other 64 workers answered in the affirmative. Although all responses rely on self-reporting, the proportion of responses who said that their injury was officially certified as caused by work is significant. Moreover, it is possible that some of the injuries of those not in a possession of such a certificate were actually caused by work, but for various reasons, these workers did not manage to obtain the necessary certificate to prove the link.
With regards to industry sectors, respondents from Manufacturing and Transport were more likely to have a certificate (83% and 89%, respectively), while the situation in most other sectors was an equal distribution of persons with and without a document certifying that their injury was caused by work. Significantly, ‘Real Estate, Renting and Business Activities’ was the only sector where none of the workers participating in the survey had a certificate.
Those respondents, whose injury was certified as caused by work, were also asked to specify the type of injury they suffered. 39% of the respondents stated that they suffered wounds and superficial injuries. The next most common injury was dislocations, sprains and strains, mentioned by 27% of the respondents, followed by bone fractures and ‘other injuries’ with 13% each, respectively.
There was no difference in the proportions in the various sectors, but in absolute terms Construction and Manufacturing respondents reported the highest number of injuries (35). An analysis by company size shows that there were more workers with occupational injuries in companies with 50-249 employees in absolute figures – 20 of the employees were from such mid-sized companies.
The survey repeated the same sequence of the questions about occupational injuries, but this time addressing cases of occupational physical ill-health. A total of 145 of the 1603 respondents (9%) stated that in 2010 they had suffered some form of ill-health caused by work which led to at least one day of absence from their workplace. The remaining 91% of the respondents gave a negative reply, and 6 workers (less then 1%) refused to answer the question. The highest cases of occupational ill-health were registered by workers in the Health and Social Work and Construction sectors.
As with injuries, a ‘filtering’ question was posed to the 145 employees who stated they suffered from occupational ill-health in order to establish how many of these cases have been certified as work-related illness. In fact, 66 workers (45%) confirmed that a medical doctor had verified the link of their condition to their work and the remaining 79 respondents (55%) gave a negative reply. The highest proportion of certified occupational ill-health cases was in the Education sector, where 61% stated that their condition was verified, followed by 56% in Construction and 50%.
With regards to the types of occupational physical ill-health suffered in 2010, the majority of respondents indicated that they had a musculoskeletal disorder (21%) or a neurological disorder (17%). Other commonly mentioned cases of ill-health included infections (mentioned by 15%), and respiratory disorders (11%). The study also showed that there were significant differences in the types of ill-health suffered according to the industry sector in which the respondents were engaged. For instance, the most common types of ill-health in Construction, Manufacturing and Other Community Activities were musculoskeletal disorders (22% and 43%, respectively), while neurological disorders were the major problem in Wholesale and Retail Trade and Real Estate and Business Activities. On the other hand, almost half of the sick respondents in Education (45%) suffered an infection in 2010.
With regards to addressing psychological ill-health at the workplace, the study focused solely on cases of ‘stress at work’ reported on employees (excluding self-employed) during 2010. The employed respondents (1,398 in total) were asked whether they suffered from some form of stress which was caused by work and which had also been certified officially by a doctor, psychiatrist or psychologist. 74 employees (5%) gave a positive reply to this question and a further 7 (1%) refused to answer Compared to the number of reported occupational injuries and ill-health and given that self-employed persons did not answer this question, this number appears very high. Worthy of mention here is that these ‘stress at work’ case findings were based on the survey respondents’ self-reporting and certification by a medical profession. Hence, these ‘stress at work’ reported findings lacked the necessary third independent source to obtain the required triangulation of data, when reporting such cases.
With regards to findings by industry sector, the highest rates of reported stress caused by work were in Other Community Activities (10%), Health and Social Work (10%), Public Administration and Education (with 9% of respondents each).

OCCUPATIONAL HEALTH AND SAFETY IN MALTA - A SNAPSHOT OF PREVAILING STANDARDS
5
2.1.1 Extrapolated Statistics for 2010Extrapolating the number of ‘uncertified’ cases of occupational injuries reported in the study to Malta’s 161,610-count workforce (LFS Q4/2010, NSO, 2011), the total number of uncertified occupational injuries amount to 9,477 cases. Whilst extrapolating the number of ‘certified’ cases of occupational injuries reported in the study, the total number of certified occupational injuries amount to 6,452 cases.
If one conducts a similar extrapolation exercise, this time focusing on the occupational ill-health cases sustained by employees in 2010, according to the study, the total number of ‘uncertified’ cases of occupational ill-health cases reported topped 14,618 cases. Whilst extrapolating the number of ‘certified’ cases of occupational ill-health cases reported in the study, the total number of certified occupational ill-health cases in 2010 amount to 6,654 cases.
The extrapolated figures for ‘certified’ psychological ill-health at the workplace stand at 7,760 cases in 2010. This extrapolated exercise for cases of occupational psychological ill-health was based on Malta’s 146,597-count employed cohort only and excluded the self-employed cohort.
Totalling the extrapolated figures for ‘certified’ occupational injuries, ill-health and psychological ill-health cases reported in 2010, based on the employee study findings, amounts to a significant 31,855 cases. Totalling the extrapolated figures for ‘certified’ occupational injuries ill-health and psychological ill-health cases and excluding the occupational psychological ill-health cases in 2010, still amount to a significant 13,106 cases. According to NSO non-fatal accidents figures reported in 2010 (Accidents at Work Q4/2010, NSO, 2011), based on cases for which an injury benefit claim was submitted to the Department of Social Services, the total number of accidents amounted to 3,314 injuries. These injuries include occupational injuries and occupational ill-health cases sustained by employees in 2010 but exclude psychological ill-health cases.
Comparing like with like, if one compares the extrapolated total number of cases of ‘certified’ occupational injuries and ill-health cases sustained by workers in 2010, based on the research findings, against the number of similar cases reported by NSO (based on the injury benefit claim submitted to DSS) for the same year, one observes a significant under-reporting of 9,792 cases. According to the study, in 2010, the number of occupational injuries/ill-health cases stood at 13,106 cases, against NSO’s 3,314
reported cases, resulting in a significant under-reporting of 75% of occupational injuries and ill-health cases during the course of just 12 months.
The high level of under-reporting is a common factor across various countries which undermines the ability to present accurate data on accidents at work. When evaluating the difference in reported cases, the findings from the research have shown that a substantial percentage of workers who sustained an injury or ill-health at work, did not resort to injury leave in the first place and therefore did not complete an NI-30 form registering this injury. The variance therefore arises due to the fact that, rather then resorting to injury leave, workers resorted to sick leave, vacation leave, or returned to work despite the injury.
2.1.2 Root Causes of OHSAnother objective of the research study was that of identifying the root causes of injuries at work during 2010. The respondent employers were asked to identify the root causes for occupational injuries and work related ill-health which resulted in the respective injuries.
Some half of the interviewed employers who indicated that their company sustained an injury during the course of 2010, reported ‘incorrect working practices’ as being the prime root cause of injuries at their workplace. Other root causes registered, but to a much lesser degree, included ‘lack of communication’, ‘unfavourable environmental conditions’ and ‘unexpected failure’. Worthy of mention is that these root causes were experienced by large and small employers, irrespective of company size.
An analysis of the root causes of physical ill-health was also carried out. The findings clearly show the two prime root causes of occupational physical ill-health at the Maltese workplaces are ‘unfavourable environmental conditions’ and incorrect working practices’. This was, in fact, reported by a third of the employers who sustained an occupational ill-health at their workplace.
The root causes of the psychological ill-health were also assessed by the study. From the employers who reported cases of psychological ill-health at their workplace in 2010, some 40% indicated that the prime root cause for these comprise ‘the workload involved’, followed by ‘pressure and deadlines’ and ‘excessive hours spent at work’. Once again, these root causes by reported by large and small employers.
When assessing the root causes of cases of psychological ill health, one can note that the main reason is the workload

OCCUPATIONAL HEALTH AND SAFETY IN MALTA - A SNAPSHOT OF PREVAILING STANDARDS
6
involved registering 41.9%. This is followed by two similar reasons namely ‘pressure and deadlines’ and ‘excessive hours spent at work’ registering 38.7% and 25.8% respectively.
2.2 Level of Access to Internal and External OHS ServicesThe research with both employers and employees has presented a clear indication of the extent of access of workers to internal and external services relating to occupational health and safety. A number of areas, particularly those involving certain legal obligations, were analysed obtaining relevant feedback on the matter.
It results that around half of the workers feel informed about their rights and duties in health and safety matters, whilst quarter of the working force felt they were not so well informed or not informed at all. The latter is even more so in the Public Administration sector and the Education sector. Generally those employees engaged in the larger companies feel much more informed of their rights and duties regarding health and safety when compared to smaller companies. The research has in fact shown that only 4% of respondents working in the largest firms stated that they do not feel well informed. A more formal structure together with training provided in such firms contributes to such positive results.
On the other hand, one of the main factors which contributes to poor levels of health and safety at the workplace is the lack of a competent person designated to deal with such matters. The research has revealed that the majority of employers (61.5%) do not have such a designated person. This is less likely to occur among larger companies where an appointment of a competent person is more apparent.
Similarly, the appointment of a workers’ health and safety representative is particularly lacking in Malta. Results in fact show that only 15.8% of employers said that such a representative was appointed.
When assessing the existence of health and safety policies at the workplace, one can note considerable variations among the different industries. Companies within the ‘Hotels & restaurants’ sector are the most likely to have a health and safety policy, followed by the ‘Construction, mining & quarrying’ sector. On the other hand, companies within the ‘Wholesale, retail trade, and repairs’ sector are highly lacking in this aspect. Nevertheless, despite the existence of a health and safety policy, the results present reservations in terms of the validity of such policies as reported by a number of employers. This is particularly
so due to the lack of adherence among such companies to certain essential health and safety practices, namely involving the designation of competent persons on health and safety matters; the appointment of worker’s health and safety representatives; and performance of risk assessments.
Taking a closer look at the training provided on health and safety reveals that 40% of workers were never provided training by their employer specifically related to health and safety. About one-third of the respondents stated that such training is provided on recruitment, whilst another 24% stated that training is given when new work practices are introduced. The research also clearly reveals that the frequency of health and safety training steadily increases with company size.
Another aspect analysed through this study dealt specifically with the performance of risk assessments. Just over half of employers conduct risk assessments, and consistent with other aspects, larger companies seem to be more geared up towards performing risk assessments, whilst this is less likely among the micro companies. It also results that companies which do perform risk assessments generally involve employees in this exercise, as was reported by 81.3% of employers interviewed.
The study also assessed the performance of risk assessments in specific cases, namely involving pregnant women, persons with a disability, foreign workers, and older employees. Findings have shown that employers are more likely to conduct a specific risk assessment for pregnant workers followed closely for a person with a disability, while less likely for foreign or aging workers.
The majority of respondents (60%) reported that no medical surveillance has been carried out by their employer prior to joining the organisation. Comparing the practices adopted by different companies in this regard reveals that larger employers are much more likely to conduct a medical examination of their workers’ health prior to employment when compared to smaller firms. In fact, only 18% of respondents from micro businesses gave a positive reply compared to 74% of workers in the largest companies
Furthermore, medical surveillance during employment reveals inferior results. Only 15% of the workers reported having medical examinations by their employers during employment. Once again, larger companies seem to have a stronger commitment to medical surveillance even during employment.
OCCUPATIONAL HEALTH AND SAFETY IN MALTA - A SNAPSHOT OF PREVAILING STANDARDS
7
In view of accessing the level of access to occupational health and safety services, the study also involved an assessment on the use of a number of OHSA’s services. The study shows that around 32% of employers have made use of one or more of OHSA’s services. The ‘Public administration’ sector is among the most likely to use OHSA’s services, and the ‘Construction, quarrying & mining’ sector also shows a higher percentage than other sectors when assessing access to their services.
Results also reveal that generally employers reported a high level of satisfaction with the services offered by OHSA. It is also worth noting that during the qualitative phase of the research, reference was often made to the evident lack of resources, both human and financial, within OHSA which consequently undermines their capability to carry out their various roles. Employers were generally aware of the limitations faced by OHSA due to such an issue. In view of the high level of satisfaction reported as well as the awareness of the limited resources made available to OHSA, an increase in resources could potentially lead to an enhanced overall service.
The qualitative findings also revealed a strong lack of awareness and knowledge on a number of issues dealing with health and safety at the workplace. One could note a number of misconceptions in terms of the duties and obligations of employers, employees, as well as about the role and function of OHSA. Bearing these issues in mind, workers do not seem to enjoy their full rights at law, or benefit from proper access of OHS services. The survey indicates for instance, that a substantial percentage of workers who sustained an injury work did not resort to injury leave, but resorted to sick leave instead or continued going to work.
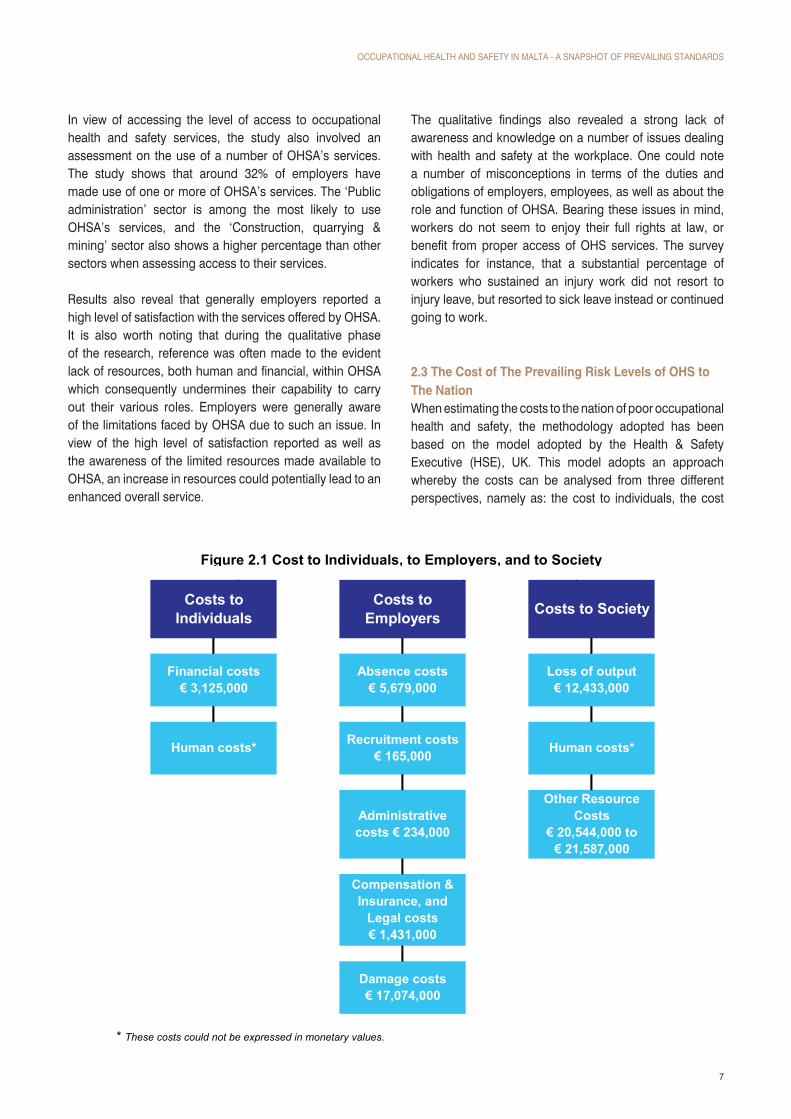
2.3 The Cost of The Prevailing Risk Levels of OHS to The NationWhen estimating the costs to the nation of poor occupational health and safety, the methodology adopted has been based on the model adopted by the Health & Safety Executive (HSE), UK. This model adopts an approach whereby the costs can be analysed from three different perspectives, namely as: the cost to individuals, the cost
estimating costs in certain cases, and therefore one must exercise caution when comparing the overall cost to the economy with similar studies conducted abroad. The following chart displays the respective costs when assessing the three different perspectives.
Figure 2.1 Cost to Individuals, to Employers, and to Society
Loss of output € 12,433,000
Human costs*
Financial costs € 3,125,000
Costs to SocietyCosts to Employers
Costs to Individuals
Damage costs € 17,074,000
Compensation & Insurance, and
Legal costs € 1,431,000
Administrative costs € 234,000
Recruitment costs € 165,000
Absence costs € 5,679,000
Other Resource Costs
€ 20,544,000 to € 21,587,000
Human costs*
* These costs could not be expressed in monetary values. 2.3.1 Cost to Individuals When estimating the cost to individuals, these were subdivided into 2 major groups – financial costs and ‘human costs’ - such as pain, grief and other suffering that the affected individuals and their families have to go through as a result of the occupational injuries or ill-health of the victim. With regards to the human costs, these are difficult to estimate, given that they are subjective in nature and cannot be quantified in a straightforward way as financial costs can. Although the HSE has considered court awards and willingness to pay (WTP) economic models to assess the possible cost of human suffering, all the available methods are shown to have serious limitations. Moreover, it is

OCCUPATIONAL HEALTH AND SAFETY IN MALTA - A SNAPSHOT OF PREVAILING STANDARDS
8
to employers, and the cost to society as a whole. The latter is the cost considered when estimating the overall cost to the nation.
The year 2010 was used as a base year for all calculations in the costing analysis. The main source of data has been based on statistics collected by means of the two national surveys carried out within the context of this study, targeting both employers and employees. Other sources also included the Labour Force Survey (LFS) 2010, the Department of Social Security, the Occupational Health and Safety Authority, and Accidents at Work news releases by the National Statistics Authority. Nevertheless, due to the lack of data about certain cost categories a number of assumptions and estimates had to be made. This has resulted in a rather conservative approach being taken when estimating costs in certain cases, and therefore one must exercise caution when comparing the overall cost to the economy with similar studies conducted abroad.
Figure 2.1 displays the respective costs when assessing the three different perspectives.
2.3.1 Cost to IndividualsWhen estimating the cost to individuals, these were subdivided into 2 major groups – financial costs and ‘human costs’ - such as pain, grief and other suffering that the affected individuals and their families have to go through as a result of the occupational injuries or ill-health of the victim. With regards to the human costs, these are difficult to estimate, given that they are subjective in nature and cannot be quantified in a straightforward way as financial costs can. Although the HSE has considered court awards and willingness to pay (WTP) economic models to assess the possible cost of human suffering, all the available methods are shown to have serious limitations. Moreover, it is extremely difficult to estimate the number of deaths due to occupational ill-health, given that several of them may occur several years after the person has stopped working, and that insufficient links can be made between exposure to health hazards at work and death. Therefore, it was not possible to present a realistic estimate of the ‘human costs’ incurred by individuals as a direct result of the current levels of health and safety in Malta.
The financial costs to individuals amounted to a total of €3,125,000. This consists of loss of income due to sick leave and injury leave as a result of an accident at work; loss of income when absent from work e.g. part-time jobs, overtime, bonuses etc.; extra expenditure on medicines. The main contributor to these costs is the loss of income
when absent from work - €2,450,000. Generally the loss of income due to leave is minimal since the employee is still likely to receive his salary partly by the employer and partly through injury or sick leave benefits.
2.3.2 Cost to EmployersThe costs to employers have been calculated by estimating five predominant costs, namely:• Absence Costs• Administrative Costs• Recruitment Costs• Damage to materials and equipment from Injuries &
non-injuries• Compensation and insurance costs, and legal costs
In some cases, the research has shown that when a person sustains a work related injury or ill-health, some employees have resorted to sick leave rather than injury leave. Therefore, when calculating the absence costs, both sick leave and injury leave which was taken as a result of an accident or ill-health at the workplace was taken into consideration. The total cost to employers based on occupational sick pay in 2010, is estimated at approximately €3,138,000, whilst the cost to employers of sick leave absence due to work-related injuries or ill health amount to €2,541,000. Therefore the total absence costs to employers during 2010 sums up to an estimated €5,679,000.
The total administrative cost to employers for occupational injuries and work related ill-health during 2010 amount to an estimated € 234,000. This type of cost is based on the fact that when an employee sustains an occupational injury or ill-health, the employers typically incur a cost in dealing with the administrative tasks associated with sickness/injury absence. Based on the HSE model, these tasks can be expected to include: Calculation of sick pay; Processing sick leave requests, certificates; Re-organisation of tasks, staff etc.
When assessing the cost of damages incurred by a company, two distinct circumstances were considered. The first consists of damages incurred as a direct result of the accident, whilst the second consists of damages due to non-injury accidents. The latter is defined by HSE as “any unplanned event that results in damage or loss to property, plant, materials, or the environment or a loss of business opportunity but does not result in an injury.” The HSE takes the view that non-injury accidents have the potential to cause human harm and are caused by the same management failures that lead to injury accidents. Based on the findings, the cost of damages as a result of injuries

OCCUPATIONAL HEALTH AND SAFETY IN MALTA - A SNAPSHOT OF PREVAILING STANDARDS
9
during 2010 is estimated at €3,985,000, whilst the costs of damages as a result of non-injury accidents during 2010 are substantially higher, and are estimated at €13,089,000. The total recruitment costs to employers in 2010 are estimated at €165,000. The recruitment costs are based on the assumption that when an employee sustains an occupational injury or work-related ill health, the employer may be required to replace the person. The activities that contribute to the cost of recruitment are: Payroll (administrative work involved); Interview, training of a new worker; Marketing, screening, e.g. job advertisements and application sifting; reduction in the quality of service/productivity before and after the replacement period.
Unlike the UK, employers in Malta are not legally required to have an Employer’s Liability and Compensation Insurance policy. However, although such a policy is not legally required in Malta, some local companies do have an Employer’s Liability cover and these are being taken into consideration when assessing the cost to employers.
The most recent data available on such claims for Malta relates to 2009. Since not much change is expected in 2010, the data for 2009 is being used for this costing exercise. According to data available through the Malta Financial Services Authority (MFSA, 2009), and adding 15% to cater for the administrative and profit premium of insurers, the total costs of compensation and insurance is estimated at €1,313,000.
When assessing legal costs involved, during the reference year (2010) the OHSA reported in its annual report that it prosecuted a total 223 criminal cases of which 46 cases involved the compilation of evidence before the Courts of Criminal Inquiry, whilst 177 cases were appointed before the Court of Magistrates acting as a Court of Judicature. A total of 143 cases were decided during 2010. In these cases the Courts imposed a total of €118,000 in fines and two suspended imprisonment sentences.
However, this figure only represents the actual fine imposed and does not reflect other costs to employers such as employer’s own time lost to appear in Court, preparation time for court sittings and legal costs, such as payment of lawyers. No sufficient data is available to estimate such costs.
The costs to employers during 2010 based on the estimates outlined above amounts to a total of € 24,583,000.
2.3.3 Cost to SocietyThe costs to society include those borne by the individuals and employers directly affected. However the total cost to society is not a simple aggregation of these costs. Firstly, there is the issue of transfer payments. For example, social security payments represent income to individuals but are a cost to the taxpayer. They are a transfer between groups in society and involve no resource cost to society as a whole. Secondly, there are costs borne by the taxpayer in general, such as for National Health Service treatment and the administration of disablement and other social security benefits.
Therefore when assessing the costs to society we are only considering direct costs to society. The costs to society are broken down into three components:• Loss of output• Other resource costs (damage; administration; medical
treatment; and OHSA costs)• Human costs
When estimating the loss of output, the costing approach being adopted takes into consideration days lost to an employer using both injury leave and sick leave, which amounts to €8,529,000. In addition to this the loss of output when absent from work from part-time jobs, overtime, benefits, and bonuses is also being included. Based on the findings of the survey, this was estimated at €2,450,000. Unfortunately no data is available on the number of people who withdrew from the labour force, which therefore does not allow us to calculate the total lost output form such persons. However, during 2010, a total of 4 fatalities were registered. However, one of the fatalities consisted of a migrant worker for which no data was available which could enable the calculation of such costs. In the case of fatalities, the lost output is calculated by estimating the working years lost and calculating the net present value of these costs. The total cost of lost output due to fatalities in 2010 has been estimated at €1,454,000, of which €22,000 were incurred directly during 2010.
As was estimated in the costs to employers, the cost of damages as a result of non-injury accidents during 2010 was estimated at €13,089,000, whilst the cost of damages as a result of injuries was estimated at €3,985,000. This leads to a total cost of damages to society of €17,075,000.
The total administrative cost to society, adds up to €608,000. This includes some of the costs to employers (Recruitment and administrative costs); as well as the administrative costs

OCCUPATIONAL HEALTH AND SAFETY IN MALTA - A SNAPSHOT OF PREVAILING STANDARDS
10
involved in the insurance costs. Another cost which needs to be considered is the administration cost incurred by the Social Security department since this is also eventually borne by the taxpayer.
In Malta the cost of medical treatment is largely publicly funded, and therefore paid for by taxpayers in general. The cost of providing medical treatment has therefore been included as a cost to society. Unfortunately no data was provided with reference to the running and operational costs of Mater Dei, which could facilitate the costing exercise of treatment provided to persons injured at work. In absence of such costs, we have resorted to the Healthcare (Fees) Regulations available in the local legislation which outline the fees to be charged for treating patients who are foreign citizens. In a few cases prices of certain interventions were also obtained from the billing section of Mater Dei. In certain cases an average fee was also established based on the fees provided in the Healthcare Fees Regulations.
Due to the lack of information on Mater Dei’s operational costs it is difficult to conclude whether the prices quoted include a profit margin or not. Likewise it is also possible that certain treatment could incorporate a lower profit margin than others, if any. We are therefore taking an upper and lower limit approach in view of such expenditure, by assuming a high profit margin of 50% when calculating the lower limit expenditure, and a 0% margin when calculating the upper limit expenditure.
The research has allowed us to obtain data on the type of treatment received due to work related injuries and ill-health in 2010, as well as the duration of such treatment. The types of medical interventions, if any, were also obtained form survey data. Based on these results, the total costs of treatment incurred during 2010 ranges between € 1,415,000 (allowing for a 50% mark-up) and € 2,123,000 (assuming no mark-up). Furthermore, based on the number of different interventions and the applicable rates for such interventions, the cost for 2010 ranges between €671,000 (allowing for a 50% mark-up) to €1,007,000 (assuming no mark-up).
The total cost to society for medical treatment therefore ranges between €2,087,000 to €3,130,000.
When calculating the costs to society, one also needs to incorporate the costs of the regulatory authority on health and safety – the OHSA. Actual figures of the investigation costs related directly to accidents at work are not available. For the purpose of this study we are including the total
government expenditure of OHSA for 2010. This amounts to a total cost of € 774,000 (OHSA, 2010).
At this stage one can look at the overall cost to the economy, and in order to do so we can consider this to be equivalent to the cost to society since in our previous calculations we have excluded the human costs resulting from pain, grief and suffering of individual victims and their families.
When considering the cost to the economy, only direct costs to society are taken into consideration. We do not attempt to estimate so-called ‘second round effects’, such as employers passing on the costs of workplace injuries and non-injury accidents and work-related ill-health.
The overall cost to the Maltese economy of all workplace injuries and work-related ill health in 2010 is estimated to be between €32,977,000 to €34,020,000. This is equivalent to between 0.53% to 0.54% of the total Maltese Gross Domestic Product for 2010, which is estimated at €6.2 billion (NSO 2011).
2.4 Variances in Research FindingsThe statistics on OHS were gathered by means of two comprehensive surveys targeting employers and employees. In view of obtaining relevant and reliable statistics on a number of issues dealing with health and safety at the workplace, the study warranted research with both the employer and the employee, thus capturing adequate data accordingly. Nevertheless, the instruments used to carry out the surveys combined some common elements. A number of research areas were examined among both the employer and the employee, and although the outcome generally presented consistent results, in some cases one could note certain discrepancies between the data obtained from employees and that obtained from employers. Some of the areas where variances were registered are examined further below.
The first variance one could note between the two surveys relates to the appointment of a competent person on health and safety at work. Results registered in the employee survey show that a total of 48.3% of employees either said that the company does not engage such a person, or weren’t sure whether the company does. This result was considerably lower when compared to the 61.5% of employers who said that there is no person designated on matters dealing with health and safety at work. This possible reason for such a variance could be due to a wrong interpretation by employees of what constitutes a competent person on health & safety. The findings from

OCCUPATIONAL HEALTH AND SAFETY IN MALTA - A SNAPSHOT OF PREVAILING STANDARDS
11
the employer’s survey are considered more reliable due to the direct knowledge on the matter from the employers interviewed.
Similarly, the appointment of a workers’ health and safety representative also registered different results in both surveys. Whilst 15.8% of employers said that such a representative was appointed, the findings from the employee survey revealed a higher percentage, possibly due to the wrong interpretation of a worker’s health and safety representative by certain employees. For this reason, the results obtained from the employer’s survey are considered to be more reliable.
Another variance was registered when examining whether a health and safety policy exists at the place of work. Results reported in the Employee findings show a higher percentage of companies who have a health & safety policy in place. Nevertheless this could be over represented due to the fact that once again, it might have been interpreted its widest possible sense, therefore being highly subjective to the employee’s interpretation.
It is also worth noting that even among employers, the health & safety policy was likely to be interpreted in its widest sense, therefore including both policies with little or no declaration of commitment, as well as rigorous policies with a strong commitment. This was substantiated further when companies who said they have a health and safety policy defaulted in terms of the performance of a number of tasks and processes relating to adequate health and safety practices.
OCCUPATIONAL HEALTH AND SAFETY IN MALTA - A SNAPSHOT OF PREVAILING STANDARDS
12
During the course of this research
project a diverse range of workers
and employers from different sectors
within Malta and Gozo have been
involved and consulted, providing
relevant feedback which may assist
policy makers with more targeted
interventions at a national level
3. OCCUPATIONAL HEALTH AND SAFETY – A REVIEW OF RECENT LITERATURE
3.1 IntroductionIn 2009, according to EuroStat figures, almost 7 million workers in the EU-27 had an accident at work during a one year period (2007) and 20 million persons experienced a work-related health problem. Furthermore 81 million workers are exposed to factors that can adversely affect physical health & 56 million workers are exposed to factors that can adversely affect mental well-being (De Norre, 2009).
The Labour Force Survey (LFS) carried out in 2007 indicated that the highest sector in the EU-27 to report having accidents at work was Construction, followed by Manufacturing, Agriculture, Hunting & Forestry, Hotel & Restaurant, Transportation, Storage & Communication for men whilst, Health & social work followed by Hotel & Restaurant, Agriculture, hunting & forestry, Transport, storage & communication & Wholesale retail trade, repair & education were those indicated for women (De Norre, 2009). The highest work-related health problems experienced in the past twelve months of the survey (LFS, 2007) for both men & women alike were bone, joint or muscle problems which mainly affected the back. Sectors reporting the most work-related health problems for men were Mining & Quarrying. Statistically women were more prone to sustain work-related health problems when compared to men. All sectors have higher reports by women sustaining these health problems with the highest reported in Agriculture, hunting & forestry followed by Health & social work (De Norre, 2009).
Such statistics show that a large quantity of the population is being affected during their course of work, leaving many workers unfit for work for a period of days, months or even a year. 0.7% of all workers in the EU-27 were out on sick leave for at least one month due to an accident at work, 22% of workers experienced considerable limitations in normal daily activities due to work-related health problems. Identified costs at micro level associated with
ill-health include sickness absence, overtime payments, lost production, missed deadlines, costs of recruiting & re-training of staff, whilst adding in strain on the workers to cover the work of their colleagues that have fallen ill (HSE, 2002) Estimated costs in 1996 for the Netherlands, in relation to work related musculoskeletal disorders alone were $160 million in direct costs & $527 million in indirect costs (Buckle & Devereux, 2002).
In effect, this research project commissioned by the Occupational Health and Safety Authority (OHSA) sets out to investigate, among other things, the prevailing levels of OHS in Malta and the levels of access to OHS for workers and employers.
During the course of this research project a diverse range of workers and employers from different sectors within Malta and Gozo have been involved and consulted, providing relevant feedback which may assist policy makers with more targeted interventions at a national level.
OverviewThis chapter seeks to provide an overview of literature including any research and statistics associated with the levels of OHS in Malta. The first part attempts to define accidents at work and occupational diseases and how statistical information is obtained. The second part provides a description of different risk factors and root causes associated with accidents at work and occupational diseases and the various costs sustained. The third part aims to provide an insight into the levels of OHS in Malta, whilst the last part takes a closer look at different models adopted in other countries to estimate the cost of work related injuries and ill-health to the nation.
Defining Accidents at Work and Work-Related Ill-HealthAccidents at work have been defined as discrete occurrences, or events, during the course of work which lead to physical or mental harm (European Commission,

OCCUPATIONAL HEALTH AND SAFETY IN MALTA - A SNAPSHOT OF PREVAILING STANDARDS
14
3.3 Defining Accidents at Work and Work-Related Ill-Health
Accidents at work have been defined as discrete occurrences, or events, during the course of work which lead to physical or mental harm (European Commission, 2004). This clearly indicates that any physical or mental harm must be sustained during the time spent at work, while engaged in an occupational activity. The types of injuries associated with physical harm have been classified by the European Statistics (EuroStat) and include the types of injuries listed in Table 1 below:
Table 3.1 - EuroStat Classification System for Type of Injury (EuroStat, 2010)
Type of Injury Type of injury unknown or unspecified Wounds and superficial injuries Superficial injuries Open wounds Other types of wounds and superficial injuries Bone fractures Closed fractures Open fractures Other types of bone fractures Dislocations, sprains and strains Dislocations and subluxations Sprains and strains Other types of dislocations, sprains and strains Traumatic amputations(Loss of body parts) Concussion and internal injuries Concussion and intracranial injuries Internal injuries Other types of concussion and internal injuries Burns, scalds and frostbite Burns and scalds (thermal) Chemical burns (corrosions) Frostbites Other types of burns, scalds and frostbite Poisonings and infections Acute poisoning Acute infections Other types of poisonings and infections Drowning and asphyxiations Asphyxiation Drowning and non-fatal submersions Other types of drowning and asphyxiation Effects of sound and vibration Acute hearing loss Other effects of sound and vibration Effects of temperature extremes, light and radiation Heat and sunstroke Effects of radiation (non-thermal) Effects of reduced temperature Other effects of temperature extremes, light and radiation Shock Shocks after aggression or threats Traumatic shock Other types of shock Multiple injuries Other specified injuries not included under other headings
2004). This clearly indicates that any physical or mental harm must be sustained during the time spent at work, while engaged in an occupational activity. The types of injuries associated with physical harm have been classified by the European Statistics (EuroStat) and include the types of injuries listed in Table 1 below:

OCCUPATIONAL HEALTH AND SAFETY IN MALTA - A SNAPSHOT OF PREVAILING STANDARDS
15
Work-related health problems, also known as occupational diseases, indicates illnesses (or diseases), disabilities & other physical or psychological health problems, apart from accidental injuries, that have been caused or made worse by work both past & current (De Norre,2009). Table 2 below indicates the health problems falling within this category as classified by the European Occupational Disease Statistics (EODS), 2000.
Table 3.2 - Types of diseases (EODS, 2000)
Cancers Liver Cancer Cancer of the nasal cavity Cancer of the accessory sinuses Laryngeal cancer Lung cancer Mesothelioma Bladder cancer Leukaemia Precancerious skin lesions Respiratory Diseases Asthma Allergic rhinitis Allergic alveolitis Nasal ulcerations Nasal perforation Chronic bronchitis Asbestosis Diffuse thickening of the pleura Pleural plaques Pleural effusion Coal workers’ pneumoconiosis Silicosis Pneumoconiosis associated with tuberculosis Pneumoconiosis due to other silicates Byssinosis Hard metal disease Neurological Diseases Carpal tunnel syndrome Toxic encephalophaty Polyneurophaty Diseases of the sensory organs Cataract Noise-induced hearing loss Cardiovascular Diseases Raynaud’s syndrome Skin Diseases Allergic contact dermatitis Irritant contact dermatitis Unspecified contact dermatitis Contact urticaria Acne
Work-related health problems, also known as occupational diseases, indicates illnesses (or diseases), disabilities & other physical or psychological health problems, apart from accidental injuries, that have been caused or made worse by work both past & current (De Norre,2009).
Table 2 below indicates the health problems falling within this category as classified by the European Occupational Disease Statistics (EODS), 2000.

OCCUPATIONAL HEALTH AND SAFETY IN MALTA - A SNAPSHOT OF PREVAILING STANDARDS
16
Musculoskeletal Diseases Arthrosis of the elbow Arthrosis of the wrist Degeneration lesions of the meniscus (knee) Bursitis of elbow Bursitis of knee Tenosynovitis of the hand and wrist Medical epicondylitis (elbow) Lateranl epicondylitis (elbow) Infections Tubercolosis Brucellosis Erysipeloid Hepatitis A Hepatitis B Hepatitis C Hepatitis E Other specific Hepatitis HIV Ancylostomiasis Leptospirosis Additional Infectious Diseases Cholera Typhoid and parathyphoid fever Salmonellosis Shigellosis Other bacterial intestinal infection Amoebiasis Tularaemia Anthrax Tetanus Diphtheria Erysipelas Borreliosis Ornithosis Avian Chlamydiosis Q Fever Rickettsiosis Poliomyelitis Rabies Haemorrhagic Fever Varicella Measles Rubella Mumps Dermatophtosis Malaria Coding of the toxic and irritant effects Hemolytic anaemia Anemia Secondary thrombocytopenia Agranyloctosis and Neutropenia Bronchitis (acute) or Pneumonitis Pulmonary oedema Upper respiratory inflammation Reactive Airways Dysfunction Syndrome Pulmonary Fibrosis Toxic liver disease Tubulo-interstitial kidney diseases Chronic renal failure Colic and other gastrointestinal symptoms
3.4 Reporting Procedures and Gathering of Statistical Data Statistics in Malta for accidents at work and work related ill-health are mainly distributed to the European Statistical System (ESS) by the National Statistics Office (NSO). These statistics are provided by OHSA in the case of fatalities at work, whilst in the cases of reported injuries and ill-heath, these are provided by the Department of Social Security (DSS). Persons sustaining an injury at work or a work-related disease may apply to receive social security benefits for any accidents that left the injured unfit for work for 3 days and over and from the first day onwards for diseases (DSS, 2010). Both these application forms are in line with the European Statistics required and use the types of injuries and diseases listed in ESAW & EODS. This not only facilitates reporting but it also ensures reliability of data since both documents are signed off by medical practitioners. On the other hand the widows’ pension application also allows for an indication as to whether the death was a result of an accident or disease sustained during employment. The payment of benefits in cash allows for high reporting levels for accidents at work since there is an economic incentive for the employer and employee to notify an accident at work (European Commission, 2004), although one must also consider the potential implications of over reporting due to such incentives. The following table and figure display the reported accidents at work published by NSO throughout the past 10 years.
Table 3.3 - Accidents at Work - 2001 to 2010 Year 2001 2002 2003 2004 2005 2006 2007 2008 2009 2010 Accidents at work 5061 4936 4746 4111 4002 4366 4328 4023 3366 3314
Figure 3.1 - Accidents at Work - 2001 to 2010
0
1000
2000
3000
4000
5000
6000
2001 2002 2003 2004 2005 2006 2007 2008 2009 2010Year
No.
of A
ccid
ents

OCCUPATIONAL HEALTH AND SAFETY IN MALTA - A SNAPSHOT OF PREVAILING STANDARDS
17
Reactive Airways Dysfunction Syndrome Pulmonary Fibrosis Toxic liver disease Tubulo-interstitial kidney diseases Chronic renal failure Colic and other gastrointestinal symptoms
3.4 Reporting Procedures and Gathering of Statistical Data Statistics in Malta for accidents at work and work related ill-health are mainly distributed to the European Statistical System (ESS) by the National Statistics Office (NSO). These statistics are provided by OHSA in the case of fatalities at work, whilst in the cases of reported injuries and ill-heath, these are provided by the Department of Social Security (DSS). Persons sustaining an injury at work or a work-related disease may apply to receive social security benefits for any accidents that left the injured unfit for work for 3 days and over and from the first day onwards for diseases (DSS, 2010). Both these application forms are in line with the European Statistics required and use the types of injuries and diseases listed in ESAW & EODS. This not only facilitates reporting but it also ensures reliability of data since both documents are signed off by medical practitioners. On the other hand the widows’ pension application also allows for an indication as to whether the death was a result of an accident or disease sustained during employment. The payment of benefits in cash allows for high reporting levels for accidents at work since there is an economic incentive for the employer and employee to notify an accident at work (European Commission, 2004), although one must also consider the potential implications of over reporting due to such incentives. The following table and figure display the reported accidents at work published by NSO throughout the past 10 years.
Table 3.3 - Accidents at Work - 2001 to 2010 Year 2001 2002 2003 2004 2005 2006 2007 2008 2009 2010 Accidents at work 5061 4936 4746 4111 4002 4366 4328 4023 3366 3314
Figure 3.1 - Accidents at Work - 2001 to 2010
0
1000
2000
3000
4000
5000
6000
2001 2002 2003 2004 2005 2006 2007 2008 2009 2010Year
No.
of A
ccid
ents
3.4 Reporting Procedures and Gathering of Statistical DataStatistics in Malta for accidents at work and work related ill-health are mainly distributed to the European Statistical System (ESS) by the National Statistics Office (NSO). These statistics are provided by OHSA in the case of fatalities at work, whilst in the cases of reported injuries and ill-heath, these are provided by the Department of Social Security (DSS). Persons sustaining an injury at work or a work-related disease may apply to receive social security benefits for any accidents that left the injured unfit for work for 3 days and over and from the first day onwards for diseases (DSS, 2010). Both these application forms are in line with the European Statistics required and use the types of injuries and diseases listed in ESAW & EODS. This not only facilitates reporting but it also ensures reliability of data since both documents are signed off by medical practitioners. On the other hand the widows’ pension application also allows for an indication as to whether the death was a result of an accident or disease sustained during employment. The payment of benefits in cash allows for high reporting levels for accidents at work since there is an economic incentive for the employer and employee to notify an accident at work (European Commission, 2004),
although one must also consider the potential implications of over reporting due to such incentives.
The following table and figure display the reported accidents at work published by NSO throughout the past 10 years. The data published by NSO as displayed above is based on information provided by the Department of Social Security. The number of reported cases of accidents at work are in turn based on the NI 30 forms completed by individuals. These cases however could also include injuries which required less than 3 days off from work.
At a European level there are 2 main reporting systems namely the European Statistics on Accidents at Work (ESAW) and the European Occupational Diseases Statistics (EODS) (European Commission, 2004). The former system includes all cases of accidents at work leading to an absence of more than three calendar days, whilst the latter includes data on cases of occupational disease recognised by the national authorities. This means that only accidents over 3 days are reported to the EU,.The prevailing levels of accidents may be much higher than those indicated by European Statistics and the relative published incidence rates.

OCCUPATIONAL HEALTH AND SAFETY IN MALTA - A SNAPSHOT OF PREVAILING STANDARDS
18
the accidents reported since the variables present only account for causes and circumstances immediately preceding the accident and not the systemic (underlying) causes of accidents (Jacinto & Aspinwall, 2003) that are usually identified through an investigation.
3.6.1 Accident Causation Models
Many models of accident causation have been proposed, ranging from Heinrich's domino theory to the sophisticated Management Oversight and Risk Tree (MORT). The simple model shown in Figure 3.2 illustrates that the causes of any accident can be grouped into five categories - task, material, environment, personnel, and management (CCOHS, 2010).
Figure 3.2 – Simple Model to Illustrate the Causes of Accidents
3.7 Level of OHS Access The Occupational Health and Safety Authority Act that came into force in January 2002 in Malta, established amongst others the functions of the OHSA and laid down the principles and general duties of employers. Part of the functions of the OHSA under article 9 (2) (f) is to “promote the dissemination of information regarding occupational health and safety and the methods required to prevent occupational injury, ill-health or death” (OHSA Act, 2000). Furthermore regulation 9, subsection (2) (g) is to “promote education and training on occupational health and safety, and emergency and first aid response at work places” (OHSA Act, 2000). One of the functions assigned to the OHSA under article 9 (2) (k), is to “promote and carry out scientific research aimed at better methods of preventing occupational ill-health, injury or death” (OHSA Act, 2000). The Act also specifies the general duties of the employer to ensure the health and safety of workers at all times in every aspect related to work. The appointment of Workers’ Health and Safety Representatives is also another important milestone in the consultation process required legally (OHSA Act, 2000). This Act also establishes a number of duties of employers including the provision of “information, instruction and training…” as is required to ensure occupational health and safety (Art. 6 (3)).
3.5 Risk FactorsOne major concern also highlighted through the Labour Force Survey (LFS) of 2007 was the exposure to the Risk Factors that can adversely affect physical health or mental well-being. Risk factors can clearly increase the number of accidents at work & work-related health problems in any given year if left uncontrolled (De Norre, 2009). Persons exposed to these factors may or may not end up sustaining an accident at work or work-related health problems since it will depend on the exposures & frequencies during their course of work. As mentioned previously 81 million workers were exposed to factors that can adversely affect physical health & 56 million workers were exposed to factors that can adversely affect mental well-being, however only 27 million workers sustained accidents at work & work-related health problems (De Norre, 2009). Table 4 shows the identified main factors that can adversely affect physical health & mental well-being.
3.6 Root CausesIncidents pose considerable challenges to an organization, both in terms of the need to respond intelligently to their occurrence and in terms of the need to deal with their aftermath. The challenge is to find a way forward that provides the necessary support for the people involved while ensuring that the lessons of the incident are learned both by individual staff members and by the overall organization (Vincent, 2003). Preventing accidents and ill-health is extremely difficult without a reasonable understanding of what causes them (Jacinto & Aspinwall, 2003). Root Causes have been defined as being specific underlying causes, that can be reasonably identified and controllable by management and for which effective recommendations for preventing recurrences can be generated (Rooney & Vanden Heuvel, 2004). Effective Root Cause Analysis (RCA) has been argued to be a valuable tool for organisations (Latino & Latino, 2006) since it helps identify what, how and why something happened, which in turn prevent a recurrence. Unfortunately, although accidents are being reported in the EU-27 through the ESAW database, little information is available on the root causes of the accidents reported since the variables present only account for causes and circumstances immediately preceding the accident and not the systemic (underlying)
causes of accidents (Jacinto & Aspinwall, 2003) that are usually identified through an investigation.
3.6.1 Accident Causation Models Many models of accident causation have been proposed, ranging from Heinrich’s domino theory to the sophisticated Management Oversight and Risk Tree (MORT). The simple model shown in Figure 3.2 illustrates that the causes of any accident can be grouped into five categories - task, material, environment, personnel, and management (CCOHS, 2010).
The data published by NSO as displayed above is based on information provided by the Department of Social Security. The number of reported cases of accidents at work are in turn based on the NI 30 forms completed by individuals. These cases however could also include injuries which required less than 3 days off from work. At a European level there are 2 main reporting systems namely the European Statistics on Accidents at Work (ESAW) and the European Occupational Diseases Statistics (EODS) (European Commission, 2004). The former system includes all cases of accidents at work leading to an absence of more than three calendar days, whilst the latter includes data on cases of occupational disease recognised by the national authorities. This means that only accidents over 3 days are reported to the EU,.The prevailing levels of accidents may be much higher than those indicated by European Statistics and the relative published incidence rates. 3.5 Risk Factors One major concern also highlighted through the Labour Force Survey (LFS) of 2007 was the exposure to the Risk Factors that can adversely affect physical health or mental well-being. Risk factors can clearly increase the number of accidents at work & work-related health problems in any given year if left uncontrolled (De Norre, 2009). Persons exposed to these factors may or may not end up sustaining an accident at work or work-related health problems since it will depend on the exposures & frequencies during their course of work. As mentioned previously 81 million workers were exposed to factors that can adversely affect physical health & 56 million workers were exposed to factors that can adversely affect mental well-being, however only 27 million workers sustained accidents at work & work-related health problems (De Norre, 2009). Table 4 shows the identified main factors that can adversely affect physical health & mental well-being.
Table 3.4 - Factors that can adversely affect physical health and mental well-being (European Statistics, 2009)
Physical health Mental well-being Noise or Vibration Violence or threat Chemicals, dusts, fumes, smoke or gases Harassment or bullying Risk of accident Time pressure or overload of work Posture , movement or heavy loads
3.6 Root Causes Incidents pose considerable challenges to an organization, both in terms of the need to respond intelligently to their occurrence and in terms of the need to deal with their aftermath. The challenge is to find a way forward that provides the necessary support for the people involved while ensuring that the lessons of the incident are learned both by individual staff members and by the overall organization (Vincent, 2003). Preventing accidents and ill-health is extremely difficult without a reasonable understanding of what causes them (Jacinto & Aspinwall, 2003). Root Causes have been defined as being specific underlying causes, that can be reasonably identified and controllable by management and for which effective recommendations for preventing recurrences can be generated (Rooney & Vanden Heuvel, 2004). Effective Root Cause Analysis (RCA) has been argued to be a valuable tool for organisations (Latino & Latino, 2006) since it helps identify what, how and why something happened, which in turn prevent a recurrence. Unfortunately, although accidents are being reported in the EU-27 through the ESAW database, little information is available on the root causes of
Physical Health Mental well-being
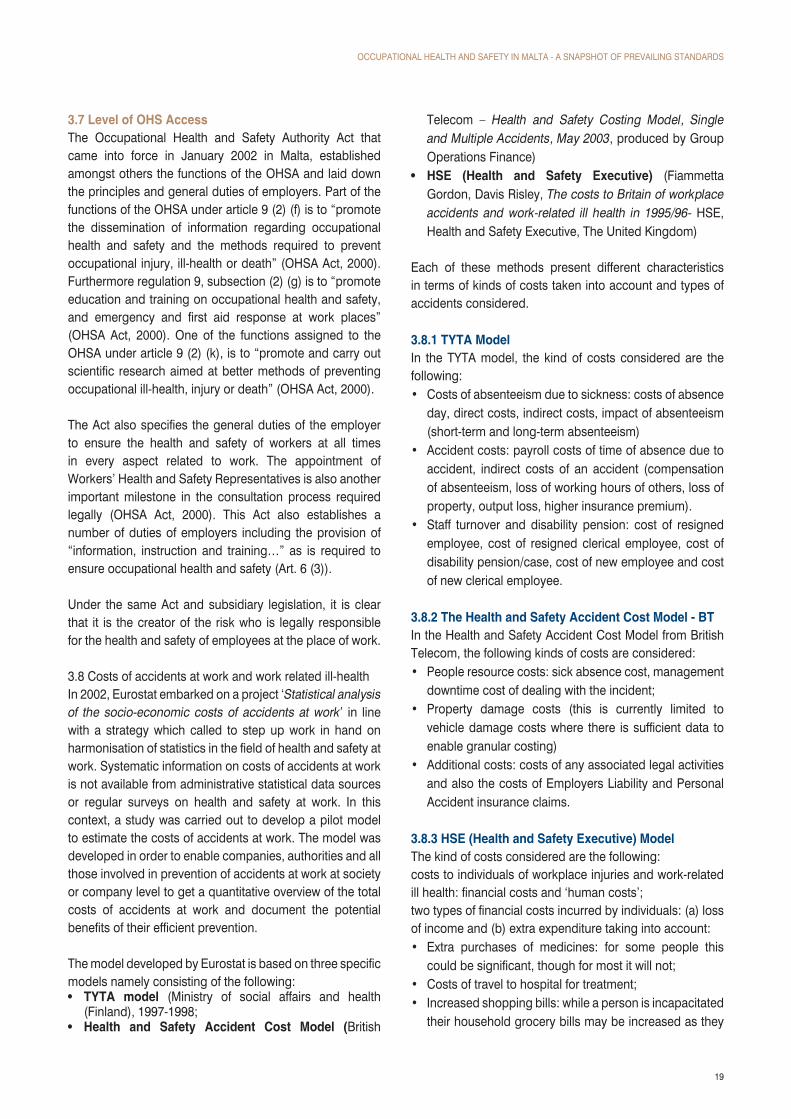
OCCUPATIONAL HEALTH AND SAFETY IN MALTA - A SNAPSHOT OF PREVAILING STANDARDS
19
3.7 Level of OHS AccessThe Occupational Health and Safety Authority Act that came into force in January 2002 in Malta, established amongst others the functions of the OHSA and laid down the principles and general duties of employers. Part of the functions of the OHSA under article 9 (2) (f) is to “promote the dissemination of information regarding occupational health and safety and the methods required to prevent occupational injury, ill-health or death” (OHSA Act, 2000). Furthermore regulation 9, subsection (2) (g) is to “promote education and training on occupational health and safety, and emergency and first aid response at work places” (OHSA Act, 2000). One of the functions assigned to the OHSA under article 9 (2) (k), is to “promote and carry out scientific research aimed at better methods of preventing occupational ill-health, injury or death” (OHSA Act, 2000).
The Act also specifies the general duties of the employer to ensure the health and safety of workers at all times in every aspect related to work. The appointment of Workers’ Health and Safety Representatives is also another important milestone in the consultation process required legally (OHSA Act, 2000). This Act also establishes a number of duties of employers including the provision of “information, instruction and training…” as is required to ensure occupational health and safety (Art. 6 (3)).
Under the same Act and subsidiary legislation, it is clear that it is the creator of the risk who is legally responsible for the health and safety of employees at the place of work.
3.8 Costs of accidents at work and work related ill-healthIn 2002, Eurostat embarked on a project ‘Statistical analysis of the socio-economic costs of accidents at work’ in line with a strategy which called to step up work in hand on harmonisation of statistics in the field of health and safety at work. Systematic information on costs of accidents at work is not available from administrative statistical data sources or regular surveys on health and safety at work. In this context, a study was carried out to develop a pilot model to estimate the costs of accidents at work. The model was developed in order to enable companies, authorities and all those involved in prevention of accidents at work at society or company level to get a quantitative overview of the total costs of accidents at work and document the potential benefits of their efficient prevention.
The model developed by Eurostat is based on three specific models namely consisting of the following:• TYTA model (Ministry of social affairs and health
(Finland), 1997-1998; • Health and Safety Accident Cost Model (British
Telecom – Health and Safety Costing Model, Single and Multiple Accidents, May 2003, produced by Group Operations Finance)
• HSE (Health and Safety Executive) (Fiammetta Gordon, Davis Risley, The costs to Britain of workplace accidents and work-related ill health in 1995/96- HSE, Health and Safety Executive, The United Kingdom)
Each of these methods present different characteristics in terms of kinds of costs taken into account and types of accidents considered.
3.8.1TYTAModelIn the TYTA model, the kind of costs considered are the following:• Costs of absenteeism due to sickness: costs of absence
day, direct costs, indirect costs, impact of absenteeism (short-term and long-term absenteeism)
• Accident costs: payroll costs of time of absence due to accident, indirect costs of an accident (compensation of absenteeism, loss of working hours of others, loss of property, output loss, higher insurance premium).
• Staff turnover and disability pension: cost of resigned employee, cost of resigned clerical employee, cost of disability pension/case, cost of new employee and cost of new clerical employee.
3.8.2TheHealthandSafetyAccidentCostModel-BTIn the Health and Safety Accident Cost Model from British Telecom, the following kinds of costs are considered:• People resource costs: sick absence cost, management
downtime cost of dealing with the incident;• Property damage costs (this is currently limited to
vehicle damage costs where there is sufficient data to enable granular costing)
• Additional costs: costs of any associated legal activities and also the costs of Employers Liability and Personal Accident insurance claims.
3.8.3HSE(HealthandSafetyExecutive)ModelThe kind of costs considered are the following:costs to individuals of workplace injuries and work-related ill health: financial costs and ‘human costs’;two types of financial costs incurred by individuals: (a) loss of income and (b) extra expenditure taking into account:• Extra purchases of medicines: for some people this
could be significant, though for most it will not;• Costs of travel to hospital for treatment;• Increased shopping bills: while a person is incapacitated
their household grocery bills may be increased as they

OCCUPATIONAL HEALTH AND SAFETY IN MALTA - A SNAPSHOT OF PREVAILING STANDARDS
20
may be forced to use more accessible but probably more expensive outlets;
• Reduction in expenditure on travel to work;• Costs to employers: costs resulting from absence
from work, costs of replacing those who are forced to quit the job, damage to materials and equipment and compensation and insurance.
• Costs to society, including those borne by the individuals (and their families and friends) and employers directly affected. Only direct costs to society are considered. It is broken down into three components: loss of output, other resource costs (damage, administration, medical treatment and HSE/local authority investigations) and human costs.
This review takes a closer look at the HSE (Health and Safety Executive) Model applied in the UK, to create a basis on which to base the cost calculation model for Malta. Reference to other models will take place to substantiate the cost calculation methods applied.
Cost Calculation Models – UKWhen estimating the costs to Britain of workplace accidents and work-related ill health, the Health and Safety Executive (HSE) has traditionally estimated costs for three types of stakeholder: individuals, employers and society. The figure below demonstrates the various cost categories typically used to estimate the costs to the three different stakeholders:
Ongoing work within HSE’s Economic Analysis Unit (EAU) has however revealed limitations with the current methodology and sources of data used to derive the estimates. A recent attempt has been made by HSE to estimate the aggregate cost to employers only of work related injuries and ill health (Pathak, M., 2008). The study applies a revised methodology, uses additional data sources and excludes the cost of non-injury accidents and any damage caused to machinery from workplace accidents. The current estimates in Gordon et al (1999) include cost estimates for non-injury accidents. However, in 2007, a scoping study was performed by the Health and Safety Laboratory (HSL) into the feasibility of collecting data on non-injury accidents, the costs of non-injury accidents and the cost of damage to equipment resulting from injury accidents (Binch, S.,and Bell, J., 2007). From sample testing, it was concluded that the costs of non-injury accidents should not be included in the aggregate estimates due to incomplete information.
Non-InjuryAccidents–(NearMiss)There are a number of possible methods to collect information on non-injury accidents and their associated costs that can be explored; this includes a pilot study, large-scale survey or case studies. One of the key criteria for identifying a suitable approach for data collection should be minimising the administrative burden on businesses by simplifying the data collection and reporting process. However, before any collection of information is attempted companies need assistance in understanding what information should be collected and how to do so.
A non-injury accident has been defined by HSE as follows: • “A non-injury accident is defined as any unplanned
event that results in: - Damage or loss to - Property - Plant - Materials - The environment
• And/or a loss of business opportunity But does not result in an injury”
Cost to IndividualsThe costs to individuals of workplace injuries and work-related ill health are split into two types:
Financial costs - The financial costs are divided between loss of income, and extra expenditure incurred as a result.Human costs
Financial Costs• Sick pay arrangements: assumptions on the form of
income received by people when absent from work are made. Assumptions are based mainly on information from the Labour Force Survey using data averaged over two years and rounded to the nearest 5%. In order to calculate the total income lost when absent due to workplace injury and work-related ill health, the percentages breakdown of sources of income for absent workers, by duration of absence is used.
• Extra purchases of medicine: It is assumed that just one prescription (and that everyone has to pay for prescriptions) for certain categories of victims and an extra one for those absent for more than five working days due to an illness is issued. The unit costs of prescriptions have been estimated.
• Cost of travel to hospital for treatment: costs to health service have had to be estimated by assuming that a

OCCUPATIONAL HEALTH AND SAFETY IN MALTA - A SNAPSHOT OF PREVAILING STANDARDS
21
longer duration of incapacity is correlated with more treatment – as both relate to severity – and consequently with higher costs.
• Increased shopping bills: • Reduction in expenditure on travel to work
Human CostsPutting a value on ‘subjective’ costs proves to be more difficult. It is sometimes suggested that court compensation awards can provide a possible measure of such losses. However, there are serious limitations to relying on court awards as a measure of welfare loss to individuals.
These limitations are most obvious in the case of death where compensation awards cover only financial losses to dependants with a token supplement for the distress suffered by the family of the deceased. Economists have sought to obtain values for the cost of fatal and non-fatal injury to individuals based on what people are willing to pay to reduce their risk of being killed or injured, or what they are willing to accept for a small increase in such risks.
Costs to Society The costs to society, including those borne by the individuals (and their families and friends) and employers directly
Employers
Society
Individuals
Loss of output
Medical treatment (short and long term)
HSE and Local Authority investigation costs
Extra expenditure when absent
Damage from injuries (equipment, goods and materials)
Damage from non-injury accidents
Insurance industry admin costs
Depatment for Work and Pensions administration costs
Compensation (ELCI)
Other insurance (low frequency, high cost events, eg, fire)
Company administration
Recruitment
Lost earnings
Human Costs (pain, grief, and suffering)
Sick pay
Figure 3.3 – Cost Categories

OCCUPATIONAL HEALTH AND SAFETY IN MALTA - A SNAPSHOT OF PREVAILING STANDARDS
22
affected. Only direct costs to society are considered. It is broken down into three components: • Loss of output, • Other resource costs (damage, administration, medical
treatment and HSE/local authority investigations)• Human costs.
Human CostsThe estimated human costs associated with each non-fatal accident category are based on the methodology set out in Davies et al (1999). This methodology is based upon the DfT human cost estimates but uses different injury state classifications. The human costs estimate is calculated as a weighted average of the human costs of different cases of ill health categorised by length of absence.
Lost OutputThe lost output due to an accident is taken as “equal to the labour cost that is normally incurred in employing the absent worker, plus any sick pay”. The “lost output” appraisal values are based on estimates from Davies et al (1999). The definition of lost output for a case of ill health is the same as for accidents. The length of absence is taken as the average number of days lost due to ill health.
Resource CostsThe resource costs for non-fatal injury accidents include property damage, administration, recruitment, HSE and local authority investigation costs, and medical treatment. The “resource costs” appraisal values are based on estimates from Davies et al (1999).
Costs to EmployersThe costs to employers of workplace injuries and work-related ill health are based on four cost components: sick pay, administrative costs, recruitment costs and compensation and insurance costs. Previous HSE estimates of the costs to employers of workplace injuries and work-related ill health considered five main categories:• Absence costs• Administrative costs• Recruitment Costs• Damage from injuries and non-injuries• Compensation and insurance costs(M. Pathak, 2008)
Absence CostsWorkplace injuries and work-related ill health typically result in a period of sickness absence of the affected employee, during which his contribution to production is lost.
Davies et al (1999) utilise findings from a case study of five firms from different business sectors, undertaken by the HSE’s Accident Prevention Unit (APAU) in 1993, to inform assumptions on employer responses to sickness absence. This study found that on average, among the case study firms, employers compensated for the absence of a worker by some medium of extra effort of existing employees rather than through an increase in formal overtime working.
According to the APAU case studies, the following actions to maintain output would be taken in the case of an absence:• Re-organisation of tasks• Extra effort• Accept decline in quality• Overtime• Hire temporary /part-time workers
This approach implies that the cost of maintaining output equals the labour cost of the absent employee, and that there is no change in the production costs to the employer. If the cost of maintaining output were to be greater than the normal cost of output, this output would be forgone by the employer. Hence the actual cost of absence to employers is assumed to be the amount of sick pay (or occupation sick pay) paid.
There are however limitations with this approach. In certain circumstances it would be difficult for employers to maintain output. For example, consider the following situations:• Presenteeism - when a worker continues/returns to work
with an illness or injury with a subsequent reduced level of productivity;
• The impact of different production processes and working arrangements on productivity. It may not be possible to perfectly adjust working arrangements to compensate for the lost output associated with the absence of an employee
An assessment is made on whether employees receive Full Pay; Part Pay; or Statutory sick pay (SSP). The estimates of the costs to employers are based on the proportions of income when absent, categorized by length of absence, sourced from the 1990 LFS module. Three lengths of absence categories are established:• 1 to 3 days• 4 to 197 days• 198 or more days
A cost per day estimate is worked out based on the average wage for all full time employees in the UK economy. Weighting is also applied to include no-wage employment

OCCUPATIONAL HEALTH AND SAFETY IN MALTA - A SNAPSHOT OF PREVAILING STANDARDS
23
costs. Applying the cost per day estimate and full pay/part pay weightings to the total number of days lost in each length of absence category gives the total cost of sick pay to employers.
Administrative CostsEmployers typically incur a cost in dealing with the administrative tasks associated with sickness absence. These tasks can be expected to include the following:• Calculation of sick pay.• Processing sick leave requests, certificates.• Re-organisation of tasks, staff.
Administrative costs can be estimated using the average wage of the staff that carry out these tasks. The UK Standard Cost Model provides an internationally agreed framework for estimating such costs. This framework is particularly useful due to its simplicity. The main elements are summarized below:
An alternative approach would be to assume ‘Three Administrative Points’ (TAP). The three administrative points would occur at the point of absence, mid absence and end of absence. Each case of a short absence (less than twenty one days) would lead to an administrative burden in total of two and a half hours, while each case of long absence (greater than twenty one days) would lead to an administrative burden in total of three and a half hours.
This approach allows for variation in administrative costs as the administrative costs are adjusted to reflect lower or higher rates of absence durations. The average administrative clerk wage per hour is adjusted for non wage costs. This amount is multiplied by the total hours (as per the appropriate administrative burden band) to give the typical cost per case. This figure is then multiplied by the total number of cases in each length of absence band.
Recruitment CostsEmployees suffering from workplace injuries or work-related ill health may need to be replaced by employers in the following situations:• When the employee suffers a work-related fatality;• When the employee is forced to change roles within an
organisation;• When the employee cannot return to work (defined as a
‘never return’).
The activities that contribute to the cost of recruitment are summarised below:• Payroll (administrative)• Interview, training of new worker
• Marketing, screening, e.g. job advertisements and application sifting.
• Fall in quality of service/productivity before and after the replacement period.
Davies et al (1999) assume that all workers in the circumstances listed above would be replaced. They acknowledge that this may be an overestimate, but argue that this is more than offset by the inclusion of the cost of ‘bringing forward’ recruitment which significantly reduces the final cost estimates.
Past recruitment cost estimates produced by the HSE have been based on an assumption that accounts for ‘bringing forward’ the cost of recruitment. This is based on the premise that an employee would be expected to move positions eventually for reasons such as promotion, relocation or a secondment. Because of this, the employer would incur the cost of replacing the employee. A workplace injury or a case of work-related ill health leading to a long term condition, or a ‘never return’, would in effect ‘move forward’ this expected recruitment cost that was likely to be incurred later. Davies et al (1999) estimate on this basis that on average, a case of a ‘never return’ would ‘bring forward’ recruitment by three years.
The cost of recruitment in three years is estimated by accounting for growth in real average earnings and applying a discount rate over the assumed three year period. This amount is subtracted from the present cost of recruitment to give the net cost of recruitment in present value figures.
Two methods are used to estimate the cost of ’bringing’ forward recruitment. The first method makes the assumption that “If the absence is greater than twenty eight weeks (six months) then the worker is replaced”. Method two accounts for ‘pure’ ‘never returns’ (i.e. those who have actually withdrawn from the workforce) and avoids the complexity of the overlap between permanent and temporary recruitment.
Compensation and InsuranceIn many cases employers may be legally required to pay compensation to current or former employees for workplace injuries or work-related ill health. Davies et al (1999) included two types of insurance costs in the costs to employers: employer’s liability insurance and insurance for fire damage and business interruption.
The Association of British Insurers (ABI) record all Employers’ Liability Compulsory Insurance (ELCI) claims in the UK, and this is used as the main data source for ELCI
OCCUPATIONAL HEALTH AND SAFETY IN MALTA - A SNAPSHOT OF PREVAILING STANDARDS
24
claims. The relevant assumptions applied to this data are summarised below:
ELCI• Total claims data from ABI
ABIdata• Assume: 1/3 of claims due to ill health• Assume: 2/3 of claims due to accidents/injuries• Add administration and profit premium (15%)
The model adopted by the Health and Safety Executive to calculate the cost to the nation is a rather extensive model which incorporates a comprehensive approach, thus allowing the inclusion of all major costs involved. The model is also one which can be applied locally, provided that the respective sources of data and information required is accessible. Furthermore, this research project also presents the opportunity to collect certain data which caters for such requisites, thus facilitating the process of applying adequate data into the cost model.

4. RESEARCH METHODOLOGY
4.1 The Research Consultant’s Key Expert Team The whole research project was led, designed, co-ordinated, executed and the findings reported upon by Clive Falzon of Informa Consultants and Marika Fsadni of M. FSADNI & Associates. Given the technical nature of the project, the Research Consultants also worked closely with a number of key expert associate consultants, each specialising in specific OHS areas.
The whole key expert team involved in this project comprised: • CliveFalzon,Key Expert in Social & Market Research
and Data Analysis. • MarikaFsadni,Key Expert in Social & Market Research
and Data Analysis. • DrDavidAttard,Key Expert in Occupational Medicine;
Occupational Physician • DrFrankBezzina,Key Expert in Statistics and Research
Methods• JeannineCassar,Key Expert in Health & Safety • AndreFarrugia,Key Expert in Risk Management • IngClaudeFarrugia,Key Expert on Health & Safety • MaryMifsud,Key Expert in Occupational Therapy.• DrAlessiaZammitMcKeon,Key Expert in Occupational
Health & Safety Law
The whole qualitative and quantitative field research exercise was designed, co-and executed and the raw data analysed entirely by Mr Falzon and Ms Fsadni and their market research analyst team. The field research operations were also conducted by the Research Consultants’ in-house field interviewing team. Moreover, all qualitative and quantitative research instruments used in the study were designed and produced by the Research Consultants and approved by OHSA, before going to field.
It is worthy of mention that at each phase of the entire research study, OHSA senior officials, namely, CEO Dr
Mark Gauci and Project Leader Mr Silvio Farrugia gave sound direction and also contributed significant input. The Research Consultants are indebted for OHSA’s vital contribution.
4.2 The Qualitative Research Phase In achieving the strategic research objectives of the project, a qualitative study with OHS stakeholders and workers hailing from the public and private sector was conducted. The object of this qualitative research phase was to obtain an ‘in-depth’ understanding of the issues to be covered in the forthcoming quantitative research phase of this project. The qualitative research phase consisted of 54 one-to-one personal interviews with various OHS stakeholders and 10 focus group sessions with ‘worker’ respondents from various industry sectors.
The key stakeholders interviewed belonged to three categories: health practitioners and OHS consultants, private sector stakeholders, and public sector stakeholders. They were all interviewed at their places of work or other convenient for them locations, and the interviews took from some 30 minutes to well over an hour, according to the respondent’s available time and the amount of views on the topics.
The focus group respondents were chosen in a way that ensured a balanced representation of males and females of various age brackets, geographical localities, marital status and occupation across various industries in both the private and public sector. Refreshments and snacks were served to create a relaxed and informal atmosphere. A semi-structured questionnaire was used for the one-to-one, personal interviews and a moderator’s discussion guide was used for the focus group sessions in order to allow ample freedom to the respondents to share all their relevant views while covering all topics of interest for the research.
THIS SECTION COMPRISES DETAILS OF THE RESEARCH METHODOLOGY USED FOR THIS STUDY, I.E. THE QUALITATIVE AND QUANTITATIVE RESEARCH APPROACHES ADOPTED, THE SAMPLING PLANS AND SAMPLE FRAMES AND SHORTCOMINGS OF THE RESEARCH.

OCCUPATIONAL HEALTH AND SAFETY IN MALTA - A SNAPSHOT OF PREVAILING STANDARDS
26
4.2.1 Personal Interviews with OHS Stakeholders The perceptions, attitudes and views of Key OHS Stakeholders were obtained on the following research areas:• Occupational injuries, occupational ill-health and
occupational psychological ill-health at the workplace in Malta and the root causes;
• The level of access of workers to internal and external OHS services;
• The cost of prevailing risk levels of OHS to Malta as a nation;
• The role of the Occupational Health & Safety Authority; and
• Important questions to be included in the quantitative surveys.
4.2.2 Key Stakeholder Respondents Fifty-four (54) key stakeholders were interviewedin person, and they belonged to the following three categories:• Health practitioners – including occupational therapists,
physiotherapists, occupational physicians, company doctors, family doctors, occupational psychologists, general medicine specialists, oncologists, respiratory specialists.
• Government officials responsible for OHS in the public sector, namely, senior officials and OHS specialists from various ministries and government departments.
• OHS service providers, employers and workers’ representatives, namely, General Secretaries, Directors and OHS officers from various trade unions and associations, as well as OHS managers from private companies of various sectors and sizes.
The representatives from private companies were from micro, small, medium-sized and large companies engaged in the following sectors: agriculture and fishing; manufacturing; quarrying and construction; wholesale and retail trade; hotels and restaurants; transport and communications; financial services, real estate and renting; education, health services and community services.
All respondents were interviewed at their convenience, usually at their workplaces, in order to ensure more cooperation and availability. The interview duration varied from thirty minutes to an hour, giving the respondent an opportunity to voice all his or her concerns and suggestions, covering all topics.
A Stakeholder Interview Semi-Structured Questionnaire, approved by OHSA before kicking off the qualitative interviews, was used during interviews to ensure a smooth flow of the conversation and that all areas of interest are covered, while allowing the respondents to mention important issues not included in the specific questions.
4.2.3 Focus Group Sessions with ‘Workers’ Respondents The perceptions, attitudes and views of Focus Group Respondents were examined on the following research areas:• Existing OHS preventive measures and equipment at
the workplace;• Employee training on OHS at the workplace;• Personnel responsible on OHS at the workplace;• Involvement of workers in OHS issues/ Access of
Information of workers;• Injuries, physical ill health and psychological ill health at
the workplace;• Part-Time Jobs (other than the main job);• Sports, Hobbies, Pastimes;• Awareness of OHSA’s rules and functions.
Ten (10) focusgroupsessions were held, the sessions being attended by 81 ‘Workers’ Respondents. The FG ‘Workers’ Respondents were selected to satisfy the definition of ‘worker’, as found in Act XXVII of 2000, namely:
‘…any person employed by an employer to perform work, or who provides a service to another person under a contract of service or for service, and includes a trainee, an apprentice and a self-employed person, but shall not include the crew of a vessel registered in Malta or any other person employed thereon as part of the ship complement’.
The choice of participants for the FG sessions was based on pre-established FG ‘worker’ respondent profiles in order to attain a balanced attendance of male and female participants whose age falls in one of the four age brackets, namely, 15-24 yrs, 25-34 yrs, 35-44 yrs, and 45+. ‘Workers’ Respondents had a married, widowed, single or separated status; and hailed from all of Malta’s geographical regions including Gozo. Pregnant workers were also invited to participate in the FG sessions.
‘Workers’ Respondents were chosen from both the private and the public sector; employees who worked in different business sectors be it micro (1-4 employees), small (5-10 employees), medium-sized (11-50 employees) or large companies/departments (50+ employees); and who

OCCUPATIONAL HEALTH AND SAFETY IN MALTA - A SNAPSHOT OF PREVAILING STANDARDS
27
were employed on full-time or part-time basis, or had the facility of working reduced hours, flexi-time or work from home. Consideration was also given to the occupation of the participating ‘Workers’ Respondents who were asked to indicate if they have ever suffered from occupational injuries, physical ill-health or occupational psychological ill-health at the workplace.
Care was taken to retain this variety within each focus group to produce a lively discussion with contrasting perspectives and opinions. A FG Moderator’s Discussion Guide, also approved by the OHSA Project Manager, was used during the focus groups with ‘Workers’ Respondents to ensure a smooth flow of the discussion and that all areas of interest are covered.
4.3 The Quantitative Research Phase The second phase of the research project consisted of two large-scale surveys carried out between June and August 2011. The research instruments were derived from the findings and insights of the qualitative phase, and were approved by the OHSA. The first part of this quantitative survey was conducted with a sample of 1603 workers, including self-employed persons (i.e. those without employees) and the second part was carried out with a sample of 1200 ‘employers’ which included managers, Health and Safety Managers, Health and Safety Officers, and company owners and directors who have employees.
For both surveys, the respondents were from the following industry sectors to ensure compatibility of the data between the two surveys and with previous data published by the National Statistics Office (NSO):• Construction, Mining and Quarrying;• Manufacturing; Agriculture; Hunting and Forestry;
Electricity, Gas & Water Supply;• Wholesale and Retail Trade, Repairs;• Hotels and Restaurants;• Transport, Storage and Communication;• Real Estate, Renting, Financial Intermediation and
Business Activities;• Public Administration;• Education;• Health and Social Work;• Other Community, Social and Personal Service Activities.
4.3.1 The ‘Employee’ Survey The ‘Employee’ Research Instrument (questionnaire) comprised four sections:• Respondent Profile• Health and safety at the place of work
• The role & services of OHSA• Injuries and ill-health at the place of work.
The 1,600-count ‘stratified sample with proportional representation’ were based on the official statistics of the NSO for the number of employees in each industry sector. The samples were based on the following criteria:• Industry Sector.• Employment basis – both employees and self-employed
persons were included in the survey, with a ratio of 8:1 as in the population.
• Designation – all NSO designations were included, in the ratios found in the population.
• Socio-economic class, gender, age bracket, geographical region – a good spread of these characteristics was obtained in the sample.
The ratio between the numbers of workers in each industry sector in the population was retained to ensure the sample is representative. Some of the industry sectors were amalgamated due to their small size so that the findings will be statistically significant and useful for the extrapolation exercise during the analysis stage.
4.3.2 The ‘Employer’ Survey The ‘Employee’ Research Instrument (questionnaire) comprised five sections:• Respondent Profile• Health and safety at the place of work• Risk Assessments• The role & services of OHSA• Injuries and ill-health at the place of work.
The same research approach was adopted for the Employer survey – the 1,200-count ‘stratified sample with proportional representation’ for each sector was based on the actual figures on the number of companies in each sector, as published by the NSO (2010). The samples were based on the following criteria: • Industry Sector.• Size of company (by number of employees).
Even for the ‘Employer’ survey, some of the industry sectors were amalgamated due to their small size so that the findings will be statistically significant and useful for the extrapolation exercise during the analysis stage.
Members of the disciplined forces and crews on board sea-going vessels, were excluded from the scope of this research.

OCCUPATIONAL HEALTH AND SAFETY IN MALTA - A SNAPSHOT OF PREVAILING STANDARDS
28
4.4 Limitations of the Research Phase Although the study produced conclusive research findings, a number of limitations were encountered in the research phase of the project.
During the qualitative research phase, it proved impossible to find a workers’ health and safety representative who is responsible for an entire company or government department. All the companies and departments studied had a set-up in which there is a different worker representative for each section of the organization, but no one person representing all the employees. For this reason, such worker representatives could not be interviewed or included in the focus group sessions.
During the quantitative research phase, when conducting the personal interviews with Employers, the Research Consultants encountered significant refusals from companies, which seem reluctant to participate in the survey. A number of issues may have contributed to this shortcoming, namely, due to the sensitive nature of the survey itself and possibly because some companies may have already faced judicial or enforcement proceedings from OHSA. Given that participation in this ‘Employer’ study was voluntary, companies could refuse participation. To this end, for some industry sectors, the ‘company size’ stratified representation criterion was somewhat relaxed.
The research findings of the ‘Employer’ quantitative study was based on ‘self-reporting’ and no technical verification or proof of evidence of such certification was asked of these respondents. To this end, it is possible that there may have been employer respondents who gave the most legal or ethical correct replies, knowing that the research was commissioned by the OHSA.
Moreover, although ALL the employer survey respondents were guaranteed anonymity, the employers were also left free not to reply. As a result, a number of employer participants may have not replied to some research questions posed to them. Furthermore, although the Employer survey respondents were all senior company officials, responsible for your company’s OHS operation, it is possible that the survey respondents did not retain records to be able to give exact OHS figures. This is more the case with survey respondents hailing from micro- and small firms. In other cases, the ‘employer’ respondent may not have been the holder of all the information requested. This may have been more the case with public sector employer respondents, where the ‘employer’ consists of various senior levels, i.e. permanent secretary, director general, director, manager and principal.
Similar research shortcomings were experienced in the research phase of the ‘Employee’ survey. Moreover, another limitation worthy of mention is that the research findings of occupational injuries, ill-health and stress at work cases were based on ‘self-reported’ findings by the employee and self-employed individuals who participated in the research study. Although these survey respondents were also asked to specify the occupational injuries, ill-health and stress at work cases, which were then certified by a medical professional, no technical verification or proof of evidence of such certification was asked of these respondents. Also, another limitation is that the ‘employee’ self-reported findings may be subject to some of the employee respondents not having a good working relationship with their existing employer and hence may have given some findings a more negative perspective than what they ought to be, however this limitation is characteristic of any survey conducted with ‘worker’ respondents.
Moreover, with regards to the stress at work cases reported in the ‘Employee’ study, although only those cases which were certified by a medical professional were taken into account in the study, these reported findings still lacked the verification of a necessary third independent source to obtain the required triangulation of data, when reporting such cases.

5. QUALITATIVE RESEARCH FINDINGS – AN OVERVIEW
The conclusions presented below are based on the entire qualitative research exercise for the project, including the face-to-face personal interviews with key stakeholders from the private and public sector, the interviews with health practitioners and medical consultants, and the focus groups with employees from various industry sectors. It is important to mention that some of the opinions, views and perceptions expressed by the employee and employer individuals who participated in this qualitative research phase of the study may not necessarily reflect factual information.
a) It was reported by a number of participants that the type of occupational injuries in Maltese workplaces vary according to the industry sector and the type of work, but it clearly emerged that the most serious and fatal cases are within the construction industry. The workers there suffer from trips, slips and falls (often fatal falls from heights), hand injuries and fractures. The second most affected industry appeared to be manufacturing together with carpentry, crafts and agriculture where the workers suffers serious hand, eye, and musculoskeletal injuries including traumatic amputations of body parts (most often fingers). In office environments, the most common injuries are paper cuts while in the public sector social workers and teachers suffer from scratches or hits by the patients and children. The root causes for these injuries were perceived to be the lack of health and safety policies and procedures, negligence on the part of workers, non-existent or inadequate protective equipment, unwillingness to wear the equipment because of discomfort or overconfidence, lack of training, and general lack of awareness and education on the risks at work. During the interviews and focus groups, it was also pointed out that a lack of enforcement by the OHSA and by employers themselves is another factor that permits the situation to persist. However,
participants acknowledged that the number of reported and actual injuries has decreased compared to the past and the standards seem to be improving slowly.
b) There was a general opinion that skin and respiratory diseases from working in dusty environments, and ill-health effects from long term exposure to the sun, allergies and musculoskeletal conditions are common among construction workers. Participants also opined that among workers employed in the manufacturing sector the most common ill-health problems are those found among those handling dangerous chemicals. Hearing problems and hearing loss are also mentioned as common health problems in transportation and manufacturing, while back pains, eye problems and headaches are common in office environments. In all sectors, contracting infections from colleagues, patients or clients appears to be a problem due to poor hygiene, training or precautions. The situation seems to be particularly serious in the health and education sectors. With regards to root causes, the participants generally agreed that problems lie in the lack of health and safety procedures or awareness, poor or inadequate equipment, poor design and ergonomics and lack of commitment or financial capabilities on the part of management. Most importantly, it is hard to prove the direct relationship between a particular condition and a person’s work, which leads to lack of awareness, reporting and adequate prevention and compensation.
c) Cases of occupationalpsychological ill-healthwere perceived by participants to be on the increase across all sectors and industries, and by far the most common problem is stress. Bullying and harassment are also present, but not on such scale and in most workplaces employees are reluctant to report such issues, either because of their personal nature or from fear to lose their
THIS CHAPTER SUMMARISES THE SALIENT OPINIONS AND PERCEPTIONS OF THE KEY STAKEHOLDERS INTERVIEWED AND OF THE ‘WORKER’ PARTICIPANTS OF THE FOCUS GROUP SESSIONS. THESE QUALITATIVE RESEARCH FINDINGS MUST BE INTERPRETED WITH CAUTION DUE TO THE FACT THAT THERE MAY BE SOME MISCONCEPTIONS ON THE PART OF STAKEHOLDERS, EMPLOYERS AND WORKERS ON THE SUBJECT OF OHS IN MALTA.

OCCUPATIONAL HEALTH AND SAFETY IN MALTA - A SNAPSHOT OF PREVAILING STANDARDS
30
job. The main root causes mentioned by participants for stress and burnout are tight deadlines, long hours of work, pressure to reach unreasonable quotas, insufficient staff to perform all the duties, responsibility in a high management position, or eve bullying and harassment. As with occupational physical ill-health, there is a problem of definition and clear guidelines for what cases are reportable and eligible for remedy and compensation. Moreover, many employers seem to ignore the seriousness of psychological ill-health at work and prefer to burnout their employees and hire new ones rather than resolving the situation and eliminating the root causes. Once again, lack of education, awareness and enforcement aggravate the problem.
d) From the feedback of the respondents it transpires that statistics on health and safety need improvement. Many cases, especially of psychological and physical ill-health are not reported, while the statistics for injuries are an underestimate of the actual situation. The major reasons are the variance in reporting systems across companies, lack of awareness on legal reporting duties and requirements. There is confusion on the types of occupational injuries and ill-health that need to be reported, the type of information that must be provided to the OHSA and the frequency of such reporting. There is also lack of reporting culture and an attitude towards concealing accidents to preserve the company’s reputation, instead of identifying all issues in order to address and resolve them. Large firms and those with foreign investment have a strong culture of keeping high OHS standards and submitting detailed reports on all injuries, near misses and other cases to the mother company. On the other hand, most small companies are not even aware that they have a legal obligation to report, or else they don’t see the need because they would not try to claim compensation. The NI forms which are currently used to report occupational injuries and ill-health appear to be inadequate and poorly designed to serve the purpose of doctors, workers and employers. The survey respondents observed that there seems to be a need for much more communication between the various entities that collect OHS statistics and integration of the data they have. Information has to be presented in such a way to reflect that respondents were not aware of the different legal obligations and who reports what.
e) One of the clearest findings of the qualitative research was the situation with regards to workers’ access to OHS services. The feedback of all respondents pointed towards a clear pattern in which large and foreign companies in the private sector have the highest level of OHS standards and internal OHS related services, while SMEs and self-employed persons still lack in the provision of a number of such. Workers hailing from the public sector who participated in the focus groups mentioned that the appointment of health and safety ‘managers’, the conductance of risk assessments or consultation with employees are rare in their respective places of work. There were some notable exceptions to this pattern, but the majority of responses indicated that in general, the level of health and safety access to workers in Malta is a function of compliance with law or internationally-imposed standards from the mother company, giving in to pressure from third parties. Some mentioned third parties exerting pressure including insurance companies or clients who require a minimum level of OHS at the workplace, or requirements in government tenders to ensure quality (including OHS) in the delivery of a particular project. Another conclusion from the discussion is that the emphasis on OHS measures is more often on the physical aspects of health and safety (such as fire extinguishers and other equipment) rather than on training, awareness, a good psychological climate and a culture of consultation and prevention. Apparently the reason for this is that most employers only adopt certain OHS measures and practices to avoid legal problems, so they make sure in case of a spot check they would be able to show they are compliant with the minimum requirements stipulated by law.
(f) With regards to the cost of occupational injuriesandill-healthtothenation, these are both direct and indirect and are borne by individual workers, employers and society. The costs borne by workers depend on the company where they are employed, but not necessarily on the sector (public or private). From the research conducted there is a trend for larger companies to have a better health and safety setup, including prevention, insurance and compensation in case of injuries or ill-health. On the other hand, the human costs incurred due to some injuries and illnesses are significant and although recognized, they cannot be compensated. Apart from lost income, ability to work overtime and grievance, cost to workers can be loss of their job and employability as they become less efficient after an injury.
OCCUPATIONAL HEALTH AND SAFETY IN MALTA - A SNAPSHOT OF PREVAILING STANDARDS
31
The costs of employers are also great, however many Maltese employers appear to save from compensation, insurance and recruitment costs because they simply let the affected employees use their sick leave and distribute their work on the remaining workers, instead of employing extra people. Society is heavily burdened mostly from taxes for medical treatment, but also due to loss of output and family disruption and grieving. The UK model for cost estimation of occupational injuries was discussed among participants of the qualitative research and there was agreement that it was also applicable to the situation in Malta, possibly with minor amendments.
g) The main roles of OHSA as perceived by participants involved in the research are education and enforcement, with several expressing the opinion that these two roles can be conflicting. With regards to enforcement, most of the respondents beleive that OHSA’s focus is currently on larger companies, especially in the Construction and Manufacturing industries within the private sector. Most of the respondents were not aware of OHSA’s interventions in the public sector, micro companies and entrepreneurs, and the services sector. Reference was also made to the fact that with regards to its promotional/educational services, OHSA is providing very good educational materials, courses and seminars, but it needs to reach out more to individual workers, something which many appear to realise is not currently possible, given OHSA’s resources. All things considered, the majority of respondents were very appreciative and full of praise for the work of the Authority, and the most important way to improve the work of OHSA is probably through greater investment in terms of financial and human resources, so that the mission can be extended on a larger scale, and both the enforcement and the educational roles can be accomplished much more effectively, including also by reaching out more to smaller companies.

OCCUPATIONAL HEALTH AND SAFETY IN MALTA - A SNAPSHOT OF PREVAILING STANDARDS
32
The questionnaire aimed
at gaining insight into the level of health
and safety in Maltese companies
from 10 different industry sectors,
as perceived by the employees
in such companies
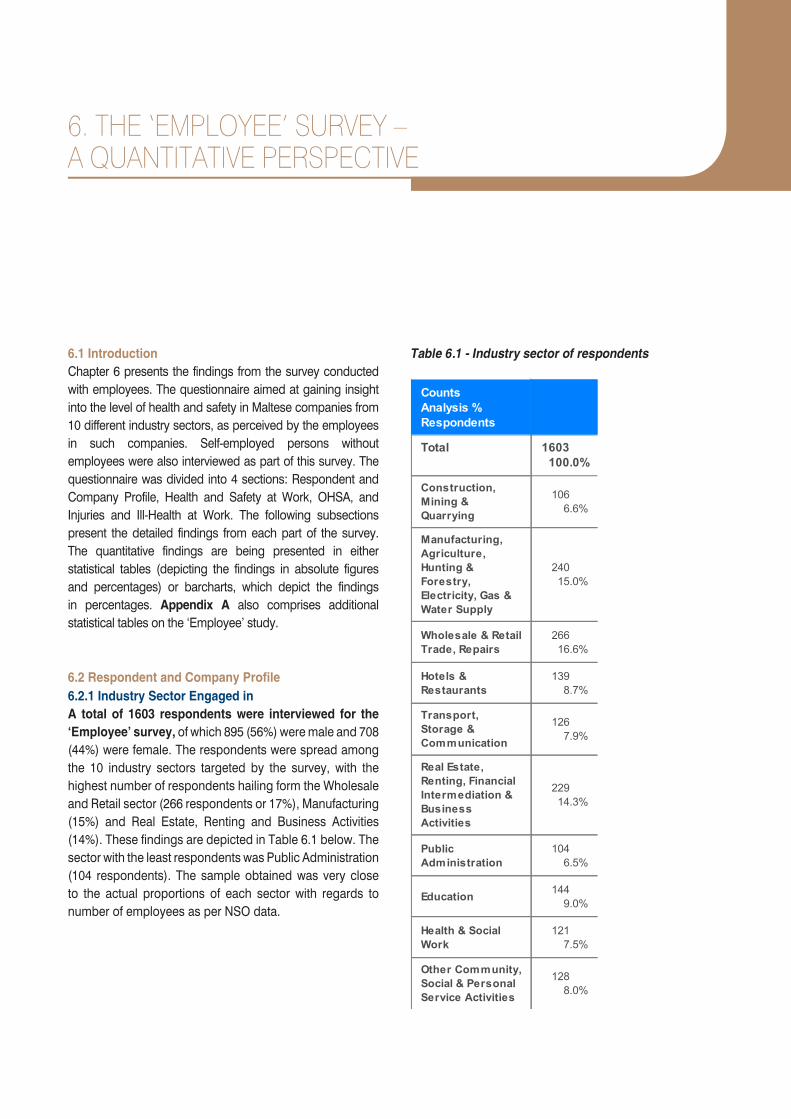
6. THE ‘EMPLOYEE’ SURVEY – A QUANTITATIVE PERSPECTIVE
6.1 Introduction Chapter 6 presents the findings from the survey conducted with employees. The questionnaire aimed at gaining insight into the level of health and safety in Maltese companies from 10 different industry sectors, as perceived by the employees in such companies. Self-employed persons without employees were also interviewed as part of this survey. The questionnaire was divided into 4 sections: Respondent and Company Profile, Health and Safety at Work, OHSA, and Injuries and Ill-Health at Work. The following subsections present the detailed findings from each part of the survey. The quantitative findings are being presented in either statistical tables (depicting the findings in absolute figures and percentages) or barcharts, which depict the findings in percentages. Appendix A also comprises additional statistical tables on the ‘Employee’ study.
6.2 Respondent and Company Profile 6.2.1 Industry Sector Engaged in A total of 1603 respondents were interviewed for the ‘Employee’ survey, of which 895 (56%) were male and 708 (44%) were female. The respondents were spread among the 10 industry sectors targeted by the survey, with the highest number of respondents hailing form the Wholesale and Retail sector (266 respondents or 17%), Manufacturing (15%) and Real Estate, Renting and Business Activities (14%). These findings are depicted in Table 6.1 below. The sector with the least respondents was Public Administration (104 respondents). The sample obtained was very close to the actual proportions of each sector with regards to number of employees as per NSO data.
Table 6.1 - Industry sector of respondents
CountsAnalysis %Respondents
Total
Construction,Mining &Quarrying
Manufacturing,Agriculture,Hunting &Forestry,Electricity, Gas &Water Supply
Wholesale & RetailTrade, Repairs
Hotels &Restaurants
Transport,Storage &Communication
Real Estate,Renting, FinancialIntermediation &BusinessActivities
PublicAdministration
Education
Health & SocialWork
Other Community,Social & PersonalService Activities
1603100.0%
1066.6%
24015.0%
26616.6%
1398.7%
1267.9%
22914.3%
1046.5%
1449.0%
1217.5%
1288.0%

OCCUPATIONAL HEALTH AND SAFETY IN MALTA - A SNAPSHOT OF PREVAILING STANDARDS
34
6.2.2CompanySizeWith regards to company size, 205 respondents (13%) were self-employed without employees, 324 were employed in micro companies (20%) and another 20% from companies with 10-49 employees (Table 6.2). Approximately one-fourth (24%) were engaged with medium-sized businesses and the remaining respondents worked in large companies at the time of the survey. The vast majority of workers were employed in the private sector (78%) and the remaining 22% were engaged with the public sector.
Table 6.2 - Company size
CountsAnalysis %Respondents
Total
Southern Harbour
Northern Harbour
South Eastern
Western
Northern
Gozo
1603100.0%
36322.6%
34621.6%
16910.5%
24515.3%
28918.0%
19111.9%
6.2.3 Respondent’s Age and Home TownThe respondents’ ages ranged from 15 to over 55 years, with the majority of them being from the 25-34 age group (31%). The oldest age group of 55+ years accounted for only 9% of the sample which could be explained with Malta’s official retirement age, and the remaining respondents were evenly spread among the other age categories.
The respondents hailed from all of Malta’s 6 geo regions, with 12% of the workers hailing from the sister island Gozo (Table 6.3). The Southern Harbour and Northern Harbour regions were best represented with 363 (23%) and 346 (22%) of the respondents respectively, however even the South Eastern and Western regions were well represented with 11% and 15% of the respondents, respectively. This distribution provides a realistic representation of the actual spread of the population in Malta and Gozo.
Table 6.3 - Respondent ‘home town’ regionTable 6.3 - Respondent ‘home town’ region
CountsAnalysis %Respondents
Total
Southern Harbour
Northern Harbour
South Eastern
Western
Northern
Gozo
1603100.0%
36322.6%
34621.6%
16910.5%
24515.3%
28918.0%
19111.9%
6.2.4 Respondent’s Designation
With regards to designation, half of the respondents were from the ‘higher’ designations (managers, professionals, technicians and clerks) and half were from the ‘lower’ designations – service workers, skilled workers, trade workers, machine operators and elementary occupations (Table 6.4). The best represented groups were service and sales workers (24%) and professionals (19%) of the respondents, while the smallest respondent group was skilled agricultural workers – 2% of the workers interviewed.
6.2.4 Respondent’s Designation With regards to designation, half of the respondents were from the ‘higher’ designations (managers, professionals, technicians and clerks) and half were from the ‘lower’ designations – service workers, skilled workers, trade workers, machine operators and elementary occupations (Table 6.4). The best represented groups were service and sales workers (24%) and professionals (19%) of the respondents, while the smallest respondent group was skilled agricultural workers – 2% of the workers interviewed.

OCCUPATIONAL HEALTH AND SAFETY IN MALTA - A SNAPSHOT OF PREVAILING STANDARDS
35
Table 6.4 - Respondent designation
CountsAnalysis %Respondents
Total
Legislator, SeniorOfficial, Manager
Professional
Technician,AssociateProfessional
Clerk
Service Worker,Market & SalesWorker
SkilledAgriculturalWorker
Craft & RelatedTrades Worker
Plant & MachineOperator,Assembler
ElementaryOccupation
1603100.0%
20012.5%
29818.6%
1288.0%
17711.0%
38924.3%
241.5%
1318.2%
1096.8%
1479.2%
6.3 Employees’ OHS Rights and Duties ‘Employed’ respondents were asked whether they feel well informed of their rights and duties with regards to health and safety by their employer. Clearly, this question was not asked to the self-employed respondents. As Figures 6.5a and 6.5b show, almost half of the respondents felt either ‘Adequately informed’ or ‘Very well informed’ with regards to their rights and duties in health and safety matters – 48% gave one of these replies. A further 28% (213 respondents) felt moderately informed, and 4 respondents did not know how to rate their knowledge in this regard. On the negative side, almost one fourth of the workers (24%) felt they were either not so well informed or not informed at all about their rights and duties in health and safety.
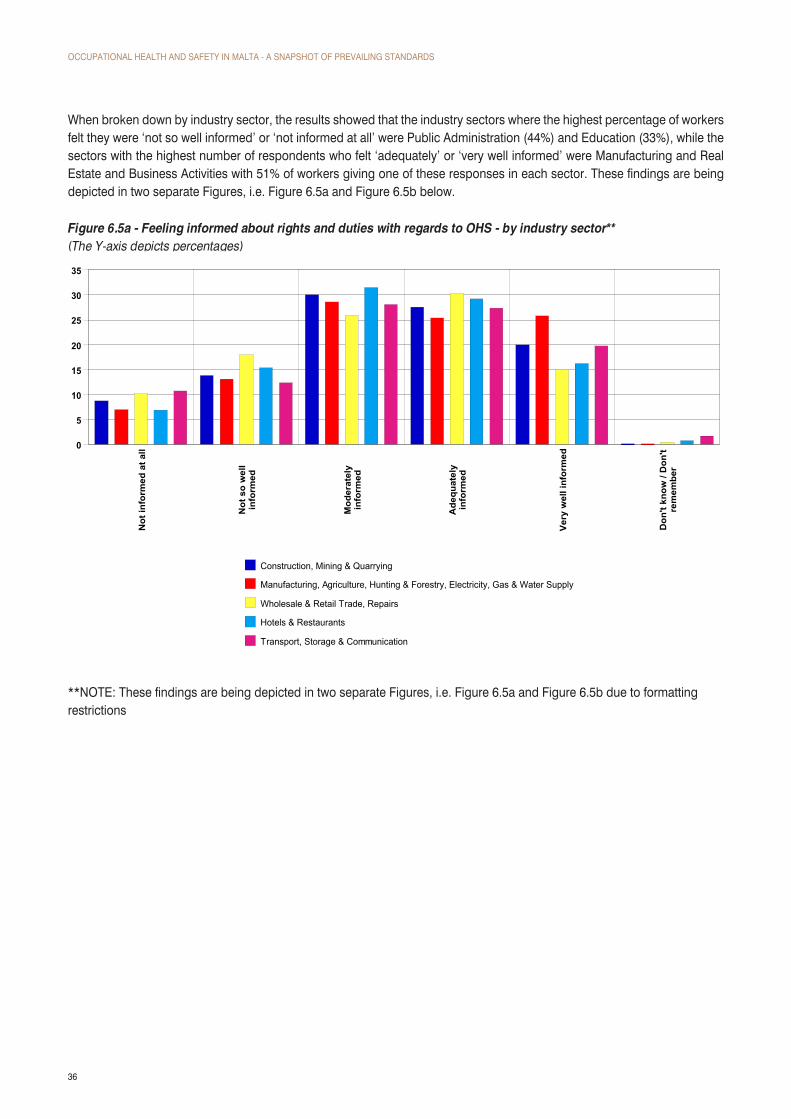
OCCUPATIONAL HEALTH AND SAFETY IN MALTA - A SNAPSHOT OF PREVAILING STANDARDS
36
When broken down by industry sector, the results showed that the industry sectors where the highest percentage of workers felt they were ‘not so well informed’ or ‘not informed at all’ were Public Administration (44%) and Education (33%), while the sectors with the highest number of respondents who felt ‘adequately’ or ‘very well informed’ were Manufacturing and Real Estate and Business Activities with 51% of workers giving one of these responses in each sector. These findings are being depicted in two separate Figures, i.e. Figure 6.5a and Figure 6.5b below.
Figure 6.5a - Feeling informed about rights and duties with regards to OHS - by industry sector**(The Y-axis depicts percentages)
0
5
10
15
20
25
30
35
Not
info
rmed
at a
ll
Not
so
wel
lin
form
ed
Mod
erat
ely
info
rmed
Ade
quat
ely
info
rmed
Ver
y w
ell i
nfor
med
Don
't kn
ow /
Don
'tre
mem
ber
Construction, Mining & Quarrying
Manufacturing, Agriculture, Hunting & Forestry, Electricity, Gas & Water Supply
Wholesale & Retail Trade, Repairs
Hotels & Restaurants
Transport, Storage & Communication
**NOTE: These findings are being depicted in two separate Figures, i.e. Figure 6.5a and Figure 6.5b due to formatting restrictions

OCCUPATIONAL HEALTH AND SAFETY IN MALTA - A SNAPSHOT OF PREVAILING STANDARDS
37
Figure 6.5b - Feeling informed about rights and duties with regards to OHS by industry sector**(The Y-axis depicts percentages)
0
5
10
15
20
25
30
35
Not
info
rmed
at a
ll
Not
so
wel
lin
form
ed
Mod
erat
ely
info
rmed
Ade
quat
ely
info
rmed
Very
wel
l inf
orm
ed
Don
't kn
ow /
Don
'tre
mem
ber
Real Estate, Renting, Financial Intermediation & Business Activities
Public Administration
Education
Health & Social Work
Other Community, Social & Personal Service Activities
**NOTE: These findings are being depicted in two separate Figures, i.e. Figure 6.5a and Figure 6.5b due to formatting restrictions
Analyzing the same results by company size reveals that in the largest companies with 500 and more employees, the employees felt much more informed of their rights and duties regarding health and safety when compared to smaller companies. In fact, only 4% of respondents working in the largest firms stated that they do not feel well informed at all, while 31% felt very well informed. This result is not surprising given the much more formal structure and training provided in larger firms.
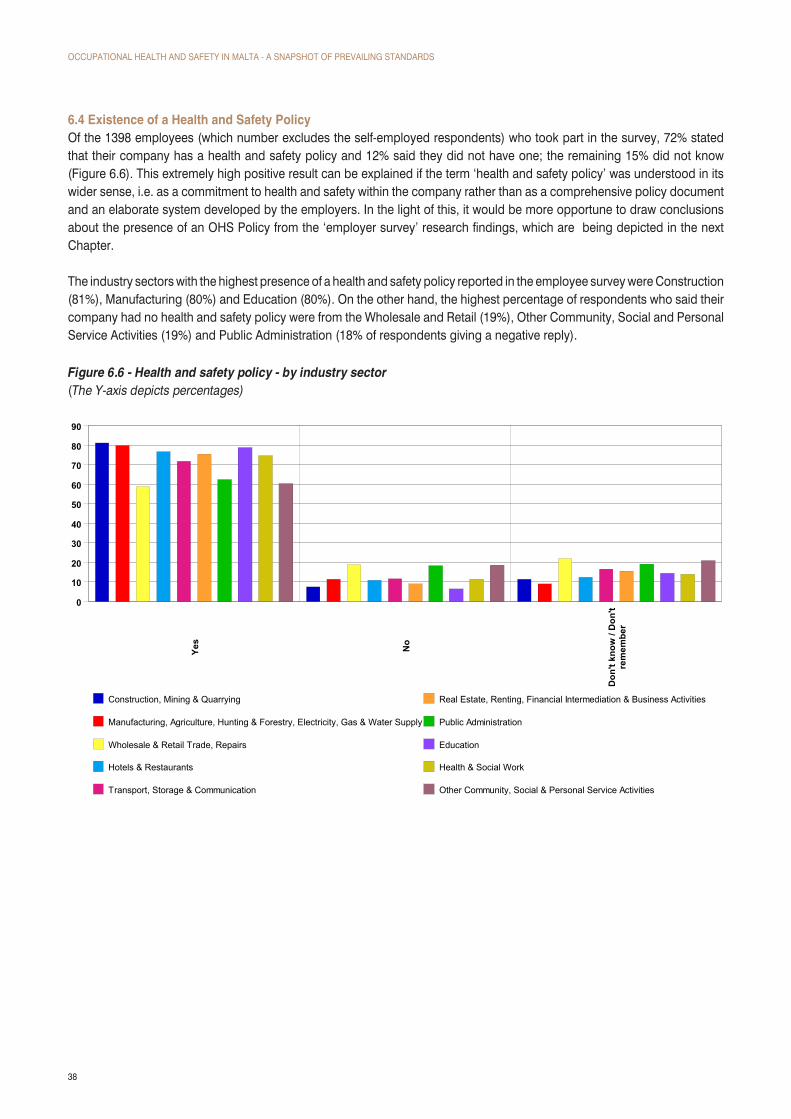
OCCUPATIONAL HEALTH AND SAFETY IN MALTA - A SNAPSHOT OF PREVAILING STANDARDS
38
6.4 Existence of a Health and Safety Policy Of the 1398 employees (which number excludes the self-employed respondents) who took part in the survey, 72% stated that their company has a health and safety policy and 12% said they did not have one; the remaining 15% did not know (Figure 6.6). This extremely high positive result can be explained if the term ‘health and safety policy’ was understood in its wider sense, i.e. as a commitment to health and safety within the company rather than as a comprehensive policy document and an elaborate system developed by the employers. In the light of this, it would be more opportune to draw conclusions about the presence of an OHS Policy from the ‘employer survey’ research findings, which are being depicted in the next Chapter.
The industry sectors with the highest presence of a health and safety policy reported in the employee survey were Construction (81%), Manufacturing (80%) and Education (80%). On the other hand, the highest percentage of respondents who said their company had no health and safety policy were from the Wholesale and Retail (19%), Other Community, Social and Personal Service Activities (19%) and Public Administration (18% of respondents giving a negative reply).
Figure 6.6 - Health and safety policy - by industry sector(The Y-axis depicts percentages)
0
10
20
30
40
50
60
70
80
90
Yes
No
Don
't kn
ow /
Don
'tre
mem
ber
Construction, Mining & Quarrying
Manufacturing, Agriculture, Hunting & Forestry, Electricity, Gas & Water Supply
Wholesale & Retail Trade, Repairs
Hotels & Restaurants
Transport, Storage & Communication
Real Estate, Renting, Financial Intermediation & Business Activities
Public Administration
Education
Health & Social Work
Other Community, Social & Personal Service Activities
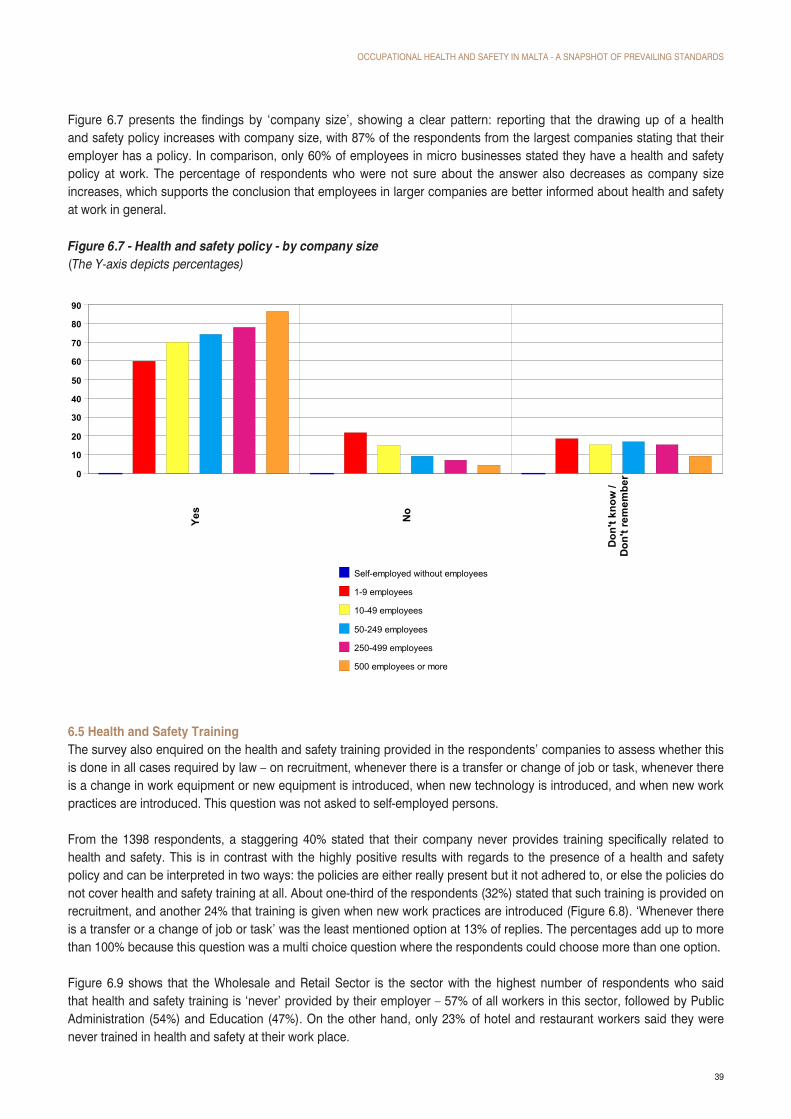
OCCUPATIONAL HEALTH AND SAFETY IN MALTA - A SNAPSHOT OF PREVAILING STANDARDS
39
Figure 6.7 presents the findings by ‘company size’, showing a clear pattern: reporting that the drawing up of a health and safety policy increases with company size, with 87% of the respondents from the largest companies stating that their employer has a policy. In comparison, only 60% of employees in micro businesses stated they have a health and safety policy at work. The percentage of respondents who were not sure about the answer also decreases as company size increases, which supports the conclusion that employees in larger companies are better informed about health and safety at work in general.
Figure 6.7 - Health and safety policy - by company size(The Y-axis depicts percentages)
Figure 6.7 - Health and safety policy - by company size(The Y-axis depicts percentages)
0
10
20
30
40
50
60
70
80
90
Yes
No
Don
't kn
ow /
Don
't re
mem
ber
Self-employed without employees
1-9 employees
10-49 employees
50-249 employees
250-499 employees
500 employees or more
6.5 Health and Safety Training The survey also enquired on the health and safety training provided in the respondents’ companies to assess whether this is done in all cases required by law – on recruitment, whenever there is a transfer or change of job or task, whenever there is a change in work equipment or new equipment is introduced, when new technology is introduced, and when new work practices are introduced. This question was not asked to self-employed persons.
From the 1398 respondents, a staggering 40% stated that their company never provides training specifically related to health and safety. This is in contrast with the highly positive results with regards to the presence of a health and safety policy and can be interpreted in two ways: the policies are either really present but it not adhered to, or else the policies do not cover health and safety training at all. About one-third of the respondents (32%) stated that such training is provided on recruitment, and another 24% that training is given when new work practices are introduced (Figure 6.8). ‘Whenever there is a transfer or a change of job or task’ was the least mentioned option at 13% of replies. The percentages add up to more than 100% because this question was a multi choice question where the respondents could choose more than one option.
Figure 6.9 shows that the Wholesale and Retail Sector is the sector with the highest number of respondents who said that health and safety training is ‘never’ provided by their employer – 57% of all workers in this sector, followed by Public Administration (54%) and Education (47%). On the other hand, only 23% of hotel and restaurant workers said they were never trained in health and safety at their work place.

OCCUPATIONAL HEALTH AND SAFETY IN MALTA - A SNAPSHOT OF PREVAILING STANDARDS
40
Figure 6.8 - Frequency of health and safety training - by industry sector(The Y-axis depicts percentages)
Figure 6.8 - Frequency of health and safety training - by industry sector(The Y-axis depicts percentages)
0
10
20
30
40
50
60
Nev
er
On
recr
uitm
ent
Whe
neve
r the
re is
atr
ansf
er o
r a c
hang
eof
job
or ta
sk
Whe
n th
ere
is a
chan
ge in
wor
keq
uipm
ent /
new
equi
pmen
t is
intr
oduc
ed
Whe
n ne
wte
chno
logy
isin
trod
uced
Whe
n ne
w w
ork
prac
tices
are
intr
oduc
ed
Construction, Mining & Quarrying
Manufacturing, Agriculture, Hunting & Forestry, Electricity, Gas & Water Supply
Wholesale & Retail Trade, Repairs
Hotels & Restaurants
Transport, Storage & Communication
Real Estate, Renting, Financial Intermediation & Business Activities
Public Administration
Education
Health & Social Work
Other Community, Social & Personal Service Activities
Again, analyzing the data for this question by ‘company size’ shows a clear trend: the frequency of health and safety training steadily increases with company size for all options, while the rate of respondents saying training is ‘never’ provided decreases. This finding is in coherence with the conclusions from the questions about health and safety policies and information about one’s duties with regards to occupational health and safety.

OCCUPATIONAL HEALTH AND SAFETY IN MALTA - A SNAPSHOT OF PREVAILING STANDARDS
41
Figure 6.9 - Frequency of health and safety training - by company size(The Y-axis depicts percentages)
Figure 6.9 - Frequency of health and safety training - by company size(The Y-axis depicts percentages)
0
10
20
30
40
50
60
Nev
er
On
recr
uitm
ent
Whe
neve
r the
re is
atra
nsfe
r or a
cha
nge
of jo
b or
task
Whe
n th
ere
is a
chan
ge in
wor
keq
uipm
ent /
new
equi
pmen
t is
intro
duce
d
Whe
n ne
w te
chno
logy
is in
trodu
ced
Whe
n ne
w w
ork
prac
tices
are
intro
duce
d
Self-employed without employees
1-9 employees
10-49 employees
50-249 employees
250-499 employees
500 employees or more
6.6 Disciplinary ActionThe respondents were asked whether their employer takes any disciplinary action when health and safety procedures are not followed. A high 40% of the respondents did not know, while 38% reported that action is taken and the remaining 23% replied that no action is taken. The sectors with the highest percentage of respondents stating that their employer does not take disciplinary measures in cases of breach of health and safety procedures were Real Estate and Business Activities (30%) and Wholesale and Retail Trade (27%). At the same time, half of the respondents in Manufacturing and Health and Social Work reported that their employers actually enforce the health and safety policies (Figure 6.10).

OCCUPATIONAL HEALTH AND SAFETY IN MALTA - A SNAPSHOT OF PREVAILING STANDARDS
42
Figure 6.10 - Disciplinary action - by company sector(The Y-axis depicts percentages)
Figure 6.10 - Disciplinary action - by industry sector(The Y-axis depicts percentages)
0
10
20
30
40
50
60
Yes
No
Don
't kn
ow /
Don
't re
mem
ber
Construction, Mining & Quarrying
Manufacturing, Agriculture, Hunting & Forestry, Electricity, Gas & Water Supply
Wholesale & Retail Trade, Repairs
Hotels & Restaurants
Transport, Storage & Communication
Real Estate, Renting, Financial Intermediation & Business Activities
Public Administration
Education
Health & Social Work
Other Community, Social & Personal Service Activities
If one conducts this analysis by company size, one finds that there is a slightly positive trend in the replies as the company size increases, with the largest companies breaking this pattern as the percentage of positive answers decreases slightly.
6.7 Designated Person with OHS DutiesAlmost a third of the respondents (28%) stated that their employer has not appointed or designated a person with duties specifically related to health and safety (Figure 6.11). Of the 1398 respondents, 309 (22%) reported that there is a person who is engaged in health and safety on a full-time basis, and 348 (25%) that health and safety fall under the responsibilities of a particular employee. Only 5% of the respondents said that their company uses the services of an external OHS consultant, and the remaining 21% did not know.
The results vary greatly by industry sector, with as many as 39% of the respondents in Manufacturing having a person employed full time on health and safety as opposed to only 8% of respondents in Wholesale and Retail (Figure 6.11).
At this stage, it is opportune to note that these findings depict a different picture from the ‘employers’ survey. This difference is figures may possibly be due to a wrong interpretation by employees of what constitutes a designated competent person on health & safety matter. The findings from the employer’s survey on the other hand are more reliable due to the direct knowledge on the matter from the employers interviewed and are being presented in the next chapter.

OCCUPATIONAL HEALTH AND SAFETY IN MALTA - A SNAPSHOT OF PREVAILING STANDARDS
43
Figure 6.11 - Person with specific OHS duties - by industry sector(The Y-axis depicts percentages)
0
5
10
15
20
25
30
35
40
45
50
Yes,
full
time
onO
HS
Yes,
OH
S fa
llsun
der t
here
spon
sibi
litie
s of
a pa
rtic
ular
empl
oyee
Yes,
reta
iner
bas
is(e
xter
nal
cons
ulta
nt)
No
Don
't kn
ow /
Don
'tre
mem
ber
Construction, Mining & Quarrying
Manufacturing, Agriculture, Hunting & Forestry, Electricity, Gas & Water Supply
Wholesale & Retail Trade, Repairs
Hotels & Restaurants
Transport, Storage & Communication
Real Estate, Renting, Financial Intermediation & Business Activities
Public Administration
Education
Health & Social Work
Other Community, Social & Personal Service Activities
As expected, larger companies are more likely to have a person engaged full-time on health and safety. In fact, over half of the companies with 500 employees or more (53%) have a full-time health and safety manager, when compared to only 6% of micro businesses.
6.8 Understanding of The Term ‘Risk Assessment’The ‘employee’ survey respondents were asked what they understand by the term “risk assessment”. Table 6.12 below depicts the salient perceived understandings of the respondents. Clearly, the findings show that even though a good number of respondents gave a correct definition to the term, there were still a high number who either indicated that they did not know what the definition is or gave a wrong explanation of what they understand by the term ‘risk assessment’. The object of this question was two-fold: firstly, to explore whether the employees know what a ‘risk assessment’ is and secondly, for those employee respondents who did not know what a risk assessment is, the Researcher explained the meaning of this term before proceeding with the next research area, i.e. on whether risk assessments were being performed by their respective employer.
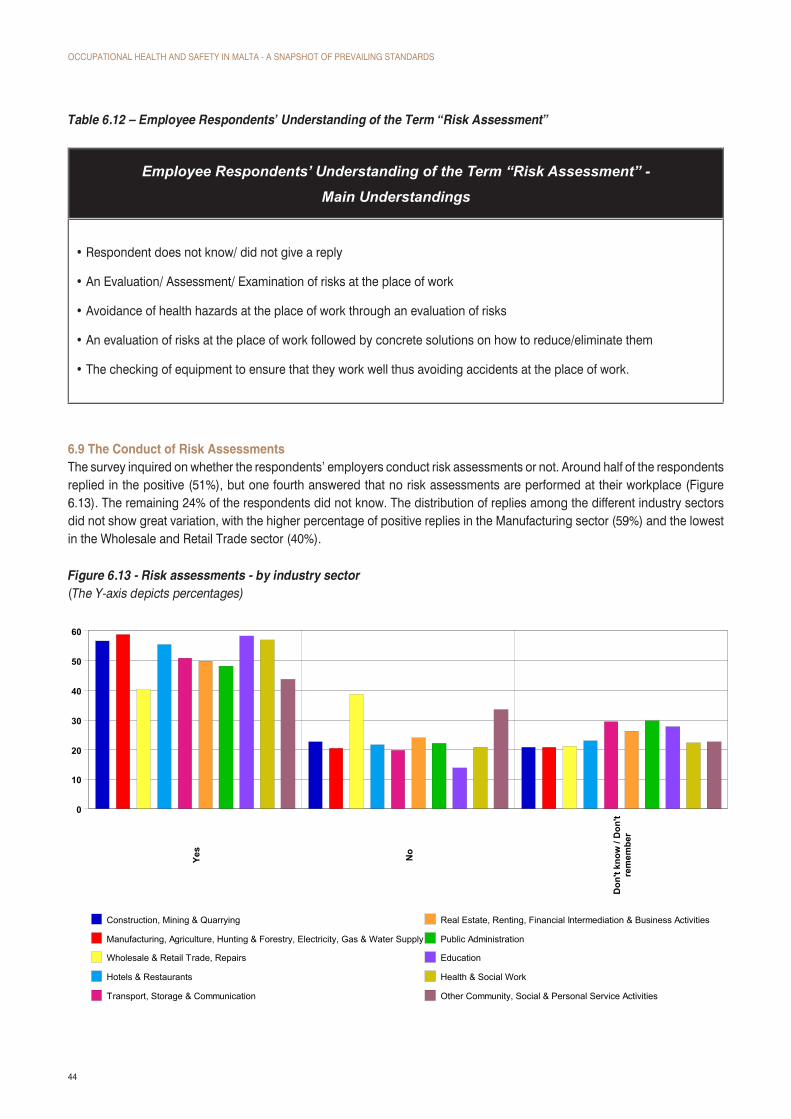
OCCUPATIONAL HEALTH AND SAFETY IN MALTA - A SNAPSHOT OF PREVAILING STANDARDS
44
Table 6.12 – Employee Respondents’ Understanding of the Term “Risk Assessment”
Employee Respondents’ Understanding of the Term “Risk Assessment” -
Main Understandings
• Respondent does not know/ did not give a reply
• An Evaluation/ Assessment/ Examination of risks at the place of work
• Avoidance of health hazards at the place of work through an evaluation of risks
• An evaluation of risks at the place of work followed by concrete solutions on how to reduce/eliminate them
• The checking of equipment to ensure that they work well thus avoiding accidents at the place of work.
6.9 The Conduct of Risk Assessments The survey inquired on whether the respondents’ employers conduct risk assessments or not. Around half of the respondents replied in the positive (51%), but one fourth answered that no risk assessments are performed at their workplace (Figure 6.13). The remaining 24% of the respondents did not know. The distribution of replies among the different industry sectors did not show great variation, with the higher percentage of positive replies in the Manufacturing sector (59%) and the lowest in the Wholesale and Retail Trade sector (40%).
Figure 6.13 - Risk assessments - by industry sector(The Y-axis depicts percentages)
0
10
20
30
40
50
60
Yes
No
Don
't kn
ow /
Don
'tre
mem
ber
Construction, Mining & Quarrying
Manufacturing, Agriculture, Hunting & Forestry, Electricity, Gas & Water Supply
Wholesale & Retail Trade, Repairs
Hotels & Restaurants
Transport, Storage & Communication
Real Estate, Renting, Financial Intermediation & Business Activities
Public Administration
Education
Health & Social Work
Other Community, Social & Personal Service Activities
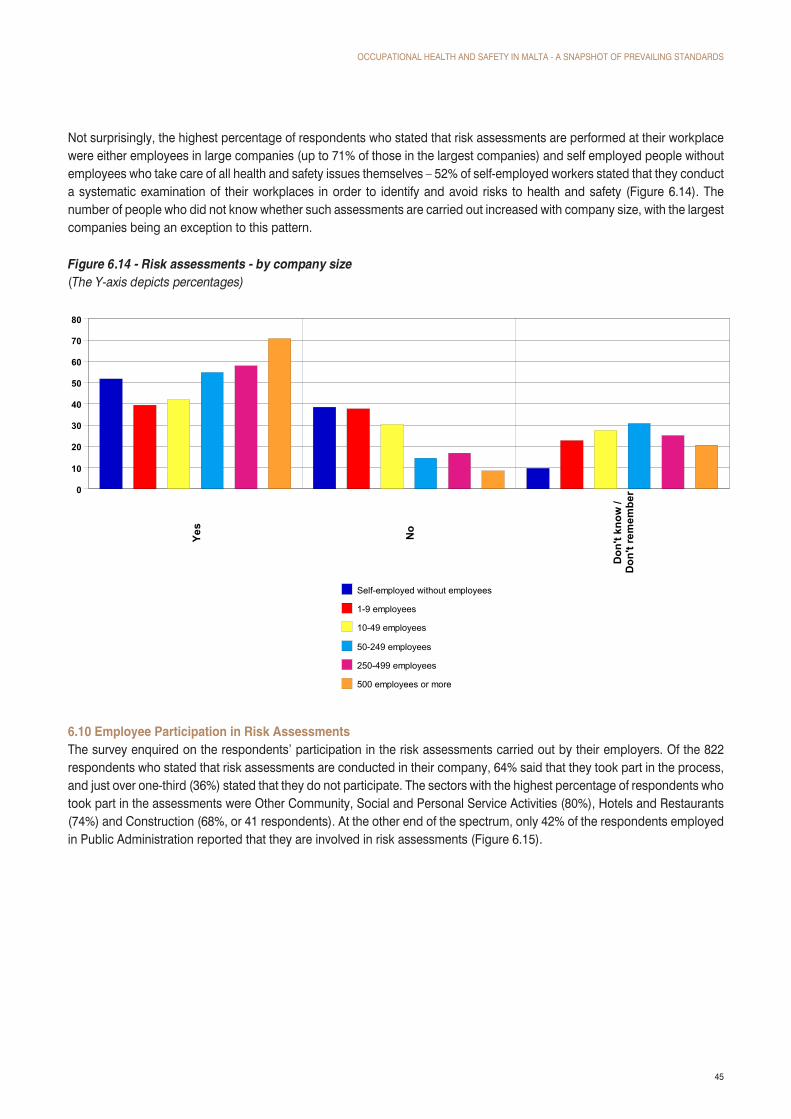
OCCUPATIONAL HEALTH AND SAFETY IN MALTA - A SNAPSHOT OF PREVAILING STANDARDS
45
Not surprisingly, the highest percentage of respondents who stated that risk assessments are performed at their workplace were either employees in large companies (up to 71% of those in the largest companies) and self employed people without employees who take care of all health and safety issues themselves – 52% of self-employed workers stated that they conduct a systematic examination of their workplaces in order to identify and avoid risks to health and safety (Figure 6.14). The number of people who did not know whether such assessments are carried out increased with company size, with the largest companies being an exception to this pattern.
Figure 6.14 - Risk assessments - by company size(The Y-axis depicts percentages)
0
10
20
30
40
50
60
70
80
Yes
No
Don
't kn
ow /
Don
't re
mem
ber
Self-employed without employees
1-9 employees
10-49 employees
50-249 employees
250-499 employees
500 employees or more
6.10 Employee Participation in Risk Assessments The survey enquired on the respondents’ participation in the risk assessments carried out by their employers. Of the 822 respondents who stated that risk assessments are conducted in their company, 64% said that they took part in the process, and just over one-third (36%) stated that they do not participate. The sectors with the highest percentage of respondents who took part in the assessments were Other Community, Social and Personal Service Activities (80%), Hotels and Restaurants (74%) and Construction (68%, or 41 respondents). At the other end of the spectrum, only 42% of the respondents employed in Public Administration reported that they are involved in risk assessments (Figure 6.15).

OCCUPATIONAL HEALTH AND SAFETY IN MALTA - A SNAPSHOT OF PREVAILING STANDARDS
46
Figure 6.15 - Participation in risk assessments - by industry sector(The Y-axis depicts percentages)
0
10
20
30
40
50
60
70
80
90
Yes
No
Construction, Mining & Quarrying
Manufacturing, Agriculture, Hunting & Forestry, Electricity, Gas & Water Supply
Wholesale & Retail Trade, Repairs
Hotels & Restaurants
Transport, Storage & Communication
Real Estate, Renting, Financial Intermediation & Business Activities
Public Administration
Education
Health & Social Work
Other Community, Social & Personal Service Activities
In terms of company size, a staggering 96% of the self-employed state that they participate in the risk assessment or they conduct it themselves, and the percentages decreased as the company size increases with the exception of the largest companies where it was slightly higher at 60% (Figure 6.16).
Figure 6.16 - Participation in risk assessments - by company size(The Y-axis depicts percentages)
0
10
20
30
40
50
60
70
80
90
100
Yes
No
Self-employed without employees
1-9 employees
10-49 employees
50-249 employees
250-499 employees
500 employees or more

OCCUPATIONAL HEALTH AND SAFETY IN MALTA - A SNAPSHOT OF PREVAILING STANDARDS
47
6.11 Pregnant Females The 628 employed women (and not the 80 self-employed females) were asked whether they were ever pregnant during the course of the current employment. Of these 628 respondents, 101 (16%) stated that they have been pregnant while working at their current company, while the majority (84%) replied in the negative (Figure 6.17). The highest percentages of women who were pregnant while working were in the public sector, namely in Public Administration (26%), Health and Social Work (24%) and Education (22%). On the other hand, no women from the Construction sector stated that they have been pregnant while working with their current employer, a finding which could be explained with the fact that only 6 women employed in Construction participated in the survey.
Figure 6.18 - Pregnant employees who informed employer of their pregnancy – by industry sector(The Y-axis depicts percentages)
Figure 6.17- Pregnant employees - by industry sector(The Y-axis depicts percentages)
0
10
20
30
40
50
60
70
80
90
100
Yes No
Construction, Mining & Quarrying
Manufacturing, Agriculture, Hunting & Forestry, Electricity, Gas & Water Supply
Wholesale & Retail Trade, Repairs
Hotels & Restaurants
Transport, Storage & Communication
Real Estate, Renting, Financial Intermediation & Business Activities
Public Administration
Education
Health & Social Work
Other Community, Social & Personal Service Activities
Of the 101 female respondents who were pregnant while working with their current employer, half informed their employer, but not by presenting a medical certificate and 9% did not inform their employer at all (Figure 6.18). The remaining 42% informed their superiors by presenting a certificate by a doctor or a midwife. As Figure 6.18 shows, only 5 respondents working in the Manufacturing sector were pregnant and none of them presented a certificate, while the highest numbers of pregnant respondents were in Education, Health and Social Work, as well as Real Estate, Renting, Financial Intermediation and Business Activities. This could be explained with the prevailing office hours, no shift work and possibility for flexible or reduced hours in these sectors. The Real Estate sector also displays the highest percentage of women (70%) who informed their employer of their pregnancy with an official certificate.

OCCUPATIONAL HEALTH AND SAFETY IN MALTA - A SNAPSHOT OF PREVAILING STANDARDS
48
Figure 6.18 - Pregnant employees who informed employer of their pregnancy – by industry sector(The Y-axis depicts percentages)
0
10
20
30
40
50
60
70
80
90Y
es
Yes
, but
not
with
a m
edic
alce
rtifi
cate
No
Construction, Mining & Quarrying
Manufacturing, Agriculture, Hunting & Forestry, Electricity, Gas & Water Supply
Wholesale & Retail Trade, Repairs
Hotels & Restaurants
Transport, Storage & Communication
Real Estate, Renting, Financial Intermediation & Business Activities
Public Administration
Education
Health & Social Work
Other Community, Social & Personal Service Activities
Figure 6.19 reveals that when the data is analyzed by company size, a clear trend emerges: the larger the company, the more likely it is that the pregnant employee will present a medical certificate to her managers in order to inform them of her pregnancy. In fact, women working in the largest companies are more than twice more likely to present a certificate than their counterparts employed with micro businesses. This finding is a reflection of the more informal communication that takes place in smaller organizations and the possibility that the need to present official documents is less felt in micro companies
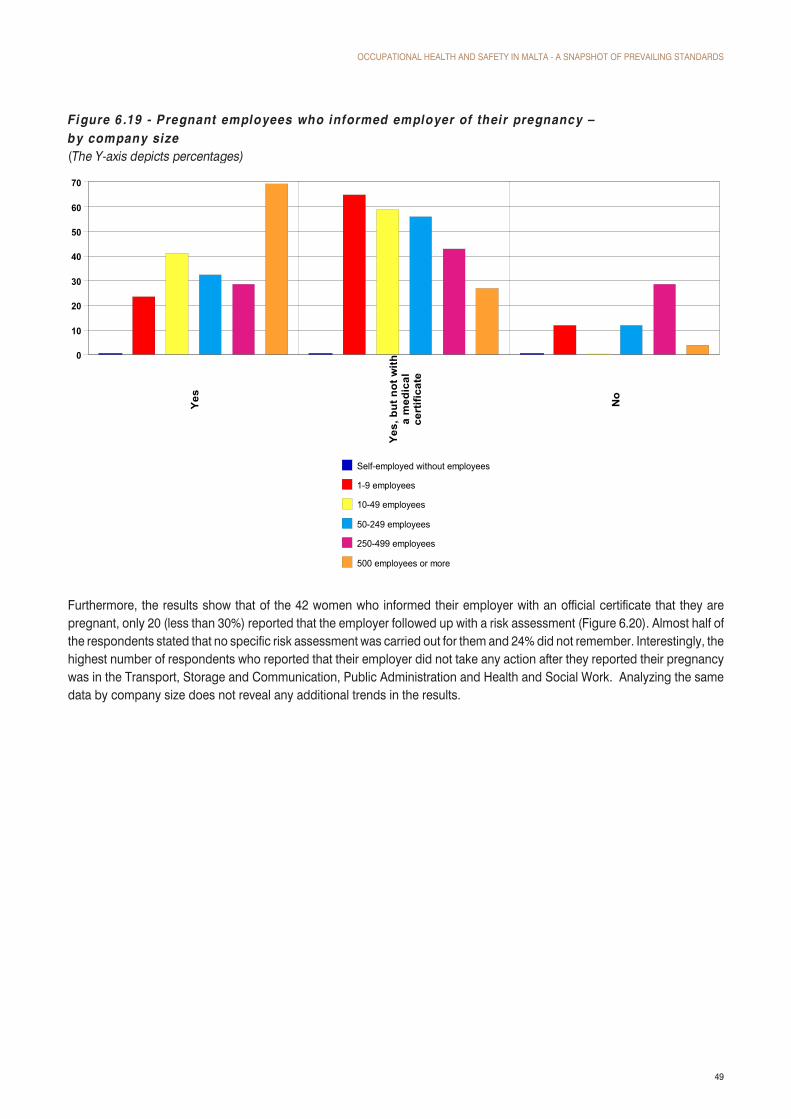
OCCUPATIONAL HEALTH AND SAFETY IN MALTA - A SNAPSHOT OF PREVAILING STANDARDS
49
Figure 6.19 - Pregnant employees who informed employer of their pregnancy –by company size(The Y-axis depicts percentages)
0
10
20
30
40
50
60
70Y
es
Yes
, but
not
with
a m
edic
alce
rtifi
cate
No
Self-employed without employees
1-9 employees
10-49 employees
50-249 employees
250-499 employees
500 employees or more
Furthermore, the results show that of the 42 women who informed their employer with an official certificate that they are pregnant, only 20 (less than 30%) reported that the employer followed up with a risk assessment (Figure 6.20). Almost half of the respondents stated that no specific risk assessment was carried out for them and 24% did not remember. Interestingly, the highest number of respondents who reported that their employer did not take any action after they reported their pregnancy was in the Transport, Storage and Communication, Public Administration and Health and Social Work. Analyzing the same data by company size does not reveal any additional trends in the results.
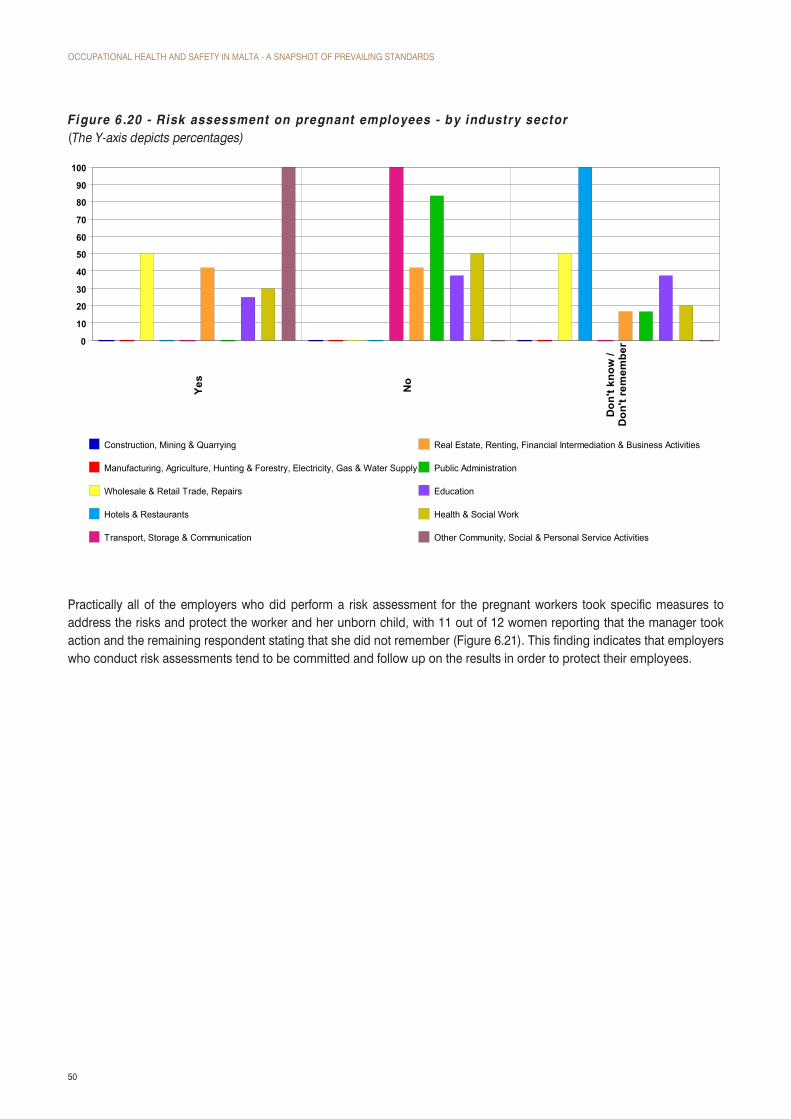
OCCUPATIONAL HEALTH AND SAFETY IN MALTA - A SNAPSHOT OF PREVAILING STANDARDS
50
Figure 6.20 - Risk assessment on pregnant employees - by industry sector(The Y-axis depicts percentages)
0
10
20
30
40
50
60
70
80
90
100
Yes
No
Don
't kn
ow /
Don
't re
mem
ber
Construction, Mining & Quarrying
Manufacturing, Agriculture, Hunting & Forestry, Electricity, Gas & Water Supply
Wholesale & Retail Trade, Repairs
Hotels & Restaurants
Transport, Storage & Communication
Real Estate, Renting, Financial Intermediation & Business Activities
Public Administration
Education
Health & Social Work
Other Community, Social & Personal Service Activities
Practically all of the employers who did perform a risk assessment for the pregnant workers took specific measures to address the risks and protect the worker and her unborn child, with 11 out of 12 women reporting that the manager took action and the remaining respondent stating that she did not remember (Figure 6.21). This finding indicates that employers who conduct risk assessments tend to be committed and follow up on the results in order to protect their employees.

OCCUPATIONAL HEALTH AND SAFETY IN MALTA - A SNAPSHOT OF PREVAILING STANDARDS
51
Figure 6.21 - Specific measures after the risk assessment of the pregnant woman - by industry sector(The Y-axis depicts percentages)
0
10
20
30
40
50
60
70
80
90
100Ye
s
No
Don
't kn
ow /
Don
't re
mem
ber
Construction, Mining & Quarrying
Manufacturing, Agriculture, Hunting & Forestry, Electricity, Gas & Water Supply
Wholesale & Retail Trade, Repairs
Hotels & Restaurants
Transport, Storage & Communication
Real Estate, Renting, Financial Intermediation & Business Activities
Public Administration
Education
Health & Social Work
Other Community, Social & Personal Service Activities

OCCUPATIONAL HEALTH AND SAFETY IN MALTA - A SNAPSHOT OF PREVAILING STANDARDS
52
6.12 Knowledge on The Role of the Health and Safety RepresentativeAll 1398 employed respondents were asked whether they know what the role of a health and safety representative is. Just over half (52%) replied in the positive and one-third (32%) stated that they do not know what the term means. Another 16% were unsure what the role of a workers’ representative with regards to health and safety is (Figure 6.22). Almost 20% of the respondents from the Education sector were unsure in their answer to this question, while as many as 45% of the respondents in the Wholesale and Retail sector did not know what the role of the representative is. The sectors with the highest positive results were Education and Health, with 60% and 61% of the respondents giving a positive reply, respectively.
Figure 6.22 - Knowledge of the role of a Workers’ Health & Safety Representative - by industry sector(The Y-axis depicts percentages)
0
10
20
30
40
50
60
70
Yes
No
Don
't kn
ow /
Don
'tre
mem
ber
Construction, Mining & Quarrying
Manufacturing, Agriculture, Hunting & Forestry, Electricity, Gas & Water Supply
Wholesale & Retail Trade, Repairs
Hotels & Restaurants
Transport, Storage & Communication
Real Estate, Renting, Financial Intermediation & Business Activities
Public Administration
Education
Health & Social Work
Other Community, Social & Personal Service Activities

OCCUPATIONAL HEALTH AND SAFETY IN MALTA - A SNAPSHOT OF PREVAILING STANDARDS
53
In respect to company size, there was a clear tendency for respondents from larger companies to be more confident in their knowledge of the role of a workers’ health and safety representative when compared to workers in smaller companies. In fact, only 37% of the employees in micro companies gave a positive reply to this Question, compared to 67% of respondents in firms with over 500 employees (Figure 6.23).
Figure 6.23- Knowledge of the role of a Workers Health & Safety Representative - by company size(The Y-axis depicts percentages)
0
10
20
30
40
50
60
70
Yes
No
Don
't kn
ow /
Don
't re
mem
ber
Self-employed without employees
1-9 employees
10-49 employees
50-249 employees
250-499 employees
500 employees or more

OCCUPATIONAL HEALTH AND SAFETY IN MALTA - A SNAPSHOT OF PREVAILING STANDARDS
54
6.13 Presence of a Workers’ OHS Representative at the WorkplaceWhen asked whether they have a workers’ health and safety representative at their workplace, 36% of the employed respondents answered ‘yes’, 40% - ‘no’, and the remaining 24% did not know (Figure 6.24). Self-employed respondents were not asked this question. The sectors with the highest percentage of respondents stating that they have a representative who deals with health and safety issues were Education (49%) and Manufacturing (46%). In contrast, almost half of the respondents employed in Construction (49%) and 62% of those working in Wholesale and Retail reported that they do not have a person they can refer to for representation on health and safety issues.
At this stage, one must note that these findings were significantly higher than those found in the ‘employer’ surveys. This is possibly due to the wrong interpretation of a health and safety representative by certain employees. Therefore the results obtained from the employer’s survey (being presented in the next Chapter) are considered to be more reliable for this reason.
Figure 6.24 - Workers Health and Safety Representative - by industry sector(The Y-axis depicts percentages)
0
10
20
30
40
50
60
70
Yes
No
Don
't kn
ow /
Don
't re
mem
ber
Construction, Mining & Quarrying
Manufacturing, Agriculture, Hunting & Forestry, Electricity, Gas & Water Supply
Wholesale & Retail Trade, Repairs
Hotels & Restaurants
Transport, Storage & Communication
Real Estate, Renting, Financial Intermediation & Business Activities
Public Administration
Education
Health & Social Work
Other Community, Social & Personal Service Activities

OCCUPATIONAL HEALTH AND SAFETY IN MALTA - A SNAPSHOT OF PREVAILING STANDARDS
55
Figure 6.25 shows the analysis by company size: the percentage of workers who said their company had a representative increased from 11% in micro companies to 65% in firms with 500 employees and more. The highest percentage of respondents who were not sure whether they have a representative or not were from companies with 50-249 employees – 122 respondents or 31%.
Figure 6.25 - Workers Health and Safety Representative - by company size(The Y-axis depicts percentages)
0
10
20
30
40
50
60
70
80
Yes
No
Don
't kn
ow /
Don
't re
mem
ber
Self-employed without employees
1-9 employees
10-49 employees
50-249 employees
250-499 employees
500 employees or more

OCCUPATIONAL HEALTH AND SAFETY IN MALTA - A SNAPSHOT OF PREVAILING STANDARDS
56
6.14 Employee’s Involvement in the Appointment of the OHS Representative All 505 respondents who said they have a workers’ health and safety representatives on matters related to occupational health and safety were asked whether they were involved in the appointment of that person. The results show that 430 respondents (85%) gave a negative reply and only 12% said they were involved. The sector where the most respondents were involved was Hotels and Restaurants where 22% of the workers took part in appointing the representative, followed by 17% in Real Estate and Business Activities and 13% in Public Administration. The sectors with the fewest workers taking part in this decision were Construction with 92% stating they were not involved, Education (91%) and Retail and Wholesale (91%). Figure 6.26 below depicts these findings.
Figure 6.26 - Involvement in the appointment of the representative by industry sector(The Y-axis depicts percentages)
0
10
20
30
40
50
60
70
80
90
100
Yes
No
Don
't kn
ow /
Don
'tre
mem
ber
Construction, Mining & Quarrying
Manufacturing, Agriculture, Hunting & Forestry, Electricity, Gas & Water Supply
Wholesale & Retail Trade, Repairs
Hotels & Restaurants
Transport, Storage & Communication
Real Estate, Renting, Financial Intermediation & Business Activities
Public Administration
Education
Health & Social Work
Other Community, Social & Personal Service Activities

OCCUPATIONAL HEALTH AND SAFETY IN MALTA - A SNAPSHOT OF PREVAILING STANDARDS
57
Interestingly, analyzing the same data by company size reveals that the smaller the company, the more likely it is that workers would be involved in the appointment of a workers’ heath and safety representative (Figure 6.27). While almost a fourth (24%) of employees in micro companies took part in the decision, less than 10% were involved in the largest firms with 500 employees or more. This finding could possibly be explained by the better and more informal communication that characterizes smaller organisations.
Figure 6.27 - Involvement in the appointment of the representative – by company size(The Y-axis depicts percentages)
0
10
20
30
40
50
60
70
80
90
100
Yes
No
Don
't kn
ow /
Don
't re
mem
ber
Self-employed without employees
1-9 employees
10-49 employees
50-249 employees
250-499 employees
500 employees or more

OCCUPATIONAL HEALTH AND SAFETY IN MALTA - A SNAPSHOT OF PREVAILING STANDARDS
58
6.15 Method of Appointment of the Workers’ HS Representative The 505 respondents who stated that they have a workers’ health and safety representative were also asked about the method of appointment of this representative. The majority replied that the representatives were appointed by management (64%), followed by ‘don’t know’ (23%) and having a volunteer or a person elected by the workers (each these to options being chosen by 6% of the respondents). Only 1% of the employees (6 respondents) stated that the representative was appointed by management after the workers failed to appoint (Figure 6.28). The sectors where the most respondents stated that the representative was elected by the workers were Manufacturing (14%) and Hotels and Restaurants (11%).
The analysis by company size showed that mid-sized companies are more likely to have a representative chosen by the workers or a volunteer when compared to micro and large firms.
Figure 6.28 - Method of choosing the representative - by industry sector(The Y-axis depicts percentages)
0
10
20
30
40
50
60
70
80
App
oint
ed b
ym
anag
emen
t
App
oint
ed b
ym
anag
emen
tbe
caus
e w
orke
rsfa
iled
to a
ppoi
nt
Volu
ntee
r
Elec
ted
by th
ew
orke
rs
Don
't kn
ow /
Don
'tre
mem
ber
Construction, Mining & Quarrying
Manufacturing, Agriculture, Hunting & Forestry, Electricity, Gas & Water Supply
Wholesale & Retail Trade, Repairs
Hotels & Restaurants
Transport, Storage & Communication
Real Estate, Renting, Financial Intermediation & Business Activities
Public Administration
Education
Health & Social Work
Other Community, Social & Personal Service Activities

OCCUPATIONAL HEALTH AND SAFETY IN MALTA - A SNAPSHOT OF PREVAILING STANDARDS
59
6.16 Medical Examination of Employees All 1398 employees were asked whether their employer conducts medical examinations of their health prior to employment and during employment. With regards to pre-employment, the majority of respondents (60%) said that no medical tests have been carried out by the employer to check their health. The percentages ranged from 37% in Public Administration and Health and Social Work to as high as 84% in the Wholesale and Retail sector. The sector with the highest percentage of respondents being examined before they start their employment was Health and Social Work with 62% of employees undergoing a medical check-up, followed by Public Administration with 60% (Figure 6.29).
Figure 6.29 - Medical examination prior to employment - by industry sector(The Y-axis depicts percentages)
0
10
20
30
40
50
60
70
80
90
Yes
No
Don
't kn
ow /
Don
't re
mem
ber
Construction, Mining & Quarrying
Manufacturing, Agriculture, Hunting & Forestry, Electricity, Gas & Water Supply
Wholesale & Retail Trade, Repairs
Hotels & Restaurants
Transport, Storage & Communication
Real Estate, Renting, Financial Intermediation & Business Activities
Public Administration
Education
Health & Social Work
Other Community, Social & Personal Service Activities

OCCUPATIONAL HEALTH AND SAFETY IN MALTA - A SNAPSHOT OF PREVAILING STANDARDS
60
When examined by company size, the results show that larger employers are much more likely to conduct a medical examination of their workers; health prior to employment when compared to smaller firms. In fact, only 18% of respondents from micro businesses gave a positive reply compared to 74% of workers in the largest companies (Figure 6.30).
Figure 6.30 - Medical examination prior to employment - by company size(The Y-axis depicts percentages)
0
10
20
30
40
50
60
70
80
90
Yes
No
Don
't kn
ow /
Don
't re
mem
ber
Self-employed without employees
1-9 employees
10-49 employees
50-249 employees
250-499 employees
500 employees or more

OCCUPATIONAL HEALTH AND SAFETY IN MALTA - A SNAPSHOT OF PREVAILING STANDARDS
61
The results were different when respondents were asked whether their health has been checked by their employer during employment (as opposed to at the start of their employment). In this part of the Research Question, only 15% of the workers answered ‘yes’, while 83% said ‘no’ and 2% could not remember (Figure 6.31). Again, the highest positive results were obtained by employees in the Health and Social Work and Public Administration with 23% and 26% of workers giving a positive reply, respectively; followed by Manufacturing and Transport with 20%. A staggering 95% of employees in the Wholesale and Retail sector stated that their employer has never conducted a medical examination of their health during employment. The results by company size were very similar to those concerning medical tests prior to employment, with larger companies showing distinctly more commitment to employees’ health examinations.
Figure 6.31 - Medical examination during employment - by industry sector(The Y-axis depicts percentages)
0
10
20
30
40
50
60
70
80
90
100
Yes
No
Don
't kn
ow /
Don
't re
mem
ber
Construction, Mining & Quarrying
Manufacturing, Agriculture, Hunting & Forestry, Electricity, Gas & Water Supply
Wholesale & Retail Trade, Repairs
Hotels & Restaurants
Transport, Storage & Communication
Real Estate, Renting, Financial Intermediation & Business Activities
Public Administration
Education
Health & Social Work
Other Community, Social & Personal Service Activities
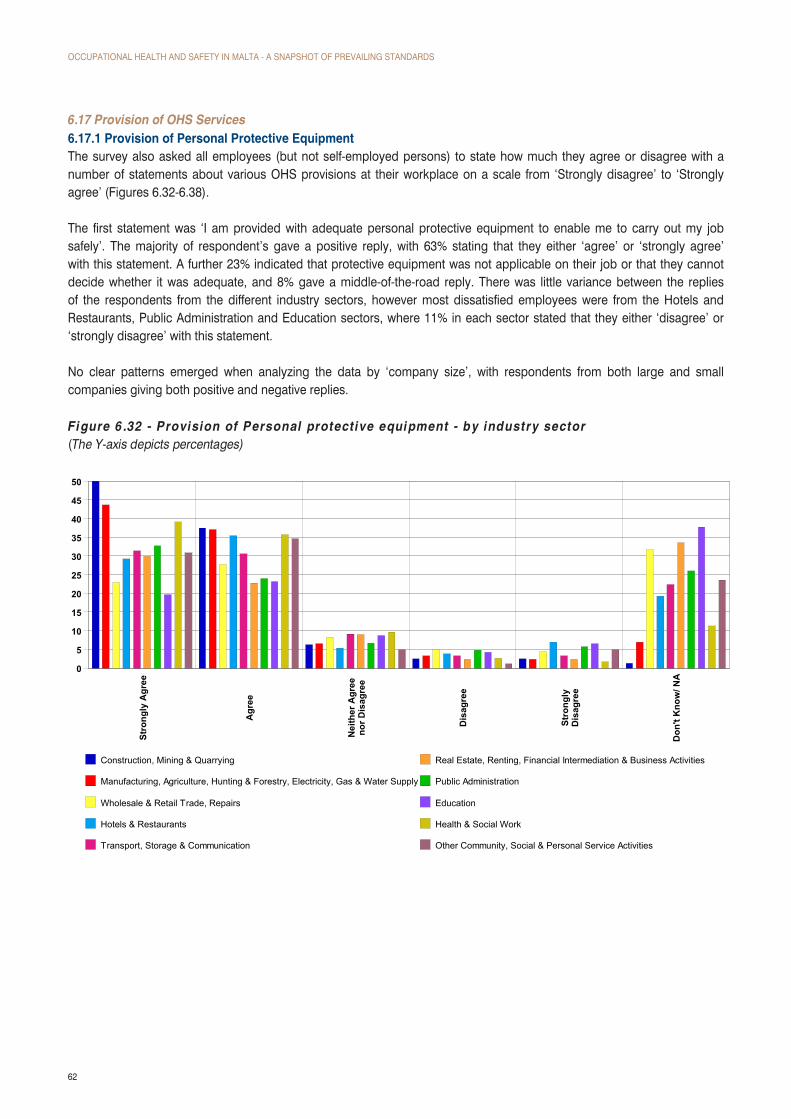
OCCUPATIONAL HEALTH AND SAFETY IN MALTA - A SNAPSHOT OF PREVAILING STANDARDS
62
6.17 Provision of OHS Services6.17.1 Provision of Personal Protective EquipmentThe survey also asked all employees (but not self-employed persons) to state how much they agree or disagree with a number of statements about various OHS provisions at their workplace on a scale from ‘Strongly disagree’ to ‘Strongly agree’ (Figures 6.32-6.38).
The first statement was ‘I am provided with adequate personal protective equipment to enable me to carry out my job safely’. The majority of respondent’s gave a positive reply, with 63% stating that they either ‘agree’ or ‘strongly agree’ with this statement. A further 23% indicated that protective equipment was not applicable on their job or that they cannot decide whether it was adequate, and 8% gave a middle-of-the-road reply. There was little variance between the replies of the respondents from the different industry sectors, however most dissatisfied employees were from the Hotels and Restaurants, Public Administration and Education sectors, where 11% in each sector stated that they either ‘disagree’ or ‘strongly disagree’ with this statement.
No clear patterns emerged when analyzing the data by ‘company size’, with respondents from both large and small companies giving both positive and negative replies.
Figure 6.32 - Provision of Personal protective equipment - by industry sector(The Y-axis depicts percentages)
0
5
10
15
20
25
30
35
40
45
50
Stro
ngly
Agr
ee
Agr
ee
Nei
ther
Agr
eeno
r Dis
agre
e
Dis
agre
e
Stro
ngly
Dis
agre
e
Don
't K
now
/ NA
Construction, Mining & Quarrying
Manufacturing, Agriculture, Hunting & Forestry, Electricity, Gas & Water Supply
Wholesale & Retail Trade, Repairs
Hotels & Restaurants
Transport, Storage & Communication
Real Estate, Renting, Financial Intermediation & Business Activities
Public Administration
Education
Health & Social Work
Other Community, Social & Personal Service Activities

OCCUPATIONAL HEALTH AND SAFETY IN MALTA - A SNAPSHOT OF PREVAILING STANDARDS
63
6.17.2 Accessibility of the OHS Representative For the statement ‘The health and safety representative was easily accessible and responsive when I needed him/her’, 40% (555 respondents) said this was not applicable to them, and another 45% stated that they either agree or strongly agree with it. The high number of ‘not applicable’ replies is not surprising given than a total of 893 respondents stated that they either don’t have a representative or they do not know whether they have one. On the negative side, 7% said they disagree or strongly disagree that the representative was there when they needed help and a further 9% neither agreed, nor disagreed with the statement (Figure 6.33).
Analyzing by industry sector, the highest percentage of negative opinions was expressed by respondents in the Construction and Health and Social Work sectors, where 11% stated that they either disagree or strongly disagree with the statement about their workers’ representative. On the other hand, 52% of the workers in Manufacturing and half of the respondents in Education agree that their representative was easily accessible.
Figure 6.33 - Accessibility of Health and Safety Representative - by industry sector(The Y-axis depicts percentages)
0
10
20
30
40
50
60
Stro
ngly
Agr
ee
Agr
ee
Nei
ther
Agr
eeno
r Dis
agre
e
Dis
agre
e
Stro
ngly
Dis
agre
e
Don
't K
now
/ NA
Construction, Mining & Quarrying
Manufacturing, Agriculture, Hunting & Forestry, Electricity, Gas & Water Supply
Wholesale & Retail Trade, Repairs
Hotels & Restaurants
Transport, Storage & Communication
Real Estate, Renting, Financial Intermediation & Business Activities
Public Administration
Education
Health & Social Work
Other Community, Social & Personal Service Activities

OCCUPATIONAL HEALTH AND SAFETY IN MALTA - A SNAPSHOT OF PREVAILING STANDARDS
64
Figure 6.34 presents the same results by company size: the proportion of employees who either agreed or strongly agreed that their health and safety representative was accessible steadily increased from 35% in micro companies to 57% in the largest companies. At the same time, the percentage of ‘don’t know/not applicable’ replies generally decreased with company size, in line with the results from this Question showing that more respondents have a representative in the larger firms when compared to smaller ones.
Figure 6.34 - Accessibility of Health and Safety Representative - by company size(The Y-axis depicts percentages)
0
5
10
15
20
25
30
35
40
Stro
ngly
Agr
ee
Agr
ee
Nei
ther
Agr
eeno
r Dis
agre
e
Dis
agre
e
Stro
ngly
Dis
agre
e
Don
't K
now
/ NA
Self-employed without employees
1-9 employees
10-49 employees
50-249 employees
250-499 employees
500 employees or more

OCCUPATIONAL HEALTH AND SAFETY IN MALTA - A SNAPSHOT OF PREVAILING STANDARDS
65
6.17.3 Handling of OHS ComplaintsThe third statement put forth to the respondents was ‘Whenever I have a complaint, it is acknowledged and promptly acted upon’. The majority of the 1398 employees (63%) agreed or strongly agreed with this statement about their workplace, and only 8% gave a negative response (‘disagree’ or ‘strongly disagree’). Almost one-fifth of the respondents (17%) neither agreed nor disagreed and the remaining 12% stated that they are unsure or the statement does not apply for them – for instance, if they never had any complaints. The industry sectors where the respondents were most satisfied with the way their complaints are handled were Real Estate and Business Activities and Other Community, Social and Personal Service Activities with 71% and 70% of the respondents giving a positive opinion, respectively. The sectors with the most dissatisfied respondents were Health and Social Work and Construction, with over 10% of the workers stating that they disagree or strongly disagree with the statement (Figure 6.35).
Figure 6.35 - Handling of complaints - by industry sector(The Y-axis depicts percentages)
0
5
10
15
20
25
Stro
ngly
Agr
ee
Agr
ee
Nei
ther
Agr
eeno
r Dis
agre
e
Dis
agre
e
Stro
ngly
Dis
agre
e
Don
't K
now
/ NA
Construction, Mining & Quarrying
Manufacturing, Agriculture, Hunting & Forestry, Electricity, Gas & Water Supply
Wholesale & Retail Trade, Repairs
Hotels & Restaurants
Transport, Storage & Communication
Real Estate, Renting, Financial Intermediation & Business Activities
Public Administration
Education
Health & Social Work
Other Community, Social & Personal Service Activities
The analysis by company size revealed that employees in micro companies are by far the most satisfied in terms of handling health and safety complaints – only 3% disagreed or strongly disagreed with the statement and 67% either agreed or strongly agreed. In comparison, the percentages for larger companies ranged from 8-11% for negative replies and 54-62% for positive replies.

OCCUPATIONAL HEALTH AND SAFETY IN MALTA - A SNAPSHOT OF PREVAILING STANDARDS
66
6.17.4TheRiskofInjuryAnother statement that the employees were asked to assess was ‘I work in an environment where the risk of injuries is high’. Most respondents disagreed with this statement and 54% indicated that they either disagree or strongly disagree. However, nearly half of the respondents gave a different response – 16% were not sure, 6% felt the statement did not apply to them, and almost a fourth (24%) actually agreed that the environment they work in presents a high risk of injuries. The sector with by far the highest perceived risk of injuries was Construction, where a staggering 74% of the workers agreed or strongly agreed with the statement, followed by Manufacturing with 39%. On the positive side, 77% of respondents from Real Estate and Business Activities and 67% from Wholesale and Retail either disagreed or strongly disagreed. The results for Wholesale and Retail might serve as a partial explanation of the apparent lack of attention to health and safety which emerged from the previous questions – the perceived lack of risks might mean that employers are less aware of the need to perform assessments and medical checks of their employees’ health.
In terms of company size, there was no relationship between the size of the company and the perceived risk of injuries at the workplace.
Figure 6.36 presents a breakdown of the findings of this question according to industry sector.
Figure 6.36 - Risk of injuries - by industry sector(The Y-axis depicts percentages)
0
10
20
30
40
50
60
Stro
ngly
Agr
ee
Agr
ee
Nei
ther
Agr
eeno
r Dis
agre
e
Dis
agre
e
Stro
ngly
Dis
agre
e
Don
't K
now
/ NA
Construction, Mining & Quarrying
Manufacturing, Agriculture, Hunting & Forestry, Electricity, Gas & Water Supply
Wholesale & Retail Trade, Repairs
Hotels & Restaurants
Transport, Storage & Communication
Real Estate, Renting, Financial Intermediation & Business Activities
Public Administration
Education
Health & Social Work
Other Community, Social & Personal Service Activities

OCCUPATIONAL HEALTH AND SAFETY IN MALTA - A SNAPSHOT OF PREVAILING STANDARDS
67
6.17.5TheRiskofIll-HealthSimilarly, the survey presented employed respondents with the statement ‘I work in an environment where the risk of ill-health is high’. More than half of the respondents (53%) disagreed with the statement, and 6% felt it did not apply to them or were not sure of their opinion. Another 17% gave a neutral reply and the remaining 24% agreed that the risk of ill-health is high. By far the sector where the most respondents perceived the risk of ill-health as being high was Health and Social Work, where 65% of the respondent either agreed or strongly agreed (Figure 6.37). In Hotels and Restaurants and Education the proportion was also high, with one-third of the respondents agreeing with the statement.
Figure 6.37 - Risk of ill-health - by industry sector(The Y-axis depicts percentages)
0
5
10
15
20
25
30
Stro
ngly
Agr
ee
Agr
ee
Nei
ther
Agr
eeno
r Dis
agre
e
Dis
agre
e
Stro
ngly
Dis
agre
e
Don
't K
now
/ NA
Construction, Mining & Quarrying
Manufacturing, Agriculture, Hunting & Forestry, Electricity, Gas & Water Supply
Wholesale & Retail Trade, Repairs
Hotels & Restaurants
Transport, Storage & Communication
Real Estate, Renting, Financial Intermediation & Business Activities
Public Administration
Education
Health & Social Work
Other Community, Social & Personal Service Activities

OCCUPATIONAL HEALTH AND SAFETY IN MALTA - A SNAPSHOT OF PREVAILING STANDARDS
68
When analyzed by company size, the results (Figure 6.38) show that the perceived risk of ill-health at the workplace increases with company size – while only 14% of the respondents from micro companies stated that they either agree or strongly agree with the statement, the percentage rises to 38% in the largest firms.
Figure 6.38 - Risk of ill-health - by company size(The Y-axis depicts percentages)
0
5
10
15
20
25
30
35
40
Stro
ngly
Agr
ee
Agr
ee
Nei
ther
Agr
eeno
r Dis
agre
e
Dis
agre
e
Stro
ngly
Dis
agre
e
Don
't K
now
/ NA
Self-employed without employees
1-9 employees
10-49 employees
50-249 employees
250-499 employees
500 employees or more

OCCUPATIONAL HEALTH AND SAFETY IN MALTA - A SNAPSHOT OF PREVAILING STANDARDS
69
6.18 Usage of OHSA ServicesThe survey enquired on the use of services by the OHSA in the past 5 years and was asked to all 1603 respondents, including the self-employed. The vast majority of the interviewees had not used any services (89%) and only 11% stated they had used at least one of the services (Figure 6.39). The results show that the sectors where the services were most used were Construction (17% of the respondents), Hotels and Restaurants, Public Administration and Health and Social Work (16% each, respectively). In contrast, 6% of the respondents hailing from the Transport, Storage and Communication used an OHSA service over the past 5 years.
Figure 6.39 - Use of OHSA services - by industry sector(The Y-axis depicts percentages)
0
10
20
30
40
50
60
70
80
90
100
Yes
No
Construction, Mining & Quarrying
Manufacturing, Agriculture, Hunting & Forestry, Electricity, Gas & Water Supply
Wholesale & Retail Trade, Repairs
Hotels & Restaurants
Transport, Storage & Communication
Real Estate, Renting, Financial Intermediation & Business Activities
Public Administration
Education
Health & Social Work
Other Community, Social & Personal Service Activities
There were no significant differences in the use of OHSA services by employees from companies of different sizes, although the use was slightly higher among self-employed people and the largest firms with 500 employees or more.

OCCUPATIONAL HEALTH AND SAFETY IN MALTA - A SNAPSHOT OF PREVAILING STANDARDS
70
The survey question ‘Which OHSA services did you use?’ was answered by the 179 respondents who said they have used OHSA services over the past 5 years. In this question, the workers could mention all the services they have used, therefore the answers add up to more than 100%.
As Figure 6.40 shows, the most popular OHSA service was the health and safety training course, used by almost half of the respondents (48%). Provision of guidance and advice and printed material on health and safety were also popular, being used by 32% and 25% of the respondents, respectively.Seminars, conferences and similar events organized by the OHSA were most attended by respondents in the Hotels and Restaurants (32%) and Manufacturing (30%) and least popular with Wholesale and Retail Trade and Construction. The OHSA website was used by roughly one-third of respondents from Manufacturing, Real Estate and Business Activities and Public Administration and was much less popular with the other industry sectors – in fact, none of the respondents engaged in Transport, Storage and Communication used it.
Figure 6.40 - Type of services used - by industry sector(The Y-axis depicts percentages)
0
10
20
30
40
50
60
70
Prov
isio
n of
guid
ance
and
advi
ce
Use
of O
HSA
web
site
Ass
ista
nce
with
atr
ade
disp
ute
/m
edia
tion
OH
S tr
aini
ngco
urse
Prin
ted
mat
eria
lon
H &
S
Sem
inar
s,co
nfer
ence
s an
dot
her s
imila
rev
ents
org
aniz
edby
OH
SAConstruction, Mining & Quarrying
Manufacturing, Agriculture, Hunting & Forestry, Electricity, Gas & Water Supply
Wholesale & Retail Trade, Repairs
Hotels & Restaurants
Transport, Storage & Communication
Real Estate, Renting, Financial Intermediation & Business Activities
Public Administration
Education
Health & Social Work
Other Community, Social & Personal Service Activities
With regards to company size, there was no particular pattern of use for the OHSA services. Assistance with trade disputes was most used by self-employed persons and large companies with 250-499 employees while the training course was universally popular with companies from all sizes.

OCCUPATIONAL HEALTH AND SAFETY IN MALTA - A SNAPSHOT OF PREVAILING STANDARDS
71
The survey also enquired on the satisfaction of the respondents with the use of each particular service provided by the OHSA. It is noteworthy that the results were overall extremely positive, with very high levels of satisfaction for all the services.
Seventy-eight percent of the respondents stated that they are either satisfied or very satisfied with the provision of guidance and advice by the OHSA, and only 5% (3 respondents) stated that they were not satisfied at all. However, when analysing the results by industry sector, it transpires that the levels of satisfaction differ among respondents from companies in different lines of business. For instance, all respondents from Wholesale & Retail, Hotels & Restaurants, and Public Administration were satisfied with this service, while respondents from Construction and Manufacturing were much more moderate in their evaluation (Figure 6.41).
Figure 6.41 - Satisfaction with the provision of guidance and advice - by industry sector(The Y-axis depicts percentages)
0
10
20
30
40
50
60
70
80
90
Not
sat
isfie
d at
all
Not
sat
isfie
d
Nei
ther
sat
isfie
dno
r dis
satis
fied
Satis
fied
Very
sat
isfie
d
Not
app
licab
le
Construction, Mining & Quarrying
Manufacturing, Agriculture, Hunting & Forestry, Electricity, Gas & Water Supply
Wholesale & Retail Trade, Repairs
Hotels & Restaurants
Transport, Storage & Communication
Real Estate, Renting, Financial Intermediation & Business Activities
Public Administration
Education
Health & Social Work
Other Community, Social & Personal Service Activities
An analysis by company size shows that middle-sized companies with 10-249 employees had the highest rates of satisfaction while the proportion of dissatisfied respondents was highest in micro firms and large organizations with over 500 employees.
The OHSA website boasts an even higher satisfaction rate, with 83% of the respondents being satisfied or very satisfied and only 1 respondent from Other Community, Social and Personal Service Activities stating that he was very dissatisfied. The remaining 14% gave a middle-of-the road reply.
Although there were no significant differences between the replies of workers according to the industry sector and the size of the company they are engaged in, the satisfaction rates appeared slightly lower in Wholesale and Retail and Other Community Services, as well as in mid-sized and large companies.
From the 9 respondents who had used the OHSA to assist them in a trade dispute or mediation, only one self-employed person in Real Estate and Business Activities was not satisfied at all and the majority were satisfied, with 2 respondents giving a neutral reply. The service was used by workers in Construction, Wholesale and Retail, Hotels and Restaurants, Real Estate, Public Administration and Health and Social Work from organisations of various sizes.
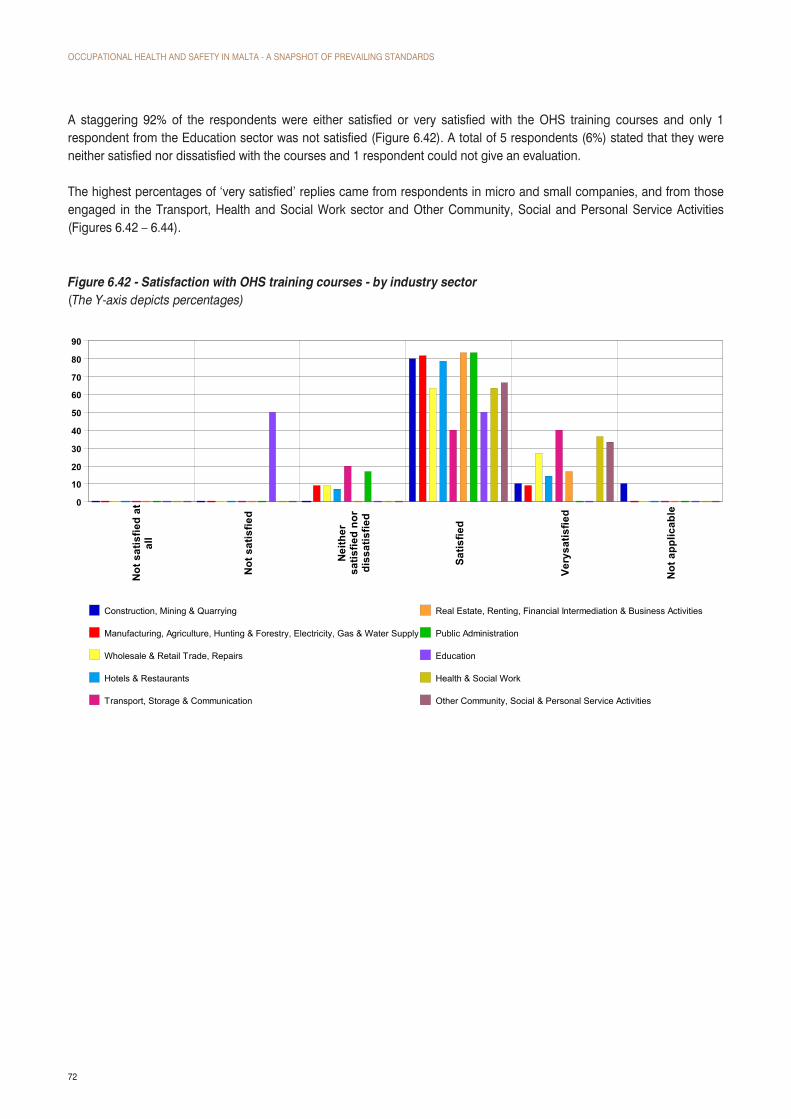
OCCUPATIONAL HEALTH AND SAFETY IN MALTA - A SNAPSHOT OF PREVAILING STANDARDS
72
A staggering 92% of the respondents were either satisfied or very satisfied with the OHS training courses and only 1 respondent from the Education sector was not satisfied (Figure 6.42). A total of 5 respondents (6%) stated that they were neither satisfied nor dissatisfied with the courses and 1 respondent could not give an evaluation.
The highest percentages of ‘very satisfied’ replies came from respondents in micro and small companies, and from those engaged in the Transport, Health and Social Work sector and Other Community, Social and Personal Service Activities (Figures 6.42 – 6.44).
Figure 6.42 - Satisfaction with OHS training courses - by industry sector(The Y-axis depicts percentages)
0
10
20
30
40
50
60
70
80
90
Not
sat
isfie
d at
all
Not
sat
isfie
d
Nei
ther
satis
fied
nor
diss
atis
fied
Satis
fied
Very
satis
fied
Not
app
licab
le
Construction, Mining & Quarrying
Manufacturing, Agriculture, Hunting & Forestry, Electricity, Gas & Water Supply
Wholesale & Retail Trade, Repairs
Hotels & Restaurants
Transport, Storage & Communication
Real Estate, Renting, Financial Intermediation & Business Activities
Public Administration
Education
Health & Social Work
Other Community, Social & Personal Service Activities

OCCUPATIONAL HEALTH AND SAFETY IN MALTA - A SNAPSHOT OF PREVAILING STANDARDS
73
Figure 6.43 - Satisfaction with OHS training courses - by company size(The Y-axis depicts percentages)
0
10
20
30
40
50
60
70
80
90
Not
sat
isfie
d at
all
Not
sat
isfie
d
Nei
ther
satis
fied
nor
diss
atis
fied
Satis
fied
Very
satis
fied
Not
app
licab
le
Self-employed without employees
1-9 employees
10-49 employees
50-249 employees
250-499 employees
500 employees or more

OCCUPATIONAL HEALTH AND SAFETY IN MALTA - A SNAPSHOT OF PREVAILING STANDARDS
74
Brochures on health and safety and other printed material distributed by the OHSA were also very positively thought of by the respondents who used it. A total of 36 respondents (80%) were satisfied or very satisfied with the materials, and only 2 stated they were not satisfied at all. The most positive responses came from Manufacturing, Wholesale and Retail, Real Estate and Business Activities and Education, where all respondents were happy with this service, while the few dissatisfied respondents hailed from Health and Social Work and Other Community Service Activities (Figure 6.44). Both dissatisfied respondents were from very large companies with 500 or more employees.
Figure 6.44 - Satisfaction with printed material on H&S - by industry sector(The Y-axis depicts percentages)
0
10
20
30
40
50
60
70
80
90
100
Not
sat
isfie
d at
all
Not
sat
isfie
d
Nei
ther
sat
isfie
dno
r dis
satis
fied
Satis
fied
Very
satis
fied
Not
app
licab
le
Construction, Mining & Quarrying
Manufacturing, Agriculture, Hunting & Forestry, Electricity, Gas & Water Supply
Wholesale & Retail Trade, Repairs
Hotels & Restaurants
Transport, Storage & Communication
Real Estate, Renting, Financial Intermediation & Business Activities
Public Administration
Education
Health & Social Work
Other Community, Social & Personal Service Activities
The last service that the respondents evaluated was the seminars, conferences and other events organized by the OHSA. Almost all respondents (91%) were satisfied or very satisfied with these events, and there was no respondent who was dissatisfied. The only sector where none of the respondents had attended a conference or seminar on health and safety was Wholesale & Retail.
With regards to company size, the events of the OHSA were equally popular with everyone from self-employed persons to employees in the largest companies.

OCCUPATIONAL HEALTH AND SAFETY IN MALTA - A SNAPSHOT OF PREVAILING STANDARDS
75
6.19 Whom to contact in Case of Complaint The survey asked all 1603 respondents whom they would contact if they had a complaint related to health and safety. The responses add up to over 100% because the workers were asked to mention all persons they would contact.
The results are presented in Figure 6.45 and Figure 6.46: by far the most frequently mentioned contact person was the owner/manager of the company, with over half of the respondents giving this reply (54%). The immediate foreman or supervisor was mentioned by 18% of the workers, and 12% stated they would turn to the Workers Health and Safety Representative. Interestingly, as many as 246 respondents (15%) said they would contact the OHSA and a further 5% stated they would look for help from a Trade Union representative.
In terms of industry sectors, respondents from Construction and Other Community, Social and Personal Service Activities were relatively more likely to contact the OHSA, while those working in Education were most likely to contact their Workers Representative. The option of contacting a Trade Union representative was significantly more popular with respondents from Health and Social Work when compared to other sectors. Workers in Real Estate (18%), Manufacturing (14%) and Transport (14%) gave the highest proportion of replies that they would contact their Health and Safety Manager.
Figure 6.45 - Contact person in case of complaint - by industry sector(The Y-axis depicts percentages)
0
10
20
30
40
50
60
70
The
man
ager
/ow
ner /
dire
ctor
OH
SA
A T
rade
Uni
onre
pres
enta
tive
The
OH
S W
orke
rsR
epre
sent
ativ
e
Your
imm
edia
tesu
perv
isor
/fo
rem
an
The
OH
S m
anag
er
Oth
er
Construction, Mining & Quarrying
Manufacturing, Agriculture, Hunting & Forestry, Electricity, Gas & Water Supply
Wholesale & Retail Trade, Repairs
Hotels & Restaurants
Transport, Storage & Communication
Real Estate, Renting, Financial Intermediation & Business Activities
Public Administration
Education
Health & Social Work
Other Community, Social & Personal Service Activities

OCCUPATIONAL HEALTH AND SAFETY IN MALTA - A SNAPSHOT OF PREVAILING STANDARDS
76
An analysis by company size reveals significant differences in the responses (Figure 6.46). For instance, the proportion of self-employed persons who would contact the ‘owner/manager’ with their health and safety complaints was several times lower than in other companies – only 8% of self-employed when compared to 69% of those employed in companies with 10-49 employees. This could be easily explained by the fact that most self-employed people are the owners/managers themselves, therefore they would need external help to solve their health and safety problems because they have no supervisors or managers to report to. In fact, over half of the self employees (53%) indicated that they would contact directly the OHSA for assistance or stated that they would tackle the issue themselves.
Not surprisingly, the proportion of respondents saying they would contact their Health and Safety Manager or Workers representative increased steadily with company size which can be related to fact that larger companies are much more likely to have these positions in place.
Figure 6.46 - Contact person in case of complaint - by company size(The Y-axis depicts percentages)
0
10
20
30
40
50
60
70
The
man
ager
/ow
ner /
dire
ctor
OH
SA
A T
rade
Uni
onre
pres
enta
tive
The
OH
SW
orke
rsR
epre
sent
ativ
e
Your
imm
edia
tesu
perv
isor
/fo
rem
an
The
OH
Sm
anag
er
Oth
er
Self-employed without employees
1-9 employees
10-49 employees
50-249 employees
250-499 employees
500 employees or more

OCCUPATIONAL HEALTH AND SAFETY IN MALTA - A SNAPSHOT OF PREVAILING STANDARDS
77
6.20OccupationalInjuriesThe survey enquired on whether the respondents had sustained an occupational injury which led to at least one day of absence from work in 2010 and was asked to all 1603 participants. As many as 94 respondents (6%) stated that they had suffered such an injury while 94% said they haven’t and 2 respondents refused to answer the question (Figure 6.47). The highest proportion of respondents giving a positive reply was in Construction (14%) and Manufacturing (13%), while the lowest rates of occupational injuries were in Real Estate, Renting and Business Activities – only 1% of respondents form this sector reported suffering an occupational injury in 2010. The difference is hardly surprising given the nature of the work – most construction and manufacturing workers tend to be more exposed to risks of injuries, while most employees in the Real Estate and Business Activities tend to be engaged in work of lesser risk of injury
Figure 6.47 - Occupational injuries in 2010 - by industry sector(The Y-axis depicts percentages)
0
10
20
30
40
50
60
70
80
90
100
Yes
No
Ref
used
Construction, Mining & Quarrying
Manufacturing, Agriculture, Hunting & Forestry, Electricity, Gas & Water Supply
Wholesale & Retail Trade, Repairs
Hotels & Restaurants
Transport, Storage & Communication
Real Estate, Renting, Financial Intermediation & Business Activities
Public Administration
Education
Health & Social Work
Other Community, Social & Personal Service Activities
Although there was no clear trend in the rate of reported injuries by company size, almost 11% respondents from companies with 250-499 employees stated they had suffered an occupational injury when compared to only 4% of those in micro businesses.

OCCUPATIONAL HEALTH AND SAFETY IN MALTA - A SNAPSHOT OF PREVAILING STANDARDS
78
The next question aimed to ‘filter’ the number of respondents who actually have a certificate that their injury was caused by work. Around a third of the 94 respondents gave a negative response (32%) but the other 64 workers answered in the affirmative. Although all responses rely on self-reporting, the proportion of responses who said that their injury was officially certified as caused by work is significant. Moreover, it is possible that some of the injuries of those not in a possession of such a certificate were actually caused by work, but for various reasons these workers did not manage to obtain the necessary certificate to prove the link.
With regards to industry sectors, respondents from Manufacturing and Transport were more likely to have a certificate (83% and 89%, respectively) while the situation in most other sectors was an equal distribution of persons with and without a document certifying that their injury was caused by work. Significantly, Real Estate, Renting and Business Activities was the only sector where none of the workers participating in the survey had a certificate.
Figure 6.48 - Certified occupational injuries in 2010 - by industry sector(The Y-axis depicts percentages)

OCCUPATIONAL HEALTH AND SAFETY IN MALTA - A SNAPSHOT OF PREVAILING STANDARDS
79
Among all respondents, the self-employed were the least likely to have a certificate proving that their injury was caused by work – almost half of them (46%) did not have such a document compared to only 21% of those working in companies with 250-499 employees.
Only those respondents whose injury was certified as caused by work were asked to specify what type of injury they suffered. All respondents could specify up to 3 different injuries they have suffered in 2010, and the data of each separate case was gathered under ‘1st mention’, ‘2nd mention’ and ‘3rd mention’.
In the first mention, the majority of the respondents (39%) stated that they suffered wounds and superficial injuries. The next most common injury was dislocations, sprains and strains, mentioned by 17 respondents (27%), followed by bone fractures and ‘other injuries’ with 13% each, respectively. One respondent had suffered a traumatic amputation and 5 had burns, scalds or frostbites in 2010 (Table 6.49). There was no difference in the proportions in the various sectors, but in absolute terms Construction and Manufacturing respondents reported the highest number of injuries (35) in the first mention. An analysis by company size shows that there were more workers with occupational injuries in companies with 50-249 employees in absolute figures – 20 of the employees were from such mid-sized companies.
Table 6.49 - Types of occupational injuries - by industry sector – 1st mention
CountsAnalysis %Respondents
Total
Total
Woundsand supe-
rficialinjuries
Bonefractures
Dislocati-ons,
sprainsand
strains
Traumaticamputati-ons (lossof bodyparts)
Concussi-on andinternalinjuries
Burns,scalds
andfrostbite
Poisonin-gs and
infections
Drowningand asph-yxiations
Otherinjuries
Construction, Mining& Quarrying
Manufacturing,Agriculture, Hunting &Forestry, Electricity,Gas & Water Supply
Wholesale & RetailTrade, Repairs
Hotels & Restaurants
Transport, Storage &Communication
Real Estate, Renting,FinancialIntermediation &Business Activities
Public Administration
Education
Health & Social Work
Other Community,Social & PersonalService Activities
64 2539.1%
812.5%
1726.6%
11.6%
--
57.8%
--
--
812.5%
10 660.0%
--
330.0%
--
--
--
--
--
110.0%
25 936.0%
14.0%
416.0%
14.0%
--
416.0%
--
--
624.0%
7 457.1%
228.6%
114.3%
--
--
--
--
--
--
3 266.7%
133.3%
--
--
--
--
--
--
--
8 112.5%
337.5%
450.0%
--
--
--
--
--
--
- --
--
--
--
--
--
--
--
--
2 150.0%
--
150.0%
--
--
--
--
--
--
2 150.0%
--
--
--
--
--
--
--
150.0%
5 120.0%
--
480.0%
--
--
--
--
--
--
2 --
150.0%
--
--
--
150.0%
--
--
--
A total of 6 respondents suffered a second injury in 2010 and they had the same types of injuries – wounds and superficial injuries (2 respondents), bone fractures (2 respondents), dislocations, sprains and strains (1 respondent) and burns, scalds and frostbite (1 respondent). Two of the respondents with multiple injuries were from the Construction sector, one form Manufacturing and the remaining two from Health and Social Work. The 6 respondents were spread among companies of different sizes.
Only 2 respondents reported suffering a third injury during 2010, and both had wounds and superficial injuries.

OCCUPATIONAL HEALTH AND SAFETY IN MALTA - A SNAPSHOT OF PREVAILING STANDARDS
80
6.21InvestigationofWork-RelatedAccidentsThe 58 respondents who were employed (rather than self-employed) and had a certificate that their injuries in 2010 were caused by work were asked: ‘Was your accident investigated by your employer?’ The majority of the respondents (71%) gave a positive reply while 22% answered in the negative and 4 respondents (7%) did not know. All respondents employed in Education, and Other Community Services stated that an investigation was carried out after they got injured, compared to only half of those working in Public Administration (Figure 6.50). The highest percentage of ‘don’t know’ replies was given by persons employed in Hotels and Restaurants.
Figure 6.50 - Investigation of accidents (n=41) - by industry sector(The Y-axis depicts percentages)
0
10
20
30
40
50
60
70
80
90
100
Yes
No
Don
't kn
ow
Construction, Mining & Quarrying
Manufacturing, Agriculture, Hunting & Forestry, Electricity, Gas & Water Supply
Wholesale & Retail Trade, Repairs
Hotels & Restaurants
Transport, Storage & Communication
Real Estate, Renting, Financial Intermediation & Business Activities
Public Administration
Education
Health & Social Work
Other Community, Social & Personal Service Activities

OCCUPATIONAL HEALTH AND SAFETY IN MALTA - A SNAPSHOT OF PREVAILING STANDARDS
81
When the data is broken down by company size, it appears that larger companies are more likely to investigate their workers’ accidents. Companies with 250-499 employees were an exception to this pattern with 55% of positive responses when compared to 75% in companies with 50-249 workers and 89% in the largest company category. It is also interesting that there were no ‘don’t know’ responses I the case of self-employed persons and micro companies, possibly due to the more effective communication in such small firms (Table 6.51).
Table 6.51 - Investigation of accidents - by company size
CountsAnalysis %Respondents
Total
Total
Yes NoDon'tknow
Self-employed withoutemployees
1-9 employees
10-49 employees
50-249 employees
250-499 employees
500 employees or more
58 4170.7%
1322.4%
46.9%
- --
--
--
8 562.5%
337.5%
--
10 770.0%
220.0%
110.0%
20 1575.0%
420.0%
15.0%
11 654.5%
436.4%
19.1%
9 888.9%
--
111.1%

OCCUPATIONAL HEALTH AND SAFETY IN MALTA - A SNAPSHOT OF PREVAILING STANDARDS
82
The 41 employees who stated that their accident was investigated by their employer were further asked whether the findings of the investigation have been communicated to them. Interestingly, 9 (22%) of the workers gave a negative reply, meaning that although they knew that the employer looked into their case, they were never made aware of the findings.
In terms of industry sectors, the findings from the accident investigation were communicated to all employees working in Hotels and Restaurants, Public Administration, Education, Health and Social Work and Other Community, Social and Personal Service Activities (Figure 6.52). The sector where the least employees were informed was Retail and Wholesale with only 60% of employees being notified of the outcome.
Figure 6.52 - Communication of the findings - by industry sector(The Y-axis depicts percentages)
0
10
20
30
40
50
60
70
80
90
100
Yes
No
Construction, Mining & Quarrying
Manufacturing, Agriculture, Hunting & Forestry, Electricity, Gas & Water Supply
Wholesale & Retail Trade, Repairs
Hotels & Restaurants
Transport, Storage & Communication
Real Estate, Renting, Financial Intermediation & Business Activities
Public Administration
Education
Health & Social Work
Other Community, Social & Personal Service Activities

OCCUPATIONAL HEALTH AND SAFETY IN MALTA - A SNAPSHOT OF PREVAILING STANDARDS
83
There was a clear pattern in the responses to this Question when analyzed by company size – the larger the company, the higher the likelihood that an employee would be made aware of the findings (Table 6.53). This seemingly counter-intuitive result could be explained with the more formal approach towards injuries and accidents in larger firms.
Table 6.53 - Communication of the findings - by company size
CountsAnalysis %Respondents
Total
Total
Yes No
Self-employed withoutemployees
1-9 employees
10-49 employees
50-249 employees
250-499 employees
500 employees or more
41 3278.0%
922.0%
- --
--
5 360.0%
240.0%
7 571.4%
228.6%
15 1280.0%
320.0%
6 583.3%
116.7%
8 787.5%
112.5%
Of the 32 respondents who were made aware of the findings from the investigation, the vast majority (93%) agreed and only 2 respondents disagreed with the results about the causes of the accident that lead to their injury. One of these two respondents was from the Manufacturing sector, and the other from a Health and Social Work organisation, and both were from companies with over 50 employees.

OCCUPATIONAL HEALTH AND SAFETY IN MALTA - A SNAPSHOT OF PREVAILING STANDARDS
84
Participants were further asked whether ‘Following the accident, was remedial action taken by the employer to avoid reoccurrence?’ Although the majority of workers who suffered an injury gave a positive reply (71%), 9 respondents (16%) said that no action was taken and a further 8 (14%) indicated that they did not know. These findings indicate that even when it is largely clear what accident caused the injury and there is agreement on the causes, a significant proportion of employers fall short of taking action to avoid reoccurrence or fail to communicate their efforts to the victims of the accident (Figure 6.54).
The highest proportions of workers who gave a negative reply was in Hotels and Restaurants (33%), followed by Manufacturing (26%), while all respondents from Education, Health and Other Community Services indicated that their employer took precautions to avoid future accidents of the same type after the investigation (Figure 6.54). With regards to company size, firms with 250-499 fared the worst in taking action following an investigation, with less than half of the respondents from such firms giving a positive reply when compared to over 65% in all other firms.
Figure 6.54 - Remedial action - by industry sector(The Y-axis depicts percentages)
0
10
20
30
40
50
60
70
80
90
100
Yes
No
Don
't kn
ow
Construction, Mining & Quarrying
Manufacturing, Agriculture, Hunting & Forestry, Electricity, Gas & Water Supply
Wholesale & Retail Trade, Repairs
Hotels & Restaurants
Transport, Storage & Communication
Real Estate, Renting, Financial Intermediation & Business Activities
Public Administration
Education
Health & Social Work
Other Community, Social & Personal Service Activities

OCCUPATIONAL HEALTH AND SAFETY IN MALTA - A SNAPSHOT OF PREVAILING STANDARDS
85
6.22OccupationalPhysicalIll-HealthThe survey repeated the same sequence of the questions about occupational injuries, but this time addressing cases of occupational physical ill-health. A total of 145 of the 1603 respondents (9%) stated that in 2010 they had suffered some form of ill-health caused by work which led to at least one day of absence from their workplace (Figure 6.55). The remaining 91% of the respondents gave a negative reply, and 6 workers (less then 1%) refused to answer the question. As much as 16% of the workers in Health and Social Work and 15% of those engaged in Construction stated that they suffered from occupational ill-health compared to only 5% of respondents working in the Hotels and Restaurants sector. The refusals were spread among the different sectors and no one area of activity stood out in this respect.
Figure 6.55 - Physical ill-health in 2010 - by industry sector(The Y-axis depicts percentages)
0
10
20
30
40
50
60
70
80
90
100
Yes
No
Ref
used
Construction, Mining & Quarrying
Manufacturing, Agriculture, Hunting & Forestry, Electricity, Gas & Water Supply
Wholesale & Retail Trade, Repairs
Hotels & Restaurants
Transport, Storage & Communication
Real Estate, Renting, Financial Intermediation & Business Activities
Public Administration
Education
Health & Social Work
Other Community, Social & Personal Service Activities
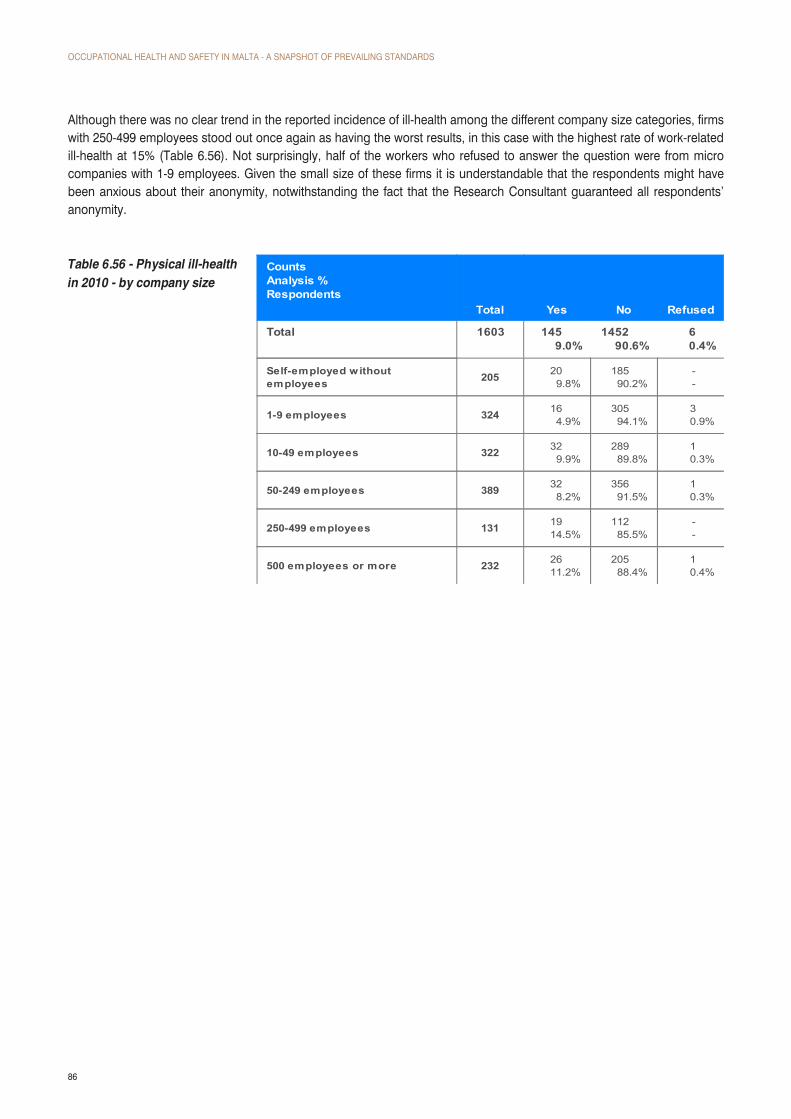
OCCUPATIONAL HEALTH AND SAFETY IN MALTA - A SNAPSHOT OF PREVAILING STANDARDS
86
Although there was no clear trend in the reported incidence of ill-health among the different company size categories, firms with 250-499 employees stood out once again as having the worst results, in this case with the highest rate of work-related ill-health at 15% (Table 6.56). Not surprisingly, half of the workers who refused to answer the question were from micro companies with 1-9 employees. Given the small size of these firms it is understandable that the respondents might have been anxious about their anonymity, notwithstanding the fact that the Research Consultant guaranteed all respondents’ anonymity.
Table 6.56 - Physical ill-health in 2010 - by company size
CountsAnalysis %Respondents
Total
Total
Yes No Refused
Self-employed withoutemployees
1-9 employees
10-49 employees
50-249 employees
250-499 employees
500 employees or more
1603 1459.0%
145290.6%
60.4%
205 209.8%
18590.2%
--
324 164.9%
30594.1%
30.9%
322 329.9%
28989.8%
10.3%
389 328.2%
35691.5%
10.3%
131 1914.5%
11285.5%
--
232 2611.2%
20588.4%
10.4%

OCCUPATIONAL HEALTH AND SAFETY IN MALTA - A SNAPSHOT OF PREVAILING STANDARDS
87
As with injuries, a ‘filtering’ question was posed to the 145 employees who stated they suffered from occupational ill-health in order to establish how many of these cases have been certified as work-related illness. In fact, less than half of the workers confirmed that a medical doctor had verified the link of their condition to their work and the remaining 55% gave a negative reply (Figure 6.57). The highest proportion of certified occupational ill-health cases was in the Education sector, where 61% stated that their condition was verified, followed by 56% in Construction and 50%.
Figure 6.57 - Verified ill-health in 2010 - by industry sector(The Y-axis depicts percentages)
0
10
20
30
40
50
60
70
80
Yes
No
Construction, Mining & Quarrying
Manufacturing, Agriculture, Hunting & Forestry, Electricity, Gas & Water Supply
Wholesale & Retail Trade, Repairs
Hotels & Restaurants
Transport, Storage & Communication
Real Estate, Renting, Financial Intermediation & Business Activities
Public Administration
Education
Health & Social Work
Other Community, Social & Personal Service Activities
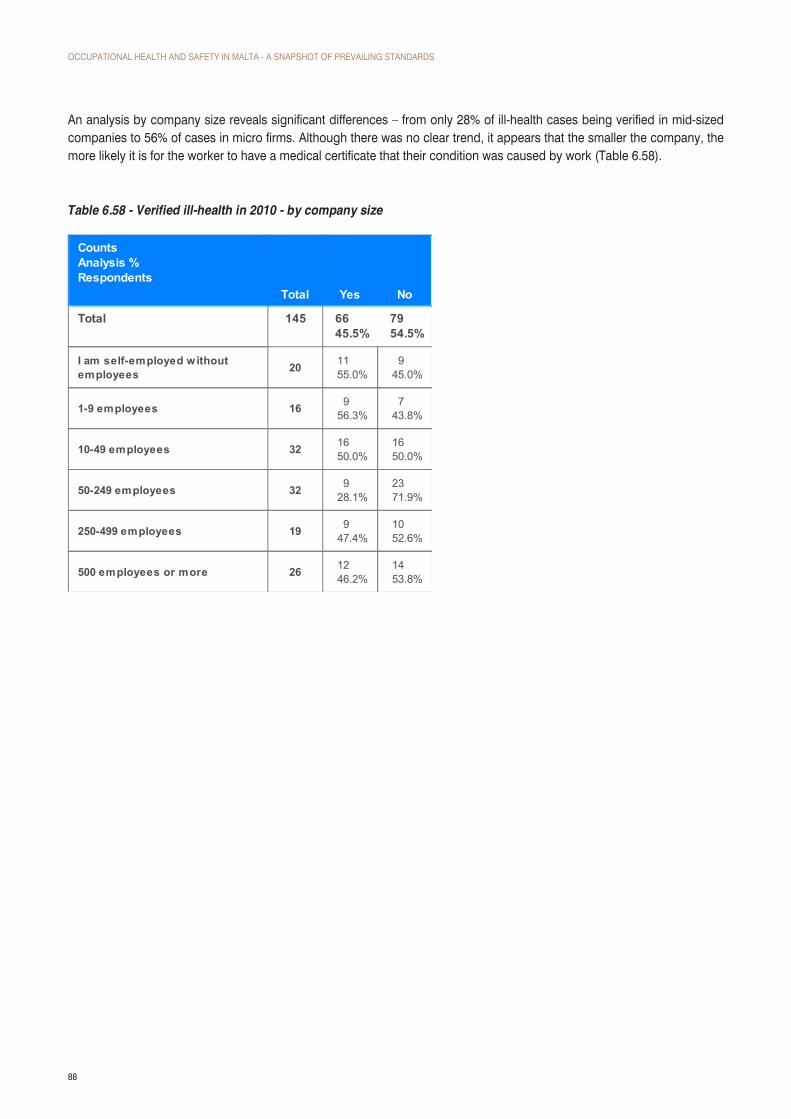
OCCUPATIONAL HEALTH AND SAFETY IN MALTA - A SNAPSHOT OF PREVAILING STANDARDS
88
An analysis by company size reveals significant differences – from only 28% of ill-health cases being verified in mid-sized companies to 56% of cases in micro firms. Although there was no clear trend, it appears that the smaller the company, the more likely it is for the worker to have a medical certificate that their condition was caused by work (Table 6.58).
Table 6.58 - Verified ill-health in 2010 - by company size
CountsAnalysis %Respondents
Total
Total
Yes No
I am self-employed withoutemployees
1-9 employees
10-49 employees
50-249 employees
250-499 employees
500 employees or more
145 6645.5%
7954.5%
20 1155.0%
945.0%
16 956.3%
743.8%
32 1650.0%
1650.0%
32 928.1%
2371.9%
19 947.4%
1052.6%
26 1246.2%
1453.8%

OCCUPATIONAL HEALTH AND SAFETY IN MALTA - A SNAPSHOT OF PREVAILING STANDARDS
89
With regards to the types of occupational physical ill-health suffered, the same approach as for injuries was adopted – each respondent was asked to specify up to 3 types of ill-health suffered in 2010 in the three mentions. The majority of respondents indicated that they had a musculoskeletal disorder (21%) or a neurological disorder (17%). Other commonly mentioned cases of ill-health included infections (mentioned by 15%), and respiratory disorders (11%).
As Table 6.59 shows, there were significant differences in the types of ill-health suffered according to the industry sector in which the respondents were engaged. For instance, the most common types of ill-health in Construction, Manufacturing and Other Community Activities were musculoskeletal disorders (22% and 43%, respectively), while neurological disorders were the major problem in Wholesale and Retail Trade and Real Estate and Business Activities. On the other hand, almost half of the sick respondents in Education (45%) suffered an infection in 2010.
Table 6.59 - Types of physical i l l-health - by industry sector – 1st mention
CountsAnalysis %Respondents
Total
Total
Effectsof sou-nd and/ or vi...
Effectsof tem-peratu-re ext... Shock
Cance-rs
Respir-atory d-isorde-
rs
Neurol-ogicaldisord-
ers
Disord-ers ofthe se-nsory...
Cardio-vascul-ar diso-rders
Skin di-sorder-
s
Muscu-loskel-etal di-sorde...
Infecti-ons
Toxicand
irritanteffects Other
Construction,Mining & Quarrying
Manufacturing, Agr-iculture, Hunting &Forestry, Electricity,Gas & Water Supply
Wholesale & RetailTrade, Repairs
Hotels &Restaurants
Transport, Storage& Communication
Real Estate, Renting,FinancialIntermediation &Business Activities
PublicAdministration
Education
Health & SocialWork
Other Community,Social & PersonalService Activities
66 34.5%
46.1%
--
11.5%
710.6%
1116.7%
34.5%
23.0%
11.5%
1421.2%
1015.2%
11.5%
913.6%
9 --
111.1%
--
--
111.1%
333.3%
111.1%
--
--
222.2%
--
111.1%
--
7 228.6%
--
--
114.3%
--
--
--
--
--
342.9%
--
--
114.3%
5 --
120.0%
--
--
--
240.0%
--
--
--
120.0%
120.0%
--
--
2 --
--
--
--
--
--
--
--
--
150.0%
--
--
150.0%
7 --
114.3%
--
--
114.3%
--
114.3%
--
114.3%
114.3%
114.3%
--
114.3%
8 112.5%
--
--
--
112.5%
225.0%
112.5%
112.5%
--
--
--
--
225.0%
4 --
--
--
--
--
125.0%
--
125.0%
--
125.0%
--
--
125.0%
11 --
--
--
--
327.3%
19.1%
--
--
--
--
545.5%
--
218.2%
7 --
114.3%
--
--
114.3%
114.3%
--
--
--
114.3%
228.6%
--
114.3%
6 --
--
--
--
--
116.7%
--
--
--
466.7%
116.7%
--
--
The analysis by company size did not reveal any additional insights, apart from the fact that almost half of the self-employed respondents who suffered from occupational ill-health reported a neurological disorder.
Almost half of those with a second incidence of occupational ill-health (7 of the 15 respondents) in fact indicated that they suffered a third illness caused by work in the same year – 2010. Three of the respondents had an infection, 2 a respiratory disorder and the remaining 2 had a neurological and musculoskeletal disorder. Three of the respondents with repeated cases of ill-health came from the Health and Social Work sector, while the others were spread among Manufacturing, Public Administration, Education and Other Community, Social and Personal Service Activities. The company size did not affect the likelihood of a person to suffer from multiple cases of occupational ill-health, as the respondents were evenly spread among the various firm size categories.
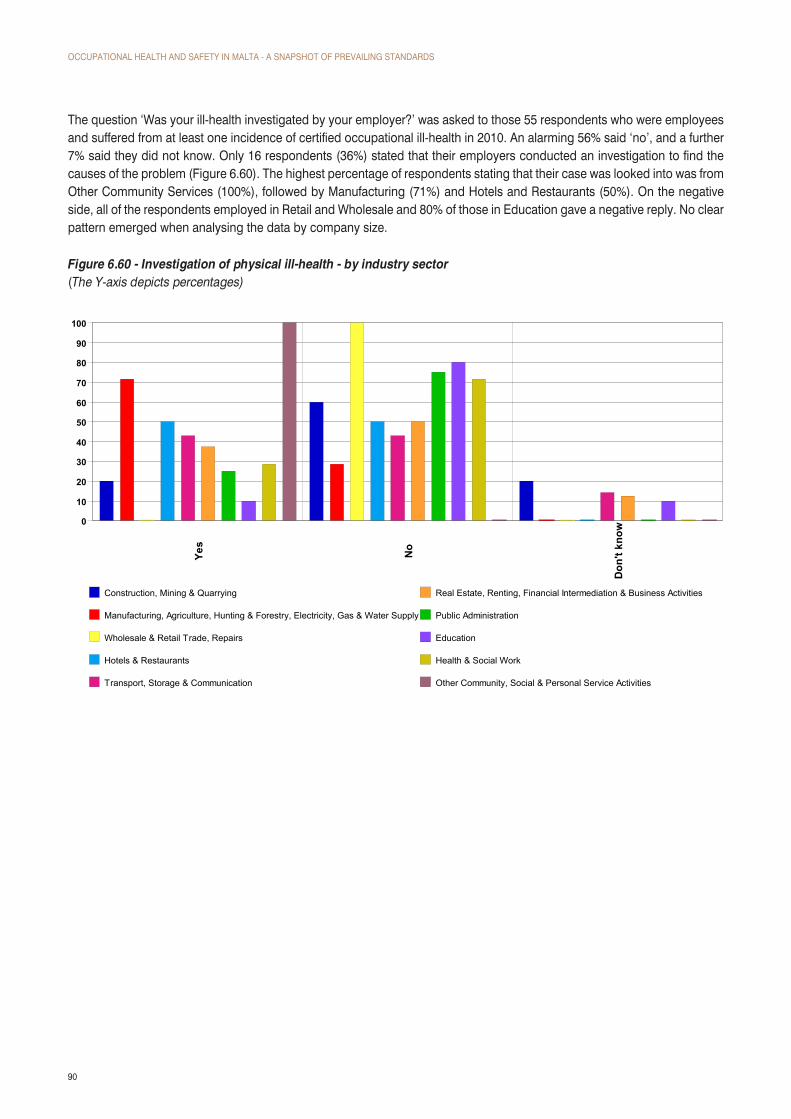
OCCUPATIONAL HEALTH AND SAFETY IN MALTA - A SNAPSHOT OF PREVAILING STANDARDS
90
The question ‘Was your ill-health investigated by your employer?’ was asked to those 55 respondents who were employees and suffered from at least one incidence of certified occupational ill-health in 2010. An alarming 56% said ‘no’, and a further 7% said they did not know. Only 16 respondents (36%) stated that their employers conducted an investigation to find the causes of the problem (Figure 6.60). The highest percentage of respondents stating that their case was looked into was from Other Community Services (100%), followed by Manufacturing (71%) and Hotels and Restaurants (50%). On the negative side, all of the respondents employed in Retail and Wholesale and 80% of those in Education gave a negative reply. No clear pattern emerged when analysing the data by company size.
Figure 6.60 - Investigation of physical ill-health - by industry sector(The Y-axis depicts percentages)
0
10
20
30
40
50
60
70
80
90
100
Yes
No
Don
't kn
ow
Construction, Mining & Quarrying
Manufacturing, Agriculture, Hunting & Forestry, Electricity, Gas & Water Supply
Wholesale & Retail Trade, Repairs
Hotels & Restaurants
Transport, Storage & Communication
Real Estate, Renting, Financial Intermediation & Business Activities
Public Administration
Education
Health & Social Work
Other Community, Social & Personal Service Activities

OCCUPATIONAL HEALTH AND SAFETY IN MALTA - A SNAPSHOT OF PREVAILING STANDARDS
91
Of the 20 employees who said their employer investigated the causes of their ill-health, the vast majority (80%) were made aware of the findings (Figure 6.61). The 4 respondents who gave a negative reply hailed from the Construction, Manufacturing, Transport and Other Community Services and from companies of different sizes.
Figure 6.62 - Communication of the findings - by industry sector(The Y-axis depicts percentages)
0
10
20
30
40
50
60
70
80
90
100Ye
s
No
Construction, Mining & Quarrying
Manufacturing, Agriculture, Hunting & Forestry, Electricity, Gas & Water Supply
Wholesale & Retail Trade, Repairs
Hotels & Restaurants
Transport, Storage & Communication
Real Estate, Renting, Financial Intermediation & Business Activities
Public Administration
Education
Health & Social Work
Other Community, Social & Personal Service Activities

OCCUPATIONAL HEALTH AND SAFETY IN MALTA - A SNAPSHOT OF PREVAILING STANDARDS
92
As with occupational injuries, far from all employers took action on the finding from their investigations into the causes of workers’ ill-health. As Figure 6.63 shows, only 60% of the employers actually took action on the results of the investigation as reported by the employees. Five percent of the respondents did not know what happened after their case was investigated and 7 (35%) said no remedial action was taken to prevent reoccurrence. Reportedly all employers took remedial action in the Hotels and Restaurants, Real Estate and Business Activities, Public Administration, Education and Health and Social Work, compared to only a third of those in Transport and other Community Activities.
With regards to company size, there was no correlation between the size of the company and remedial action to avoid future cases of physical ill-health, but the categories with the highest proportion of positive replies were large companies with 50-240 or over 500 employees.
Figure 6.63 - Remedial action - by industry sector(The Y-axis depicts percentages)
0
10
20
30
40
50
60
70
80
90
100
Yes
No
Don
't kn
ow
Construction, Mining & Quarrying
Manufacturing, Agriculture, Hunting & Forestry, Electricity, Gas & Water Supply
Wholesale & Retail Trade, Repairs
Hotels & Restaurants
Transport, Storage & Communication
Real Estate, Renting, Financial Intermediation & Business Activities
Public Administration
Education
Health & Social Work
Other Community, Social & Personal Service Activities
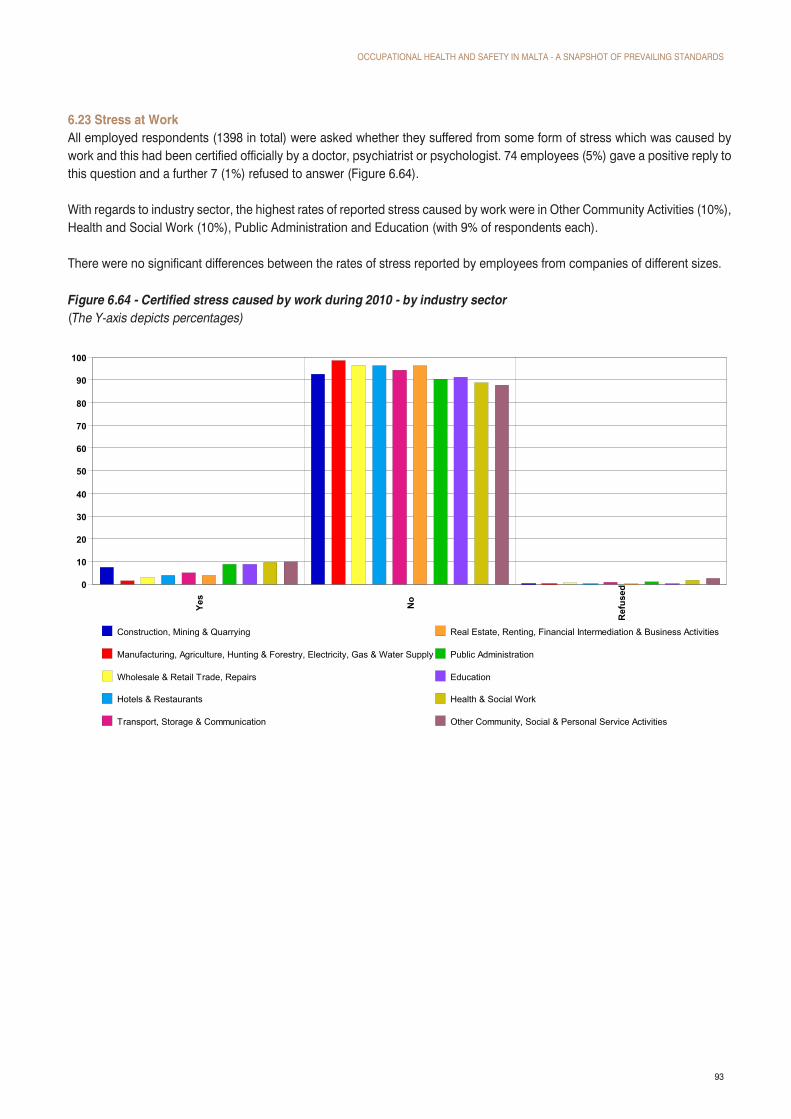
OCCUPATIONAL HEALTH AND SAFETY IN MALTA - A SNAPSHOT OF PREVAILING STANDARDS
93
6.23 Stress at WorkAll employed respondents (1398 in total) were asked whether they suffered from some form of stress which was caused by work and this had been certified officially by a doctor, psychiatrist or psychologist. 74 employees (5%) gave a positive reply to this question and a further 7 (1%) refused to answer (Figure 6.64).
With regards to industry sector, the highest rates of reported stress caused by work were in Other Community Activities (10%), Health and Social Work (10%), Public Administration and Education (with 9% of respondents each).
There were no significant differences between the rates of stress reported by employees from companies of different sizes.
Figure 6.64 - Certified stress caused by work during 2010 - by industry sector(The Y-axis depicts percentages)
0
10
20
30
40
50
60
70
80
90
100
Yes
No
Ref
used
Construction, Mining & Quarrying
Manufacturing, Agriculture, Hunting & Forestry, Electricity, Gas & Water Supply
Wholesale & Retail Trade, Repairs
Hotels & Restaurants
Transport, Storage & Communication
Real Estate, Renting, Financial Intermediation & Business Activities
Public Administration
Education
Health & Social Work
Other Community, Social & Personal Service Activities

OCCUPATIONAL HEALTH AND SAFETY IN MALTA - A SNAPSHOT OF PREVAILING STANDARDS
94
6.24ActionTakenByEmployeeAll respondents who had suffered an injury, ill-health or stress which they believed was caused by work (whether this link was certified by a specialist or not) were asked about the action they took as a result of their problem. As many as 38% of the respondents answered that they only took sick leave and a further 37% stated that they did not even report their ill-health or injury and continued working. Only 12% actually filled in the NI30 form and took injury leave, and 13% reported their problem but kept going to work.
Some noteworthy variances among the industry sectors include the situation in Wholesale and Retail, and Hotels and Restaurants where half of the respondents did not even report their injury, ill health and stress. However, the most striking case is in Public Administration, where 65% of the respondents did not report their problem (Figure 6.65).
Table 6.65 - Action taken in case of injury or ill-health - by industry sector(The Y-axis depicts percentages)
0
10
20
30
40
50
60
70
I fill
ed th
e N
I 30
form
and
took
inju
ry le
ave
I onl
y to
ok s
ick
leav
e
I util
ized
vaca
tion
leav
e
I rep
orte
d it
but
cont
inue
d go
ing
to w
ork
I did
not
repo
rt it
and
cont
inue
dw
orki
ng
Construction, Mining & Quarrying
Manufacturing, Agriculture, Hunting & Forestry, Electricity, Gas & Water Supply
Wholesale & Retail Trade, Repairs
Hotels & Restaurants
Transport, Storage & Communication
Real Estate, Renting, Financial Intermediation & Business Activities
Public Administration
Education
Health & Social Work
Other Community, Social & Personal Service Activities

OCCUPATIONAL HEALTH AND SAFETY IN MALTA - A SNAPSHOT OF PREVAILING STANDARDS
95
In terms of company size, self-employed respondents and those working in larger companies tended to be more likely to fill in the NI30 form. Self-employed workers and employees in micro businesses were also most likely to continue working without reporting their occupational injury or ill-health in any way (Table 6.66).
Table 6.66 - Action taken in case of injury or ill-health - by company size
CountsAnalysis %Respondents
Total
Total
I filled the NI30 form andtook injury
leaveI only tooksick leave
I utilizedvacation
leave
I reported itbut continuedgoing to work
I did notreport it andcontinuedworking
Self-employed withoutemployees
1-9 employees
10-49 employees
50-249 employees
250-499 employees
500 employees ormore
268 3111.6%
10338.4%
41.5%
3513.1%
9836.6%
26 415.4%
726.9%
--
311.5%
1350.0%
43 12.3%
1841.9%
12.3%
37.0%
2046.5%
53 47.5%
2445.3%
--
713.2%
1834.0%
68 1014.7%
2638.2%
11.5%
811.8%
2536.8%
32 618.8%
1237.5%
--
515.6%
928.1%
46 613.0%
1634.8%
24.3%
919.6%
1328.3%

OCCUPATIONAL HEALTH AND SAFETY IN MALTA - A SNAPSHOT OF PREVAILING STANDARDS
96
6.25NumberofWorkingDaysLostDuetoInjury/Ill-healthThe survey asked to estimate the number of working days lost for each injury or ill-health and to distinguish between days taken as sick leave and injury leave, so that the cost to the nation of such cases could be calculated from the results of the survey. The ‘Cost to the Nation’ Chapter elaborates on their significance, therefore only a summarized account of the replies to these questions is presented here.
The majority of respondents took 5-10 days off as injury leave for their first injury, and there were no significant differences among industry sectors or company sizes. The results were the same for the second injury, and 3 of the 6 workers who had a second injury took between 5 and 10 days of injury leave.
The results were the same for the second injury, and 3 of the 6 workers who had a second injury took between 5 and 10 days of injury leave. Due to the small number of respondents answering these questions, no conclusions can be drawn about differences in sector and company size distribution of the replies. With regards to the third mention, 1 of the 3 workers who suffered 3 injuries in 2010 took two weeks of injury leave, and the others availed themselves of longer periods.
In terms of sick leave taken for injuries, the majority of the respondents took only a few days off from work: 19 of the 59 respondents took 3-4 days leave, and another 14 took only 1-2 days for their first injury. None of the respondents took more than 40 days off, although 5 of the workers could not remember the exact number of days they had taken.
For their second injury, none of the respondents took more than 10 days as sick leave and the majority took 4 days off or less. It is significant that more than half of the injured workers did not remember the exact number of days they took as sick leave when they got injured for the second time in 2010.
Of the 18 respondents who got injured for the third time, 1 took 1-2 days and 3 took 3-4 days off as sick leave, while the other 14 did not remember.
Twelve respondents took injury leave at least once in 2010 due to occupational ill-health. Of these, only one respondent took more than 20 days off and no one took more than 50 days. The majority of workers were absent for 1-2 (3 respondents) or else 5-10 days (3 respondents). Importantly, all respondents remembered how much injury leave they took for their first case of occupational ill-health in 2010.
Two respondents took injury leave due to work-related ill-health for a second time in 2010: one took 5-10 days off and the other 41-50 days. One respondent even took 3 more weeks as injury leave due to a third case of occupational injury in 2010.
With regards to sick leave, 71 respondents took sick leave at least once because of occupational ill-health they suffered in 2010. The majority of workers took 3-4 days (25 persons), 5-10 days (16 persons) or 1-2 days (15 persons). Only one respondent took more than 20 days as sick leave for the first case of ill-health suffered.
Twenty-one respondents took sick leave for a second case of occupational ill-health they suffered in 2010. The majority (15 respondents) did not remember how many days off they took, but 8 of the respondents took less than 10 days and only one took 16-20 days. All of these respondents also took sick leave due to occupational ill-health a third time during 2010 with a similar distribution of the number of days taken. It is important to note that these results include even the responses of those workers who did not have a certificate that their ill-health was caused by work.
All 133 respondents who said they either took injury leave, sick leave, or both were asked how many days they spent in hospital and rehabilitation to estimate the cost to society of their stay there. The majority of respondents did not spend any time in hospital as in-patients (86%), and most stayed for 1-3 days (5 respondents) or 4-10 days (4 respondents). Only one stayed for more than 10 days and 9 workers could not remember (Table 6.67). Those who had to spend time in hospital as in-patients because of their occupational injuries or ill-health were mostly from the Manufacturing, Transport and Health and Social Work sectors (4 people from each), and the rest were from Construction, Wholesale and Retail, Education and Other Community Services. In terms of company size, the majority of respondents who stayed in hospital were from small companies with 10-49 employees.

OCCUPATIONAL HEALTH AND SAFETY IN MALTA - A SNAPSHOT OF PREVAILING STANDARDS
97
Table 6.67 - Days spent in hospital as an in-patient - by industry sector
CountsAnalysis %Respondents
Total
Total
None 1-3 days 4-10 days11-20days
21-50days
Over 50days
Don'tknow /Don't
remember
Construction, Mining& Quarrying
Manufacturing,Agriculture, Hunting &Forestry, Electricity,Gas & Water Supply
Wholesale & RetailTrade, Repairs
Hotels & Restaurants
Transport, Storage &Communication
Real Estate, Renting,FinancialIntermediation &Business Activities
Public Administration
Education
Health & Social Work
Other Community,Social & PersonalService Activities
133 11485.7%
53.8%
43.0%
10.8%
--
--
96.8%
16 1487.5%
16.3%
--
--
--
--
16.3%
29 2586.2%
13.4%
13.4%
--
--
--
26.9%
12 1083.3%
18.3%
--
--
--
--
18.3%
4 375.0%
--
--
--
--
--
125.0%
13 969.2%
215.4%
17.7%
17.7%
--
--
--
11 11100.0%
--
--
--
--
--
--
6 6100.0%
--
--
--
--
--
--
17 1694.1%
--
--
--
--
--
15.9%
15 1173.3%
--
16.7%
--
--
--
320.0%
10 990.0%
--
110.0%
--
--
--
--
A total of 22 respondents went to hospital as out-patients due to occupational injuries and ill-health suffered in 2010. Of these, 12 spend 1-3 days, and 7 respondents did not remember. Only one respondent from the Manufacturing sector stated he spent more than 50 days as an out-patient (Table 6.68). The remaining respondents were evenly spread among the various sectors and company sizes, and there were 3 sectors from which no respondents went to hospital as out-patients in 2010: Hotels & Restaurants, Real Estate and Business Activities, and Public Administration. Moreover, no respondents from micro companies had to go to hospital as out-patients.

OCCUPATIONAL HEALTH AND SAFETY IN MALTA - A SNAPSHOT OF PREVAILING STANDARDS
98
Table 6.68 - Days spent in hospital as an out-patient - by industry sector
CountsAnalysis %Respondents
Total
Total
None 1-3 days 4-10 days11-20days
21-50days
Over 50days
Don'tknow /Don't
remember
Construction, Mining& Quarrying
Manufacturing,Agriculture, Hunting& Forestry, Electricity,Gas & Water Supply
Wholesale & RetailTrade, Repairs
Hotels & Restaurants
Transport, Storage &Communication
Real Estate, Renting,FinancialIntermediation &Business Activities
Public Administration
Education
Health & Social Work
Other Community,Social & PersonalService Activities
133 11183.5%
129.0%
21.5%
--
--
10.8%
75.3%
16 1381.3%
212.5%
16.3%
--
--
--
--
29 2689.7%
--
--
--
--
13.4%
26.9%
12 866.7%
325.0%
--
--
--
--
18.3%
4 4100.0%
--
--
--
--
--
--
13 969.2%
323.1%
17.7%
--
--
--
--
11 11100.0%
--
--
--
--
--
--
6 6100.0%
--
--
--
--
--
--
17 1482.4%
211.8%
--
--
--
--
15.9%
15 1173.3%
16.7%
--
--
--
--
320.0%
10 990.0%
110.0%
--
--
--
--
--

OCCUPATIONAL HEALTH AND SAFETY IN MALTA - A SNAPSHOT OF PREVAILING STANDARDS
99
With regards to rehabilitation, 11 respondents had to undergo therapy and none of them spent less than 4 days in rehab. In fact, 5 of the respondents did not remember the exact number of days and the others spent from 4 to over 50 days (Table 6.69). The 11 respondents were from various sectors and companies with different sizes.
Table 6.69 - Days spent in rehabilitation - by industry sector
CountsAnalysis %Respondents
Total
Total
None 1-3 days 4-10 days11-20days
21-50days
Over 50days
Don'tknow /Don't
remember
Construction, Mining& Quarrying
Manufacturing,Agriculture, Hunting &Forestry, Electricity,Gas & Water Supply
Wholesale & RetailTrade, Repairs
Hotels & Restaurants
Transport, Storage &Communication
Real Estate, Renting,FinancialIntermediation &Business Activities
Public Administration
Education
Health & Social Work
Other Community,Social & PersonalService Activities
133 12291.7%
--
32.3%
10.8%
10.8%
10.8%
53.8%
16 1487.5%
--
16.3%
--
--
16.3%
--
29 2793.1%
--
--
--
--
--
26.9%
12 1191.7%
--
--
--
--
--
18.3%
4 375.0%
--
--
125.0%
--
--
--
13 1292.3%
--
--
--
17.7%
--
--
11 1090.9%
--
19.1%
--
--
--
--
6 6100.0%
--
--
--
--
--
--
17 1694.1%
--
15.9%
--
--
--
--
15 1386.7%
--
--
--
--
--
213.3%
10 10100.0%
--
--
--
--
--
--

OCCUPATIONAL HEALTH AND SAFETY IN MALTA - A SNAPSHOT OF PREVAILING STANDARDS
100
The survey respondents who made use of a hospital-based service (as in-patient, out-patient, in rehabilitation or in any combination of these options) were asked to specify what interventions were performed on them. Six of the 33 workers said that no interventions were performed, while the others mentioned X-ray (40%), blood tests (36%), physiotherapy (33%), MRI (24%) and other interventions such as CT scans and operations (Table 6.70). The percentages add up to more than 100% because some respondents had various treatments performed due to their occupational injuries and ill-health. The majority of respondents from the Construction sector (75%) had X-rays and physiotherapy, while none of the respondents from Real Estate and Business Activities underwent any interventions.
Table 6.70 - Interventions performed while receiving medical help - by industry sector
CountsAnalysis %Respondents
Total
Total
X ray Blood test CT scan MRIMinor
operationMajor
operationPhysiothe-
rapy NoneOther inte-rventions
Construction,Mining & Quarrying
Manufacturing, Agr-iculture, Hunting &Forestry, Electricity,Gas & Water Supply
Wholesale & RetailTrade, Repairs
Hotels &Restaurants
Transport, Storage& Communication
Real Estate,Renting, FinancialIntermediation &Business Activities
PublicAdministration
Education
Health & SocialWork
Other Community,Social & PersonalService Activities
33 1339.4%
1236.4%
26.1%
824.2%
39.1%
13.0%
1133.3%
618.2%
39.1%
4 375.0%
250.0%
--
125.0%
125.0%
--
375.0%
--
--
5 120.0%
240.0%
--
120.0%
--
120.0%
480.0%
--
--
4 375.0%
--
--
125.0%
125.0%
--
--
--
--
2 150.0%
150.0%
--
150.0%
--
--
2100.0%
--
150.0%
6 466.7%
350.0%
233.3%
233.3%
--
--
233.3%
--
116.7%
1 --
--
--
--
--
--
--
1100.0%
--
- --
--
--
--
--
--
--
--
--
5 --
120.0%
--
120.0%
--
--
--
480.0%
--
4 --
250.0%
--
125.0%
--
--
--
125.0%
--
2 150.0%
150.0%
--
--
150.0%
--
--
--
150.0%
Interestingly, the majority of respondents who had to undergo medical interventions were from small and mid-sized companies – in fact, 58% of the respondents were from such companies.

OCCUPATIONAL HEALTH AND SAFETY IN MALTA - A SNAPSHOT OF PREVAILING STANDARDS
101
Finally, the survey aimed at establishing how many of the respondents lost financial income due to the occupational injuries, ill-health and stress they suffered in 2010. All the respondents who filled the NI30 form or took sick leave were asked whether they lost income from wages, part-time jobs, overtime, bonuses and similar sources. Although the majority of the workers gave a negative reply (71%), 26% answered in the affirmative (Figure 6.71). The highest percentage of workers who lost income in this way was in the Construction industry where 44% of respondents said they lost money, followed by Public Administration (33%) and Manufacturing (28%).
Figure 6.71 - Lost income during injury/sick leave in 2010 - by industry sector(The Y-axis depicts percentages)
0
10
20
30
40
50
60
70
80
90
Yes
No
Don
't kn
ow /
Don
't re
mem
ber
Construction, Mining & Quarrying
Manufacturing, Agriculture, Hunting & Forestry, Electricity, Gas & Water Supply
Wholesale & Retail Trade, Repairs
Hotels & Restaurants
Transport, Storage & Communication
Real Estate, Renting, Financial Intermediation & Business Activities
Public Administration
Education
Health & Social Work
Other Community, Social & Personal Service Activities

OCCUPATIONAL HEALTH AND SAFETY IN MALTA - A SNAPSHOT OF PREVAILING STANDARDS
102
None of the respondents from micro companies said they lost income due to occupational injuries and ill-health, and only 14% of those in mid-sized companies gave a positive reply. Not surprisingly, the workers who suffered most financially due to the days lost away from work were the self employed – in fact, almost half of them stated they lost money while sick or injured (Table 6.72).
Table 6.72 - Lost income during injury/sick leave in 2010 - by company size
CountsAnalysis %Respondents
Total
Total
Yes No
Don'tknow /Don't
remember
Self-employed withoutemployees
1-9 employees
10-49 employees
50-249 employees
250-499 employees
500 employees or more
133 3425.6%
9571.4%
43.0%
11 545.5%
654.5%
--
19 --
19100.0%
--
28 1035.7%
1760.7%
13.6%
35 514.3%
2880.0%
25.7%
18 633.3%
1161.1%
15.6%
22 836.4%
1463.6%
--

OCCUPATIONAL HEALTH AND SAFETY IN MALTA - A SNAPSHOT OF PREVAILING STANDARDS
103
The 34 respondents who said they lost some income due to occupational injuries and ill-health were asked to specify the amount. Over half of the respondents (53%) stated they lost less than €200, however 2 respondents from the Construction sector estimated that they lost between €3000 and €5000 in 2010 (Table 6.73). With regards to company size, self-employed persons reported losing relatively larger sums during their periods of absence. More details on the implication of these findings for workers in Malta as a whole and the cost of the current levels of health and safety to the nation are presented in Chapter 8 below.
Table 6.73 - Amount of lost income - by industry sector
Table 6.73 - Amount of lost income - by industry sector
CountsAnalysis %Respondents
Total
Total
0 - 100Euro
101 - 200Euro
201 - 500Euro
501 - 1000Euro
1001 -3000 Euro
3001 -5000 Euro
5001+Euro
Don'tknow /Don't
remember
Construction,Mining & Quarrying
Manufacturing, Agr-iculture, Hunting &Forestry, Electricity,Gas & Water Supply
Wholesale & RetailTrade, Repairs
Hotels &Restaurants
Transport, Storage& Communication
Real Estate,Renting, FinancialIntermediation &Business Activities
PublicAdministration
Education
Health & SocialWork
Other Community,Social & PersonalService Activities
34 926.5%
926.5%
514.7%
411.8%
514.7%
25.9%
--
--
7 457.1%
--
114.3%
--
--
228.6%
--
--
8 225.0%
225.0%
112.5%
112.5%
225.0%
--
--
--
3 --
133.3%
--
133.3%
133.3%
--
--
--
1 --
--
--
1100.0%
--
--
--
--
3 266.7%
--
--
--
133.3%
--
--
--
2 --
150.0%
150.0%
--
--
--
--
--
2 --
150.0%
--
--
150.0%
--
--
--
2 --
150.0%
150.0%
--
--
--
--
--
4 125.0%
250.0%
--
125.0%
--
--
--
--
2 --
150.0%
150.0%
--
--
--
--
--

OCCUPATIONAL HEALTH AND SAFETY IN MALTA - A SNAPSHOT OF PREVAILING STANDARDS
104
A total of 1,200 employers
were interviewed with the aim of better
understanding the level of occupational
health and safety practices
present within these companies

7.1 Introduction
This chapter presents the findings gathered from the survey conducted among employers. A total of 1,200 employers were interviewed with the aim of better understanding the level of occupational health and safety practices present within these companies. The questionnaire was divided into five sections: Health and Safety at Work; Risk Assessments; OHSA; Injuries and Ill-Health at Work; Company Profile. The following subsections present the detailed findings from each part of the survey.
Some of the results are presented in table format whilst others are presented as charts. In the case of the latter, a corresponding table can also be found in the appendix.
7.2 Respondent Profile The companies hailed from different sectors and varied in size, in order to reflect the local business demographics. The employers also hailed from companies within both the private and public sector and were located in both Malta and Gozo.
Table 7.1 Company Size
7 THE ‘EMPLOYER’ SURVEY – A QUANTITATIVE PERSPECTIVE
CountsBase %Respondents
Total
1 - 9 employees
10 - 49 employees
50 - 249 employees
250 - 499 employees
500 employees or more
1200100.0%
91576.3%
18315.3%
746.2%
171.4%
110.9%
Table 7.2. Industry Sector
CountsBase %Respondents
Total
Manufacturing; Agriculture,hunting & forestry; Electricity,gas & water supply
Construction, Mining andquarrying
Wholesale & Retail trade, repairs
Hotels & Restaurants
Transport, Storage andCommunications
Financial intermediation, RealEstate & Renting and Businessactivities
Public administration;compulsory social security
Education
Health and social work
Other community, social andpersonal service activities
1200100.0%
17314.4%
494.1%
41634.7%
13211.0%
1159.6%
1018.4%
80.7%
655.4%
231.9%
1189.8%

OCCUPATIONAL HEALTH AND SAFETY IN MALTA - A SNAPSHOT OF PREVAILING STANDARDS
106
7.3 Health & Safety Practices at Work 7.3.1 Designation of a Person on OHS IssuesEmployers were asked whether they designated a competent person to deal with OHS issues. The majority of employers (61.5%) said no such person was designated, whilst another 23.3% of employers said that OHS falls under the responsibility of another employee.
One must note that results registered in the employee survey show that a total of 48.3% of employees either said that the company does not engage such a person, or weren’t sure whether the company does. This lower result when compared to the 61.5% registered in the employer’s survey could possibly be due to a wrong interpretation by employees of what constitutes a designated competent person on health & safety. The findings from the employer’s survey on the other hand are more reliable due to the direct knowledge on the matter from the employers interviewed.
Figure 7.3 Designation of Person on OHS Issues - by Industry Sector(The Y-axis depicts percentages)
0
10
20
30
40
50
60
70
80
Yes,
full
time
on O
HS
Yes,
OH
S fa
llsun
der o
ne o
fth
ere
spon
sibi
lity
of a
par
ticul
arem
ploy
ee
Yes,
reta
iner
basi
s (e
xter
nal
cons
ulta
nt)
No
Don
't kn
ow
Manufacturing; Agriculture, hunting & forestry; Electricity, gas & water supply
Construction, Mining and quarrying
Wholesale & Retail trade, repairs
Hotels & Restaurants
Transport, Storage and Communications
Financial intermediation, Real Estate & Renting and Business activities
Public administration; compulsory social security
Education
Health and social work
Other community, social and personal service activities
The lack of a person designated to handle OHS issues is mostly prominent in the ‘Wholesale, retail trade, and repairs’ sector registering 75.5% who said ‘No’. On the other hand, employers within the ‘Public administration’ and ‘Hotels & restaurants’ sectors registered the highest percentage which do actually engage a competent person on OHS issues.
When assessing this information in terms of company size, one can note that the designation of a person on matters dealing with OHS is more likely to occur among larger companies. Results in Figure 7.4 indicates that as the company size increases, the presence of a designated person either as a full-timer, part-timer or retainer basis, increases accordingly.

OCCUPATIONAL HEALTH AND SAFETY IN MALTA - A SNAPSHOT OF PREVAILING STANDARDS
107
Figure 7.4 Designation of person on OHS Issues - by Company Size(The Y-axis depicts percentages)
0
10
20
30
40
50
60
70
80
Yes,
full
time
onO
HS
Yes,
OH
S fa
llsun
der o
ne o
f the
resp
onsi
bilit
y of
apa
rtic
ular
empl
oyee
Yes,
reta
iner
basi
s (e
xter
nal
cons
ulta
nt)
No
Don
't kn
ow
1 - 9 employees
10 - 49 employees
50 - 249 employees
250 - 499 employees
500 employees or more
7.3.2 Health and Safety PolicyThe results in Figure 7.5 indicate that 41.1% of all employers interviewed stated they did have a health and safety policy in place. This however tends to vary considerably by industry, with results showing that the ‘Hotels & restaurants’ sector are the most likely to have a health and safety policy, registering 64.4% of companies within this sector which stated so. The ‘Construction, mining & quarrying’ sector follows with 59.2%, whilst on the other hand, results also indicate that the ‘Wholesale, retail trade, and repairs’ registered the lowest result – with only 27.9% stating that they do have a health & safety policy in place.
When assessing these results one must bear in mind that the health & safety policy was likely to be interpreted in its widest sense, therefore including policies with little or no declaration of commitment as well as rigorous policies with a strong commitment. This is substantiated further at a later stage when assessing companies who said they have a health and safety policy in terms of the performance of a number of tasks and processes relating to adequate health and safety practices.
One must also note that results reported in the Employee findings show an even higher percentage of companies who have a health & safety policy in place. Nevertheless this could be over represented due to the fact that once again, it might have been interpreted its widest possible sense, therefore being highly subjective to the employee’s interpretation.

OCCUPATIONAL HEALTH AND SAFETY IN MALTA - A SNAPSHOT OF PREVAILING STANDARDS
108
0
10
20
30
40
50
60
70
80
90
100
Yes
No
Don'
t kno
w
1 - 9 employees
10 - 49 employees
50 - 249 employees
250 - 499 employees
500 employees or more
Figure 7.5 Health and Safety Policy - by Industry Sector(The Y-axis depicts percentages)
0
10
20
30
40
50
60
70Ye
s
No
Don
'tkn
ow
Manufacturing; Agriculture, hunting & forestry; Electricity, gas & water supply
Construction, Mining and quarrying
Wholesale & Retail trade, repairs
Hotels & Restaurants
Transport, Storage and Communications
Financial intermediation, Real Estate & Renting and Business activities
Public administration; compulsory social security
Education
Health and social work
Other community, social and personal service activities
The research shows that larger companies are more likely to implement a health and safety policy. As Figure 7.6 indicates, 90.9% of larger companies do have such a policy, in contrast to only 32.6% of micro companies who said they have a health and safety policy.
Figure 7.6 Health and Safety Policy - by Company Size(The Y-axis depicts percentages)

OCCUPATIONAL HEALTH AND SAFETY IN MALTA - A SNAPSHOT OF PREVAILING STANDARDS
109
7.3.3 Provision of OHS TrainingResults indicate that a vast percentage of companies never provide training dealing with OHS – 46.8%. On the other hand, when taking a closer look at those employers who provide training on OHS, one can note that this is generally provided upon recruitment – 40.6%, followed by 22.4% who provide such training when new practices are introduced. Further analysis also reveals that a total of 81 employers (6.8%) provided training in all circumstances as required by law.
Figure 7.7 Provision of OHS Training(The Y-axis depicts percentages)
0
5
10
15
20
25
30
35
40
45
50
Never
On recruitment
Whenever there is a transfer, or change of job or tasks
When there is a change in work equipment, or new equipment is introduced
When new technology is introduced
When new work practices are introduced

OCCUPATIONAL HEALTH AND SAFETY IN MALTA - A SNAPSHOT OF PREVAILING STANDARDS
110
Table 7.7 Provision of OHS Training - by Industry Sector
CountsAnalysis %Respondents
Total
Total
NeverOn
recruitment
Wheneverthere is a
transfer, orchange of job
or tasks
When there isa change in
work equipm-ent, or new e-quipment is i-
ntroduced
When newtechnology is
introduced
When newwork
practices areintroduced
Manufacturing; Agriculture,hunting & forestry; Electricity,gas & water supply
Construction, Mining andquarrying
Wholesale & Retail trade,repairs
Hotels & Restaurants
Transport, Storage andCommunications
Financial intermediation, RealEstate & Renting andBusiness activities
Public administration;compulsory social security
Education
Health and social work
Other community, social andpersonal service activities
1200 56246.8%
48740.6%
15512.9%
22418.7%
18415.3%
26922.4%
173 7945.7%
7040.5%
2715.6%
4123.7%
3117.9%
4727.2%
49 1632.7%
2449.0%
714.3%
1428.6%
1020.4%
1530.6%
416 24258.2%
14033.7%
358.4%
5513.2%
4911.8%
6615.9%
132 2821.2%
8967.4%
3123.5%
3828.8%
2720.5%
4937.1%
115 6455.7%
4034.8%
1210.4%
1613.9%
1311.3%
1815.7%
101 5251.5%
3332.7%
1110.9%
1615.8%
1615.8%
2221.8%
8 225.0%
450.0%
112.5%
337.5%
225.0%
337.5%
65 2944.6%
2436.9%
710.8%
1116.9%
1116.9%
1320.0%
23 1043.5%
1043.5%
28.7%
28.7%
521.7%
626.1%
118 4033.9%
5344.9%
2218.6%
2823.7%
2016.9%
3025.4%
When analyzing the various sectors, results show that employers within the ‘Hotels & Restaurants’ sector and ‘public administration’ sector, are most likely to provide OHS training. On the other hand one can note that in a number of sectors the majority of employers never provide training, particularly in the ‘Wholesale, retail trade, and repairs’ sector where up to 58.2% of the companies said they never provide training, followed by the ‘Transport, storage, and communications’ sector with 55.7%.
Similar to other results, company size seems to have a direct influence on the matter. Figure 7.8 indicates that training is least provided among the micro companies - 55.3% stating that they never provide such training. On the other hand one can note that the large companies provide training in various circumstances, besides at recruitment stage.

OCCUPATIONAL HEALTH AND SAFETY IN MALTA - A SNAPSHOT OF PREVAILING STANDARDS
111
Figure 7.8 Provision of OHS Training - by Company Size(The Y-axis depicts percentages)
0
20
40
60
80
100
Nev
er
On
recr
uitm
ent
Whe
neve
r the
re is
atr
ansf
er, o
r cha
nge
ofjo
b or
task
s
Whe
n th
ere
is a
chan
ge in
wor
keq
uipm
ent,
or n
eweq
uipm
ent i
sin
trod
uced
Whe
n ne
wte
chno
logy
isin
trod
uced
Whe
n ne
w w
ork
prac
tices
are
intr
oduc
ed
1 - 9 employees
10 - 49 employees
50 - 249 employees
250 - 499 employees
500 employees or more

OCCUPATIONAL HEALTH AND SAFETY IN MALTA - A SNAPSHOT OF PREVAILING STANDARDS
112
7.3.4 Appointment of Workers’ Health & Safety RepresentativesAs results in Figure 7.9 indicate, the appointment of a workers’ health and safety representative is still quite low in Malta, and from this study only 15.8% of employers said that such a representative was appointed. One must also note that in the findings from the employee survey a higher percentage was registered, possibly due to the wrong interpretation of a health and safety representative by certain employees.
The ‘public administration’ sector shows a remarkable contrast to other sectors in this regard, with 75% who said that the workers’ health and safety representative was appointed.
Results also indicate, that a workers’ health and safety representative is more likely to be present in larger companies - with a total of 82.4% of employers with up to 499 employees confirming the appointment of a representative.
Figure 7.9 Appointment of a Workers’ Health & Safety Representative - by Industry Sector(The Y-axis depicts percentages)
0
10
20
30
40
50
60
70
80
90
100
Yes
No
Don
'tkn
ow
Manufacturing; Agriculture, hunting & forestry; Electricity, gas & water supply
Construction, Mining and quarrying
Wholesale & Retail trade, repairs
Hotels & Restaurants
Transport, Storage and Communications
Financial intermediation, Real Estate & Renting and Business activities
Public administration; compulsory social security
Education
Health and social work
Other community, social and personal service activities

OCCUPATIONAL HEALTH AND SAFETY IN MALTA - A SNAPSHOT OF PREVAILING STANDARDS
113
Figure 7.10 Appointment of a Workers’ Health & Safety Representative - by Company Size(The Y-axis depicts percentages)
0
10
20
30
40
50
60
70
80
90
100
Yes
No
Don
't kn
ow
1 - 9 employees
10 - 49 employees
50 - 249 employees
250 - 499 employees
500 employees or more
The majority of the workers’ health and safety representatives were actually appointed directly by the employer, contrary to legal requirements. Only 25.4% of these representatives were actually elected by workers, whilst 6.9% were appointed by management after workers failed to appoint a representative themselves.
Results in figure 7.12 indicate that companies with 250 employees and over are more likely to allow workers to elect the representative. Among companies with over 500 employees one can note that official procedure is most likely applied, whereby 60% of the representatives were elected by workers.

OCCUPATIONAL HEALTH AND SAFETY IN MALTA - A SNAPSHOT OF PREVAILING STANDARDS
114
Figure 7.11 Method of Appointment - by Industry Sector(The Y-axis depicts percentages)
0
20
40
60
80
100
App
oint
ed b
ym
anag
emen
tw
ithou
tco
nsul
tatio
n
App
oint
ed b
ym
anag
emen
tbe
caus
ew
orke
rs fa
iled
to a
ppoi
nt
Elec
ted
byth
e w
orke
rs
Don
't kn
ow
Manufacturing; Agriculture, hunting & forestry; Electricity, gas & water supply
Construction, Mining and quarrying
Wholesale & Retail trade, repairs
Hotels & Restaurants
Transport, Storage and Communications
Financial intermediation, Real Estate & Renting and Business activities
Public administration; compulsory social security
Education
Health and social work
Other community, social and personal service activities
Figure 7.12 Method of Appointment - by Company Size(The Y-axis depicts percentages)
0
10
20
30
40
50
60
70
80
App
oint
ed b
ym
anag
emen
tw
ithou
tco
nsul
tatio
n
App
oint
ed b
ym
anag
emen
tbe
caus
ew
orke
rs fa
iled
to a
ppoi
nt
Elec
ted
by th
ew
orke
rs
Don
't kn
ow
1 - 9 employees
10 - 49 employees
50 - 249 employees
250 - 499 employees
500 employees or more

OCCUPATIONAL HEALTH AND SAFETY IN MALTA - A SNAPSHOT OF PREVAILING STANDARDS
115
7.3.5 Involvement of Workers’ Health & Safety RepresentativeAmong those companies who appointed a workers health and safety representative, the research shows that in 4.8% of these cases, the workers representative is not involved in any decisions related to health and safety matters.
When employers were asked which are the areas where the workers’ representative is involved in, results indicate that main involvement is in risk assessments (79.9%), followed by training related to OHS (58.2%).
When looking at the results by industry sectors, one can note that the involvement of a worker’s representative in risk assessments is common throughout all industries, particularly in the ‘Health & social work’ sector. The analysis provided in Figure 7.14 also shows that the involvement is likely to be higher among larger companies.
Figure 7.13 Involvement of Workers’ Health & Safety Representative - by Industry Sector(The Y-axis depicts percentages)
0
20
40
60
80
100
Ris
kA
sses
smen
ts
Trai
ning
rela
ted
toO
HS
Des
igna
ting
wor
kers
for
spec
ific
func
tions
eg fi
rst a
id,
fire-
fighi
tng,
evac
uatio
npr
oced
ures
Not
invo
lved
inan
yde
cisi
ons
Don
't kn
owManufacturing; Agriculture, hunting & forestry; Electricity, gas & water supply
Construction, Mining and quarrying
Wholesale & Retail trade, repairs
Hotels & Restaurants
Transport, Storage and Communications
Financial intermediation, Real Estate & Renting and Business activities
Public administration; compulsory social security
Education
Health and social work
Other community, social and personal service activities
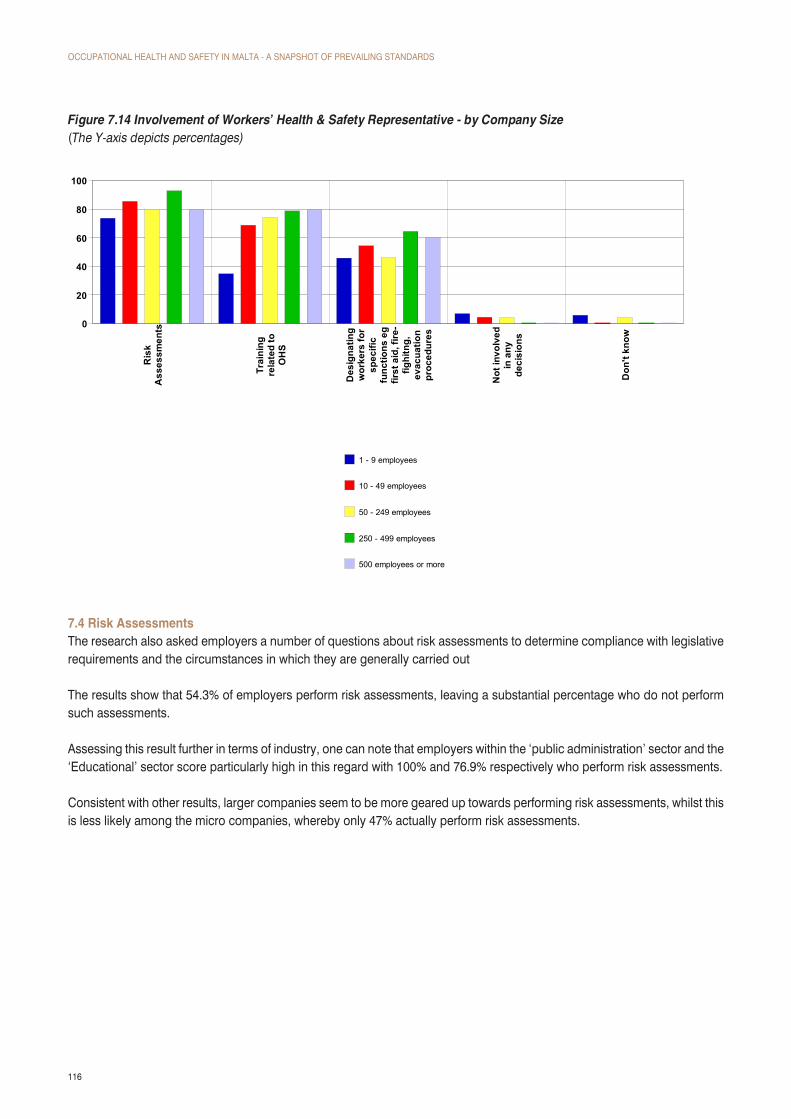
OCCUPATIONAL HEALTH AND SAFETY IN MALTA - A SNAPSHOT OF PREVAILING STANDARDS
116
Figure 7.14 Involvement of Workers’ Health & Safety Representative - by Company Size(The Y-axis depicts percentages)
0
20
40
60
80
100
Ris
kA
sses
smen
ts
Trai
ning
rela
ted
toO
HS
Des
igna
ting
wor
kers
for
spec
ific
func
tions
eg
first
aid
, fire
-fig
hitn
g,ev
acua
tion
proc
edur
es
Not
invo
lved
in a
nyde
cisi
ons
Don
't kn
ow
1 - 9 employees
10 - 49 employees
50 - 249 employees
250 - 499 employees
500 employees or more
7.4 Risk AssessmentsThe research also asked employers a number of questions about risk assessments to determine compliance with legislative requirements and the circumstances in which they are generally carried out
The results show that 54.3% of employers perform risk assessments, leaving a substantial percentage who do not perform such assessments.
Assessing this result further in terms of industry, one can note that employers within the ‘public administration’ sector and the ‘Educational’ sector score particularly high in this regard with 100% and 76.9% respectively who perform risk assessments.
Consistent with other results, larger companies seem to be more geared up towards performing risk assessments, whilst this is less likely among the micro companies, whereby only 47% actually perform risk assessments.

OCCUPATIONAL HEALTH AND SAFETY IN MALTA - A SNAPSHOT OF PREVAILING STANDARDS
117
Figure 7.15 Performance of Risk Assessments - by Industry Sector(The Y-axis depicts percentages)
0
10
20
30
40
50
60
70
80
90
100Ye
s
No
Don
't kn
ow
Manufacturing; Agriculture, hunting & forestry; Electricity, gas & water supply
Construction, Mining and quarrying
Wholesale & Retail trade, repairs
Hotels & Restaurants
Transport, Storage and Communications
Financial intermediation, Real Estate & Renting and Business activities
Public administration; compulsory social security
Education
Health and social work
Other community, social and personal service activities
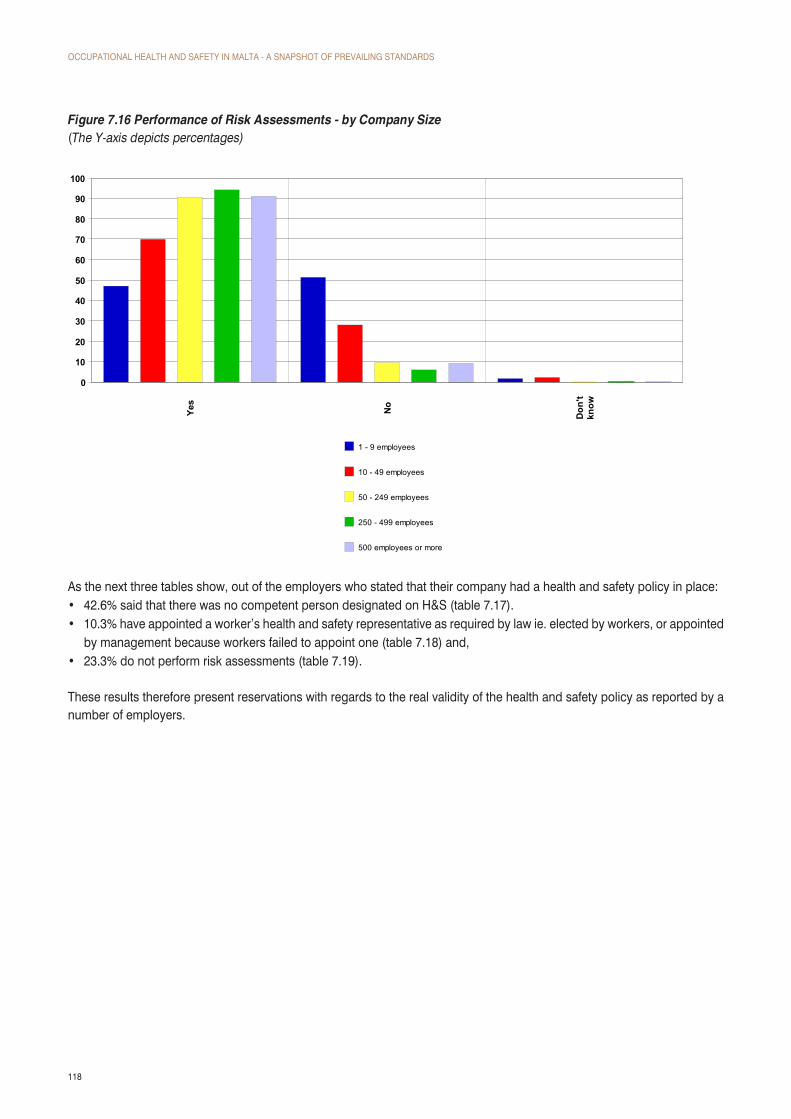
OCCUPATIONAL HEALTH AND SAFETY IN MALTA - A SNAPSHOT OF PREVAILING STANDARDS
118
Figure 7.16 Performance of Risk Assessments - by Company Size(The Y-axis depicts percentages)
0
10
20
30
40
50
60
70
80
90
100Ye
s
No
Don
'tkn
ow
1 - 9 employees
10 - 49 employees
50 - 249 employees
250 - 499 employees
500 employees or more
As the next three tables show, out of the employers who stated that their company had a health and safety policy in place:• 42.6% said that there was no competent person designated on H&S (table 7.17). • 10.3% have appointed a worker’s health and safety representative as required by law ie. elected by workers, or appointed
by management because workers failed to appoint one (table 7.18) and, • 23.3% do not perform risk assessments (table 7.19).
These results therefore present reservations with regards to the real validity of the health and safety policy as reported by a number of employers.

OCCUPATIONAL HEALTH AND SAFETY IN MALTA - A SNAPSHOT OF PREVAILING STANDARDS
119
Table 7.17 Presence of a H&S Policy by Designation of a Competent Person on H&S
CountsAnalysis %Respondents
Total
Total
Yes, full time onOHS
Yes, OHS fallsunder one of th-e responsibilityof a particular
employee
Yes, retainerbasis (external
consultant) No Don't know
Yes
No
Don't know
1200 1099.1%
28023.3%
635.3%
73861.5%
100.8%
493 9018.3%
14729.8%
448.9%
21042.6%
20.4%
654 172.6%
12218.7%
162.4%
49776.0%
20.3%
53 23.8%
1120.8%
35.7%
3158.5%
611.3%
Table 7.18 Presence of a H&S Policy by Appointment of a Worker’s H&S Representative
CountsAnalysis %Respondents
Total
Total
Appointed bymanagement
withoutconsultation
Appointed bymanagement
because workersfailed to appoint
Elected by theworkers Don't know Not appointed
Yes
No
Don't know
1200 12410.3%
131.1%
484.0%
40.3%
101184.3%
493 9419.1%
122.4%
397.9%
30.6%
34570.0%
654 274.1%
10.2%
81.2%
--
61894.5%
53 35.7%
--
11.9%
11.9%
4890.6%
Table 7.19 Presence of a H&S Policy by Performance of Risk Assessments
CountsAnalysis %Respondents Total
Total
Yes NoDon'tknow
Yes
No
Don't know
1200 65154.3%
52944.1%
201.7%
493 37075.1%
11523.3%
81.6%
654 26139.9%
38859.3%
50.8%
53 2037.7%
2649.1%
713.2%
7.4.1 Involvement of Employees in Risk AssessmentsWhen employers were asked whether employees are generally involved in risk assessments, in the majority of cases (81.3%), results show that employees are involved. Results also show that the sector which is least likely to involve employees is the ‘Financial Intermediation; Real Estate & Renting and Business Activities’ registering 70.2%. The ‘Construction, Mining and Quarrying’ sector follows with 74.3%.

OCCUPATIONAL HEALTH AND SAFETY IN MALTA - A SNAPSHOT OF PREVAILING STANDARDS
120
Figure 7.20 Involvement of Employees in Risk Assessments - by Industry Sector(The Y-axis depicts percentages)
0
10
20
30
40
50
60
70
80
90
100
Yes
No
Don
't kn
ow
Manufacturing; Agriculture, hunting & forestry; Electricity, gas & water supply
Construction, Mining and quarrying
Wholesale & Retail trade, repairs
Hotels & Restaurants
Transport, Storage and Communications
Financial intermediation, Real Estate & Renting and Business activities
Public administration; compulsory social security
Education
Health and social work
Other community, social and personal service activities
When analysing results in terms of company size, one can note that in larger companies there is a higher tendency of involving employees in risk assessments. In the case of employers within companies with over 500 employees, all confirmed that employees are generally involved.

OCCUPATIONAL HEALTH AND SAFETY IN MALTA - A SNAPSHOT OF PREVAILING STANDARDS
121
Figure 7.21 Involvement of Employees in Risk Assessments - by Company Size(The Y-axis depicts percentages)
0
10
20
30
40
50
60
70
80
90
100Ye
s
No
Don
't kn
ow
1 - 9 employees
10 - 49 employees
50 - 249 employees
250 - 499 employees
500 employees or more
7.4.2 Foreign Workers
Employers were also asked about the employment of foreign workers within their organization. The reason behind this was to establish possible barriers one might face, particularly in light of the communication between the employer and the foreign employee and the resulting hazards it could place in terms of occupational health and safety.
Results show that 22.2% of employers interviewed do employ foreign workers. This is particularly so in the ‘Hotels & Restaurants’ sector where 47.7% of such employers said they employ foreign workers. The ‘Construction, Mining and Quarrying’ sector follows with 34.7%.

OCCUPATIONAL HEALTH AND SAFETY IN MALTA - A SNAPSHOT OF PREVAILING STANDARDS
122
Figure 7.22 Employment of Foreign Workers (including migrants) - by Industry Sector(The Y-axis depicts percentages)
0
10
20
30
40
50
60
70
80
90
100Ye
s
No
Don
't kn
ow
Manufacturing; Agriculture, hunting & forestry; Electricity, gas & water supply
Construction, Mining and quarrying
Wholesale & Retail trade, repairs
Hotels & Restaurants
Transport, Storage and Communications
Financial intermediation, Real Estate & Renting and Business activities
Public administration; compulsory social security
Education
Health and social work
Other community, social and personal service activities
Employers who employ foreign workers were also asked whether the company ensures that these workers are trained for work situations they are specifically engaged in. The research has shown that the vast majority of employers do provide training to foreign workers (90.2%). Assessing the various sectors, results show that employers within the ‘Construction, mining and quarrying’ sector are least likely to train foreign workers for specific work situations – 82.4%. The ‘Financial intermediation; real estate & renting and business activities’ sector follows with 83.9%.
Across the various company sizes, in most cases training is in fact provided to foreign workers for specific work situations. The least likely to do so are micro companies registering 87.5%.

OCCUPATIONAL HEALTH AND SAFETY IN MALTA - A SNAPSHOT OF PREVAILING STANDARDS
123
Figure 7.23 Training of Foreign Workers - by Industry Sector(The Y-axis depicts percentages)
0
10
20
30
40
50
60
70
80
90
100Ye
s
No
Don
'tkn
ow
Manufacturing; Agriculture, hunting & forestry; Electricity, gas & water supply
Construction, Mining and quarrying
Wholesale & Retail trade, repairs
Hotels & Restaurants
Transport, Storage and Communications
Financial intermediation, Real Estate & Renting and Business activities
Public administration; compulsory social security
Education
Health and social work
Other community, social and personal service activities
The next aspect analysed among companies who employ foreign workers, dealt with the method of communication used. When asked what steps are generally taken to communicate with foreign employees, the majority (59.7%) said that such employees had a good understanding of our language or used English as a common language. A high percentage of employers (41.1%) also stated that they were capable of speaking their language fluently.
When taking a closer look at the various sectors one can note that in the case of the ‘Construction, mining and quarrying’ sector a substantial percentage – 35.3%, engage an interpreter. This sector also shows the highest percentage which rely on body language or use very basic communication methods.

OCCUPATIONAL HEALTH AND SAFETY IN MALTA - A SNAPSHOT OF PREVAILING STANDARDS
124
Table 7.24 Steps Taken to Communicate - by Industry Sector
CountsAnalysis %Respondents
Total
Total
We can speakin their
languagefluently
Employeeshave a good
understandingof our language/ Communicate
in EnglishEngage aninterpreter
Try to speak intheir language /Employee triesto understandour language
Use bodylanguage orvery basic
communication Other
Manufacturing; Agriculture,hunting & forestry; Electricity,gas & water supply
Construction, Mining andquarrying
Wholesale & Retail trade,repairs
Hotels & Restaurants
Transport, Storage andCommunications
Financial intermediation, RealEstate & Renting and Businessactivities
Public administration;compulsory social security
Education
Health and social work
Other community, social andpersonal service activities
263 10841.1%
15759.7%
93.4%
3111.8%
114.2%
31.1%
32 1546.9%
1443.8%
13.1%
515.6%
39.4%
--
17 423.5%
529.4%
635.3%
635.3%
317.6%
15.9%
36 1747.2%
2261.1%
--
--
--
--
63 1320.6%
5282.5%
23.2%
1523.8%
23.2%
23.2%
26 1661.5%
1350.0%
--
--
13.8%
--
31 1238.7%
2064.5%
--
39.7%
13.2%
--
2 150.0%
150.0%
--
--
--
--
18 1372.2%
633.3%
--
--
--
--
7 228.6%
685.7%
--
--
--
--
31 1548.4%
1858.1%
--
26.5%
13.2%
--
Employers were also asked whether specific risk assessments are carried out for foreign workers employed with the company. Results however indicate that most employers (42.9%) who employ foreign workers do not carry out risk assessments specifically for such employees. One should also note that a substantial percentage also stated that specific assessments were not applicable in their case – 28.2%. Among the sectors which do carry out specific risk assessments for foreign workers, it transpires that the “Health & Social Work’ sector is most likely to do so – 42.9%.
Results show that company size also has a direct influence on whether specific risk assessments are carried out for foreign workers. The percentage varies from a minimum of 14.3% within companies with less than 10 employees, to 54.5% within companies employing over 500 employees.

OCCUPATIONAL HEALTH AND SAFETY IN MALTA - A SNAPSHOT OF PREVAILING STANDARDS
125
Figure 7.25 Risk Assessments for Foreign Workers - by Industry Sector(The Y-axis depicts percentages)
0
10
20
30
40
50
60
Yes
No
Don
't kn
ow
Not
App
licab
le
Manufacturing; Agriculture, hunting & forestry; Electricity, gas & water supply
Construction, Mining and quarrying
Wholesale & Retail trade, repairs
Hotels & Restaurants
Transport, Storage and Communications
Financial intermediation, Real Estate & Renting and Business activities
Public administration; compulsory social security
Education
Health and social work
Other community, social and personal service activities
Figure 7.26 Risk Assessments for Foreign Workers - by Company Size(The Y-axis depicts percentages)
0
10
20
30
40
50
60
Yes
No
Don
't kn
ow
Not
App
licab
le
1 - 9 employees
10 - 49 employees
50 - 249 employees
250 - 499 employees
500 employees or more

OCCUPATIONAL HEALTH AND SAFETY IN MALTA - A SNAPSHOT OF PREVAILING STANDARDS
126
7.4.3 Pregnant workersAnother area of relevance which was analysed by means of the survey with employers, dealt with the presence of pregnant women within the company. This is of particular relevance since such cases warrant certain health and safety procedures to be adopted within a company to protect the pregnant woman.
Employers were asked whether they ever had a pregnant woman working with the company. The results show that the highest presence of pregnant women was registered within the ‘Public Administration’ sector and the ‘Health & Social Work’ sector registering 75% and 60.9% respectively. When taking an overall look at the results, 29.9% have not had a pregnant woman working within the company.
Figure 7.27 Pregnant Women Working with Company - by Industry Sector(The Y-axis depicts percentages)
0
10
20
30
40
50
60
70
80
Yes
No
Don
't kn
ow
Manufacturing; Agriculture, hunting & forestry; Electricity, gas & water supply
Construction, Mining and quarrying
Wholesale & Retail trade, repairs
Hotels & Restaurants
Transport, Storage and Communications
Financial intermediation, Real Estate & Renting and Business activities
Public administration; compulsory social security
Education
Health and social work
Other community, social and personal service activities
The 29.9% of employers who did have pregnant women working with the company were also asked whether in these cases, they were notified by a certificate issued by a medical doctor or midwife. Results indicate that only in 34% of these cases were employers actually presented with a medical certificate.
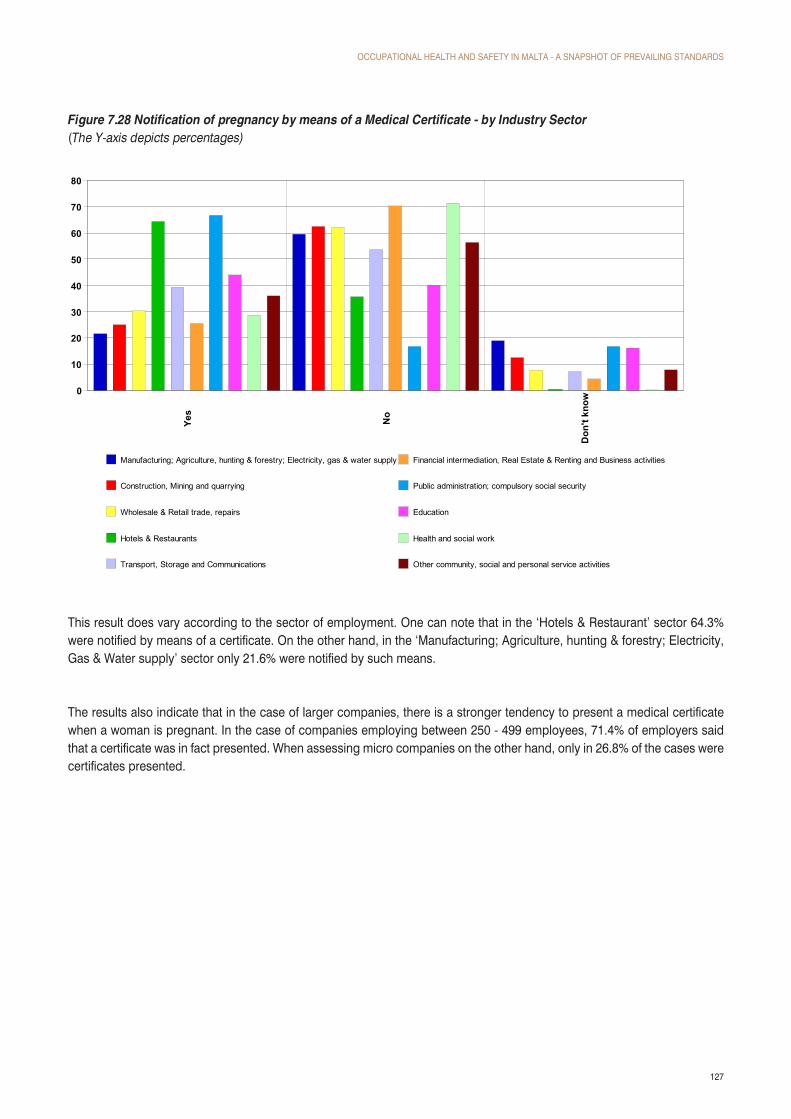
OCCUPATIONAL HEALTH AND SAFETY IN MALTA - A SNAPSHOT OF PREVAILING STANDARDS
127
Figure 7.28 Notification of pregnancy by means of a Medical Certificate - by Industry Sector(The Y-axis depicts percentages)
0
10
20
30
40
50
60
70
80Ye
s
No
Don
't kn
ow
Manufacturing; Agriculture, hunting & forestry; Electricity, gas & water supply
Construction, Mining and quarrying
Wholesale & Retail trade, repairs
Hotels & Restaurants
Transport, Storage and Communications
Financial intermediation, Real Estate & Renting and Business activities
Public administration; compulsory social security
Education
Health and social work
Other community, social and personal service activities
This result does vary according to the sector of employment. One can note that in the ‘Hotels & Restaurant’ sector 64.3% were notified by means of a certificate. On the other hand, in the ‘Manufacturing; Agriculture, hunting & forestry; Electricity, Gas & Water supply’ sector only 21.6% were notified by such means.
The results also indicate that in the case of larger companies, there is a stronger tendency to present a medical certificate when a woman is pregnant. In the case of companies employing between 250 - 499 employees, 71.4% of employers said that a certificate was in fact presented. When assessing micro companies on the other hand, only in 26.8% of the cases were certificates presented.

OCCUPATIONAL HEALTH AND SAFETY IN MALTA - A SNAPSHOT OF PREVAILING STANDARDS
128
Figure 7.29 Notification of pregnancy by means of a Medical Certificate - by Company Size(The Y-axis depicts percentages)
0
10
20
30
40
50
60
70
80
Yes
No
Don
't kn
ow
1 - 9 employees
10 - 49 employees
50 - 249 employees
250 - 499 employees
500 employees or more
A vital issue when dealing with the presence of a pregnant worker within a company, is the performance of a risk assessment specifically for such circumstances. Employers were therefore asked whether they do perform a specific risk assessment on pregnant employees.
Results indicate that the majority (58.5%) said that this was not done, whilst only 32.4% said they did carry out a specific risk assessment.

OCCUPATIONAL HEALTH AND SAFETY IN MALTA - A SNAPSHOT OF PREVAILING STANDARDS
129
Figure 7.30 Risk Assessments on Pregnant Women - by Industry Sector(The Y-axis depicts percentages)
0
10
20
30
40
50
60
70
80
90Ye
s
No
Don
'tkn
ow
Manufacturing; Agriculture, hunting & forestry; Electricity, gas & water supply
Construction, Mining and quarrying
Wholesale & Retail trade, repairs
Hotels & Restaurants
Transport, Storage and Communications
Financial intermediation, Real Estate & Renting and Business activities
Public administration; compulsory social security
Education
Health and social work
Other community, social and personal service activities
When looking more specifically into the various sectors, one can note that certain sectors differ from others in this regard. The ‘Hotels & Restaurant’ sector once again registered the highest percentage which did perform risk assessments on pregnant women – 64.3%. The “Transport, Storage & Communications’ sector follows with 53.6%, whilst the ‘Public Administration’ sector follows with 50%. On the other hand the lowest percentage registered can be noted within the ‘Construction, Mining and Quarrying’ sector – 18.8%.
In analyzing the performance of risk assessments on pregnant women, results clearly indicate that the majority of companies with less than 250 employees did not perform such assessments. There is however a steep increase in such risk assessments once the company exceeds 250 employees, whereby as figure 7.31 indicates, 78.6% of companies employing between 250 – 499 employees do carry out risk assessments on pregnant women.

OCCUPATIONAL HEALTH AND SAFETY IN MALTA - A SNAPSHOT OF PREVAILING STANDARDS
130
Figure 7.31 Risk Assessments on Pregnant Women - by Company Size(The Y-axis depicts percentages)
0
10
20
30
40
50
60
70
80Ye
s
No
Don
't kn
ow
1 - 9 employees
10 - 49 employees
50 - 249 employees
250 - 499 employees
500 employees or more
7.4.4 Workers With a DisabilityIn addition to the presence of foreign workers and pregnant employees, employers were also asked whether they have ever had an employee who was registered as a person with a disability.
Results show that a total of 8.4% of employers said they employ a person with a disability. When analyzing individual sectors one can also notice that this increases substantially, particularly in the ‘Health & Social Work’ sector where 26.1% of employers said that they do employ a person with a disability. This is followed by the ‘Public Administration’ sector, registering 25%. The lowest percentage on the other hand was registered within the ‘Wholesale, Retail trade, and Repairs’ sector – 3.8%.

OCCUPATIONAL HEALTH AND SAFETY IN MALTA - A SNAPSHOT OF PREVAILING STANDARDS
131
Figure 7.32 Employment of Persons with a Disability - by Industry Sector(The Y-axis depicts percentages)
0
10
20
30
40
50
60
70
80
90
100Ye
s
No
Don
't kn
ow
Manufacturing; Agriculture, hunting & forestry; Electricity, gas & water supply
Construction, Mining and quarrying
Wholesale & Retail trade, repairs
Hotels & Restaurants
Transport, Storage and Communications
Financial intermediation, Real Estate & Renting and Business activities
Public administration; compulsory social security
Education
Health and social work
Other community, social and personal service activities
As was the case with pregnant employees, the presence of a person with a disability employed with the company also requires a specific risk assessment to be carried out, in order to safeguard the health and safety of the employee in these specific circumstances.
When asking employers whether they do carry out specific risk assessments for persons with a disability, the majority - 55.4% - said they do. Certain sectors registered a stronger possibility of carrying out such assessments, especially in the ‘Public Administration’ sector (100%) and the ‘Transport, Storage and Communications’ sector (80%). The lowest percentage of companies who would carry out a risk assessment for persons with a disability was registered within the ‘Wholesale, Retail Trade, and Repairs’ sector – 37.5%.

OCCUPATIONAL HEALTH AND SAFETY IN MALTA - A SNAPSHOT OF PREVAILING STANDARDS
132
Figure 7.33 Risk Assessments for Persons with a Disability - by Industry Sector(The Y-axis depicts percentages)
0
10
20
30
40
50
60
70
80
90
100Ye
s
No
Don
't kn
ow
Not
App
licab
le
Manufacturing; Agriculture, hunting & forestry; Electricity, gas & water supply
Construction, Mining and quarrying
Wholesale & Retail trade, repairs
Hotels & Restaurants
Transport, Storage and Communications
Financial intermediation, Real Estate & Renting and Business activities
Public administration; compulsory social security
Education
Health and social work
Other community, social and personal service activities
One can also note that risk assessments for persons with a disability are more likely to be carried out among the larger companies as can be noted in figure 7.34. The results show that 90.9% of companies with 250 to 499 employees who have a person with a disability employed with them, do carry out a specific risk assessment.
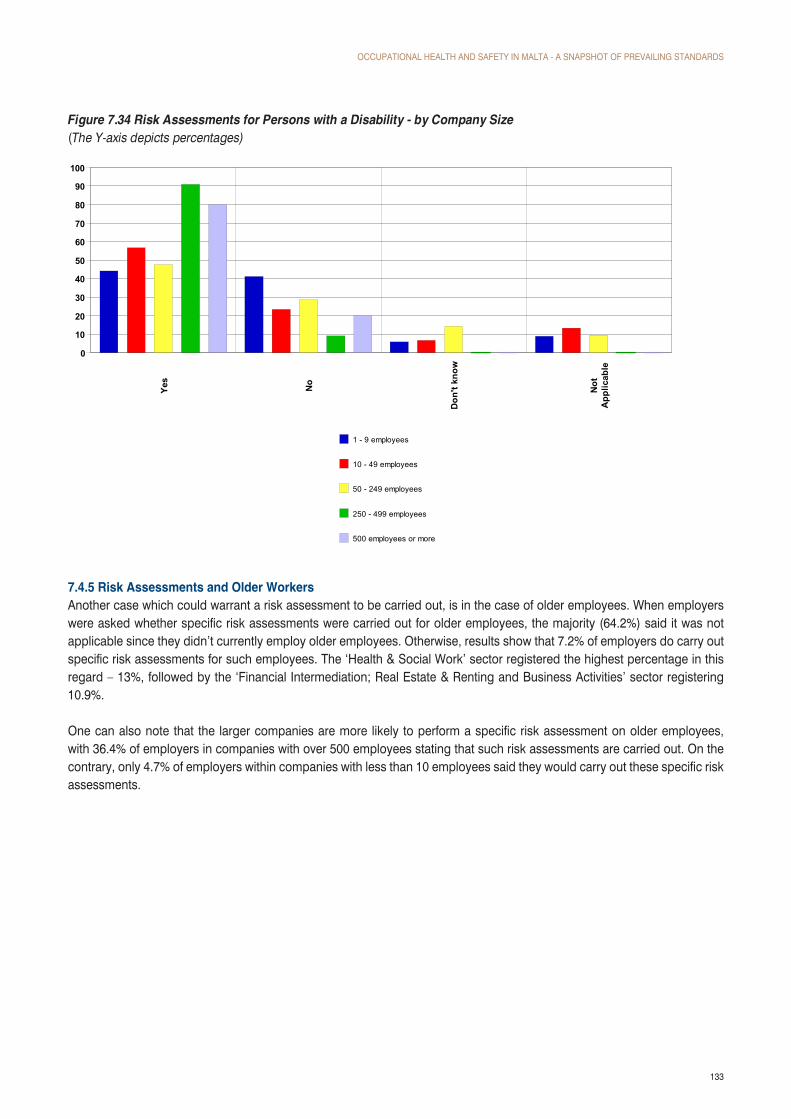
OCCUPATIONAL HEALTH AND SAFETY IN MALTA - A SNAPSHOT OF PREVAILING STANDARDS
133
Figure 7.34 Risk Assessments for Persons with a Disability - by Company Size(The Y-axis depicts percentages)
0
10
20
30
40
50
60
70
80
90
100Ye
s
No
Don
't kn
ow
Not
App
licab
le
1 - 9 employees
10 - 49 employees
50 - 249 employees
250 - 499 employees
500 employees or more
7.4.5 Risk Assessments and Older Workers Another case which could warrant a risk assessment to be carried out, is in the case of older employees. When employers were asked whether specific risk assessments were carried out for older employees, the majority (64.2%) said it was not applicable since they didn’t currently employ older employees. Otherwise, results show that 7.2% of employers do carry out specific risk assessments for such employees. The ‘Health & Social Work’ sector registered the highest percentage in this regard – 13%, followed by the ‘Financial Intermediation; Real Estate & Renting and Business Activities’ sector registering 10.9%.
One can also note that the larger companies are more likely to perform a specific risk assessment on older employees, with 36.4% of employers in companies with over 500 employees stating that such risk assessments are carried out. On the contrary, only 4.7% of employers within companies with less than 10 employees said they would carry out these specific risk assessments.
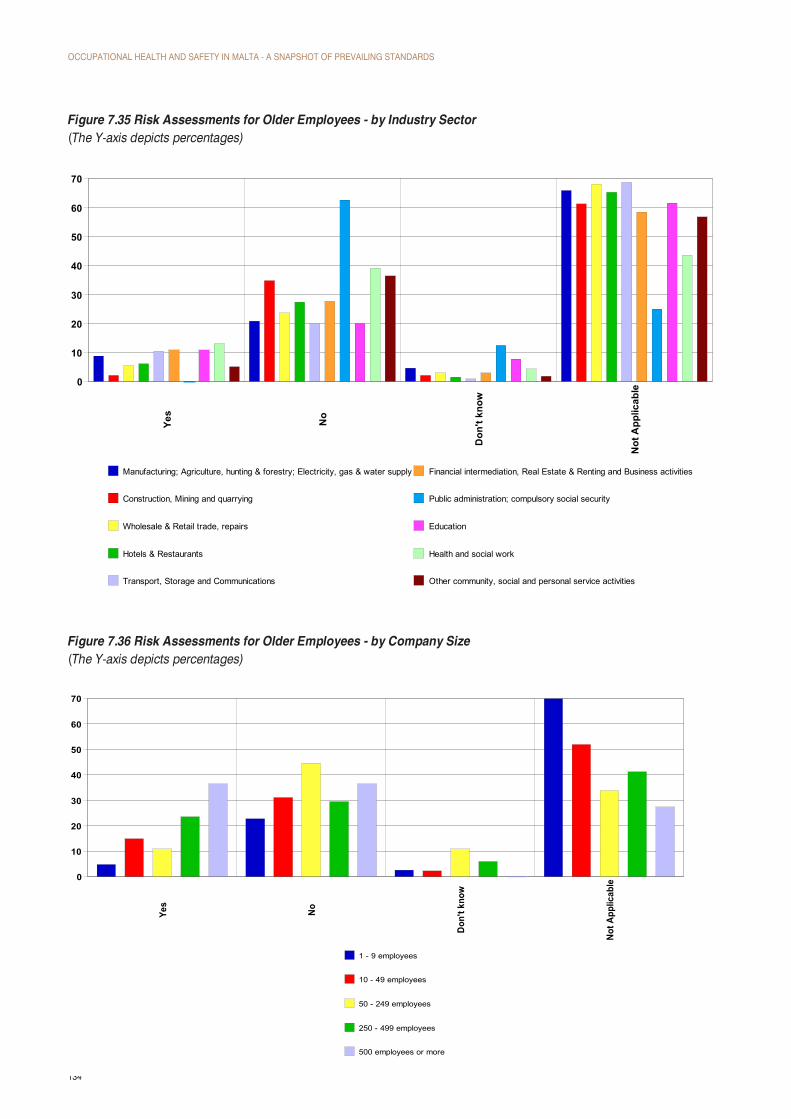
OCCUPATIONAL HEALTH AND SAFETY IN MALTA - A SNAPSHOT OF PREVAILING STANDARDS
134
Figure 7.35 Risk Assessments for Older Employees - by Industry Sector(The Y-axis depicts percentages)
0
10
20
30
40
50
60
70Ye
s
No
Don
't kn
ow
Not
App
licab
le
Manufacturing; Agriculture, hunting & forestry; Electricity, gas & water supply
Construction, Mining and quarrying
Wholesale & Retail trade, repairs
Hotels & Restaurants
Transport, Storage and Communications
Financial intermediation, Real Estate & Renting and Business activities
Public administration; compulsory social security
Education
Health and social work
Other community, social and personal service activities
Figure 7.36 Risk Assessments for Older Employees - by Company Size(The Y-axis depicts percentages)
0
10
20
30
40
50
60
70
Yes
No
Don'
t kno
w
Not A
pplic
able
1 - 9 employees
10 - 49 employees
50 - 249 employees
250 - 499 employees
500 employees or more

OCCUPATIONAL HEALTH AND SAFETY IN MALTA - A SNAPSHOT OF PREVAILING STANDARDS
135
7.4.6. Control Measures Taken Following Risk AssessmentsOne of the aims of a risk assessment is to identify the possible occupational hazards, evaluate the resultant risks and take necessary action to avoid or limit such risks. The next few tables present data on whether control measures were taken by the employer to address the risks to different vulnerable groups following a risk assessment exercise.
The research shows that in the majority of cases when a risk assessment is carried out, measures are in fact taken to address the risks involved. This was especially so when dealing with persons with a disability, where 92.9% of employers (table 7.37) said that action was taken. When analysing the different risk assessments carried out for specific situations, few were the cases where despite the risks involved no action was taken.
Table 7.37 Control Measures taken for Table 7.38 Control Measures takenPersons with a Disability for Foreign Workers
CountsBase %Respondents
Total
Yes, measures were taken
No measures were taken
No need for action
Don't know
NA
56100.0%
5292.9%
--
35.4%
--
11.8%
CountsBase %Respondents
Total
Yes, measures were taken
No measures were taken
No need for action
Don't know
NA
69100.0%
4971.0%
22.9%
1521.7%
11.4%
22.9%
Table 7.39 Control Measures taken for Table 7.40 Control Measures takenOlder Employees for Pregnant Employees
CountsBase %Respondents
Total
Yes, measures were taken
No measures were taken
No need for action
Don't know
NA
86100.0%
7688.4%
--
78.1%
--
33.5%
CountsBase %Respondents
Total
Yes, measures were taken
No measures were taken
No need for action
Don't know
NA
120100.0%
9780.8%
21.7%
1411.7%
21.7%
54.2%

OCCUPATIONAL HEALTH AND SAFETY IN MALTA - A SNAPSHOT OF PREVAILING STANDARDS
136
7.5 Medical SurveillanceThe research also assessed whether employers carry out any sort of medical surveillance on their employees, focusing specifically on medical examinations. Overall, results indicate that the vast majority of companies do not carry out such medial examinations on their workers – 72.7%.
The sector which is least likely to carry out medical surveillance on its employees is the ‘Wholesale, Retail Trade, and Repairs’ sector registering 77.4% who stated that no such surveillance is carried out. Results also indicate that among companies who do carry out medical surveillance some sectors indicate that this is mainly carried out when employees join the company, whilst in other cases this is carried out during employment.
Figure 7.41 Medical Surveillance on Employees - by Industry Sector(The Y-axis depicts percentages)
0
10
20
30
40
50
60
70
80
Yes,
on
entr
y
Yes,
dur
ing
empl
oym
ent
No
Don
't kn
ow
Manufacturing; Agriculture, hunting & forestry; Electricity, gas & water supply
Construction, Mining and quarrying
Wholesale & Retail trade, repairs
Hotels & Restaurants
Transport, Storage and Communications
Financial intermediation, Real Estate & Renting and Business activities
Public administration; compulsory social security
Education
Health and social work
Other community, social and personal service activities
When assessing these results in terms of company size, one can note that when dealing with larger companies the majority do tend to carry out medical surveillance on their employees. Results indicate that in the case of companies employing between 250 to 499 employees, 64.7% carry out medical surveillance on entry, whilst 58.8% of such companies said medical surveillance is carried out during employment.

OCCUPATIONAL HEALTH AND SAFETY IN MALTA - A SNAPSHOT OF PREVAILING STANDARDS
137
Figure 7.42 Medical Surveillance on Employees - by Company Size(The Y-axis depicts percentages)
0
10
20
30
40
50
60
70
80
Yes,
on
entry
Yes,
dur
ing
empl
oym
ent
No
Don'
t kno
w
1 - 9 employees
10 - 49 employees
50 - 249 employees
250 - 499 employees
500 employees or more
7.5.SystemsAdoptedByManagementinCaseofNon-ObservanceofOHSMeasuresByWorkersOne of the aspects which was focused upon when carrying out research with employers, was whether companies had a system in place which called for some type of action whenever health and safety procedures were not adhered to. Based on the feedback given by employers, the system was not always necessarily a formal or documented procedure adopted held by the company.
The results show that the majority (75.8%) said that some kind of action is in fact taken when an employee fails to follow health and safety procedures at work. The majority of companies within all sectors said that a system did exist and this was particularly so in the ‘Hotels & Restaurant’ sector and the ‘Education’ sector where 87.1% and 84.6% stated so.
Results also show that the ‘Financial Intermediation; Real Estate & Renting and Business Activities’ sector registered the lowest percentage (66.3%) of companies who would have a system in place which called for action to be taken.

OCCUPATIONAL HEALTH AND SAFETY IN MALTA - A SNAPSHOT OF PREVAILING STANDARDS
138
Figure 7.43 Action Taken if Health & Safety Procedure is Not Followed - by Industry Sector(The Y-axis depicts percentages)
0
10
20
30
40
50
60
70
80
90Ye
s
No
Don
't kn
ow
Manufacturing; Agriculture, hunting & forestry; Electricity, gas & water supply
Construction, Mining and quarrying
Wholesale & Retail trade, repairs
Hotels & Restaurants
Transport, Storage and Communications
Financial intermediation, Real Estate & Renting and Business activities
Public administration; compulsory social security
Education
Health and social work
Other community, social and personal service activities
Results also indicate that as the company size increases one is more likely to encounter a system calling for some kind of action in cases when health and safety procedures are not adhered to. Figure 7.44 shows that all companies employing over 250 employees have a system of this sort in place.

OCCUPATIONAL HEALTH AND SAFETY IN MALTA - A SNAPSHOT OF PREVAILING STANDARDS
139
Figure 7.44 Action Taken if Health & Safety Procedure is Not Followed - by Company Size(The Y-axis depicts percentages)
0
10
20
30
40
50
60
70
80
90
100Ye
s
No
Don
't kn
ow
1 - 9 employees
10 - 49 employees
50 - 249 employees
250 - 499 employees
500 employees or more
Employers who said they did have a system in place calling for some kind of action in cases when health and safety procedures are not followed, were probed further in order to identify the type of action taken.
In the majority of cases when an employee fails to follow health and safety regulations, he/she is given a verbal warning (90.4%). Other actions were also mentioned, though to a lesser degree, such as written warnings (19.3%) and employee dismissals (9.4%).
The use of verbal warnings is applied in all industry sectors and even more so in the ‘Manufacturing; Agriculture, hunting & forestry; Electricity, gas & water supply’ sector where 95.8% of employers indicated that a verbal warning is given. The ‘Construction, mining & quarrying’ sector and the ’Wholesale, retail trade, and repairs’ sector also registered a high percentage who stated that verbal warnings are generally given – 94.4% respectively.

OCCUPATIONAL HEALTH AND SAFETY IN MALTA - A SNAPSHOT OF PREVAILING STANDARDS
140
Table 7.45 Type of Action Taken - by Industry Sector
CountsAnalysis %Respondents
Total
Total
Verbalwarning
Writtenwarning
Employeeis dismis-
sed
Dependson the se-verity of t-he case
Onemeasureleads toanother
Dependson the co-llective a-greement
Fines areimposed Other
Manufacturing; Agriculture,hunting & forestry; Electricity,gas & water supply
Construction, Mining andquarrying
Wholesale & Retail trade, repairs
Hotels & Restaurants
Transport, Storage andCommunications
Financial intermediation, RealEstate & Renting and Businessactivities
Public administration;compulsory social security
Education
Health and social work
Other community, social andpersonal service activities
907 82090.4%
17519.3%
859.4%
182.0%
161.8%
40.4%
50.6%
50.6%
142 13695.8%
2416.9%
107.0%
21.4%
10.7%
21.4%
21.4%
10.7%
36 3494.4%
1233.3%
822.2%
--
--
--
12.8%
--
286 27094.4%
4114.3%
124.2%
20.7%
20.7%
--
--
--
114 8675.4%
2521.9%
1815.8%
87.0%
87.0%
--
--
10.9%
91 8593.4%
1718.7%
77.7%
--
22.2%
11.1%
11.1%
--
67 5988.1%
2232.8%
1116.4%
11.5%
11.5%
--
11.5%
--
6 583.3%
233.3%
--
116.7%
116.7%
--
--
--
55 4785.5%
1221.8%
610.9%
--
--
--
--
11.8%
16 1275.0%
531.3%
318.8%
--
16.3%
--
--
16.3%
94 8691.5%
1516.0%
1010.6%
44.3%
--
11.1%
--
11.1%
The research also highlights the fact that smaller companies rely more heavily on verbal warnings, while as the company size increases, written warning become more prominent. As results indicate, 64.7% of companies employing between 250 – 499 employees resort to written warnings too, whilst in the even larger companies employing over 500 employees, an equivalent percentage of verbal and written warnings were registered – 63.6%.
The results could also be a reflection of the fact that larger companies are more likely to have a formal system in place in which health and safety procedures are clearly outlined together with the consequences when procedures are not followed, which would include for instance written warnings, cases for dismissal etc.

OCCUPATIONAL HEALTH AND SAFETY IN MALTA - A SNAPSHOT OF PREVAILING STANDARDS
141
Figure 7.46 Type of Action Taken - by Company Size(The Y-axis depicts percentages)
0
10
20
30
40
50
60
70
80
90
100
Verb
al w
arni
ng
Writ
ten
war
ning
Empl
oyee
isdi
smis
sed
Dep
ends
on
the
seve
rity
of th
eca
se
One
mea
sure
lead
s to
anot
her
Dep
ends
on
the
colle
ctiv
eag
reem
ent
Fine
s ar
eim
pose
d
Oth
er
1 - 9 employees
10 - 49 employees
50 - 249 employees
250 - 499 employees
500 employees or more
7.6 Access to OHSA’s Services 7.6.1 Usage of ServicesAn assessment was done on the use of a number of OHSA’s services, by employers. The study has shown that a total of 389 employers have made use of one or more of OHSA’s services, which is equivalent to 32.4% of companies in Malta. The results below show the number of companies using the various services as listed in the table.

OCCUPATIONAL HEALTH AND SAFETY IN MALTA - A SNAPSHOT OF PREVAILING STANDARDS
142
Table 7.47 Use of OHSA Services
CountsBase %Respondents
Total
Provision of guidance or advice
Use of OHSA Website
Assistance with a trade dispute /mediation
OHSA training course
Printed material on H&S
Seminars, conferences and othersimilar events organised by OHSA
389100.0%
17946.0%
16341.9%
215.4%
19349.6%
18848.3%
8521.9%
When assessing the various sectors, results show that overall the ‘Public administration’ sector is among the most likely to use OHSA’s services. The ‘Construction, quarrying & mining’ sector also shows a higher percentage than other sectors when assessing access the OHSA’s services.

OCCUPATIONAL HEALTH AND SAFETY IN MALTA - A SNAPSHOT OF PREVAILING STANDARDS
143
Figure 7.48 Use of OHSA Services – Provision of Guidance or Advice - by Industry Sector(The Y-axis depicts percentages)
0
10
20
30
40
50
60
70
80
90Ye
s
No
Don
't kn
ow
Manufacturing; Agriculture, hunting & forestry; Electricity, gas & water supply
Construction, Mining and quarrying
Wholesale & Retail trade, repairs
Hotels & Restaurants
Transport, Storage and Communications
Financial intermediation, Real Estate & Renting and Business activities
Public administration; compulsory social security
Education
Health and social work
Other community, social and personal service activities
Figure 7.49 Use of OHSA Services – Use of OHSA website - by Industry Sector(The Y-axis depicts percentages)
0
10
20
30
40
50
60
70
80
90
Yes
No
Don
't kn
ow
Manufacturing; Agriculture, hunting & forestry; Electricity, gas & water supply
Construction, Mining and quarrying
Wholesale & Retail trade, repairs
Hotels & Restaurants
Transport, Storage and Communications
Financial intermediation, Real Estate & Renting and Business activities
Public administration; compulsory social security
Education
Health and social work
Other community, social and personal service activities

OCCUPATIONAL HEALTH AND SAFETY IN MALTA - A SNAPSHOT OF PREVAILING STANDARDS
144
Figure 7.50 Use of OHSA Services – Assistance/Mediation with a Trade Dispute – by Industry Sector(The Y-axis depicts percentages)
0
10
20
30
40
50
60
70
80
90
100
Yes
No
Don
't kn
ow
Manufacturing; Agriculture, hunting & forestry; Electricity, gas & water supply
Construction, Mining and quarrying
Wholesale & Retail trade, repairs
Hotels & Restaurants
Transport, Storage and Communications
Financial intermediation, Real Estate & Renting and Business activities
Public administration; compulsory social security
Education
Health and social work
Other community, social and personal service activities
Figure 7.51 Use of OHSA Services – OHS Training Course - by Industry Sector(The Y-axis depicts percentages)
0
10
20
30
40
50
60
70
80
90
Yes
No
Don
't kn
ow
Manufacturing; Agriculture, hunting & forestry; Electricity, gas & water supply
Construction, Mining and quarrying
Wholesale & Retail trade, repairs
Hotels & Restaurants
Transport, Storage and Communications
Financial intermediation, Real Estate & Renting and Business activities
Public administration; compulsory social security
Education
Health and social work
Other community, social and personal service activities

OCCUPATIONAL HEALTH AND SAFETY IN MALTA - A SNAPSHOT OF PREVAILING STANDARDS
145
Figure 7.52 Use of OHSA Services – Printed Material on Health & Safety – by Industry Sector(The Y-axis depicts percentages)
0
10
20
30
40
50
60
70
80
90
Yes
No
Don
't kn
ow
Manufacturing; Agriculture, hunting & forestry; Electricity, gas & water supply
Construction, Mining and quarrying
Wholesale & Retail trade, repairs
Hotels & Restaurants
Transport, Storage and Communications
Financial intermediation, Real Estate & Renting and Business activities
Public administration; compulsory social security
Education
Health and social work
Other community, social and personal service activities
Figure 7.53 Use of OHSA Services – Seminars, Conferences, Events - by Industry Sector(The Y-axis depicts percentages)
0
10
20
30
40
50
60
70
80
90
100
Yes
No
Don
't kn
ow
Manufacturing; Agriculture, hunting & forestry; Electricity, gas & water supply
Construction, Mining and quarrying
Wholesale & Retail trade, repairs
Hotels & Restaurants
Transport, Storage and Communications
Financial intermediation, Real Estate & Renting and Business activities
Public administration; compulsory social security
Education
Health and social work
Other community, social and personal service activities

OCCUPATIONAL HEALTH AND SAFETY IN MALTA - A SNAPSHOT OF PREVAILING STANDARDS
146
Consistent with previous analysis, results clearly indicate that micro/smaller companies are least likely to access OHSA’s services. This shifts rather drastically when dealing with medium and larger companies which stand in stark contrast to the smaller and micro enterprises. Nevertheless, one must bear in mind that the vast majority of companies do consist of the latter type, therefore restricting the overall percentages registered in terms of access to OHSA’s services.
Figure 7.54 Use of OHSA Services – Provision of Guidance or Advice - by Company Size(The Y-axis depicts percentages)
0
10
20
30
40
50
60
70
80
90
Yes
No
Don
't kn
ow
1 - 9 employees
10 - 49 employees
50 - 249 employees
250 - 499 employees
500 employees or more
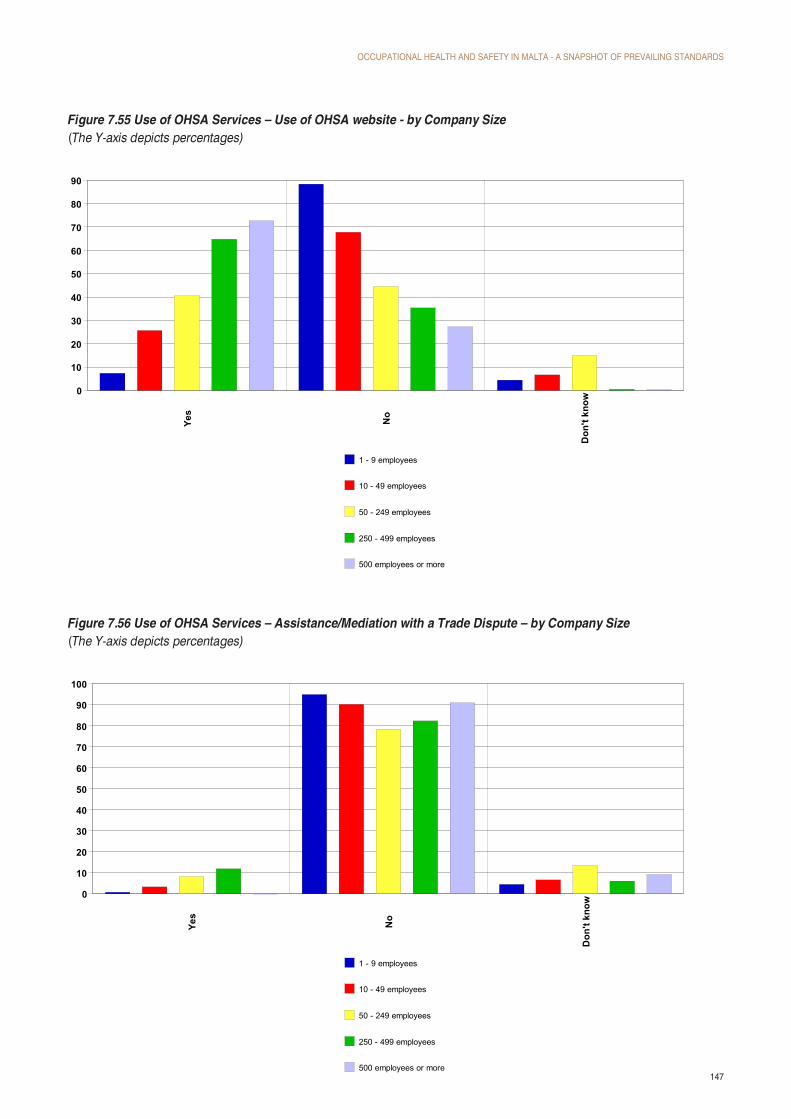
OCCUPATIONAL HEALTH AND SAFETY IN MALTA - A SNAPSHOT OF PREVAILING STANDARDS
147
Figure 7.55 Use of OHSA Services – Use of OHSA website - by Company Size(The Y-axis depicts percentages)
0
10
20
30
40
50
60
70
80
90Ye
s
No
Don
't kn
ow
1 - 9 employees
10 - 49 employees
50 - 249 employees
250 - 499 employees
500 employees or more
Figure 7.56 Use of OHSA Services – Assistance/Mediation with a Trade Dispute – by Company Size(The Y-axis depicts percentages)
0
10
20
30
40
50
60
70
80
90
100
Yes
No
Don
't kn
ow
1 - 9 employees
10 - 49 employees
50 - 249 employees
250 - 499 employees
500 employees or more

OCCUPATIONAL HEALTH AND SAFETY IN MALTA - A SNAPSHOT OF PREVAILING STANDARDS
148
Figure 7.57 Use of OHSA Services – OHS Training Course - by Company Size(The Y-axis depicts percentages)
0
10
20
30
40
50
60
70
80
90Ye
s
No
Don
't kn
ow
1 - 9 employees
10 - 49 employees
50 - 249 employees
250 - 499 employees
500 employees or more
Figure 7.58 Use of OHSA Services – Printed Material on Health & Safety – by Company Size(The Y-axis depicts percentages)
0
10
20
30
40
50
60
70
80
90
Yes
No
Don
't kn
ow
1 - 9 employees
10 - 49 employees
50 - 249 employees
250 - 499 employees
500 employees or more

OCCUPATIONAL HEALTH AND SAFETY IN MALTA - A SNAPSHOT OF PREVAILING STANDARDS
149
Figure 7.59 Use of OHSA Services – Seminars, Conferences, Events - by Company Size(The Y-axis depicts percentages)
0
10
20
30
40
50
60
70
80
90
100Ye
s
No
Don
't kn
ow
1 - 9 employees
10 - 49 employees
50 - 249 employees
250 - 499 employees
500 employees or more
7.6.2 Satisfaction with OHSA ServicesEmployers who made use of OHSA’s services were also asked how satisfied they were with these services. Results indicate that generally employers were ‘satisfied’ with such services offered by OHSA, and a substantial percentage also stated they were ‘very satisfied’.
The highest level of satisfaction was registered with the printed material on health & safety, whereby a total of 92% stated they were ‘satisfied’ with this material, out of which 32.4% stated they were ‘very satisfied’. Similarly, a total of 91.8% were satisfied with the seminars, conferences or other OHSA events, out of which, 35.3% were ‘very satisfied’.

OCCUPATIONAL HEALTH AND SAFETY IN MALTA - A SNAPSHOT OF PREVAILING STANDARDS
150
Figure 7.60 Satisfaction with OHSA’s services(The Y-axis depicts percentages)
0
10
20
30
40
50
60
Very
Sat
isfie
d
Satis
fied
Nei
ther
sat
isfie
dno
r dis
satis
fied
Not
sat
isfie
d
Not
sat
isfie
d at
all
Don
't kn
ow
Provision of guidance or advice
Use of OHSA Website
Assistance / mediation with a trade dispute
OHSA training course
Printed material on H&S
Seminars, conferences and other similar events organised by OHSA
7.6.3JudicialProceedingsonOHSIssuesThe research assessed whether any of the companies interviewed were ever subject to judicial proceedings on matters dealing with occupational health & safety. Results indicate that 3.8% of employers interviewed were in fact subject to such proceedings. Assessing individual sectors one can note that the highest percentage who were subject to judicial proceedings can be found within the ‘Construction, quarrying, and mining’ sector, where 14.3% of employers in this sector stated so.

OCCUPATIONAL HEALTH AND SAFETY IN MALTA - A SNAPSHOT OF PREVAILING STANDARDS
151
Figure 7.61 Judicial Proceedings on OHS matters - by Industry Sector(The Y-axis depicts percentages)
0
10
20
30
40
50
60
70
80
90
100
Yes
No
Don
'tkn
ow
Manufacturing; Agriculture, hunting & forestry; Electricity, gas & water supply
Construction, Mining and quarrying
Wholesale & Retail trade, repairs
Hotels & Restaurants
Transport, Storage and Communications
Financial intermediation, Real Estate & Renting and Business activities
Public administration; compulsory social security
Education
Health and social work
Other community, social and personal service activities
Analysing such results by company size shows that the highest percentage of employers subject to judicial proceedings can be found within the companies who employ between 250 - 499 employees – 23.5%. Companies employing between 50 – 249 employees follow with 20.3%.

OCCUPATIONAL HEALTH AND SAFETY IN MALTA - A SNAPSHOT OF PREVAILING STANDARDS
152
Figure 7.62 Judicial Proceedings on OHS matters - by Company Size(The Y-axis depicts percentages)
0
10
20
30
40
50
60
70
80
90
100
Yes
No
Don
't kn
ow
1 - 9 employees
10 - 49 employees
50 - 249 employees
250 - 499 employees
500 employees or more
7.7InjuriesatWorkOne of the primary objectives of the research was to obtain a clearer picture of the number of injuries and ill-health occurring at the workplace. Such calculations were based on any incidences of injuries and ill-health which occurred during 2010. Three distinct categories were used to distinguish the injury or ill-health sustained, namely:• Occupational Injuries• Physical ill-health• Psychological ill-health
The data on work-related injuries or ill-health was assessed through both surveys i.e. the survey targeting employers and the survey targeting employees. During the course of the study however, and as the findings from the research also indicate, health and safety practices in many local organizations are somewhat limited. Consequently, in many cases one could note that no official records were kept on the number of injuries, types of injuries, days lost due to such injuries etc. Hence when asked to provide information on these aspects, these often consisted of very rough estimates.
On the other hand, the survey targeting employees provided far more reliable data, for the obvious reason that an employee who sustained a work related injury or ill-health during 2010 was likely to remember and report it accordingly during the survey. Therefore, data on injuries and work related ill-health during 2010 is being presented in the chapter dealing with the findings from the employee survey.
Nevertheless, data captured from this section which could be considered as reliable information due to the nature of the information sought for, is being presented in this section.

OCCUPATIONAL HEALTH AND SAFETY IN MALTA - A SNAPSHOT OF PREVAILING STANDARDS
153
One of the objectives of the research was that of identifying the root causes of injuries at work during 2010. Employers were therefore asked to identify the root causes for occupational injuries and work related ill-health which resulted in the respective injuries.
7.8.1OccupationalInjuriesAs the results below indicate, according to 50.6% of employers whose company sustained an injury during 2010, the most common root cause of injuries is ‘Incorrect working practices’ registering a substantially higher percentage when compared to other possible root causes. ‘Lack of communication’ follows with 12.8%, whilst ‘Unfavourable environmental conditions’ and ‘Unexpected failure’ follow with 11% respectively.
Figure 7.63 Root Causes of Injuries(The Y-axis depicts percentages)
0
10
20
30
40
50
60
Problems with Man machine interface/ design/specification/ layout
Inadequate work schedule/organisation/ planning
Insufficient resource management (or resources)
Inadequate or no Procedures/ documents or management systems
Unfavorable environmental conditions
Incorrect working practices
Insufficient/inadequate supervisory/ managerial methods
Lack of communication
Lack of or incorrect training/ qualifications
Preventive maintenance less than adequate
Repeat failure
Unexpected failure
Defective/ incorrect equipment/ parts/ materials
Don't know
Other

OCCUPATIONAL HEALTH AND SAFETY IN MALTA - A SNAPSHOT OF PREVAILING STANDARDS
154
Table 7.63 Root Causes of Injuries - by Company Size(The Y-axis depicts percentages)
CountsBreak %Respondents
Total
Total
1 - 9employees
10 - 49employees
50 - 249employees
250 - 499employees
500employees
or more
Incorrect working practices
Lack of communication
Unfavorable environmentalconditions
Unexpected failure
Other
Defective/ incorrect equipment/parts/ materials
Inadequate workschedule/organisation/ planning
Don't know
Lack of or incorrect training/qualifications
Problems with Man machineinterface/ design/specification/layout
Repeat failure
Inadequate or no Procedures/documents or managementsystems
Insufficient resourcemanagement (or resources)
Insufficient/inadequatesupervisory/ managerialmethods
Preventive maintenance lessthan adequate
164 81 27 33 16 7
8350.6%
3644.4%
1140.7%
2369.7%
956.3%
457.1%
2112.8%
78.6%
622.2%
515.2%
212.5%
114.3%
1811.0%
89.9%
--
412.1%
531.3%
114.3%
1811.0%
78.6%
311.1%
39.1%
425.0%
114.3%
1710.4%
89.9%
311.1%
412.1%
16.3%
114.3%
169.8%
22.5%
725.9%
618.2%
--
114.3%
137.9%
67.4%
311.1%
39.1%
--
114.3%
127.3%
911.1%
13.7%
13.0%
16.3%
--
95.5%
22.5%
13.7%
515.2%
--
114.3%
74.3%
33.7%
27.4%
13.0%
16.3%
--
74.3%
22.5%
--
39.1%
16.3%
114.3%
53.0%
22.5%
--
13.0%
16.3%
114.3%
31.8%
22.5%
--
--
16.3%
--
31.8%
22.5%
--
--
16.3%
--
31.8%
11.2%
--
26.1%
--
--
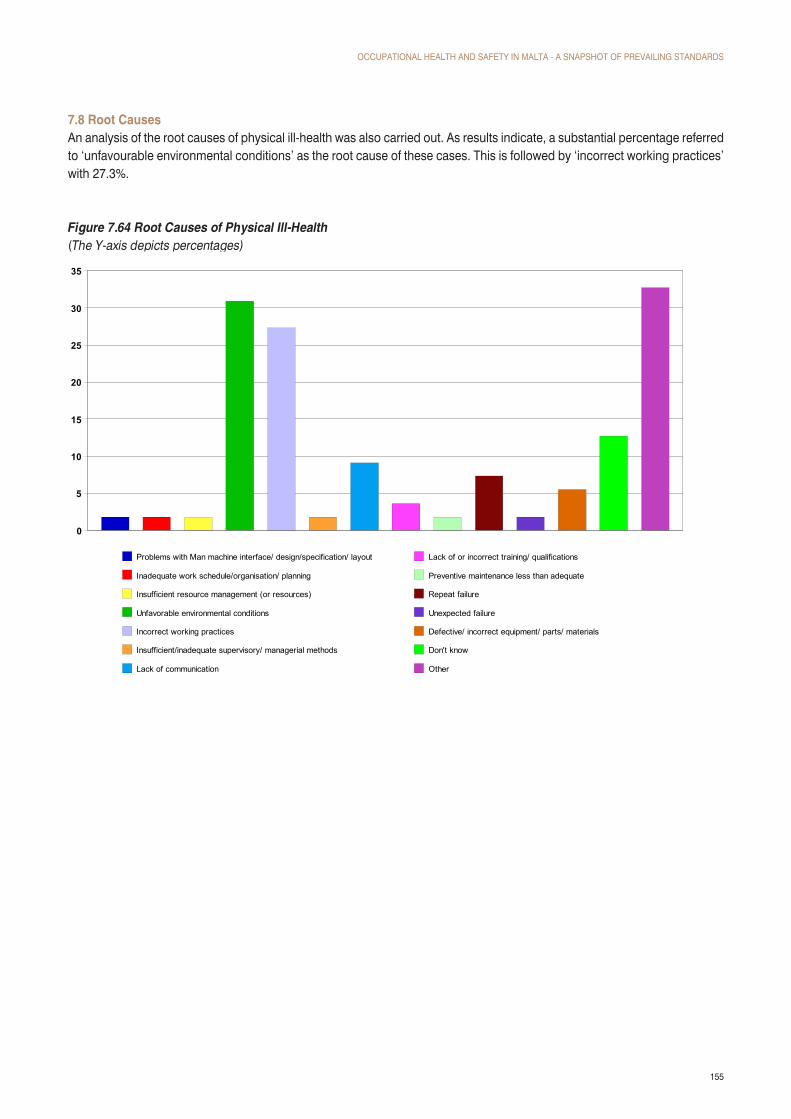
OCCUPATIONAL HEALTH AND SAFETY IN MALTA - A SNAPSHOT OF PREVAILING STANDARDS
155
7.8 Root CausesAn analysis of the root causes of physical ill-health was also carried out. As results indicate, a substantial percentage referred to ‘unfavourable environmental conditions’ as the root cause of these cases. This is followed by ‘incorrect working practices’ with 27.3%.
Figure 7.64 Root Causes of Physical Ill-Health(The Y-axis depicts percentages)
0
5
10
15
20
25
30
35
Problems with Man machine interface/ design/specification/ layout
Inadequate work schedule/organisation/ planning
Insufficient resource management (or resources)
Unfavorable environmental conditions
Incorrect working practices
Insufficient/inadequate supervisory/ managerial methods
Lack of communication
Lack of or incorrect training/ qualifications
Preventive maintenance less than adequate
Repeat failure
Unexpected failure
Defective/ incorrect equipment/ parts/ materials
Don't know
Other

OCCUPATIONAL HEALTH AND SAFETY IN MALTA - A SNAPSHOT OF PREVAILING STANDARDS
156
Table 7.64 Root Causes of Physical Ill-Health(The Y-axis depicts percentages)
CountsBreak %Respondents
Total
Total
1 - 9employees
10 - 49employees
50 - 249employees
250 - 499employees
500employees
or more
Other
Unfavorable environmentalconditions
Incorrect working practices
Don't know
Lack of communication
Repeat failure
Defective/ incorrect equipment/parts/ materials
Lack of or incorrect training/qualifications
Problems with Man machineinterface/ design/specification/layout
Inadequate workschedule/organisation/ planning
Insufficient resourcemanagement (or resources)
Insufficient/inadequatesupervisory/ managerial methods
Preventive maintenance less thanadequate
Unexpected failure
55 32 16 7 - -
1832.7%
1031.3%
531.3%
342.9%
--
--
1730.9%
1134.4%
212.5%
457.1%
--
--
1527.3%
721.9%
531.3%
342.9%
--
--
712.7%
515.6%
212.5%
--
--
--
59.1%
39.4%
--
228.6%
--
--
47.3%
13.1%
212.5%
114.3%
--
--
35.5%
26.3%
16.3%
--
--
--
23.6%
--
--
228.6%
--
--
11.8%
13.1%
--
--
--
--
11.8%
--
16.3%
--
--
--
11.8%
--
16.3%
--
--
--
11.8%
--
--
114.3%
--
--
11.8%
13.1%
--
--
--
--
11.8%
--
--
114.3%
--
--
--
--
--
--
--

OCCUPATIONAL HEALTH AND SAFETY IN MALTA - A SNAPSHOT OF PREVAILING STANDARDS
157
7.8.3PsychologicalIll-HealthThe root causes of the psychological ill health were also assessed by means of the survey. When assessing the root causes of cases of psychological ill health, one can note that the main reason is the workload involved registering 41.9%. This is followed by two similar reasons namely ‘pressure and deadlines’ and ‘excessive hours spent at work’ registering 38.7% and 25.8% respectively.
Figure 7.65 Root Causes of Psychological Ill-Health(The Y-axis depicts percentages)
0
5
10
15
20
25
30
35
40
45
Workload
Pressure and deadlines
Excessive hours spent at work
Inappropriate working environment
Job or Role Uncertainty
Lack of staff or resources
Management style
Don't know
Other

OCCUPATIONAL HEALTH AND SAFETY IN MALTA - A SNAPSHOT OF PREVAILING STANDARDS
158
Table 7.65 Root Causes of Psychological Ill-Health(The percentages in this table represent column percentages)
CountsBreak %Respondents
Total
Total
1 - 9employees
10 - 49employees
50 - 249employees
250 - 499employees
500employees
or more
Workload
Pressure and deadlines
Excessive hours spent atwork
Job or Role Uncertainty
Lack of staff or resources
Don't know
Management style
Other
Inappropriate workingenvironment
31 16 7 5 2 1
1341.9%
637.5%
457.1%
120.0%
2100.0%
--
1238.7%
637.5%
114.3%
240.0%
2100.0%
1100.0%
825.8%
318.8%
114.3%
240.0%
2100.0%
--
722.6%
212.5%
457.1%
120.0%
--
--
619.4%
16.3%
342.9%
120.0%
150.0%
--
516.1%
425.0%
--
120.0%
--
--
412.9%
--
114.3%
120.0%
2100.0%
--
412.9%
212.5%
114.3%
120.0%
--
--
13.2%
--
--
--
150.0%
--
7.9DamagesDuetoInjuriesIn certain situations, an injury at work can also possibly lead to damages to for instance machinery, equipment, stocks, furniture, building etc. During the survey with Employers, this was analysed accordingly, and employers were asked whether as a result of accidents at work in 2010, some damage was incurred. In the majority of cases (78%) no damage was incurred, whilst 18.9% of employers who sustained some type of injury during 2010 said they did incur some damage too.
Figure 7.66 Damage Incurred due to Accidents
Yes18.9%
No78.1%
Don't know3.0%
7.9 Damages Due to Injuries In certain situations, an injury at work can also possibly lead to damages to for instance machinery, equipment, stocks, furniture, building etc. During the survey with Employers, this was analysed accordingly, and employers were asked whether as a result of accidents at work in 2010, some damage was incurred. In the majority of cases (78%) no damage was incurred, whilst 18.9% of employers who sustained some type of injury during 2010 said they did incur some damage too.
Figure 7.66 Damage Incurred due to Accidents

OCCUPATIONAL HEALTH AND SAFETY IN MALTA - A SNAPSHOT OF PREVAILING STANDARDS
159
Employers who incurred damage due to an injury at work were consequently asked to quantify the costs involved of such damage. Results indicate that in most cases the damage incurred was up to €500, with 41.9% of employers who did incur damages stating so.
Figure 7.67 Costs Incurred from Damages in 2010(The Y-axis depicts percentages)
0
5
10
15
20
25
30
35
40
45
€0 to €500
€501 to € 2,000
€2,001 to € 5,000
€5,001 to € 10,000
€10,001 to €15,000
€15,001 to € 20,000
€20,001 to €30,000
More than € 30,000
Don't know
7.10Non-InjuryAccidentsThe research also sought to obtain information about non-injury accidents (near misses). This was defined as “any unplanned event that results in: damage or loss to property, plant, materials, the environment’, and/or a loss of business opportunity, but does not result in an injury”. Although a number of injuries are sometimes avoided for some reason or another, the occurrence of non-injury accidents could still be the result of poor health and safety at work, and nevertheless, the existing hazard could still have resulted in damages to the company.
No official records are generally kept of such incidences, and the information provided consisted of estimates given by the respective employers.
The research has shown that out of the 1200 employers interviewed, a total of 156 companies (13%) did come across non-injury accidents during 2010. When asked how many such cases were encountered, a total of 766 cases of non-injury accidents were registered among the 156 companies.
When asked to quantify the costs incurred due to the non-injury accidents, the majority of employers (57.1%) said it resulted in up to €500 in damages, followed by another 20.5% who said it resulted in between €501 - €2,000 in damages.

OCCUPATIONAL HEALTH AND SAFETY IN MALTA - A SNAPSHOT OF PREVAILING STANDARDS
160
Figure 7.68 Costs of Non-Injury Accidents(The Y-axis depicts percentages)
0
10
20
30
40
50
60
€0 to €500
€501 to € 2,000
€2,001 to € 5,000
€5,001 to € 10,000
€10,001 to €15,000
€20,001 to €30,000
More than € 30,000
Don't know
7.11TerminationofEmploymentasaResultofInjury/Ill-healthEmployers were also asked whether any employees who sustained some form of occupational injury, physical ill-health, or psychological ill-health had to give up work as a result of such injury or ill-health. Results indicate that from the 1,200 companies interviewed, 19 employees gave up their job as a result of occupational injuries; 5 employees due to physical ill-health; and 3 employees due to work-related stress.
7.12 Investigation of Accidents at Work7.12.1 Investigation of AccidentsEmployers were asked whether any accidents leading to some kind of injury or ill-health are investigated. Results show that 58.2% of employers confirmed that such accidents are investigated, whilst 15.6% said they are not. One can also note that 26.1% were not sure whether they were investigated or not.
When assessing the various sectors one can identify a strong commitment within the ‘Public administration’ sector whereby all accidents are investigated. The ‘Health and social work’ sector registered 73.9%, followed closely by the ‘Financial intermediation, real estate & renting; and business activities’ sector and the ‘Hotels & restaurants’ sector with 72.3% and 72% respectively. On the other hand, results indicate that within the ‘Wholesale & retail trade; and repairs’ sector the lowest percentage of investigated accidents occur – 47.4%.

OCCUPATIONAL HEALTH AND SAFETY IN MALTA - A SNAPSHOT OF PREVAILING STANDARDS
161
Figure 7.69 Investigation of Accidents - by Industry Sector(The Y-axis depicts percentages)
0
10
20
30
40
50
60
70
80
90
100Ye
s
No
Don
't kn
ow
Manufacturing; Agriculture, hunting & forestry; Electricity, gas & water supply
Construction, Mining and quarrying
Wholesale & Retail trade, repairs
Hotels & Restaurants
Transport, Storage and Communications
Financial intermediation, Real Estate & Renting and Business activities
Public administration; compulsory social security
Education
Health and social work
Other community, social and personal service activities
In terms of company size, results show a stronger tendency to investigate accidents as the company size increases, with companies with over 500 employees registering 100%, whilst micro companies registering 53.4%.

OCCUPATIONAL HEALTH AND SAFETY IN MALTA - A SNAPSHOT OF PREVAILING STANDARDS
162
Figure 7.70 Investigation of Accidents - by Company Size(The Y-axis depicts percentages)
0
10
20
30
40
50
60
70
80
90
100Ye
s
No
Don
't kn
ow
1 - 9 employees
10 - 49 employees
50 - 249 employees
250 - 499 employees
500 employees or more
7.12.2 Communication of Investigation of AccidentsAmidst those employers who confirmed that accidents were investigated, in the majority of cases (91.1%), the results of such investigations were communicated to the employees.
In the ‘Health & social work’ sector this was done for every case, and as results indicate, the ‘Transport, storage, and communications’ sector also registered a very positive result – 96.8%
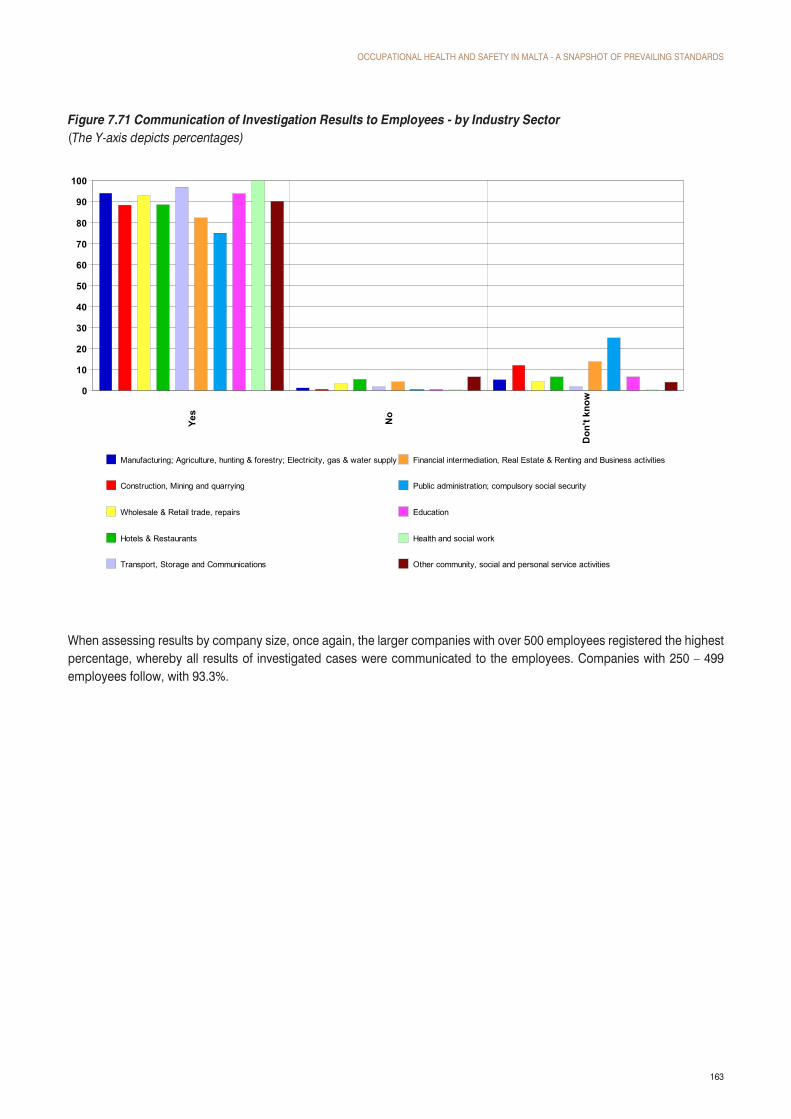
OCCUPATIONAL HEALTH AND SAFETY IN MALTA - A SNAPSHOT OF PREVAILING STANDARDS
163
Figure 7.71 Communication of Investigation Results to Employees - by Industry Sector(The Y-axis depicts percentages)
0
10
20
30
40
50
60
70
80
90
100Ye
s
No
Don
't kn
ow
Manufacturing; Agriculture, hunting & forestry; Electricity, gas & water supply
Construction, Mining and quarrying
Wholesale & Retail trade, repairs
Hotels & Restaurants
Transport, Storage and Communications
Financial intermediation, Real Estate & Renting and Business activities
Public administration; compulsory social security
Education
Health and social work
Other community, social and personal service activities
When assessing results by company size, once again, the larger companies with over 500 employees registered the highest percentage, whereby all results of investigated cases were communicated to the employees. Companies with 250 – 499 employees follow, with 93.3%.

OCCUPATIONAL HEALTH AND SAFETY IN MALTA - A SNAPSHOT OF PREVAILING STANDARDS
164
Figure 7.72 Communication of Investigation Results to Employees - by Company Size(The Y-axis depicts percentages)
0
10
20
30
40
50
60
70
80
90
100
Yes
No
Don
'tkn
ow
1 - 9 employees
10 - 49 employees
50 - 249 employees
250 - 499 employees
500 employees or more
7.12.3 Remedial Action TakenThe survey also set out to assess whether remedial action was generally taken to avoid the accident repeating itself. The results show that 63.1% said remedial action was taken, whilst 30% could not verify whether such action was taken, and 6.9% said that no action was taken whatsoever. The public administration’ sector and the ‘Health and social work’ sector registered the highest percentages of employers who said action was taken – 87.5% and 87% respectively. On the other hand the ‘Wholesale & retail trade; repairs’ sector registered the lowest percentage – 53.6%

OCCUPATIONAL HEALTH AND SAFETY IN MALTA - A SNAPSHOT OF PREVAILING STANDARDS
165
Figure 7.73 Remedial Action Taken - by Industry Sector(The Y-axis depicts percentages)
0
10
20
30
40
50
60
70
80
90Ye
s
No
Don
't kn
ow
Manufacturing; Agriculture, hunting & forestry; Electricity, gas & water supply
Construction, Mining and quarrying
Wholesale & Retail trade, repairs
Hotels & Restaurants
Transport, Storage and Communications
Financial intermediation, Real Estate & Renting and Business activities
Public administration; compulsory social security
Education
Health and social work
Other community, social and personal service activities
As results indicate (Figure 7.74), one can note a direct influence between company size and taking remedial action to avoid an accident repeating itself. Whilst companies with 500 employees and over show a 100% result whereby remedial action was taken, this drops to 58.7% in companies with 1 – 9 employees.

OCCUPATIONAL HEALTH AND SAFETY IN MALTA - A SNAPSHOT OF PREVAILING STANDARDS
166
Figure 7.74 Remedial Action Taken - by Company Size(The Y-axis depicts percentages)
0
10
20
30
40
50
60
70
80
90
100Ye
s
No
Don
't kn
ow
1 - 9 employees
10 - 49 employees
50 - 249 employees
250 - 499 employees
500 employees or more
7.13 Shifts in Number of Accidents at WorkEmployers who whose workers suffered any injuries or cases of ill-health over the past 5 years were asked whether the number of accidents within the company increased, decreased or remained rather constant. When assessing the different categories of injuries or ill-health, one can note that in the majority of cases, employers said that the incidences remained rather constant. However, it is worth noting that a considerable percentage also stated that they decrease, especially in the case of occupational injuries (41.6%).
It is also worth noting that when assessing the percentages of employers who stated that the occurrences have increased, cases of psychological ill-health registered the highest percentage (4.6%).

OCCUPATIONAL HEALTH AND SAFETY IN MALTA - A SNAPSHOT OF PREVAILING STANDARDS
167
Figure 7.75 Shifts in Work Related Injuries and Ill-Health Over the Past 5 Years(The Y-axis depicts percentages)
0
10
20
30
40
50
60
70In
crea
sed
Rem
aine
dco
nsta
nt
Dec
reas
ed
Occupational Injuries
Physical Ill-Health
Psychological Ill-Health
When assessing occupational injuries, results show that whilst 57.3% of respondents said that this remained rather constant, a substantial percentage said that the number of injuries decreased. This was especially so in the ‘Education’ sector and the ‘Construction, mining and quarrying’ sector registering 58.3% and 53.3% respectively. The percentage of employers who said these injuries increased is very minimal – showing only 1%.

OCCUPATIONAL HEALTH AND SAFETY IN MALTA - A SNAPSHOT OF PREVAILING STANDARDS
168
Figure 7.75 Shifts in Occupational Injuries Over the Past 5 Years - by Industry Sector(The Y-axis depicts percentages)
0
10
20
30
40
50
60
70
80
90In
crea
sed
Rem
aine
dco
nsta
nt
Dec
reas
ed
Manufacturing; Agriculture, hunting & forestry; Electricity, gas & water supply
Construction, Mining and quarrying
Wholesale & Retail trade, repairs
Hotels & Restaurants
Transport, Storage and Communications
Financial intermediation, Real Estate & Renting and Business activities
Public administration; compulsory social security
Education
Health and social work
Other community, social and personal service activities
When assessing cases physical ill-health, in the majority of cases (66.8%) there were no shifts in the number of incidences over the past 5 years. On the other hand, 31.9% stated that these incidences decreased, whilst 1.3% said that they actually increased.
The highest decrease can be seen within the ‘Education’ sector – 47.8%, followed by the ‘Transport, storage, and communications’ sector with 44.2%.

OCCUPATIONAL HEALTH AND SAFETY IN MALTA - A SNAPSHOT OF PREVAILING STANDARDS
169
Figure 7.76 Shifts in Cases of Physical Ill-Health Over the Past 5 Years by Industry Sector(The Y-axis depicts percentages)
0
10
20
30
40
50
60
70
80
90In
crea
sed
Rem
aine
dco
nsta
nt
Dec
reas
ed
Manufacturing; Agriculture, hunting & forestry; Electricity, gas & water supply
Construction, Mining and quarrying
Wholesale & Retail trade, repairs
Hotels & Restaurants
Transport, Storage and Communications
Financial intermediation, Real Estate & Renting and Business activities
Public administration; compulsory social security
Education
Health and social work
Other community, social and personal service activities
When assessing shifts in the number of cases of psychological ill health, and comparing these to the number of physical injuries and physical ill-health, one can note a slightly higher percentage of employers who stated that these cases increased over the past 5 years – 4.6%. Nonetheless, the majority of employers (69.2%) said that there was no shift in such cases, whilst 26.2% said that cases of psychological ill health decreased.
Taking a closer look at the various sectors, results show that in the case of the ’Health & social work’ sector, results show a higher percentage of employers who said these cases increased (16.7%), when compared to those who said they decreased (8.3%). The ‘Education’ sector on the other hand registered the highest percentage of employers who said that such cases decreased – 50%.

OCCUPATIONAL HEALTH AND SAFETY IN MALTA - A SNAPSHOT OF PREVAILING STANDARDS
170
Figure 7.77 Shifts in Cases of Psychological Ill-Health Over the Past 5 Years – by Industry Sector(The Y-axis depicts percentages)
0
10
20
30
40
50
60
70
80
90In
crea
sed
Rem
aine
dco
nsta
nt
Dec
reas
ed
Manufacturing; Agriculture, hunting & forestry; Electricity, gas & water supply
Construction, Mining and quarrying
Wholesale & Retail trade, repairs
Hotels & Restaurants
Transport, Storage and Communications
Financial intermediation, Real Estate & Renting and Business activities
Public administration; compulsory social security
Education
Health and social work
Other community, social and personal service activities
7.14 Legal Responsibility for OHSThe research also attempted to identify the perception of legal responsibility for ensuring health & safety at work. The vast majority of employers (92.1%) said that the employer is the person who is legally responsible for ensuring the occupational health and safety of his/her employees at the place of work. Another 46.5% also claimed that the employees themselves are also legally responsible, whilst 5% referred to the OHSA. Further analysis also reveals that 0.4% said that OHSA is solely responsible for OHS, whilst 7.9% excluded the employer completely for any responsibility for OHS.
The sector which registered the least claims that the employer is legally responsible is the ‘Construction, mining & quarrying’ sector where 81.6% stated so. The ‘Wholesale and retail trade; and repairs’ sector follows with 89.9%.

OCCUPATIONAL HEALTH AND SAFETY IN MALTA - A SNAPSHOT OF PREVAILING STANDARDS
171
Table 7.78 Perceived Legal Responsibility for OHS - by Industry Sector
CountsAnalysis %Respondents
Total
Total
EmployerEmployeesthemselves OHSA Unions Other
Manufacturing; Agriculture,hunting & forestry; Electricity,gas & water supply
Construction, Mining andquarrying
Wholesale & Retail trade, repairs
Hotels & Restaurants
Transport, Storage andCommunications
Financial intermediation, RealEstate & Renting and Businessactivities
Public administration;compulsory social security
Education
Health and social work
Other community, social andpersonal service activities
1200 110592.1%
55846.5%
605.0%
201.7%
252.1%
173 16092.5%
9554.9%
42.3%
42.3%
42.3%
49 4081.6%
2653.1%
24.1%
12.0%
12.0%
416 37489.9%
18143.5%
153.6%
30.7%
81.9%
132 12090.9%
5843.9%
129.1%
21.5%
53.8%
115 10692.2%
5749.6%
32.6%
21.7%
21.7%
101 9594.1%
4645.5%
76.9%
22.0%
33.0%
8 8100.0%
450.0%
112.5%
112.5%
112.5%
65 65100.0%
2335.4%
57.7%
23.1%
11.5%
23 2295.7%
1043.5%
--
--
--
118 11597.5%
5849.2%
119.3%
32.5%
--

OCCUPATIONAL HEALTH AND SAFETY IN MALTA - A SNAPSHOT OF PREVAILING STANDARDS
172
This Chapter and the costing
methodology have been based
on the methodology used by the Health
and Safety Executive to estimate
the cost to the nation of occupational
injuries and ill-health in the United
Kingdom (HSE, 1999)
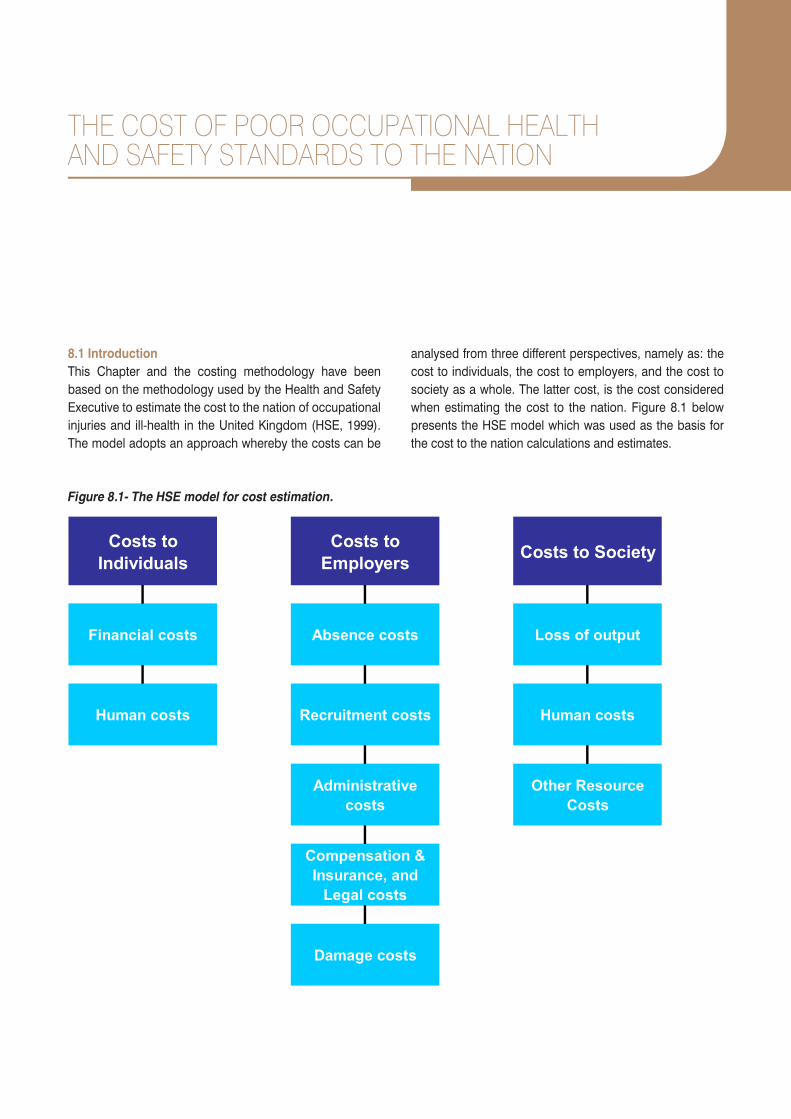
Figure 8.1- The HSE model for cost estimation.
Compensation & Insurance, and
Legal costs
Damage costs
Human costs Recruitment costs Human costs
Administrative costs
Other Resource Costs
Costs to Individuals
Costs to Employers Costs to Society
Financial costs Absence costs Loss of output
THE COST OF POOR OCCUPATIONAL HEALTH AND SAFETY STANDARDS TO THE NATION
8.1 Introduction This Chapter and the costing methodology have been based on the methodology used by the Health and Safety Executive to estimate the cost to the nation of occupational injuries and ill-health in the United Kingdom (HSE, 1999). The model adopts an approach whereby the costs can be
analysed from three different perspectives, namely as: the cost to individuals, the cost to employers, and the cost to society as a whole. The latter cost, is the cost considered when estimating the cost to the nation. Figure 8.1 below presents the HSE model which was used as the basis for the cost to the nation calculations and estimates.

OCCUPATIONAL HEALTH AND SAFETY IN MALTA - A SNAPSHOT OF PREVAILING STANDARDS
174
The year 2010 was used as a base year for all calculations in the costing analysis. The following subsections present the detailed analysis of the cost under each of these groups of costs based on the findings of the surveys carried out by the Research Consultants in June-August 2011, data from the National Statistics Office, personal interviews with key stakeholders and other sources of reliable data. Nevertheless, due to the lack of data about certain cost categories a number of assumptions and estimates had to be made. All of these assumptions and approximations are outlined and explained in this chapter. The lack of data available, has resulted in a rather conservative approach being taken when estimating costs in certain cases, and therefore one must exercise caution when comparing the
overall cost to the economy with similar studies conducted abroad.
In all of the following cost calculations, workers engaged in the police, civil protection and fisheries have been excluded.
8.2 Costs to Individuals UK’s Health and Safety Executive divides the costs to individuals into 2 major groups – financial costs and ‘human costs’, such as pain, grief and other suffering that the affected individuals and their families have to go through as a result of the occupational injuries or ill-health of the victim.
Figure 8.2 - Cost to Individuals
In all of the following cost calculations, workers engaged in the police, civil protection and fisheries have been excluded. 8.2 Costs to Individuals
UK’s Health and Safety Executive divides the costs to individuals into 2 major groups – financial costs and ‘human costs’, such as pain, grief and other suffering that the affected individuals and their families have to go through as a result of the occupational injuries or ill-health of the victim.
Figure 8.2 - Cost to Individuals
In Malta, as in the UK, there is no data available about the people who have had to change jobs due to an occupational injury or illness, therefore the cost of lower income in the new job could not be approximated and the overall cost to individuals may be actually lower than if these costs were included. Hence, for the purpose of this analysis a distinction is made only between those workers who have returned to work with the same employer (assuming they have retained the same job with the same earnings) and those who have had to give up work permanently and rely on government disability and invalidity pensions (‘boarded out’ workers). Furthermore, in the following calculations no distinction could be made between employees and self-employed workers due to scarce data, and it is assumed that they incur the same losses. However, the self-employed are entitled to the same benefits from
Costs to
Individuals
Financial
Costs
Loss of income
Extra Expenditure
Human costs
(pain, grief, suffering)
Extra Travel to Hospital (less
reduced cost to travel to work)
-
Higher shopping bills
-
Extra purchase of medicines
€420,000
Lost basic pay
€255,000
Part-time, overtime,
bonuses etc
€2,450,000

OCCUPATIONAL HEALTH AND SAFETY IN MALTA - A SNAPSHOT OF PREVAILING STANDARDS
175
In Malta, as in the UK, there is no data available about the people who have had to change jobs due to an occupational injury or illness, therefore the cost of lower income in the new job could not be approximated and the overall cost to individuals may be actually lower than if these costs were included.
Hence, for the purpose of this analysis a distinction is made only between those workers who have returned to work with the same employer (assuming they have retained the same job with the same earnings) and those who have had to give up work permanently and rely on government disability and invalidity pensions (‘boarded out’ workers). Furthermore, in the following calculations no distinction could be made between employees and self-employed workers due to scarce data, and it is assumed that they incur the same losses. However, the self-employed are entitled to the same benefits from the Social Security Department in case of occupational injuries and ill-health so the impact of this assumption is unlikely to be significant.
For the workers who continued on their job after recovering, it is necessary to estimate the number of days lost from work in order to calculate the loss of income. The total number of days lost from work due to injuries and ill-health is presented in the tables below. Tables 8.1 and 8.2 present the results from the survey with employees, and take into account only the cases in which the respondent had a
certificate that their injury or ill-health was an occupational one. Table 8.1 includes days taken as injury leave due to injuries, physical ill-health and psychological ill-health and Table 8.2 shows the total number of cases where a worker took sick leave as a direct result of occupational injuries and ill-health. These extrapolated figures are based on the total number of employees according to the Labour Force Survey published by the NSO for Q4/2010 (NSO, 2011) – 161,610 employees.
8.2.1 Financial CostsFor both the ‘boarded out’ workers and those who returned to their workplace after their absence, the financial costs can be divided into loss of income and extra expenditure (HSE, 1999).
8.2.2 Loss of Income This category of costs includes the income that individuals would have earned had they not got injured or sick at work – their pay from wages, bonuses, overtime, part-time and other lost income. In order to examine the difference of employees’ income at work with that when not at work, it is assumed that when at work they receive the average wage for their designation, and when not at work they are entitled to a partial or full wage, as well as social benefits as applicable. The loss of income to individuals is calculated as the difference between the income when working and the income when absent from work.
Table 8.1 - Days lost due to injuries and ill-health taken as injury leave (certified occupational injuries and ill-health only)
Days Lost
1-4 days
5-10 days
11-15 days
16-20 days
21-30 days
31-40 days
41-50 days
51-75 days
76-100 days
101+ days
Total 706 1411 504 202 403 202 504 0 202 101
Table 8.2 - Days lost due to injuries and ill-health taken as sick leave (certified occupational injuries and ill-health only)
Days Lost 1-4 days 5-15
days16-30 days
31-40 days
41-50 days
51-75 days
76-100 days
101+ days
Total 6351 2722 101 101 0 0 0 0
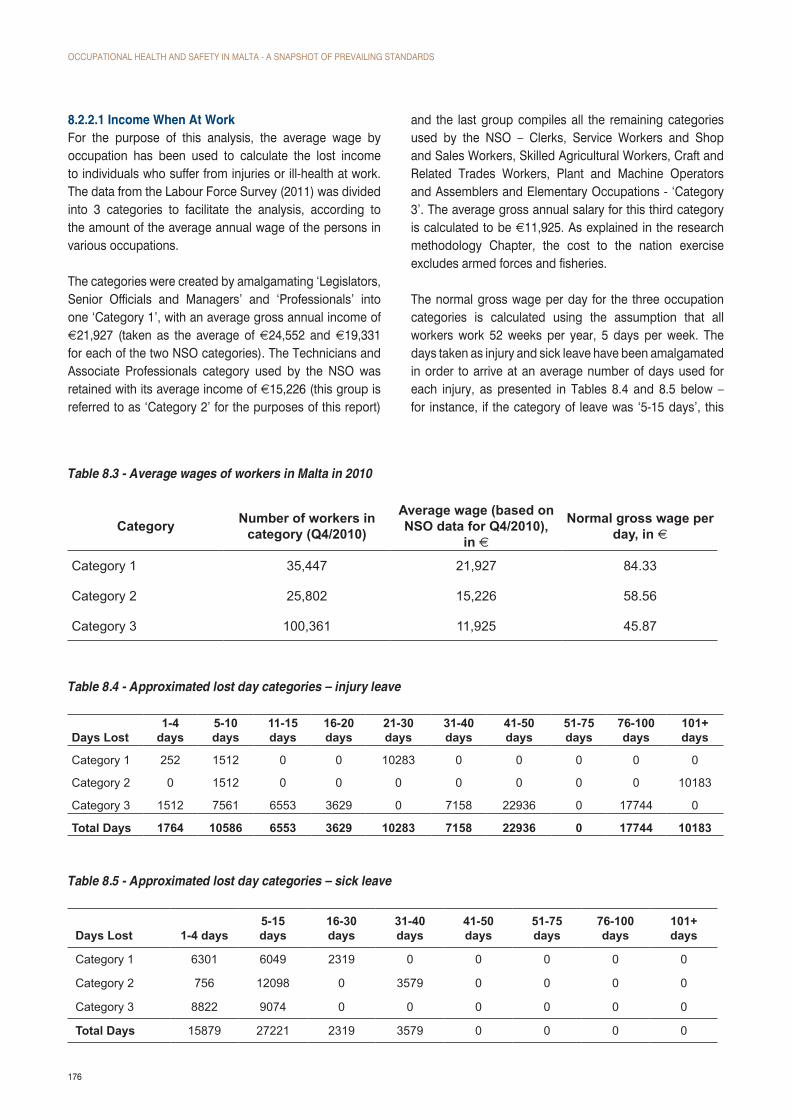
OCCUPATIONAL HEALTH AND SAFETY IN MALTA - A SNAPSHOT OF PREVAILING STANDARDS
176
8.2.2.1 Income When At Work For the purpose of this analysis, the average wage by occupation has been used to calculate the lost income to individuals who suffer from injuries or ill-health at work. The data from the Labour Force Survey (2011) was divided into 3 categories to facilitate the analysis, according to the amount of the average annual wage of the persons in various occupations.
The categories were created by amalgamating ‘Legislators, Senior Officials and Managers’ and ‘Professionals’ into one ‘Category 1’, with an average gross annual income of €21,927 (taken as the average of €24,552 and €19,331 for each of the two NSO categories). The Technicians and Associate Professionals category used by the NSO was retained with its average income of €15,226 (this group is referred to as ‘Category 2’ for the purposes of this report)
Table 8.3 - Average wages of workers in Malta in 2010
Category Number of workers in category (Q4/2010)
Average wage (based on NSO data for Q4/2010),
in €
Normal gross wage per day, in €
Category 1 35,447 21,927 84.33
Category 2 25,802 15,226 58.56
Category 3 100,361 11,925 45.87
Table 8.4 - Approximated lost day categories – injury leave
Days Lost1-4
days5-10 days
11-15 days
16-20 days
21-30 days
31-40 days
41-50 days
51-75 days
76-100 days
101+ days
Category 1 252 1512 0 0 10283 0 0 0 0 0
Category 2 0 1512 0 0 0 0 0 0 0 10183
Category 3 1512 7561 6553 3629 0 7158 22936 0 17744 0
Total Days 1764 10586 6553 3629 10283 7158 22936 0 17744 10183
Table 8.5 - Approximated lost day categories – sick leave
Days Lost 1-4 days5-15 days
16-30 days
31-40 days
41-50 days
51-75 days
76-100 days
101+ days
Category 1 6301 6049 2319 0 0 0 0 0
Category 2 756 12098 0 3579 0 0 0 0
Category 3 8822 9074 0 0 0 0 0 0
Total Days 15879 27221 2319 3579 0 0 0 0
and the last group compiles all the remaining categories used by the NSO – Clerks, Service Workers and Shop and Sales Workers, Skilled Agricultural Workers, Craft and Related Trades Workers, Plant and Machine Operators and Assemblers and Elementary Occupations - ‘Category 3’. The average gross annual salary for this third category is calculated to be €11,925. As explained in the research methodology Chapter, the cost to the nation exercise excludes armed forces and fisheries.
The normal gross wage per day for the three occupation categories is calculated using the assumption that all workers work 52 weeks per year, 5 days per week. The days taken as injury and sick leave have been amalgamated in order to arrive at an average number of days used for each injury, as presented in Tables 8.4 and 8.5 below – for instance, if the category of leave was ‘5-15 days’, this
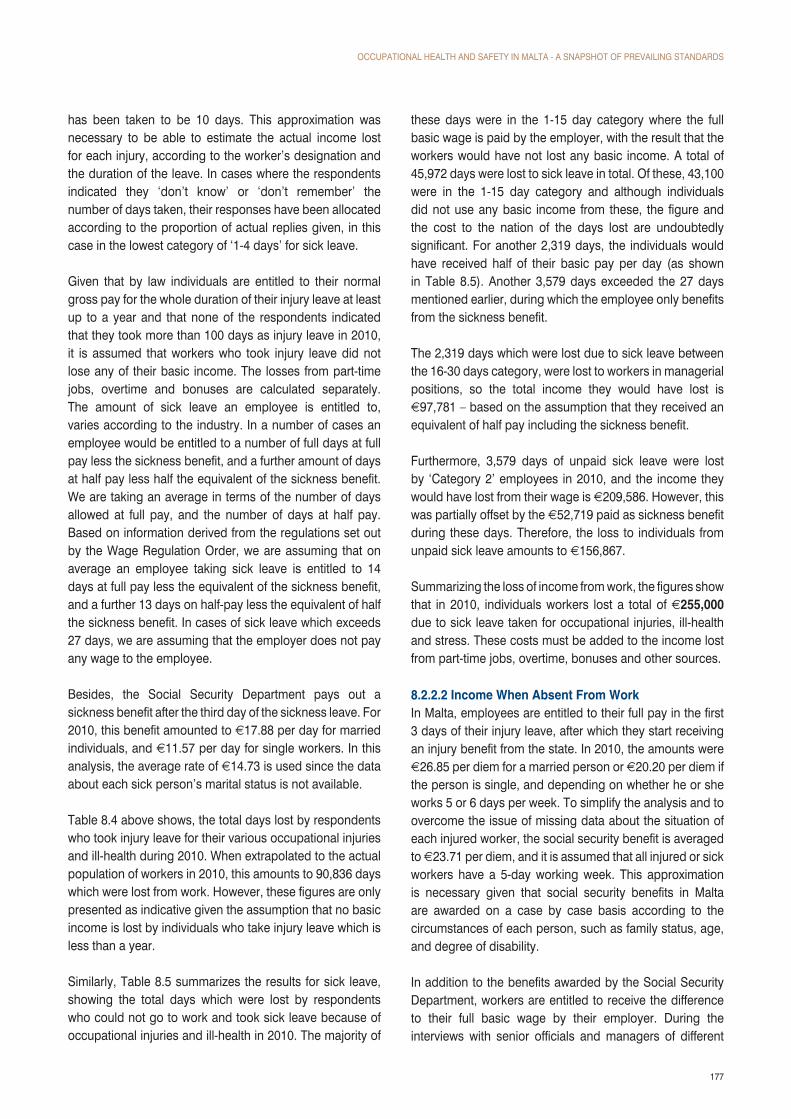
OCCUPATIONAL HEALTH AND SAFETY IN MALTA - A SNAPSHOT OF PREVAILING STANDARDS
177
has been taken to be 10 days. This approximation was necessary to be able to estimate the actual income lost for each injury, according to the worker’s designation and the duration of the leave. In cases where the respondents indicated they ‘don’t know’ or ‘don’t remember’ the number of days taken, their responses have been allocated according to the proportion of actual replies given, in this case in the lowest category of ‘1-4 days’ for sick leave.
Given that by law individuals are entitled to their normal gross pay for the whole duration of their injury leave at least up to a year and that none of the respondents indicated that they took more than 100 days as injury leave in 2010, it is assumed that workers who took injury leave did not lose any of their basic income. The losses from part-time jobs, overtime and bonuses are calculated separately. The amount of sick leave an employee is entitled to, varies according to the industry. In a number of cases an employee would be entitled to a number of full days at full pay less the sickness benefit, and a further amount of days at half pay less half the equivalent of the sickness benefit. We are taking an average in terms of the number of days allowed at full pay, and the number of days at half pay. Based on information derived from the regulations set out by the Wage Regulation Order, we are assuming that on average an employee taking sick leave is entitled to 14 days at full pay less the equivalent of the sickness benefit, and a further 13 days on half-pay less the equivalent of half the sickness benefit. In cases of sick leave which exceeds 27 days, we are assuming that the employer does not pay any wage to the employee.
Besides, the Social Security Department pays out a sickness benefit after the third day of the sickness leave. For 2010, this benefit amounted to €17.88 per day for married individuals, and €11.57 per day for single workers. In this analysis, the average rate of €14.73 is used since the data about each sick person’s marital status is not available.
Table 8.4 above shows, the total days lost by respondents who took injury leave for their various occupational injuries and ill-health during 2010. When extrapolated to the actual population of workers in 2010, this amounts to 90,836 days which were lost from work. However, these figures are only presented as indicative given the assumption that no basic income is lost by individuals who take injury leave which is less than a year.
Similarly, Table 8.5 summarizes the results for sick leave, showing the total days which were lost by respondents who could not go to work and took sick leave because of occupational injuries and ill-health in 2010. The majority of
these days were in the 1-15 day category where the full basic wage is paid by the employer, with the result that the workers would have not lost any basic income. A total of 45,972 days were lost to sick leave in total. Of these, 43,100 were in the 1-15 day category and although individuals did not use any basic income from these, the figure and the cost to the nation of the days lost are undoubtedly significant. For another 2,319 days, the individuals would have received half of their basic pay per day (as shown in Table 8.5). Another 3,579 days exceeded the 27 days mentioned earlier, during which the employee only benefits from the sickness benefit.
The 2,319 days which were lost due to sick leave between the 16-30 days category, were lost to workers in managerial positions, so the total income they would have lost is €97,781 – based on the assumption that they received an equivalent of half pay including the sickness benefit.
Furthermore, 3,579 days of unpaid sick leave were lost by ‘Category 2’ employees in 2010, and the income they would have lost from their wage is €209,586. However, this was partially offset by the €52,719 paid as sickness benefit during these days. Therefore, the loss to individuals from unpaid sick leave amounts to €156,867.
Summarizing the loss of income from work, the figures show that in 2010, individuals workers lost a total of €255,000 due to sick leave taken for occupational injuries, ill-health and stress. These costs must be added to the income lost from part-time jobs, overtime, bonuses and other sources.
8.2.2.2 Income When Absent From Work In Malta, employees are entitled to their full pay in the first 3 days of their injury leave, after which they start receiving an injury benefit from the state. In 2010, the amounts were €26.85 per diem for a married person or €20.20 per diem if the person is single, and depending on whether he or she works 5 or 6 days per week. To simplify the analysis and to overcome the issue of missing data about the situation of each injured worker, the social security benefit is averaged to €23.71 per diem, and it is assumed that all injured or sick workers have a 5-day working week. This approximation is necessary given that social security benefits in Malta are awarded on a case by case basis according to the circumstances of each person, such as family status, age, and degree of disability.
In addition to the benefits awarded by the Social Security Department, workers are entitled to receive the difference to their full basic wage by their employer. During the interviews with senior officials and managers of different

OCCUPATIONAL HEALTH AND SAFETY IN MALTA - A SNAPSHOT OF PREVAILING STANDARDS
178
firms, it transpired that there are two basic arrangements that are made between the employer and the workers in practice: the employee either gets the full wage from the employer for the duration of the injury leave and then gives any cheques received by the DSS to the employer; or else the employer immediately deducts the amount of social security benefit that the employee may receive from the wage paid. In both cases, by law the employees are entitled to their full basic wage when the amounts paid by the employer and the DSS are added up, and it is assumed that there are no exceptions to this rule.
Therefore, employees who take injury leave only lose income from overtime, benefits, bonuses and part-time jobs. Table 8.6 presents the losses reported by respondents in the Employee survey during 2010. A total of 1.9% of the 1603 respondents reported losing income due to occupational injuries and ill-health which were certified as caused by work during 2010. The majority lost up to €200 (48% of the respondents) and only a few lost over €200. None of the workers stated that they have lost over €5,000 during 2010.
Based on the findings of the survey the results indicate that the nation’s workers lost an average of €2,450,000 due to occupational injuries and ill-health where it was certified that the condition was actually caused by work.
Table 8.6 - Lost income due to occupational injuries and ill-health during 2010
Lost Income %
€0-€100 22.6
€101-€200 25.8
€201-€500 16.1
€501-€1000 12.9
€1001-€3000 16.1
€3001-€5000 6.5
€5001+ 0.0
The data from the Social Security Department shows that the number of workers who have been awarded invalidity (disability) pensions during 2010 was 391. However, the Department does not have any data on how many of these workers have been ‘boarded out’ due to injuries and ill-health caused by their work. Without such data,
no assumption can be made as to the proportion of workers which should be included in the cost to the nation calculations and in the future, it is necessary that such data is made available to the Department if more realistic estimations are to be made. Were the data available, it would be possible to follow the approach used by the HSE and calculate the average age at which the injured persons had to stop working. The age is then used to estimate the number of lost years (in days) for each person, assuming that they would have worked till the state pension age were they not ‘boarded out’. Finally, the net present value of the workers’ future earnings is calculated to bring them to their realistic cost at the time of the estimation. All this would give a realistic figure, were more detailed data about the boarded out workers collected. Undoubtedly, the amount of lost income to boarded out workers would increase the overall cost to the nation significantly as was the case in the United Kingdom.
8.2.2.3 Extra Expenditure Workers who are sick or injured because of work may have to incur additional expenses, apart from the income they lose because of their condition. The HSE (1999) has identified several factors that may influence such extra expenditure: increased shopping bills, purchase of medicines, extra costs for travelling to hospital or clinics and reduced cost of travelling to work. These items are discussed and quantified as far as possible below.
8.2.2.3.1 Extra Purchases of Medicines An assumption is made that all those who got injured at work in 2010 needed one prescription at a unit cost of €15, and the conservative approach of calculating the costs only where it was certified that the person’s injury was caused by work is retained. Similarly, a €15 prescription to cover for painkillers and similar standard medicines is assumed for all those who suffered from certified occupational ill-health in 2010. For stress, the cost of the prescription is assumed to be €30 on average, given the higher cost of anti-depressant and similar medicines and the longer duration of the treatment required.
Extrapolating the figures from the employee survey, it results that there were 6,452 workers with an occupational injury, 6,654 with occupational ill-health, and 7,460 with stress caused by work in 2010. To keep the results comparable with those of the HSE, only the first case of injury or ill-health is taken into account if a person suffered from more than one problem in 2010. The costs are therefore €96,780 in prescriptions for injuries, €99,810 for ill-health, and €223,800 for stress. In contrast to the approach adopted by the HSE, no extra prescriptions are assumed for those

OCCUPATIONAL HEALTH AND SAFETY IN MALTA - A SNAPSHOT OF PREVAILING STANDARDS
179
who were absent from work for more than 3 days due to an injury or more than 5 days due ill-health, because the indicative price of the prescription includes sufficient amount of the medicine for a 1-2 week course of treatment. Therefore, the total extra expenditure for medicines incurred by individuals who suffered occupational injuries, ill-health or stress is estimated at €420,000.
The costs of other medical interventions and the hospital stay as in-patient, out-patient or in rehabilitation are assumed to be free to the individual due to the health care system in Malta. These costs are instead included in the costs to society as a whole.
8.2.2.3.2 Impacts on Travel Costs Given the small size of Malta, it is assumed that the difference in travel expenses when absent from work and when going to work is negligible. Furthermore, it is assumed that the extra expenses to travel to a hospital or clinic for check ups and treatment are offset by the savings from not travelling to work.
8.2.2.3.3IncreasesinShoppingBillsThe HSE has considered the impact of increased expenses due to shopping bills for all those who got injured or sick and therefore had to shop from closer places which might have higher prices than bigger shops situated further away from the persons’ homes. However, considering the small size of Malta and the rather equal distribution of large supermarkets on the territory of the island, the impact of increased shopping bills is considered to be insignificant for the purposes of this analysis.
The value of lost household production is another factor that could not be estimated and is therefore not included in the total figure of cost to individuals. This relates specifically to the value of unpaid work since lost household production is also an economic cost. It is possible that injured or sick individuals cannot go about their daily housework due to their condition and this would increase the total figure.
8.2.3 ‘Human Costs’ The human costs include the loss in quality of life and general welfare of the injured or sick workers and their families and friends (HSE, 1999). These costs are related to the physical pain and suffering of the injured or sick person, the worry and concern of friends and relatives, the grieving in the case of fatalities or serious injuries and sicknesses, and the inability to participate in leisure and social activities, among others. Moreover, there are the costs for friends and relatives who might have to give up their social or work life to take care of the sick or injured.
These costs are extremely difficult to estimate, given that they are subjective in nature and cannot be quantified in a straightforward way as financial costs can. Although the HSE has considered court awards and willingness to pay (WTP) economic models to assess the possible cost of human suffering, all the available methods are shown to have serious limitations. Moreover, it is extremely difficult to estimate the number of deaths due to occupational ill-health, given that several of them may occur several years after the person has stopped working, and that insufficient links can be made between exposure to health hazards at work and death. Therefore, it was not possible to present a realistic estimate of the ‘human costs’ incurred by individuals as a direct result of the current levels of health and safety in Malta.
8.2 Cost To Employers This Section looks at the costs to employers of occupational injuries and non-injury accidents, as well as of physical ill-health and psychological ill-health. The analysis is based on the costs incurred during 2010. Based on the Health and Safety Executive (HSE) model adopted in the UK, when assessing the costs of injuries and ill-health at work, there are five predominant costs involved in the calculation, namely:• Absence Costs• Administrative Costs• Recruitment Costs• Damage to materials and equipment from Injuries &
non-injuries• Compensation and insurance costs, and legal costs
Some of the costs could not be quantified, partly due to lack of data and partly due to the somewhat intangible nature of the cost. These include for instance:• reduced productivity, as a result of injuries or
absenteeism• loss of goodwill and reputation of the firm with its
workforce, customers and the local community

OCCUPATIONAL HEALTH AND SAFETY IN MALTA - A SNAPSHOT OF PREVAILING STANDARDS
180
Data Sources & InformationThe main data relating to the number of occupational injuries and work related ill-health, as well as the days lost due to such injuries is mainly based on statistics collected by means of two national surveys carried out within the context of this study, targeting both employers and employees. These two surveys were carried out during 2011, therefore allowing the collection of the necessary information pertaining to the occurrences of work related injuries and ill-health during 2010. The data collected from these surveys also provided the necessary information relating to damages incurred from injuries or non-injury accidents, as well as information relating to the employer’s liability insurances.
Other sources also included the Labour Force Survey (LFS) 2010, the Department of Social Security, the Occupational Health and Safety Authority, and Accidents at Work releases by the National Statistics Authority.
8.2.1 Absence CostsWorkplace injuries and work-related ill health typically result in a period of absence of the affected employee, during which his contribution to production is lost. Employers can
respond to such absences in different ways. For example, the employer could:• Seek to maintain the level of output by: recruiting
temporary part-time staff, paying current employees to work overtime, or encourage increased work intensity among current employees. In this scenario, the cost of recruiting temporary staff or paying for overtime to maintain output could be expected to be approximated by the wage of the absent employee.
• Accept a decline in output equivalent to the foregone output of the absent employee. In this scenario, the cost of lost output can be expected to be approximated by the value of the incremental gross value added that would otherwise result from the work effort of the absent employee. Value added includes not just wages, but any returns to capital and other assets accruing from the productive activity.
In a study by Davies et al (1999), findings from a case study of five firms from different business sectors were used to identify assumptions on employer responses to sickness absence. This study found that on average, among the case study firms, employers compensated for the absence
Figure 8.3 - Cost to Employers
8.2 Cost To Employers
This Section looks at the costs to employers of occupational injuries and non-injury accidents, as well as of physical ill-health and psychological ill-health. The analysis is based on the costs incurred during 2010. Based on the Health and Safety Executive (HSE) model adopted in the UK, when assessing the costs of injuries and ill-health at work, there are five predominant costs involved in the calculation, namely:
Absence Costs Administrative Costs Recruitment Costs Damage to materials and equipment from Injuries & non-injuries Compensation and insurance costs, and legal costs
Some of the costs could not be quantified, partly due to lack of data and partly due to the somewhat intangible nature of the cost. These include for instance:
reduced productivity, as a result of injuries or absenteeism loss of goodwill and reputation of the firm with its workforce, customers and the local
community
Figure 8.3 - Cost to Employers
Data Sources & Information The main data relating to the number of occupational injuries and work related ill-health, as well as the days lost due to such injuries is mainly based on statistics collected by means of two national surveys carried out within the context of this study, targeting both employers and employees. These two surveys were carried out during 2011, therefore allowing the collection of the necessary information pertaining to the occurrences of work related injuries and ill-health during 2010. The data collected from these surveys also provided the necessary information
Cost to Employers
Absence Costs
€5,679,000
Administrative Costs
€234,000
Recruitment Costs
€165,000
Damage Costs
Compensation & Insurance Costs;
Legal Costs
€1,431,000
Damage from Injuries
€3,985,000
Damage from Non-injuries
€13,089,000
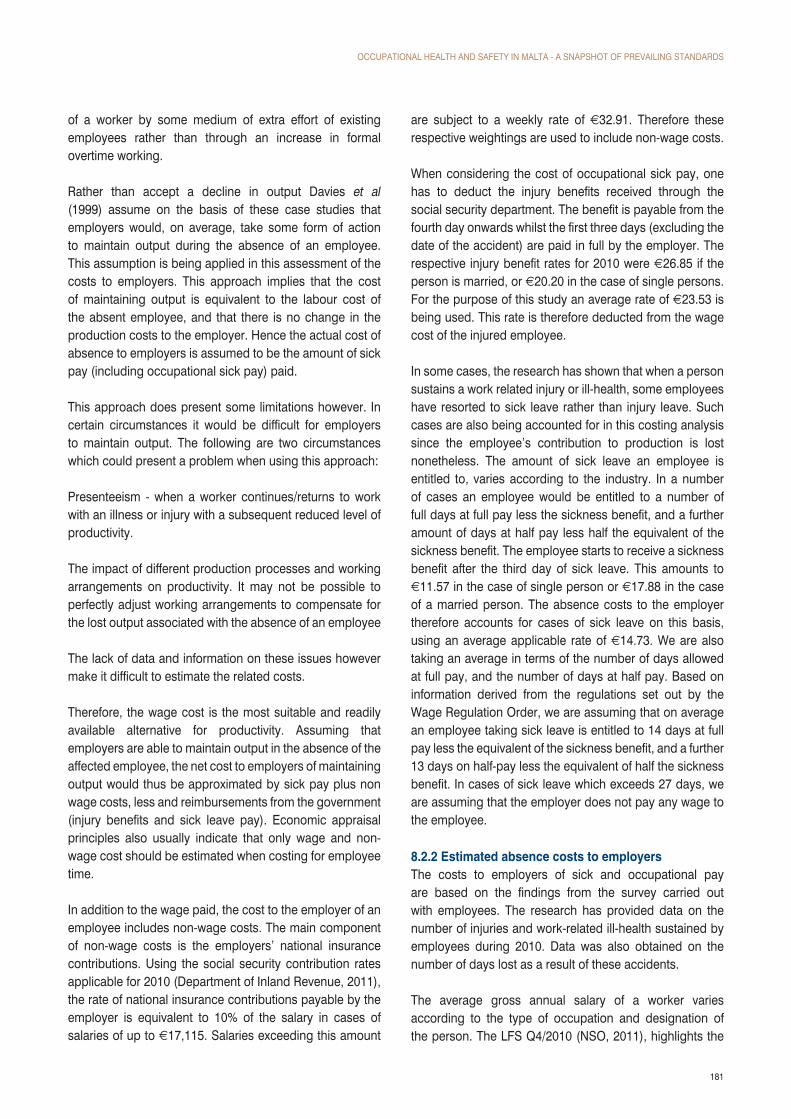
OCCUPATIONAL HEALTH AND SAFETY IN MALTA - A SNAPSHOT OF PREVAILING STANDARDS
181
of a worker by some medium of extra effort of existing employees rather than through an increase in formal overtime working.
Rather than accept a decline in output Davies et al (1999) assume on the basis of these case studies that employers would, on average, take some form of action to maintain output during the absence of an employee. This assumption is being applied in this assessment of the costs to employers. This approach implies that the cost of maintaining output is equivalent to the labour cost of the absent employee, and that there is no change in the production costs to the employer. Hence the actual cost of absence to employers is assumed to be the amount of sick pay (including occupational sick pay) paid.
This approach does present some limitations however. In certain circumstances it would be difficult for employers to maintain output. The following are two circumstances which could present a problem when using this approach:
Presenteeism - when a worker continues/returns to work with an illness or injury with a subsequent reduced level of productivity.
The impact of different production processes and working arrangements on productivity. It may not be possible to perfectly adjust working arrangements to compensate for the lost output associated with the absence of an employee
The lack of data and information on these issues however make it difficult to estimate the related costs.
Therefore, the wage cost is the most suitable and readily available alternative for productivity. Assuming that employers are able to maintain output in the absence of the affected employee, the net cost to employers of maintaining output would thus be approximated by sick pay plus non wage costs, less and reimbursements from the government (injury benefits and sick leave pay). Economic appraisal principles also usually indicate that only wage and non-wage cost should be estimated when costing for employee time.
In addition to the wage paid, the cost to the employer of an employee includes non-wage costs. The main component of non-wage costs is the employers’ national insurance contributions. Using the social security contribution rates applicable for 2010 (Department of Inland Revenue, 2011), the rate of national insurance contributions payable by the employer is equivalent to 10% of the salary in cases of salaries of up to €17,115. Salaries exceeding this amount
are subject to a weekly rate of €32.91. Therefore these respective weightings are used to include non-wage costs.
When considering the cost of occupational sick pay, one has to deduct the injury benefits received through the social security department. The benefit is payable from the fourth day onwards whilst the first three days (excluding the date of the accident) are paid in full by the employer. The respective injury benefit rates for 2010 were €26.85 if the person is married, or €20.20 in the case of single persons. For the purpose of this study an average rate of €23.53 is being used. This rate is therefore deducted from the wage cost of the injured employee.
In some cases, the research has shown that when a person sustains a work related injury or ill-health, some employees have resorted to sick leave rather than injury leave. Such cases are also being accounted for in this costing analysis since the employee’s contribution to production is lost nonetheless. The amount of sick leave an employee is entitled to, varies according to the industry. In a number of cases an employee would be entitled to a number of full days at full pay less the sickness benefit, and a further amount of days at half pay less half the equivalent of the sickness benefit. The employee starts to receive a sickness benefit after the third day of sick leave. This amounts to €11.57 in the case of single person or €17.88 in the case of a married person. The absence costs to the employer therefore accounts for cases of sick leave on this basis, using an average applicable rate of €14.73. We are also taking an average in terms of the number of days allowed at full pay, and the number of days at half pay. Based on information derived from the regulations set out by the Wage Regulation Order, we are assuming that on average an employee taking sick leave is entitled to 14 days at full pay less the equivalent of the sickness benefit, and a further 13 days on half-pay less the equivalent of half the sickness benefit. In cases of sick leave which exceeds 27 days, we are assuming that the employer does not pay any wage to the employee.
8.2.2 Estimated absence costs to employersThe costs to employers of sick and occupational pay are based on the findings from the survey carried out with employees. The research has provided data on the number of injuries and work-related ill-health sustained by employees during 2010. Data was also obtained on the number of days lost as a result of these accidents.
The average gross annual salary of a worker varies according to the type of occupation and designation of the person. The LFS Q4/2010 (NSO, 2011), highlights the

OCCUPATIONAL HEALTH AND SAFETY IN MALTA - A SNAPSHOT OF PREVAILING STANDARDS
182
average gross annual salaries of employees according to occupation. The various occupations have been grouped into 3 categories and an average wage was calculated accordingly for each category. The categories consist of: 1. Legislators, Senior Officials and Managers, Professionals2. Technicians & Associate Professionals
Table 8.7 - Average Gross Annual Salaries per Category
Average Annual wage Gross wage per day Gross wage including non-wage costs
Category 1 21927 84.33 90.91Category 2 15226 58.56 64.42Category 3 11925 45.87 50.45
Based on the average wage earnings for each category, a daily wage rate is calculated and the non-wage costs are applied to this rate (Table 8.7). Applying the cost per day estimate to the total number of days lost (Table 8.8), and deducting reimbursement from the Social Security Department (injury benefits) gives the total cost of occupational sick pay to employers.
Table 8.8 - Average days lost during 2010 due to Occupational Injuries & Ill-Health using Injury Leave
Days Lost 1-4 days 5-10 days
11-15 days
16-20 days
21-30 days
31-40 days
41-50 days
51-75 days
76-100 days
101+ days
Category 1 252 1512 0 0 10283 0 0 0 0 0
Category 2 0 1512 0 0 0 0 0 0 0 10183
Category 3 1512 7561 6553 3629 0 7158 22936 0 17744 0
Total Days 1764 10586 6553 3629 10283 7158 22936 0 17744 10183
The total cost to employers based on occupational sick pay in 2010, is estimated at approximately €3,138,000.
Table 8.9 - Average days lost during 2010 due to Occupational Injuries & Ill-Health using Sick Leave
Days Lost 1-4 days 5-15 days 16-30 days
31-40 days
41-50 days
51-75 days
76-100 days
101+ days
Category 1 6301 6049 2319 0 0 0 0 0
Category 2 756 12098 0 3579 0 0 0 0
Category 3 8822 9074 0 0 0 0 0 0
Total Days 15879 27221 2319 3579 0 0 0 0
3. Clerks; Service workers and shop and sales workers; Skilled agricultural and fishery workers; Craft and related trades workers; Plant and machine operators and assemblers; Elementary occupations
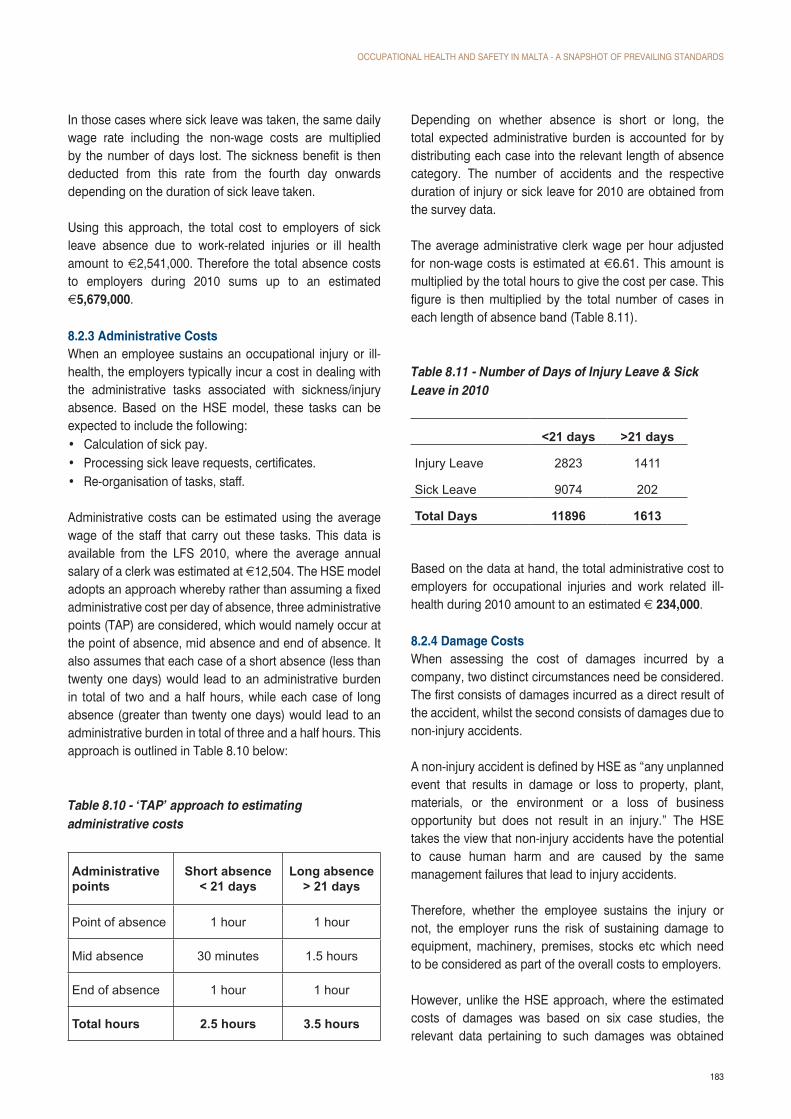
OCCUPATIONAL HEALTH AND SAFETY IN MALTA - A SNAPSHOT OF PREVAILING STANDARDS
183
In those cases where sick leave was taken, the same daily wage rate including the non-wage costs are multiplied by the number of days lost. The sickness benefit is then deducted from this rate from the fourth day onwards depending on the duration of sick leave taken.
Using this approach, the total cost to employers of sick leave absence due to work-related injuries or ill health amount to €2,541,000. Therefore the total absence costs to employers during 2010 sums up to an estimated €5,679,000.
8.2.3 Administrative CostsWhen an employee sustains an occupational injury or ill-health, the employers typically incur a cost in dealing with the administrative tasks associated with sickness/injury absence. Based on the HSE model, these tasks can be expected to include the following:• Calculation of sick pay.• Processing sick leave requests, certificates.• Re-organisation of tasks, staff.
Administrative costs can be estimated using the average wage of the staff that carry out these tasks. This data is available from the LFS 2010, where the average annual salary of a clerk was estimated at €12,504. The HSE model adopts an approach whereby rather than assuming a fixed administrative cost per day of absence, three administrative points (TAP) are considered, which would namely occur at the point of absence, mid absence and end of absence. It also assumes that each case of a short absence (less than twenty one days) would lead to an administrative burden in total of two and a half hours, while each case of long absence (greater than twenty one days) would lead to an administrative burden in total of three and a half hours. This approach is outlined in Table 8.10 below:
Table 8.10 - ‘TAP’ approach to estimating administrative costs
Administrative points
Short absence< 21 days
Long absence> 21 days
Point of absence 1 hour 1 hour
Mid absence 30 minutes 1.5 hours
End of absence 1 hour 1 hour
Total hours 2.5 hours 3.5 hours
Depending on whether absence is short or long, the total expected administrative burden is accounted for by distributing each case into the relevant length of absence category. The number of accidents and the respective duration of injury or sick leave for 2010 are obtained from the survey data.
The average administrative clerk wage per hour adjusted for non-wage costs is estimated at €6.61. This amount is multiplied by the total hours to give the cost per case. This figure is then multiplied by the total number of cases in each length of absence band (Table 8.11).
Table 8.11 - Number of Days of Injury Leave & Sick Leave in 2010
<21 days >21 days
Injury Leave 2823 1411
Sick Leave 9074 202
Total Days 11896 1613
Based on the data at hand, the total administrative cost to employers for occupational injuries and work related ill-health during 2010 amount to an estimated € 234,000.
8.2.4 Damage CostsWhen assessing the cost of damages incurred by a company, two distinct circumstances need be considered. The first consists of damages incurred as a direct result of the accident, whilst the second consists of damages due to non-injury accidents.
A non-injury accident is defined by HSE as “any unplanned event that results in damage or loss to property, plant, materials, or the environment or a loss of business opportunity but does not result in an injury.” The HSE takes the view that non-injury accidents have the potential to cause human harm and are caused by the same management failures that lead to injury accidents.
Therefore, whether the employee sustains the injury or not, the employer runs the risk of sustaining damage to equipment, machinery, premises, stocks etc which need to be considered as part of the overall costs to employers.
However, unlike the HSE approach, where the estimated costs of damages was based on six case studies, the relevant data pertaining to such damages was obtained

OCCUPATIONAL HEALTH AND SAFETY IN MALTA - A SNAPSHOT OF PREVAILING STANDARDS
184
through the survey targeting employers which was carried out as part of this project.
Employers were asked whether any damages were incurred as a result of the accidents sustained by the company during 2010, and also whether any damages were incurred as a result of non-injury accidents during the same period.
When assessing the value of the damages, the estimates provided by employers were indicative since one can assume that in the majority of cases no specific records are kept of such damages.
8.2.5DamagesDuetoInjuriesThe results of the survey show that 19% of employers who sustained an occupational injury during 2010, also incurred damages as a result of these injuries. When assessing the cost of these damages, the majority claimed that the damage resulted in up to €500 (Table 8.12).
Table 8.12 - Damages Incurred due to Injuries
Cost of Damages %
€0 to €500 41.9
€501 to € 2,000 16.1
€2,001 to € 5,000 16.1
€5,001 to € 10,000 0.0
€10,001 to €15,000 0.0
€15,001 to € 20,000 0.0
€20,001 to €30,000 3.2
More than € 30,000 3.2
Don’t know 19.3
In the case of employers who said they don’t know what the damage was (19.3%), an assumption was made that in these cases the actual costs were up to €500.
Based on the data obtained, the cost of damages as a result of injuries during 2010 is estimated at €3,985,000.
8.2.6DamagesduetoNon-InjuryAccidentsThe research shows that 13% of employers incurred damages due to non-injury accidents during 2010. The resultant costs incurred can be seen in table 8.13, where once again the majority of cases (57%) the costs incurred amounted to up to €500.
Table 8.13 - Damages Incurred due to Non-Injury Accidents
Cost of Damages %
€0 to €500 57.0
€501 to € 2,000 20.5
€2,001 to € 5,000 9.6
€5,001 to € 10,000 5.1
€10,001 to €15,000 0.6
€20,001 to €30,000 0.6
More than € 30,000 1.3
Don’t know 5.1
In the case of employers who said they don’t know what the damage was (5.1%), an assumption was made that in these cases the actual costs were up to €500.
When extrapolating these results, the cost of damages as a result of non-injury accidents during 2010 is estimated at €13,089,000.
8.2.7 Recruitment CostsWhen an employee sustains an occupational injury or work-related ill health, the employer may be required to replace the person. This can occur in the following situations: 1 When the employee suffers a work-related fatality;2 When the employee is forced to change roles within an
organisation;3 When the employee cannot return to work (defined as a
‘never return’)
Davies et al (1999) assume that all workers in the circumstances listed above would be replaced. They acknowledge that this may be an overestimate, but argue that this is more than offset by the inclusion of the cost of ‘bringing forward’ recruitment which significantly reduces the final cost estimates.
When an employee is replaced, HSE summarise the activities that contribute to the cost of recruitment as follows:• Payroll (administrative work involved)• Interview, training of a new worker• Marketing, screening, e.g. job advertisements and
application sifting• Fall in quality of service/productivity before and after the
replacement period.

OCCUPATIONAL HEALTH AND SAFETY IN MALTA - A SNAPSHOT OF PREVAILING STANDARDS
185
Past recruitment cost estimates produced by the HSE have been based on an assumption that accounts for ‘bringing forward’ the cost of recruitment. This is based on the premise that an employee would be expected to move positions eventually for reasons such as promotion, relocation or a secondment. Because of this, the employer would incur the cost of replacing the employee. A workplace injury or a case of work-related ill health leading to a long term condition, or a ‘never return’, would in effect ‘move forward’ this expected recruitment cost that was likely to be incurred later. Davies et al (1999) estimate on this basis that on average a case of a ‘never return’ would ‘bring forward’ recruitment by three years.
The HSE model suggests two approaches when estimating the recruitment costs to employers. The first approach is based on the assumption “If the absence is greater than twenty eight weeks (six months) then the worker is replaced”. This implies that cases of workplace injuries or work-related ill health that lead to a length of absence beyond twenty eight weeks activate the recruitment cost cycle (i.e. the worker is replaced).
Once the weighted average cost for recruitment is estimated the discounted cost of recruitment in three years time is subtracted from this. This amount is then multiplied by the estimated incidence rates for injuries and ill health in cases where the length of absence exceeds 28 weeks.
The second method takes on a different approach and accounts for ‘pure’ ‘never returns’ (i.e. those who have actually withdrawn from the workforce) and avoids the complexity of the overlap between permanent and temporary recruitment. In order to use this method however, one must have access to the percentage of people who receive an incapacity benefit due to a work related injury or ill-health. Unfortunately although the total number of people who registered for an incapacity benefit during 2010 is available, there is no indication of what percentage was actually related to a work related injury or ill-health. Therefore such an approach cannot be used for this exercise. Both methods however, yielded similar results according to HSE.
For the purpose of assessing the recruitment costs for 2010, data from the survey carried out with employers shows that an estimated 323 persons had to stop working during 2010. This figure does not necessarily consist of people who withdrew completely from the workforce, but also includes people who as a result of the injury had to change their job, therefore setting off the recruitment cycle. This figure is therefore being applied to the first method
of estimating recruitment costs to the employer, with the assumption that the worker is being replaced.
Based on a typical case of recruitment, it is envisaged that in terms of the administrative payroll work involved, it would require a total of three hours work. This would entail the payroll and administrative work required to terminate the previous employee’s employment (ETC termination, settling pending salary, bonuses, leave, etc) and to set up the papers, payroll, ETC, FS4 and FS3 forms for the new employee. Using the average administrative clerk wage per hour, the resultant payroll costs are estimated at €18.03 per case.
The costs involved with the interviewing process and the training of new workers requires an estimated 50 hours of executive time. This would include the screening of applicants; conducting of 1st, 2nd, and possibly 3rd interviews; and short listing of the respective applicants. Using the average wage for managerial positions, the costs of the interviewing process sum up to € 4,242.
The advertising costs for a vacancy are also included in this costing exercise, and it is estimated that a company requires approximately €1,500 for media expenditure.
When considering the costs of a loss in productivity, this often depends on the job position in question, the learning curve required for the job, and the new recruit engaged. One expects that during the first month of employment the service/productivity will drop by 75% and in the 2nd-3rd month it will rise slowly to 50%, whilst full productivity is gained after 6 months. Using this rate of drop in productivity, and adopting the same approach for calculating the lost output i.e. as a reflection of the wage of the employee, the resultant cost of drop in productivity using the average wage for 2010, is estimated at €3,160.
The weighted average cost for recruitment is estimated to be €8,920. Subtracting from this the discounted cost of recruitment in three years time, gives a figure of €511.34. Multiplying this amount by the estimated incidence rates for injuries and ill health which resulted in the worker terminating his employment results in a total cost of € 165,000.
8.2.8 Compensation & Insurance Costs, and Legal CostsUnlike the UK, employers in Malta are not legally required to have an Employer’s Liability and Compensation Insurance policy. Such a policy is designed to cover employers’ liability to employees if the employee suffers any physical

OCCUPATIONAL HEALTH AND SAFETY IN MALTA - A SNAPSHOT OF PREVAILING STANDARDS
186
injury or death as a consequence of workplace conditions. In such cases, the insurer pays the cost of the claim. Although such a policy is not legally required in Malta, some local companies do have an Employer’s Liability cover nevertheless. These are therefore being taken into consideration when assessing the cost to employers.
The HSE approach basis the costs of compensation and insurance by actually using the total figure for claims related to employer’s liability and compensation insurance, which is obtained from the Association of British Insurers. In addition to this, a 15% mark-up is added accounting for an administrative and profit premium by insurers.
The most recent data available on such claims for Malta relates to 2009. Since not much change is expected in 2010, the data for 2009 is being used for this costing exercise. According to data available through the Malta Financial Services Authority (MFSA, 2009), the total claims paid by insurers during 2009 amount to € 1,142,000. Adding 15% to cater for the administrative and profit premium of insurers, the total costs of compensation and insurance is estimated at €1,313,000.
Legal CostsAs provided for in Art. 38 (3) of the OHS Authority Act 2000, “any person who commits an offence against this Act or regulations made by virtue of this Act, shall, on conviction, be liable to imprisonment for a period of not more than two years or to a fine (multa) of not less than four hundred and sixty-five euro and eighty-seven cents (465.87) but not exceeding eleven thousand and six hundred and forty-six euro and eighty-seven cents (11,646.87)”.
During the reference year (2010) the OHSA reported in its annual report that it prosecuted a total of 223 criminal cases of which 46 cases involved the compilation of evidence before the Courts of Criminal Inquiry, whilst 177 cases were appointed before the Court of Magistrates acting as a Court of Judicature. A total of 143 cases were decided during 2010. In these cases the Courts imposed a total of €118,000 in fines and two suspended imprisonment sentences.
However, this figure only represents the actual fine imposed and does not reflect other costs to employers such as employer’s own time lost to appear in Court, preparation time for court sittings and legal costs, such as payment of lawyers.
8.3 Cost To Society The costs to society include those borne by the individuals and employers directly affected. However the total cost to society is not a simple aggregation of these costs. Firstly, there is the issue of transfer payments. For example, social security payments represent income to individuals but are a cost to the taxpayer. They are a transfer between groups in society and involve no resource cost to society as a whole. Secondly, there are costs borne by the taxpayer in general, such as for National Health Service treatment and the administration of disablement and other social security benefits.
Therefore when assessing the costs to society we are only considering direct costs to society. No attempt is made to estimate so-called ‘second round effects’, such as employers passing on the costs of workplace injuries and non-injury accidents and work-related ill health in the form of higher prices, or impacts on investment and employment.
The costs to society are broken down into three components:• Loss of output• Other resource costs (damage; administration; medical
treatment; and OHSA costs)• Human costs
8.3.1 Loss of outputBased once again on the HSE approach, the loss of output to society resulting from absence or withdrawal from the labour force encompasses the previously estimated loss of income to individuals and loss of output to employers. However, these costs included transfers from the state which reduced the cost to individuals and employers. For example, the cost to individuals is reduced by the provision of state benefits. Also, some of their lost income would have gone in tax. For employers, the cost of loss of output is eased by state funded benefits. Such benefits and lost tax are not, however, costs to society as a whole. Since there is no need to adjust for these transfers, the estimation of costs to society as a whole is more straightforward.
Earlier when calculating the costs to employers it was noted that one could equate the value of the marginal output loss with the value of the marginal input, i.e. the cost to the employer of employing the worker (comprising wage and non-wage labour costs). The research has provided data on the number of injuries and work-related ill-health sustained by employees during 2010 as well as data on the

OCCUPATIONAL HEALTH AND SAFETY IN MALTA - A SNAPSHOT OF PREVAILING STANDARDS
187
number of days lost as a result of these accidents.
As was specified earlier the average gross annual salary of a worker varies according to the type of occupation and designation of the person, and the various occupations have been grouped into 3 categories. An average wage was then calculated for each category.
The costing approach being adopted is taking into consideration days lost to an employer using both injury leave and sick leave. Multiplying the average wage by the number of days off gives a total cost of €8,529,000. In addition to this the loss of output when absent from work from part-time jobs, overtime, benefits, and bonuses is also being included. Based on the findings of the survey, this was estimated at €2,450,000.
Unfortunately no data is available on the number of people who withdrew from the labour force, which therefore does not allow us to calculate the total lost output form such persons. However, during 2010, a total of 4 fatalities were registered. However, one of the fatalities consisted of a migrant worker for which no data was available which could enable the calculation of such costs. In the case of fatalities, the lost output is calculated by estimating the working years lost (age of worker subtracted from retirement age) and calculating the net present value of these costs. The total cost of lost output due to fatalities in 2010 has been estimated at €1,454,000, of which €22,000 were incurred directly during 2010.
Figure 8.4 – Cost to Society
8.3.2 Other Resource CostsDamagesThe cost of damages to society is the same as that stipulated in the cost to employers section earlier which includes both the damage cost of non-injury accidents as well as the damage due to injuries. When assessing the value of the damages, the estimates provided by employers were indicative since one can assume that in the majority of cases no specific records are kept of such damages.
The cost of damages as a result of non-injury accidents during 2010 was estimated at €13,089,000, whilst the cost of damages as a result of injuries was estimated at €3,985,000. This leads to a total cost of damages to society of €17,075,000.
AdministrationThe cost of additional administration also includes some of the costs to employers estimated in the costs to employers section. These consist of:Administration costs: € 234,000Recruitment Costs: € 165,000 (deducting the net present value over 3 years)
The administrative costs involved in the insurance costs are also considered when calculating the costs to society. In this case, the 15% premium for administration and profits is taken into consideration. This amounts to €171,300.
Another cost which needs to be considered is the administration cost incurred by the Social Security
The costs to society are broken down into three components:
Loss of output Other resource costs (damage; administration; medical treatment; and OHSA costs) Human costs
Figure 8.4 – Cost to Society
8.3.1 Loss of output Based once again on the HSE approach, the loss of output to society resulting from absence or withdrawal from the labour force encompasses the previously estimated loss of income to individuals and loss of output to employers. However, these costs included transfers from the state which reduced the cost to individuals and employers. For example, the cost to individuals is reduced by the provision of state benefits. Also, some of their lost income would have gone in tax. For employers, the cost of loss of output is eased by state funded benefits. Such benefits and lost tax are not, however, costs to society as a whole. Since there is no need to adjust for these transfers, the estimation of costs to society as a whole is more straightforward. Earlier when calculating the costs to employers it was noted that one could equate the value of the marginal output loss with the value of the marginal input, i.e. the cost to the employer of employing the worker (comprising wage and non-wage labour costs). The research has provided data on the number of injuries and work-related ill-health sustained by employees during 2010 as well as data on the number of days lost as a result of these accidents. As was specified earlier the average gross annual salary of a worker varies according to the type of occupation and designation of the person, and the various occupations have been grouped into 3 categories. An average wage was then calculated for each category. The costing approach being adopted is taking into consideration days lost to an employer using both injury leave and sick leave. Multiplying the average wage by the number of days off gives a total cost of €8,529,000. In addition to this the loss of output when absent from work from part-time jobs, overtime, benefits, and bonuses is also being included. Based on the findings of the survey, this was estimated at €2,450,000.
Costs to Society
Loss of Output €12,433,000
Other Resource
Costs
Human Costs
Medical Treatment
€2,087,000 to €3,130,000
Cost of OHSA
€774,000
Administration Costs
€608,000
Damage cost to employers from both injury and non-injury
accidents €17,075,000

OCCUPATIONAL HEALTH AND SAFETY IN MALTA - A SNAPSHOT OF PREVAILING STANDARDS
188
department since this is also eventually borne by the taxpayer. Currently, there are three clerks engaged full-time in the processing of injury benefits. Based on the average annual gross salaries for clerks during 2010 - €12,504 (LFS 2010), the total administrative cost of the Social Security department sums up to €37,512.
As was specified earlier, in certain cases, an injury or work related ill-health can sometimes lead to judicial proceedings. According to OHSA, a total of 144 court cases involving businesses took place during 2010. This involves an element of legal costs which would be incurred both by employers, particularly in the absence of an employer’s liability and compensation insurance policy, and also by the state. In the case of the latter this would entail court hearings, administrative work within the law courts etc. Unfortunately no data is available on the administrative and financial implications on the state when dealing with such cases. These costs would otherwise be added to the administrative costs to society.
The total administrative cost to society, when considering all of these items adds up to €608,000.
Medical TreatmentSince in Malta the cost of medical treatment is largely publicly funded, and therefore paid for by taxpayers in general, the cost of providing medical treatment has not been included in other sections of this report (except the cost of prescriptions to individuals). It is however included as a cost to society.
Similar to the HSE approach, when assessing the costs of medical treatment some assumptions need to be made. These consist mainly of the following:
we assume the longer the duration of incapacity, the more treatment receivedwe assume that all treatment is being provided by Mater Dei hospital
Unfortunately no data was provided with reference to the running and operational costs of Mater Dei, which could facilitate the costing exercise of treatment provided to persons injured at work. In absence of such costs, we have resorted to the Healthcare (Fees) Regulations available in the local legislation which outline the fees to be charged for treating patients who are foreign citizens. In a few cases prices of certain interventions were also obtained from the billing section of Mater Dei. In certain cases an average fee was also established based on the fees provided in the Healthcare Fees Regulations.
Due to the lack of information on Mater Dei’s operational costs it is difficult to conclude whether the prices quoted include a profit margin or not. Likewise it is also possible that certain treatment could incorporate a lower profit margin than others, if any. We are therefore taking an upper and lower limit approach in view of such expenditure, by assuming a high profit margin of 50% when calculating the lower limit expenditure, and a 0% margin when calculating the upper limit expenditure.
The research has allowed us to obtain data on the type of treatment received due to work related injuries and ill-health in 2010, as well as the duration of such treatment. The types of medical interventions, if any, were also obtained form survey data.
The following table displays the total number of days spent as an out-patient; in-patient; or in rehabilitation as a result of an occupational injury or work related ill-health.
Table 8.14 - Days Spent receiving treatment
Treatment received Days
In-patient 6402
Out-patient 9477
Rehabilitation 13005
Using the above days and the applicable rates for such treatment, the total costs incurred during 2010 ranges between € 1,415,000 (allowing for a 50% mark-up) and € 2,123,000 (assuming no mark-up).
Table 8.15 - No. of Medical Interventions
Intervention Cases
X Ray 1,109
Blood test 807
CT scan 202
MRI 807
Minor Operation 202
Major Operation 101
Other interventions 101

OCCUPATIONAL HEALTH AND SAFETY IN MALTA - A SNAPSHOT OF PREVAILING STANDARDS
189
Based on the number of different interventions and the applicable rates for such interventions, the total cost for 2010 ranges between €671,000 (allowing for a 50% mark-up) to €1,007,000 (assuming no mark-up).
The total cost to society for medical treatment therefore ranges between €2,087,000 to €3,130,000.
OHSA CostsWhen calculating the costs to society, one also needs to incorporate the costs of the regulatory authority on health and safety - OHSA. Actual figures of the investigation costs related directly to accidents at work are not available. For the purpose of this study we are including the total expenditure of OHSA for 2010. This amounts to a total cost of € 774,000 (OHSA, 2010).
8.3.3 Human CostsAs was mentioned earlier in the costs to the individuals section, human costs are difficult to estimate, given that they are subjective in nature and cannot be quantified in a straightforward way as financial costs can. Although the HSE has considered court awards and willingness to pay economic models to assess the possible cost of human suffering, all the available methods are shown to have serious limitations. Therefore, it was not possible to present a realistic estimate of the ‘human costs’ incurred by individuals as a direct result of the current levels of health and safety in Malta.
8.4 Cost to the NationThis study has set out to estimate the costs of prevailing risk levels of occupational injuries and non-injury accidents and of physical and psychological ill-health for Malta in 2010. It has assessed this cost by looking at three distinct areas namely the cost to individuals, to employers and to society.
A strict comparison with studies which adopt different methods of calculation is not possible. However, the model adopted for this exercise does have a relatively wide coverage of costs. The following table summarises the respective costs to the three different categories.
Table 8.16 – Summary of Costs
Individuals €
Loss of Income 2,705,000
Medical Expenses 420,000
Total Cost to Individuals 3,125,000
Employers
Absence Costs 5,679,000
Administrative Costs 234,000
Recruitment Costs 165,000
Damage from Injuries 3,985,000
Damage from Non-injuries 13,089,000Compensation & Insurance
Costs; Legal Costs 1,431,000
Total Cost to Employers 24,583,000
Society
Loss of Output 12,433,000
Resource Costs 20,544,000 to 21,587,000
Total Cost to Society 32,977,000 to 34,020,000
At this stage one can look at the overall cost to the economy, and in order to do so we can consider this to be equivalent to the cost to society since in our previous calculations we have excluded the human costs resulting from pain, grief and suffering of individual victims and their families.
As was stated earlier, when considering the cost to the economy, only direct costs to society are taken into consideration. We do not attempt to estimate so-called ‘second round effects’, such as employers passing on the costs of workplace injuries and non-injury accidents and work-related ill-health.
The overall cost to the Maltese economy of all workplace injuries and work-related ill health in 2010 is estimated to be between €32,977,000 to €34,020,000. This is equivalent to between 0.53% to 0.54% of the total Maltese Gross Domestic Product for 2010, which is estimated at €6.2 billion (NSO 2011).

The overall cost to the Maltese
economy of all workplace injuries
and work-related ill health
in 2010 is estimated to be between
€32,977,000 to €34,020,000.
This is equivalent to between 0.53%
to 0.54% of the total Maltese Gross
Domestic Product for 2010

Buckle, P.W., Devereux, J.J. (2002). The nature of work-related neck and upper limb musculoskeletal disorders, Applied Ergonomics 33 (2002) 207-217, Elsevier Sciences Ltd. UK
CCOHS (2010). Accident Investigation. Canadian Centre for Occupational Health & Safety. Retrieved June 21, 2010 from http://www.ccohs.ca/oshanswers/hsprograms/investg.html
Davies et al (1999). The costs to Britain of workplace accidents and work related ill health in 1995/96. Health and Safety Executive
De Norre, B. (2009). Eurostat, Statistics in focus 2009, Population and Social Conditions. European Commission
Department of Social Security (2010). Social Benefits Application Forms. Ministry of Education, Employment & the Family, Malta. Retrieved June 12, 2010 from http://www.msp.gov.mt/services/subpages/content_index.asp?id=socprotection§ion=applications
Economic Advisers Unit (2004). Interim update of the “Costs to Britain of Workplace Accidents and Work-Related Ill Health”. Economic Advisers Unit, UK
European Commission (2004). Work and Health in the EU. A Statistical Portrait, Data 1994-2002, Edition 2003, Panorama of the European Union, Office for Official Publications of the European Communities, European Commission, Luxembourg
European Statistics, (2010), Statistics database, Population and Social Conditions. Health & Safety at Work. Retrieved June 12, 2010 from http://epp.eurostat.ec.europa.eu/portal/page/portal/statistics/search_databasehttp://epp.eurostat.ec.europa.eu/portal/page/portal/health/health_safety_work/data
http://epp.eurostat.ec.europa.eu/tgm/table.do?tab=table&init=l&language=en&pcode=tsiem090&plugin=1
European Statistics (2009). Statistics in Focus 2009 – Accidents at Work, work-related health problems and risk factors. European Commission
Health and Safety Executive (2002). Revitalising Health and Safety: Ill- health costs, HSE Website, UK. Retrieved June 12, 2010 from http://www.hse.gov.uk/costs/ill_health_costs/ill_health_costs_intro.asp#top
HealthCare Fees Regulations, Subsidiary Legislation 35.28. Legal Notice 201 of 2004
Inland Revenue Department (2011). Retrieved August 22, 2011 from http://www.ird.gov.mt/v1/services/ssc/sscrates.aspx
Jacinto, C., Aspinwall, E. (2003). Work Accidents Investigation Technique Part I, Safety Science Monitor, Issue 1 2003, Volume 7, Article IV-2
Latino, R.J., Latino, K.C., (2006), Root Cause Analysis, Improving Performance for Bottom-Line Results, Third Edition, Taylor & Francis
MFSA 2009. Insurance Principals Statistics 2009, General Business Statistics
M. Pathak (1999). The cost to Britain of workplace accidents and work-related ill health in 1995/96. Health and Safety Executive
M. Pathak, 2008. The costs to employers in Britain of workplace injuries and work-related ill health in 2005/06. Analytical Services Division Health and Safety Executive, UK
9. BIBLIOGRAPHY

OCCUPATIONAL HEALTH AND SAFETY IN MALTA - A SNAPSHOT OF PREVAILING STANDARDS
192
National Statistics Office, (2010), European Statistics. Retrieved June 12, 2010 from http://www.nso.gov.mt/site/page.aspx?pageid=34
National Statistics Office (2010). News Release May 2011 - Gainfully Occupied Population December 2010. Retrieved May 9, 2011 from: http://www.nso.gov.mt/statdoc/document_file.aspx?id=3020
National Statistics Office (2011). News Release March 2011, Labour Force Survey Q4/2010. National Statistics Office, Valletta, Malta
National Statistics Office (2011). Labour Force Survey 2007. National Statistics Office, Valletta, Malta
National Statistics Office (2011). News Release March 2011, Gross Domestic Product for 2010. National Statistics Office, Valletta, Malta
Occupational Health & Safety Authority Act, Act XXVII (2000), Laws of Malta, Malta.
Occupational Health and Safety Authority (2010). Activity Report 2009. Occupational Health and Safety Authority, Malta
Rooney, J.J., Vanden Heuvel, L.N. (2004). Quality Basics, Root Cause Analysis for Beginners, Quality Progress, July 2004
S. Binch, J. Bell, (2007). The cost of non-injury accidents - Scoping study. Health and Safety Laboratory UK
Vincent, C. (2003). Understanding and responding to adverse events, The New England Journal Of Medicine, Volume 348:1051-1056, Number 11, 2003

Table 6.5a - Feeling informed about rights and duties with regards to OHS – By industry sector**
CountsAnalysis %Respondents
Total
Total
Notinformed
at allNot so wellinformed
Moderatelyinformed
Adequatelyinformed
Very wellinformed
Don't know/ Don't
remember
Construction, Mining &Quarrying
Manufacturing, Agriculture,Hunting & Forestry, Electricity,Gas & Water Supply
Wholesale & Retail Trade,Repairs
Hotels & Restaurants
Transport, Storage &Communication
749 658.7%
11114.8%
21328.4%
20927.9%
14719.6%
40.5%
80 78.8%
1113.8%
2430.0%
2227.5%
1620.0%
--
213 157.0%
2813.1%
6128.6%
5425.4%
5525.8%
--
205 2110.2%
3718.0%
5325.9%
6230.2%
3115.1%
10.5%
130 96.9%
2015.4%
4131.5%
3829.2%
2116.2%
10.8%
121 1310.7%
1512.4%
3428.1%
3327.3%
2419.8%
21.7%
**NOTE: These Findings are being depicted in two separate Tables, i.e. Table 6.5a and Table 6.5b
10. APPENDIX A – SUPPLEMENTARY ‘EMPLOYEE’ SURVEY FINDINGS

OCCUPATIONAL HEALTH AND SAFETY IN MALTA - A SNAPSHOT OF PREVAILING STANDARDS
194
Table 6.5b - Feeling informed about rights and duties with regards to OHS - By industry sector**
CountsAnalysis %Respondents
Total
Total
Notinformed
at allNot so wellinformed
Moderatelyinformed
Adequatelyinformed
Very wellinformed
Don't know/ Don't
remember
Real Estate, Renting, FinancialIntermediation & BusinessActivities
Public Administration
Education
Health & Social Work
Other Community, Social &Personal Service Activities
649 568.6%
12719.6%
18127.9%
15924.5%
11818.2%
81.2%
211 125.7%
2913.7%
6128.9%
5727.0%
5124.2%
10.5%
104 1211.5%
3331.7%
2120.2%
1918.3%
1514.4%
43.8%
138 139.4%
3323.9%
4129.7%
3424.6%
1611.6%
10.7%
115 108.7%
1815.7%
3530.4%
2521.7%
2622.6%
10.9%
81 911.1%
1417.3%
2328.4%
2429.6%
1012.3%
11.2%
**NOTE: These Findings are being depicted in two separate Tables, i.e. Table 6.5a and Table 6.5b

OCCUPATIONAL HEALTH AND SAFETY IN MALTA - A SNAPSHOT OF PREVAILING STANDARDS
195
Table 6.6 - Health and safety policy - by industry sector
CountsAnalysis %Respondents
Total
Total
Yes No
Don'tknow /Don't
remember
Construction, Mining &Quarrying
Manufacturing, Agriculture,Hunting & Forestry, Electricity,Gas & Water Supply
Wholesale & Retail Trade,Repairs
Hotels & Restaurants
Transport, Storage &Communication
Real Estate, Renting, FinancialIntermediation & BusinessActivities
Public Administration
Education
Health & Social Work
Other Community, Social &Personal Service Activities
1398 101172.3%
17212.3%
21515.4%
80 6581.3%
67.5%
911.3%
213 17079.8%
2411.3%
198.9%
205 12159.0%
3919.0%
4522.0%
130 10076.9%
1410.8%
1612.3%
121 8771.9%
1411.6%
2016.5%
211 15975.4%
199.0%
3315.6%
104 6562.5%
1918.3%
2019.2%
138 10979.0%
96.5%
2014.5%
115 8674.8%
1311.3%
1613.9%
81 4960.5%
1518.5%
1721.0%

OCCUPATIONAL HEALTH AND SAFETY IN MALTA - A SNAPSHOT OF PREVAILING STANDARDS
196
218
Table 6.7 - Health and safety policy - by company size
CountsAnalysis %Respondents
Total
Total
Yes No
Don'tknow /Don't
remember
Self-employed withoutemployees
1-9 employees
10-49 employees
50-249 employees
250-499 employees
500 employees or more
1398 101172.3%
17212.3%
21515.4%
- --
--
--
324 19459.9%
7021.6%
6018.5%
322 22569.9%
4814.9%
4915.2%
389 28974.3%
359.0%
6516.7%
131 10277.9%
96.9%
2015.3%
232 20186.6%
104.3%
219.1%
Table 6.7 - Health and safety policy - by company size

OCCUPATIONAL HEALTH AND SAFETY IN MALTA - A SNAPSHOT OF PREVAILING STANDARDS
197
219
Table 6.8 - Frequency of health and safety training - by industry sector
CountsAnalysis %Respondents
Total
Total
NeverOn
recruitment
Wheneverthere is a
transfer or achange ofjob or task
When thereis a change
in workequipment /
newequipment isintroduced
When newtechnology
isintroduced
When newwork
practicesare
introduced
Construction, Mining &Quarrying
Manufacturing, Agriculture,Hunting & Forestry, Electricity,Gas & Water Supply
Wholesale & Retail Trade,Repairs
Hotels & Restaurants
Transport, Storage &Communication
Real Estate, Renting, FinancialIntermediation & BusinessActivities
Public Administration
Education
Health & Social Work
Other Community, Social &Personal Service Activities
1398 55940.0%
45132.3%
17912.8%
25418.2%
25318.1%
33323.8%
80 3442.5%
2328.7%
1012.5%
1923.8%
1215.0%
2025.0%
213 6028.2%
8640.4%
3817.8%
5827.2%
6028.2%
6631.0%
205 11757.1%
4923.9%
178.3%
209.8%
199.3%
3215.6%
130 3123.8%
5139.2%
2015.4%
2620.0%
2519.2%
4534.6%
121 4033.1%
3428.1%
1814.9%
3024.8%
3327.3%
3428.1%
211 8439.8%
7937.4%
2913.7%
3315.6%
3617.1%
4320.4%
104 5653.8%
2524.0%
1312.5%
1312.5%
1312.5%
1918.3%
138 6647.8%
3122.5%
85.8%
1510.9%
1611.6%
2518.1%
115 4135.7%
4135.7%
2118.3%
3127.0%
3227.8%
3530.4%
81 3037.0%
3239.5%
56.2%
911.1%
78.6%
1417.3%
Table 6.9 - Frequency of health and safety training - by company size
CountsAnalysis %Respondents
Total
Total
NeverOn
recruitment
Wheneverthere is a
transfer ora change ofjob or task
When thereis a change
in workequipment /
newequipment
isintroduced
When newtechnology
isintroduced
When newwork
practicesare
introduced
Self-employed w ithoutemployees
1-9 employees
10-49 employees
50-249 employees
250-499 employees
500 employees or more
1398 55940.0%
45132.3%
17912.8%
25418.2%
25318.1%
33323.8%
- --
--
--
--
--
--
324 17955.2%
8927.5%
185.6%
3611.1%
3310.2%
4614.2%
322 14745.7%
10231.7%
309.3%
5216.1%
5015.5%
5918.3%
389 14637.5%
12030.8%
5313.6%
6717.2%
6717.2%
10025.7%
131 3829.0%
4433.6%
2619.8%
3123.7%
3929.8%
3829.0%
232 4921.1%
9641.4%
5222.4%
6829.3%
6427.6%
9038.8%
Table 6.8 - Frequency of health and safety training - by industry sector
Table 6.9 - Frequency of health and safety training - by company size
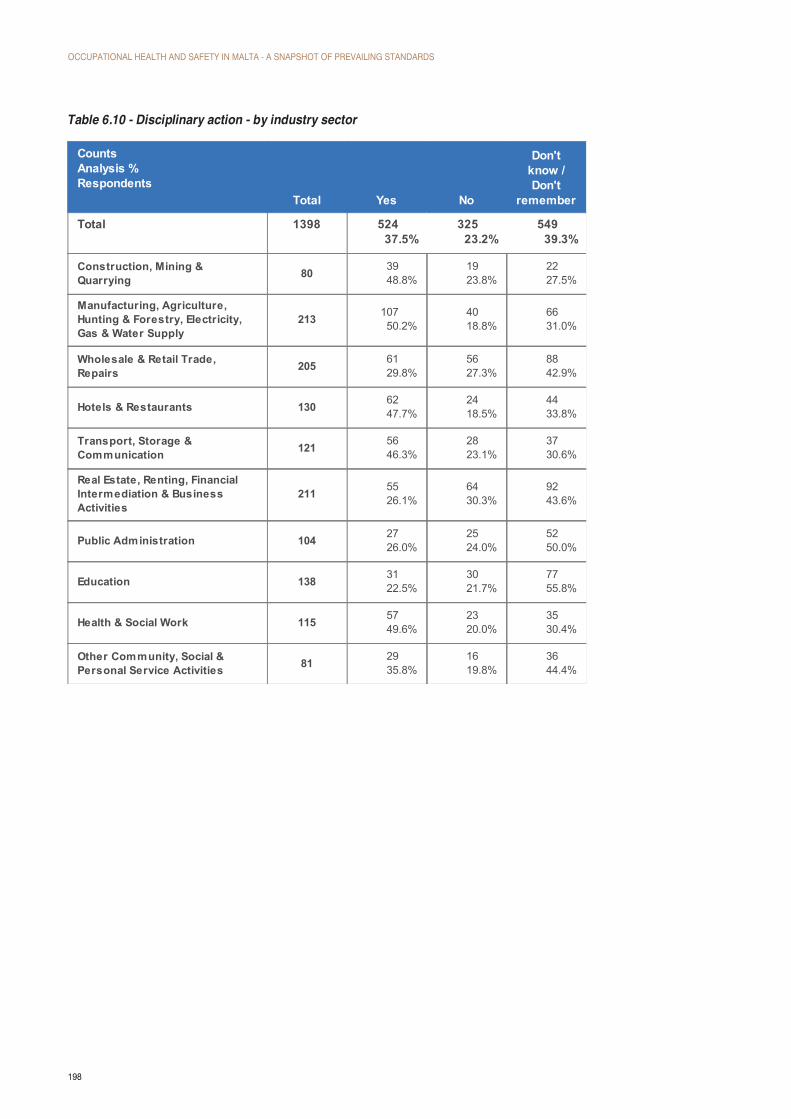
OCCUPATIONAL HEALTH AND SAFETY IN MALTA - A SNAPSHOT OF PREVAILING STANDARDS
198
220
Table 6.10 - Disciplinary action - by industry sector
CountsAnalysis %Respondents
Total
Total
Yes No
Don'tknow /Don't
remember
Construction, Mining &Quarrying
Manufacturing, Agriculture,Hunting & Forestry, Electricity,Gas & Water Supply
Wholesale & Retail Trade,Repairs
Hotels & Restaurants
Transport, Storage &Communication
Real Estate, Renting, FinancialIntermediation & BusinessActivities
Public Administration
Education
Health & Social Work
Other Community, Social &Personal Service Activities
1398 52437.5%
32523.2%
54939.3%
80 3948.8%
1923.8%
2227.5%
213 10750.2%
4018.8%
6631.0%
205 6129.8%
5627.3%
8842.9%
130 6247.7%
2418.5%
4433.8%
121 5646.3%
2823.1%
3730.6%
211 5526.1%
6430.3%
9243.6%
104 2726.0%
2524.0%
5250.0%
138 3122.5%
3021.7%
7755.8%
115 5749.6%
2320.0%
3530.4%
81 2935.8%
1619.8%
3644.4%
Table 6.10 - Disciplinary action - by industry sector

OCCUPATIONAL HEALTH AND SAFETY IN MALTA - A SNAPSHOT OF PREVAILING STANDARDS
199
221
Table 6.11 - Person with specific OHS duties - by industry sector
CountsAnalysis %Respondents
Total
Total
Yes, full timeon OHS
Yes, OHS fallsunder the
responsibilitiesof a particular
employee
Yes, retainerbasis (external
consultant) No
Don't know /Don't
remember
Construction, Mining &Quarrying
Manufacturing, Agriculture,Hunting & Forestry, Electricity,Gas & Water Supply
Wholesale & Retail Trade,Repairs
Hotels & Restaurants
Transport, Storage &Communication
Real Estate, Renting, FinancialIntermediation & BusinessActivities
Public Administration
Education
Health & Social Work
Other Community, Social &Personal Service Activities
1398 30922.1%
34824.9%
664.7%
38427.5%
29120.8%
80 1215.0%
1822.5%
911.3%
2531.3%
1620.0%
213 8238.5%
3616.9%
41.9%
5726.8%
3416.0%
205 167.8%
4019.5%
94.4%
9546.3%
4522.0%
130 129.2%
3728.5%
64.6%
4131.5%
3426.2%
121 3629.8%
2722.3%
75.8%
2722.3%
2419.8%
211 5224.6%
5827.5%
83.8%
5727.0%
3617.1%
104 2322.1%
3129.8%
21.9%
2423.1%
2423.1%
138 3928.3%
5036.2%
128.7%
128.7%
2518.1%
115 2925.2%
2723.5%
43.5%
2420.9%
3127.0%
81 89.9%
2429.6%
56.2%
2227.2%
2227.2%
Table 6.11 - Person with specific OHS duties - by industry sector

OCCUPATIONAL HEALTH AND SAFETY IN MALTA - A SNAPSHOT OF PREVAILING STANDARDS
200
222
Table 6.13 - Risk assessments - by industry sector
CountsAnalysis %Respondents
Total
Total
Yes No
Don'tknow /Don't
remember
Construction, Mining &Quarrying
Manufacturing, Agriculture,Hunting & Forestry, Electricity,Gas & Water Supply
Wholesale & Retail Trade,Repairs
Hotels & Restaurants
Transport, Storage &Communication
Real Estate, Renting, FinancialIntermediation & BusinessActivities
Public Administration
Education
Health & Social Work
Other Community, Social &Personal Service Activities
1603 82251.3%
39724.8%
38424.0%
106 6056.6%
2422.6%
2220.8%
240 14158.8%
4920.4%
5020.8%
266 10740.2%
10338.7%
5621.1%
139 7755.4%
3021.6%
3223.0%
126 6450.8%
2519.8%
3729.4%
229 11449.8%
5524.0%
6026.2%
104 5048.1%
2322.1%
3129.8%
144 8458.3%
2013.9%
4027.8%
121 6957.0%
2520.7%
2722.3%
128 5643.8%
4333.6%
2922.7%
Table 6.13 - Risk assessments - by industry sector

OCCUPATIONAL HEALTH AND SAFETY IN MALTA - A SNAPSHOT OF PREVAILING STANDARDS
201
223
Table 6.14 - Risk assessments – by company size
CountsAnalysis %Respondents
Total
Total
Yes No
Don'tknow /Don't
remember
Self-employed withoutemployees
1-9 employees
10-49 employees
50-249 employees
250-499 employees
500 employees or more
1603 82251.3%
39724.8%
38424.0%
205 10651.7%
7938.5%
209.8%
324 12839.5%
12237.7%
7422.8%
322 13541.9%
9830.4%
8927.6%
389 21354.8%
5614.4%
12030.8%
131 7658.0%
2216.8%
3325.2%
232 16470.7%
208.6%
4820.7%
Table 6.14 - Risk assessments – by company size

OCCUPATIONAL HEALTH AND SAFETY IN MALTA - A SNAPSHOT OF PREVAILING STANDARDS
202
224
Table 6.15- Participation in risk assessments - by industry sector
CountsAnalysis %Respondents
Total
Total
Yes No
Construction, Mining &Quarrying
Manufacturing, Agriculture,Hunting & Forestry, Electricity,Gas & Water Supply
Wholesale & Retail Trade,Repairs
Hotels & Restaurants
Transport, Storage &Communication
Real Estate, Renting, FinancialIntermediation & BusinessActivities
Public Administration
Education
Health & Social Work
Other Community, Social &Personal Service Activities
822 52764.1%
29535.9%
60 4168.3%
1931.7%
141 9063.8%
5136.2%
107 6863.6%
3936.4%
77 5774.0%
2026.0%
64 3554.7%
2945.3%
114 7061.4%
4438.6%
50 2142.0%
2958.0%
84 5464.3%
3035.7%
69 4666.7%
2333.3%
56 4580.4%
1119.6%
Table 6.15- Participation in risk assessments - by industry sector

OCCUPATIONAL HEALTH AND SAFETY IN MALTA - A SNAPSHOT OF PREVAILING STANDARDS
203
225
Table 6.16 - Participation in risk assessments - by company size
CountsAnalysis %Respondents
Total
Total
Yes No
Self-employed withoutemployees
1-9 employees
10-49 employees
50-249 employees
250-499 employees
500 employees or more
822 52764.1%
29535.9%
106 10296.2%
43.8%
128 8868.8%
4031.3%
135 8260.7%
5339.3%
213 11754.9%
9645.1%
76 4153.9%
3546.1%
164 9759.1%
6740.9%
Table 6.16 - Participation in risk assessments - by company size
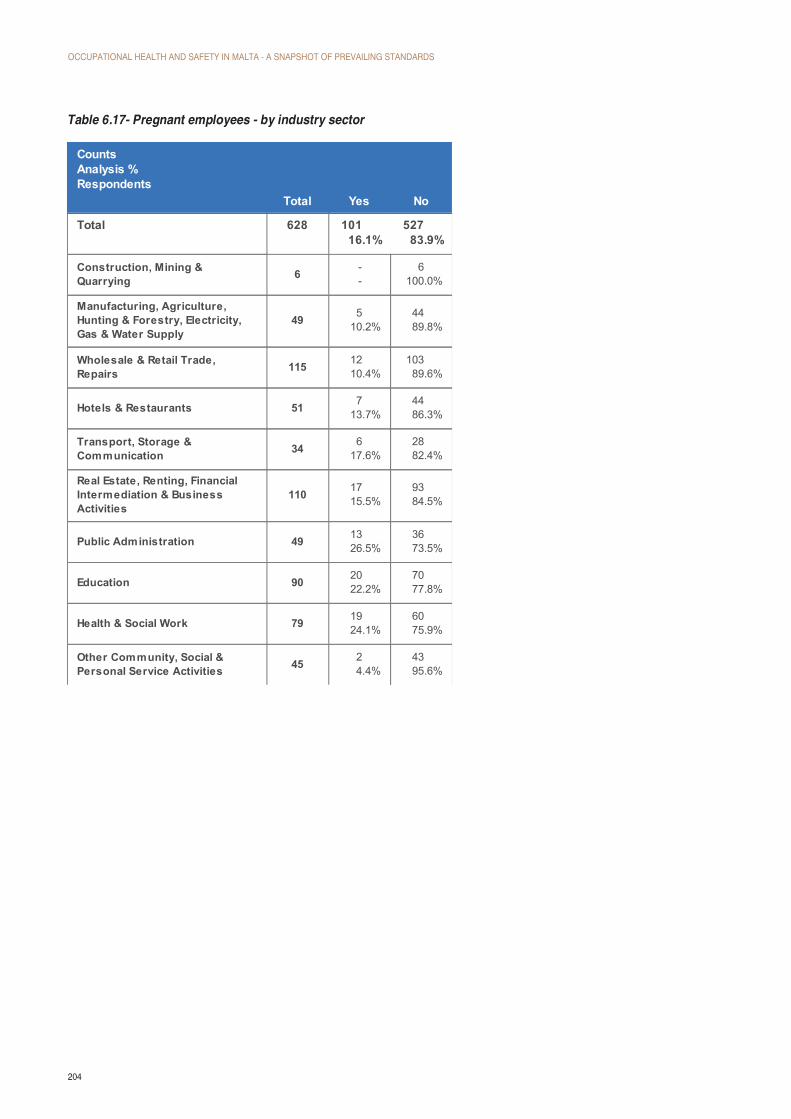
OCCUPATIONAL HEALTH AND SAFETY IN MALTA - A SNAPSHOT OF PREVAILING STANDARDS
204
226
Table 6.17- Pregnant employees - by industry sector
CountsAnalysis %Respondents
Total
Total
Yes No
Construction, Mining &Quarrying
Manufacturing, Agriculture,Hunting & Forestry, Electricity,Gas & Water Supply
Wholesale & Retail Trade,Repairs
Hotels & Restaurants
Transport, Storage &Communication
Real Estate, Renting, FinancialIntermediation & BusinessActivities
Public Administration
Education
Health & Social Work
Other Community, Social &Personal Service Activities
628 10116.1%
52783.9%
6 --
6100.0%
49 510.2%
4489.8%
115 1210.4%
10389.6%
51 713.7%
4486.3%
34 617.6%
2882.4%
110 1715.5%
9384.5%
49 1326.5%
3673.5%
90 2022.2%
7077.8%
79 1924.1%
6075.9%
45 24.4%
4395.6%
Table 6.17- Pregnant employees - by industry sector

OCCUPATIONAL HEALTH AND SAFETY IN MALTA - A SNAPSHOT OF PREVAILING STANDARDS
205
227
Table 6.18- Pregnant employees who informed employer of their pregnancy – by industry sector
CountsAnalysis %Respondents
Total
Total
Yes
Yes, butnot with amedical
certificate No
Construction, Mining &Quarrying
Manufacturing, Agriculture,Hunting & Forestry, Electricity,Gas & Water Supply
Wholesale & Retail Trade,Repairs
Hotels & Restaurants
Transport, Storage &Communication
Real Estate, Renting, FinancialIntermediation & BusinessActivities
Public Administration
Education
Health & Social Work
Other Community, Social &Personal Service Activities
101 4241.6%
5049.5%
98.9%
- --
--
--
5 --
480.0%
120.0%
12 216.7%
975.0%
18.3%
7 114.3%
685.7%
--
6 233.3%
350.0%
116.7%
17 1270.6%
423.5%
15.9%
13 646.2%
538.5%
215.4%
20 840.0%
1260.0%
--
19 1052.6%
631.6%
315.8%
2 150.0%
150.0%
--
Table 6.18- Pregnant employees who informed employer of their pregnancy – by industry sector

OCCUPATIONAL HEALTH AND SAFETY IN MALTA - A SNAPSHOT OF PREVAILING STANDARDS
206
228
Table 6.19 - Pregnant employees who informed employer of their pregnancy
- by company size
CountsAnalysis %Respondents
Total
Total
Yes
Yes, butnot with amedical
certificate No
Self-employed withoutemployees
1-9 employees
10-49 employees
50-249 employees
250-499 employees
500 employees or more
101 4241.6%
5049.5%
98.9%
- --
--
--
17 423.5%
1164.7%
211.8%
17 741.2%
1058.8%
--
34 1132.4%
1955.9%
411.8%
7 228.6%
342.9%
228.6%
26 1869.2%
726.9%
13.8%
Table 6.19 - Pregnant employees who informed employer of their pregnancy - by company size

OCCUPATIONAL HEALTH AND SAFETY IN MALTA - A SNAPSHOT OF PREVAILING STANDARDS
207
229
Table 6.20 - Risk assessment on pregnant employees - by industry sector
CountsAnalysis %Respondents
Total
Total
Yes No
Don'tknow /Don't
remember
Construction, Mining &Quarrying
Manufacturing, Agriculture,Hunting & Forestry, Electricity,Gas & Water Supply
Wholesale & Retail Trade,Repairs
Hotels & Restaurants
Transport, Storage &Communication
Real Estate, Renting, FinancialIntermediation & BusinessActivities
Public Administration
Education
Health & Social Work
Other Community, Social &Personal Service Activities
42 1228.6%
2047.6%
1023.8%
- --
--
--
- --
--
--
2 150.0%
--
150.0%
1 --
--
1100.0%
2 --
2100.0%
--
12 541.7%
541.7%
216.7%
6 --
583.3%
116.7%
8 225.0%
337.5%
337.5%
10 330.0%
550.0%
220.0%
1 1100.0%
--
--
Table 6.20 - Risk assessment on pregnant employees - by industry sector

OCCUPATIONAL HEALTH AND SAFETY IN MALTA - A SNAPSHOT OF PREVAILING STANDARDS
208
230
Table 6.21 - Specific measures after the risk assessment of the pregnant woman - by industry sector
CountsAnalysis %Respondents
Total
Total
Yes No
Don'tknow /Don't
remember
Construction, Mining &Quarrying
Manufacturing, Agriculture,Hunting & Forestry, Electricity,Gas & Water Supply
Wholesale & Retail Trade,Repairs
Hotels & Restaurants
Transport, Storage &Communication
Real Estate, Renting, FinancialIntermediation & BusinessActivities
Public Administration
Education
Health & Social Work
Other Community, Social &Personal Service Activities
12 1191.7%
--
18.3%
- --
--
--
- --
--
--
1 1100.0%
--
--
- --
--
--
- --
--
--
5 5100.0%
--
--
- --
--
--
2 150.0%
--
150.0%
3 3100.0%
--
--
1 1100.0%
--
--
Table 6.21 - Specific measures after the risk assessment of the pregnant woman - by industry sector
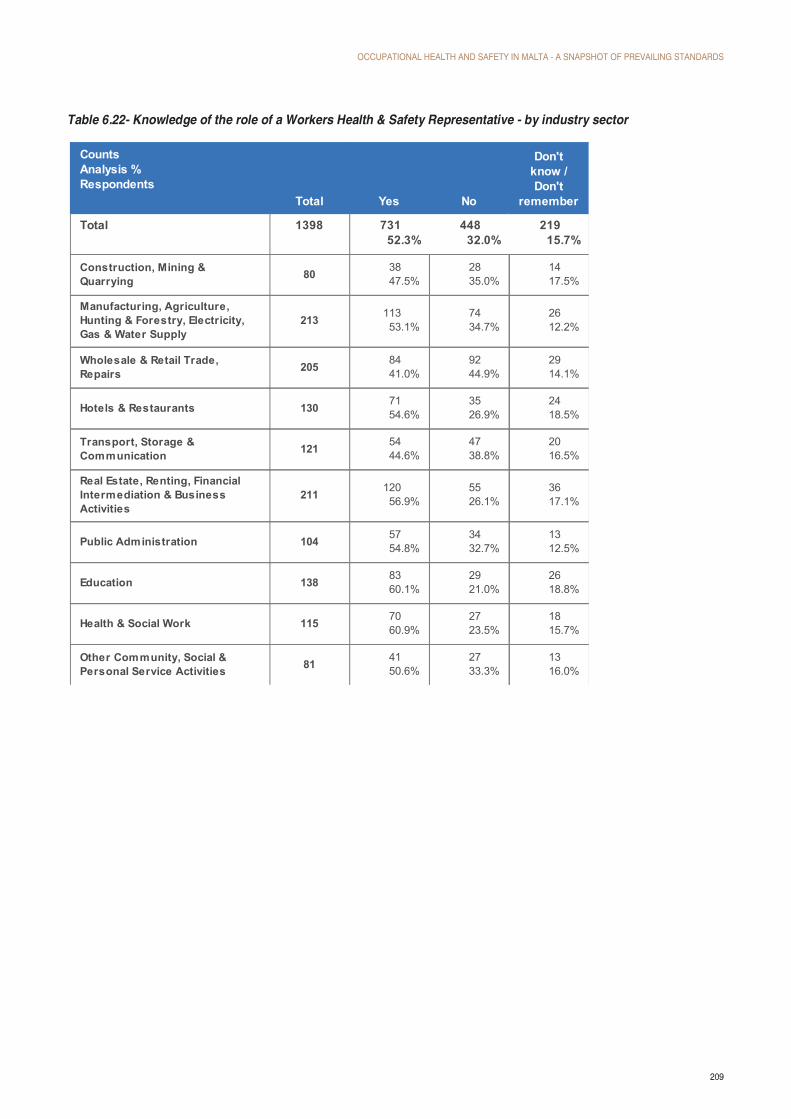
OCCUPATIONAL HEALTH AND SAFETY IN MALTA - A SNAPSHOT OF PREVAILING STANDARDS
209
231
Table 6.22- Knowledge of the role of a Workers Health & Safety Representative - by industry sector
CountsAnalysis %Respondents
Total
Total
Yes No
Don'tknow /Don't
remember
Construction, Mining &Quarrying
Manufacturing, Agriculture,Hunting & Forestry, Electricity,Gas & Water Supply
Wholesale & Retail Trade,Repairs
Hotels & Restaurants
Transport, Storage &Communication
Real Estate, Renting, FinancialIntermediation & BusinessActivities
Public Administration
Education
Health & Social Work
Other Community, Social &Personal Service Activities
1398 73152.3%
44832.0%
21915.7%
80 3847.5%
2835.0%
1417.5%
213 11353.1%
7434.7%
2612.2%
205 8441.0%
9244.9%
2914.1%
130 7154.6%
3526.9%
2418.5%
121 5444.6%
4738.8%
2016.5%
211 12056.9%
5526.1%
3617.1%
104 5754.8%
3432.7%
1312.5%
138 8360.1%
2921.0%
2618.8%
115 7060.9%
2723.5%
1815.7%
81 4150.6%
2733.3%
1316.0%
Table 6.22- Knowledge of the role of a Workers Health & Safety Representative - by industry sector

OCCUPATIONAL HEALTH AND SAFETY IN MALTA - A SNAPSHOT OF PREVAILING STANDARDS
210
232
Table 6.23- Knowledge of the role of a Workers Health & Safety Representative - by company size
CountsAnalysis %Respondents
Total
Total
Yes No
Don'tknow /Don't
remember
Self-employed withoutemployees
1-9 employees
10-49 employees
50-249 employees
250-499 employees
500 employees or more
1398 73152.3%
44832.0%
21915.7%
- --
--
--
324 12137.3%
16952.2%
3410.5%
322 16551.2%
10432.3%
5316.5%
389 20853.5%
10226.2%
7920.3%
131 8262.6%
2821.4%
2116.0%
232 15566.8%
4519.4%
3213.8%
233
Table 6.24 - Workers Health and Safety Representative - by industry sector
CountsAnalysis %Respondents
Total
Total
Yes No
Don'tknow /Don't
remember
Construction, Mining &Quarrying
Manufacturing, Agriculture,Hunting & Forestry, Electricity,Gas & Water Supply
Wholesale & Retail Trade,Repairs
Hotels & Restaurants
Transport, Storage &Communication
Real Estate, Renting, FinancialIntermediation & BusinessActivities
Public Administration
Education
Health & Social Work
Other Community, Social &Personal Service Activities
1398 50536.1%
56440.3%
32923.5%
80 2430.0%
3948.8%
1721.3%
213 9846.0%
7133.3%
4420.7%
205 3416.6%
12661.5%
4522.0%
130 4534.6%
4937.7%
3627.7%
121 4436.4%
4738.8%
3024.8%
211 7535.5%
8439.8%
5224.6%
104 4543.3%
3634.6%
2322.1%
138 6748.6%
4029.0%
3122.5%
115 4640.0%
3732.2%
3227.8%
81 2733.3%
3543.2%
1923.5%
Table 6.23- Knowledge of the role of a Workers Health & Safety Representative - by company size
Table 6.24 - Workers Health and Safety Representative - by industry sector

OCCUPATIONAL HEALTH AND SAFETY IN MALTA - A SNAPSHOT OF PREVAILING STANDARDS
211
234
Table 6.25 - Workers Health and Safety Representative - by company size
CountsAnalysis %Respondents
Total
Total
Yes No
Don'tknow /Don't
remember
Self-employed withoutemployees
1-9 employees
10-49 employees
50-249 employees
250-499 employees
500 employees or more
1398 50536.1%
56440.3%
32923.5%
- --
--
--
324 3711.4%
24575.6%
4213.0%
322 8325.8%
15347.5%
8626.7%
389 16642.7%
10126.0%
12231.4%
131 6851.9%
2720.6%
3627.5%
232 15165.1%
3816.4%
4318.5%
235
Table 6.26 - Involvement in the appointment of the representative
- by industry sector
CountsAnalysis %Respondents
Total
Total
Yes No
Don'tknow /Don't
remember
Construction, Mining &Quarrying
Manufacturing, Agriculture,Hunting & Forestry, Electricity,Gas & Water Supply
Wholesale & Retail Trade,Repairs
Hotels & Restaurants
Transport, Storage &Communication
Real Estate, Renting, FinancialIntermediation & BusinessActivities
Public Administration
Education
Health & Social Work
Other Community, Social &Personal Service Activities
505 6212.3%
43085.1%
132.6%
24 28.3%
2291.7%
--
98 1111.2%
8586.7%
22.0%
34 38.8%
3191.2%
--
45 1022.2%
3577.8%
--
44 613.6%
3784.1%
12.3%
75 1317.3%
6181.3%
11.3%
45 613.3%
3884.4%
12.2%
67 46.0%
6191.0%
23.0%
46 510.9%
3882.6%
36.5%
27 27.4%
2281.5%
311.1%
Table 6.25 - Workers Health and Safety Representative - by company size
Table 6.26 - Involvement in the appointment of the representative - by industry sector
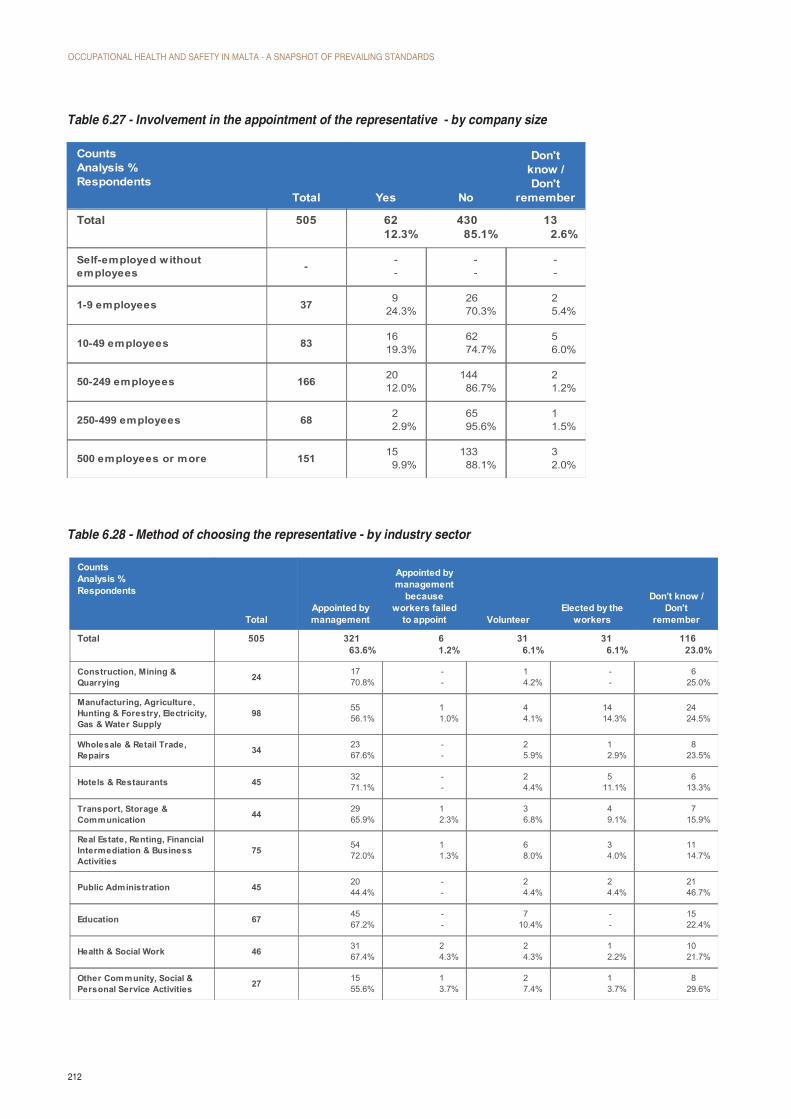
OCCUPATIONAL HEALTH AND SAFETY IN MALTA - A SNAPSHOT OF PREVAILING STANDARDS
212
Table 6.27 - Involvement in the appointment of the representative - by company size
Table 6.28 - Method of choosing the representative - by industry sector
236
Table 6.27 - Involvement in the appointment of the representative
- by company size
CountsAnalysis %Respondents
Total
Total
Yes No
Don'tknow /Don't
remember
Self-employed withoutemployees
1-9 employees
10-49 employees
50-249 employees
250-499 employees
500 employees or more
505 6212.3%
43085.1%
132.6%
- --
--
--
37 924.3%
2670.3%
25.4%
83 1619.3%
6274.7%
56.0%
166 2012.0%
14486.7%
21.2%
68 22.9%
6595.6%
11.5%
151 159.9%
13388.1%
32.0%
Table 6.28 - Method of choosing the representative - by industry sector
CountsAnalysis %Respondents
Total
Total
Appointed bymanagement
Appointed bymanagement
becauseworkers failed
to appoint VolunteerElected by the
workers
Don't know /Don't
remember
Construction, Mining &Quarrying
Manufacturing, Agriculture,Hunting & Forestry, Electricity,Gas & Water Supply
Wholesale & Retail Trade,Repairs
Hotels & Restaurants
Transport, Storage &Communication
Real Estate, Renting, FinancialIntermediation & BusinessActivities
Public Administration
Education
Health & Social Work
Other Community, Social &Personal Service Activities
505 32163.6%
61.2%
316.1%
316.1%
11623.0%
24 1770.8%
--
14.2%
--
625.0%
98 5556.1%
11.0%
44.1%
1414.3%
2424.5%
34 2367.6%
--
25.9%
12.9%
823.5%
45 3271.1%
--
24.4%
511.1%
613.3%
44 2965.9%
12.3%
36.8%
49.1%
715.9%
75 5472.0%
11.3%
68.0%
34.0%
1114.7%
45 2044.4%
--
24.4%
24.4%
2146.7%
67 4567.2%
--
710.4%
--
1522.4%
46 3167.4%
24.3%
24.3%
12.2%
1021.7%
27 1555.6%
13.7%
27.4%
13.7%
829.6%

OCCUPATIONAL HEALTH AND SAFETY IN MALTA - A SNAPSHOT OF PREVAILING STANDARDS
213
237
Table 6.29 - Medical examination prior to employment - by industry sector
CountsAnalysis %Respondents
Total
Total
Yes No
Don'tknow /Don't
remember
Construction, Mining &Quarrying
Manufacturing, Agriculture,Hunting & Forestry, Electricity,Gas & Water Supply
Wholesale & Retail Trade,Repairs
Hotels & Restaurants
Transport, Storage &Communication
Real Estate, Renting, FinancialIntermediation & BusinessActivities
Public Administration
Education
Health & Social Work
Other Community, Social &Personal Service Activities
1398 52237.3%
84360.3%
332.4%
80 1518.8%
5973.8%
67.5%
213 9745.5%
11353.1%
31.4%
205 2914.1%
17384.4%
31.5%
130 3627.7%
9371.5%
10.8%
121 5948.8%
5948.8%
32.5%
211 7535.5%
13061.6%
62.8%
104 6259.6%
3836.5%
43.8%
138 6144.2%
7453.6%
32.2%
115 7161.7%
4236.5%
21.7%
81 1721.0%
6276.5%
22.5%
Table 6.30 - Medical examination prior to employment - by company size CountsAnalysis %Respondents
Total
Total
Yes No
Don'tknow /Don't
remember
Self-employed withoutemployees
1-9 employees
10-49 employees
50-249 employees
250-499 employees
500 employees or more
1398 52237.3%
84360.3%
332.4%
- --
--
--
324 5717.6%
26280.9%
51.5%
322 8024.8%
23673.3%
61.9%
389 15439.6%
22457.6%
112.8%
131 6045.8%
6851.9%
32.3%
232 17173.7%
5322.8%
83.4%
Table 6.29 - Medical examination prior to employment - by industry sector
Table 6.30 - Medical examination prior to employment - by company size

OCCUPATIONAL HEALTH AND SAFETY IN MALTA - A SNAPSHOT OF PREVAILING STANDARDS
214
238
Table 6.31 - Medical examination during employment - by industry sector
CountsAnalysis %Respondents
Total
Total
Yes No
Don'tknow /Don't
remember
Construction, Mining &Quarrying
Manufacturing, Agriculture,Hunting & Forestry, Electricity,Gas & Water Supply
Wholesale & Retail Trade,Repairs
Hotels & Restaurants
Transport, Storage &Communication
Real Estate, Renting, FinancialIntermediation & BusinessActivities
Public Administration
Education
Health & Social Work
Other Community, Social &Personal Service Activities
1398 20714.8%
116583.3%
261.9%
80 45.0%
7188.8%
56.3%
213 4320.2%
16677.9%
41.9%
205 83.9%
19595.1%
21.0%
130 129.2%
11890.8%
--
121 2419.8%
9780.2%
--
211 2813.3%
17683.4%
73.3%
104 2726.0%
7572.1%
21.9%
138 2417.4%
11180.4%
32.2%
115 2622.6%
8775.7%
21.7%
81 1113.6%
6985.2%
11.2%
Table 6.31 - Medical examination during employment - by industry sector

OCCUPATIONAL HEALTH AND SAFETY IN MALTA - A SNAPSHOT OF PREVAILING STANDARDS
215
239
Table 6.32- Personal protective equipment - by industry sector
CountsBreak %Respondents
Total
Total
StronglyAgree Agree
NeitherAgree
norDisagree Disagree
StronglyDisagree
Don'tKnow/
NA
Construction, Mining &Quarrying
Manufacturing, Agriculture,Hunting & Forestry, Electricity,Gas & Water Supply
Wholesale & Retail Trade,Repairs
Hotels & Restaurants
Transport, Storage &Communication
Real Estate, Renting, FinancialIntermediation & BusinessActivities
Public Administration
Education
Health & Social Work
Other Community, Social &Personal Service Activities
1398 450 423 107 48 55 315
805.7%
408.9%
307.1%
54.7%
24.2%
23.6%
10.3%
21315.2%
9320.7%
7918.7%
1413.1%
714.6%
59.1%
154.8%
20514.7%
4710.4%
5713.5%
1715.9%
1020.8%
916.4%
6520.6%
1309.3%
388.4%
4610.9%
76.5%
510.4%
916.4%
257.9%
1218.7%
388.4%
378.7%
1110.3%
48.3%
47.3%
278.6%
21115.1%
6314.0%
4811.3%
1917.8%
510.4%
59.1%
7122.5%
1047.4%
347.6%
255.9%
76.5%
510.4%
610.9%
278.6%
1389.9%
276.0%
327.6%
1211.2%
612.5%
916.4%
5216.5%
1158.2%
4510.0%
419.7%
1110.3%
36.3%
23.6%
134.1%
815.8%
255.6%
286.6%
43.7%
12.1%
47.3%
196.0%
Table 6.32- Personal protective equipment - by industry sector
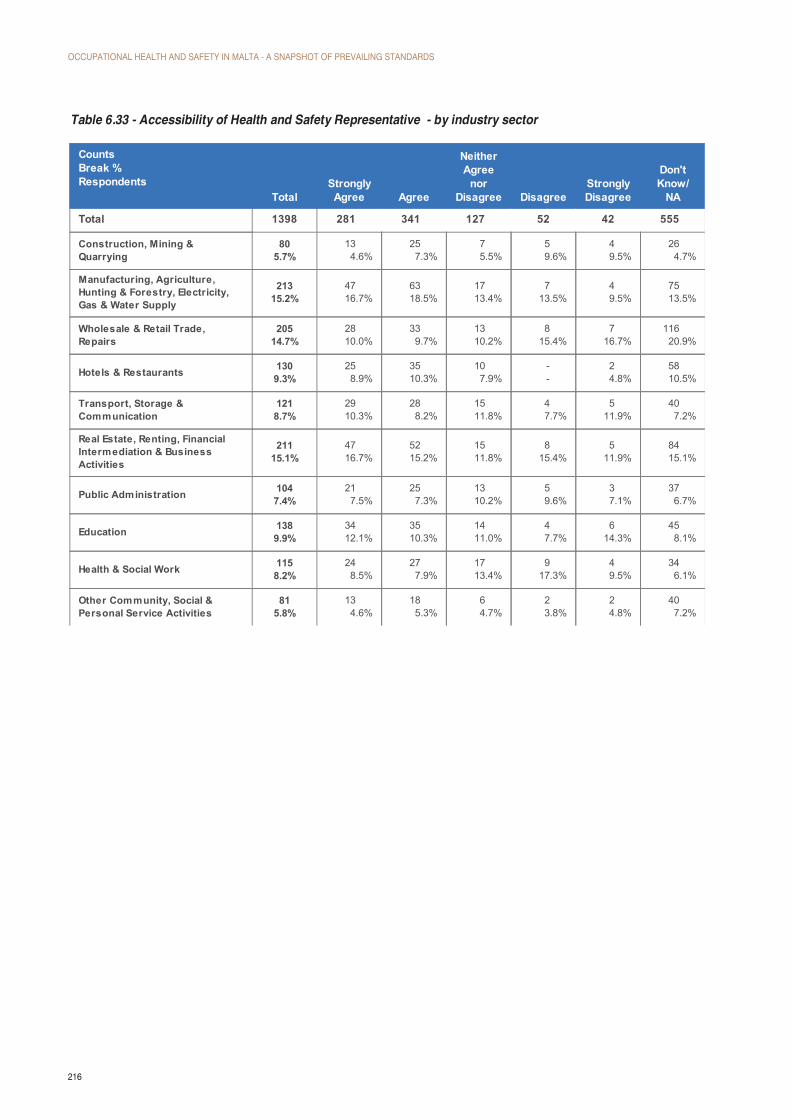
OCCUPATIONAL HEALTH AND SAFETY IN MALTA - A SNAPSHOT OF PREVAILING STANDARDS
216
240
Table 6.33 - Accessibil ity of Health and Safety Representative - by industry sector
CountsBreak %Respondents
Total
Total
StronglyAgree Agree
NeitherAgree
norDisagree Disagree
StronglyDisagree
Don'tKnow/
NA
Construction, Mining &Quarrying
Manufacturing, Agriculture,Hunting & Forestry, Electricity,Gas & Water Supply
Wholesale & Retail Trade,Repairs
Hotels & Restaurants
Transport, Storage &Communication
Real Estate, Renting, FinancialIntermediation & BusinessActivities
Public Administration
Education
Health & Social Work
Other Community, Social &Personal Service Activities
1398 281 341 127 52 42 555
805.7%
134.6%
257.3%
75.5%
59.6%
49.5%
264.7%
21315.2%
4716.7%
6318.5%
1713.4%
713.5%
49.5%
7513.5%
20514.7%
2810.0%
339.7%
1310.2%
815.4%
716.7%
11620.9%
1309.3%
258.9%
3510.3%
107.9%
--
24.8%
5810.5%
1218.7%
2910.3%
288.2%
1511.8%
47.7%
511.9%
407.2%
21115.1%
4716.7%
5215.2%
1511.8%
815.4%
511.9%
8415.1%
1047.4%
217.5%
257.3%
1310.2%
59.6%
37.1%
376.7%
1389.9%
3412.1%
3510.3%
1411.0%
47.7%
614.3%
458.1%
1158.2%
248.5%
277.9%
1713.4%
917.3%
49.5%
346.1%
815.8%
134.6%
185.3%
64.7%
23.8%
24.8%
407.2%
Table 6.33 - Accessibility of Health and Safety Representative - by industry sector

OCCUPATIONAL HEALTH AND SAFETY IN MALTA - A SNAPSHOT OF PREVAILING STANDARDS
217
241
Table 6.34 - Accessibil ity of Health and Safety Representative - by company size
CountsBreak %Respondents
Total
Total
StronglyAgree Agree
NeitherAgree
norDisagree Disagree
StronglyDisagree
Don'tKnow/
NA
Self-employed withoutemployees
1-9 employees
10-49 employees
50-249 employees
250-499 employees
500 employees or more
1398 281 341 127 52 42 555
--
--
--
--
--
--
--
32423.2%
4516.0%
6920.2%
2418.9%
917.3%
921.4%
16830.3%
32223.0%
6723.8%
5716.7%
2822.0%
1630.8%
921.4%
14526.1%
38927.8%
8329.5%
10229.9%
3023.6%
1223.1%
1535.7%
14726.5%
1319.4%
3111.0%
3610.6%
2217.3%
611.5%
37.1%
335.9%
23216.6%
5519.6%
7722.6%
2318.1%
917.3%
614.3%
6211.2%
Table 6.35 - Handling of complaints - by industry sector
CountsBreak %Respondents
Total
Total
StronglyAgree Agree
NeitherAgree
norDisagree Disagree
StronglyDisagree
Don'tKnow/
NA
Construction, Mining &Quarrying
Manufacturing, Agriculture,Hunting & Forestry, Electricity,Gas & Water Supply
Wholesale & Retail Trade,Repairs
Hotels & Restaurants
Transport, Storage &Communication
Real Estate, Renting, FinancialIntermediation & BusinessActivities
Public Administration
Education
Health & Social Work
Other Community, Social &Personal Service Activities
1398 383 493 241 75 39 167
805.7%
215.5%
316.3%
125.0%
56.7%
37.7%
84.8%
21315.2%
6216.2%
6713.6%
4518.7%
1621.3%
512.8%
1810.8%
20514.7%
5514.4%
6813.8%
3414.1%
79.3%
410.3%
3722.2%
1309.3%
389.9%
499.9%
218.7%
56.7%
12.6%
169.6%
1218.7%
359.1%
397.9%
218.7%
810.7%
410.3%
148.4%
21115.1%
6717.5%
8216.6%
2912.0%
79.3%
410.3%
2213.2%
1047.4%
225.7%
336.7%
197.9%
1013.3%
615.4%
148.4%
1389.9%
297.6%
5010.1%
2711.2%
79.3%
615.4%
1911.4%
1158.2%
297.6%
428.5%
229.1%
912.0%
512.8%
84.8%
815.8%
256.5%
326.5%
114.6%
11.3%
12.6%
116.6%
Table 6.34 - Accessibility of Health and Safety Representative - by company size
Table 6.35 - Handling of complaints - by industry sector
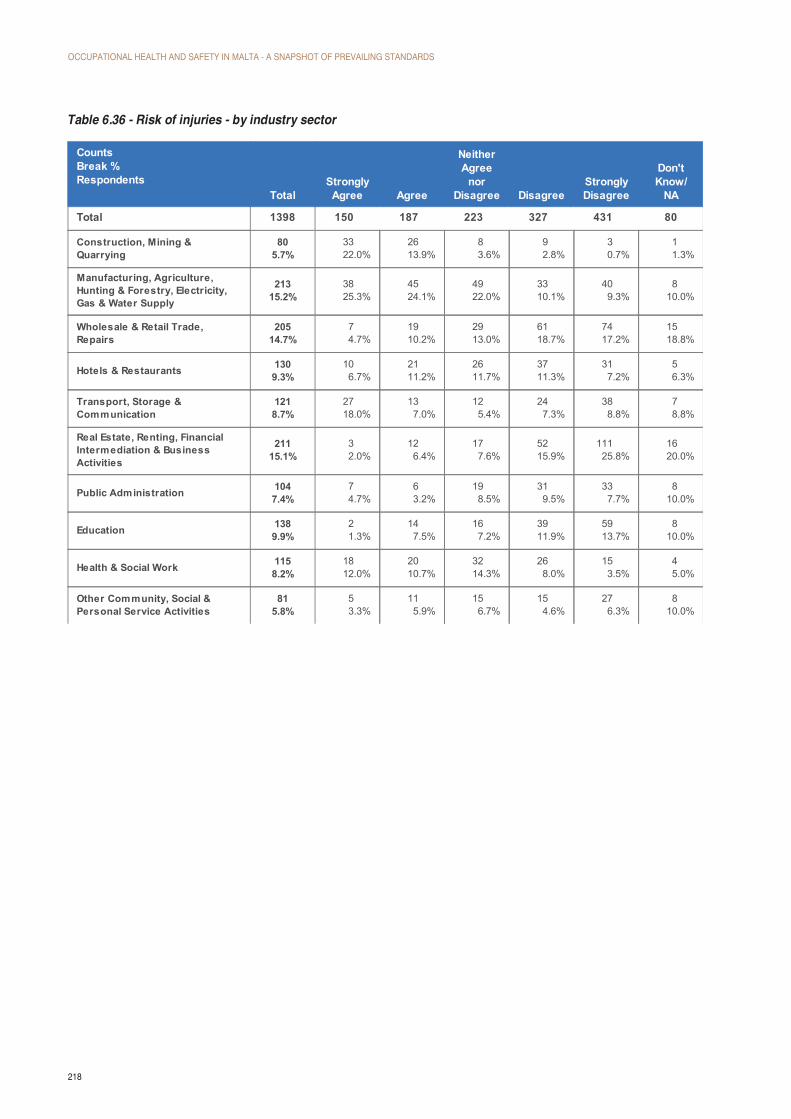
OCCUPATIONAL HEALTH AND SAFETY IN MALTA - A SNAPSHOT OF PREVAILING STANDARDS
218
242
Table 6.36 - Risk of injuries - by industry sector
CountsBreak %Respondents
Total
Total
StronglyAgree Agree
NeitherAgree
norDisagree Disagree
StronglyDisagree
Don'tKnow/
NA
Construction, Mining &Quarrying
Manufacturing, Agriculture,Hunting & Forestry, Electricity,Gas & Water Supply
Wholesale & Retail Trade,Repairs
Hotels & Restaurants
Transport, Storage &Communication
Real Estate, Renting, FinancialIntermediation & BusinessActivities
Public Administration
Education
Health & Social Work
Other Community, Social &Personal Service Activities
1398 150 187 223 327 431 80
805.7%
3322.0%
2613.9%
83.6%
92.8%
30.7%
11.3%
21315.2%
3825.3%
4524.1%
4922.0%
3310.1%
409.3%
810.0%
20514.7%
74.7%
1910.2%
2913.0%
6118.7%
7417.2%
1518.8%
1309.3%
106.7%
2111.2%
2611.7%
3711.3%
317.2%
56.3%
1218.7%
2718.0%
137.0%
125.4%
247.3%
388.8%
78.8%
21115.1%
32.0%
126.4%
177.6%
5215.9%
11125.8%
1620.0%
1047.4%
74.7%
63.2%
198.5%
319.5%
337.7%
810.0%
1389.9%
21.3%
147.5%
167.2%
3911.9%
5913.7%
810.0%
1158.2%
1812.0%
2010.7%
3214.3%
268.0%
153.5%
45.0%
815.8%
53.3%
115.9%
156.7%
154.6%
276.3%
810.0%
Table 6.36 - Risk of injuries - by industry sector

OCCUPATIONAL HEALTH AND SAFETY IN MALTA - A SNAPSHOT OF PREVAILING STANDARDS
219
243
Table 6.37 - Risk of i l l-health - by industry sector
CountsBreak %Respondents
Total
Total
StronglyAgree Agree
NeitherAgree
norDisagree Disagree
StronglyDisagree
Don'tKnow/
NA
Construction, Mining &Quarrying
Manufacturing, Agriculture,Hunting & Forestry, Electricity,Gas & Water Supply
Wholesale & Retail Trade,Repairs
Hotels & Restaurants
Transport, Storage &Communication
Real Estate, Renting, FinancialIntermediation & BusinessActivities
Public Administration
Education
Health & Social Work
Other Community, Social &Personal Service Activities
1398 133 204 239 307 432 83
805.7%
96.8%
136.4%
187.5%
206.5%
153.5%
56.0%
21315.2%
1612.0%
3115.2%
4518.8%
5417.6%
5813.4%
910.8%
20514.7%
86.0%
2612.7%
3113.0%
5016.3%
7417.1%
1619.3%
1309.3%
96.8%
115.4%
2610.9%
3511.4%
4310.0%
67.2%
1218.7%
1511.3%
2110.3%
135.4%
268.5%
378.6%
910.8%
21115.1%
64.5%
146.9%
2811.7%
4314.0%
10724.8%
1315.7%
1047.4%
118.3%
167.8%
187.5%
258.1%
286.5%
67.2%
1389.9%
139.8%
2813.7%
2912.1%
268.5%
337.6%
910.8%
1158.2%
3929.3%
3617.6%
166.7%
123.9%
92.1%
33.6%
815.8%
75.3%
83.9%
156.3%
165.2%
286.5%
78.4%
Table 6.38 - Risk of i l l-health - by company size
CountsBreak %Respondents
Total
Total
StronglyAgree Agree
NeitherAgree
norDisagree Disagree
StronglyDisagree
Don'tKnow/
NA
Self-employed withoutemployees
1-9 employees
10-49 employees
50-249 employees
250-499 employees
500 employees or more
1398 133 204 239 307 432 83
--
--
--
--
--
--
--
32423.2%
2216.5%
2411.8%
6025.1%
7424.1%
11426.4%
3036.1%
32223.0%
2921.8%
4723.0%
5322.2%
7123.1%
10825.0%
1416.9%
38927.8%
3627.1%
5828.4%
5623.4%
8628.0%
12428.7%
2934.9%
1319.4%
1612.0%
178.3%
2410.0%
309.8%
399.0%
56.0%
23216.6%
3022.6%
5828.4%
4619.2%
4615.0%
4710.9%
56.0%
Table 6.37 - Risk of ill-health - by industry sector
Table 6.38 - Risk of ill-health - by company size

OCCUPATIONAL HEALTH AND SAFETY IN MALTA - A SNAPSHOT OF PREVAILING STANDARDS
220
244
Table 6.39 - Use of OHSA services - by industry sector
CountsAnalysis %Respondents
Total
Total
Yes No
Construction, Mining &Quarrying
Manufacturing, Agriculture,Hunting & Forestry, Electricity,Gas & Water Supply
Wholesale & Retail Trade,Repairs
Hotels & Restaurants
Transport, Storage &Communication
Real Estate, Renting, FinancialIntermediation & BusinessActivities
Public Administration
Education
Health & Social Work
Other Community, Social &Personal Service Activities
1603 17911.2%
142488.8%
106 1817.0%
8883.0%
240 3012.5%
21087.5%
266 186.8%
24893.2%
139 2215.8%
11784.2%
126 86.3%
11893.7%
229 187.9%
21192.1%
104 1716.3%
8783.7%
144 128.3%
13291.7%
121 1915.7%
10284.3%
128 1713.3%
11186.7%
Table 6.39 - Use of OHSA services - by industry sector
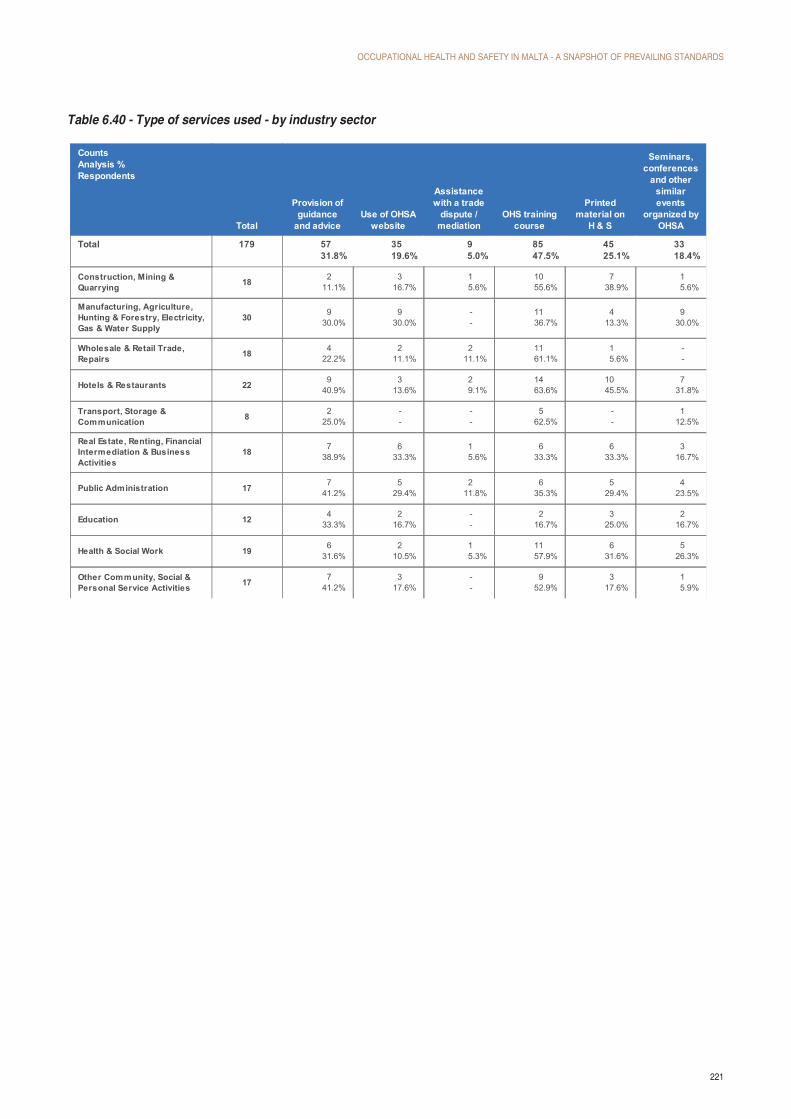
OCCUPATIONAL HEALTH AND SAFETY IN MALTA - A SNAPSHOT OF PREVAILING STANDARDS
221
245
Table 6.40 - Type of services used - by industry sector
CountsAnalysis %Respondents
Total
Total
Provision ofguidance
and adviceUse of OHSA
website
Assistancewith a trade
dispute /mediation
OHS trainingcourse
Printedmaterial on
H & S
Seminars,conferences
and othersimilarevents
organized byOHSA
Construction, Mining &Quarrying
Manufacturing, Agriculture,Hunting & Forestry, Electricity,Gas & Water Supply
Wholesale & Retail Trade,Repairs
Hotels & Restaurants
Transport, Storage &Communication
Real Estate, Renting, FinancialIntermediation & BusinessActivities
Public Administration
Education
Health & Social Work
Other Community, Social &Personal Service Activities
179 5731.8%
3519.6%
95.0%
8547.5%
4525.1%
3318.4%
18 211.1%
316.7%
15.6%
1055.6%
738.9%
15.6%
30 930.0%
930.0%
--
1136.7%
413.3%
930.0%
18 422.2%
211.1%
211.1%
1161.1%
15.6%
--
22 940.9%
313.6%
29.1%
1463.6%
1045.5%
731.8%
8 225.0%
--
--
562.5%
--
112.5%
18 738.9%
633.3%
15.6%
633.3%
633.3%
316.7%
17 741.2%
529.4%
211.8%
635.3%
529.4%
423.5%
12 433.3%
216.7%
--
216.7%
325.0%
216.7%
19 631.6%
210.5%
15.3%
1157.9%
631.6%
526.3%
17 741.2%
317.6%
--
952.9%
317.6%
15.9%
Table 6.40 - Type of services used - by industry sector

OCCUPATIONAL HEALTH AND SAFETY IN MALTA - A SNAPSHOT OF PREVAILING STANDARDS
222
246
Table 6.41 - Satisfaction with the provision of guidance and advice - by industry sector
CountsAnalysis %Respondents
Total
Total
Notsatisfied at
allNot
satisfied
Neithersatisfied
nordissatisfied Satisfied
Verysatisfied
Notapplicable
Construction, Mining &Quarrying
Manufacturing, Agriculture,Hunting & Forestry, Electricity,Gas & Water Supply
Wholesale & Retail Trade,Repairs
Hotels & Restaurants
Transport, Storage &Communication
Real Estate, Renting, FinancialIntermediation & BusinessActivities
Public Administration
Education
Health & Social Work
Other Community, Social &Personal Service Activities
57 35.3%
47.0%
58.8%
2849.1%
1729.8%
--
2 --
150.0%
150.0%
--
--
--
9 111.1%
222.2%
111.1%
333.3%
222.2%
--
4 --
--
--
375.0%
125.0%
--
9 --
--
--
888.9%
111.1%
--
2 --
--
--
150.0%
150.0%
--
7 114.3%
--
114.3%
228.6%
342.9%
--
7 --
--
--
571.4%
228.6%
--
4 125.0%
--
125.0%
125.0%
125.0%
--
6 --
--
116.7%
116.7%
466.7%
--
7 --
114.3%
--
457.1%
228.6%
--
Table 6.42 - Satisfaction with OHS training courses - by industry sector
CountsAnalysis %Respondents
Total
Total
Not satisfiedat all Not satisfied
Neithersatisfied nordissatisfied Satisfied Verysatisfied
Notapplicable
Construction, Mining &Quarrying
Manufacturing, Agriculture,Hunting & Forestry, Electricity,Gas & Water Supply
Wholesale & Retail Trade,Repairs
Hotels & Restaurants
Transport, Storage &Communication
Real Estate, Renting, FinancialIntermediation & BusinessActivities
Public Administration
Education
Health & Social Work
Other Community, Social &Personal Service Activities
85 --
11.2%
55.9%
6171.8%
1720.0%
11.2%
10 --
--
--
880.0%
110.0%
110.0%
11 --
--
19.1%
981.8%
19.1%
--
11 --
--
19.1%
763.6%
327.3%
--
14 --
--
17.1%
1178.6%
214.3%
--
5 --
--
120.0%
240.0%
240.0%
--
6 --
--
--
583.3%
116.7%
--
6 --
--
116.7%
583.3%
--
--
2 --
150.0%
--
150.0%
--
--
11 --
--
--
763.6%
436.4%
--
9 --
--
--
666.7%
333.3%
--
Table 6.41 - Satisfaction with the provision of guidance and advice - by industry sector
Table 6.42 - Satisfaction with OHS training courses - by industry sector
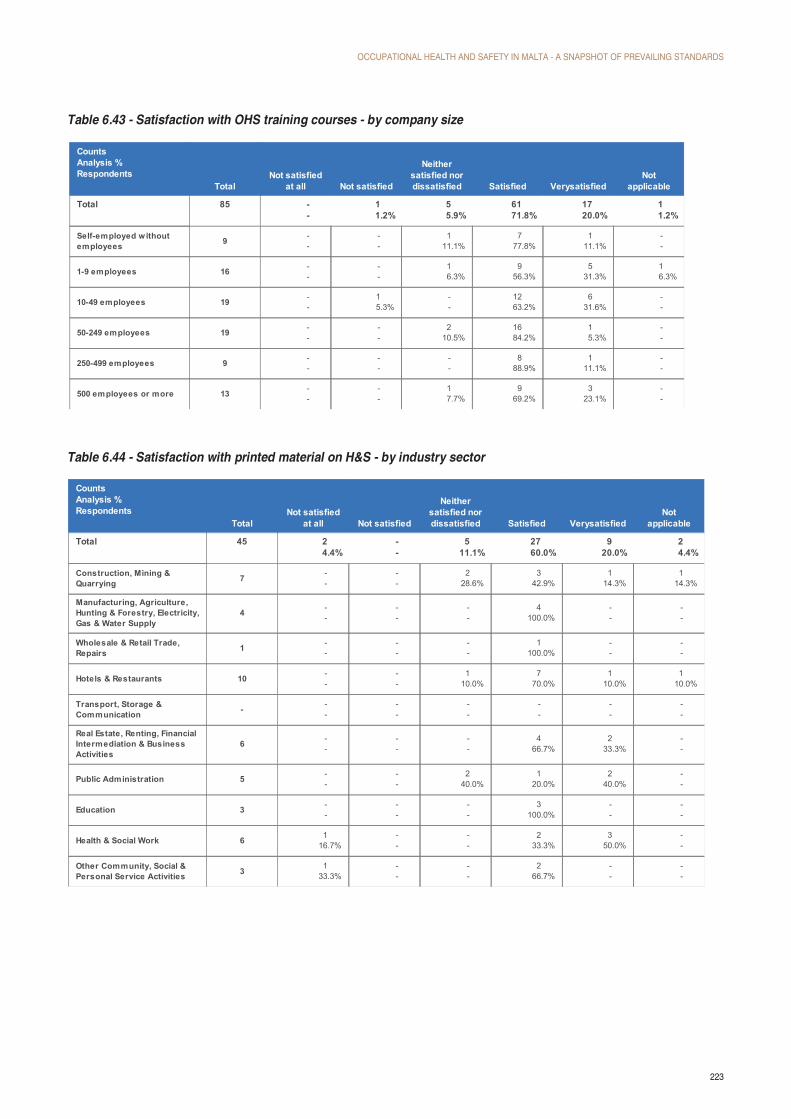
OCCUPATIONAL HEALTH AND SAFETY IN MALTA - A SNAPSHOT OF PREVAILING STANDARDS
223
247
Table 6.43 - Satisfaction with OHS training courses - by company size
CountsAnalysis %Respondents
Total
Total
Not satisfiedat all Not satisfied
Neithersatisfied nordissatisfied Satisfied Verysatisfied
Notapplicable
Self-employed withoutemployees
1-9 employees
10-49 employees
50-249 employees
250-499 employees
500 employees or more
85 --
11.2%
55.9%
6171.8%
1720.0%
11.2%
9 --
--
111.1%
777.8%
111.1%
--
16 --
--
16.3%
956.3%
531.3%
16.3%
19 --
15.3%
--
1263.2%
631.6%
--
19 --
--
210.5%
1684.2%
15.3%
--
9 --
--
--
888.9%
111.1%
--
13 --
--
17.7%
969.2%
323.1%
--
Table 6.44 - Satisfaction with printed material on H&S - by industry sector
CountsAnalysis %Respondents
Total
Total
Not satisfiedat all Not satisfied
Neithersatisfied nordissatisfied Satisfied Verysatisfied
Notapplicable
Construction, Mining &Quarrying
Manufacturing, Agriculture,Hunting & Forestry, Electricity,Gas & Water Supply
Wholesale & Retail Trade,Repairs
Hotels & Restaurants
Transport, Storage &Communication
Real Estate, Renting, FinancialIntermediation & BusinessActivities
Public Administration
Education
Health & Social Work
Other Community, Social &Personal Service Activities
45 24.4%
--
511.1%
2760.0%
920.0%
24.4%
7 --
--
228.6%
342.9%
114.3%
114.3%
4 --
--
--
4100.0%
--
--
1 --
--
--
1100.0%
--
--
10 --
--
110.0%
770.0%
110.0%
110.0%
- --
--
--
--
--
--
6 --
--
--
466.7%
233.3%
--
5 --
--
240.0%
120.0%
240.0%
--
3 --
--
--
3100.0%
--
--
6 116.7%
--
--
233.3%
350.0%
--
3 133.3%
--
--
266.7%
--
--
Table 6.43 - Satisfaction with OHS training courses - by company size
Table 6.44 - Satisfaction with printed material on H&S - by industry sector

OCCUPATIONAL HEALTH AND SAFETY IN MALTA - A SNAPSHOT OF PREVAILING STANDARDS
224
248
Table 6.45- Contact person in case of complaint - by industry sector
CountsAnalysis %Respondents
Total
Total
The manager/ owner /director OHSA
A TradeUnion repre-
sentative
The OHSWorkers Re-presentative
Yourimmediate
supervisor /foreman
The OHSmanager Other
Construction, Mining& Quarrying
Manufacturing,Agriculture, Hunting& Forestry, Electricity,Gas & Water Supply
Wholesale & RetailTrade, Repairs
Hotels & Restaurants
Transport, Storage &Communication
Real Estate, Renting,FinancialIntermediation &Business Activities
Public Administration
Education
Health & Social Work
Other Community,Social & PersonalService Activities
1603 86654.0%
24615.3%
875.4%
20012.5%
28517.8%
1519.4%
1499.3%
106 5148.1%
3028.3%
54.7%
76.6%
2119.8%
54.7%
76.6%
240 11045.8%
3916.3%
93.8%
3715.4%
6225.8%
3313.8%
187.5%
266 16060.2%
5018.8%
72.6%
103.8%
2910.9%
93.4%
3011.3%
139 8259.0%
1712.2%
32.2%
2215.8%
2719.4%
107.2%
96.5%
126 7458.7%
97.1%
75.6%
1713.5%
2519.8%
1713.5%
1411.1%
229 13559.0%
3214.0%
83.5%
2912.7%
3615.7%
4017.5%
135.7%
104 5956.7%
1211.5%
54.8%
1615.4%
2322.1%
1110.6%
54.8%
144 7854.2%
117.6%
1611.1%
3121.5%
117.6%
139.0%
1812.5%
121 6755.4%
1915.7%
2016.5%
2319.0%
2924.0%
108.3%
108.3%
128 5039.1%
2721.1%
75.5%
86.3%
2217.2%
32.3%
2519.5%
Table 6.46 - Contact person in case of complaint - by company size
CountsAnalysis %Respondents
Total
Total
The manager/ owner /director OHSA
A TradeUnion repre-
sentative
The OHSWorkers Re-presentative
Yourimmediate
supervisor /foreman
The OHSmanager Other
I am self-employedw ithout employees
1-9 employees
10-49 employees
50-249 employees
250-499 employees
500 employees ormore
1603 86654.0%
24615.3%
875.4%
20012.5%
28517.8%
1519.4%
1499.3%
205 167.8%
10953.2%
157.3%
73.4%
31.5%
42.0%
6531.7%
324 20964.5%
5115.7%
72.2%
103.1%
5416.7%
113.4%
206.2%
322 22268.9%
247.5%
154.7%
309.3%
5115.8%
247.5%
195.9%
389 24563.0%
307.7%
174.4%
6015.4%
8822.6%
5012.9%
225.7%
131 6549.6%
107.6%
96.9%
2821.4%
3728.2%
2015.3%
53.8%
232 10947.0%
229.5%
2410.3%
6528.0%
5222.4%
4218.1%
187.8%
Table 6.45- Contact person in case of complaint - by industry sector
Table 6.46 - Contact person in case of complaint - by company size

OCCUPATIONAL HEALTH AND SAFETY IN MALTA - A SNAPSHOT OF PREVAILING STANDARDS
225
249
Table 6.45 - Occupational injuries in 2010 - by industry sector
CountsAnalysis %Respondents
Total
Total
Yes No Refused
Construction, Mining &Quarrying
Manufacturing, Agriculture,Hunting & Forestry, Electricity,Gas & Water Supply
Wholesale & Retail Trade,Repairs
Hotels & Restaurants
Transport, Storage &Communication
Real Estate, Renting, FinancialIntermediation & BusinessActivities
Public Administration
Education
Health & Social Work
Other Community, Social &Personal Service Activities
1603 945.9%
150794.0%
20.1%
106 1514.2%
9185.8%
--
240 3012.5%
21087.5%
--
266 93.4%
25796.6%
--
139 64.3%
13295.0%
10.7%
126 97.1%
11792.9%
--
229 31.3%
22698.7%
--
104 43.8%
10096.2%
--
144 42.8%
14097.2%
--
121 108.3%
11090.9%
10.8%
128 43.1%
12496.9%
--
Table 6.45 - Occupational injuries in 2010 - by industry sector

OCCUPATIONAL HEALTH AND SAFETY IN MALTA - A SNAPSHOT OF PREVAILING STANDARDS
226
250
Table 6.48 - Certif ied occupational injuries in 2010 - by industry sector
CountsAnalysis %Respondents
Total
Total
Yes No
Construction, Mining &Quarrying
Manufacturing, Agriculture,Hunting & Forestry, Electricity,Gas & Water Supply
Wholesale & Retail Trade,Repairs
Hotels & Restaurants
Transport, Storage &Communication
Real Estate, Renting, FinancialIntermediation & BusinessActivities
Public Administration
Education
Health & Social Work
Other Community, Social &Personal Service Activities
94 6468.1%
3031.9%
15 1066.7%
533.3%
30 2583.3%
516.7%
9 777.8%
222.2%
6 350.0%
350.0%
9 888.9%
111.1%
3 --
3100.0%
4 250.0%
250.0%
4 250.0%
250.0%
10 550.0%
550.0%
4 250.0%
250.0%
Table 6.48 - Certified occupational injuries in 2010 - by industry sector

OCCUPATIONAL HEALTH AND SAFETY IN MALTA - A SNAPSHOT OF PREVAILING STANDARDS
227
251
Table 6.50 - Investigation of accidents - by industry sector
CountsAnalysis %Respondents
Total
Total
Yes NoDon'tknow
Construction, Mining &Quarrying
Manufacturing, Agriculture,Hunting & Forestry, Electricity,Gas & Water Supply
Wholesale & Retail Trade,Repairs
Hotels & Restaurants
Transport, Storage &Communication
Real Estate, Renting, FinancialIntermediation & BusinessActivities
Public Administration
Education
Health & Social Work
Other Community, Social &Personal Service Activities
58 4170.7%
1322.4%
46.9%
8 562.5%
337.5%
--
23 1669.6%
626.1%
14.3%
6 583.3%
--
116.7%
3 266.7%
--
133.3%
8 675.0%
112.5%
112.5%
- --
--
--
2 150.0%
150.0%
--
1 1100.0%
--
--
5 360.0%
240.0%
--
2 2100.0%
--
--
Table 6.50 - Investigation of accidents - by industry sector
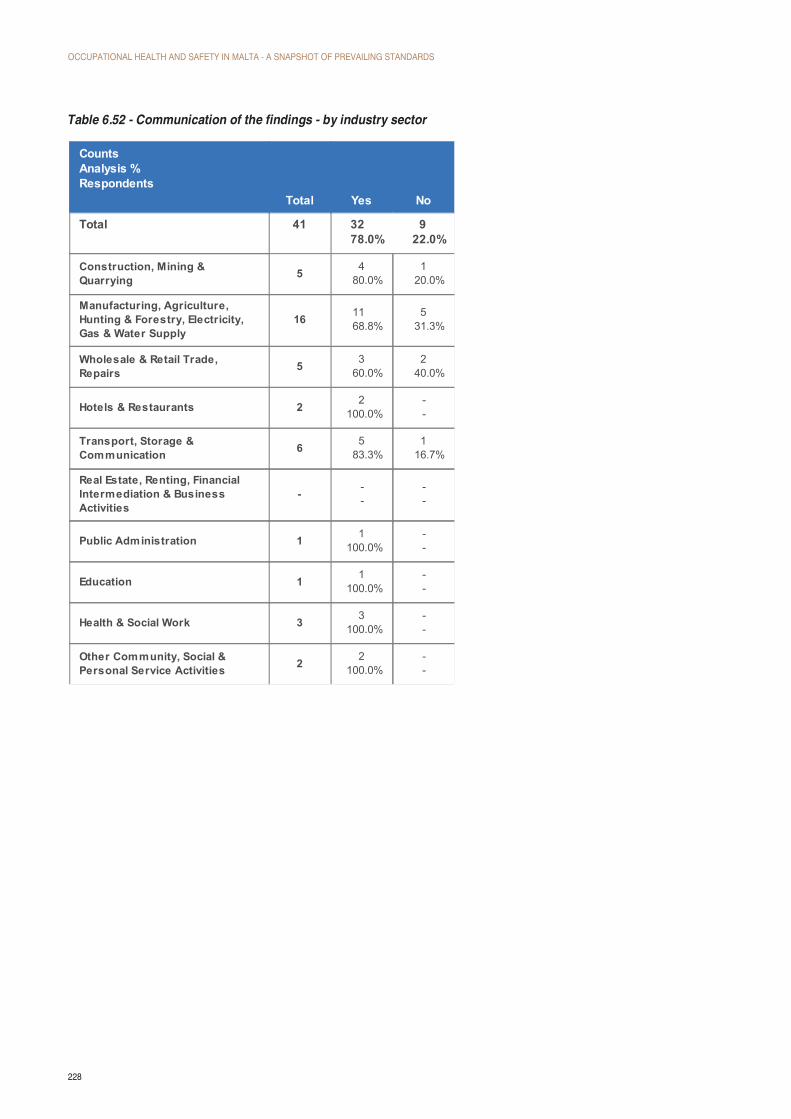
OCCUPATIONAL HEALTH AND SAFETY IN MALTA - A SNAPSHOT OF PREVAILING STANDARDS
228
252
Table 6.52 - Communication of the findings - by industry sector
CountsAnalysis %Respondents
Total
Total
Yes No
Construction, Mining &Quarrying
Manufacturing, Agriculture,Hunting & Forestry, Electricity,Gas & Water Supply
Wholesale & Retail Trade,Repairs
Hotels & Restaurants
Transport, Storage &Communication
Real Estate, Renting, FinancialIntermediation & BusinessActivities
Public Administration
Education
Health & Social Work
Other Community, Social &Personal Service Activities
41 3278.0%
922.0%
5 480.0%
120.0%
16 1168.8%
531.3%
5 360.0%
240.0%
2 2100.0%
--
6 583.3%
116.7%
- --
--
1 1100.0%
--
1 1100.0%
--
3 3100.0%
--
2 2100.0%
--
Table 6.52 - Communication of the findings - by industry sector

OCCUPATIONAL HEALTH AND SAFETY IN MALTA - A SNAPSHOT OF PREVAILING STANDARDS
229
253
Table 6.54- Remedial action - by industry sector
CountsAnalysis %Respondents
Total
Total
Yes NoDon'tknow
Construction, Mining &Quarrying
Manufacturing, Agriculture,Hunting & Forestry, Electricity,Gas & Water Supply
Wholesale & Retail Trade,Repairs
Hotels & Restaurants
Transport, Storage &Communication
Real Estate, Renting, FinancialIntermediation & BusinessActivities
Public Administration
Education
Health & Social Work
Other Community, Social &Personal Service Activities
58 4170.7%
915.5%
813.8%
8 675.0%
112.5%
112.5%
23 1565.2%
626.1%
28.7%
6 583.3%
--
116.7%
3 133.3%
133.3%
133.3%
8 562.5%
112.5%
225.0%
- --
--
--
2 150.0%
--
150.0%
1 1100.0%
--
--
5 5100.0%
--
--
2 2100.0%
--
--
Table 6.54- Remedial action - by industry sector

OCCUPATIONAL HEALTH AND SAFETY IN MALTA - A SNAPSHOT OF PREVAILING STANDARDS
230
254
Table 6.55- Physical i l l-health in 2010 - by industry sector
CountsAnalysis %Respondents
Total
Total
Yes No Refused
Construction, Mining &Quarrying
Manufacturing, Agriculture,Hunting & Forestry, Electricity,Gas & Water Supply
Wholesale & Retail Trade,Repairs
Hotels & Restaurants
Transport, Storage &Communication
Real Estate, Renting, FinancialIntermediation & BusinessActivities
Public Administration
Education
Health & Social Work
Other Community, Social &Personal Service Activities
1603 1459.0%
145290.6%
60.4%
106 1615.1%
9084.9%
--
240 187.5%
22292.5%
--
266 176.4%
24893.2%
10.4%
139 75.0%
13295.0%
--
126 1411.1%
11188.1%
10.8%
229 167.0%
21292.6%
10.4%
104 98.7%
9389.4%
21.9%
144 1812.5%
12687.5%
--
121 1915.7%
10183.5%
10.8%
128 118.6%
11791.4%
--
Table 6.55- Physical ill-health in 2010 - by industry sector

OCCUPATIONAL HEALTH AND SAFETY IN MALTA - A SNAPSHOT OF PREVAILING STANDARDS
231
255
Table 6.57 - Verified il l-health in 2010 - by industry sector
CountsAnalysis %Respondents
Total
Total
Yes No
Construction, Mining &Quarrying
Manufacturing, Agriculture,Hunting & Forestry, Electricity,Gas & Water Supply
Wholesale & Retail Trade,Repairs
Hotels & Restaurants
Transport, Storage &Communication
Real Estate, Renting, FinancialIntermediation & BusinessActivities
Public Administration
Education
Health & Social Work
Other Community, Social &Personal Service Activities
145 6645.5%
7954.5%
16 956.3%
743.8%
18 738.9%
1161.1%
17 529.4%
1270.6%
7 228.6%
571.4%
14 750.0%
750.0%
16 850.0%
850.0%
9 444.4%
555.6%
18 1161.1%
738.9%
19 736.8%
1263.2%
11 654.5%
545.5%
Table 6.57 - Verified ill-health in 2010 - by industry sector
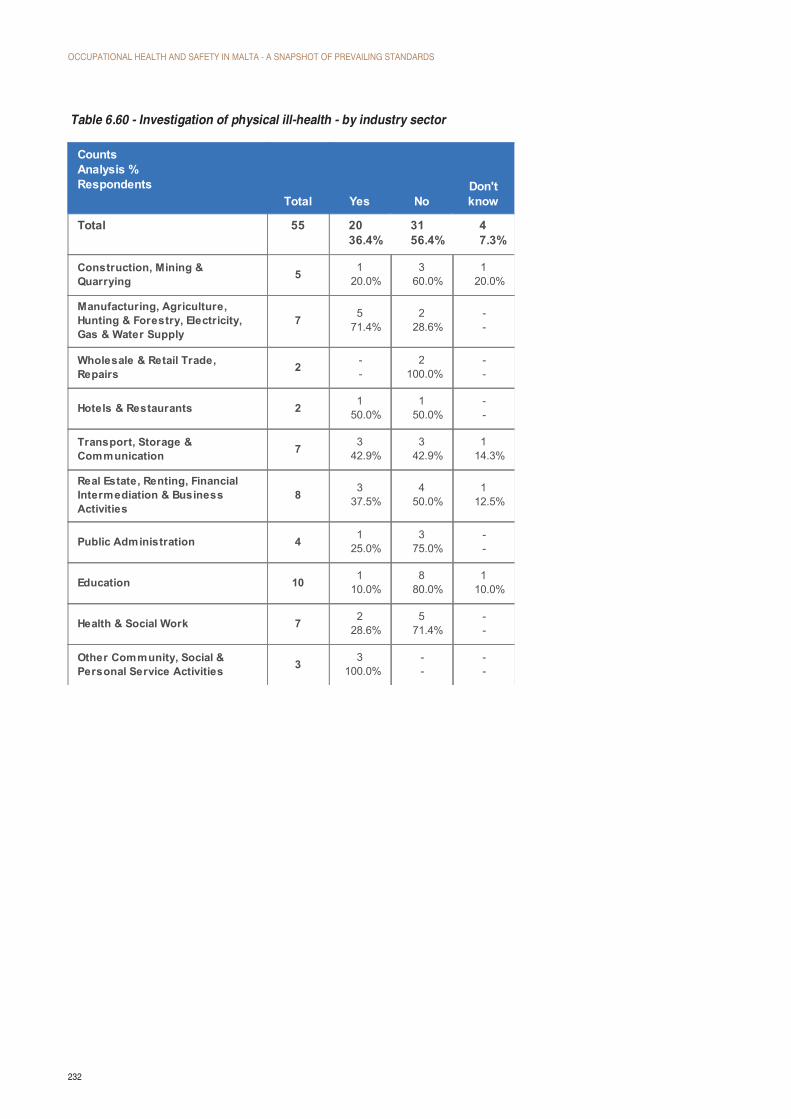
OCCUPATIONAL HEALTH AND SAFETY IN MALTA - A SNAPSHOT OF PREVAILING STANDARDS
232
256
Table 6.60 - Investigation of physical i l l-health - by industry sector
CountsAnalysis %Respondents
Total
Total
Yes NoDon'tknow
Construction, Mining &Quarrying
Manufacturing, Agriculture,Hunting & Forestry, Electricity,Gas & Water Supply
Wholesale & Retail Trade,Repairs
Hotels & Restaurants
Transport, Storage &Communication
Real Estate, Renting, FinancialIntermediation & BusinessActivities
Public Administration
Education
Health & Social Work
Other Community, Social &Personal Service Activities
55 2036.4%
3156.4%
47.3%
5 120.0%
360.0%
120.0%
7 571.4%
228.6%
--
2 --
2100.0%
--
2 150.0%
150.0%
--
7 342.9%
342.9%
114.3%
8 337.5%
450.0%
112.5%
4 125.0%
375.0%
--
10 110.0%
880.0%
110.0%
7 228.6%
571.4%
--
3 3100.0%
--
--
Table 6.60 - Investigation of physical ill-health - by industry sector

OCCUPATIONAL HEALTH AND SAFETY IN MALTA - A SNAPSHOT OF PREVAILING STANDARDS
233
257
Table 6.61 - Communication of the findings - by industry sector
CountsAnalysis %Respondents
Total
Total
Yes No
Construction, Mining &Quarrying
Manufacturing, Agriculture,Hunting & Forestry, Electricity,Gas & Water Supply
Wholesale & Retail Trade,Repairs
Hotels & Restaurants
Transport, Storage &Communication
Real Estate, Renting, FinancialIntermediation & BusinessActivities
Public Administration
Education
Health & Social Work
Other Community, Social &Personal Service Activities
20 1680.0%
420.0%
1 --
1100.0%
5 480.0%
120.0%
- --
--
1 1100.0%
--
3 266.7%
133.3%
3 3100.0%
--
1 1100.0%
--
1 1100.0%
--
2 2100.0%
--
3 266.7%
133.3%
Table 6.61 - Communication of the findings - by industry sector
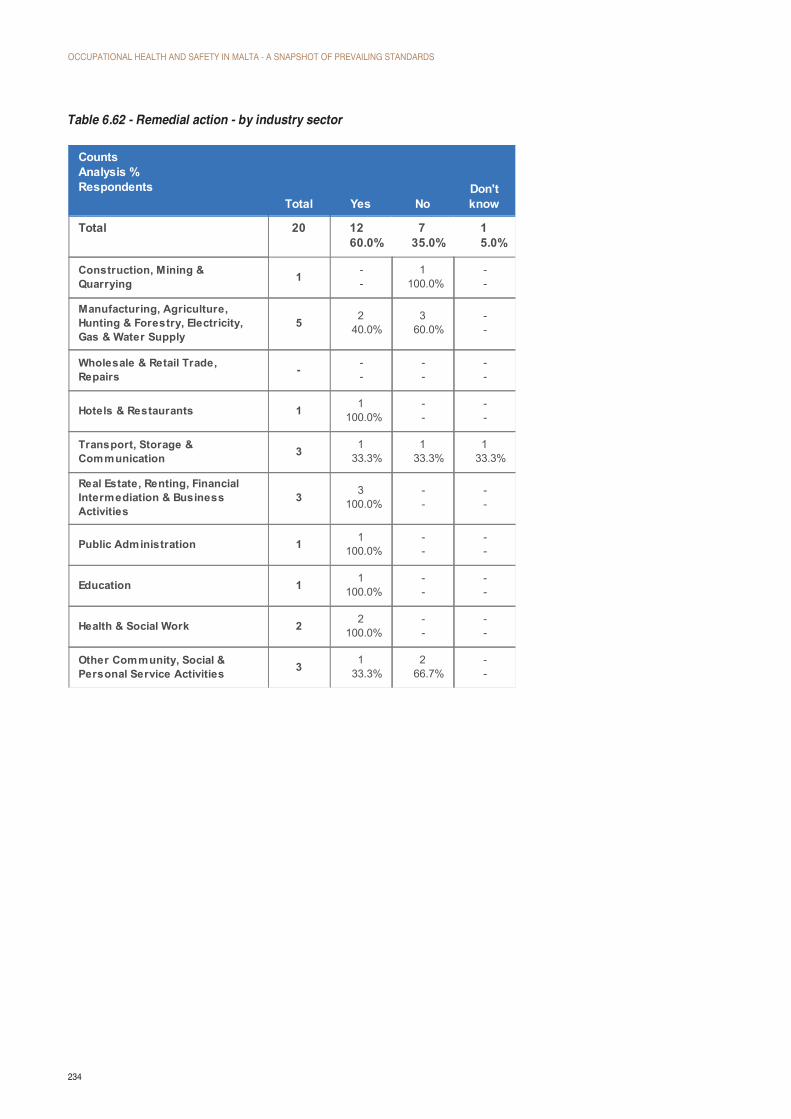
OCCUPATIONAL HEALTH AND SAFETY IN MALTA - A SNAPSHOT OF PREVAILING STANDARDS
234
258
Table 6.62 - Remedial action - by industry sector
CountsAnalysis %Respondents
Total
Total
Yes NoDon'tknow
Construction, Mining &Quarrying
Manufacturing, Agriculture,Hunting & Forestry, Electricity,Gas & Water Supply
Wholesale & Retail Trade,Repairs
Hotels & Restaurants
Transport, Storage &Communication
Real Estate, Renting, FinancialIntermediation & BusinessActivities
Public Administration
Education
Health & Social Work
Other Community, Social &Personal Service Activities
20 1260.0%
735.0%
15.0%
1 --
1100.0%
--
5 240.0%
360.0%
--
- --
--
--
1 1100.0%
--
--
3 133.3%
133.3%
133.3%
3 3100.0%
--
--
1 1100.0%
--
--
1 1100.0%
--
--
2 2100.0%
--
--
3 133.3%
266.7%
--
Table 6.62 - Remedial action - by industry sector

OCCUPATIONAL HEALTH AND SAFETY IN MALTA - A SNAPSHOT OF PREVAILING STANDARDS
235
259
Table 6.63 - Certif ied stress caused by work during 2010 - by industry sector
CountsAnalysis %Respondents
Total
Total
Yes No Refused
Construction, Mining &Quarrying
Manufacturing, Agriculture,Hunting & Forestry, Electricity,Gas & Water Supply
Wholesale & Retail Trade,Repairs
Hotels & Restaurants
Transport, Storage &Communication
Real Estate, Renting, FinancialIntermediation & BusinessActivities
Public Administration
Education
Health & Social Work
Other Community, Social &Personal Service Activities
1398 745.3%
131794.2%
70.5%
80 67.5%
7492.5%
--
213 31.4%
21098.6%
--
205 62.9%
19896.6%
10.5%
130 53.8%
12596.2%
--
121 65.0%
11494.2%
10.8%
211 83.8%
20396.2%
--
104 98.7%
9490.4%
11.0%
138 128.7%
12691.3%
--
115 119.6%
10288.7%
21.7%
81 89.9%
7187.7%
22.5%
Table 6.63 - Certified stress caused by work during 2010 - by industry sector

OCCUPATIONAL HEALTH AND SAFETY IN MALTA - A SNAPSHOT OF PREVAILING STANDARDS
236
260
Table 6.65 - Action taken in case of injury or i l l -health - by industry sector
CountsAnalysis %Respondents
Total
Total
I filled the NI30 form andtook injury
leaveI only tooksick leave
I utilizedvacation
leave
I reported itbut continuedgoing to work
I did notreport it andcontinuedworking
Construction, Mining &Quarrying
Manufacturing, Agriculture,Hunting & Forestry, Electricity,Gas & Water Supply
Wholesale & Retail Trade,Repairs
Hotels & Restaurants
Transport, Storage &Communication
Real Estate, Renting, FinancialIntermediation & BusinessActivities
Public Administration
Education
Health & Social Work
Other Community, Social &Personal Service Activities
268 3111.6%
10338.4%
41.5%
3513.1%
9836.6%
29 517.2%
1137.9%
--
620.7%
827.6%
46 919.6%
2043.5%
--
919.6%
817.4%
28 414.3%
828.6%
--
27.1%
1450.0%
17 15.9%
317.6%
--
423.5%
952.9%
24 416.7%
937.5%
14.2%
520.8%
520.8%
23 --
1147.8%
--
28.7%
1043.5%
17 211.8%
529.4%
15.9%
--
1164.7%
31 13.2%
1651.6%
--
13.2%
1341.9%
33 26.1%
1339.4%
26.1%
515.2%
1133.3%
20 315.0%
735.0%
--
15.0%
945.0%
Table 6.65 - Action taken in case of injury or ill-health - by industry sector

OCCUPATIONAL HEALTH AND SAFETY IN MALTA - A SNAPSHOT OF PREVAILING STANDARDS
237
261
Table 6.71 - Lost income during injury/sick leave in 2010 - by industry sector
CountsAnalysis %Respondents
Total
Total
Yes No
Don'tknow /Don't
remember
Construction, Mining &Quarrying
Manufacturing, Agriculture,Hunting & Forestry, Electricity,Gas & Water Supply
Wholesale & Retail Trade,Repairs
Hotels & Restaurants
Transport, Storage &Communication
Real Estate, Renting, FinancialIntermediation & BusinessActivities
Public Administration
Education
Health & Social Work
Other Community, Social &Personal Service Activities
133 3425.6%
9571.4%
43.0%
16 743.8%
850.0%
16.3%
29 827.6%
2069.0%
13.4%
12 325.0%
866.7%
18.3%
4 125.0%
375.0%
--
13 323.1%
969.2%
17.7%
11 218.2%
981.8%
--
6 233.3%
466.7%
--
17 211.8%
1588.2%
--
15 426.7%
1173.3%
--
10 220.0%
880.0%
--
Table 6.71 - Lost income during injury/sick leave in 2010 - by industry sector

OCCUPATIONAL HEALTH AND SAFETY IN MALTA - A SNAPSHOT OF PREVAILING STANDARDS
238
This study has set out
to estimate the costs of prevailing risk
levels of occupational injuries
and non-injury accidents
and of physical and psychological
ill-health for Malta in 2010

262
CountsBreak %Respondents
Total
Total
Yes, full timeon OHS
Yes, OHS fallsunder one of t-he responsibil-ity of a particu-lar employee
Yes, retainerbasis
(externalconsultant) No Don't know
Manufacturing; Agriculture,hunting & forestry; Electricity,gas & water supply
Construction, Mining andquarrying
Wholesale & Retail trade, repairs
Hotels & Restaurants
Transport, Storage andCommunications
Financial intermediation, RealEstate & Renting and Businessactivities
Public administration;compulsory social security
Education
Health and social work
Other community, social andpersonal service activities
1200 1099.1%
28023.3%
635.3%
73861.5%
100.8%
173 116.4%
4324.9%
63.5%
11264.7%
10.6%
49 612.2%
714.3%
1122.4%
2551.0%
--
416 215.0%
6615.9%
112.6%
31475.5%
41.0%
132 1612.1%
5642.4%
75.3%
5138.6%
21.5%
115 1311.3%
2219.1%
54.3%
7363.5%
21.7%
101 109.9%
3231.7%
87.9%
5150.5%
--
8 450.0%
225.0%
112.5%
112.5%
--
65 57.7%
1523.1%
710.8%
3756.9%
11.5%
23 417.4%
626.1%
28.7%
1147.8%
--
118 1916.1%
3126.3%
54.2%
6353.4%
--
11. APPENDIX B - Supplementary ‘Employer’ Survey Findings
Table 7.3 Designation of Person on OHS Issues - by Industry Sector
11. APPENDIX B - SUPPLEMENTARY ‘EMPLOYER’ SURVEY FINDINGS
Table 7.3 Designation of Person on OHS Issues - by Industry Sector

OCCUPATIONAL HEALTH AND SAFETY IN MALTA - A SNAPSHOT OF PREVAILING STANDARDS
240
263
CountsBreak %Respondents
Total
Total
Yes, full timeon OHS
Yes, OHS fallsunder one of t-he responsibil-ity of a particu-lar employee
Yes, retainerbasis
(externalconsultant) No Don't know
1 - 9 employees
10 - 49 employees
50 - 249 employees
250 - 499 employees
500 employees or more
1200 1099.1%
28023.3%
635.3%
73861.5%
100.8%
915 576.2%
18019.7%
232.5%
64670.6%
91.0%
183 2513.7%
5329.0%
2513.7%
7943.2%
10.5%
74 1418.9%
3648.6%
1418.9%
1013.5%
--
17 847.1%
741.2%
15.9%
15.9%
--
11 545.5%
436.4%
--
218.2%
--
Table 7.4 Designation of person on OHS Issues - by Company Size
Table 7.4 Designation of person on OHS Issues - by Company Size

OCCUPATIONAL HEALTH AND SAFETY IN MALTA - A SNAPSHOT OF PREVAILING STANDARDS
241
264
CountsBreak %Respondents
Total
Total
Yes NoDon'tknow
Manufacturing; Agriculture,hunting & forestry; Electricity,gas & water supply
Construction, Mining andquarrying
Wholesale & Retail trade, repairs
Hotels & Restaurants
Transport, Storage andCommunications
Financial intermediation, RealEstate & Renting and Businessactivities
Public administration;compulsory social security
Education
Health and social work
Other community, social andpersonal service activities
1200 49341.1%
65454.5%
534.4%
173 6638.2%
10359.5%
42.3%
49 2959.2%
1938.8%
12.0%
416 11627.9%
27666.3%
245.8%
132 8564.4%
4231.8%
53.8%
115 3833.0%
6657.4%
119.6%
101 4746.5%
5150.5%
33.0%
8 337.5%
562.5%
--
65 3655.4%
2741.5%
23.1%
23 1147.8%
1252.2%
--
118 6252.5%
5344.9%
32.5%
Table 7.5 Health and Safety Policy - by Industry Sector
Table 7.5 Health and Safety Policy - by Industry Sector
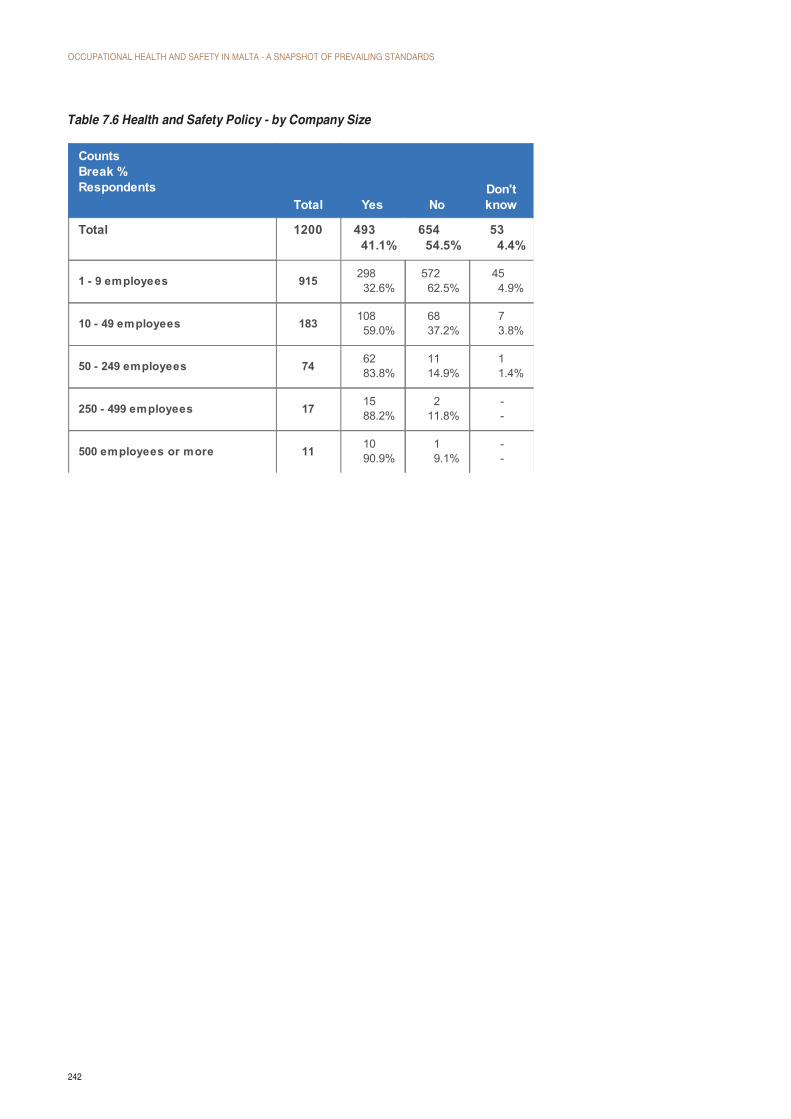
OCCUPATIONAL HEALTH AND SAFETY IN MALTA - A SNAPSHOT OF PREVAILING STANDARDS
242
265
CountsBreak %Respondents
Total
Total
Yes NoDon'tknow
1 - 9 employees
10 - 49 employees
50 - 249 employees
250 - 499 employees
500 employees or more
1200 49341.1%
65454.5%
534.4%
915 29832.6%
57262.5%
454.9%
183 10859.0%
6837.2%
73.8%
74 6283.8%
1114.9%
11.4%
17 1588.2%
211.8%
--
11 1090.9%
19.1%
--
Table 7.6 Health and Safety Policy - by Company Size
Table 7.6 Health and Safety Policy - by Company Size

OCCUPATIONAL HEALTH AND SAFETY IN MALTA - A SNAPSHOT OF PREVAILING STANDARDS
243
266
CountsAnalysis %Respondents
Total
Total
Never On recruitment
Wheneverthere is a
transfer, orchange of job
or tasks
When there isa change in w-ork equipment,or new equip-ment is introd-
uced
When newtechnology is
introduced
When newwork practicesare introduced
1 - 9 employees
10 - 49 employees
50 - 249 employees
250 - 499 employees
500 employees or more
1200 56246.8%
48740.6%
15512.9%
22418.7%
18415.3%
26922.4%
915 50655.3%
31634.5%
879.5%
14015.3%
10911.9%
15116.5%
183 4926.8%
9753.0%
3318.0%
4223.0%
3418.6%
5932.2%
74 68.1%
4966.2%
2331.1%
2635.1%
2533.8%
3952.7%
17 --
1588.2%
741.2%
847.1%
847.1%
1376.5%
11 19.1%
1090.9%
545.5%
872.7%
872.7%
763.6%
Table 7.8 Provision of OHS Training - by Company Size
Table 7.8 Provision of OHS Training - by Company Size

OCCUPATIONAL HEALTH AND SAFETY IN MALTA - A SNAPSHOT OF PREVAILING STANDARDS
244
267
CountsAnalysis %Respondents
Total
Total
Yes NoDon'tknow
Manufacturing; Agriculture,hunting & forestry; Electricity,gas & water supply
Construction, Mining andquarrying
Wholesale & Retail trade, repairs
Hotels & Restaurants
Transport, Storage andCommunications
Financial intermediation, RealEstate & Renting and Businessactivities
Public administration;compulsory social security
Education
Health and social work
Other community, social andpersonal service activities
1200 18915.8%
99082.5%
211.8%
173 2916.8%
14080.9%
42.3%
49 1122.4%
3877.6%
--
416 286.7%
38091.3%
81.9%
132 3425.8%
9572.0%
32.3%
115 2118.3%
9380.9%
10.9%
101 1918.8%
8281.2%
--
8 675.0%
225.0%
--
65 1523.1%
4772.3%
34.6%
23 417.4%
1982.6%
--
118 2218.6%
9479.7%
21.7%
Table 7.9 Appointment of a Workers’ Health & Safety Representative - by Industry Sector
Table 7.9 Appointment of a Workers’ Health & Safety Representative - by Industry Sector

OCCUPATIONAL HEALTH AND SAFETY IN MALTA - A SNAPSHOT OF PREVAILING STANDARDS
245
268
CountsAnalysis %Respondents
Total
Total
Yes NoDon'tknow
1 - 9 employees
10 - 49 employees
50 - 249 employees
250 - 499 employees
500 employees or more
1200 18915.8%
99082.5%
211.8%
915 727.9%
82890.5%
151.6%
183 4826.2%
13171.6%
42.2%
74 5067.6%
2229.7%
22.7%
17 1482.4%
317.6%
--
11 545.5%
654.5%
--
Table 7.10 Appointment of a Workers’ Health & Safety Representative - by Company Size
Table 7.10 Appointment of a Workers’ Health & Safety Representative - by Company Size

OCCUPATIONAL HEALTH AND SAFETY IN MALTA - A SNAPSHOT OF PREVAILING STANDARDS
246
269
CountsAnalysis %Respondents
Total
Total
Appointed bymanagement
withoutconsultation
Appointed bymanagement
becauseworkers failed
to appointElected by the
workers Don't know
Manufacturing; Agriculture,hunting & forestry; Electricity,gas & water supply
Construction, Mining andquarrying
Wholesale & Retail trade, repairs
Hotels & Restaurants
Transport, Storage andCommunications
Financial intermediation, RealEstate & Renting and Businessactivities
Public administration;compulsory social security
Education
Health and social work
Other community, social andpersonal service activities
189 12465.6%
136.9%
4825.4%
42.1%
29 2172.4%
26.9%
620.7%
--
11 654.5%
218.2%
327.3%
--
28 2071.4%
310.7%
310.7%
27.1%
34 1955.9%
12.9%
1441.2%
--
21 1571.4%
29.5%
314.3%
14.8%
19 1263.2%
210.5%
526.3%
--
6 350.0%
--
350.0%
--
15 1386.7%
--
213.3%
--
4 125.0%
--
375.0%
--
22 1463.6%
14.5%
627.3%
14.5%
Table 7.11 Method of Appointment - by Industry Sector
Table 7.11 Method of Appointment - by Industry Sector

OCCUPATIONAL HEALTH AND SAFETY IN MALTA - A SNAPSHOT OF PREVAILING STANDARDS
247
270
CountsAnalysis %Respondents
Total
Total
Appointed bymanagement
withoutconsultation
Appointed bymanagement
becauseworkers failed
to appointElected by the
workers Don't know
1 - 9 employees
10 - 49 employees
50 - 249 employees
250 - 499 employees
500 employees or more
189 12465.6%
136.9%
4825.4%
42.1%
72 5475.0%
56.9%
1115.3%
22.8%
48 3266.7%
24.2%
1327.1%
12.1%
50 3162.0%
36.0%
1530.0%
12.0%
14 535.7%
321.4%
642.9%
--
5 240.0%
--
360.0%
--
Table 7.12 Method of Appointment - by Company Size
Table 7.12 Method of Appointment - by Company Size

OCCUPATIONAL HEALTH AND SAFETY IN MALTA - A SNAPSHOT OF PREVAILING STANDARDS
248
271
CountsAnalysis %Respondents
Total
Total
RiskAssessments
Training relatedto OHS
Designating wo-rkers for speci-fic functions egfirst aid, fire-fig-hitng, evacuati-on procedures
Not involved inany decisions Don't know
Manufacturing; Agriculture,hunting & forestry; Electricity,gas & water supply
Construction, Mining andquarrying
Wholesale & Retail trade, repairs
Hotels & Restaurants
Transport, Storage andCommunications
Financial intermediation, RealEstate & Renting and Businessactivities
Public administration;compulsory social security
Education
Health and social work
Other community, social andpersonal service activities
189 15179.9%
11058.2%
9449.7%
94.8%
63.2%
29 2482.8%
1862.1%
1551.7%
13.4%
13.4%
11 763.6%
763.6%
545.5%
--
--
28 2175.0%
1346.4%
1139.3%
27.1%
414.3%
34 2985.3%
2367.6%
2058.8%
12.9%
--
21 1571.4%
838.1%
838.1%
29.5%
--
19 1684.2%
1368.4%
1052.6%
210.5%
--
6 583.3%
466.7%
350.0%
--
--
15 1386.7%
1066.7%
746.7%
--
--
4 4100.0%
250.0%
250.0%
--
--
22 1777.3%
1254.5%
1359.1%
14.5%
14.5%
Table 7.13 Involvement of Workers’ Health & Safety Representative - by Industry Sector
Table 7.13 Involvement of Workers’ Health & Safety Representative - by Industry Sector

OCCUPATIONAL HEALTH AND SAFETY IN MALTA - A SNAPSHOT OF PREVAILING STANDARDS
249
272
CountsAnalysis %Respondents
Total
Total
RiskAssessments
Training relatedto OHS
Designating wor-kers for specificfunctions eg firstaid, fire-fighitng,evacuation proc-
edures Not involved inany decisions Don't know
1 - 9 employees
10 - 49 employees
50 - 249 employees
250 - 499 employees
500 employees or more
189 15179.9%
11058.2%
9449.7%
94.8%
63.2%
72 5373.6%
2534.7%
3345.8%
56.9%
45.6%
48 4185.4%
3368.8%
2654.2%
24.2%
--
50 4080.0%
3774.0%
2346.0%
24.0%
24.0%
14 1392.9%
1178.6%
964.3%
--
--
5 480.0%
480.0%
360.0%
--
--
Table 7.14 Involvement of Workers’ Health & Safety Representative - by Company Size
Table 7.14 Involvement of Workers’ Health & Safety Representative - by Company Size

OCCUPATIONAL HEALTH AND SAFETY IN MALTA - A SNAPSHOT OF PREVAILING STANDARDS
250
273
CountsAnalysis %Respondents
Total
Total
Yes NoDon'tknow
Manufacturing; Agriculture,hunting & forestry; Electricity,gas & water supply
Construction, Mining andquarrying
Wholesale & Retail trade, repairs
Hotels & Restaurants
Transport, Storage andCommunications
Financial intermediation, RealEstate & Renting and Businessactivities
Public administration;compulsory social security
Education
Health and social work
Other community, social andpersonal service activities
1200 65154.3%
52944.1%
201.7%
173 10057.8%
7141.0%
21.2%
49 3571.4%
1428.6%
--
416 17241.3%
23456.3%
102.4%
132 8463.6%
4836.4%
--
115 5850.4%
5648.7%
10.9%
101 5756.4%
4140.6%
33.0%
8 8100.0%
--
--
65 5076.9%
1320.0%
23.1%
23 1043.5%
1356.5%
--
118 7765.3%
3933.1%
21.7%
Table 7.15 Performance of Risk Assessments - by Industry Sector
Table 7.15 Performance of Risk Assessments - by Industry Sector

OCCUPATIONAL HEALTH AND SAFETY IN MALTA - A SNAPSHOT OF PREVAILING STANDARDS
251
274
CountsAnalysis %Respondents
Total
Total
Yes NoDon'tknow
1 - 9 employees
10 - 49 employees
50 - 249 employees
250 - 499 employees
500 employees or more
1200 65154.3%
52944.1%
201.7%
915 43047.0%
46951.3%
161.7%
183 12869.9%
5127.9%
42.2%
74 6790.5%
79.5%
--
17 1694.1%
15.9%
--
11 1090.9%
19.1%
--
Table 7.16 Performance of Risk Assessments - by Company Size
Table 7.16 Performance of Risk Assessments - by Company Size

OCCUPATIONAL HEALTH AND SAFETY IN MALTA - A SNAPSHOT OF PREVAILING STANDARDS
252
275
CountsAnalysis %Respondents
Total
Total
Yes NoDon'tknow
Manufacturing; Agriculture,hunting & forestry; Electricity,gas & water supply
Construction, Mining andquarrying
Wholesale & Retail trade, repairs
Hotels & Restaurants
Transport, Storage andCommunications
Financial intermediation, RealEstate & Renting and Businessactivities
Public administration;compulsory social security
Education
Health and social work
Other community, social andpersonal service activities
651 52981.3%
11317.4%
91.4%
100 8585.0%
1515.0%
--
35 2674.3%
617.1%
38.6%
172 14081.4%
3017.4%
21.2%
84 7184.5%
1315.5%
--
58 5086.2%
813.8%
--
57 4070.2%
1628.1%
11.8%
8 8100.0%
--
--
50 3978.0%
1020.0%
12.0%
10 990.0%
110.0%
--
77 6179.2%
1418.2%
22.6%
Table 7.20 Involvement of Employees in Risk Assessments - by Industry Sector
Table 7.20 Involvement of Employees in Risk Assessments - by Industry Sector

OCCUPATIONAL HEALTH AND SAFETY IN MALTA - A SNAPSHOT OF PREVAILING STANDARDS
253
276
CountsAnalysis %Respondents
Total
Total
Yes No Don't know
1 - 9 employees
10 - 49 employees
50 - 249 employees
250 - 499 employees
500 employees or more
651 52981.3%
11317.4%
91.4%
430 36083.7%
6815.8%
20.5%
128 9171.1%
3225.0%
53.9%
67 5379.1%
1217.9%
23.0%
16 1593.8%
16.3%
--
10 10100.0%
--
--
Table 7.21 Involvement of Employees in Risk Assessments - by Company Size
Table 7.21 Involvement of Employees in Risk Assessments - by Company Size
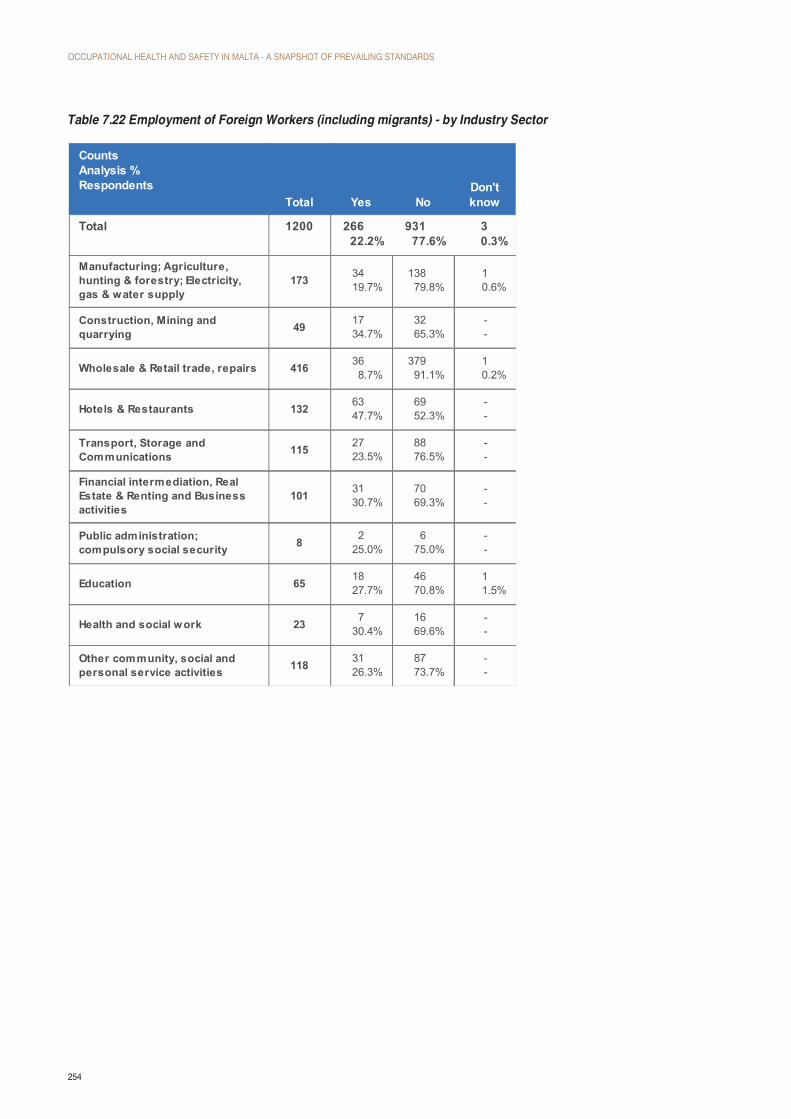
OCCUPATIONAL HEALTH AND SAFETY IN MALTA - A SNAPSHOT OF PREVAILING STANDARDS
254
277
CountsAnalysis %Respondents
Total
Total
Yes NoDon'tknow
Manufacturing; Agriculture,hunting & forestry; Electricity,gas & water supply
Construction, Mining andquarrying
Wholesale & Retail trade, repairs
Hotels & Restaurants
Transport, Storage andCommunications
Financial intermediation, RealEstate & Renting and Businessactivities
Public administration;compulsory social security
Education
Health and social work
Other community, social andpersonal service activities
1200 26622.2%
93177.6%
30.3%
173 3419.7%
13879.8%
10.6%
49 1734.7%
3265.3%
--
416 368.7%
37991.1%
10.2%
132 6347.7%
6952.3%
--
115 2723.5%
8876.5%
--
101 3130.7%
7069.3%
--
8 225.0%
675.0%
--
65 1827.7%
4670.8%
11.5%
23 730.4%
1669.6%
--
118 3126.3%
8773.7%
--
Table 7.22 Employment of Foreign Workers (including migrants) - by Industry Sector
Table 7.22 Employment of Foreign Workers (including migrants) - by Industry Sector
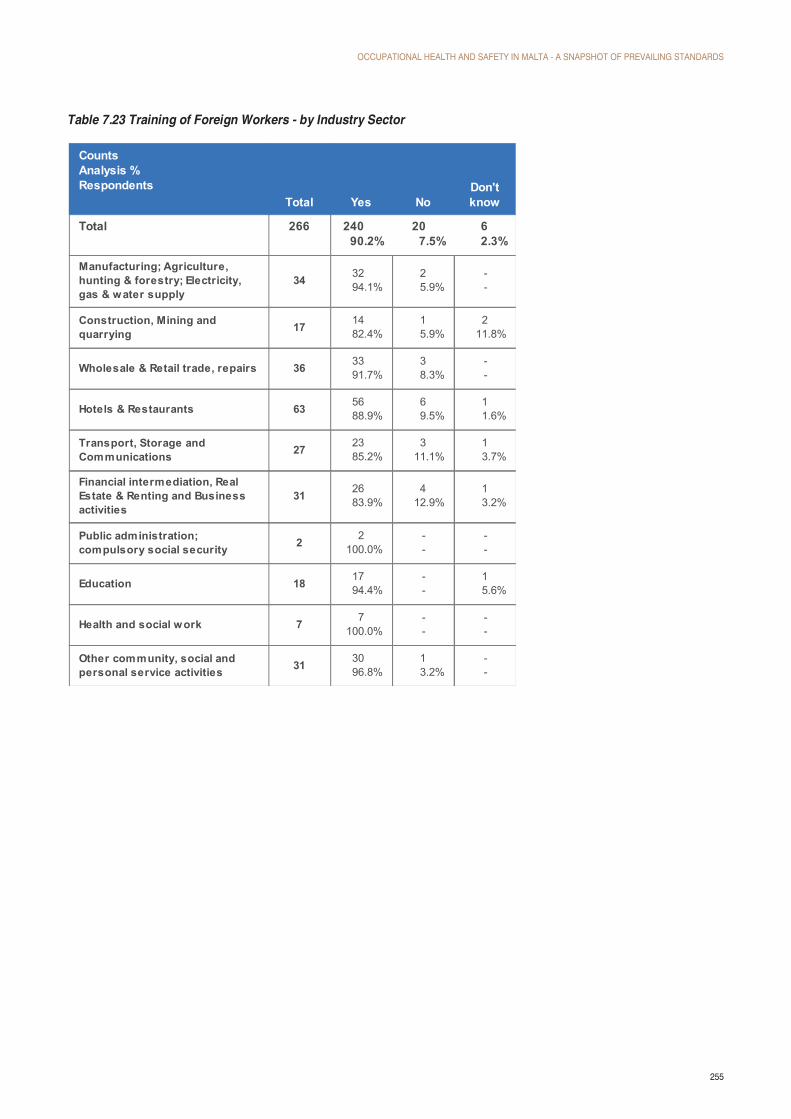
OCCUPATIONAL HEALTH AND SAFETY IN MALTA - A SNAPSHOT OF PREVAILING STANDARDS
255
278
CountsAnalysis %Respondents
Total
Total
Yes NoDon'tknow
Manufacturing; Agriculture,hunting & forestry; Electricity,gas & water supply
Construction, Mining andquarrying
Wholesale & Retail trade, repairs
Hotels & Restaurants
Transport, Storage andCommunications
Financial intermediation, RealEstate & Renting and Businessactivities
Public administration;compulsory social security
Education
Health and social work
Other community, social andpersonal service activities
266 24090.2%
207.5%
62.3%
34 3294.1%
25.9%
--
17 1482.4%
15.9%
211.8%
36 3391.7%
38.3%
--
63 5688.9%
69.5%
11.6%
27 2385.2%
311.1%
13.7%
31 2683.9%
412.9%
13.2%
2 2100.0%
--
--
18 1794.4%
--
15.6%
7 7100.0%
--
--
31 3096.8%
13.2%
--
Table 7.23 Training of Foreign Workers - by Industry Sector
Table 7.23 Training of Foreign Workers - by Industry Sector

OCCUPATIONAL HEALTH AND SAFETY IN MALTA - A SNAPSHOT OF PREVAILING STANDARDS
256
279
CountsAnalysis %Respondents
Total
Total
Yes NoDon'tknow
NotApplicable
Manufacturing; Agriculture,hunting & forestry; Electricity,gas & water supply
Construction, Mining andquarrying
Wholesale & Retail trade, repairs
Hotels & Restaurants
Transport, Storage andCommunications
Financial intermediation, RealEstate & Renting and Businessactivities
Public administration;compulsory social security
Education
Health and social work
Other community, social andpersonal service activities
266 6925.9%
11442.9%
83.0%
7528.2%
34 720.6%
2058.8%
--
720.6%
17 211.8%
1058.8%
--
529.4%
36 513.9%
2158.3%
38.3%
719.4%
63 2438.1%
2234.9%
--
1727.0%
27 1037.0%
829.6%
--
933.3%
31 39.7%
1754.8%
26.5%
929.0%
2 --
150.0%
--
150.0%
18 633.3%
211.1%
211.1%
844.4%
7 342.9%
228.6%
--
228.6%
31 929.0%
1135.5%
13.2%
1032.3%
Table 7.25 Risk Assessments for Foreign Workers - by Industry Sector
Table 7.25 Risk Assessments for Foreign Workers - by Industry Sector

OCCUPATIONAL HEALTH AND SAFETY IN MALTA - A SNAPSHOT OF PREVAILING STANDARDS
257
280
CountsAnalysis %Respondents
Total
Total
Yes NoDon'tknow
NotApplicable
1 - 9 employees
10 - 49 employees
50 - 249 employees
250 - 499 employees
500 employees or more
266 6925.9%
11442.9%
83.0%
7528.2%
112 1614.3%
5347.3%
43.6%
3934.8%
78 2430.8%
3139.7%
22.6%
2126.9%
49 1632.7%
2244.9%
24.1%
918.4%
16 743.8%
637.5%
--
318.8%
11 654.5%
218.2%
--
327.3%
Table 7.26 Risk Assessments for Foreign Workers - by Company Size
Table 7.26 Risk Assessments for Foreign Workers - by Company Size

OCCUPATIONAL HEALTH AND SAFETY IN MALTA - A SNAPSHOT OF PREVAILING STANDARDS
258
281
CountsAnalysis %Respondents
Total
Total
Yes NoDon'tknow
Manufacturing; Agriculture,hunting & forestry; Electricity,gas & water supply
Construction, Mining andquarrying
Wholesale & Retail trade, repairs
Hotels & Restaurants
Transport, Storage andCommunications
Financial intermediation, RealEstate & Renting and Businessactivities
Public administration;compulsory social security
Education
Health and social work
Other community, social andpersonal service activities
1200 35929.9%
83669.7%
50.4%
173 3721.4%
13678.6%
--
49 1632.7%
3367.3%
--
416 11928.6%
29671.2%
10.2%
132 2821.2%
10277.3%
21.5%
115 2824.3%
8674.8%
10.9%
101 4746.5%
5453.5%
--
8 675.0%
225.0%
--
65 2538.5%
4061.5%
--
23 1460.9%
939.1%
--
118 3933.1%
7866.1%
10.8%
Table 7.27 Pregnant Women Working with Company - by Industry Sector
Table 7.27 Pregnant Women Working with Company - by Industry Sector

OCCUPATIONAL HEALTH AND SAFETY IN MALTA - A SNAPSHOT OF PREVAILING STANDARDS
259
282
CountsAnalysis %Respondents
Total
Total
Yes NoDon'tknow
Manufacturing; Agriculture,hunting & forestry; Electricity,gas & water supply
Construction, Mining andquarrying
Wholesale & Retail trade, repairs
Hotels & Restaurants
Transport, Storage andCommunications
Financial intermediation, RealEstate & Renting and Businessactivities
Public administration;compulsory social security
Education
Health and social work
Other community, social andpersonal service activities
359 12234.0%
20757.7%
308.4%
37 821.6%
2259.5%
718.9%
16 425.0%
1062.5%
212.5%
119 3630.3%
7462.2%
97.6%
28 1864.3%
1035.7%
--
28 1139.3%
1553.6%
27.1%
47 1225.5%
3370.2%
24.3%
6 466.7%
116.7%
116.7%
25 1144.0%
1040.0%
416.0%
14 428.6%
1071.4%
--
39 1435.9%
2256.4%
37.7%
Table 7.28 Medical Certificate Notification - by Industry Sector
Table 7.28 Medical Certificate Notification - by Industry Sector

OCCUPATIONAL HEALTH AND SAFETY IN MALTA - A SNAPSHOT OF PREVAILING STANDARDS
260
283
CountsAnalysis %Respondents
Total
Total
Yes NoDon'tknow
1 - 9 employees
10 - 49 employees
50 - 249 employees
250 - 499 employees
500 employees or more
359 12234.0%
20757.7%
308.4%
179 4826.8%
12368.7%
84.5%
98 3535.7%
5556.1%
88.2%
58 2339.7%
2339.7%
1220.7%
14 1071.4%
321.4%
17.1%
10 660.0%
330.0%
110.0%
Table 7.29 Medical Certificate Notification - by Company Size
Table 7.29 Medical Certificate Notification - by Company Size

OCCUPATIONAL HEALTH AND SAFETY IN MALTA - A SNAPSHOT OF PREVAILING STANDARDS
261
284
CountsAnalysis %Respondents
Total
Total
Yes NoDon'tknow
Manufacturing; Agriculture,hunting & forestry; Electricity,gas & water supply
Construction, Mining andquarrying
Wholesale & Retail trade, repairs
Hotels & Restaurants
Transport, Storage andCommunications
Financial intermediation, RealEstate & Renting and Businessactivities
Public administration;compulsory social security
Education
Health and social work
Other community, social andpersonal service activities
359 12033.4%
21058.5%
298.1%
37 1232.4%
2054.1%
513.5%
16 318.8%
1381.3%
--
119 3428.6%
7361.3%
1210.1%
28 1864.3%
932.1%
13.6%
28 1553.6%
1139.3%
27.1%
47 1123.4%
3268.1%
48.5%
6 350.0%
350.0%
--
25 624.0%
1560.0%
416.0%
14 428.6%
1071.4%
--
39 1435.9%
2461.5%
12.6%
Table 7.30 Risk Assessments on Pregnant Women - by Industry Sector
Table 7.30 Risk Assessments on Pregnant Women - by Industry Sector

OCCUPATIONAL HEALTH AND SAFETY IN MALTA - A SNAPSHOT OF PREVAILING STANDARDS
262
285
CountsAnalysis %Respondents
Total
Total
Yes NoDon'tknow
1 - 9 employees
10 - 49 employees
50 - 249 employees
250 - 499 employees
500 employees or more
359 12033.4%
21058.5%
298.1%
179 5731.8%
11061.5%
126.7%
98 2929.6%
6061.2%
99.2%
58 1729.3%
3458.6%
712.1%
14 1178.6%
321.4%
--
10 660.0%
330.0%
110.0%
Table 7.31 Risk Assessments on Pregnant Women - by Company Size
Table 7.31 Risk Assessments on Pregnant Women - by Company Size

OCCUPATIONAL HEALTH AND SAFETY IN MALTA - A SNAPSHOT OF PREVAILING STANDARDS
263
286
CountsAnalysis %Respondents
Total
Total
Yes NoDon'tknow
Manufacturing; Agriculture,hunting & forestry; Electricity,gas & water supply
Construction, Mining andquarrying
Wholesale & Retail trade, repairs
Hotels & Restaurants
Transport, Storage andCommunications
Financial intermediation, RealEstate & Renting and Businessactivities
Public administration;compulsory social security
Education
Health and social work
Other community, social andpersonal service activities
1200 1018.4%
108290.2%
171.4%
173 148.1%
15690.2%
31.7%
49 714.3%
4183.7%
12.0%
416 163.8%
39895.7%
20.5%
132 1712.9%
11486.4%
10.8%
115 108.7%
10490.4%
10.9%
101 65.9%
9190.1%
44.0%
8 225.0%
562.5%
112.5%
65 913.8%
5483.1%
23.1%
23 626.1%
1773.9%
--
118 1411.9%
10286.4%
21.7%
Table 7.32 Employment of Persons with a Disability - by Industry Sector
Table 7.32 Employment of Persons with a Disability - by Industry Sector

OCCUPATIONAL HEALTH AND SAFETY IN MALTA - A SNAPSHOT OF PREVAILING STANDARDS
264
287
CountsAnalysis %Respondents
Total
Total
Yes NoDon'tknow
NotApplicable
Manufacturing; Agriculture,hunting & forestry; Electricity,gas & water supply
Construction, Mining andquarrying
Wholesale & Retail trade, repairs
Hotels & Restaurants
Transport, Storage andCommunications
Financial intermediation, RealEstate & Renting and Businessactivities
Public administration;compulsory social security
Education
Health and social work
Other community, social andpersonal service activities
101 5655.4%
2928.7%
76.9%
98.9%
14 750.0%
535.7%
--
214.3%
7 342.9%
342.9%
--
114.3%
16 637.5%
850.0%
16.3%
16.3%
17 1058.8%
317.6%
211.8%
211.8%
10 880.0%
220.0%
--
--
6 350.0%
233.3%
116.7%
--
2 2100.0%
--
--
--
9 666.7%
--
222.2%
111.1%
6 466.7%
116.7%
--
116.7%
14 750.0%
535.7%
17.1%
17.1%
Table 7.33 Risk Assessments for Persons with a Disability - by Industry Sector
Table 7.33 Risk Assessments for Persons with a Disability - by Industry Sector

OCCUPATIONAL HEALTH AND SAFETY IN MALTA - A SNAPSHOT OF PREVAILING STANDARDS
265
288
CountsAnalysis %Respondents
Total
Total
Yes No Don't knowNot
Applicable
1 - 9 employees
10 - 49 employees
50 - 249 employees
250 - 499 employees
500 employees or more
101 5655.4%
2928.7%
76.9%
98.9%
34 1544.1%
1441.2%
25.9%
38.8%
30 1756.7%
723.3%
26.7%
413.3%
21 1047.6%
628.6%
314.3%
29.5%
11 1090.9%
19.1%
--
--
5 480.0%
120.0%
--
--
Table 7.34 Risk Assessments for Persons with a Disability - by Company Size
Table 7.34 Risk Assessments for Persons with a Disability - by Company Size

OCCUPATIONAL HEALTH AND SAFETY IN MALTA - A SNAPSHOT OF PREVAILING STANDARDS
266
289
CountsAnalysis %Respondents
Total
Total
Yes NoDon'tknow
NotApplicable
Manufacturing; Agriculture,hunting & forestry; Electricity,gas & water supply
Construction, Mining andquarrying
Wholesale & Retail trade, repairs
Hotels & Restaurants
Transport, Storage andCommunications
Financial intermediation, RealEstate & Renting and Businessactivities
Public administration;compulsory social security
Education
Health and social work
Other community, social andpersonal service activities
1200 867.2%
30825.7%
363.0%
77064.2%
173 158.7%
3620.8%
84.6%
11465.9%
49 12.0%
1734.7%
12.0%
3061.2%
416 235.5%
9823.6%
122.9%
28368.0%
132 86.1%
3627.3%
21.5%
8665.2%
115 1210.4%
2320.0%
10.9%
7968.7%
101 1110.9%
2827.7%
33.0%
5958.4%
8 --
562.5%
112.5%
225.0%
65 710.8%
1320.0%
57.7%
4061.5%
23 313.0%
939.1%
14.3%
1043.5%
118 65.1%
4336.4%
21.7%
6756.8%
Table 7.35 Risk Assessments for Older Employees - by Industry Sector
Table 7.35 Risk Assessments for Older Employees - by Industry Sector

OCCUPATIONAL HEALTH AND SAFETY IN MALTA - A SNAPSHOT OF PREVAILING STANDARDS
267
290
CountsAnalysis %Respondents
Total
Total
Yes NoDon'tknow
NotApplicable
1 - 9 employees
10 - 49 employees
50 - 249 employees
250 - 499 employees
500 employees or more
1200 867.2%
30825.7%
363.0%
77064.2%
915 434.7%
20922.8%
232.5%
64069.9%
183 2714.8%
5731.1%
42.2%
9551.9%
74 810.8%
3344.6%
810.8%
2533.8%
17 423.5%
529.4%
15.9%
741.2%
11 436.4%
436.4%
--
327.3%
Table 7.36 Risk Assessments for Older Employees - by Company Size
Table 7.36 Risk Assessments for Older Employees - by Company Size
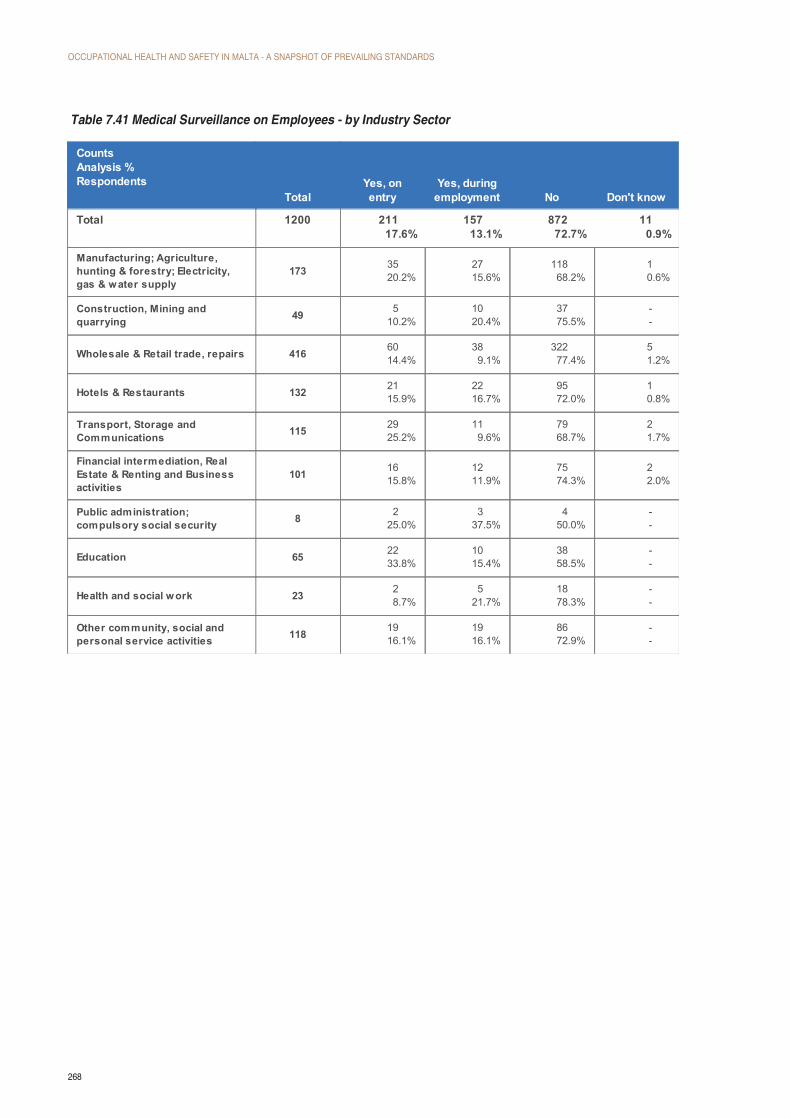
OCCUPATIONAL HEALTH AND SAFETY IN MALTA - A SNAPSHOT OF PREVAILING STANDARDS
268
291
CountsAnalysis %Respondents
Total
Total
Yes, onentry
Yes, duringemployment No Don't know
Manufacturing; Agriculture,hunting & forestry; Electricity,gas & water supply
Construction, Mining andquarrying
Wholesale & Retail trade, repairs
Hotels & Restaurants
Transport, Storage andCommunications
Financial intermediation, RealEstate & Renting and Businessactivities
Public administration;compulsory social security
Education
Health and social work
Other community, social andpersonal service activities
1200 21117.6%
15713.1%
87272.7%
110.9%
173 3520.2%
2715.6%
11868.2%
10.6%
49 510.2%
1020.4%
3775.5%
--
416 6014.4%
389.1%
32277.4%
51.2%
132 2115.9%
2216.7%
9572.0%
10.8%
115 2925.2%
119.6%
7968.7%
21.7%
101 1615.8%
1211.9%
7574.3%
22.0%
8 225.0%
337.5%
450.0%
--
65 2233.8%
1015.4%
3858.5%
--
23 28.7%
521.7%
1878.3%
--
118 1916.1%
1916.1%
8672.9%
--
Table 7.41 Medical Surveillance on Employees - by Industry Sector
Table 7.41 Medical Surveillance on Employees - by Industry Sector

OCCUPATIONAL HEALTH AND SAFETY IN MALTA - A SNAPSHOT OF PREVAILING STANDARDS
269
292
CountsAnalysis %Respondents
Total
Total
Yes, on entryYes, during
employment No Don't know
1 - 9 employees
10 - 49 employees
50 - 249 employees
250 - 499 employees
500 employees or more
1200 21117.6%
15713.1%
87272.7%
110.9%
915 13414.6%
9710.6%
70376.8%
60.7%
183 3519.1%
3418.6%
12065.6%
31.6%
74 2635.1%
1114.9%
4256.8%
22.7%
17 1164.7%
1058.8%
317.6%
--
11 545.5%
545.5%
436.4%
--
Table 7.42 Medical Surveillance on Employees - by Company Size
Table 7.42 Medical Surveillance on Employees - by Company Size

OCCUPATIONAL HEALTH AND SAFETY IN MALTA - A SNAPSHOT OF PREVAILING STANDARDS
270
293
CountsAnalysis %Respondents
Total
Total
Yes NoDon'tknow
Manufacturing; Agriculture,hunting & forestry; Electricity,gas & water supply
Construction, Mining andquarrying
Wholesale & Retail trade, repairs
Hotels & Restaurants
Transport, Storage andCommunications
Financial intermediation, RealEstate & Renting and Businessactivities
Public administration;compulsory social security
Education
Health and social work
Other community, social andpersonal service activities
1200 90975.8%
25120.9%
403.3%
173 14382.7%
2615.0%
42.3%
49 3673.5%
1326.5%
--
416 28668.8%
11026.4%
204.8%
132 11587.1%
1612.1%
10.8%
115 9179.1%
2118.3%
32.6%
101 6766.3%
2827.7%
65.9%
8 675.0%
112.5%
112.5%
65 5584.6%
1015.4%
--
23 1669.6%
626.1%
14.3%
118 9479.7%
2016.9%
43.4%
Table 7.43 Action Taken if Health & Safety Procedure is Not Followed - by Industry Sector
Table 7.43 Action Taken if Health & Safety Procedure is Not Followed - by Industry Sector

OCCUPATIONAL HEALTH AND SAFETY IN MALTA - A SNAPSHOT OF PREVAILING STANDARDS
271
294
CountsAnalysis %Respondents
Total
Total
Yes NoDon'tknow
1 - 9 employees
10 - 49 employees
50 - 249 employees
250 - 499 employees
500 employees or more
1200 90975.8%
25120.9%
403.3%
915 66072.1%
22324.4%
323.5%
183 15986.9%
1910.4%
52.7%
74 6283.8%
912.2%
34.1%
17 17100.0%
--
--
11 11100.0%
--
--
Table 7.44 Action Taken if Health & Safety Procedure is Not Followed - by Company Size
Table 7.44 Action Taken if Health & Safety Procedure is Not Followed - by Company Size

OCCUPATIONAL HEALTH AND SAFETY IN MALTA - A SNAPSHOT OF PREVAILING STANDARDS
272
295
CountsAnalysis %Respondents
Total
Total
Verbalwarning
Writtenwarning
Employeeis dismis-
sed
Dependson the se-verity of t-he case
Onemeasureleads toanother
Dependson the co-llective a-greement
Fines areimposed Other
1 - 9 employees
10 - 49 employees
50 - 249 employees
250 - 499 employees
500 employees or more
907 82090.4%
17519.3%
859.4%
182.0%
161.8%
40.4%
50.6%
50.6%
658 62294.5%
6810.3%
446.7%
30.5%
71.1%
--
20.3%
10.2%
159 13383.6%
5937.1%
2113.2%
53.1%
31.9%
21.3%
21.3%
21.3%
62 4572.6%
3048.4%
1117.7%
46.5%
34.8%
11.6%
11.6%
11.6%
17 1376.5%
1164.7%
423.5%
317.6%
211.8%
15.9%
--
15.9%
11 763.6%
763.6%
545.5%
327.3%
19.1%
--
--
--
Table 7.46 Type of Action Taken - by Company Size
Table 7.46 Type of Action Taken - by Company Size

OCCUPATIONAL HEALTH AND SAFETY IN MALTA - A SNAPSHOT OF PREVAILING STANDARDS
273
296
CountsAnalysis %Respondents
Total
Total
Yes NoDon'tknow
Manufacturing; Agriculture,hunting & forestry; Electricity,gas & water supply
Construction, Mining andquarrying
Wholesale & Retail trade, repairs
Hotels & Restaurants
Transport, Storage andCommunications
Financial intermediation, RealEstate & Renting and Businessactivities
Public administration;compulsory social security
Education
Health and social work
Other community, social andpersonal service activities
1200 17914.9%
95479.5%
675.6%
173 3017.3%
13980.3%
42.3%
49 1428.6%
3571.4%
--
416 409.6%
34382.5%
337.9%
132 2821.2%
9975.0%
53.8%
115 1210.4%
9683.5%
76.1%
101 1817.8%
7473.3%
98.9%
8 450.0%
450.0%
--
65 1421.5%
4975.4%
23.1%
23 626.1%
1669.6%
14.3%
118 1311.0%
9983.9%
65.1%
Table 7.48 Use of OHSA Services – Provision of Guidance or Advice - by Industry Sector
Table 7.48 Use of OHSA Services – Provision of Guidance or Advice - by Industry Sector

OCCUPATIONAL HEALTH AND SAFETY IN MALTA - A SNAPSHOT OF PREVAILING STANDARDS
274
297
CountsAnalysis %Respondents
Total
Total
Yes NoDon'tknow
Manufacturing; Agriculture,hunting & forestry; Electricity,gas & water supply
Construction, Mining andquarrying
Wholesale & Retail trade, repairs
Hotels & Restaurants
Transport, Storage andCommunications
Financial intermediation, RealEstate & Renting and Businessactivities
Public administration;compulsory social security
Education
Health and social work
Other community, social andpersonal service activities
1200 16313.6%
97581.3%
625.2%
173 2615.0%
14583.8%
21.2%
49 1224.5%
3775.5%
--
416 286.7%
35384.9%
358.4%
132 2720.5%
10176.5%
43.0%
115 1311.3%
9582.6%
76.1%
101 2524.8%
6968.3%
76.9%
8 787.5%
112.5%
--
65 1116.9%
5381.5%
11.5%
23 417.4%
1773.9%
28.7%
118 108.5%
10488.1%
43.4%
Table 7.49 Use of OHSA Services – Use of OHSA website - by Industry Sector
Table 7.49 Use of OHSA Services – Use of OHSA website - by Industry Sector

OCCUPATIONAL HEALTH AND SAFETY IN MALTA - A SNAPSHOT OF PREVAILING STANDARDS
275
298
CountsAnalysis %Respondents
Total
Total
Yes NoDon'tknow
Manufacturing; Agriculture,hunting & forestry; Electricity,gas & water supply
Construction, Mining andquarrying
Wholesale & Retail trade, repairs
Hotels & Restaurants
Transport, Storage andCommunications
Financial intermediation, RealEstate & Renting and Businessactivities
Public administration;compulsory social security
Education
Health and social work
Other community, social andpersonal service activities
1200 211.8%
111592.9%
645.3%
173 63.5%
16394.2%
42.3%
49 --
4898.0%
12.0%
416 20.5%
37991.1%
358.4%
132 21.5%
12695.5%
43.0%
115 32.6%
10490.4%
87.0%
101 11.0%
9695.0%
44.0%
8 225.0%
675.0%
--
65 34.6%
6295.4%
--
23 14.3%
2191.3%
14.3%
118 10.8%
11093.2%
75.9%
Table 7.50 Use of OHSA Services – Assistance/Mediation with a Trade Dispute -
by Industry Sector
Table 7.50 Use of OHSA Services – Assistance/Mediation with a Trade Dispute - by Industry Sector

OCCUPATIONAL HEALTH AND SAFETY IN MALTA - A SNAPSHOT OF PREVAILING STANDARDS
276
299
CountsAnalysis %Respondents
Total
Total
Yes NoDon'tknow
Manufacturing; Agriculture,hunting & forestry; Electricity,gas & water supply
Construction, Mining andquarrying
Wholesale & Retail trade, repairs
Hotels & Restaurants
Transport, Storage andCommunications
Financial intermediation, RealEstate & Renting and Businessactivities
Public administration;compulsory social security
Education
Health and social work
Other community, social andpersonal service activities
1200 19316.1%
94678.8%
615.1%
173 3520.2%
13376.9%
52.9%
49 1020.4%
3877.6%
12.0%
416 419.9%
34582.9%
307.2%
132 4030.3%
8765.9%
53.8%
115 1412.2%
9380.9%
87.0%
101 1312.9%
8382.2%
55.0%
8 450.0%
450.0%
--
65 1624.6%
4975.4%
--
23 521.7%
1773.9%
14.3%
118 1512.7%
9782.2%
65.1%
Table 7.51 Use of OHSA Services – OHS Training Course - by Industry Sector
Table 7.51 Use of OHSA Services – OHS Training Course - by Industry Sector

OCCUPATIONAL HEALTH AND SAFETY IN MALTA - A SNAPSHOT OF PREVAILING STANDARDS
277
300
CountsAnalysis %Respondents
Total
Total
Yes NoDon'tknow
Manufacturing; Agriculture,hunting & forestry; Electricity,gas & water supply
Construction, Mining andquarrying
Wholesale & Retail trade, repairs
Hotels & Restaurants
Transport, Storage andCommunications
Financial intermediation, RealEstate & Renting and Businessactivities
Public administration;compulsory social security
Education
Health and social work
Other community, social andpersonal service activities
1200 18815.7%
95179.3%
615.1%
173 2615.0%
14282.1%
52.9%
49 1428.6%
3571.4%
--
416 358.4%
35084.1%
317.5%
132 3022.7%
9874.2%
43.0%
115 1613.9%
9078.3%
97.8%
101 2322.8%
7372.3%
55.0%
8 675.0%
112.5%
112.5%
65 1726.2%
4873.8%
--
23 417.4%
1878.3%
14.3%
118 1714.4%
9681.4%
54.2%
Table 7.52 Use of OHSA Services – Printed Material on Health & Safety - by Industry Sector
Table 7.52 Use of OHSA Services – Printed Material on Health & Safety - by Industry Sector

OCCUPATIONAL HEALTH AND SAFETY IN MALTA - A SNAPSHOT OF PREVAILING STANDARDS
278
301
CountsAnalysis %Respondents
Total
Total
Yes NoDon'tknow
Manufacturing; Agriculture,hunting & forestry; Electricity,gas & water supply
Construction, Mining andquarrying
Wholesale & Retail trade, repairs
Hotels & Restaurants
Transport, Storage andCommunications
Financial intermediation, RealEstate & Renting and Businessactivities
Public administration;compulsory social security
Education
Health and social work
Other community, social andpersonal service activities
1200 857.1%
104887.3%
675.6%
173 116.4%
15991.9%
31.7%
49 816.3%
3877.6%
36.1%
416 122.9%
37088.9%
348.2%
132 1612.1%
11083.3%
64.5%
115 76.1%
10087.0%
87.0%
101 44.0%
9291.1%
55.0%
8 450.0%
450.0%
--
65 1015.4%
5483.1%
11.5%
23 313.0%
2087.0%
--
118 108.5%
10185.6%
75.9%
Table 7.53 Use of OHSA Services – Seminars, Conferences, Events - by Industry Sector
Table 7.53 Use of OHSA Services – Seminars, Conferences, Events - by Industry Sector

OCCUPATIONAL HEALTH AND SAFETY IN MALTA - A SNAPSHOT OF PREVAILING STANDARDS
279
302
CountsAnalysis %Respondents
Total
Total
Yes NoDon'tknow
1 - 9 employees
10 - 49 employees
50 - 249 employees
250 - 499 employees
500 employees or more
1200 17914.9%
95479.5%
675.6%
915 829.0%
79186.4%
424.6%
183 4926.8%
12065.6%
147.7%
74 2939.2%
3547.3%
1013.5%
17 1164.7%
635.3%
--
11 872.7%
218.2%
19.1%
CountsAnalysis %Respondents
Total
Total
Yes NoDon'tknow
1 - 9 employees
10 - 49 employees
50 - 249 employees
250 - 499 employees
500 employees or more
1200 16313.6%
97581.3%
625.2%
915 677.3%
80988.4%
394.3%
183 4725.7%
12467.8%
126.6%
74 3040.5%
3344.6%
1114.9%
17 1164.7%
635.3%
--
11 872.7%
327.3%
--
Table 7.54 Use of OHSA Services – Provision of Guidance or Advice - by Company Size
Table 7.55 Use of OHSA Services – Use of OHSA website - by Company Size
Table 7.54 Use of OHSA Services – Provision of Guidance or Advice - by Company Size
Table 7.55 Use of OHSA Services – Use of OHSA website - by Company Size

OCCUPATIONAL HEALTH AND SAFETY IN MALTA - A SNAPSHOT OF PREVAILING STANDARDS
280
303
CountsAnalysis %Respondents
Total
Total
Yes NoDon'tknow
1 - 9 employees
10 - 49 employees
50 - 249 employees
250 - 499 employees
500 employees or more
1200 211.8%
111592.9%
645.3%
915 70.8%
86894.9%
404.4%
183 63.3%
16590.2%
126.6%
74 68.1%
5878.4%
1013.5%
17 211.8%
1482.4%
15.9%
11 --
1090.9%
19.1%
CountsAnalysis %Respondents
Total
Total
Yes NoDon'tknow
1 - 9 employees
10 - 49 employees
50 - 249 employees
250 - 499 employees
500 employees or more
1200 19316.1%
94678.8%
615.1%
915 10411.4%
77384.5%
384.2%
183 3921.3%
13372.7%
116.0%
74 3040.5%
3243.2%
1216.2%
17 1270.6%
529.4%
--
11 872.7%
327.3%
--
Table 7.56 Use of OHSA Services – Assistance/Mediation with a Trade Dispute –
by Company Size
Table 7.57 Use of OHSA Services – OHS Training Course - by Company Size
Table 7.56 Use of OHSA Services – Assistance/Mediation with a Trade Dispute – by Company Size
Table 7.57 Use of OHSA Services – OHS Training Course - by Company Size

OCCUPATIONAL HEALTH AND SAFETY IN MALTA - A SNAPSHOT OF PREVAILING STANDARDS
281
304
CountsAnalysis %Respondents
Total
Total
Yes NoDon'tknow
1 - 9 employees
10 - 49 employees
50 - 249 employees
250 - 499 employees
500 employees or more
1200 18815.7%
95179.3%
615.1%
915 9410.3%
78385.6%
384.2%
183 5027.3%
12065.6%
137.1%
74 2635.1%
3851.4%
1013.5%
17 1058.8%
741.2%
--
11 872.7%
327.3%
--
CountsAnalysis %Respondents
Total
Total
Yes NoDon'tknow
1 - 9 employees
10 - 49 employees
50 - 249 employees
250 - 499 employees
500 employees or more
1200 857.1%
104887.3%
675.6%
915 323.5%
84392.1%
404.4%
183 179.3%
15283.1%
147.7%
74 2128.4%
4155.4%
1216.2%
17 952.9%
741.2%
15.9%
11 654.5%
545.5%
--
Table 7.58 Use of OHSA Services – Printed Material on Health & Safety - by Company Size
Table 7.59 Use of OHSA Services – Seminars, Conferences, Events - by Company Size
Table 7.58 Use of OHSA Services – Printed Material on Health & Safety - by Company Size
Table 7.59 Use of OHSA Services – Seminars, Conferences, Events - by Company Size

OCCUPATIONAL HEALTH AND SAFETY IN MALTA - A SNAPSHOT OF PREVAILING STANDARDS
282
305
CountsAnalysis %Respondents
TotalVery
Satisfied Satisfied
Neithersatisfied nordissatisfied Not satisfied
Not satisfiedat all Don't know
Provision of guidance or advice
Use of OHSA Website
Assistance / mediation with atrade dispute
OHSA training course
Printed material on H&S
Seminars, conferences andother similar events organisedby OHSA
179 6737.4%
9251.4%
105.6%
42.2%
42.2%
21.1%
163 4930.1%
9155.8%
2112.9%
10.6%
--
10.6%
21 419.0%
1152.4%
14.8%
14.8%
29.5%
29.5%
193 6634.2%
10755.4%
168.3%
31.6%
10.5%
--
188 6132.4%
11259.6%
136.9%
10.5%
--
10.5%
85 3035.3%
4856.5%
44.7%
11.2%
--
22.4%
Table 7.60 Satisfaction with OHSA’s services
Table 7.60 Satisfaction with OHSA’s services
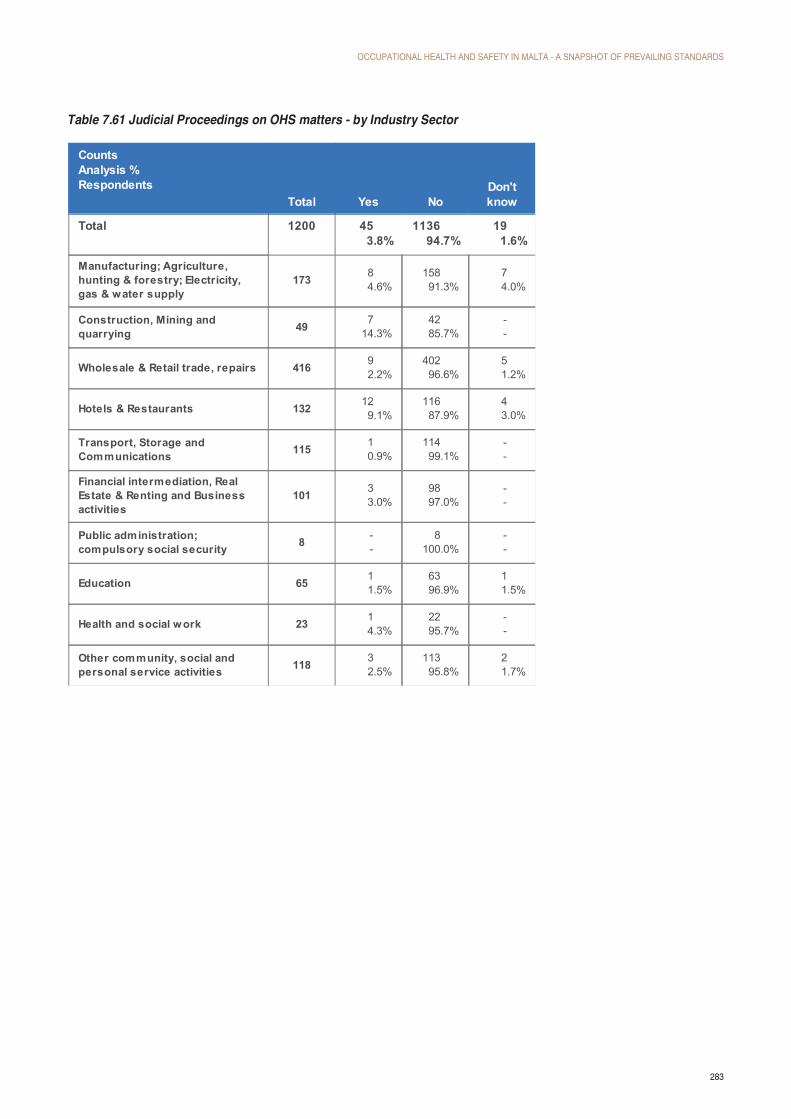
OCCUPATIONAL HEALTH AND SAFETY IN MALTA - A SNAPSHOT OF PREVAILING STANDARDS
283
306
CountsAnalysis %Respondents
Total
Total
Yes NoDon'tknow
Manufacturing; Agriculture,hunting & forestry; Electricity,gas & water supply
Construction, Mining andquarrying
Wholesale & Retail trade, repairs
Hotels & Restaurants
Transport, Storage andCommunications
Financial intermediation, RealEstate & Renting and Businessactivities
Public administration;compulsory social security
Education
Health and social work
Other community, social andpersonal service activities
1200 453.8%
113694.7%
191.6%
173 84.6%
15891.3%
74.0%
49 714.3%
4285.7%
--
416 92.2%
40296.6%
51.2%
132 129.1%
11687.9%
43.0%
115 10.9%
11499.1%
--
101 33.0%
9897.0%
--
8 --
8100.0%
--
65 11.5%
6396.9%
11.5%
23 14.3%
2295.7%
--
118 32.5%
11395.8%
21.7%
Table 7.61 Judicial Proceedings on OHS matters - by Industry Sector
Table 7.61 Judicial Proceedings on OHS matters - by Industry Sector

OCCUPATIONAL HEALTH AND SAFETY IN MALTA - A SNAPSHOT OF PREVAILING STANDARDS
284
308
CountsBase %Respondents
Total
Yes
No
Don't know
164100.0%
3118.9%
12878.0%
53.0%
Table 7.66 Damage Incurred due to Accidents
307
CountsAnalysis %Respondents
Total
Total
Yes NoDon'tknow
1 - 9 employees
10 - 49 employees
50 - 249 employees
250 - 499 employees
500 employees or more
1200 453.8%
113694.7%
191.6%
915 151.6%
88997.2%
111.2%
183 94.9%
16992.3%
52.7%
74 1520.3%
5675.7%
34.1%
17 423.5%
1376.5%
--
11 218.2%
981.8%
--
Table 7.62 Judicial Proceedings on OHS matters - by Company Size
Table 7.62 Judicial Proceedings on OHS matters - by Company Size
Table 7.66 Damage Incurred due to Accidents
309
CountsBase %Respondents
Total
€0 to €500
€501 to € 2,000
€2,001 to € 5,000
€5,001 to € 10,000
€10,001 to €15,000
€15,001 to € 20,000
€20,001 to €30,000
More than € 30,000
Don't know
31100.0%
1341.9%
516.1%
516.1%
--
--
--
13.2%
13.2%
619.4%
Table 7.67 Costs Incurred from Damages in 2010
Table 7.67 Costs Incurred from Damages in 2010
Table 7.68 Costs of Non-Injury Accidents
310
CountsBase %Respondents
Total
€0 to €500
€501 to € 2,000
€2,001 to € 5,000
€5,001 to € 10,000
€10,001 to €15,000
€20,001 to €30,000
More than € 30,000
Don't know
156100.0%
8957.1%
3220.5%
159.6%
85.1%
10.6%
10.6%
21.3%
85.1%
Table 7.68 Costs of Non-Injury Accidents

OCCUPATIONAL HEALTH AND SAFETY IN MALTA - A SNAPSHOT OF PREVAILING STANDARDS
285
311
CountsAnalysis %Respondents
Total
Total
Yes NoDon'tknow
Manufacturing; Agriculture,hunting & forestry; Electricity,gas & water supply
Construction, Mining andquarrying
Wholesale & Retail trade, repairs
Hotels & Restaurants
Transport, Storage andCommunications
Financial intermediation, RealEstate & Renting and Businessactivities
Public administration;compulsory social security
Education
Health and social work
Other community, social andpersonal service activities
1200 69858.2%
18915.8%
31326.1%
173 9957.2%
2715.6%
4727.2%
49 3469.4%
510.2%
1020.4%
416 19747.4%
9422.6%
12530.0%
132 9572.0%
1813.6%
1914.4%
115 6354.8%
54.3%
4740.9%
101 7372.3%
87.9%
2019.8%
8 8100.0%
--
--
65 3249.2%
1015.4%
2335.4%
23 1773.9%
28.7%
417.4%
118 8067.8%
2016.9%
1815.3%
Table 7.69 Investigation of Accidents - by Industry Sector
Table 7.69 Investigation of Accidents - by Industry Sector

OCCUPATIONAL HEALTH AND SAFETY IN MALTA - A SNAPSHOT OF PREVAILING STANDARDS
286
312
CountsAnalysis %Respondents
Total
Total
Yes NoDon'tknow
1 - 9 employees
10 - 49 employees
50 - 249 employees
250 - 499 employees
500 employees or more
1200 69858.2%
18915.8%
31326.1%
915 48953.4%
16417.9%
26228.6%
183 12467.8%
2010.9%
3921.3%
74 5979.7%
45.4%
1114.9%
17 1588.2%
15.9%
15.9%
11 11100.0%
--
--
Table 7.70 Investigation of Accidents - by Company Size
Table 7.70 Investigation of Accidents - by Company Size

OCCUPATIONAL HEALTH AND SAFETY IN MALTA - A SNAPSHOT OF PREVAILING STANDARDS
287
Table 7.71 Communication of Investigation Results to Employees - by Industry Sector
313
CountsAnalysis %Respondents
Total
Total
Yes NoDon'tknow
Manufacturing; Agriculture,hunting & forestry; Electricity,gas & water supply
Construction, Mining andquarrying
Wholesale & Retail trade, repairs
Hotels & Restaurants
Transport, Storage andCommunications
Financial intermediation, RealEstate & Renting and Businessactivities
Public administration;compulsory social security
Education
Health and social work
Other community, social andpersonal service activities
698 63691.1%
213.0%
415.9%
99 9393.9%
11.0%
55.1%
34 3088.2%
--
411.8%
197 18392.9%
63.0%
84.1%
95 8488.4%
55.3%
66.3%
63 6196.8%
11.6%
11.6%
73 6082.2%
34.1%
1013.7%
8 675.0%
--
225.0%
32 3093.8%
--
26.3%
17 17100.0%
--
--
80 7290.0%
56.3%
33.8%
Table 7.71 Communication of Investigation Results to Employees - by Industry Sector

OCCUPATIONAL HEALTH AND SAFETY IN MALTA - A SNAPSHOT OF PREVAILING STANDARDS
288
314
CountsAnalysis %Respondents
Total
Total
Yes NoDon'tknow
1 - 9 employees
10 - 49 employees
50 - 249 employees
250 - 499 employees
500 employees or more
698 63691.1%
213.0%
415.9%
489 44691.2%
163.3%
275.5%
124 11491.9%
43.2%
64.8%
59 5186.4%
11.7%
711.9%
15 1493.3%
--
16.7%
11 11100.0%
--
--
Table 7.72 Communication of Investigation Results to Employees - by Company Size
Table 7.72 Communication of Investigation Results to Employees - by Company Size

OCCUPATIONAL HEALTH AND SAFETY IN MALTA - A SNAPSHOT OF PREVAILING STANDARDS
289
315
CountsAnalysis %Respondents
Total
Total
Yes NoDon'tknow
Manufacturing; Agriculture,hunting & forestry; Electricity,gas & water supply
Construction, Mining andquarrying
Wholesale & Retail trade, repairs
Hotels & Restaurants
Transport, Storage andCommunications
Financial intermediation, RealEstate & Renting and Businessactivities
Public administration;compulsory social security
Education
Health and social work
Other community, social andpersonal service activities
1200 75763.1%
836.9%
36030.0%
173 11063.6%
84.6%
5531.8%
49 3673.5%
--
1326.5%
416 22353.6%
419.9%
15236.5%
132 10176.5%
118.3%
2015.2%
115 6657.4%
10.9%
4841.7%
101 6968.3%
55.0%
2726.7%
8 787.5%
--
112.5%
65 3655.4%
69.2%
2335.4%
23 2087.0%
--
313.0%
118 8975.4%
119.3%
1815.3%
Table 7.73 Remedial Action Taken - by Industry Sector
Table 7.73 Remedial Action Taken - by Industry Sector

OCCUPATIONAL HEALTH AND SAFETY IN MALTA - A SNAPSHOT OF PREVAILING STANDARDS
290
316
CountsAnalysis %Respondents
Total
Total
Yes NoDon'tknow
1 - 9 employees
10 - 49 employees
50 - 249 employees
250 - 499 employees
500 employees or more
1200 75763.1%
836.9%
36030.0%
915 53758.7%
758.2%
30333.1%
183 13573.8%
73.8%
4122.4%
74 5979.7%
11.4%
1418.9%
17 1588.2%
--
211.8%
11 11100.0%
--
--
Table 7.74 Remedial Action Taken - by Company Size
Table 7.74 Remedial Action Taken - by Company Size
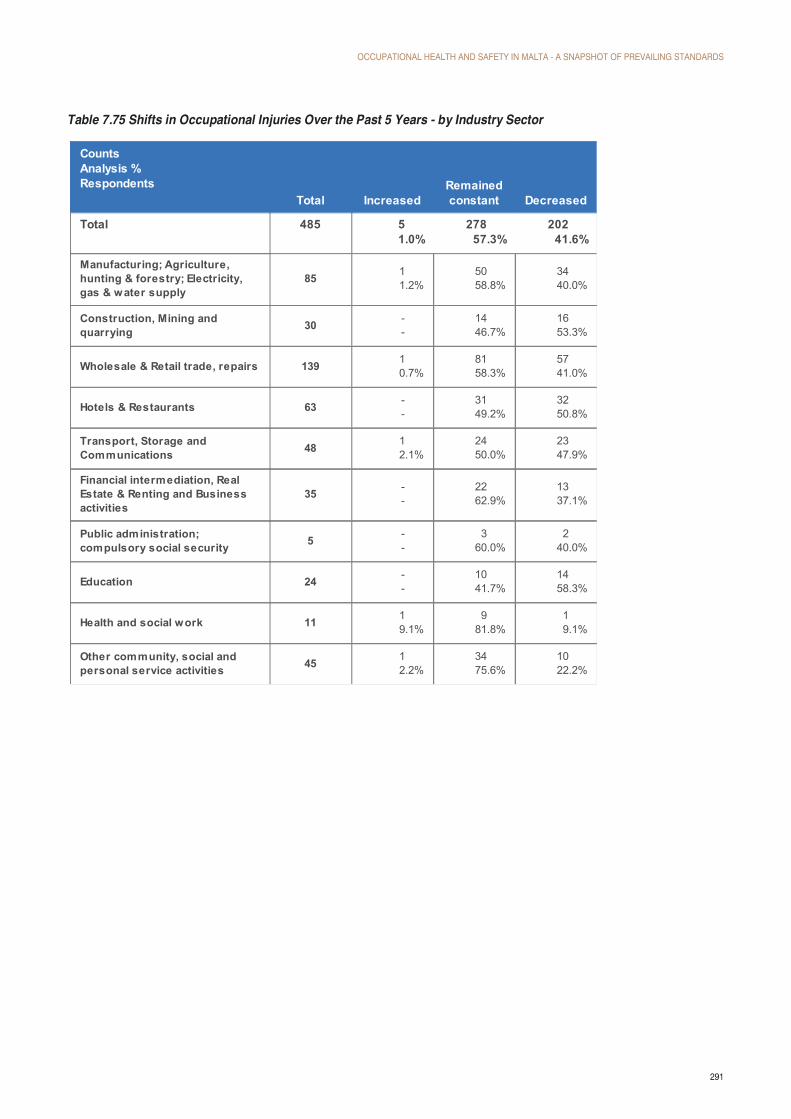
OCCUPATIONAL HEALTH AND SAFETY IN MALTA - A SNAPSHOT OF PREVAILING STANDARDS
291
317
CountsAnalysis %Respondents
Total
Total
IncreasedRemainedconstant Decreased
Manufacturing; Agriculture,hunting & forestry; Electricity,gas & water supply
Construction, Mining andquarrying
Wholesale & Retail trade, repairs
Hotels & Restaurants
Transport, Storage andCommunications
Financial intermediation, RealEstate & Renting and Businessactivities
Public administration;compulsory social security
Education
Health and social work
Other community, social andpersonal service activities
485 51.0%
27857.3%
20241.6%
85 11.2%
5058.8%
3440.0%
30 --
1446.7%
1653.3%
139 10.7%
8158.3%
5741.0%
63 --
3149.2%
3250.8%
48 12.1%
2450.0%
2347.9%
35 --
2262.9%
1337.1%
5 --
360.0%
240.0%
24 --
1041.7%
1458.3%
11 19.1%
981.8%
19.1%
45 12.2%
3475.6%
1022.2%
Table 7.75 Shifts in Occupational Injuries Over the Past 5 Years - by Industry Sector
Table 7.75 Shifts in Occupational Injuries Over the Past 5 Years - by Industry Sector

OCCUPATIONAL HEALTH AND SAFETY IN MALTA - A SNAPSHOT OF PREVAILING STANDARDS
292
318
CountsAnalysis %Respondents
Total
Total
IncreasedRemainedconstant Decreased
Manufacturing; Agriculture,hunting & forestry; Electricity,gas & water supply
Construction, Mining andquarrying
Wholesale & Retail trade, repairs
Hotels & Restaurants
Transport, Storage andCommunications
Financial intermediation, RealEstate & Renting and Businessactivities
Public administration;compulsory social security
Education
Health and social work
Other community, social andpersonal service activities
382 51.3%
25566.8%
12231.9%
65 11.5%
4264.6%
2233.8%
19 --
1263.2%
736.8%
98 --
6566.3%
3333.7%
44 --
3068.2%
1431.8%
43 --
2455.8%
1944.2%
31 --
2271.0%
929.0%
3 --
266.7%
133.3%
23 14.3%
1147.8%
1147.8%
11 218.2%
872.7%
19.1%
45 12.2%
3986.7%
511.1%
Table 7.76 Shifts in Cases of Physical Ill-Health Over the Past 5 Years - by Industry Sector
Table 7.76 Shifts in Cases of Physical Ill-Health Over the Past 5 Years - by Industry Sector

OCCUPATIONAL HEALTH AND SAFETY IN MALTA - A SNAPSHOT OF PREVAILING STANDARDS
293
319
CountsAnalysis %Respondents
Total
Total
IncreasedRemainedconstant Decreased
Manufacturing; Agriculture,hunting & forestry; Electricity,gas & water supply
Construction, Mining andquarrying
Wholesale & Retail trade, repairs
Hotels & Restaurants
Transport, Storage andCommunications
Financial intermediation, RealEstate & Renting and Businessactivities
Public administration;compulsory social security
Education
Health and social work
Other community, social andpersonal service activities
325 154.6%
22569.2%
8526.2%
58 11.7%
4272.4%
1525.9%
16 212.5%
956.3%
531.3%
91 22.2%
6672.5%
2325.3%
33 13.0%
2472.7%
824.2%
31 --
1961.3%
1238.7%
26 311.5%
1661.5%
726.9%
3 --
266.7%
133.3%
18 211.1%
738.9%
950.0%
12 216.7%
975.0%
18.3%
37 25.4%
3183.8%
410.8%
Table 7.77 Shifts in Cases of Psychological Ill-Health Over the Past 5 Years –
by Industry Sector
Table 7.77 Shifts in Cases of Psychological Ill-Health Over the Past 5 Years – by Industry Sector