Embed Size (px)
Citation preview

Occupancy and Performance Appraisal: Early Childhood Education and Care Sector
December 2018

Prepared on behalf of:
Australian Childcare Alliance, Australian Community Children’s Services, ELACCA
Prepared by:
Kerrianne Meulman Managing Director
Jacques de Wet & Chidi Ezimah Research Assistants
17095
Urban Economics Level 10, 87 Wickham Tce
Spring Hill QLD 4000 (ph) 07 3839 1400
[email protected] www.urbaneconomics.com.au
Warranty
This report has been based upon the most up to date readily available information at this point in time, as documented in this report. Urban Economics has applied due professional care and diligence in accordance with generally accepted standards of professional practice in undertaking the analysis contained in this report from these information sources. Urban Economics shall not be liable for damages arising from any errors or omissions which may be contained within these information sources. As this report involves future market projections which can be affected by a number of unforeseen variables, they represent our best possible estimates at this point in time and no warranty is given that this particular set of projections will in fact eventuate.

i | P a g e
TABLE OF CONTENTS
EXECUTIVE SUMMARY .......................................................................................................... ii
1.0 INTRODUCTION ................................................................................................................ 1
2.0 STUDY METHODOLOGY ..................................................................................................... 2
3.0 EARLY CHILDHOOD EDUCATION & CARE NETWORK ................................................................. 4
3.1 TRENDS AFFECTING THE CHILDCARE SECTOR ................................................................................. 4 3.2 SUPPLY PROFILE ...................................................................................................................... 6
3.2.1 SUPPLY OF PLACES ......................................................................................................................... 6 3.2.2 NEW SOUTH WALES ....................................................................................................................... 8 3.2.3 VICTORIA .................................................................................................................................. 11 3.2.4 QUEENSLAND.............................................................................................................................. 13 3.2.5 WESTERN AUSTRALIA ................................................................................................................... 16 3.2.5 SOUTH AUSTRALIA ....................................................................................................................... 18 3.2.7 OTHER ...................................................................................................................................... 19
3.3 IMPLICATIONS FOR THE SECTOR ................................................................................................ 21
4.0 DEMAND FOR EARLY CHILDHOOD EDUCATION & CARE........................................................... 23
4.1 DEMAND DRIVERS ................................................................................................................. 23 4.2 POPULATION & HOUSEHOLD GROWTH ...................................................................................... 25
5.0 DEMAND AND SUPPLY BALANCE........................................................................................ 30
6.0 OTHER FACTORS INFLUENCING THE SECTOR ......................................................................... 31
7.0 OCCUPANCY RATES AND CENTRE VIABILITY.......................................................................... 33
8.0 CONCLUDING COMMENTS ................................................................................................ 36
APPENDIX 1 – CHILD CARE PROVISION BY LGA .............................................................................. 37
APPENDIX 2 – SURVEY QUESTIONNAIRE ....................................................................................... 43
REFERENCES ........................................................................................................................... 48

ii | P a g e
EXECUTIVE SUMMARY
• This Report has been prepared by Urban Economics providing an independent analysis of the factors influencing demand for, and supply of, Early Childhood Education and Care (ECEC) across Australia.
• This independent analysis examines the results of a national survey of ECEC operators, centres and managers exploring available places, enrolment, performance and key issues influencing the sector and individual centres.
• A survey of centre operators was undertaken between August and October 2018 as input to this analysis, with operators asked to report their enrolment numbers and occupancy rates for the week ending May 25th2018, enabling comparisons of the results with a survey undertaken in Queensland in May 2017.
• Occupancy rates were diverse across regions, even reflecting different occupancy rates within the same regions, indicative that there were a range of factors at play in influencing centre performance including catchment size, age of facilities, location, accessibility, operator, quality etc. There has generally been a decrease in occupancy rates, particularly in South Australia and Queensland, which is coincident with an increase in the opening of new centres.
• By their very nature, supply additions are “lumpy” rather than incremental like population growth or demand for ECEC places, therefore the addition of a new centre is likely to have implications for some existing facilities and centres, at least for the short to medium term as population growth and demand for additional ECEC places or utilisation of ECEC places absorbs additional supply.
• As highlighted in the following TABLE, Metropolitan areas typically demonstrated a higher incidence of centres with occupancy rates in excess of 90%, whilst regional and remote centres demonstrated a relatively even distribution of occupancy rate performances across peak high and low brackets.
TABLE A: Occupancy Ranges by Location
State Occupancy Rates
Inner Metropolitan %
Outer Metropolitan %
Region/Remote %
Qld <60% 9 22 22
Qld >90% 51 14 24
NSW <60% 23 12 16
NSW >90% 39 32 38
VIC <60% 10 17 19
VIC >90% 36 29 21
iii | P a g e
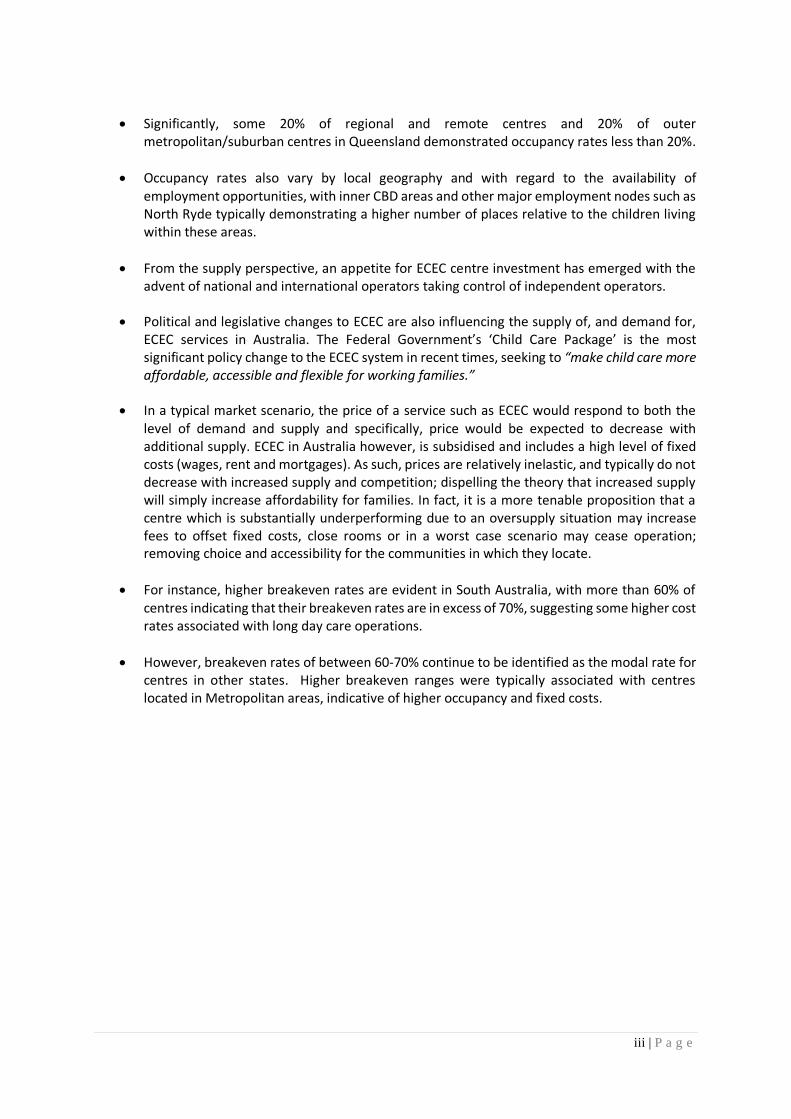
• Significantly, some 20% of regional and remote centres and 20% of outer
metropolitan/suburban centres in Queensland demonstrated occupancy rates less than 20%.
• Occupancy rates also vary by local geography and with regard to the availability of employment opportunities, with inner CBD areas and other major employment nodes such as North Ryde typically demonstrating a higher number of places relative to the children living within these areas.
• From the supply perspective, an appetite for ECEC centre investment has emerged with the advent of national and international operators taking control of independent operators.
• Political and legislative changes to ECEC are also influencing the supply of, and demand for, ECEC services in Australia. The Federal Government’s ‘Child Care Package’ is the most significant policy change to the ECEC system in recent times, seeking to “make child care more affordable, accessible and flexible for working families.”
• In a typical market scenario, the price of a service such as ECEC would respond to both the level of demand and supply and specifically, price would be expected to decrease with additional supply. ECEC in Australia however, is subsidised and includes a high level of fixed costs (wages, rent and mortgages). As such, prices are relatively inelastic, and typically do not decrease with increased supply and competition; dispelling the theory that increased supply will simply increase affordability for families. In fact, it is a more tenable proposition that a centre which is substantially underperforming due to an oversupply situation may increase fees to offset fixed costs, close rooms or in a worst case scenario may cease operation; removing choice and accessibility for the communities in which they locate.
• For instance, higher breakeven rates are evident in South Australia, with more than 60% of centres indicating that their breakeven rates are in excess of 70%, suggesting some higher cost rates associated with long day care operations.
• However, breakeven rates of between 60-70% continue to be identified as the modal rate for centres in other states. Higher breakeven ranges were typically associated with centres located in Metropolitan areas, indicative of higher occupancy and fixed costs.
1 | P a g e
1.0 INTRODUCTION Urban Economics has been commissioned by a consortium of Early Childhood Education and Care (ECEC) organisations and operators to examine and profile the performance of the ECEC sector within Australia. This independent analysis explores the performance of the sector through a survey of member centres and a critique of demand and supply drivers. A survey of members nationally was undertaken during August to October 2018, and member organisations also provided summary data sets of centre occupancy and performance data to supplement the quantitative and qualitative results collated through the survey. The results of the survey have been compared with a comparable survey conducted on behalf of Australian Childcare Alliance (Qld) in 2017, noting changes over time. The results of this comprehensive analysis will be utilised by the sector to advocate on behalf of the sector and their members as to the key issues influencing their sector including but not limited to the supply of places, staffing, regulations and perceptions of the sector. Urban Economics is a specialist economic and market research consultancy teamed by professionals with a passion for understanding how we live, work, play and learn within our urban environments. We enjoy exploring vertical and horizontal integration and linkage opportunities and critiquing the commercial realities underpinning these opportunities. Our consulting experience has spanned the breadth of urban developments from child care to aged care, and we are experienced in investigating economic development strategies and opportunities across a broad spectrum of development scales.

2 | P a g e
2.0 STUDY METHODOLOGY The overall objective of this analysis is to explore the performance of the ECEC sector and to examine the demand and supply factors influencing the performance of the sector. This analysis has applied a range of primary and secondary research tools in assessing the performance of the ECEC sector Australia-wide and on a state by state basis. The study process has adopted the following approach:
• ‘Discover what is’ through a comprehensive survey of ECEC centres and member
organisations nationally;
• Assessed the performance of ECEC centres based on enrolment and occupancy rates;
• Examined the relative provision of ECEC services and places across Australia relative to the
number of children 0-4 years,
• Examined the demand supply balance of long day care centres;
• Critiqued trends in ECEC supply and demand;
• Critiqued implications of performance for the ECEC sector.
A total of 889 responses to the on-line survey were collected, together with data sets from Goodstart, YMCA, Foundational Early Learning, Guardian and SDN which have been collated to present a quantitative analysis of occupancy and attendance performance. A total sample of 1,342 centres has therefore been collected, with the following TABLE summarising the number of responding centres by State/Territory:
TABLE 2.1: Responding Centres by Location
State/Territory No. Centres %
NSW 537 32%
VIC 352 21%
QLD 412 31%
WA 180 11%
SA 128 8%
TAS, ACT & NT 49 3%
TOTAL 1,658 100%
With a total of 1,658 responding centres, this represents a statistically significant sample from which inferences as to the performance and occupancy rate of the total population of long day care centres can be derived. In optimising the statistical significance of the centre data, we have combined the results for Tasmania, the Australian Capital Territory and the Northern Territory, however, this remains less than 50 centres and whilst an overview of results has been provided in this Report, inferences for the total number of centres are cautioned. On a state by state basis, the following maximum margins of error are attached to the results based on sample sizes:
3 | P a g e
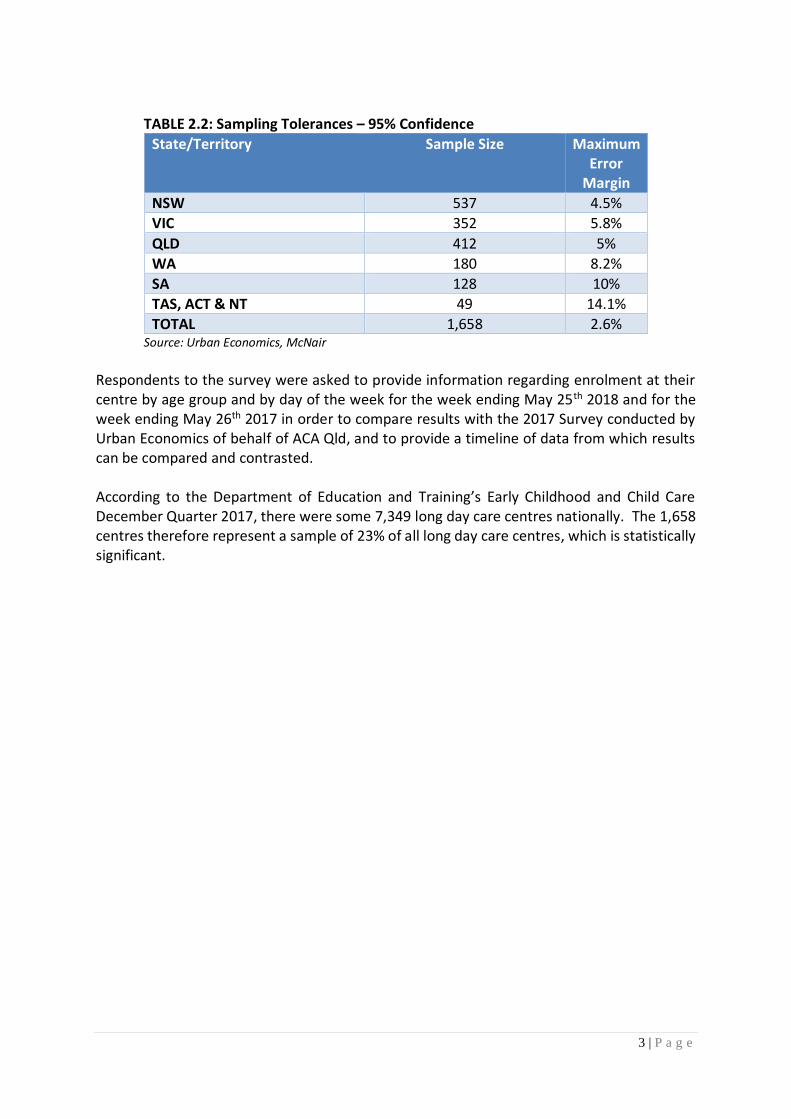
TABLE 2.2: Sampling Tolerances – 95% Confidence
State/Territory Sample Size Maximum Error
Margin
NSW 537 4.5%
VIC 352 5.8%
QLD 412 5%
WA 180 8.2%
SA 128 10%
TAS, ACT & NT 49 14.1%
TOTAL 1,658 2.6% Source: Urban Economics, McNair
Respondents to the survey were asked to provide information regarding enrolment at their centre by age group and by day of the week for the week ending May 25th 2018 and for the week ending May 26th 2017 in order to compare results with the 2017 Survey conducted by Urban Economics of behalf of ACA Qld, and to provide a timeline of data from which results can be compared and contrasted. According to the Department of Education and Training’s Early Childhood and Child Care December Quarter 2017, there were some 7,349 long day care centres nationally. The 1,658 centres therefore represent a sample of 23% of all long day care centres, which is statistically significant.

4 | P a g e
3.0 EARLY CHILDHOOD EDUCATION & CARE NETWORK
This Chapter sets the scene for the analysis, summarising key trends in the ECEC sector influencing and influenced by the supply of centres and supply of places, and identifying the network of centres across Australia. This Chapter also summarises the key performance of centres that responded to the survey at a national and state by state level.
3.1 TRENDS AFFECTING THE ECEC SECTOR Commercial Property Investment Trends
• The Australian ECEC investment market has grown exponentially over the last five years with strong transaction volumes.
• An appetite for ECEC centre investment has emerged with the advent of national and international operators taking control of independent operators. The larger operators can provide better certainty for investment yields and leasing terms which can make ECEC centres attractive for property investors and developers.
• Major international private equity firms and investment banks are signalling confidence in the sector by acquiring large portfolios or taking equity positions.
• Self-managed super funds (SMSF) and ‘mum and dad’ investors/owner operators are attracted to the sub-$5million price point of many centres coupled with the long leases to operators and are therefore competing with institutional and corporate real estate; driving record yields for centres (particularly in metropolitan areas) across Australia.
• ECEC centres are also increasingly integrated within mixed use developments. Whilst once the focus of education precincts, integration of ECEC facilities into mixed use precincts is becoming more common, with movements to also integrate with other forms of development; commercial office buildings, not only in CBDs but also in business parks; and as early education “hubs” with other facilities such as swim schools, challenging the planning and approvals processes.
• “End-of-trip” facilities such as showers and bike storage which were once not common within CBD offices are now considered a standard inclusion by building owners to attract and retain tenants. It is also now considered that ‘lifestyle” facilities such as ECEC and co-working spaces are being demanded by workers and businesses in CBDs or near their place of work.
5 | P a g e
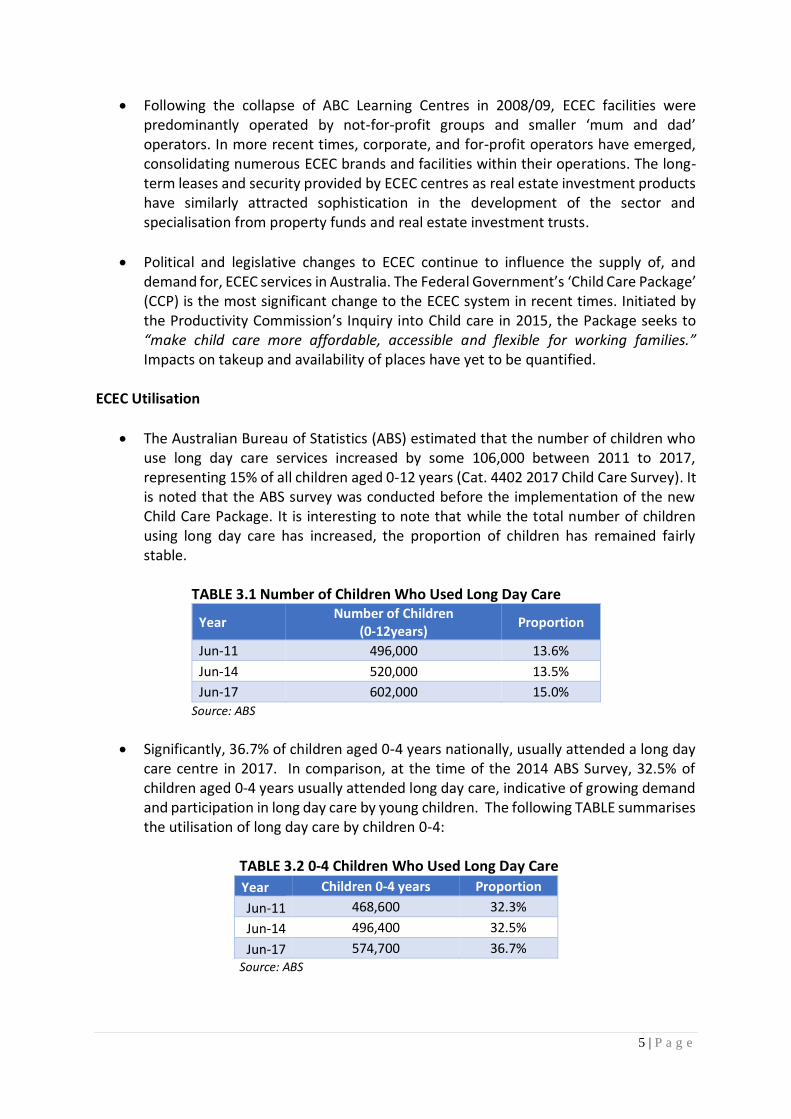
• Following the collapse of ABC Learning Centres in 2008/09, ECEC facilities were predominantly operated by not-for-profit groups and smaller ‘mum and dad’ operators. In more recent times, corporate, and for-profit operators have emerged, consolidating numerous ECEC brands and facilities within their operations. The long-term leases and security provided by ECEC centres as real estate investment products have similarly attracted sophistication in the development of the sector and specialisation from property funds and real estate investment trusts.
• Political and legislative changes to ECEC continue to influence the supply of, and demand for, ECEC services in Australia. The Federal Government’s ‘Child Care Package’ (CCP) is the most significant change to the ECEC system in recent times. Initiated by the Productivity Commission’s Inquiry into Child care in 2015, the Package seeks to “make child care more affordable, accessible and flexible for working families.” Impacts on takeup and availability of places have yet to be quantified.
ECEC Utilisation
• The Australian Bureau of Statistics (ABS) estimated that the number of children who use long day care services increased by some 106,000 between 2011 to 2017, representing 15% of all children aged 0-12 years (Cat. 4402 2017 Child Care Survey). It is noted that the ABS survey was conducted before the implementation of the new Child Care Package. It is interesting to note that while the total number of children using long day care has increased, the proportion of children has remained fairly stable.
TABLE 3.1 Number of Children Who Used Long Day Care
Year Number of Children
(0-12years) Proportion
Jun-11 496,000 13.6%
Jun-14 520,000 13.5%
Jun-17 602,000 15.0%
Source: ABS
• Significantly, 36.7% of children aged 0-4 years nationally, usually attended a long day care centre in 2017. In comparison, at the time of the 2014 ABS Survey, 32.5% of children aged 0-4 years usually attended long day care, indicative of growing demand and participation in long day care by young children. The following TABLE summarises the utilisation of long day care by children 0-4:
TABLE 3.2 0-4 Children Who Used Long Day Care
Year Children 0-4 years Proportion
Jun-11 468,600 32.3%
Jun-14 496,400 32.5%
Jun-17 574,700 36.7% Source: ABS

6 | P a g e
• Whilst the number of children aged 0-4 years increased by 39,100 between 2014 and 2017, the number attending long day care increased by 78,300, indicating increasing utilisation of long day care by young children.
• The following table shows the proportion of children attending long day care by age. More than 50% of 3-year-old children in 2017 usually attend long day care centres (50.9%), as summarised in the following TABLE:
TABLE 3.3: Participation in Long Day Care by Age 2017
Age Participation in Long Day Care
%
0 9.7%
1 35.5%
2 48.3%
3 50.9%
4 37.8% Source: ABS
• The following TABLE summarises the share of children 0 to 5 years by State and Territory that usually attend long day care, based on the 2014 and 2017 ABS Child Care and Education survey results. There has been a general increase in the relative share of children 0 to 5 years attending long day care, particularly in Queensland and Victoria.
TABLE 3.4: % 0-5 Children Attend Long Day Care
2014 2017
NSW 32.4% 33.7%
VIC 25.6% 31.1%
QLD 28.2% 37.5%
WA 22.1% 26.0%
SA 25.4% 27.9%
TAS 8.5% 12.2%
NT 11.8% 8.6%
ACT 15.9% 16.4% Source: ABS
3.2 SUPPLY PROFILE
3.2.1 SUPPLY OF PLACES
• FIGURE 3.1 summarises the Department of Education’s Child Care & Early Learning in Summary data for long day care centres in Australia between June 2010 and December 2017,
• On average, there were 194 new facilities per annum added to the supply network over this period.

7 | P a g e
FIGURE 3.1: Number Long Day Care Centres
Source: Department of Education
• The following TABLE summarises the number of approved Long Day Care Places by State as provided by the Australian Children’s Education & Care Quality Authority data:
TABLE 3.5: Number of Approved Long Day Care Places
State Number of Places Children 0-4 2017 Children per Place NSW 164,578 508,752 3.09
VIC 127,844 392,237 3.07
QLD 125,254 323,305 2.58
WA 38,793 177,558 3.73
SA 28,280 105,377 4.57 Source: ACECQA
• As at December Quarter 2017, there were reported to be 7,349 long day care centres as defined by the Department of Education and Training (DET), comprising 40% of all 18,524 ECEC services nationally.
• The DET report also estimated that between December Quarter 2016 and December Quarter 2017, the number of children utilising long day care increased by some 27,680 children to 734,250 children.
0
1000
2000
3000
4000
5000
6000
7000
8000

8 | P a g e
• Centre occupancy rates are a key metric in determining the viability of an operation. Whilst there is no ‘one size fits all’ measurement for occupancy rates, 70% occupancy is often adopted as the target break-even point for a long day care centre. Data released by larger and sophisticated operators through annual reports suggest that an occupancy rate over 80% and above is targeted for profitable centres.
• A 2016 report by Colliers International estimated that average occupancy rates across Australia were 70% although, regional areas were noted to have occupancy rates averaging between 50% and 70%, whilst metropolitan areas were in the order of 80%.
• Occupancy rates derived from the results of the survey of centres are summarised by State for 2018 and 2017 for reporting centres in the following TABLE, highlighting stable or declining occupancy rates across all markets, particularly in Queensland and South Australia. (A lower incidence of centres reported 2017 results and we have rounded to the nearest whole value to reflect the smaller sample sizes generally).
TABLE 3.6: Occupancy Rates by State & Territory
State/Territory 2017 2018
NSW 79% 80.7%
VIC 82% 78.6%
QLD 80% 72.4%
WA 71% 71.0%
SA 78% 70.9%
ACT/TAS/NT 82% 76.7%
• Occupancy rates by market and day for 2018 are therefore summarised in the following TABLE. As expected, occupancy rates are highest across the board mid-week, with the lowest occupancy rates for most markets evident on Mondays.
TABLE 3.7: Occupancy Rates by Day
Market Monday %
Tuesday %
Wednesday %
Thursday %
Friday %
NSW 74 85 86 85 75
VIC 72 84 83 84 73
QLD 63 75 77 77 66
WA 64 79 77 79 67
SA 61 75 76 76 65
ACT/TAS/NT 72 82 81 82 71
Survey results have been summarised by major markets in the following sections of this Report.
3.2.2 NEW SOUTH WALES
Between 2009 and 2017, the number of registered ECEC services within New South Wales (NSW) has increased by 1,410 businesses.

9 | P a g e
TABLE 3.8: ECEC Service Businesses by Employment Ranges – New South Wales Non
Employing 1-19
Employees 20-199
Employees 200+
Employees Total
Jun-09 1,282 1,146 481 7 2,916
Jun-10 1,369 1,183 506 8 3,066
Jun-11 1,381 1,201 535 10 3,127
Jun-12 1,408 1,439 378 9 3,234
Jun-13 1,427 1,440 411 9 3,287
Jun-14 1,723 1,541 459 10 3,733
Jun-15 1,832 1,656 433 11 3,930
Jun-16 1,978 1,699 446 15 4,135
Jun-17 2,080 1,767 462 16 4,326 Source: ABS
As summarised in TABLE 3.5, 164,578 long day care places are approved across NSW. Based on the number of children 0-4 years in NSW, it is estimated that there are 3.09 children per long day care place. Key findings of the survey for NSW centres are summarised below:
• A total of 537 centres provided data to the survey, with almost three quarters of responding centres located in metropolitan areas as outlined below:
TABLE 3.9: Location of Reporting Centres
Area of Centres %
Inner City 26%
Other Metropolitan 47%
Inner Regional 20%
Outer Regional 7%
Remote 1%
TOTAL 100%
• Some 29,926 licensed places were recorded across 525 reporting centres, representing an average of 57 places per centre, the smallest average places per centre for the States and Territories.
• The following breakdown of places for reporting centres was recorded by age group, noting not all responding centres recorded the number of licensed places by age group:

10 | P a g e
TABLE 3.10: Licensed Places by Age Group - NSW
Age Group No. %
0-2 years 6,088 21%
2-3 years 7,600 27%
3yrs to school age 14,551 52%
TOTAL 28,239 100%
• 451 centres reported places for infants (births to 2 years), representing an average of 13 places per reporting centre, 84% of all reporting centres providing places for infant age groups.
• A significant 61% of the reporting centres had been operational for at least 10 years, and only 17% were less than 5 years old, as illustrated in the following FIGURE 3.2:
FIGURE 3.2: Age of Centre %
• The following TABLE summarises the average charge per day for reporting centres by age group, with distinct differences in fees by location, with inner city Sydney rates typically in excess of $130 per day and in many instances in the order of $150-$160/day:
TABLE 3.11: Fees per Day
Age Group $/Day
Birth-2 years $114.44
2-3 years $112.31
3 yrs – school age $105.77

11 | P a g e
• Based on the licensed places and enrolled children for the week ending 25th May 2018 and 26th May 2017, the following occupancy rates are estimated for New South Wales, estimating an increasing occupancy between 2017 and 2018:
TABLE 3.12: NSW Occupancy Rates
NSW Occupancy Rate %
2017 79%
2018 80.7%
• Occupancy rates for reporting centres in NSW were the highest of all the State and Territory markets investigated.
• Centres in metropolitan areas of Sydney typically recorded high occupancy rates, with some 39% of metropolitan centres demonstrating occupancy rates in excess of 90%, whilst 16% of regional and remote areas demonstrated occupancy rates less than 60%, indicative of employment derived demand for places.
• Of the 318 centres that reported whether they currently had vacancy lists or not, 194 centres indicated that waiting lists applied for the 0-2 years age group, representing 61% of reporting centres.
• 50% of reporting centres identified waiting lists for children aged 2 to 3 years and 30% of reporting centres identified waiting lists for children 3 years to school age (smaller sample sizes).
3.2.3 VICTORIA The number of ECEC services across Victoria has increased by 1,080 services, almost. TABLE 3.5 reported 127,844 long day care places in Victoria and an average of 3.07 children per long day care place.
TABLE 3.13: ECEC Service Businesses by Employment Ranges - Victoria Non-
Employing 1-19
Employees 20-199
Employees 200+
Employees Total
Jun-09 551 359 263 6 1,179
Jun-10 571 391 304 9 1,275
Jun-11 528 393 355 11 1,287
Jun-12 543 516 270 7 1,336
Jun-13 561 527 285 8 1,381
Jun-14 863 657 288 8 1,816
Jun-15 1,055 632 266 6 1,960
Jun-16 1,239 623 256 13 2,134
Jun-17 1,348 627 277 7 2,259 Source: ABS

12 | P a g e
The following summarises the key results of the survey for Victoria:
• Some 352 centres responded to the survey, with 81% of these centres within the Melbourne Metropolitan area, which dominates the Victorian market.
TABLE 3.14: Location of Reporting Centres
Area of Centres %
Inner City 37%
Other Metropolitan 44%
Inner Regional 14%
Outer Regional/Remote 5%
TOTAL 100%
• A total of 28,181 licensed places were reported by 345 centres, representing an average of 82 places per centre.
• Of the 327 centres that reported the number of licensed places by age group, the following breakdown of places was reported:
TABLE 3.15: Reported Places by Age Group - VIC
Age Group No. %
0-2 years 6,898 25%
2-3years 6,634 25%
3yrs to school age 13,426 50%
TOTAL 26,958 100%
• Some 56% of reporting centres have been operational for more than 10 years, and only 22% have opened within the last 5 years. 12 of the reporting centres indicated that they had opened within the 12 months prior to the survey. FIGURE 3.3: Age of Centre %
13 | P a g e
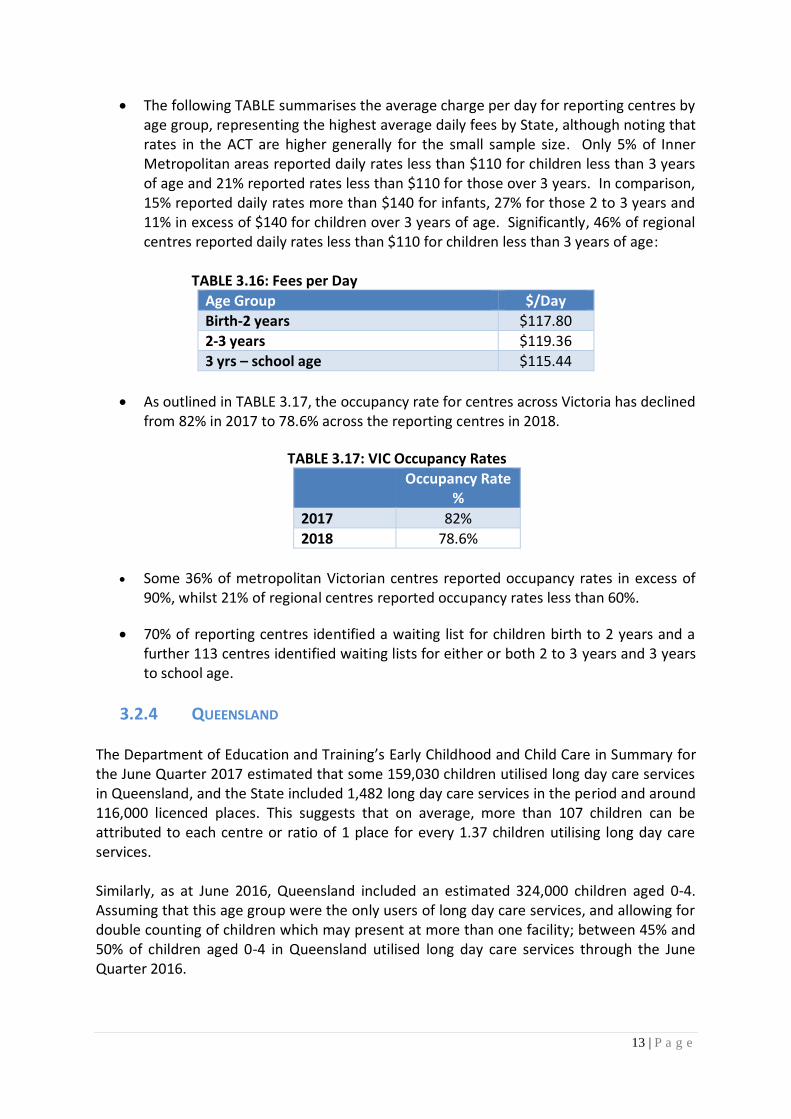
• The following TABLE summarises the average charge per day for reporting centres by age group, representing the highest average daily fees by State, although noting that rates in the ACT are higher generally for the small sample size. Only 5% of Inner Metropolitan areas reported daily rates less than $110 for children less than 3 years of age and 21% reported rates less than $110 for those over 3 years. In comparison, 15% reported daily rates more than $140 for infants, 27% for those 2 to 3 years and 11% in excess of $140 for children over 3 years of age. Significantly, 46% of regional centres reported daily rates less than $110 for children less than 3 years of age:
TABLE 3.16: Fees per Day
Age Group $/Day
Birth-2 years $117.80
2-3 years $119.36
3 yrs – school age $115.44
• As outlined in TABLE 3.17, the occupancy rate for centres across Victoria has declined from 82% in 2017 to 78.6% across the reporting centres in 2018.
TABLE 3.17: VIC Occupancy Rates
Occupancy Rate
%
2017 82%
2018 78.6%
• Some 36% of metropolitan Victorian centres reported occupancy rates in excess of
90%, whilst 21% of regional centres reported occupancy rates less than 60%.
• 70% of reporting centres identified a waiting list for children birth to 2 years and a further 113 centres identified waiting lists for either or both 2 to 3 years and 3 years to school age.
3.2.4 QUEENSLAND The Department of Education and Training’s Early Childhood and Child Care in Summary for the June Quarter 2017 estimated that some 159,030 children utilised long day care services in Queensland, and the State included 1,482 long day care services in the period and around 116,000 licenced places. This suggests that on average, more than 107 children can be attributed to each centre or ratio of 1 place for every 1.37 children utilising long day care services. Similarly, as at June 2016, Queensland included an estimated 324,000 children aged 0-4. Assuming that this age group were the only users of long day care services, and allowing for double counting of children which may present at more than one facility; between 45% and 50% of children aged 0-4 in Queensland utilised long day care services through the June Quarter 2016.
14 | P a g e
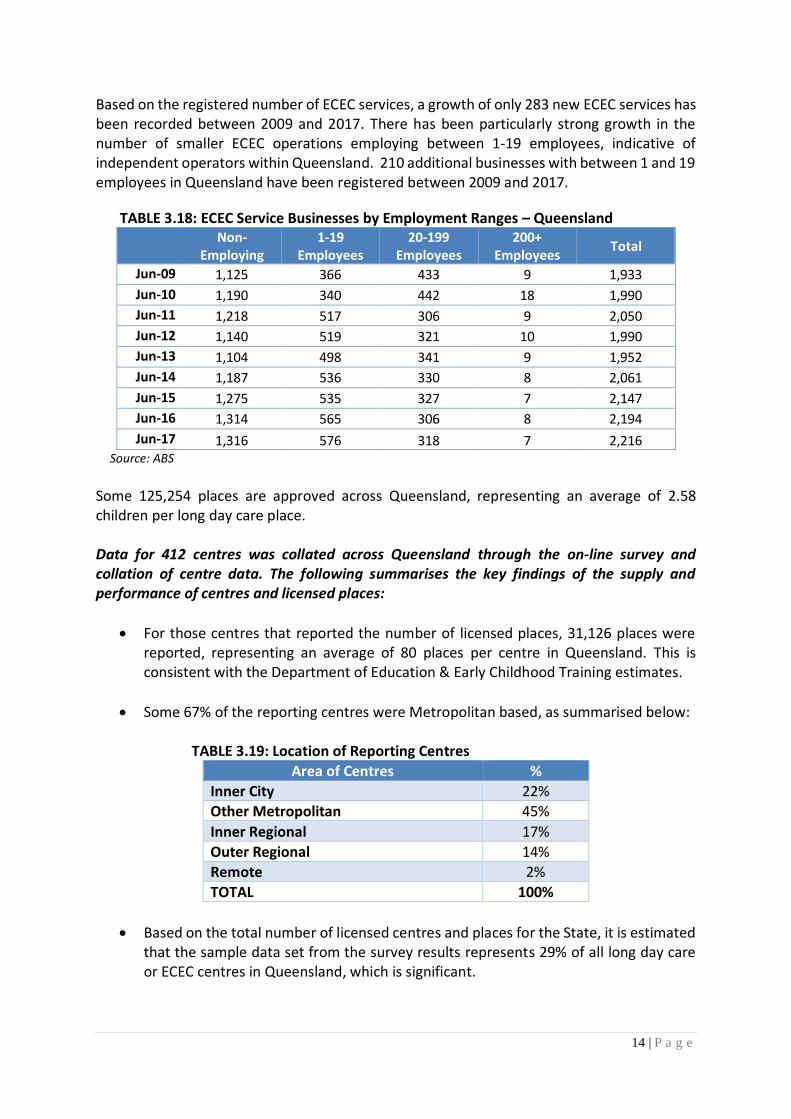
Based on the registered number of ECEC services, a growth of only 283 new ECEC services has been recorded between 2009 and 2017. There has been particularly strong growth in the number of smaller ECEC operations employing between 1-19 employees, indicative of independent operators within Queensland. 210 additional businesses with between 1 and 19 employees in Queensland have been registered between 2009 and 2017.
TABLE 3.18: ECEC Service Businesses by Employment Ranges – Queensland Non-
Employing 1-19
Employees 20-199
Employees 200+
Employees Total
Jun-09 1,125 366 433 9 1,933
Jun-10 1,190 340 442 18 1,990
Jun-11 1,218 517 306 9 2,050
Jun-12 1,140 519 321 10 1,990
Jun-13 1,104 498 341 9 1,952
Jun-14 1,187 536 330 8 2,061
Jun-15 1,275 535 327 7 2,147
Jun-16 1,314 565 306 8 2,194
Jun-17 1,316 576 318 7 2,216 Source: ABS
Some 125,254 places are approved across Queensland, representing an average of 2.58 children per long day care place. Data for 412 centres was collated across Queensland through the on-line survey and collation of centre data. The following summarises the key findings of the supply and performance of centres and licensed places:
• For those centres that reported the number of licensed places, 31,126 places were reported, representing an average of 80 places per centre in Queensland. This is consistent with the Department of Education & Early Childhood Training estimates.
• Some 67% of the reporting centres were Metropolitan based, as summarised below:
TABLE 3.19: Location of Reporting Centres
Area of Centres %
Inner City 22%
Other Metropolitan 45%
Inner Regional 17%
Outer Regional 14%
Remote 2%
TOTAL 100%
• Based on the total number of licensed centres and places for the State, it is estimated that the sample data set from the survey results represents 29% of all long day care or ECEC centres in Queensland, which is significant.
15 | P a g e
• 20% of reported places were for children birth to 2 years, 26% for children 2 to 3 years and 54% of reported places were for children aged 3+.
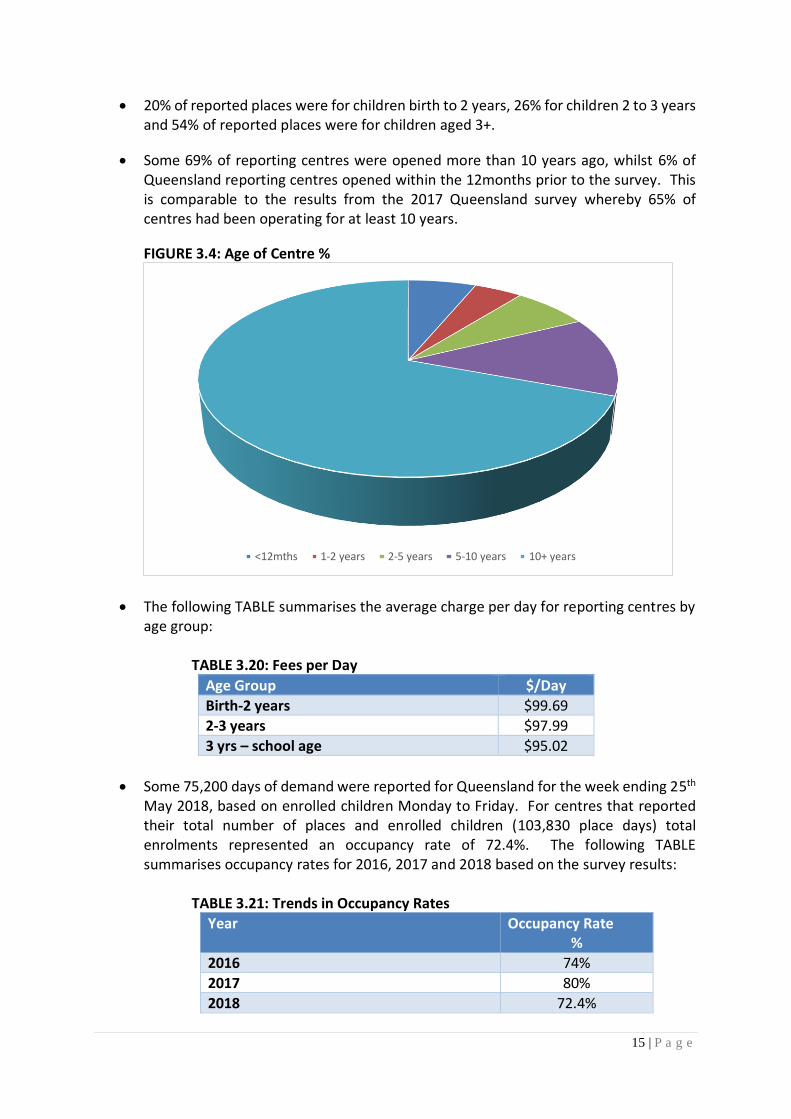
• Some 69% of reporting centres were opened more than 10 years ago, whilst 6% of Queensland reporting centres opened within the 12months prior to the survey. This is comparable to the results from the 2017 Queensland survey whereby 65% of centres had been operating for at least 10 years.
FIGURE 3.4: Age of Centre %
• The following TABLE summarises the average charge per day for reporting centres by age group:
TABLE 3.20: Fees per Day
Age Group $/Day
Birth-2 years $99.69
2-3 years $97.99
3 yrs – school age $95.02
• Some 75,200 days of demand were reported for Queensland for the week ending 25th May 2018, based on enrolled children Monday to Friday. For centres that reported their total number of places and enrolled children (103,830 place days) total enrolments represented an occupancy rate of 72.4%. The following TABLE summarises occupancy rates for 2016, 2017 and 2018 based on the survey results:
TABLE 3.21: Trends in Occupancy Rates
Year Occupancy Rate %
2016 74%
2017 80%
2018 72.4%
<12mths 1-2 years 2-5 years 5-10 years 10+ years
16 | P a g e
• The 2017 surveys results had estimated an occupancy rate of 76% for the 218 responding centres in Queensland, suggesting that the addition of more corporate headquarter data and doubling of the sample size has consolidated occupancy rate reporting. Based on the relative sample sizes and associated standard errors, we conclude that there is consistency between the occupancy rate data for Queensland between the 2017 and 2018 surveys.
• Inner City metropolitan areas were more likely to have occupancy rates in excess of 90%, with more than 50% of reporting centres indicating occupancy rates in excess of 90% in locations proximate to major employment nodes. 22% of other metropolitan and suburban areas identified occupancy rates less than 60% and 14% in excess of 90%, with a further 21% of centres reporting occupancy rates between 70% and 90%.
• In comparison, 24% of regional and remote communities identified occupancy rates in excess of 90% whilst 22% identified occupancy rates less than 60% in 2018.
• Waiting lists apply for the birth to 2 years age group for 58% of the 219 reporting centres or 31% of all Queensland centres.
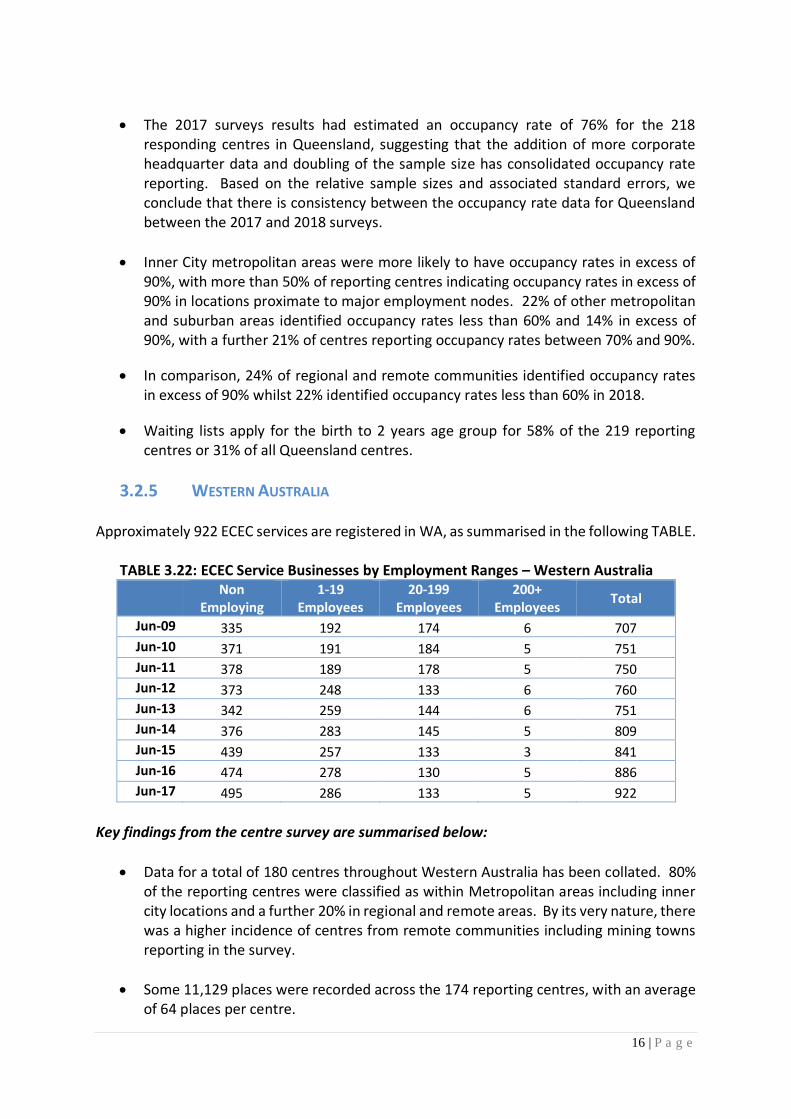
3.2.5 WESTERN AUSTRALIA Approximately 922 ECEC services are registered in WA, as summarised in the following TABLE.
TABLE 3.22: ECEC Service Businesses by Employment Ranges – Western Australia Non
Employing 1-19
Employees 20-199
Employees 200+
Employees Total
Jun-09 335 192 174 6 707
Jun-10 371 191 184 5 751
Jun-11 378 189 178 5 750
Jun-12 373 248 133 6 760
Jun-13 342 259 144 6 751
Jun-14 376 283 145 5 809
Jun-15 439 257 133 3 841
Jun-16 474 278 130 5 886
Jun-17 495 286 133 5 922
Key findings from the centre survey are summarised below:
• Data for a total of 180 centres throughout Western Australia has been collated. 80% of the reporting centres were classified as within Metropolitan areas including inner city locations and a further 20% in regional and remote areas. By its very nature, there was a higher incidence of centres from remote communities including mining towns reporting in the survey.
• Some 11,129 places were recorded across the 174 reporting centres, with an average of 64 places per centre.
17 | P a g e
• The WA network recorded the lowest overall share of places reported for children aged 3 years to school age (44% of all places) relative to the infant (26%) and toddler age groups (30%), which is a factor of the different legislation and funding models implemented.
• The following TABLE summarises the average charge per day for reporting:
TABLE 3.24: Fees per Day
Age Group $/Day
Birth-2 years $106.26
2-3 years $104.74
3 yrs – school age $102.71
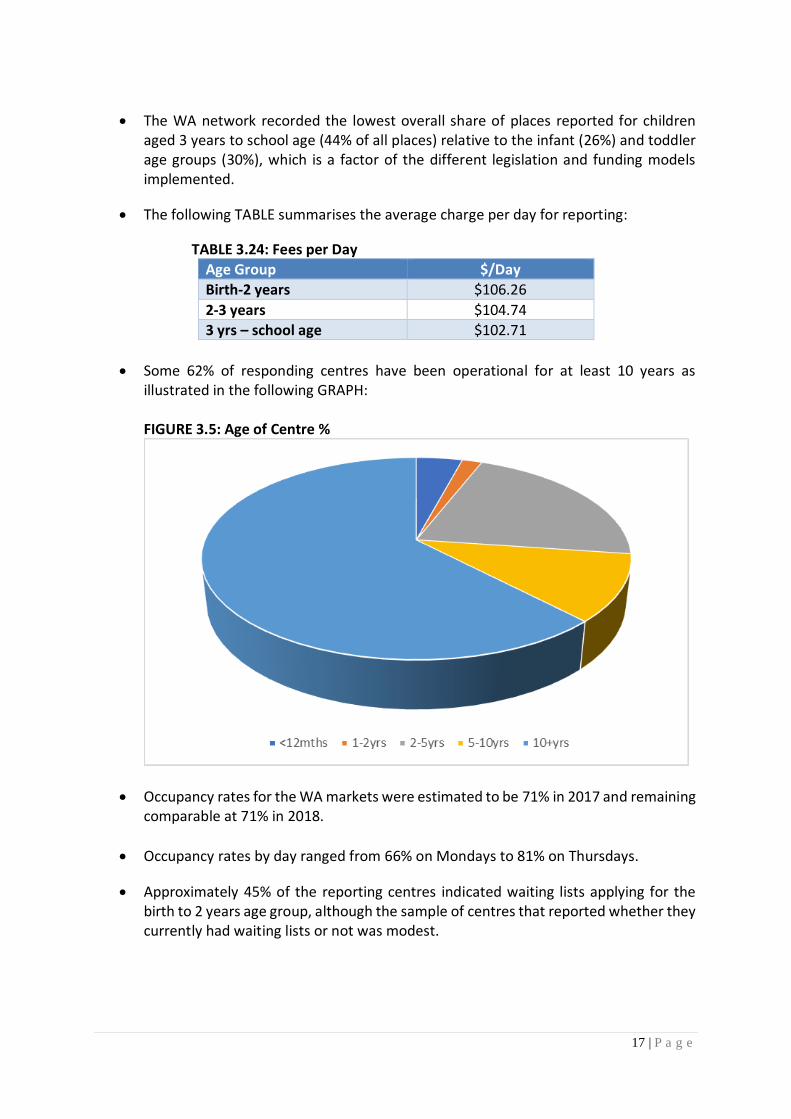
• Some 62% of responding centres have been operational for at least 10 years as illustrated in the following GRAPH:
FIGURE 3.5: Age of Centre %
• Occupancy rates for the WA markets were estimated to be 71% in 2017 and remaining comparable at 71% in 2018.
• Occupancy rates by day ranged from 66% on Mondays to 81% on Thursdays.
• Approximately 45% of the reporting centres indicated waiting lists applying for the birth to 2 years age group, although the sample of centres that reported whether they currently had waiting lists or not was modest.

18 | P a g e
3.2.5 SOUTH AUSTRALIA
Approximately 467 ECEC services are registered in South Australia (SA), as summarised in the following TABLES.
TABLE 3.23: ECEC Service Businesses by Employment Ranges – South Australia Non-
Employing 1-19
Employees 20-199
Employees 200+
Employees Total
Jun-09 295 66 92 3 456
Jun-10 316 65 92 0 473
Jun-11 306 63 101 3 473
Jun-12 286 83 81 0 450
Jun-13 260 79 88 3 430
Jun-14 276 89 91 3 459
Jun-15 295 100 86 3 476
Jun-16 280 111 76 3 471
Jun-17 267 104 88 3 467
Key findings from the centre survey are summarised below:
• Data for a total of 128 centres throughout South Australia has been collated. 92% of the reporting centres were classified as within Metropolitan areas including inner city locations and a further 8% in regional and remote areas.
• Some 9,692 places were recorded across the 128 reporting centres, with an average of 76 places per centre.
• The following TABLE summarises the average charge per day for reporting centres:
TABLE 3.24: Fees per Day
Age Group $/Day
Birth-2 years $105.84
2-3 years $106.10
3 years – school age $105.00
• Some 69% of responding centres have been operational for at least 10 years, comparable to Queensland as comprising the oldest mix of centres for the mainland states as illustrated in the following GRAPH:
19 | P a g e
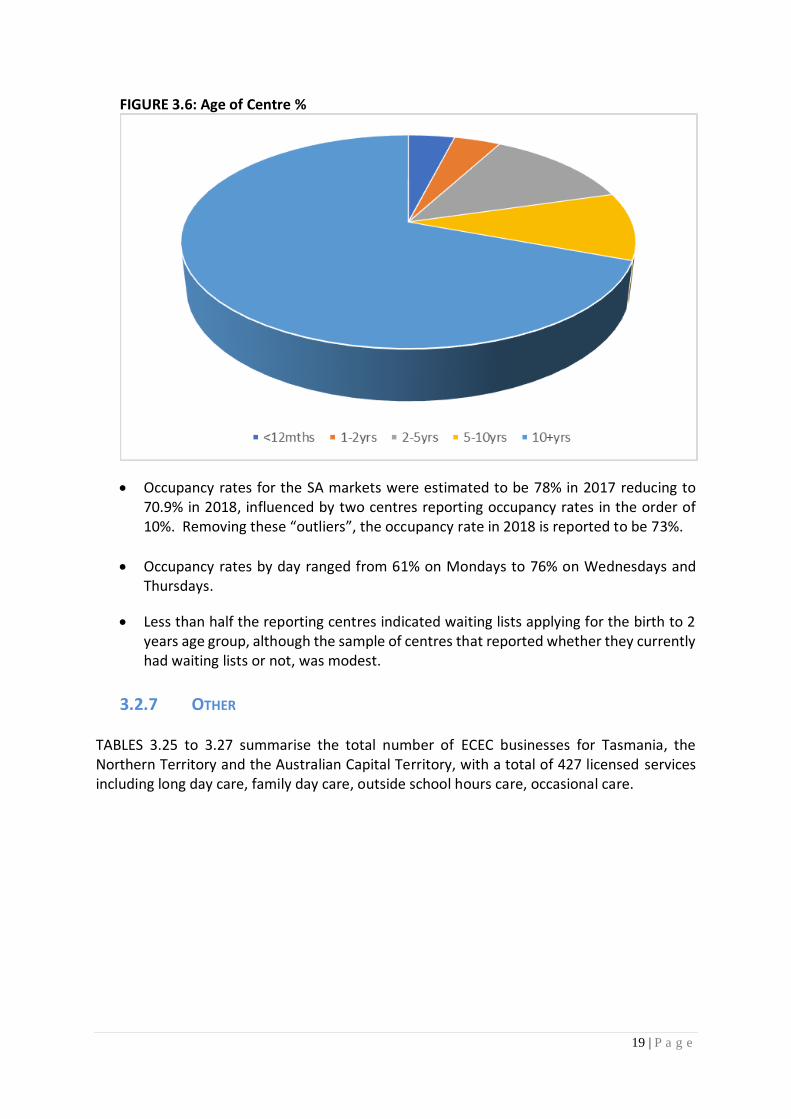
FIGURE 3.6: Age of Centre %
• Occupancy rates for the SA markets were estimated to be 78% in 2017 reducing to 70.9% in 2018, influenced by two centres reporting occupancy rates in the order of 10%. Removing these “outliers”, the occupancy rate in 2018 is reported to be 73%.
• Occupancy rates by day ranged from 61% on Mondays to 76% on Wednesdays and Thursdays.
• Less than half the reporting centres indicated waiting lists applying for the birth to 2 years age group, although the sample of centres that reported whether they currently had waiting lists or not, was modest.
3.2.7 OTHER
TABLES 3.25 to 3.27 summarise the total number of ECEC businesses for Tasmania, the Northern Territory and the Australian Capital Territory, with a total of 427 licensed services including long day care, family day care, outside school hours care, occasional care.

20 | P a g e
TABLE 3.25: ECEC Service Businesses by Employment Ranges - TAS Non-
Employing 1-19
Employees 20-199
Employees 200+
Employees Total
Jun-09 148 37 21 0 206
Jun-10 156 39 21 0 216
Jun-11 173 42 21 0 236
Jun-12 180 44 18 0 242
Jun-13 164 47 19 3 233
Jun-14 168 46 24 0 238
Jun-15 171 42 22 0 233
Jun-16 167 41 22 0 232
Jun-17 152 46 20 3 216
TABLE 3.26: ECEC Service Businesses by Employment Ranges - NT
Non-Employing
1-19 Employees
20-199 Employees
200+ Employees
Total
Jun-09 55 17 19 0 91
Jun-10 68 22 22 0 112
Jun-11 65 19 20 0 104
Jun-12 77 21 20 0 118
Jun-13 65 27 15 0 107
Jun-14 66 27 15 0 108
Jun-15 64 29 15 0 103
Jun-16 67 29 17 0 110
Jun-17 67 30 14 0 115
TABLE 3.27: ECEC Service Businesses by Employment Ranges - ACT
Non-Employing
1-19 Employees
20-199 Employees
200+ Employees
Total
Jun-09 32 10 30 5 77
Jun-10 40 13 34 4 91
Jun-11 32 20 28 4 84
Jun-12 26 22 27 3 78
Jun-13 25 21 28 4 78
Jun-14 30 20 30 3 83
Jun-15 29 28 23 3 84
Jun-16 33 31 25 3 90
Jun-17 34 28 30 3 96
Combining the results of the survey for the ACT, NT and Tasmania, the following summarises the key findings, although noting the small sample size of responding centres:
• Together, 49 reporting centres have been summarised for the ACT, Tasmania and Northern Territory markets. At this sample size, a maximum margin of error of 14% is attached to results so it is important to utilise these results as indicators as to
21 | P a g e
performance not as inferences as to the total population of centres across the three geographic areas.
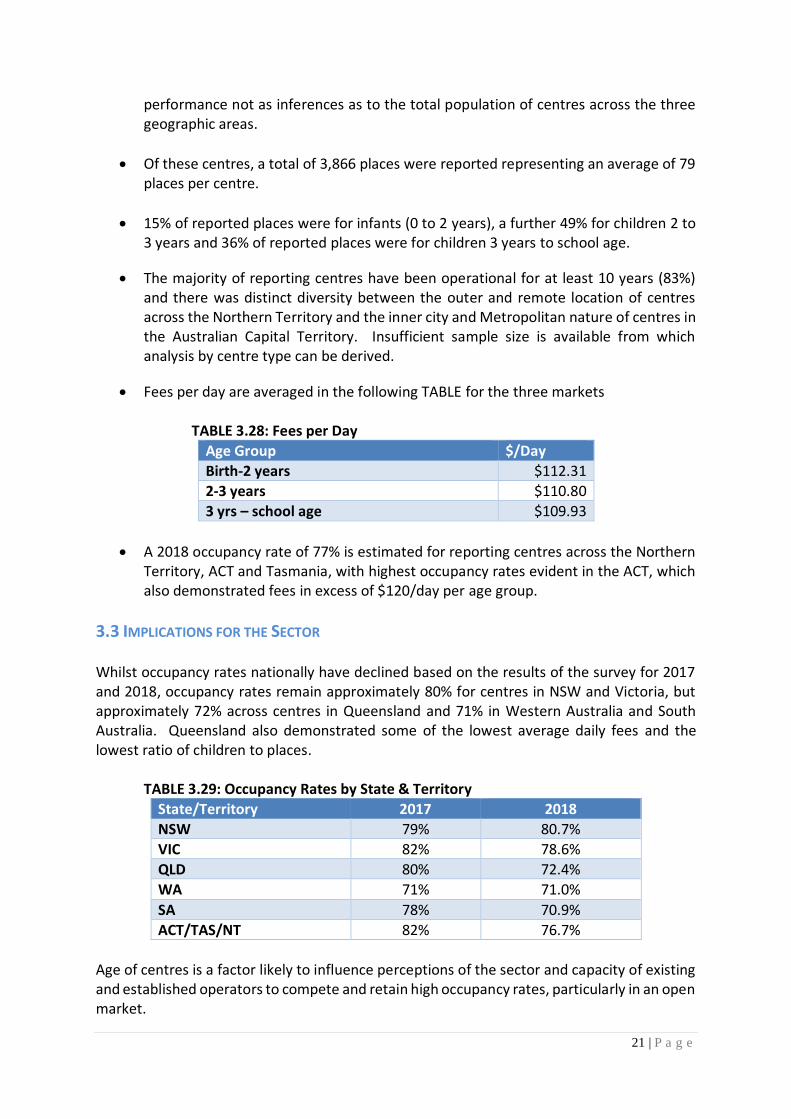
• Of these centres, a total of 3,866 places were reported representing an average of 79 places per centre.
• 15% of reported places were for infants (0 to 2 years), a further 49% for children 2 to 3 years and 36% of reported places were for children 3 years to school age.
• The majority of reporting centres have been operational for at least 10 years (83%) and there was distinct diversity between the outer and remote location of centres across the Northern Territory and the inner city and Metropolitan nature of centres in the Australian Capital Territory. Insufficient sample size is available from which analysis by centre type can be derived.
• Fees per day are averaged in the following TABLE for the three markets
TABLE 3.28: Fees per Day
Age Group $/Day
Birth-2 years $112.31
2-3 years $110.80
3 yrs – school age $109.93
• A 2018 occupancy rate of 77% is estimated for reporting centres across the Northern Territory, ACT and Tasmania, with highest occupancy rates evident in the ACT, which also demonstrated fees in excess of $120/day per age group.
3.3 IMPLICATIONS FOR THE SECTOR Whilst occupancy rates nationally have declined based on the results of the survey for 2017 and 2018, occupancy rates remain approximately 80% for centres in NSW and Victoria, but approximately 72% across centres in Queensland and 71% in Western Australia and South Australia. Queensland also demonstrated some of the lowest average daily fees and the lowest ratio of children to places.
TABLE 3.29: Occupancy Rates by State & Territory
State/Territory 2017 2018
NSW 79% 80.7%
VIC 82% 78.6%
QLD 80% 72.4%
WA 71% 71.0%
SA 78% 70.9%
ACT/TAS/NT 82% 76.7%
Age of centres is a factor likely to influence perceptions of the sector and capacity of existing and established operators to compete and retain high occupancy rates, particularly in an open market.

22 | P a g e
Metropolitan areas typically demonstrated a higher incidence of centres with occupancy rates in excess of 90%, whilst regional and remote centres demonstrated a relatively even distribution of occupancy rate performances across peak high and low brackets. More than 20% of Queensland centres in outer metropolitan/suburban or regional areas reported occupancy rates less than 60%.
TABLE 3.30: Occupancy Ranges by Location
State Occupancy Rates
Inner Metropolitan %
Outer Metropolitan %
Region/Remote %
Qld <60% 9 22 22
Qld >90% 51 14 24
NSW <60% 23 12 16
NSW >90% 39 32 38
VIC <60% 10 17 19
VIC >90% 36 29 21

23 | P a g e
4.0 DEMAND FOR EARLY CHILDHOOD EDUCATION & CARE
4.1 DEMAND DRIVERS
Workforce Trends
• There is significant interplay between increasing casualisation of the workforce and increases in the rate of female workforce participation rates as illustrated in FIGURE 4.1. This growth has moderated since 2009, but peaks in female participation have been reached in 2018 together with declining unemployment rates, indicative of increasing labour force participation.
FIGURE 4.1: Employment Profile – Australia
Source: ABS
• Whilst employment overall continues to grow, casual and part-time job creation has outpaced full-time employment, with declining rates of full term employment. Between 1978 and 2018, the share of workers employed part-time has increased from 15.1% to 31.6% by September 2018, although this has moderated from the Global Financial Crisis (GFC) with increasing casualisation of the workforce.
• Similarly, unemployment rates have been reported within a healthy range of below 6% over this period, a rate which is being maintained by part-time and casual workers. As at September 2018, the national unemployment rate was reported by the ABS to be 5.2%, its lowest point since July 2012.
0%
2%
4%
6%
8%
10%
12%
0%
10%
20%
30%
40%
50%
60%
70%
80%
90%
Feb
-19
78
Ap
r-1
97
9
Jun
-198
0
Au
g-1
981
Oct
-19
82
Dec
-198
3
Feb
-19
85
Ap
r-1
98
6
Jun
-198
7
Au
g-1
988
Oct
-19
89
Dec
-199
0
Feb
-19
92
Ap
r-1
99
3
Jun
-199
4
Au
g-1
995
Oct
-19
96
Dec
-199
7
Feb
-19
99
Ap
r-2
00
0
Jun
-200
1
Au
g-2
002
Oct
-20
03
Dec
-200
4
Feb
-20
06
Ap
r-2
00
7
Jun
-200
8
Au
g-2
009
Oct
-20
10
Dec
-201
1
Feb
-20
13
Ap
r-2
01
4
Jun
-201
5
Au
g-2
016
Oct
-20
17
Un
emp
loym
ent R
ate
Par
tici
pat
ion
Full Time Part Time Female Participation
Male Participation Unemployment Rate

24 | P a g e
State Government Preschool Funding Policy State Government delivery and funding models for preschool programs in the year before school have a significant impact on the demand for child care, not just in the year before school, but for earlier ages as well. The two states (New South Wales and Queensland) that have the highest reliance on long day care programs for the roll out of preschool programs in the year before school also have the highest participation rates of children aged 0-4 in early learning. By contrast, the States that rely heavily on government or community provision of preschool in the year before school (Western Australia, South Australia, Victoria and Tasmania) have markedly lower participation rates in child care for children aged 0-4 years. TABLE 4.1: Participation of Children in Preschool Programs in the Year Before School and In Childcare (CCB Approved Services) by Age
PARTICIPATION
OF CHILDREN
in
NSW QLD VIC WA SA1 TAS ACT NT
% children enrolled in preschools
26.2 27.4 53.8 78.3 56.3 79.5 43.0 65.1
% children enrolled in LDC preschool programs
54.7 63.1 37.3 1.9 20.6 3.6 41.8 11.5
% children aged 0-3 in child care
44.2 46.7 40.8 33.6 38.9 41.9 53.7 28.2
% children aged 4-5 in child care
51.2 49.8 42.4 30.0 42.5 42.0 54.9 27.5=4
(Prod. Comm (2018) “Report on Government Services” Table 3A.18, 3A.2, 3A.15, preschool data reported as 2016, child care includes long day care and family day care; 1SA provides funding for preschool programs in long day care services as well as funding government preschools)
While State Government preschool policies clearly have a significant impact on child care participation rates, they do not explain fully the wide variation in child care participation rates between states. This suggests that parental preferences and attitudes to formal care may also vary markedly between states.

25 | P a g e
4.2 POPULATION & HOUSEHOLD GROWTH The following TABLE 4.2 summarises the 2017 estimated number of children aged 0-4 years by State relative to the number of places, together with the projected growth in children aged 0-4 years. Very modest growth in the number of children aged 0-4 years in South Australia in particular is projected over this period, suggesting limited growth opportunities based on sheer number of children from which low occupancy rates in South Australia can be improved.
TABLE 4.2: Children 0-4 years 2017 and 2021
State Places 2017 0-4 children
Children per Place
2021 0-4 children
2026 0-4 children
NSW 164,578 508,752 3.09 535,070 570,350
VIC 127,844 392,237 3.07 423,490 452,173
QLD 125,254 323,305 2.58 337,960 353,356
WA 38,793 177,558 4.57 205,460 214,090
SA 28,280 105,377 3.73 106,060 104,847 Source: Urban Economics, ABS, Various State Projections
There is significant variation in the ratio of children to ECEC places by region as illustrated in the following FIGURE 4.2 which illustrates the ratio or balance by Local Government Area (LGA). FIGURE 4.2: Children to Places by LGA

26 | P a g e
The darker red and orange colours represent a higher ratio of children to places with the pale-yellow colours representing a lower ratio and higher representation of the number of places to children. For instance, LGAs such as the Adelaide LGA which effectively represents the Adelaide CBD, demonstrated one of the lowest relative ratios of children to places (0.6), which reflects the employment nature of the CBD and the prevalence of ECEC places within employment precincts. The lowest ratio was demonstrated in Burke LGA, which effectively operates as a regional service centre and Fly in Fly Out (FIFO) centre for the surrounding regional and resource communities. At the other end of the spectrum the highest relative ratio of children to places was demonstrated in Gulf Country areas (25.6), which exhibit high incidences of young children and limited long day care places, with other forms of care and informal care catering to young children in these areas. TABLES 4.3 to 4.12 illustrate the LGA’s with the lowest and highest relative ratio of children to places, with individual State maps included in the APPENDIX.
TABLE 4.3: NSW LGA’S with Low Relative Ratio of Children to Places LGA 0-4 Approved Places Ratio
Sydney (C) 8,202 5,644 1.5
North Sydney (A) 4,112 2,298 1.8
Ryde (C) 7,761 3,832 2.0
• The Sydney, North Sydney and City of Ryde LGA’s have a low ratio of children to places
indicative of employment nodes with a low incidence of children aged 0-4 and a
heightened supply of centres.
TABLE 4.4: VIC LGA’S with Low Relative Ratio of Children to Places
LGA 0-4 Approved Places Balance
Melbourne (C) 5,190 4,126 1.3
Towong (S) 317 171 1.9
Nillumbik (S) 3,595 1,930 1.9
Alpine (S) 553 274 2.0
Glen Eira (C) 9,489 4,654 2.0
Wodonga (C) 2,986 1,296 2.3
• Melbourne, Glen Eira, Wodonga and Nillumbik have a low ratio of Children to places;
indicative of LGA’s with heightened supply of ECEC centres and in the case of the
Melbourne City, reflect proximity of major employment opportunities and inclusion
of ECEC places that particularly cater to the children of CBD workers.

27 | P a g e
TABLE 4.5: QLD LGA’S with Low Relative Ratio of Children to Places
LGA 0-4 Approved Places Balance
Burke (S) 18 86 0.2
Cook (S) 252 149 1.7
Winton (S) 72 41 1.8
Blackall-Tambo (R) 128 65 2.0
Gold Coast (C) 35,918 18,127 2.0
• With the exception of the large the Gold Coast LGA, all other LGA listed above reflect
LGA’s in regional and remote communities with a low incidence of 0-4’s and sufficient
network of ECEC centres.
TABLE 4.6: WA LGA’S with Low Relative Ratio of Children to Places
LGA 0-4 Approved Places Balance
Perth (C) 926 834 1.1
Nedlands (C) 1121 995 1.1
Leonora (S) 124 61 2.0
Perenjori (S) 40 19 2.1
Cambridge (T) 1609 616 2.6
• Both Perth and Nedlands are inner Metropolitan LGAs, supporting a limited number
of children but a large and increasing number of places particularly catering to children
of workers.
TABLE 4.7: SA LGA’S with Low Relative Ratio of Children to Places
LGA 0-4 Approved
Places Balance
Adelaide (C) 562 944 0.6
Norwood Payneham St Peters (C) 1744 1365 1.3
Prospect (C) 1278 681 1.9
Walkerville (M) 330 150 2.2
Clare and Gilbert Valleys (DC) 480 208 2.3
• These LGA’s have a low ratio of children to places; indicative of LGA’s with heightened
supply of ECEC centres and in the case of the Adelaide City, reflect proximity of major
employment opportunities and inclusion of ECEC places that particularly cater to the
children of CBD workers.
28 | P a g e
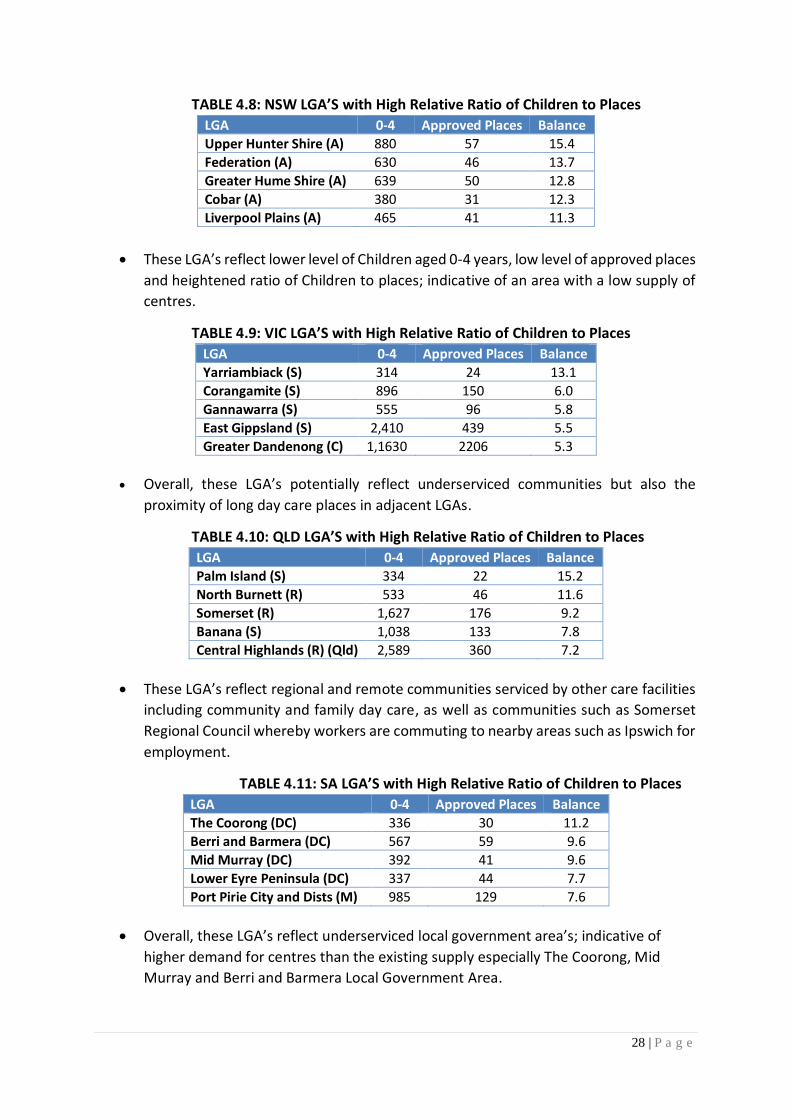
TABLE 4.8: NSW LGA’S with High Relative Ratio of Children to Places
LGA 0-4 Approved Places Balance
Upper Hunter Shire (A) 880 57 15.4
Federation (A) 630 46 13.7
Greater Hume Shire (A) 639 50 12.8
Cobar (A) 380 31 12.3
Liverpool Plains (A) 465 41 11.3
• These LGA’s reflect lower level of Children aged 0-4 years, low level of approved places
and heightened ratio of Children to places; indicative of an area with a low supply of
centres.
TABLE 4.9: VIC LGA’S with High Relative Ratio of Children to Places
LGA 0-4 Approved Places Balance
Yarriambiack (S) 314 24 13.1
Corangamite (S) 896 150 6.0
Gannawarra (S) 555 96 5.8
East Gippsland (S) 2,410 439 5.5
Greater Dandenong (C) 1,1630 2206 5.3
• Overall, these LGA’s potentially reflect underserviced communities but also the
proximity of long day care places in adjacent LGAs.
TABLE 4.10: QLD LGA’S with High Relative Ratio of Children to Places
LGA 0-4 Approved Places Balance
Palm Island (S) 334 22 15.2
North Burnett (R) 533 46 11.6
Somerset (R) 1,627 176 9.2
Banana (S) 1,038 133 7.8
Central Highlands (R) (Qld) 2,589 360 7.2
• These LGA’s reflect regional and remote communities serviced by other care facilities
including community and family day care, as well as communities such as Somerset
Regional Council whereby workers are commuting to nearby areas such as Ipswich for
employment.
TABLE 4.11: SA LGA’S with High Relative Ratio of Children to Places
LGA 0-4 Approved Places Balance
The Coorong (DC) 336 30 11.2
Berri and Barmera (DC) 567 59 9.6
Mid Murray (DC) 392 41 9.6
Lower Eyre Peninsula (DC) 337 44 7.7
Port Pirie City and Dists (M) 985 129 7.6
• Overall, these LGA’s reflect underserviced local government area’s; indicative of
higher demand for centres than the existing supply especially The Coorong, Mid
Murray and Berri and Barmera Local Government Area.
29 | P a g e
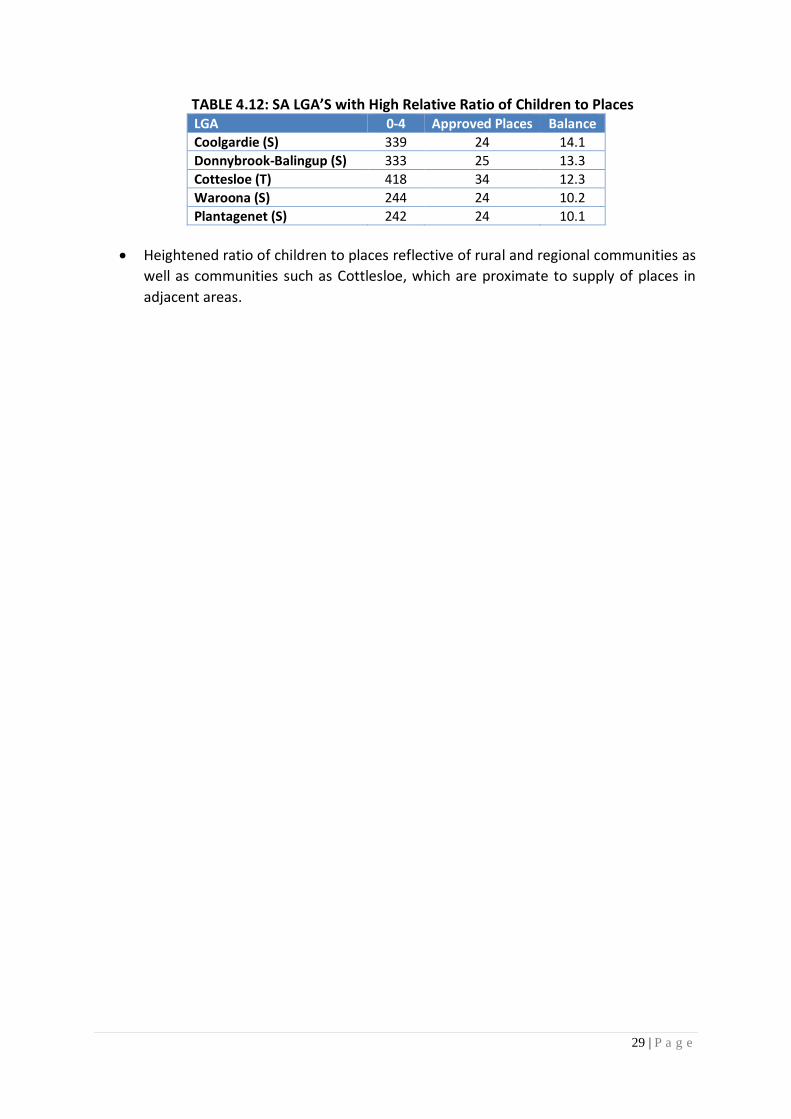
TABLE 4.12: SA LGA’S with High Relative Ratio of Children to Places LGA 0-4 Approved Places Balance
Coolgardie (S) 339 24 14.1
Donnybrook-Balingup (S) 333 25 13.3
Cottesloe (T) 418 34 12.3
Waroona (S) 244 24 10.2
Plantagenet (S) 242 24 10.1
• Heightened ratio of children to places reflective of rural and regional communities as
well as communities such as Cottlesloe, which are proximate to supply of places in
adjacent areas.
30 | P a g e
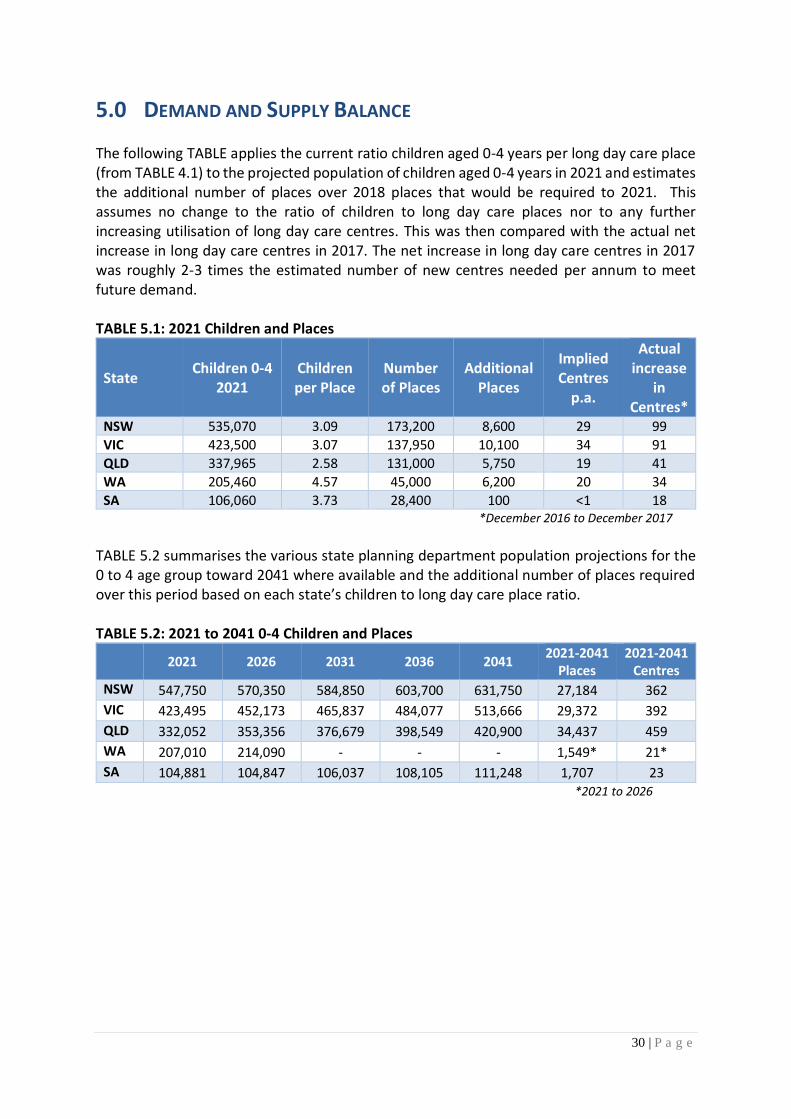
5.0 DEMAND AND SUPPLY BALANCE The following TABLE applies the current ratio children aged 0-4 years per long day care place (from TABLE 4.1) to the projected population of children aged 0-4 years in 2021 and estimates the additional number of places over 2018 places that would be required to 2021. This assumes no change to the ratio of children to long day care places nor to any further increasing utilisation of long day care centres. This was then compared with the actual net increase in long day care centres in 2017. The net increase in long day care centres in 2017 was roughly 2-3 times the estimated number of new centres needed per annum to meet future demand. TABLE 5.1: 2021 Children and Places
State Children 0-4
2021 Children per Place
Number of Places
Additional Places
Implied Centres
p.a.
Actual increase
in Centres*
NSW 535,070 3.09 173,200 8,600 29 99
VIC 423,500 3.07 137,950 10,100 34 91
QLD 337,965 2.58 131,000 5,750 19 41
WA 205,460 4.57 45,000 6,200 20 34
SA 106,060 3.73 28,400 100 <1 18 *December 2016 to December 2017
TABLE 5.2 summarises the various state planning department population projections for the 0 to 4 age group toward 2041 where available and the additional number of places required over this period based on each state’s children to long day care place ratio. TABLE 5.2: 2021 to 2041 0-4 Children and Places
2021 2026 2031 2036 2041 2021-2041
Places 2021-2041
Centres
NSW 547,750 570,350 584,850 603,700 631,750 27,184 362
VIC 423,495 452,173 465,837 484,077 513,666 29,372 392
QLD 332,052 353,356 376,679 398,549 420,900 34,437 459
WA 207,010 214,090 - - - 1,549* 21*
SA 104,881 104,847 106,037 108,105 111,248 1,707 23 *2021 to 2026

31 | P a g e
6.0 OTHER FACTORS INFLUENCING THE SECTOR Respondents to the survey were also asked to comment on any other factors that they consider are influencing the performance of their centre and the ECEC sector generally, including opportunities and constraints. There were essentially four main themes that respondents identified as issues, constraints or opportunities facing their centre or the industry generally:
1. The supply of places and in particular noting an oversupply of centres or concerns about construction of new, modern and large centres
2. Staffing issues including availability of staff, cost of staff and availability of quality, trained staff
3. Regulatory and funding issues 4. General cost of living issues influencing family capacity to afford and access ECEC.
(Multiple responses were allowed). In terms of opportunities or prospects facing the ECEC sector:
• 12% of those who responded to this question, identified an oversupply of new centres or that there were too many centres being built generally.
• A further 13% identified staffing issues as critical.
• Education was an important opportunity identified by respondents, including the education and training of staff but importantly the significance of ECEC centres as the first and critical step in educational pathways.
A key opportunity identified by respondents for the sector was the need to improve the perceptions of the sector overall, “to be taken seriously” and to be perceived as “professionals” educating the public as to the role of the sector in influencing early childhood development. Respondents identified an opportunity to change from the perception of a “babysitting service” or child minding, to an early learning or early childhood education and care service. This reflects the importance of early developmental years, the transition from early development to school and of educational pathways. Ongoing education and training of staff as professionals was also identified as synonymous with this movement to early childhood education and care services.
32 | P a g e
With particular regard to the factors or issues facing individual centres or operations:
• 22% of those who responded to the question, indicated some level of concern about the opening of centres in their local area or about the new supply of centres generally;
• 11% of respondents indicated some level of concern with regulations, funding and administration or operations influencing their centre;
• Others identified that their centre design, presentation, age and the places that they are able to offer were limiting them or at issue, particularly in light of the opening of new “shiny” centres.

33 | P a g e
7.0 OCCUPANCY RATES AND CENTRE VIABILITY
This Section critiques the potential impact of ECEC centre supply in relation to occupancy rates, and the ongoing viability of centres. In a typical market scenario, the price of a service such as ECEC would respond to both the level of demand and supply and specifically, price would be expected to decrease with additional supply. ECEC in Australia however, is subsidised and includes a high level of fixed costs (predominantly wages) as outlined in TABLE 7.1 and 7.2. As such, prices are relatively inelastic, and typically do not decrease significantly with increased supply and competition; dispelling the theory that increased supply will increase affordability for families. In fact, it is a more tenable proposition that a centre which is substantially underperforming due to an oversupply situation may increase charges to cover costs, reduce the rooms available, reduce staffing or potentially cease operation; removing choice and accessibility for the communities in which they locate. The following TABLES compare performance benchmark data between 2014/15 and 2015/16 based on information from the Australian Taxation Office (ATO), highlighting the continued significance of labour costs as a component of centre performance. TABLE 7.1: Performance Benchmarks - ECEC Services – 2014/15
Key benchmark range
Annual turnover range
$65,000 – $200,000
$200,001 – $600,000
More than $600,000
Total expenses/turnover 52% – 63% 72% – 86% 78% – 87%
Average total expenses 58% 79% 83%
Benchmark Range $65,000 – $200,000
$200,001 – $600,000
More than $600,000
Labour/turnover 23% – 45% 38% – 51% 44% – 52%
Rent/turnover 9% – 14% 7% – 12% 7% – 11%
Motor vehicle expenses/turnover 5% – 7% 1% – 3% 1%
Source: ATO
TABLE 7.2: Performance Benchmarks - ECEC Services – 2015/16
Key benchmark range
Annual turnover range
$65,000 – $200,000
$200,001 – $600,000
More than $600,000
Total expenses/turnover 51% – 64% 71% – 85% 79% – 88%
Average total expenses 58% 78% 84%
Benchmark Range $65,000 – $200,000
$200,001 – $600,000
More than $600,000
Labour/turnover 21% – 37% 37% – 51% 44% – 53%
Rent/turnover 9% – 13% 7% – 12% 7% – 11%
Motor vehicle expenses/turnover 4% – 6% 2% – 3% 1%
Source: ATO

34 | P a g e
• It is important to note that Federal changes to staffing ratios were implemented from the start of 2016. TABLE 7.2 demonstrates evidence of increasing employment expenses and costs, which are expected to become more apparent as full financial year data becomes available subsequent to these changes.
• 70% occupancy is the oft quoted break-even point for a ECEC centre (Ibisworld industry report) however; the Productivity Commission in its 2015 Review suggested that increased costs may now place this figure closer to 80%.
• Based on the results of the survey, for those centres reporting their estimated breakeven point, the modal response from all States with the exception of South Australia was the 60-70% bracket, whilst 50% of South Australian responding centres indicated a 70-80% bracket as their breakeven range. The following TABLE summarises the breakeven rates by State:
TABLE 7.3: Breakeven Rates
State <60% 60-70% 70-80% >80% NSW 33% 34% 11% 22%
VIC 37% 44% 11% 8%
QLD 8% 63% 17% 12%
WA 40% 31% 14% 15%
SA 18% 31% 42% 9%
• Centres in NSW were more likely to report higher breakeven rates in excess of 80%, indicative of operating costs including rents in inner Sydney areas.
• According to Goodstart Early Learning Annual Report (2017) a 0.9% increase in occupancy (year on year) was achieved, reversing a declining trend over the previous two years through organisational wide strategies to raise the quality of practice, contain costs, improve engagement with families and upgrade centres to compete.
• G8 Education reported declining utilisation rates from 70.1% in 2018, 72.6% in 2017, 80.85% in 2016 and 81.88% in 2015 across its portfolio; with significant increase in new centres through opening of new centres and acquisition by G8 Education across Australia during this period.
• Urban Economics’s Survey of ECEC centres nationally reported occupancy rates of 71% in South Australia and up to 81% for reporting centres across NSW.
• The following TABLE summarises occupancy rates by major region for NSW, Victoria and Queensland, with lower occupancy rates reported for centres in Queensland’s outer metropolitan areas, which are typically subject to greenfield and suburban growth suggesting new supply may be outstripping population growth in some of these areas. Significantly, occupancy rates of at least 30% in regional and remote centres and in the order of 46% in regional and remote reporting centres in NSW were evident:

35 | P a g e
TABLE 7.3: Occupancy Ranges by Location
State Occupancy Rates
Inner Metropolitan %
Outer Metropolitan %
Regional/Remote %
Qld <60% 9 22 22
Qld >90% 51 14 24
NSW <60% 23 12 16
NSW >90% 39 32 38
VIC <60% 10 17 19
VIC >90% 36 29 21
• A study of government involvement within the ECEC sector in the UK states that an 80% occupancy is the rate of viability for a ECEC centre (Penn, 2007).
• 76% occupancy rate reported by the respondents to the Queensland survey for 2017.

36 | P a g e
8.0 CONCLUDING COMMENTS Based on the findings and analyses of this Survey and Report, Urban Economics concludes that:
• There has generally been a decrease in occupancy rates, particularly in South Australia and Queensland, which is coincident with an increase in the opening of new centres.
• Higher breakeven rates are also evident in South Australia, with more than 50% of centres indicating that their breakeven rates are in excess of 70%, suggesting some higher cost rates associated with long day care operations.
• Breakeven rates of between 60-70% continued to be identified as the modal rate for centres in other states, with breakeven rates in excess of 90% typically located in inner Metropolitan locations indicative of higher occupancy costs within these locations. Nonetheless, 34% of NSW centres continued to identify breakeven rates in the 60-70% range.
• Regional centres in Victoria and Queensland and centres in outer Metropolitan Queensland centres are demonstrating the lowest occupancy rates, with in excess of 20% of reporting centres indicating occupancy rates of less than 60%. This is in part a reflection of the opening of new centres in Greenfield locations as communities establish in outer Metropolitan Queensland, and in part the provision of long day care centres almost as a service in regional towns.
• The ratio of children to places typically reflects occupancy rates; with areas having lower rates of children to places, characterised by areas with higher occupancy rates. Occupancy rates vary by geography and with regard to the availability of employment opportunities, with inner CBD areas and major employment nodes such as North Ryde typically demonstrating higher number of places relative to the children living within the CBD areas.
37 | P a g e
APPENDIX 1 – ECEC PROVISION BY LGA

38 | P a g e
FIGURE A.1 – NSW

39 | P a g e
FIGURE A.2 – VICTORIA

40 | P a g e
FIGURE A.3 – QLD

41 | P a g e
FIGURE A.4 – SA

42 | P a g e
FIGURE A.5 – WA

43 | P a g e
APPENDIX 2 – SURVEY QUESTIONNAIRE
Your centre matters - make it count!
Urban Economics has been commissioned to undertake independent research
exploring the supply of child care places and occupancy rates of child care
centres nationally.
In developing a clear and accurate picture of our industry, the opportunities
and constraints to growth of the sector, we are undertaking a quantitative
survey of members and child care operators. It would assist you in responding
to this survey to have access to your centre attendance figures
1. Centre Details - For classification purposes only (optional)
Centre Name
Address
Suburb/City
2. What group or organisation if any is your centre associated with?
Affinity
G8 Group
Goodstart
Church Run/Operated
Bright Horizons
C&K
Other Community Group
YMCA
Other Chain (specify)
Other
None/Independently Run
Other (please specify)

44 | P a g e
* 3. In which area is your centre located?
Queensland
New South Wales
Victoria
Western Australia
South Australia
Northern Territory
ACT
Tasmania
* 4. What postcode is your centre in?
5. Could you please indicate if your centre is located
Inner city metropolitan
Other metropolitan/suburban
Inner Regional centre
Outer Regional centre
Remote
6. Number of licensed places by age group
Birth to 2 years
2 to 3 years
3 years to School age
Total Licensed Capacity
When did this centre open?
Within the last 12 months
Within the last 1 to 2 years
Within the last 2 to 5 years
Within the last 5 to 10 years
More than 10 years ago

45 | P a g e
8. What do you currently charge per day? (For classification purposes only)
Birth to 2 years
2 to 3 years
3 years to School Age
9. For the week ending 25th May 2018, could you please indicate the number of children
attending your centre by age group.
Birth to 2 years
2 to 3 years
3 years to School Age
10. And for this same week ending 25th May 2018, could you please indicate the number
of children enrolled at your centre by age group.
Birth to 2 years
2 to 3 years
3 years to School Age
11. For this same week ending 25th May 2018, could you also indicate the number of
children attending your centre by day.
Monday
Tuesday
Wednesday
Thursday
Friday
12. Similarly, for the week ending 25th May 2018, could you also indicate the number of
children enrolled at your centre by day.
Monday
Tuesday
Wednesday
Thursday
Friday

46 | P a g e
13. We are also interested in looking at trends. For the same week 12 months ago (ie
ending Friday 26th May 2017) could you also indicate below the number of children
enrolled by age group if you have the data readily available?
Birth to 2 years
2 to 3 years
3 years to School Age
14. And again thinking 12 months ago, the number of children enrolled by day for that
same week ending Friday 26th May 2017.
Monday
Tuesday
Wednesday
Thursday
Friday
15. Do you currently have a waiting list for any of the following age groups?
Yes/No
Birth to 2 years
2 to 3 years
3 years to School Age
16. At which occupancy level is the breakeven point for your centre?
<50%
50-60%
60-70%
70-80%
80-90%
>90%
17. What do you consider are the key opportunities and prospects facing the child care
sector?

47 | P a g e
18. What factors or issues (if any) do you believe are influencing or constraining your
centre at this point in time?
19. Are there any other factors or issues that you would like to raise concerning the
operation of your centre or the industry as a whole?
This survey is being conducted under the auspices of the Privacy Act. All responses will
remain confidential and no individual responses will be identifiable.
If you have any questions about the survey, please do not hesitate to contact Kerrianne
Meulman, Managing Director of Urban Economics on (07) 3839 1400
or alternatively at [email protected]

48 | P a g e
REFERENCES
Affinity Education. (2015). 2015 Affinity Education Limited Interim Report. Retrieved from http://www.asx.com.au/asxpdf/20150818/pdf/430kxfq9vn577r.pdf Australian Child care Alliance New South Wales. (2017). Submission to NSW Planning. Draft Education Child care State Environmental Planning Policy (SEPP) Can Create More Child care Oversupply. Parramatta, NSW Burgess Rawson Child Care Property Report 2018 Colliers International (2016). Child Care Whitepaper Australia’s Burgeoning Real Estate Investment Class. Sydney, NSW. G8 Education Annual Report Goodstart Early Learning Annual Report Penn, H. (2007). Child care Market Management: how the United Kingdom Government has reshaped its role in developing early childhood education and care. Contemporary Issues in Early Childhood, 8(3), 192-207. doi: 10.2304/ciec.2007.8.3.192 Productivity Commission. (2015). Child care and Early Childhood Learning. Inquiry Report No. 73. Canberra, ACT.