Embed Size (px)
Citation preview

SINTEF Ocean AS Environmental Technology 2017-03-25
OC2017 A-090- Unrestricted
FINAL report
Subsurface oil releases – Verification of dispersant effectiveness under high pressure using combined releases of live oil and natural gas A scaled experimental approach using the SwRIs 90" high pressure chamber Authors Per Johan Brandvik, Emlyn Davies, Chris Storey (SwRI), Frode Leirvik and Dan Krause
The 90" hyperbaric chamber at SwRI before the lid is lowered and closed

SINTEF Ocean AS Environmental Technology 2017-03-25


PROJECT NO. 102007986
REPORT NO. OC2017 A-090
VERSION Final
2 of 56
Document history VERSION DATE
Final version 2017-03-25 Final version reflecting comments from API received January 2017.
Disclaimer: The statements, technical information, results, conclusions and recommendations contained herein are believed to be accurate as of the date hereof. Since any use of this information is beyond our control, SINTEF expressly disclaims all liability for any results obtained or arising from any use of this report or reliance on any information in this report.
Recommended reference: Per Johan Brandvik, Emlyn Davies, Chris Storey and Frode Leirvik. 2017: Subsurface oil releases – Verification of dispersant effectiveness under high pressure using combined releases oil live oil and natural gas. SINTEF report no: OC2017 A-090. Trondheim Norway 2017. ISBN: 978-82-7174-282-9.

PROJECT NO. 102007986
REPORT NO. OC2017 A-090
VERSION Final
3 of 56
Table of Contents
1 Introduction .................................................................................................................................. 5
2 Objectives ..................................................................................................................................... 6
3 Experimental ................................................................................................................................. 7 3.1 Selection of oil type ....................................................................................................................... 7 3.2 Selection of dispersants ................................................................................................................. 7 3.3 Dispersant injection ....................................................................................................................... 8 3.4 IFT analysis - Spinning drop method .............................................................................................. 8
3.4.1 Oil sampling for IFT measurements ................................................................................... 8 3.5 Experiments at ambient pressure – SINTEF Tower Basin .............................................................. 8
3.5.1 Combined releases of oil & natural gas ............................................................................. 9 3.6 Quantification of oil droplets and gas bubbles ............................................................................ 10 3.7 Predicting oil droplet sizes ........................................................................................................... 14
3.7.1 Gas density....................................................................................................................... 14 3.7.2 Viscosity of live oil ........................................................................................................... 14
3.8 Experimental work at SwRI .......................................................................................................... 15 3.9 Preparation of Live oil .................................................................................................................. 17
4 Results ........................................................................................................................................ 19 4.1 Overview of experiments ............................................................................................................. 19 4.2 Combined releases of oil and gas at varying GORs – SINTEF Tower Basin .................................. 24
4.2.1 Quantification of oil droplets and gas bubbles ................................................................ 24 4.2.2 Oil droplet and gas bubble size as a function of GORs .................................................... 25
4.3 Combined releases of live oil and natural gas at high pressure – SwRI ....................................... 27 4.3.1 Quantification of oil droplets and gas bubbles ................................................................ 28 4.3.2 Live oil and varying gas void fraction (0, 20, 50 & 80%) – SwRI ...................................... 28 4.3.3 Live oil and natural gas (50%) at varying pressure – SwRI/SINTEF .................................. 31
5 Discussion ................................................................................................................................... 34 5.1 Ambient conditions – SINTEF Tower Basin .................................................................................. 34
5.1.1 Documentation of the SilCam with combined releases .................................................. 34 5.1.2 Oil droplet sizes versus gas void fraction (0-90%) ........................................................... 34 5.1.3 Gas bubble sizes versus gas void fraction (0-90%) .......................................................... 34 5.1.4 Experiments using water as the liquid fraction ............................................................... 35 5.1.5 Closing remarks ............................................................................................................... 35
5.2 HP conditions - SwRI .................................................................................................................... 35 5.2.1 Documentation of the SilCam with combined releases .................................................. 35 5.2.2 Preparation of live oil ...................................................................................................... 35 5.2.3 Oil droplet sizes versus gas void fraction (0, 20, 50 and 80%) at constant pressure ...... 35

PROJECT NO. 102007986
REPORT NO. OC2017 A-090
VERSION Final
4 of 56
5.2.4 Gas bubble sizes versus gas void fraction (0, 20, 50 and 80%) at constant pressure...... 36 5.2.5 Live oil droplet sizes versus pressure (constant 50 % gas fraction)................................. 36 5.2.6 Gas bubble sizes versus pressure (constant 50 % gas fraction) ...................................... 37
5.3 Comparison of measured and predicted (modified Weber) oil droplet sizes ............................. 37
6 Conclusions ................................................................................................................................. 38
7 Recommendations ....................................................................................................................... 39
8 References .................................................................................................................................. 40
APPENDICES Appendix A: Experimental description of HP & Ambient work performed at SwRI. Appendix B: Experimental description of SINTEF Tower Basin.
PROJECT NO. 102007986
REPORT NO. OC2017 A-090
VERSION Final
5 of 56
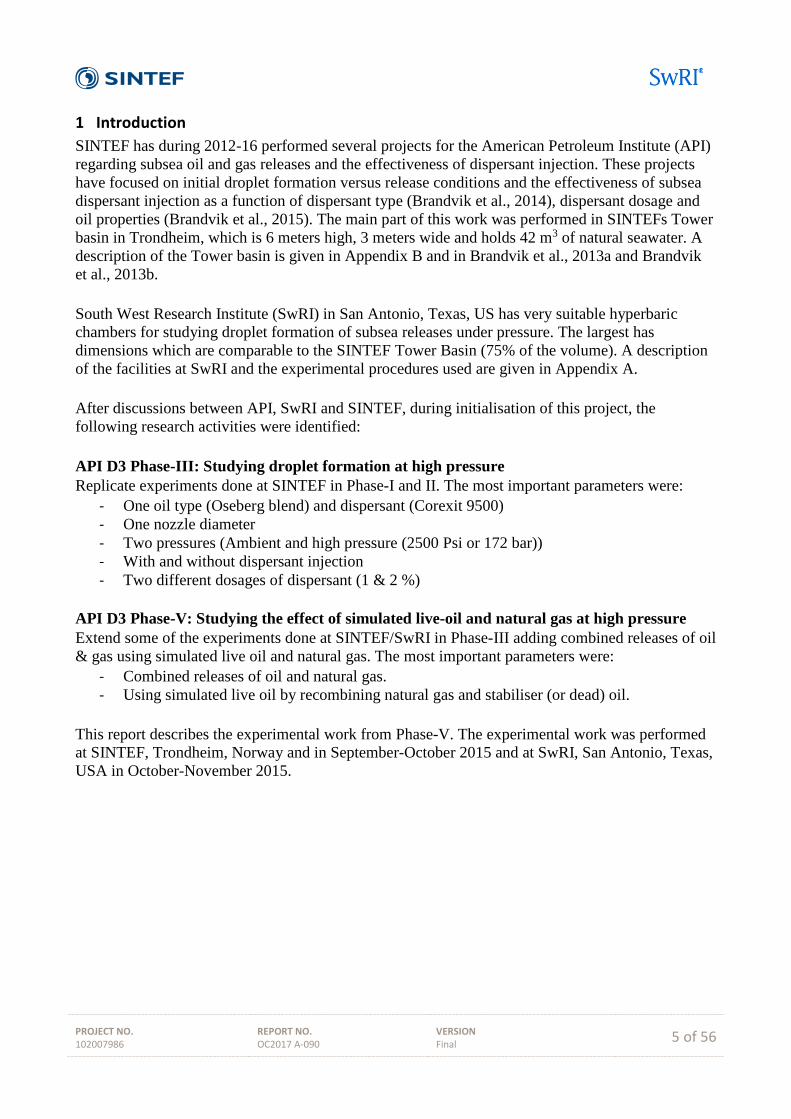
1 Introduction SINTEF has during 2012-16 performed several projects for the American Petroleum Institute (API) regarding subsea oil and gas releases and the effectiveness of dispersant injection. These projects have focused on initial droplet formation versus release conditions and the effectiveness of subsea dispersant injection as a function of dispersant type (Brandvik et al., 2014), dispersant dosage and oil properties (Brandvik et al., 2015). The main part of this work was performed in SINTEFs Tower basin in Trondheim, which is 6 meters high, 3 meters wide and holds 42 m3 of natural seawater. A description of the Tower basin is given in Appendix B and in Brandvik et al., 2013a and Brandvik et al., 2013b. South West Research Institute (SwRI) in San Antonio, Texas, US has very suitable hyperbaric chambers for studying droplet formation of subsea releases under pressure. The largest has dimensions which are comparable to the SINTEF Tower Basin (75% of the volume). A description of the facilities at SwRI and the experimental procedures used are given in Appendix A. After discussions between API, SwRI and SINTEF, during initialisation of this project, the following research activities were identified: API D3 Phase-III: Studying droplet formation at high pressure Replicate experiments done at SINTEF in Phase-I and II. The most important parameters were:
- One oil type (Oseberg blend) and dispersant (Corexit 9500) - One nozzle diameter - Two pressures (Ambient and high pressure (2500 Psi or 172 bar)) - With and without dispersant injection - Two different dosages of dispersant (1 & 2 %)
API D3 Phase-V: Studying the effect of simulated live-oil and natural gas at high pressure Extend some of the experiments done at SINTEF/SwRI in Phase-III adding combined releases of oil & gas using simulated live oil and natural gas. The most important parameters were:
- Combined releases of oil and natural gas. - Using simulated live oil by recombining natural gas and stabiliser (or dead) oil.
This report describes the experimental work from Phase-V. The experimental work was performed at SINTEF, Trondheim, Norway and in September-October 2015 and at SwRI, San Antonio, Texas, USA in October-November 2015.

PROJECT NO. 102007986
REPORT NO. OC2017 A-090
VERSION Final
6 of 56
2 Objectives Perform experiments in the Tower basin at SINTEF and at the 90" hyperbaric chamber at SwRI to study the influence of combined releases of oil and natural gas with special focus on; At ambient pressure (SINTEF Tower Basin):
- Testing & verifying of new instrumentation (Silhouette camera and image analysis) for discriminating between oil & gas in mixed releases (both air and natural gas).
- Dispersant effectiveness with mixed releases of oil & gas - Varying gas to oil ration (GOR) - Bubble formation of natural gas with dispersants injection - Surfactant scavenging from natural gas
At deep water pressure (SwRI hyperbaric chamber): - Oil droplet and gas bubble formation with mixed releases - Possible gas hydrate formation with mixed releases - Oil droplet and gas bubble formation for mixed releases with dispersant injection - Varying gas to oil ratio (GOR) - Varying Oil temperature - Varying hydrostatic pressure

PROJECT NO. 102007986
REPORT NO. OC2017 A-090
VERSION Final
7 of 56
3 Experimental The experimental part of this project has been performed both at SINTEF, Trondheim, Norway and at SwRI, San Antonio, Texas, USA. The work at SINTEF focused on testing the oil release and dispersant injection system and the new Silhouette camera for droplets & gas bubble quantification. Also part of the work was development and testing of image analysis algorithms for the silhouette camera to identify particles as "droplets" or "bubbles" and constructing individual volume size distributions. The Silhouette camera with the new algorithm is used in real time during the experiments offering a unique possibility to monitor and make adjustments during the oil &gas releases (see Figure 3.1). Data describing droplet & bubble sizes were generated for combined releases of oil and gas (air & natural gas) for two different nozzle sizes 1.5 and 3 mm and for varying gas ratios (10 – 90 vol.% or GOR: 0.1 – 9). This work was performed in the SINTEF Tower basin (see Appendix B). The high pressure (HP) testing at SwRI simulates deep water conditions down to 1720 meters depth or 2500 psi/172 bars. It was conducted in a 90-inch (2.29 meter) inside diameter by 230-inch (5.84 meter) deep pressure chamber at SwRI. This chamber is rated for 4000 psi (275 bar) and can be cooled to maintain an inside water temperature of approximately 40 degrees Fahrenheit (4 degrees Celsius). A description of the SwRI 90" hyperbaric chamber modified for these experiments (oil release, salt water mixing, dispersant injection and droplet monitoring) is given in Appendix A, and a similar description of the SINTEF Tower Basin in Appendix B.
3.1 Selection of oil type To replicate the work previously performed in SINTEF Tower Basin in API D3 JITS Phase I and II the same oil was used during the work at SwRI (Oseberg blend). The oil was delivered to SINTEF from the oil terminal at Sture, outside Bergen and shipped to San Antonio. Table 3.1: Properties of Oseberg blend.
Oseberg blend 2015 (2015-0014)
Density (kg/l) 0.826 Pour Point (°C) -36 Viscosity (mPas at 40°C) 2.7 Asphaltene (wt%) 0.2 Waxes (wt%) 2.3 150°C – Evaporative loss (vol%) 22 200°C – Evaporative loss (vol%) 34 250°C – Evaporative loss (vol%) 45
3.2 Selection of dispersants Corexit 9500 was selected for this study since it has been the main dispersant in earlier API studies at SINTEF (Brandvik et al., 2014 and Brandvik et al., 2015). The dispersant was delivered directly from Nalco to SwRI in 2014 and used as received.

PROJECT NO. 102007986
REPORT NO. OC2017 A-090
VERSION Final
8 of 56
3.3 Dispersant injection One dispersant injection technique was selected for this project, Simulated insertion tool (SIT). The release and injection arrangements were similar to what have been used at SINTEF for earlier API studies. With simulated injection tool (SIT) dispersant was injected 6 release diameters (3 x 6 = 18 mm) before the oil release opening. This distance has proved very efficient in earlier studies (Brandvik et al., 2014) and is a very operationally relevant technique (feasible in a real-world blow-out.).
3.4 IFT analysis - Spinning drop method For the interfacial tension measurements (IFT) by spinning drop method (Khelifa and So, 2009), the Dataphysics Spinning Drop Tensiometer SVT-20N with control and calculation software SVTS 20 IFT was used. The Julabo F12-ED Refrigerated and Heating Circulator were used for temperature control. Disposable 1ml plastic syringes were used to inject the oil sample into the SVT 20N capillary tube. Prior to each measurement, the capillary tube was rinsed three times with dichloromethane (DCM), acetone and deionized water, dried with nitrogen gas, and then rinsed three times with the sea-water. The capillary was carefully filled with sea-water (outer phase liquid) to ensure the absence of air bubbles. Depending on the oil sample, the capillary may be stationary or rotating when the drop of oil is injected and the rotation speed may also vary. Measurements of IFT were taken as soon as the drop elongation was stable.
3.4.1 Oil sampling for IFT measurements During different injection sequences of dispersants into the oil, oil/water samples were taken from 0.8 meters above the nozzle after 60 seconds of each dispersant injection. Oil/water samples were collected in 1 litre long necked measuring flasks. Upon collection, oil appeared as droplets in seawater, with droplet sizes dependant on DOR. Oil settled as a layer in the narrow neck of the bottle and was collected for IFT measurements after 24 hours. The settling time was important for collecting the smaller droplets in experiments with high dispersant effectiveness. The collected oil samples were stored in a dry and cool place overnight. No homogenization or heating was done before the IFT measurements. All IFTs were measured at 13°C. During the high pressure experiments the oil-water sample had to be depressurized (from 172 bar to ambient). The mixing of oil and water during this pressure drop produced in some cases very stable water-in-oil emulsions which complicated the IFT measurements. Some of these IFT results might for this reason be slightly higher than expected (see footnote in Table 4.3).
3.5 Experiments at ambient pressure – SINTEF Tower Basin This sections presents the experimental procedures, equipment and experimental matrix used for the work performed at SINTEF. Selected results are shown to visualize the instrumentation and how the experiments were performed. A full presentation of the results is given in the next section. SINTEF has earlier performed two projects for API focusing on injection techniques (API D3 Phase-I and Phase-II), dispersant dosages, effectiveness of different dispersant products, oil temperature and combined releases of oil and gas (air used as a proxy for natural gas). All these experiments were performed at SINTEFs Tower basin under a hydrostatic pressure of 6 meter water height (1.6 bar). The SINTEF Tower basin has no capability to be pressurised further. In this new study (API D3 Phase-V) a series of mixed releases of oil and gas were performed to:

PROJECT NO. 102007986
REPORT NO. OC2017 A-090
VERSION Final
9 of 56
1. Test new instrumentation (colour & High Pressure SilCam) and new software to determine if this new system could discriminate between oil droplets and gas bubbles,
2. Study the influence of dispersant injection on bubble sizes of natural gas, and 3. Study possible surfactant scavenging by natural gas in combined releases with dispersant
injection.
An overview of the experiments at SINTEF is given in Table 3.2. The experiments were performed in September - October 2015 and the actual conditions measured during the experiments are presented in Table 4.1 in the Results section. Initial experiments (1-8) were performed with a smaller nozzle (1.5 mm). These experiments produced droplets which were slightly too small (50-300 microns) for testing of the new algorithms to distinguish between oil droplets and gas bubbles. Larger droplets made by a 3 mm nozzle, made it easier to quantify a different "signature" for the oil droplets and gas bubbles, due to a larger number of pixels across each particle. Having larger droplets also permitted longer experimental time at both the Tower basin and at SwRI, due to reduced amount of small droplets (< 30 µm), which quickly make the water cloudy, due to their low rise velocity. Table 3.2: Experimental matrix for work at SINTEF Tower Basin1. All experiments were
performed with Oseberg blend. The actual conditions measured during the experiments are presented in Table 4.1 in the Results section.
Experi- ment#
Nozzle (mm)
Ambient Pressure
Natural gas or air (0-90%)
Oil or water
(1.5 L/min)
C9500 (1:100)
1-8 1.5 X 9 3 X Air oil 10 3 X Air oil X 11 3 X LNG oil 12 3 X LNG oil X 13 3 X Air water 14 3 X Air water X 15 3 X LNG water 16 3 X LNG water X
1) SINTEFs Tower Basin (3 meter inside diameter, 6 meter high, holding 42 000 Litres of natural sea water) located in Trondheim, Norway. Further details are presented in Appendix B and Brandvik et al., 2013.
3.5.1 Combined releases of oil & natural gas The SINTEF Tower basin was modified to do experiments with natural gas instead of air. The main HSE strategy was to dilute and vent the natural gases and keep the atmosphere in the ventilation hood over the Tower basin below any explosion hazard at all times. Several modifications were needed to make experiments with natural gas possible (Explosion proof ventilation fan, new flow regulators, Lower Explosion Level (LEL) meters etc.). These experiments were initially performed under similar conditions as earlier studies (API D3 Phase-I and II), but the nozzle size was increased to 3 mm and flow rate was set to 1.5 l/min to create larger droplets (d50: 1200 µm).

PROJECT NO. 102007986
REPORT NO. OC2017 A-090
VERSION Final
10 of 56
The oil release was kept constant (3 mm nozzle, 1.5 L/min oil flow rate) while the volume rate of additional gas (air or natural gas) was increased so void fraction of the gas (in the total release) was increased from 0% to 90% in 10% increments (90 seconds at each setting). This corresponds to a gas to oil ratio (GOR) of 0 to 9. All gas volumes and GORs are specified at the nozzle, which means that they are corrected for the hydrostatic pressure in the Tower Basin (5 meters water depth). During a 15 minute experiment (one oil and gas type, with or without dispersant) the image data from one SilCam would usually fill up a 100 Gb hard disk with a sampling rate of 15 frames per second (fps).
3.6 Quantification of oil droplets and gas bubbles Both oil droplet and gas bubble distributions were quantified using the SINTEF Silhouette Camera (SilCam). Quantification of bubble sizes was used to calculate actual gas void fractions and to study the gas droplet sizes versus flow rates, pressure and dispersant injection. The SilCam is discussed in several earlier SINTEF API-reports (for example Brandvik et al., 2017b) and with more details in Davies et al., 2017. The method used for differentiating between oil and gas is based on unique signatures of the transmitted light through each droplet recorded by the SilCam. In short, each particle in every image (obtained at 15 Hz) is identified as either oil or gas and then counted into log-spaced volume classes to match that of the LISST-100 and LISST-Holo instruments. However, with the SilCam, the maximum size is extended up to 12 mm, see Davies et al., 2017 for further details. Each volume size class is 1.18 times larger than the previous size class, and the same classes were used for both the SilCam and the LISST-100 up to the maximum size class for the LISST. The results of this are two time-series of separated oil volume distributions and gas bubble distributions. Segments of this time-series are then extracted at the time periods of the experiment to relate to the release conditions of interest. Integration of the separated oil and gas bubble size distributions therefore provides a measure of oil-to-gas ratio. The path length used was set to 8 mm to enable total light transmissions through each image to remain above 70%, and hence allow for sufficient average separation between particles to allow accurate identification, in addition to the geometrical filtering in post-processing (described by Davies et al., 2017). The magnification of the SilCam system, used in this study, enabled the minimum resolvable diameter (Dmin) to extend down to 54 microns, as per the following relation to pixel size (Ps):
𝐷𝐷𝑚𝑚𝑚𝑚𝑚𝑚 = 2�12𝑃𝑃𝑠𝑠2
𝜋𝜋
Custom made software was both used to analyse and display the SilCam data in real-time during the experiment (reduced resolution, usually 2-5 fps) and to analyse the full dataset afterwards (15 fps) as shown in Figure 3.1. An example of individual volume distributions of oil droplets and gas bubbles calculated from the SilCam images are presented in Figure 3.2. A comparison of the calculated gas void fraction (SilCam data) and the actual released (based on flow regulator readings) for one experiment (experiment 14) is shown in Figure 3.3 and serves as a kind of globalized validation of the SilCam methodology. The two figures presenting SilCam data (Figure 3.2 and Figure 3.3) are included here in the experimental section as illustrations or examples of the type of data generated. This initial data was also used to optimise and verify the performance of the SilCam and its ability to discriminate

PROJECT NO. 102007986
REPORT NO. OC2017 A-090
VERSION Final
11 of 56
between oil droplets and gas bubbles. For SINTEF, it was also important to show that the GORs calculated from the SilCam data gave a high correlation with the set gas values (r2 = 0.93, see Figure 3.3). This correlation (r2) is a linear correlations between d50 (y) and set gas fractions (x), not between the best-fit line and the measurements. The full dataset containing oil droplets and gas bubble data from experiments with two different fluids (oil & water), two gasses (0 – 90% air and natural gas) and with dispersant injection (1% C9500) are presented in the Result section.
PROJECT NO. 102007986
REPORT NO. OC2017 A-090
VERSION Final
12 of 56
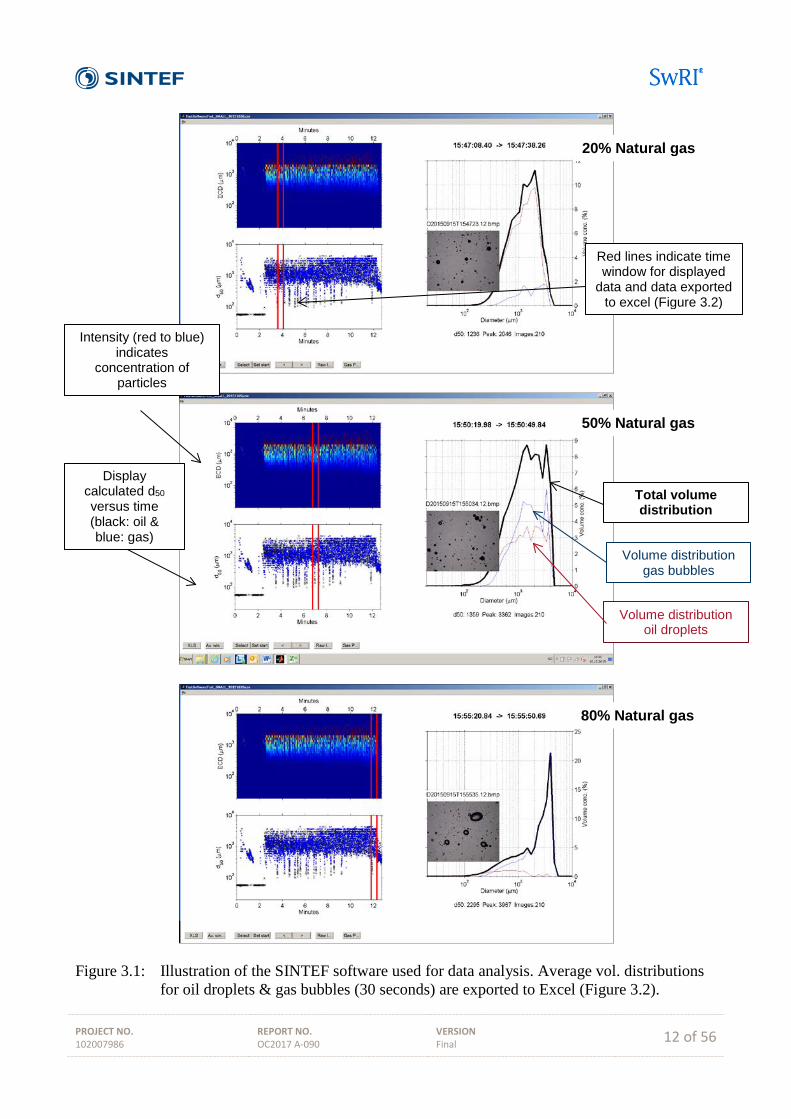
Figure 3.1: Illustration of the SINTEF software used for data analysis. Average vol. distributions for oil droplets & gas bubbles (30 seconds) are exported to Excel (Figure 3.2).
20% Natural gas
50% Natural gas
80% Natural gas
Volume distribution oil droplets
Volume distribution gas bubbles
Total volume distribution
Intensity (red to blue) indicates
concentration of particles
Display calculated d50 versus time (black: oil & blue: gas)
Red lines indicate time window for displayed
data and data exported to excel (Figure 3.2)

PROJECT NO. 102007986
REPORT NO. OC2017 A-090
VERSION Final
13 of 56
Figure 3.2: Example of SilCam data from one GOR: Relative volume distribution for oil droplets
and gas bubbles. The distributions are based on 33 500 identified particles (both droplets & bubbles) from 421 images (15 fps in 30 seconds). Release condition: 3 mm nozzle, oil flow rate 1.5 L/min, Gas flow rate: 0.6 L/min (30 vol. %) with Oseberg.
Figure 3.3: Quantified natural gas (volume %), from a series of combined releases with oil, versus set void fraction released. The individual experiment presented in Figure 3.2 (30%) is marked with a red circle. Solid line represent best-fit, dotted line represent 1:1.
0
1
2
3
4
5
6
7
Rela
tive
drop
let s
ize d
istr
ibut
ion
(Vol
. %)
Droplet size (microns)
Crude oil (70 %)Natural gas (30 %)
Oil (d50) = 1093 µm
Gas (d50) = 1509 µm
Oil: 71 %
Gas: 29 %
R² = 0,95
0
10
20
30
40
50
60
70
80
90
100
0 10 20 30 40 50 60 70 80 90 100
Qua
ntifi
ed g
as v
oid
frac
tion
(Vol
%)
Set gas void fraction (Vol%)

PROJECT NO. 102007986
REPORT NO. OC2017 A-090
VERSION Final
14 of 56
3.7 Predicting oil droplet sizes The main objective for this experimental work is to establish a data set of oil droplet and gas bubble sizes for verification or calibration of algorithms used in models to describe subsea blowouts. We have used the modified Weber number algorithm (Johansen et al., 2013) which needs both natural gas density and live oil viscosity as a function of pressure. The approach to calculate these parameters are described below.
3.7.1 Gas density The density of natural gases is known to deviate significantly from the density predicted by the ideal gas law in deep water. To account for this, a compressibility factor z is introduced in the gas law: P V = z R T (1) where P (N/m2 or Pa) is the pressure, V (m3/kmol) is the molar volume, R = 8316 J/K kmol is the universal gas constant, and T (K) is the temperature. The density of the gas at a given pressure and temperature is given as ρg = M/V (kg/m3), where M (kg/kmol) is the molar weight of the gas. We will assume that the natural gas used in these experiments may be represented by Methane with a molar weight of M = 16. The z-factor depends in a complex way on pressure and temperature and the type of gas. In order to account for this various Equations of State (EOS) have been developed. One that is used widely in petroleum engineering is the Peng-Robinson EOS: [P+ aT/(V(V+b)+b(V-b) )](V-b)=R T (2) where the coefficients aT and b are functions of the critical pressure and temperature of the gas. For Methane with PC = 4.6 MPa and TC = 191 K, b = 0.027, while aT varies slightly with temperature from 2.13×10⁵ at 0°C to 1.945×10⁵ at 50 °C. More details regarding this topic, including graphs of z values as a function of depth and oil temperature, are available in Johansen et al., 2016.
3.7.2 Viscosity of live oil "Live oil" contains, by definition, a certain fraction of dissolved gas. In petroleum engineering textbooks, the amount of gas dissolved in the oil when oil and gas is at equilibrium (i.e. at the bubble-point pressure) is represented by the solution gas-oil ratio. McCain (1990) presents an empirical equation for the bubble-point pressure PB (PSI) corresponding to a given solution gas-oil ratio RS (scft/STB): PB=18.2 (CB - 1.4), (4) where CB=(RS/γg )^0.83 〖10〗^((0.00091 t_R - 0.0125 API) ). Here, γg is the specific gravity of the gas at standard conditions, API is the API gravity of the “dead” oil, and tR is the reservoir temperature in °F. With given gas and oil properties, the corresponding solution gas-oil ratio RS equation can be found from the same equation for a given

PROJECT NO. 102007986
REPORT NO. OC2017 A-090
VERSION Final
15 of 56
pressure and temperature. The viscosity of live oil μ is known to depend on the viscosity of the “dead” oil μD and the solution gas-oil ratio. McCain (op. cit.) presents the following empirical equation: μ=A_RS 〖〖 μ〗_D〗^(B_RS ), (5) where A_RS=10.715 (R_S+100)^(-0.515) and B_RS=5.44 (R_S+150)^(-0.338). Note that in this equation, the viscosity of live oil refers to pressure PB and temperature TR, while the viscosity of the “dead” oil refers to the same temperature, but atmospheric pressure. For Oseberg Blend, the viscosity of stabilized (“dead”) oil is reported to be 2.7 cP at 40°C. For other temperatures, a temperature adjustment has to be made. In the present study, the ASTM formula (ASTM D341) has been used: log[log(ν+0.7)]=A-B "log" (T), (6) where log is logarithm with base 10, ν = μ/ρ is the kinematic viscosity in cSt (1 cSt = 10-6 m2/s), A and B are empirical coefficients, and T (K) is the absolute temperature. With a known value νRef of the viscosity at a reference temperature TRef , and a known slope B, Eq. 6 can be written as: log Y = log YRef – B log(T/TRef) (7) where Y = log(ν + 0.7), and YRef = log(νRef + 0.7). Based on crude assay data for Oseberg Blend, the slope is found to be B = 6.139. The calculated values for gas saturation and live oil viscosity can be found in Table 4.3.
3.8 Experimental work at SwRI The high pressure (HP) testing at SwRI simulates deep water conditions at approximate 1700 meters depth and was performed at various pressures up to 2500 psi or 172 bars. It was conducted in a 2.3 meter inside diameter by 5.8 meter deep pressure chamber at SwRI. This chamber holds 24 000 liters of artificial sea water, is rated for 4000 psi (275 bar) and can be cooled to maintain an inside water temperature of approximately 4 degrees. All experiments were performed with filtered artificial sea water made from city water and natural salt, approximating a salinity of 3.5%. The salt water was prepared and filtered in an external tank. Filtering was done by circulating the water through 5 µm filters for 24 hours or until water was totally transparent. The water was also cooled to 4°C, with a high capacity external chiller, before transferring to the hyperbaric chamber. The release nozzle and the SilCam instrumentation were continuously monitored by a HD video camera during the experiments. Flow rates, densities and temperatures of the released oil and gas were continuously displayed for the operators, together with the relevant pressure. Real time monitoring of these vital experimental parameters together with the oil droplet sizes was important for the success of these experiments. A description of the SwRI 90" hyperbaric chamber modified for these experiments is given in Figure 3.4. The following experiments were originally planned for the work at SwRI:
1. Ambient: dead oil/gas/dispersant (1%) 2. HP: dead oil/gas/dispersant (1%) + testing with live oil towards the end of the experiment

PROJECT NO. 102007986
REPORT NO. OC2017 A-090
VERSION Final
16 of 56
3. HP: live oil/additional gas (GOR 1:1 at pressure)/dispersant (1%). Low temperature
4. As #3 with three temperatures (oil alone/disp) low-middle-high (10 – 80°C) 5. As #3 with 3 higher GORs (1:1, 1:5 and 1:10) - middle temp 6. As #5 but with reduced pressure e.g. 88 bar (GORs doubled accordingly) – middle temp
The main objective with experiment 1-2 was to replicate data from earlier studies at SwRI (API D3 Phase-III, January 2015). However, since we, based on the experience from the initial experiments at SINTEF, changed to a larger nozzle (from 1.5 mm to 3 mm), the rationale for doing experiment with the 1.5 mm nozzle was not there anymore. These experiments were for this reason used for initial testing with the new system for releasing live oil.
Figure 3.4: Left: Pressure chamber ready for frame insertion. SilCam is seen installed in the
internal white frame. Right: Schematics of the experimental setup. All experiments at SwRI were performed at elevated pressure (see Table 3.3). Experiments 1-2 in Table 3.3 were used to test the gas injection system and the generation of live oil. Due to challenges with hydrate formation only experiments at medium to high temperature were possible to perform. The flow meter initially used for gas was of the "impeller type" and it malfunctioned when the system was pressurized, probably due to hydrate formation on the impeller blades due to humidity in the natural gas. We also needed to reduce the heat loss of both oil & gas lines in the tank due to the cold water (4°C). This was done by combining oil and gas on the outside and insulating a common supply line in the tank, see Appendix A for further details. This increased the temperature
PROJECT NO. 102007986
REPORT NO. OC2017 A-090
VERSION Final
17 of 56
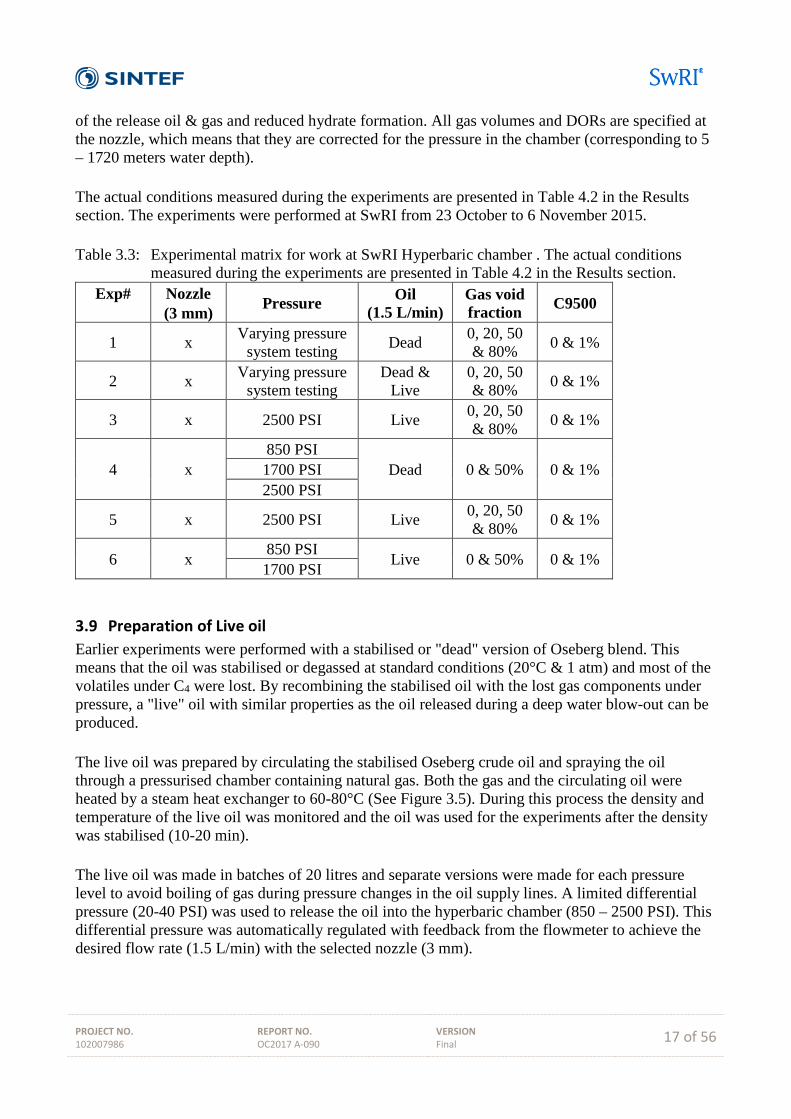
of the release oil & gas and reduced hydrate formation. All gas volumes and DORs are specified at the nozzle, which means that they are corrected for the pressure in the chamber (corresponding to 5 – 1720 meters water depth). The actual conditions measured during the experiments are presented in Table 4.2 in the Results section. The experiments were performed at SwRI from 23 October to 6 November 2015. Table 3.3: Experimental matrix for work at SwRI Hyperbaric chamber . The actual conditions
measured during the experiments are presented in Table 4.2 in the Results section. Exp#
Nozzle (3 mm) Pressure Oil
(1.5 L/min) Gas void fraction C9500
1 x Varying pressure system testing Dead 0, 20, 50
& 80% 0 & 1%
2 x Varying pressure system testing
Dead & Live
0, 20, 50 & 80% 0 & 1%
3 x 2500 PSI Live 0, 20, 50 & 80% 0 & 1%
4 x 850 PSI
Dead 0 & 50% 0 & 1% 1700 PSI 2500 PSI
5 x 2500 PSI Live 0, 20, 50 & 80% 0 & 1%
6 x 850 PSI Live 0 & 50% 0 & 1% 1700 PSI
3.9 Preparation of Live oil Earlier experiments were performed with a stabilised or "dead" version of Oseberg blend. This means that the oil was stabilised or degassed at standard conditions (20°C & 1 atm) and most of the volatiles under C4 were lost. By recombining the stabilised oil with the lost gas components under pressure, a "live" oil with similar properties as the oil released during a deep water blow-out can be produced. The live oil was prepared by circulating the stabilised Oseberg crude oil and spraying the oil through a pressurised chamber containing natural gas. Both the gas and the circulating oil were heated by a steam heat exchanger to 60-80°C (See Figure 3.5). During this process the density and temperature of the live oil was monitored and the oil was used for the experiments after the density was stabilised (10-20 min). The live oil was made in batches of 20 litres and separate versions were made for each pressure level to avoid boiling of gas during pressure changes in the oil supply lines. A limited differential pressure (20-40 PSI) was used to release the oil into the hyperbaric chamber (850 – 2500 PSI). This differential pressure was automatically regulated with feedback from the flowmeter to achieve the desired flow rate (1.5 L/min) with the selected nozzle (3 mm).

PROJECT NO. 102007986
REPORT NO. OC2017 A-090
VERSION Final
18 of 56
Two replicate experiments were performed at 2500 PSI with live oil (experiment 3 and 5), see Table 4.2. The live oil produced for these two experiments were slightly different (temperature, gas saturation and density). For experiment 3 the gas density was varying between 0.689 and 0.704 kg/L, while the live oils was slightly denser during experiment 5 (0.764 – 0.776 kg/L). Additional insulation on the combined gas and oil line were installed after experiment 3. The oil temperatures at the release (inside nozzle) were in the 20-30 °C range for experiment 3 and in the 40-50 °C range for experiment 5 (see Table 4.3), due to the extra insulation of the oil & gas line.
Figure 3.5: Schematics of the experimental setup to make live oil.

PROJECT NO. 102007986
REPORT NO. OC2017 A-090
VERSION Final
19 of 56
4 Results This section contains the results from the testing both at the SINTEF Tower Basin and the hyberbaric chamber at SwRI.
4.1 Overview of experiments Table 4.1: Overview of experiments performed at SINTEF in March 2015.
Exp. no
Date ddmmyy
Type of experiment
Nozzle Oil rate
Type experiment
Disp GOR
Injection Comments Water
samples
1-8 September 2015
1.5 mm 1.2 L/min
Ambient (5 meters
depth)
Testing with various fluids
(water/oil), gasses
(air/natural gas) and dispersant
(C9500)
Too small droplets for testing of algorithm for
identifying droplets versus bubbles
0
9 060315 3.0 mm 1.5 L/min Ambient Air, Water Successful
experiments 0
10 060315 3.0 mm 1.5 L/min Ambient Air, Oil Successful
experiments 0
11 060315 3.0 mm 1.5 L/min Ambient Air, Oil, C9500 Successful
experiments 0
12 060315 3.0 mm 1.5 L/min Ambient Air, Water,
C9500 Successful
experiments 0
13 060315 3.0 mm 1.5 L/min Ambient Natural gas,
Water Successful
experiments 0
14 060315 3.0 mm 1.5 L/min Ambient Natural gas, Oil Successful
experiments 0
15 060315 3.0 mm 1.5 L/min Ambient Natural gas,
Oil, C9500 Successful
experiments 0
15 060315 3.0 mm 1.5 L/min Ambient Natural gas,
Water, C9500 Successful
experiments 0
Red: Not successful experiment Yellow: Partly successful experiment Green: Completely successful experiment The first experiments 1-8 were not successful since the droplets & bubbles were small (50-300 microns) making it challenging to test the new SilCam algorithms to distinguish between oil droplets and gas bubbles. See Experimental sections for further details.

PROJECT NO. 102007986
REPORT NO. OC2017 A-090
VERSION Final
20 of 56
Table 4.2: Overview of experiments performed at SwRI in October-November 2015.
Exp. no Date
Type of experiment
Nozzle Oil rate
Type experime
nt
Disp GOR
Injection Comments Water
samples
1 261015 3.0 mm 1.5 L/min
High Pressure
Testing new setup for combined
releases of oil and gas
Successful testing of equipment, but no data generation. Problems with stable gas flow
rates.
0
2 281015 3.0 mm 1.5 L/min
High Pressure
Testing of gas saturation and
release of Live oil and natural gas
Successful testing of equipment, but limited data generation. Still problems with gas
regulation.
0
3 301015 3.0 mm 1.5 L/min
High Pressure
Live oil, varying GOR (0-80%) at
constant pressure (2500 PSI)
Almost successful experiments, Good data obtained. Some minor challenges with gas
regulation
8
4 021115 3.0 mm 1.5 L/min
High Pressure
Dead oil, varying pressure (850,
1700 & 2500 PSI) with oil alone and 50% natural gas.
Reduced data quality, lacking the largest
droplets, probably due to misaligned nozzle *
8
5 041115 3.0 mm 1.5 L/min
High Pressure
Live oil, varying GOR (0-80%) at
constant pressure (2500 PSI)
Replica of exp. 3. Successful experiments,
Good data obtained. Excellent gas regulation.
8
6 051115 3.0 mm 1.5 L/min
High pressure
Live oil, varying pressure (850, & 1700 PSI) with oil alone and 50%
natural gas.
Successful experiments, Good data obtained.
Excellent gas regulation. 10
Red: Not successful experiment Yellow: Partly successful experiment Green: Completely successful experiment *) When the nozzle is misaligned and not pointing correctly vertically towards the instrumentation,
only the outer parts of the rising oil plume will hit the instrumentation and the largest droplets will usually not be detected.

PROJECT NO. 102007986
REPORT NO. OC2017 A-090
VERSION Final
21 of 56
Table 4.3: IFT measurements of oil samples taken from the hyperbaric chamber. The water/oil sampling intervals are indicated in Figure 4.1 to Figure 4.4. Oil/Gas flow rates, oil temperatures & densities at the release nozzle are averaged from data logged during the experiments. Live oil viscosities are calculated.
Experiment 3, 5 and 6.
(Live oil & Natural gas, varying GOR & pressure, all experiments: 3 mm nozzle)
Oil droplets (d50, µm)
Gas bubbles (d50, µm)
Tank Pressure
(PSI)
Oil-water IFT
(mN/m)
Oil & gas
nozzle temp (°C)
Live oil density (Kg/L)
Live oil flow rate
(L/min)
Nat. gas flow rate
(L/min)
Live oil viscosity
(mPas)
3A-Only live oil, no gas 1242 1944 2500 19.3±1.3 22 0.700 1.5 0 0.878 3B-Oil + 20% gas 981 1380 2500 18.2±2.0 26 0.700 1.5 0.35 0.806 3C-Oil + 50% gas 644 726 2500 18.2±2.0 27 0.706 1.4 1.5 0.790 3D-Oil + 80% gas 331 639 2500 21.6±3.0 28 0.705 1.4 5.5 0.775
3E-Oil + 20% gas + 1% disp. 196 418 2500 2.8±0.6* 28 0.695 1.5 0.25 0.775 3F-Oil + 50% gas + 1% disp. 186 482 2500 3.2±0.8* 32 0.695 1.6 1.0 0.718 3G-Oil + 80% gas + 1% disp. 147 389 2500 3.8±0.7* 36 0.690 1.5 3.5 0.669 3H - Only live oil + 1% disp. 209 412 2500 3.8±1.5* 27 0.700 1.5 0 0.790
5A-Only live oil, no gas 1214 1714 2500 18.6±3.0 27 0.776 1.5 0 0.790 5B-Oil + 20% gas 1025 1739 2500 21.0±0.2 37 0.774 1.4 0.65 0.657 5C-Oil + 50% gas 620 648 2500 21.5±3.5 36 0.773 1.5 1.7 0.669 5D-Oil + 80% gas 206 403 2500 19.5±1.5 49 0.773 1.5 6.0 0.548
5Fb-Oil + 80% gas + 1% disp. 167 379 2500 1.7±0.6* 50 0.772 1.5 5.9 0.540 5E-Oil + 50% gas + 1% disp. 272 414 2500 3.3±1.0* 45 0.772 1.6 1.3 0.580 5G-Oil + 20% gas + 1% disp. 289 429 2500 3.3±0.4* 41 0.773 1.5 0.6 0.616 5H-Oil + 0% gas + 1% disp. 331 446 2500 3.5±1.5* 40 0.773 1.5 0 0.626
6A-oil no gas 1221 2142 850 22.4±2.4 22 0.764 1.5 0 0.790 6B-Oil, 50% gas 720 848 850 20.8±2 30 0.773 1.4 1.4 0.657
6C-Oil no gas 1174 1742 1700 21.3±2.6 31 0.755 1.5 0 0.669 6D-Oil, 50% gas 668 724 1700 20.0±1.3 34 0.755 1.5 1.2 0.548
6F-Oil, 50% gas, 1% disp. 188 662 1700 6.7±0.31 38 0.753 1.5 1.5 0.580 6E-Oil, no gas, 1% disp. 209 418 1700 2.8±0.7* 39 0.754 1.5 0 0.540 6G-Oil, no gas, 1% disp. 298 445 850 3.2±0.5* 35 0.752 1.5 0 0.616
6H-Oil, 50% gas, 1% disp. 319 490 850 0.5±0.5 37 0.770 1.5 1.3 0.626
No droplet/bubble data available for experiment 4 due to unsuccessful experiment (probably misaligned nozzle). *: Measurements of IFT (spinning drop) of treated samples was a challenge due to "creaming or emulsification" caused
by gas expansion of the live oil during depressurization of the sample. IFT Values for 1% injection of C9500 on this crude (Oseberg blend) was in the 0.5 – 0.8 range for earlier high pressure experiments with "dead oil". An average of 2.5 mN/m (after omitting the highest values) is used for predicting droplet sizes later in this report.
1): This oil sample is probably sampled (in the rising plume) slightly too early before the dispersed oil have reached the sampling tube 1.5 meter above the nozzle. The dispersant injection was delayed and untreated droplets are probably still present. The oil droplet and gas bubble data are recorded later when the dispersant injection was efficient.

PROJECT NO. 102007986
REPORT NO. OC2017 A-090
VERSION Final
22 of 56
Figure 4.1: High Pressure experiment 3: Time series showing the live oil flow (blue line), additional natural gas flow (red line), oil temperature in supply line (dark green) and oil temperature at release nozzle (light green). Times for monitoring droplet sizes and in-situ oil/water sampling are indicated by coloured bars, oil alone (grey) and treated oil, 1% C9500 (blue).
Figure 4.2: High Pressure experiment 4: Time series showing the live oil flow (blue line),
additional natural gas flow (red line), oil temperature in supply line (dark green) and oil temperature at release nozzle (light green). Times for monitoring droplet sizes and in-situ oil/water sampling are indicated by coloured bars, oil alone (grey) and treated oil, 1% C9500 (blue).
0
10
20
30
40
50
60
70
80
90
0,0
1,0
2,0
3,0
4,0
5,0
6,0
7,0
8,0
9,0
05:1
7…05
:17…
05:1
8…05
:19…
05:2
0…05
:20…
05:2
1…05
:22…
05:2
3…05
:24…
05:2
4…05
:25…
05:2
6…05
:27…
05:2
7…05
:28…
05:2
9…05
:30…
05:3
1…05
:31…
05:3
2…05
:33…
05:3
4…05
:35…
05:3
5…05
:36…
05:3
7…05
:38…
05:3
8…05
:39…
05:4
0…05
:41…
05:4
2…05
:42…
05:4
3…05
:44…
05:4
5…05
:45…
05:4
6…05
:47…
05:4
8…05
:49…
05:4
9…05
:50…
05:5
1…05
:52…
05:5
3…05
:53…
05:5
4…05
:55…
05:5
6…
Oil-
Gas
tem
pera
ture
(°C)
Oil
& g
as fl
ow ra
te (L
/min
)Gas flow (L/min)Oil flow (L/min)Oil supply temp (°C)Nozzle temp (°C)
Dispersant 1%SwRI Exp3 - Oct. 30. 2015
IFT: 19.3
IFT: 3.2
IFT: 2.8
IFT: 21.6
IFT: 18.2
IFT: 18.2
IFT: 9.3
IFT: 3.8
IFT: 3.8
0
10
20
30
40
50
60
70
0,0
0,5
1,0
1,5
2,0
2,5
3,0
3,5
4,0
3:23
:01
3:24
:27
3:25
:53
3:27
:20
3:28
:46
3:30
:12
3:31
:39
3:33
:05
3:34
:32
3:35
:59
3:37
:25
3:38
:52
3:40
:19
3:41
:45
3:43
:12
3:44
:39
3:46
:05
3:47
:32
3:48
:59
3:50
:26
3:51
:53
3:53
:19
3:54
:46
3:56
:13
3:57
:40
3:59
:07
4:00
:34
4:02
:01
4:03
:28
4:04
:55
4:06
:22
4:07
:49
4:09
:16
4:10
:43
4:12
:10
4:13
:37
4:15
:04
4:16
:32
4:17
:59
4:19
:26
4:20
:53
4:22
:21
4:23
:48
4:25
:15
4:26
:43
4:28
:11
4:29
:38
4:31
:06
4:32
:33
4:34
:01
4:35
:29
Oil-
Gas
tem
pera
ture
(°C)
Oil
& g
as fl
ow ra
te (L
/min
)
Gas flow (L/min)Oil flow (L/min)Oil supply temp (°C)Nozzle temp (°C)
SwRI Exp4 - Nov. 2. 2015
Dispersant 1%
850 PSI 2500 PSI1700 PSI
850 PSI
1700 PSI
IFT: 5.2
IFT: 2.4
IFT: 2.0IFT: 3.1
IFT: 20.1IFT: 20.8
IFT: 24.0
IFT: 23.5
Refilling of oil in accumulator and repressurization

PROJECT NO. 102007986
REPORT NO. OC2017 A-090
VERSION Final
23 of 56
Figure 4.3: High Pressure experiment 5: Time series showing the live oil flow (blue line), additional natural gas flow (red line), oil temperature in supply line (dark green) and oil temperature at release nozzle (light green). Times for monitoring droplet sizes and in-situ oil/water sampling are indicated by coloured bars, oil alone (grey) and treated oil, 1% C9500 (blue).
Figure 4.4: High Pressure experiment 6: Time series showing the live oil flow (blue line),
additional natural gas flow (red line), oil temperature in supply line (dark green) and oil temperature at release nozzle (light green). Times for monitoring droplet sizes and in-situ oil/water sampling are indicated by coloured bars, oil alone (grey) and treated oil, 1% C9500 (blue).
0
10
20
30
40
50
60
70
80
90
0,0
1,0
2,0
3,0
4,0
5,0
6,0
7,0
8,0
9,0
10,0
05:1
6…05
:17…
05:1
7…05
:18…
05:1
8…05
:19…
05:1
9…05
:20…
05:2
0…05
:21…
05:2
1…05
:22…
05:2
2…05
:23…
05:2
3…05
:24…
05:2
4…05
:25…
05:2
5…05
:26…
05:2
6…05
:27…
05:2
7…05
:27…
05:2
8…05
:28…
05:2
9…05
:29…
05:3
0…05
:30…
05:3
1…05
:31…
05:3
2…05
:32…
05:3
3…05
:33…
05:3
4…05
:34…
05:3
5…05
:35…
05:3
6…05
:36…
05:3
7…05
:37…
05:3
8…05
:38…
05:3
9…05
:39…
05:4
0…
Oil-
Gas
tem
pera
ture
(°C)
Oil
& g
as fl
ow ra
te (L
/min
)Gas flow (L/min)Oil flow (L/min)Oil supply temp (°C)Nozzle temp (°C)
Dispersant 1%
SwRI Exp5 - Nov. 4. 2015
IFT: 21.0IFT: 18.6
IFT: 1.7
IFT: 3.5
IFT: 3.3IFT: 3.3
IFT: 11.5
IFT: 19.5IFT: 21.5
0
10
20
30
40
50
60
70
80
90
0,0
0,5
1,0
1,5
2,0
2,5
3,0
3,5
03:0
1…03
:03…
03:0
4…03
:06…
03:0
7…03
:09…
03:1
0…03
:11…
03:1
3…03
:14…
03:1
6…03
:17…
03:1
9…03
:20…
03:2
2…03
:23…
03:2
4…03
:26…
03:2
7…03
:29…
03:3
0…03
:32…
03:3
3…03
:35…
03:3
6…03
:37…
03:3
9…03
:40…
03:4
2…03
:43…
03:4
5…03
:46…
03:4
8…03
:49…
03:5
0…03
:52…
03:5
3…03
:55…
03:5
6…03
:58…
03:5
9…04
:01…
04:0
2…04
:04…
04:0
5…04
:06…
04:0
8…04
:09…
04:1
1…04
:12…
Oil-
Gas
tem
pera
ture
(°C)
Oil
& g
as fl
ow ra
te (L
/min
)
Gas flow (L/min)Oil flow (L/min)Oil supply temp (°C)Nozzle temp (°C)
SwRI Exp6 - Nov. 5. 2015
Dispersant 1%
850 PSI 1700 PSI 850 PSI
IFT: 20.0IFT: 0.5
IFT: 3.2
IFT: 21.3
IFT: 20.8IFT: 22.4 IFT: 6.7
IFT: 2.8
Refilling of oil, warming and pressurizing
Refilling of oil, warming and pressurizing
Refilling of oil, warming and pressurizing

PROJECT NO. 102007986
REPORT NO. OC2017 A-090
VERSION Final
24 of 56
4.2 Combined releases of oil and gas at varying GORs – SINTEF Tower Basin Two different gases were used for these experiments in the SINTEF Tower Basin, air and natural gas (NG). The NG was a custom blend made for this project based on specifications from SwRI. See Appendix A for a specification of the blend. At SINTEF, the oil and gas were fed in separate lines and mixed in a T-junction 30 cm (or 100 release diameters) before the nozzle, see Appendix B for further details.
4.2.1 Quantification of oil droplets and gas bubbles This testing at SINTEF was performed to verify and refine the new high pressure colour version of the SilCam and the algorithm for identifying or classifying particles as "oil droplets" or "gas bubbles". Individual volume distributions of oil droplets and gas bubbles calculated from the SilCam images without dispersant injection was used as an example in the experimental section (Figure 3.3). Figure 4.5 illustrates an experiment with dispersant injection where the difference between the oil and gas bubble sizes is larger. The d50 for oil and gas in this example were determined to be 271 µm and 1990 µm and the gas void fraction to be 84% (actual or experimental void fraction 80%).
Figure 4.5: SilCam data from experiment with oil, natural gas (GOR: 4, gas void fraction: 80%)
and dispersant injection (1%, C9500). Relative volume distribution for oil droplets and gas bubbles. The distributions are based on 266 498 identified particles (both droplets & bubbles) from 331 images (15 fps in 30 seconds).
Figure 4.6 provides a comparison of the gas void fraction determined by the SilCam to the actual void fraction based on flow measurements for experiments in the SINTEF Tower Basin. The data point representing the individual experiment in Figure 4.5 is marked by a red circle (80% void fraction) in Figure 4.6. This figure includes all the gas experiments, while Figure 3.3 in the previous chapter only presented the natural gas data. The correlation between measured and set gas volume fractions is generally high (0.90), but the SilCam overestimates the gas fraction, especially in the
0
2
4
6
8
10
12
Rela
tive
drop
let s
ize d
istr
ibut
ion
(Vol
. %)
Droplet size (microns)
Oil Droplets (20 vol. %)Gas bubbles (80 vol. %)
Oil (d50) = 271 µm
Natural gas (d50) = 1990 µm
Oil volume: 16%
Gas volume: 84%

PROJECT NO. 102007986
REPORT NO. OC2017 A-090
VERSION Final
25 of 56
midrange (30-70%). NB! Correlations (r2) are linear correlations between d50 (y) and set gas fractions (x), not between the best-fit line and the measurements. The overestimation of gas fraction is largest for the dispersant experiments (smaller droplets and bubbles) and less for the oil & gas experiments (larger droplets and bubbles). This is probably caused by the reduced number of pixels available for identification of droplets versus bubbles (see section 3.6) with the smaller oil droplets and gas bubbles. The algorithm used should be refined to reduce this overestimation of gas fraction. However, both oil droplets and gas bubbles are expected to be larger in possible real cases.
Figure 4.6: Comparison of calculated gas void fraction, quantified by the SINTEF SilCam, versus
actual void fraction of gas (volume %) released. The individual experiment presented in Figure 4.5 (Natural gas void fraction 80%, dispersant injected) is marked with a red circle. Solid line represent best-fit, dotted line represent 1:1.
4.2.2 Oil droplet and gas bubble size as a function of GORs The oil droplet sizes were quantified using the SINTEF SilCam. Usually the last 30 seconds of each 90 second period were used to establish a volume distribution. The experimental conditions for all four experiments at SINTEF with combined releases (air or NG) and oil alone or with dispersant injection, are presented Table 4.1. All experiments at SINTEF were performed with dead oil. The oil droplet sizes from these experiments are presented in Figure 4.7 and the gas bubble sizes in Figure 4.8, both as a function of increasing gas void fraction (0-90 %). For the bubble sizes there are two additional experiments where the oil was replaced with water. This allowed us to study bubble formation without the need for cleaning the Tower Basin for oil. The dispersant was injected into the water/gas mix, similar to what was done with the oil/gas mix, see Figure 4.9. Correlations (r2) are linear correlations between d50 (y) and set gas fractions (x), not between the best-fit line and the measurements.
R² = 0,90
0
10
20
30
40
50
60
70
80
90
100
0 10 20 30 40 50 60 70 80 90 100
Qua
ntifi
ed g
as v
oid
frac
tion
(Vol
%)
Set gas void fraction (Vol%)
Natural gas & oil
Air & Oil
Natural gas & oil (dispersants)
Air & oil (Dispersant)

PROJECT NO. 102007986
REPORT NO. OC2017 A-090
VERSION Final
26 of 56
Figure 4.7: Oil droplet sizes (d50 - volume distribution) quantified with the SINTEF SilCam for
combined releases with oil & gas (air and NG), including dispersant injection (SIT) using Corexit 9500 (1%). Gas flow rate: 0.2 – 14 L/min (10 – 90%). Individual experiment presented in Figure 4.5 (Oil droplet with 80% gas, dispersant injected) is marked with a red circle.
Figure 4.8: Gas bubble sizes (d50 - volume distribution) quantified with the SINTEF SilCam for
combined releases with oil & gas (air and NG), including dispersant injection (SIT) using Corexit 9500 (1%). Gas flow rate: 0.2 – 14 L/min (10 – 90%). Individual experiment presented in Figure 4.5 (Natural gas void fraction 80%, dispersant injected) is marked with a red circle.
R² = 0,69
R² = 0,50
R² = 0,89
R² = 0,64
0
200
400
600
800
1000
1200
1400
1600
1800
2000
0 10 20 30 40 50 60 70 80 90 100
Cum
mul
ativ
e d 5
0(m
icro
ns)
Set gas void fraction (Vol%)
10-Air-Oil
11-Air-Oil-C9500 (1%)
14-NG-Oil
16-NG-Oil-C9500 (1%)
SINTEF - Oil droplet sizes versus gas void fraction (Using air or NG as gas)
R² = 0,76
R² = 0,98
R² = 0,72
R² = 0,96
0
500
1000
1500
2000
2500
3000
3500
0 10 20 30 40 50 60 70 80 90 100
Cum
mul
ativ
e d 5
0(m
icro
ns)
Set gas void fraction (Vol%)
10-Air-Oil
11-Air-Oil-C9500 (1%)
14-NG-Oil
16-NG-Oil-C9500 (1%)

PROJECT NO. 102007986
REPORT NO. OC2017 A-090
VERSION Final
27 of 56
Figure 4.9: Gas bubble sizes (d50 - volume distribution) quantified with the SINTEF SilCam for
combined releases with oil & gas (air and NG) using water instead of oil, including dispersant injection (SIT) using Corexit 9500 (1%). Gas flow rate: 0.2 – 14 L/min (10 – 90%).
4.3 Combined releases of live oil and natural gas at high pressure – SwRI Only experiments with natural gas were performed at SwRI and the gas used had the same composition as the gas used at SINTEF. Experiments were performed both with dead and live oil, but the data quality for the dead oil experiments (experiment 4) was not sufficient (probably due to a misaligned nozzle), see Table 3.3 and Table 4.2. For this reason, only results from the live oil experiments will be presented in this section (experiment 3, 5 and 6). Initial experiments (experiment 1 & 2) showed that a high temperature was needed to avoid gas hydrate formation in the nozzle and in the gas/oil supply line before the oil/gas were released into the water. This was not a challenge as long as we maintained a stable oil and gas flow, but in case of an unexpected halt, the system was clogged. Reducing the pressure in the chamber to thaw hydrates formed in the release nozzle or supply lines was very time consuming. No gas hydrate formation was observed during the release of live oil and natural gas with the conditions described in Table 4.1. No gas hydrate formation, neither on the oil droplets or gas bubbles or as hydrates in the water, were detected by the SilCam or observed on the video material. Two types of experiments were performed:
1. Live oil at fixed pressure (2500 PSI) and varying gas void fraction (0, 20, 50 and 80%) 2. Live oil at varying pressure (850, 1700 and 2500 PSI) with oil alone and 50% gas void
fraction. Oil droplet and gas bubble sizes for the live oil experiments with additional natural gas at high pressure (bulleted point 1 above) are presented in Figure 4.11 (oil droplets) and in Figure 4.12 (gas
0
500
1000
1500
2000
2500
3000
3500
0 10 20 30 40 50 60 70 80 90 100
Cum
mul
ativ
e d 5
0(m
icro
ns)
Set gas void fraction (Vol%)
9-Air-Water12-Air-Water-C9500 (1%)13-NG-Water15-NG-Water-C9500(1%)
Gas bubble size versus gas void fraction (for air/NG experiments with only water)Gas bubble size versus gas void fraction for air and natural gas (NG) with water replacing oil

PROJECT NO. 102007986
REPORT NO. OC2017 A-090
VERSION Final
28 of 56
bubbles). Oil droplets and gas bubble sizes for the live oil experiments at varying pressure (bulleted point 2 above) are presented in Figure 4.13 (oil droplets) and Figure 4.14 (gas bubbles).
4.3.1 Quantification of oil droplets and gas bubbles A comparison of the calculated gas void fractions (SilCam volume data) and the set values for all experiments at high constant pressure (2500 PSI or 172 atm) are presented in Figure 4.10.
Figure 4.10: Gas void fraction in combined releases with live oil & natural gas under pressure
(2500 PSI). Quantified gas void fraction (SilCam) versus measured void fraction (in-line flowmeter, see Table 4.3) for 0, 20, 50 and 80 % gas. Solid line represent best-fit, dotted line represent 1:1.
4.3.2 Live oil and varying gas void fraction (0, 20, 50 & 80%) – SwRI All gas volumes and DORs are specified at the nozzle, which means that they are corrected for the pressure in the chamber. Two replicate experiments were performed at 2500 PSI with live oil and varying gas void fraction (experiment 3 and 5), see Table 3.3 and Table 4.2. Different flow conditions can occur in multiphase blow outs, from bubbly flow with oil as the continuous phase, via slug flow where slugs of oil and gas occupy sequential sections of the pipe, to mist flow where oil droplets are suspended in the gas flow. Bubbly flow in vertical pipes are normally associated with low to moderate gas void fractions (< 60 %), while mist flow is limited to very high void fractions (> 95%) (Gould et al., 1974). The actual flow conditions are also influenced by the velocity of the flow, often defined by the superficial velocities of the two fluids. In the present context, we will only consider bubbly flow condition, which represents a deep water blowout that releases high volumes of oil.
R² = 0,82
0
10
20
30
40
50
60
70
80
90
0 10 20 30 40 50 60 70 80 90
Qua
ntifi
ed g
as v
oid
frac
tion
(Vol
. %)
Monitored gas void fraction (in-line flow meter, vol. %)
Exp3 Live OilExp3 Live oil + 1% dispersantExp5 Live oilExp5 Live oil + 1% dispersant

PROJECT NO. 102007986
REPORT NO. OC2017 A-090
VERSION Final
29 of 56
However, the live oil produced for these two experiments are slightly different (gas saturation and density). For experiment 3 the oil density varied between 0.689 and 0.704 kg/L, while the live oil was slightly denser during experiment 5 (0.764 – 0.776 kg/L). Also the release temperature changed during these experiments because additional insulation on the combined gas and oil line were installed after experiment 3, and even improved after experiment 4. The oil temperatures at the release were in the 20-30 °C range for experiment 3 (see Figure 4.1) and in the 40-50 °C range for experiment 5 (see Figure 4.3). For comparing measured oil droplet and gas bubble sizes with predicted sizes (modified Weber scaling) in several of the figures in this report, the averaged live oil temperatures, live oil densities and viscosity (calculated) are presented in Table 4.3 together with the IFTs for the oil sampled during the experiments. The results from the two replicate experiments (experiment 3 and 5) are combined in Figure 4.11 (live oil droplet sizes) and Figure 4.12 (natural gas bubble sizes). The two figures illustrate the changes in droplet and bubble sizes as a function of increasing gas void fraction and dispersant injection (1 % C9500). Increasing the gas void fraction in the 0-80% range (GOR: 0-8) at the actual pressure of 172 bar or 1720 meters depth (Figure 4.11), corresponds to a GOR of 0-1376 at standard condition (1 atm). A combined release with such a high GOR would usually be classified as a gas release. The main reason for spanning such a large gas range was to generate a suitable data set for refining existing models for predicting oil droplet sizes for combined releases (modified Weber scaling) and to develop new algorithms for predicting gas bubble sizes. The live oil is saturated with natural gas, but this gas volume is not included in the GORs used to calculate exit velocities (assuming bubble-point pressure < hydrostatic pressure at release point). The following correction for void fraction in release velocity is made for the predictions in Figure 4.11: Un= Uoil/(1 – n)1/2, where Uoil is the oil only release velocity and n is the gas void fraction at the exit (Johansen et al., 2013). For large volume flows which might be buoyancy dominated, an exit Froude number correction should also be applied (Johansen et al, 2013). A void ratio of 80% increases the release velocity (U) by a factor of 2.8 compared to a release of oil alone. Since the Weber number (and droplet sizes) are proportional to U2 it is clear that a large increase in gas void fraction will cause significantly smaller oil droplet sizes. This is clearly seen in Figure 4.11 where the untreated oil droplet sizes are reduced from 1200 to 300 microns, by increasing the gas void fraction to 80%.

PROJECT NO. 102007986
REPORT NO. OC2017 A-090
VERSION Final
30 of 56
Figure 4.11: Live oil droplet sizes (d50) quantified with the SINTEF SilCam for combined releases with live oil & natural gas, including 1% dispersant injection (SIT) as a function of gas void fraction (in-line flowmeter, see Table 4.3). Predicted values using modified Weber scaling are also included (solid line is best fit to predictions). Release velocities (U), corrected for increasing gas void fractions, are also included.
Figure 4.12: Gas bubble sizes (d50 – vol. distribution) quantified with the SINTEF SilCam for
combined releases with live oil & natural gas, including 1% dispersant injection (SIT) as a function of varying gas void fraction. (in-line flowmeter, see Table 4.3). Solid lines are best fit to measurements.
0
200
400
600
800
1000
1200
1400
0 10 20 30 40 50 60 70 80 90
Oil
drop
lets
size
(d50
mic
rons
)
Monitored gas void fraction (in-line flow meter, vol. %)
Live oil alone (exp3)Live oil alone (exp 5)1% Dispersant injection (exp 3)1% Dispersant injection (exp 5)Predicted - Live oil alonePredicted - Dispersant injection
0
200
400
600
800
1000
1200
1400
1600
1800
2000
0 10 20 30 40 50 60 70 80 90
Gas
bub
ble
size
(d50
mic
rons
)
Monitored gas void fraction (in-line flow meter, vol. %)
Live oil alone (exp3)
1% Dispersant injection (exp 3)
Live oil alone (exp 5)
1% Dispersant injection (exp 5)
U = 4.0 m/s
U = 3.5 m/s
U = 5.4 m/s
U = 9.9 m/s

PROJECT NO. 102007986
REPORT NO. OC2017 A-090
VERSION Final
31 of 56
4.3.3 Live oil and natural gas (50%) at varying pressure – SwRI/SINTEF All gas volumes are specified at the release nozzle, which means that the mass flows of gas were corrected for the pressure in the chamber. To maintain a constant void fraction as pressure increased required increasing the mass flow of gas. The gas void fraction is for this reason constant (50%) in all figures in this chapter, regardless of pressure. During the experimental period at SwRI, two experiments were performed at 2500 PSI (experiment 3 and 5) and one experiment (experiment 6) combining 850 and 1750 PSI, see Table 4.2. The results from these three experiments and one experiment from SINTEF Tower Basin (5 meter depth) are combined in Figure 4.13 (live oil droplet sizes) and Figure 4.14 (natural gas bubble sizes). The two figures illustrate the changes in droplet and bubble sizes as a function of pressure and dispersant injection (1 % C9500). Oil temperatures at the release nozzle and the live oil (density/gas saturation) varied slightly between these three experiments. This is due to modifications of the oil and gas supply line (additional insulation) and other experimental conditions. The averaged live oil temperatures, densities and gas saturation (calculated) are presented in Table 4.3 together with the IFTs for the oil sampled during the experiments.

PROJECT NO. 102007986
REPORT NO. OC2017 A-090
VERSION Final
32 of 56
Figure 4.13: Live oil droplet sizes (d50 - volume distribution) quantified with the SINTEF SilCam
for combined releases with live oil & natural gas, including 1% dispersant injection (SIT) as a function of pressure at constant gas void fraction (50 vol.%). 5 meter data from SINTEF Tower basin, pressurized experiments performed at SwRI. Predicted values using modified Weber are also included (lines are best fit to predictions).
Figure 4.14: Gas bubble sizes (d50 - volume distribution) quantified with the SINTEF SilCam for combined releases with live oil & natural gas, including 1% dispersant injection as a function of pressure at constant gas void fraction (50 vol.%). 5 meter data from SINTEF Tower basin, pressurized experiments performed at SwRI.
0
200
400
600
800
1000
1200
1400
1600
0 500 1000 1500 2000 2500
Oil
drop
lets
size
(d50
mic
rons
)
Pressure (PSI) - Depth (m)
Live oil alone Live oil alone - DispersantLive oil - 50% gas Live oil - 50% gas - DispersantLive oil alone (Predicted) Live oil - Dispersant (Predicted)Live oil - 50% gas (Predicted) Live oil - 50% gas - Dispersant (Predicted)
850 m5 m 1160 m 1750 m
0
500
1000
1500
2000
2500
3000
0 500 1000 1500 2000 2500
Gas
bub
ble
size
(d50
mic
rons
)
Pressure (PSI) - Depth (m)
Live oil - 50% gas
Live oil - 50% gas - Dispersant
850 m5 m 1160 m 1750 m

PROJECT NO. 102007986
REPORT NO. OC2017 A-090
VERSION Final
33 of 56
A correlation between the measured and predicted oil droplet sizes (d50) for all the experiments is summarised in Figure 4.15. The general correlation is very high (r2=0.95) and shows that the modified Weber scaling (Johansen et al., 2013) gives good predictions of initial oil droplet sizes also for combined release of live oil and natural gas under varying pressures corresponding to 5 to 1750 meters depth.
Figure 4.15: Test of modified Weber scaling: Observed and computed oil droplet sizes. Broken lines show deviations of ± 10% from a perfect fit (solid lines). Data from Table 4.3
0
200
400
600
800
1000
1200
1400
0 200 400 600 800 1000 1200 1400
Com
pute
d (m
odW
eber
) d50
Measured (SilCam) d50
Exp #3Exp #5Exp #6Exp #3 dispExp #5 dispExp #6 disp

PROJECT NO. 102007986
REPORT NO. OC2017 A-090
VERSION Final
34 of 56
5 Discussion This section contains a discussion of the data presented in the previous section.
5.1 Ambient conditions – SINTEF Tower Basin
5.1.1 Documentation of the SilCam with combined releases The new instrumentation, the SilCam, was designed to discriminate between oil droplets and gas bubbles. Experiments with combined releases of oil (Oseberg blend) and gas (air & natural gas) were performed to test and document this capability. A series with experiments were performed in the SINTEF Tower Basin varying the gas void fraction from 0 to 90 vol.% (see Table 3.2). With the SilCam each particle in every image is identified as either oil droplet or gas bubble, details can be found in Davies et al., 2016. This is done with a custom made software, which also is used for manual exploration and analysis of the data (see Figure 3.1). Data obtained both from the oil-gas experiments, giving individual distributions of oil droplets and gas bubbles, shows that the SilCam separate these two different overlapping classes of particles in distinct distributions over a wide range of GORs and droplet sizes, see example with 30% and 80% natural gas in Figure 3.2 and Figure 4.5. Experiments with a gas void fraction ranging from 0 to 90% (air & natural gas) show in general a good fit between the calculated and set values (r2 = 0.95 and 0.82, see Figure 3.3 and Figure 4.6). However, the SilCam is generally overestimating the gas void fraction by about 10-20 % in the 30 – 70 % range. This bias could probably be reduced by adjusting the algorithm used to discriminate between oil droplets and gas bubbles. For the highest void fractions (80-90%) the calculated values were lower, probably caused by saturation of the SilCam due to very high gas concentrations.
5.1.2 Oil droplet sizes versus gas void fraction (0-90%) Oil droplet sizes are presented as a function of gas void fraction (0 – 90%) in Figure 4.7 and show a decrease in droplet size of untreated oil with increasing gas void fraction (constant oil flux) due to the increased exit volocity. We also observed a significant reduction in oil droplet size when dispersant is injected (1%, SIT, Corexit 9500). The untreated droplets are in the 1300-800 µm range while the treated droplets are in the 300-200 µm range. There was a small, but systematic difference in the treated oil droplet sizes when air and natural gas was used, giving smaller droplets with air compared to natural gas (see Figure 4.7). This could indicate that the hydrocarbon-water interphase introduced by the natural gas attracts some of the surfactants from the dispersants, but it could also be caused by the increased density of air (larger exit Weber number) compared to the lighter natural gas.
5.1.3 Gas bubble sizes versus gas void fraction (0-90%) The gas bubble sizes presented in Figure 4.8, on the other hand, showed a decrease in droplet size of untreated oil with increasing gas void fraction (0 – 90%). This is surprising since the increasing exit velocity should create smaller bubbles, but might be explained by the reduction in exit Weber number from around 200 to 2 (from low to high gas fraction). The high Weber number is sufficient to form an "atomizing" jet creating small bubbles, while the low number at high gas void fraction is not sufficient for "atomizing" conditions. Smaller gas bubble sizes can be observed for the heavier air compared to the lighter natural gas. The effect of dispersant injection on the bubble sizes are also

PROJECT NO. 102007986
REPORT NO. OC2017 A-090
VERSION Final
35 of 56
significantly lower compared to the effect on the oil droplets, although there is a reduction in d50 relative to the untreated bubbles.
5.1.4 Experiments using water as the liquid fraction An additional series of experiments were performed with water as the liquid medium instead of oil. Only gas bubbles were present and could be monitored in these experiments (see Figure 4.9). A similar trend with increasing bubble sizes were observed, but the difference between untreated and treated gas bubbles are significantly reduced. This might be explained by less effective surfactant coating on the bubbles since the dispersant is injected into the water (simulating) oil and not into the oil. The soluabilities of the surfactants are higher in water compared to oil.
5.1.5 Closing remarks The low exit Weber number of the combined oil and gas releases with high gas void fraction in the Tower basin is not very representative for a deep-water subsea release. The main objectives with these experiments were to test and verify the new SilCam instrumentation with high gas void fractions. The experiments performed in the hyperbaric chamber at SwRI represent a more realistic representation of the processes in a deep water release, see discussions in next section.
5.2 HP conditions - SwRI
5.2.1 Documentation of the SilCam with combined releases A comparison of the gas fraction determined with the SilCam and the monitored gas fractions (in-line flowmeters) from the two experiments with constant high pressure (2500 PSI or 172 atm) is presented in Figure 4.10. A high correlation between calculated and measured gas fractions were observed (r2 = 0.82), as also experienced with the SINTEF Tower Basin. However, the SilCam generally underestimates the gas void fraction with 10-20%. This could be caused by the reduced density difference between oil and gas, but more likely by the generally smaller size of the gas bubbles due to the increased pressure. The smaller sizes results in less pixels available for the algorithm used to discriminate between droplets and bubbles (see Section 3.6). A larger spread in both calculated and measured values was observed for these experiments.
5.2.2 Preparation of live oil The system established to recombine natural gas and dead oil to produce a realistic live oil functioned well, after some initial adjustments. The main lessons learned are that Coriolis flow meters were necessary (no moving propellers) and that the oil & gas mix had to be kept warm to avoid any gas hydrate formation in the gas/oil-supply lines. Less humidity in the natural gas supply would probably also reduce gas hydrate formation in the supply lines.
5.2.3 Oil droplet sizes versus gas void fraction (0, 20, 50 and 80%) at constant pressure The oil droplet sizes as a function of gas void fraction using natural gas in Figure 4.11 (172 atm) showed a steeper decrease in droplets size versus gas void fraction compared to experiments in the Tower Basin in Figure 4.7 (0.6 atm). This is caused by the increased gas density (more mass/higher weber number) at higher pressure and constant gas volume fractions, compared to the low pressure experiments in the Tower Basin.

PROJECT NO. 102007986
REPORT NO. OC2017 A-090
VERSION Final
36 of 56
Oil droplets were significantly reduced in Figure 4.11for the high gas void fractions due to increased release velocities and the higher gas density at high pressure. These release conditions were used to span a wide range of gas void fractions to create a data set suitable for model verification. The releases with the highest gas void fractions are not realistic for deep water blow outs with high oil release rates. The GOR at standard conditions is above 1500+ and the release would be classified as a gas release. A significant effect of dispersant injection similar to that observed in the Tower basin (Figure 4.7, 0.6 atm) was observed during the experiments at high pressure (Figure 4.11, 172 atm). The droplet sizes of the live oil were reduced from 1200 micron (untreated) to 200-300 micron when treated with 1% C9500. These droplet sizes were very comparable to those measured in the Tower Basin and strongly indicate that, at least for low viscosity paraffinic oils, deep-water pressure and use of live oil is not giving significantly different droplet sizes or reduced effectiveness of dispersant injection. The measured and predicted oil droplets sizes in Figure 4.11 show a very good correlation. For the dispersant injection experiments, the measured droplet sizes doesn't show the same tight clustering along the predicted line, but this is probably due to experimental uncertainty.
5.2.4 Gas bubble sizes versus gas void fraction (0, 20, 50 and 80%) at constant pressure The gas bubbles sizes measured with combined releases of live-oil and natural gas under pressure (Figure 4.12, 172 atm) showed reduced bubble sizes for increasing gas fractions (0, 20, 50 and 80%). This is contrary to the Tower basin experiments (Figure 4.8, 0.6 atm), where the bubble sizes increased. This is probably caused by the increased density of the natural gas at 172 atm, giving sufficient exit Weber number to maintain atomising conditions. The bubble sizes were also reduced as the exit velocity was increased from approximately 3 m/s to 10 m/s (80 % additional natural gas). Small amount of gas bubbles were detected by the SilCam in the "live oil only" experiments. The live oil was not expected to release any gas during release (bubble-point pressure < hydrostatic pressure), however some bubbles could be formed since due to a pressure drop over the nozzle of approximately 10 bar. Small volumes of void gas from earlier experiments could also be left in the system. A significant effect of dispersant injection (1%, SIT, Corexit 9500) was also observed as the gas bubbles were reduced from 1800-500 µm (0-80% gas) to a relatively stable 400 µm, independent of gas void fraction. This reduction in bubble size is not documented earlier and highly significant for predicting plume buoyancy and fate of oil droplets. The gas bubble sizes were expected to decrease as a function of increasing release velocity, similar to the oil droplets. However, this was not observed and could be due to challenges with quantifying gas bubbles significantly smaller than 400 µm with this version of the SilCam.
5.2.5 Live oil droplet sizes versus pressure (constant 50 % gas fraction) Results from experiments at ambient pressure (Tower basin, 0.6 atm) and from experiment with varying pressure (SwRI, 58, 116 and 172 atm) are combined in Figure 4.13. Droplet sizes for oil alone showed no significant variation versus pressure, with a size of around 1200 µm over the pressure range of 0.6 to 172 atm. The droplet sizes in the combined release of live oil and natural gas show an expected reduced droplet size due to the increased mass of gas (and exit Weber

PROJECT NO. 102007986
REPORT NO. OC2017 A-090
VERSION Final
37 of 56
number) due to the constant volume fraction (50%). No additional effects of the increased pressure were observed. No significant pressure effect was observed on the effectiveness of dispersant injection (1%, SIT, Corexit 9500). The oil droplet sizes were reduced from 900-600 µm range to around 300 µm (Figure 4.13).
5.2.6 Gas bubble sizes versus pressure (constant 50 % gas fraction) The gas bubble size is very sensitive to pressure due to the compressibility of the natural gas. The reduction in bubble size was largest in the first 100 meters (Figure 4.14), due to large reduction in differential pressure. Bubble sizes for the live-oil alone, without any additional natural gas, are also shown since bubbles probably are released from the saturated oil due to the differential pressure drop over the nozzle (approximately 10 bar). Again, we observe that gas bubble sizes were also reduced as a function of dispersant injection. This reduction in bubble size is highly significant for predicting plume buoyancy and fate of oil droplets.
5.3 Comparison of measured and predicted (modified Weber) oil droplet sizes Oil droplet sizes can be predicted using the modified Weber scaling algorithm (Johansen et al., 2013). This approach was used to compare measured droplet sizes (SilCam) and predicted droplet sizes. The figure presenting live oil droplet sizes as a function of gas void fraction (Figure 4.11, constant pressure 172 bar), showed a very high correlation between measured and predicted droplet sizes. Also the live oil droplet sizes presented as a function of depth or pressure (Figure 4.13, constant 50% gas), show a high correlation between measured and predicted droplet sizes. The comparison of all live oil droplet data (measured versus predicted) is summarized in Figure 4.15. The figure show a good correlation of both untreated and treated oil droplets (r2 = 0.95).

PROJECT NO. 102007986
REPORT NO. OC2017 A-090
VERSION Final
38 of 56
6 Conclusions • The new SINTEF silhouette camera (SilCam) can be used to quantify both oil droplets and
gas bubble sizes in combined subsea releases. These data were used to calculate: gas void fraction and particle distributions (50 - 5 000 µm)
• Oil and natural gas were successfully recombined under pressure and high temperature to
form "live oil".
• "Live oil" were used in subsea releases under pressure and showed no significant reduction in oil droplet sizes versus pressure (6 m to 1750 m) for: Live oil alone, Combined releases with additional natural gas and Oil treated with dispersant.
• This strongly indicates that SSDI effectiveness is not dependent on pressure (water depth) or
the presence of gas provided one accounts for the effect of gas void fraction on the exit velocity.
• Gas bubble sizes were also significantly reduced due to dispersant injection (SSDI). This is a new and significant finding, since gas bubble sizes will influence buoyancy of rising plumes and dissolution of gas. Being able to predict more correctly bubble sizes would improve the ability to describe the fate of oil & gas from subsea releases.
• A mixed release of oil and natural gas introduce a new and alternative hydrocarbon-water
interface that could scavenge surfactants from the oil and possibly reduce dispersant effectiveness. Experiments with air or natural gas indicate that this effect is very small and probably not significant.
• The generated data set of live oil droplet sizes as a function of both pressure/depth (6-1720
meters and gas void fraction (0-80% gas) are used to correlate measured versus predicted oil droplet sizes (modified Weber scaling). The data show a very high correlation and proves that modified Weber scaling can be used to predict oil droplet sizes for live oil (with or without added gas) at high pressure (both untreated and treated with dispersants).

PROJECT NO. 102007986
REPORT NO. OC2017 A-090
VERSION Final
39 of 56
7 Recommendations 1. Combined releases of oil and gas versus pressure should be studied in more detail to verify
that changes in release characteristics when oil & gas change role as the continuous phase at high gas void fractions. Will this change the exit weber number and degree of atomisation? Better data describing this will help us understand the difference between the low pressure experiments at SINTEF and the high pressure experiments at SwRI, regarding gas bubble formation at varying gas void fraction.
2. Further studies are needed to verify the observed low influence of scavenging of surfactants by natural gas bubbles (water-hydrocarbon interphase).
3. Being able to predict more correct bubble sizes would improve the ability to describe fate of oil from a subsea releases. We should use the generated data describing gas bubble sizes versus gas void fraction and pressure to include the ability to predict of gas bubble sizes into the modified Weber scaling algorithm.
4. A large-scale experimental deep-water field release of oil and gas including subsea dispersant injection would be very valuable to verify the finding from this study. This could be arranged in a similar manner as the DeepSpill experiment in Norway in 2001 (oil & gas release from 840 meters depth). No dispersants were included in DeepSpill and the monitoring systems (for example for oil droplets & gas bubbles) were very simple compared to our present capabilities (for example with the SilCam).

PROJECT NO. 102007986
REPORT NO. OC2017 A-090
VERSION Final
40 of 56
8 References SINTEF API D3 JITF Subsea dispersant effectiveness reports Finals versions are also available from API's web pages: (http://www.oilspillprevention.org/oil-spill-research-and-development-cente) Phase I: Brandvik, P.J., Johansen, Ø., Farooq, U., Angell G., and Leirvik, F. 2014: Sub-surface
oil releases – Experimental study of droplet distributions and different dispersant injection techniques – version 2. A scaled experimental approach using the SINTEF Tower basin. SINTEF report no: A26122 (Unrestricted) Trondheim Norway 2014. ISBN: 9788214057393.
Phase-II: Brandvik, P.J., Johansen, Ø., Farooq, U., Davies E., Krause D. and Leirvik, F. 2015: Sub-surface oil releases – Subsurface oil releases – Experimental study of droplet size distributions Phase-II. A scaled experimental approach using the SINTEF Tower basin. SINTEF report no: A26866 (Unrestricted) Trondheim Norway 2015. ISBN: 9788214058406.
Phase-III: Brandvik, P.J., Emlyn Davies, Chris Storey, Cole Bradly and Frode Leirvik. 2016: Subsurface oil releases. Verification of dispersant effectiveness under high pressure - A scaled experimental approach using the SINTEF Tower Basin and SwRIs 90" high pressure chamber. SINTEF report no: A27469. Trondheim Norway 2016. ISBN: 978-821405857-4.
Phase IV: Davis J.E., Brandvik, P.J., Øistein Johansen, Ike Nagamine, Dorien Dunnebier, Stephen Masutani, Frode Leirvik, 2017: Fate of subsea dispersed oil droplets. An experimental study combining the SINTEF MiniTower and Univ. of Hawaii's inverted cone system. Phase-IV Report. SINTEF report - In preparation.
Phase V: Brandvik, P.J., Emlyn Davies, Chris Storey and Frode Leirvik. 2017a: Subsurface oil releases – Verification of dispersant effectiveness under high pressure using combined releases oil live oil and natural gas. SINTEF report no: OC2017 A-090. Trondheim Norway 2017. ISBN: 978-82-7174-282-9.
Phase VI: Brandvik, P.J., Johansen, Ø., Davies, E. Leirvik, F., and Belore, R.. 2017b: Subsea Dispersant Injection – large-scale experiments to verify algorithms for initial droplet formation (modified Weber scaling). An approach using the Ohmsett facility, NJ, USA and SINTEF Tower Basin in Norway. Phase-VI report. SINTEF report no: OC2017 A-087 (Unrestricted) Trondheim Norway 2017. ISBN: 978-82-7174-280-5.
Other references used in this report: Brandvik, P.J., Johansen, Ø., Leirvik,F., Farooq, U., and Daling, P.S. 2013a. Droplet breakup in
sub-surface oil releases – Part 1: Experimental study of droplet breakup and effectiveness of dispersant injection. Mar. Pollut. Bull. 2013 Volume 73, Issue 1, 15 2013, pp. 319-326.
Brandvik, P.J., Johansen, Ø., Farooq, U., Angell G., and Leirvik, F. 2013b: Subsea release of oil & gas – a downscaled laboratory study focused on initial droplet formation and the effect of dispersant injection. In proceedings from the International Oil Spill Conference, Savannah, USA, 2014.
Davies, E.J., Nimmo-Smith, W.A.M., Agrawal, Y.C., Souza, A.J., 2011, Scattering signatures of suspended particles: an integrated system for combining digital holography and laser diffraction, Optics Express, 19, 25488-25499.

PROJECT NO. 102007986
REPORT NO. OC2017 A-090
VERSION Final
41 of 56
Davies, E.J., Nimmo-Smith, W.A.M., Agrawal, Y.C., Souza, A.J., 2012, LISST-100 response to large particles, Marine Geology, 307-310.
Davies, Brandvik and Leirvik 2017: The use of spectral transmittance imaging to size and classify suspended particulate matter in seawater. Mar. Pollut. Bull. 2017, vol. 115 Issue 1-2 pp. 402 - 410.
Gould, T.L., Tek M. R. and Katz D.L., 1974. Two-phase flow through vertical, inclined, or curved pipe. J. Pet. Technology. 26, 915-926.
Khelifa and So. (2011). Effects of chemical dispersants on oil-brine interfacial tension and droplet formation. 34th AMOP Technical seminar on environmental contamination and response. Alberta.
Or, C.M., Lam, K.M. and Liu, P. 2011: Potential core lengths of round jets in stagnant and moving envirionments. Journal of Hydro-environment Research, Vol. 5, pp. 81-91.
Hinze, J.O., 1955: Fundamentals of the hydrodynamic mechanism of splitting in dispersion processes. A.I.Ch.E. Journal, Vol. 1, pp. 289-295
Johansen, Ø., Brandvik, P.J., and Farooq, U. 2013. Droplet breakup in sub-surface oil releases – Part 2: Predictions of droplet size distributions with and without injection of chemical dispersants. Mar. Pollut. Bull. 2013 Volume 73, Issue 1, 15 2013, pp. 327-335.
Masutani, S.M. and E.E. Adams, 2000: Experimental study of multiphase plumes and application to deep ocean oil spills. Final report to the U.S. Department of Interior, Minerals Management Service, contract No. 1435-01-98-CT-30946.
Neto, I.E.L., D.Z. Zhu and N. Rajaratnam, 2008: Bubbly jets in stagnant water. International Journal of Multiphase Flow, 34, pp. 1130-1141.
Tang and S.M. Masutani, 2003: Laminar and Turbulent Flow Liquid-liquid Jet Instability and Breakup. Proceedings of the Thirteenth International Offshore and Polar Engineering Conference, Honolulu, Hawaii, USA, pp. 317-324.
Lefebvre, AH, 1989: Atomization and Sprays, Taylor & Francis, 421 pp. Masutani, S.M. and E.E. Adams, 2000: Experimental study of multiphase plumes and application to
deep ocean oil spills. Final report to the U.S. Department of Interior, Minerals Management Service, contract No. 1435-01-98-CT-30946.
Neto, I.E.L., D.Z. Zhu and N. Rajaratnam, 2008: Bubbly jets in stagnant water. International Journal of Multiphase Flow, 34, pp. 1130-1141.

PROJECT NO. 102007986
REPORT NO. OC2017 A-090
VERSION Final
42 of 56
A Appendix: Experimental description of HP & Ambient work performed at SwRI This appendix describes the 90-inch chamber facilities at SwRI and the general experimental setup.
A.1 Preparation and injection of simulated Live oil
A.2 Basic facilities The 90-inch Inner Diameter chamber at SwRI has been in service with the 1960’s as a part of SwRI’s Ocean Simulation Labs. It has been used for many purposes from initial hydrostatic testing of manned and unmanned submeribles to buoyancy modules, pipe, subsea Oil & Gas industry equipment and recently for research activity involving deep water oil releases. The main specifications of the 90-Inch Chamber and test setup are:
1. The tank has approximately 18.25 feet (5.6 meters) of working length and has 90-inches (2.3 m) inner diameter with a hemispherical head on the bottom. The chamber holds 6,444 gallons (24.4 m3) of simulated salt water. The chamber is located outdoors and under cover.
2. The salt water is mixed in a separate tank to nearly 24% by weight concentration and is circulated through high capacity sand filters to remove impurities before mixing with chamber fresh water. Commercially available water softener salt with minimal additives is used.
3. A separate frame is installed within the chamber to hold SINTEF measurement equipment and tubing routed to the test nozzle.
4. An oil flow loop was setup external to the chamber that consisted of an accumulator, flow meter and control valves. Oil stream extraction equipment was placed on the chamber closure to withdraw oil/water sample from the plume during atmospheric and high pressure experiments.
5. A LabVIEW based control system recorded data and controlled the oil delivery. Dispersant delivery was controlled via a separate Insco Pump and control software.
6. SwRI’s facilities include an effluent tank to hose the contaminated oil/water mixture. The waste fluid is filtered and disposed in accordance with local ordances and permits.
The overall configuration of the 90-inch chamber, control and oil/dispersant delivery system can be seen in Figure A - 1.

PROJECT NO. 102007986
REPORT NO. OC2017 A-090
VERSION Final
43 of 56
Figure A - 1: Piping and Instrumenation Diagram for Phase III Amendment Testing
A.2.1 Monitoring during the experiments

PROJECT NO. 102007986
REPORT NO. OC2017 A-090
VERSION Final
44 of 56
This chapter contains the description of the different monitoring techniques used during the release experiments. The main monitoring is performed in the center of the plume approximately 3 meters above the release point. SINTEF monitoring equipment statically affixed to the chamber internal frame as seen in Figure A - 2.
Figure A - 2: SINTEF Instruments Mounted to Test Frame
SwRI pressure and temperature monitoring instrumentation was mounted in accordance with Figure A - 1.
A.2.1.1 Oil/Water sampling Water samples were taken below the position in the tank as droplets sizes were measured. The water is sampled through a long tube located on the internal moutnign frame. The water samples were captured and stored in flasks for SINTEF posttest evaluation.
A.2.1.2 Video documentation One video camera was used to document the plume during experiments. This camera was used to monitor the plume and had pan/zoom capabilities to visualize the release nozzle and SINTEF equipment. Figure A - 3 shows the plume exiting the nozzle during a high pressure experiment.

PROJECT NO. 102007986
REPORT NO. OC2017 A-090
VERSION Final
45 of 56
Figure A - 3: Screen Capture of Video during High Pressure Test, Dispersant Introduced (1% C9500)
A.2.2 General description of a 90-Inch Chamber experiment A short version of this procedure for a blow-out experiment in the Tower basin is given below:
1. Test Preparation: a. Fill salt water mixing chamber approximately 2/3 full with fresh, chilled water. Turn
on agitator and add predetermined amount of salt. Circulated high concerntraion salt water mix through chiller and filter. Skim off impurities in form of foam from tank top opening.
b. Flow high concerntation salf water and fresh chilled water through mixing chamber into 90-inch diameter chamber. Install sump pump at bottom of 90-inch chamber to continuously mix the water as it fills the chamber. Measure the salinity of the mix at regular intervals and adjust flow of salt and/or fresh water accordingly.
c. Once the chamber is filled, allow the sump to mix the water for several hours. Approximately 4 hours or more before testing, switch the flow to route the chamber water through filters. Clarity is needed for the camera.
d. Fill piston accumulator full with Oseberg blend oil and attach high pressure nitrogen on other side with regulator. Set nitrogen pressure appropriately for the test to be performed.
e. Load chamber with test frame holding the nozzle and instrumentation. Close chamber and make all necessary water, oil, dispersant, video and electrical connections. Check function of all items prior to beginning test.
2. Testing a. Begin to flow oil alone at specificed rate. Begin plume oil/water sampling system.
Extract oil/water sample once flow rate has stabilized. b. Begin injection of dispersant at first speicified rate. Extract oil/water sample. c. Repeat for all remaining dispersant injection rates required. Record video of the
plume and/or other points of interest.

PROJECT NO. 102007986
REPORT NO. OC2017 A-090
VERSION Final
46 of 56
d. Stop flow of oil and dispersant. Depressurize chamber (if necessary) and disconnect necessary items in order to open the chamber.
3. Frame Removal and Chamber Reset a. Remove test frame from chamber, use high pressure water spray to clean excess oil
from frame and capture inside chamber. b. Extract the oil layer from the top of the chamber water and route to effluent tank
first. Wash down chamber internal surfaces while removing contaminated water and route all fluids to effluent tank.
c. Clean chamber and test frame. Remove all remaining oil residue from instrumentation surfaces.
A typical atmospheric or high pressure test takes one day with approximately 15 minutes of actual oil flow time before the chamber is too saturated for camera use and/or the small droplets saturate the oil droplet measurement equipment. Cleaning and chamber reset activities take one calendar day.
Figure A - 4: Chamber Ready for Test Prior to Frame Install

PROJECT NO. 102007986
REPORT NO. OC2017 A-090
VERSION Final
47 of 56
Figure A - 5: The path reduction module of the LISST-DEEP (round/conical prism) and the
perforated plastic clip holding it in place used during the initial testing (see Appendix C for details). Seen form the side (upper) and from above (lower).
Figure A - 6: The path reduction module of the LISST-100X (round/conical prism). The LISST-100X
and LISST DEEP were used during the initial testing (see Appendix C for details).

PROJECT NO. 102007986
REPORT NO. OC2017 A-090
VERSION Final
48 of 56
B Appendix: Experimental description of SINTEF Tower Basin
B.1 Basic facilities The basic parts of the SINTEF Tower Basin were constructed and built in 2005 as a part of SINTEFs research activity within deep water releases. This was a follow-up activity of the DeepSpill field experiment in 2000. This basic infrastructure was financed by STATOIL ASA. Due to reduced focus on deep water releases and since our main ice basin at SeaLab was heavily booked for other project, the Tower Basin was not mounted and tested until January 2011. The ice basin without the Tower Basin and the mounted Tower Basin during the first filling are seen in Figure A.8.1.A drawing showing the scaffolding/railing around the Tower Basin together with the ventilated hood and oil collecting system is shown in Figure A.8.2. The main components of the basin before the first experiment in March 2012 are shown in Figure A.8.3 and the principles of the experimental set-up for the Tower Basin are shown in Figure A.8.4. The main specifications of the Tower Basin are:
7. The tank is 6 meters high, 3 meters wide and holds 40 m3 of natural sea water. 8. The sea water is rinsed through high capacity sand filters and holds a stable and high purity. 9. All release rates of oil and gas are remotely controlled and both set points and real values
are logged on a central control system. 10. The tank has three remotely operated and programmable instrument platforms. The positions
of these are logged during operation (depth and axial position). 11. To insure proper HSE working conditions a scaffolding/railing around the tower and a
staircase to reach the top section is installed for inspection and sampling 12. A ventilated hood prevents light hydrocarbons to enter the laboratory hall. It is not necessary
for the operators to wear any breathing protection. 13. A overflow system to skim off surfacing oil from the top of the tower ensure safe and
efficient removal of surface oil. 14. A disposal system approved by the local environmental authorities is in place to take care of
the surface oil and the large volume of oil containing water. Especially the chemical enhanced dispersion experiments will create very small droplets with very long settling times.
The principal overview of the experimental set-up (Figure A.8.4) shows the main features of the Tower Basin. Oil, gas and dispersants can be delivered over a wide range of flow rates and internal ratios. Both oil and gas are delivered through mass controllers and both the set points and the obtained values are logged during an experiment. We have two pressurized tanks (30 bar) for delivering the oil (25 and 100 Liters). The system is operated and monitored from a central computer through a program written in NI LabView©. A screen dump of the settings and obtained values for flow rate (oil) is also given in Figure A.8.4. The log of the actual values obtained during the experiments is important for further analysis of the data. NB! This is a general text describing the capabilities of SINTEF Basin Tower and MiniTower. The resources allocated to a specific project (type of equipment, sampling frequency etc.) are scope dependent and described in the experimental plan of each project.

PROJECT NO. 102007986
REPORT NO. OC2017 A-090
VERSION Final
49 of 56
Figure A.8.1: Ice basin without propellers and other equipment used for circulation showing the
fundament for the Tower Basin (left) and the initial mounting of the Tower Basin in January 2011 (right).
Figure A.8.2: Principles for the scaffolding/railing around the tower, ventilated hood and overflow
system to collect surface oil from the top of the tower.

PROJECT NO. 102007986
REPORT NO. OC2017 A-090
VERSION Final
50 of 56
Figure A.8.3: The Tower Basin per March 2012 showing the scaffolding, staircase and the railings
to ensure safe working conditions and the ventilated hood.
Figure A.8.4: Principle overview of the experimental set-up showing how oil, gas (air) and dispersant will be released during a Tower Basin experiments (P: Pressure gauge, F: Flow controller). An example of the set point for oil flow rate (L/min) and the obtained values are also given. This is a screen dump from the operator's computer during an experiment.
200 litre reservoir
Heatedpressure
tank T
P
P F
Pressurised air
Heat exch.
Water heater
PF
Disp.

PROJECT NO. 102007986
REPORT NO. OC2017 A-090
VERSION Final
51 of 56
Figur A.8.5: Left: Adjustment of camera equipment and the Vitrino 3D current profiler with all
three instrument platforms in surface position. Right: All three instrument platforms lowered into the tank and ready to initiate an experiment. The squared release platform can be seen in the middle on the bottom of the tank.
B.1.1 Monitoring during the experiments This chapter contains the description of the different monitoring techniques used during the blow-out simulation experiments. The main monitoring is performed in the centre of the plume approximately 3 metres above the release point. A suit of instruments is mounted on a piston operated platform which is inserted into the plume. The platform is mounted on a slide on the inner wall of the basin and its vertical and radial position can be continuously adjusted, see Figure A.8.6. The instrument platform can continuously be lifted or lowered in the tank during an experiment to study variations in droplet size as a function of height. However, monitoring too close to the release could be difficult due to saturation of our instrumentation, especially the LISST instrument.
B.1.2 Droplet size distribution Since documentation of oil droplet size distribution is central in many projects, three different approaches can be used to measure droplet size distribution of the rising oil droplets (see Figure A.8.6). How many and which methods used depends on the scope of the specific projects.
1. LIST 100X Particle size analyzer (2 - 500 µm) 2. In-situ macro camera with a green laser focusing plane (5 - 2500 µm) 3. External particle Visual Microscope, Mettler Toledo PVM V819 (5 -1200 µm )
Figure A.8.6: The three systems for monitoring droplet size distribution shown during adjustment
over the water surface and submerged.
Macro camera and the paired green lasers
Water inlet hose for the Particle visual
microscope (PVM)
LIST 100X Lazer Droplet Sizer

PROJECT NO. 102007986
REPORT NO. OC2017 A-090
VERSION Final
52 of 56
The LISST-100X and the in-situ macro camera is operated inside the Tower Basin (Figure A.8.6) and can do measurement at different locations with respect to the oil plume. The external camera (PVM) is located outside the tank, but the water is collected from a hose located together with the LIST 100X (Figure A.8.6). Images from PVM and In-situ camera are used to generate droplet size distributions that are complementary to distributions from the LISST-100X, since they can detect larger droplets.
B.1.2.1 Water sampling Water samples can be taken in the same position in the tank as droplets sizes are measured. The water is sampled through a short flexible hose located on the moving sampling platform. The water samples can be analysed for (dependent on the scope of the projects):
a. Oil content (Total hydrocarbons – THC) b. Dispersant content (For dispersant experiments)
B.1.2.2 In-situ measurement of oil in water The overflow hose (no pumping) used for water sampling above can also be used for monitoring of oil-in-water content (droplets and dissolved components). This is done by ultraviolet fluorescence (UVF) with an UviLux flow-through cell. The water flows through this cell before being sampled.
B.1.2.3 Oil sampling The oil in the water samples taken from the plume can be analyzed for the following parameters:
a. Interfacial tension (when dispersants are applied). b. Surfactant content (a part of the C9500 solvent package a glycol ether (DPnB) is used as
reference, GC-MS analysis).
B.1.2.4 Video documentation Several video cameras are used to control and document the operation of the Tower Basin during an experiment (operational cameras). These cameras are used to monitor the following locations:
a. The release nozzle b. The use of injection tools for dispersant (wand, dispersant ring etc.)
The video footage from the operational cameras is stored as a part of the operational documentation, but is usually not used for further analysis. The video recordings used for documenting and analysing the droplet sizes are taken by four HD cameras (1280 x 960 pixels) at four different adjustable heights over the release point (for example 0, 0.5, 1 and 1.5 meters). An example of such video is given in Figure A.8.7. Close-up or macro still or video cameras are also used to study details regarding injection of dispersants, turbulence around release nozzle etc. (Figure A.8.8).

PROJECT NO. 102007986
REPORT NO. OC2017 A-090
VERSION Final
53 of 56
Figure A.8.7: An example of a composite video showing the four HD cameras covering the rising
oil flume at 0.5 m intervals over the release point. This is from earlier experiments with a North Sea crude (Oseberg blend).
Figure A.8.8: Close-up images (video) of release nozzle with options for injection dispersant
horizontally into the oil. A: Oil released alone, no dispersant, B: Dispersant injected.
B.1.3 General description of a Tower Basin experiment This section gives a general description of a Tower Basin experiment. A more specific procedure for operating the Tower Basin is found in our internal operational procedures (Laboratory procedure no: 507). This procedure is a part of SINTEF general QA system for laboratory activities.
A B

PROJECT NO. 102007986
REPORT NO. OC2017 A-090
VERSION Final
54 of 56
A short version of this procedure for a blow-out experiment in the Tower Basin is given below: a. Test filling, release and control equipment. b. Fill Tower Basin with sea water and check for leaks. c. Check background values (particle/oil concentration, droplet size distribution, temperature). d. Determine and program test conditions (oil type and rates of gas/oil). e. Check and confirm status on monitoring equipment. f. Prepare for experiment, perform background monitoring (approximately 3 meters above
release nozzle) g. Initiate experiment, start release of oil/gas/dispersant (dependent of experiment type) h. Monitoring of oil/gas/dispersant plume (0.5 - 3 min)
• Video cameras (4 cameras at three different heights) • Oil droplet size distribution (LISST-100X, particle visual microscope (PVM) and in-situ
macro camera/lasers). • UVF monitoring of oil content/dissolved components • Water and oil sampling, dependant on type of experiment.
i. Stop release j. Collection, initial quality control of monitoring data and storage of data. k. Settling of oil droplets and removal/skimming of surface oil l. Emptying/disposal of used water containing small oil droplet and dissolved oil components
according to lab. Procedure. m. Cleaning and control of equipment.
A typical Tower Basin experiment consist of two days of preparation (filling of water, filling of oil in the pressurized tank, testing of release and monitoring equipment etc.), one day for the actual experiment and two days for settling of oil droplets and cleaning of the tank and monitoring equipment, QA, storage and initial treatment of data, chemical analysis etc. .


Technology for a better society www.sintef.no


![[Shinobi] Claymore 090](https://img.pdfslide.us/doc/110x75/568c367a1a28ab02359831bd/shinobi-claymore-090.jpg)