Embed Size (px)
Citation preview
Ž .Chemical Geology 172 2001 277–290www.elsevier.comrlocaterchemgeo
Obtaining geologically meaningful 40Ar–39Ar agesfrom altered biotite
H.J. Roberts a,), S.P. Kelley a, P.S. Dahl b
a Department of Earth Sciences, The Open UniÕersity, Walton Hall, Milton Keynes MK7 6AA, UKb Department of Geology, Kent State UniÕersity, Kent, OH, USA
Received 8 June 1999; accepted 17 March 2000
Abstract
Biotite is the most used 40Ar–39Ar geochronometer yet two significant problems arise from Ar–Ar step-heating. Datingaltered biotite can be problematic, producing disturbed age spectra that reflect 39Ar recoil. However, unaltered biotite canyield disturbed ages with apparently meaningful plateau ages as a result of mineral breakdown during stepped heating.Obtaining meaningful ages from such spectra is very difficult. Because alteration of biotite is common and widespread innature, and because many biotites affected by alteration are nonetheless unique geologically andror representative of keylocalities, the capability to obtain reliable ages from altered material is extremely important. In this study, the effects ofalteration progress on biotite age spectra were tested using both IR laser step-heating and UV laser microprobe 40Ar–39Ardating techniques. Our aims were to extract geologically meaningful ages from altered biotite and to identify cases where theages had been influenced by alteration.
Three variably altered biotites from the Precambrian metamorphic terrain of southwestern Montana were selected forargon isotopic analysis. Sample A is an unaltered rock containing pristine biotite, sample B is a highly altered rock withchlorite and prehnite interlayers within biotite, and sample C contains biotite with only incipient alteration. For each sample,the biotite ages obtained with IR and UV laser techniques were compared and the validity of the apparent ages was assessed.
IR step-heating analysis of biotite from sample A yielded a well-defined plateau of 1776"6 Ma. UV laser microprobeanalysis of the same biotite yielded a concordant weighted mean age of 1771"8 Ma, based upon 65 spot analyses of eightgrains that ranged in age from 1819"54 to 1722"62 Ma. In contrast, IR step-heating of biotite from sample B resulted indisturbed spectra, with two separate fragments yielding total gas ages of 1505"12 and 1540"16 Ma, whereas UV lasermicroprobe analysis yielded 14 spot ages ranging from 1806"72 to 1565"78 Ma. UV laser analysis of sample C producedapparent ages ranging from 1772"52 to 1359"200 Ma.
Ž .Detailed analysis of age variations occurring perpendicular to 001 cleavage planes of biotite in sample B wasaccomplished by depth profiling using the UV laser microprobe. Depth profiling of single grains revealed considerable agevariation among the biotite layers, with profiles 1 and 2 yielding apparent ages ranging from 1730"226 to 1511"186 Ma,
) Corresponding author.Ž .E-mail address: [email protected] H.J. Roberts .
0009-2541r01r$ - see front matter q 2001 Elsevier Science B.V. All rights reserved.Ž .PII: S0009-2541 00 00255-2
( )H.J. Roberts et al.rChemical Geology 172 2001 277–290278
and from 1741"290 to 956"230 Ma, respectively. In both samples B and C, younger apparent ages correspond to higher36Arr39Ar ratios. The youngest ages, therefore, are believed to have derived from altered layers, whereas the oldest ages arerelated to layers with relatively little or no alteration.
In summary, incremental step-heating of altered biotite single grains yields 40Ar–39Ar age spectra that are compromisedby recoil and variable release patterns. However, extraction of small samples via the UV laser microprobe provides a simplerpattern of apparent ages, all younger than the AtrueB cooling age yet inversely correlated with atmospheric argon. This resultsuggests that true biotite ages can be recovered from areas of pristine material if they are sufficiently large to be ablated bythe UV laser. q 2001 Elsevier Science B.V. All rights reserved.
Keywords: 40Ar–39Ar geochronology; Alteration; Biotite; SW Montana; Precambrian
1. Introduction
Biotite is the mineral most commonly dated byK–Ar and 40Ar–39Ar geochronology. However, sec-ondary alteration of biotite to phases such as chloriteis a common and widespread occurrence in natureand has long been known to lead to a lowering of
Žbiotite ages Mitchell and Taka, 1984; Adams and.Kelley, 1998 . Although biotite ages disturbed by
later heating can yield plateaux, alteration andweathering of grains almost always correlates with40Ar–39Ar age spectra that are seriously disturbed. Itis desirable to identify apparent ages that are ad-versely influenced by alteration and to obtain mean-ingful biotite ages from all rocks regardless of condi-tion because many rocks are geologically uniqueandror representative of key localities. However,producing geologically meaningful ages from highlyaltered biotite using incremental step-heating is diffi-cult. Even those biotites which appear pristine in thinsection can yield variable plateaux and unexpected
Žapparent ages e.g., Lo and Onstott, 1989; Onstott et.al., 1991; Ruffet et al., 1991 . Indeed, it is likely that
the vast majority of natural biotites are altered tosome extent. Therefore, overcoming the effects ofsecondary alteration on biotite age is a problem ofuniversal importance in geochronology.
This study reports on the effects of chlorite andprehnite alteration on apparent biotite ages producedwith both IR step-heating and UV laser-microprobe40Ar–39Ar dating techniques. The results are sugges-tive of a useful new strategy for discriminating be-tween meaningless AdatesB in highly altered biotitesand geologically meaningful ages.
2. Sample selection and experimental methods
The rocks selected for analysis in this study arehigh-grade gneisses from the Ruby Range, a Precam-brian terrain in southwestern Montana, USA. Thetectonometamorphic setting of this terrain is sum-
Žmarised elsewhere e.g., Dahl et al., 1999; Mogk andHenry, 1988; Karasevich et al., 1981; Garihan, 1979;
.Dahl, 1979 , and is not repeated here. Previousgeochronology of Ruby Range phlogopites, biotites,
40 39 Ž .and hornblendes has yielded Ar– Ar near- plateauŽand total gas ages of ;1700 Ma e.g., Brady et al.,
.1991 . However, as the mica spectra were disturbed,the ;1700 Ma can be interpreted as only a mini-mum cooling age. In a subsequent study, Kovaric et
Ž .al. 1996 produced plateau ages of ;1720 Ma fortwo Ruby Range phlogopites and a hornblende, us-ing laser single-crystal fusion and furnace step-heat-ing techniques. Extensive 40Ar–39Ar UV laser datingof biotite from across the Ruby Range by RobertsŽ .1999 yielded biotite ages between 1780 and 1740Ma.
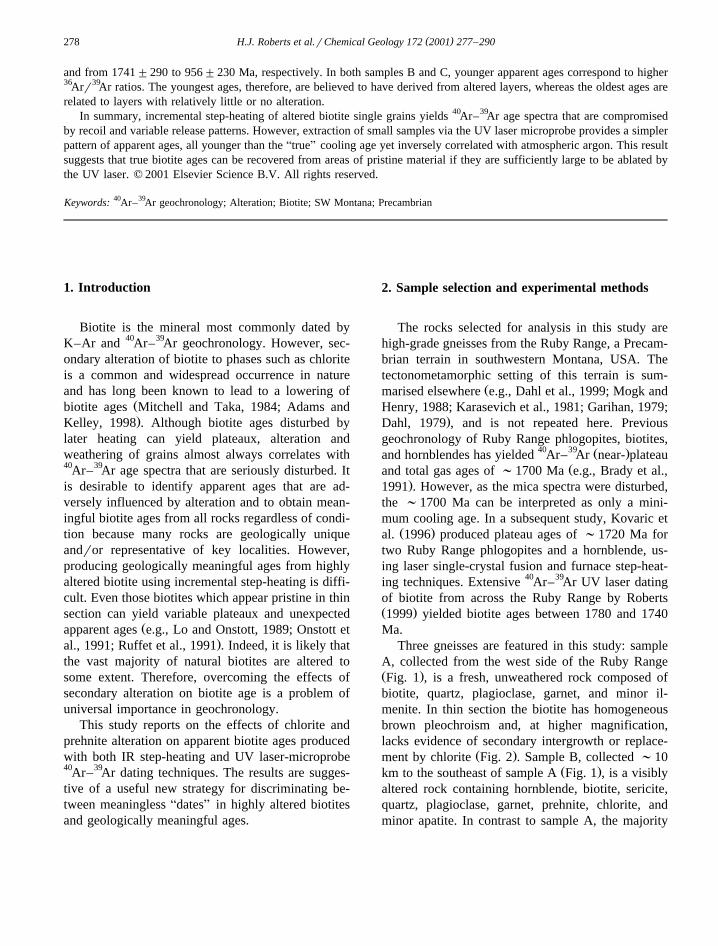
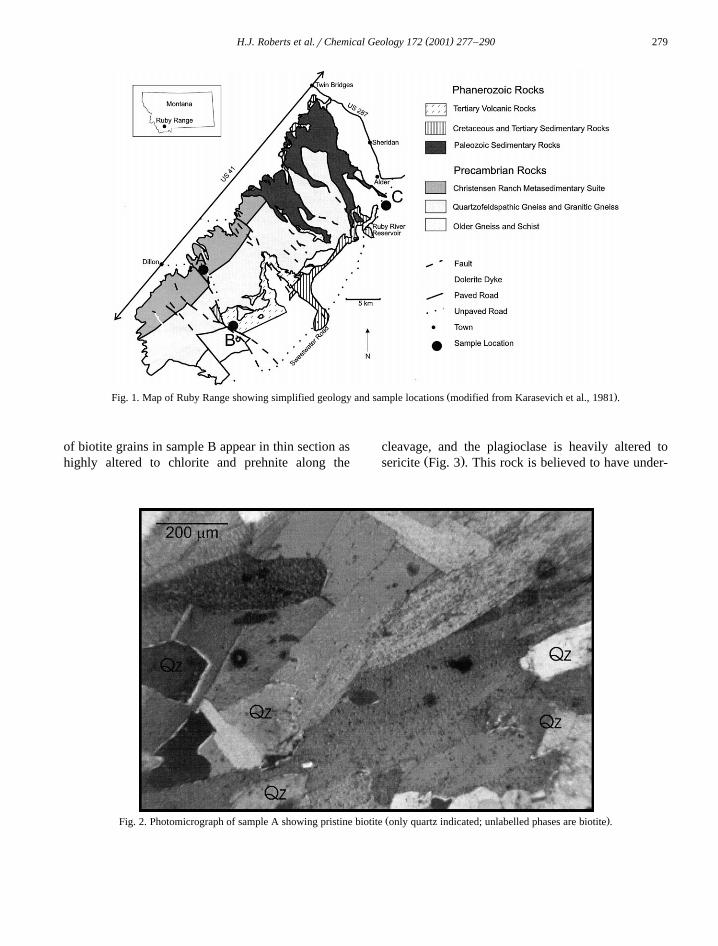
Three gneisses are featured in this study: sampleA, collected from the west side of the Ruby RangeŽ .Fig. 1 , is a fresh, unweathered rock composed ofbiotite, quartz, plagioclase, garnet, and minor il-menite. In thin section the biotite has homogeneousbrown pleochroism and, at higher magnification,lacks evidence of secondary intergrowth or replace-
Ž .ment by chlorite Fig. 2 . Sample B, collected ;10Ž .km to the southeast of sample A Fig. 1 , is a visibly
altered rock containing hornblende, biotite, sericite,quartz, plagioclase, garnet, prehnite, chlorite, andminor apatite. In contrast to sample A, the majority
( )H.J. Roberts et al.rChemical Geology 172 2001 277–290 279
Ž .Fig. 1. Map of Ruby Range showing simplified geology and sample locations modified from Karasevich et al., 1981 .
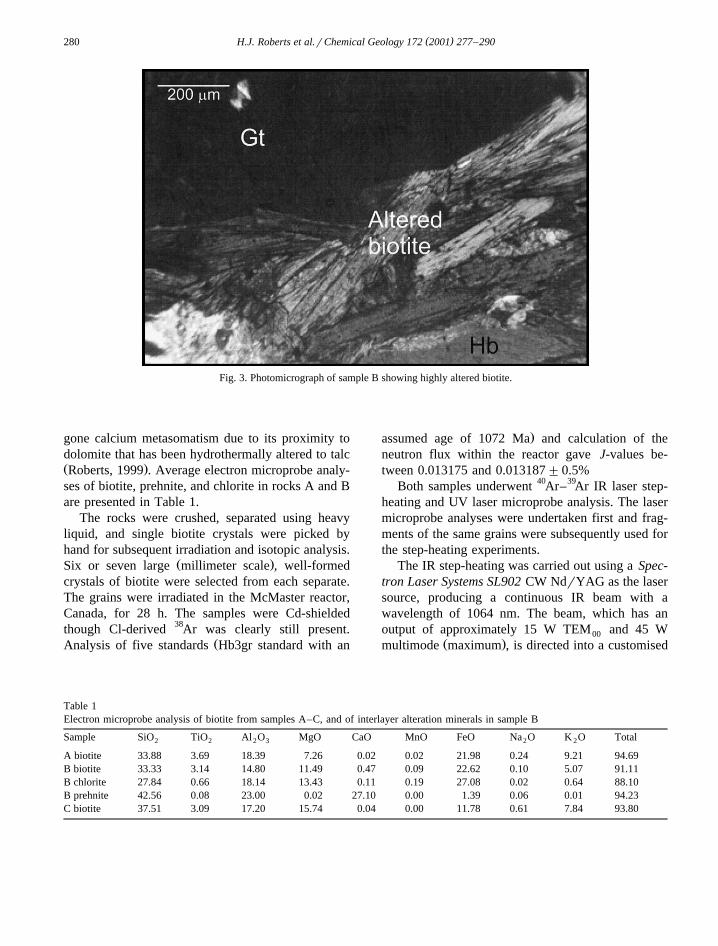
of biotite grains in sample B appear in thin section ashighly altered to chlorite and prehnite along the
cleavage, and the plagioclase is heavily altered toŽ .sericite Fig. 3 . This rock is believed to have under-
Ž .Fig. 2. Photomicrograph of sample A showing pristine biotite only quartz indicated; unlabelled phases are biotite .
( )H.J. Roberts et al.rChemical Geology 172 2001 277–290280
Fig. 3. Photomicrograph of sample B showing highly altered biotite.
gone calcium metasomatism due to its proximity todolomite that has been hydrothermally altered to talcŽ .Roberts, 1999 . Average electron microprobe analy-ses of biotite, prehnite, and chlorite in rocks A and Bare presented in Table 1.
The rocks were crushed, separated using heavyliquid, and single biotite crystals were picked byhand for subsequent irradiation and isotopic analysis.
Ž .Six or seven large millimeter scale , well-formedcrystals of biotite were selected from each separate.The grains were irradiated in the McMaster reactor,Canada, for 28 h. The samples were Cd-shieldedthough Cl-derived 38Ar was clearly still present.
ŽAnalysis of five standards Hb3gr standard with an
.assumed age of 1072 Ma and calculation of theneutron flux within the reactor gave J-values be-tween 0.013175 and 0.013187"0.5%
Both samples underwent 40Ar–39Ar IR laser step-heating and UV laser microprobe analysis. The lasermicroprobe analyses were undertaken first and frag-ments of the same grains were subsequently used forthe step-heating experiments.
The IR step-heating was carried out using a Spec-tron Laser Systems SL902 CW NdrYAG as the lasersource, producing a continuous IR beam with awavelength of 1064 nm. The beam, which has anoutput of approximately 15 W TEM and 45 W00
Ž .multimode maximum , is directed into a customised
Table 1Electron microprobe analysis of biotite from samples A–C, and of interlayer alteration minerals in sample B
Sample SiO TiO Al O MgO CaO MnO FeO Na O K O Total2 2 2 3 2 2
A biotite 33.88 3.69 18.39 7.26 0.02 0.02 21.98 0.24 9.21 94.69B biotite 33.33 3.14 14.80 11.49 0.47 0.09 22.62 0.10 5.07 91.11B chlorite 27.84 0.66 18.14 13.43 0.11 0.19 27.08 0.02 0.64 88.10B prehnite 42.56 0.08 23.00 0.02 27.10 0.00 1.39 0.06 0.01 94.23C biotite 37.51 3.09 17.20 15.74 0.04 0.00 11.78 0.61 7.84 93.80
( )H.J. Roberts et al.rChemical Geology 172 2001 277–290 281
Leica Metallux 3 microscope using high reflectance,oxide coated mirrors. Focusing of the beam at thesample surface via the objective lens enabled a spotsize of between 25 and 100 mm. The sample wasobserved using a CCD camera, coaxial with the laserbeam. The grain was gently and evenly heated usinga defocused laser beam over a number of steps,increasing the beam intensity with each step.
Due to the high concentrations of argon accumu-lated within Precambrian biotite, only small frag-ments of the grains analysed by UV laser microprobewere used for the IR laser step-heating experiment.Heating began with steps that caused little visiblealteration to the grain. For sample A, the experimentwas stopped when the fragment surface began tomelt, indicated by the formation of bubbles, and thedata were processed at this point. This was a largefragment that contained a considerable volume ofgas and would have taken several days to analyseuntil all the gas was released. However, because thedata showed that a plateau had already been reached,the experiment was not continued beyond the 14steps for which data is presented in Table 1. Sincethe biotite fragments from sample B were smallerthan those from sample A and contained less gas, theexperiment on sample B was continued until thefragments were completely melted and little gas was
Žreleased upon additional heating. Two fragments 1.and 2 of sample B biotite were analysed. Fragments
1 and 2 underwent 13 and 19 incremental-heatingsteps, respectively.
The UV laser microprobe analysis was carried outusing a Spectron Laser Systems SL401 as the sourceof UV radiation for sample ablation. At its source the
Ž .laser has a wavelength of 1064 nm IR . This fre-quency is doubled by the first KD) P crystal to 532nm and doubled again by the second crystal to a
Ž .resultant wavelength of 266 nm UV . The wave-lengths are separated using a Pellin Brocca prism.Typical UV laser pulses have energies of ;1mJrpulse, for a pulse length of 10 ns and repetitionrate of 10 Hz. The beam is directed into a cus-tomised Leica DM microscope by high-reflectanceoxide-coated mirrors. Inside the microscope the beamis redirected through a UV-refracting objective lensand focused to a spot size of ;10 mm at the samplesurface. The sample is observed using a CCD cam-era, coaxial with the laser beam.
A computer-controlled XY stage was used tomove the sample beneath the laser beam. Stagemovement can be programmed to cover the area ofinterest and can be activated when the laser isswitched on. These capabilities give the analyst pre-cise control over the area to be ablated. For themajority of analyses a 50 mm square was ablated.The laser beam was rastered over the same areaseven to nine times within the 10-min analysis time.
Detailed age variation across the cleavage planesŽ .of single biotite grains sample B was characterised
by repeated depth-profiling of basal sections. Eachanalysis consisted of a 150 mm square ablated onceonly within the 10-min analysis time. Successiveanalyses were performed over the previously ablatedsquare. Each ablation step removed only a thin layerof material. Although 39Ar release has been used to
Žcalculate pit depth in K-feldspar experiments Arnaud.and Kelley, 1997 , it is impossible to back-calculate
the exact amount of material removed with eachablation step in biotite from sample B, using theamount of 39Ar released alone. This is because alter-ation along the cleavage can result in potassium-de-pleted material being ablated during the depth pro-file. However, the maximum 39Ar released, for agiven analysis, yields an estimate of ;1 mm depthof ablation with each analysis.
The gases released were cleaned using two SAESŽAP 10 getters one at 4008C and one at room temper-
.ature . Each sample run was 10 min and the gasesaccumulated were equilibrated into the mass spec-trometer via computer controlled VAT valves oper-ated by compressed air. The extracted argon wasmeasured in a MAP 215-50 noble gas mass spec-trometer using a Balzers 219 electron multiplierdetector. Argon isotope peaks between 35 and 41were scanned 10 times and the amounts extrapolatedback to the inlet time. Blanks were measured afterevery two samples and an overall mean for a day’sblanks were used to correct the sample analyses.
3. Results
3.1. IR step-heating
Incremental-release step-heating of biotite in sam-ple A yielded a well-defined plateau corresponding
( )H.J. Roberts et al.rChemical Geology 172 2001 277–290282
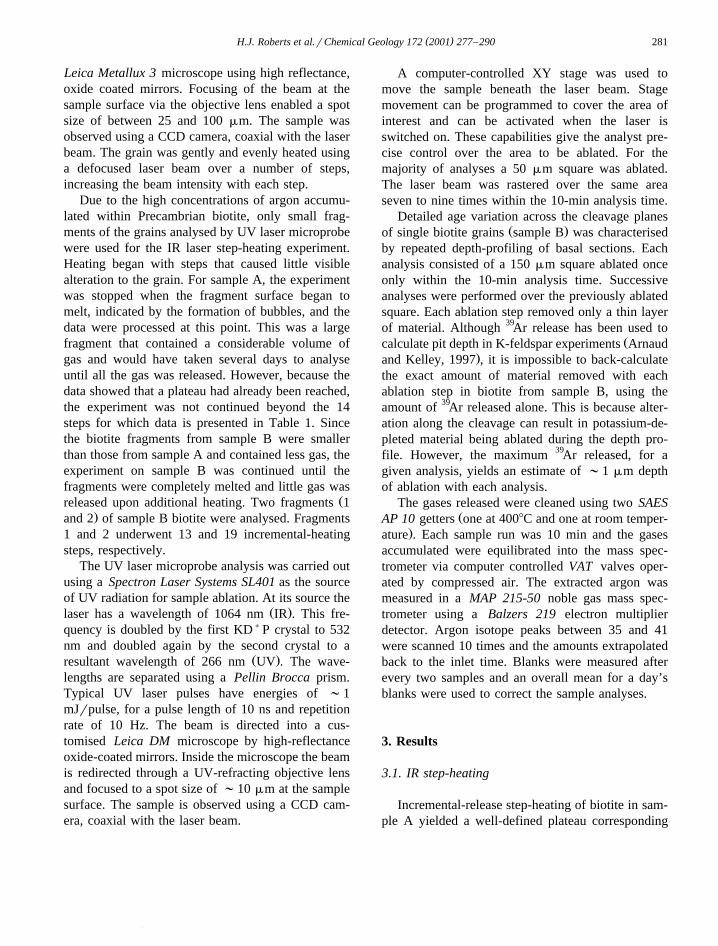
Ž .to an age of 1776"6 Ma Fig. 4A, Table 2 . In fact,only 5–10% of the total gas within the fragment wasreleased during the experiment, which representsonly the very beginning of the total spectrum. Clearlythere is little spectral disruption, as would be ex-pected from a pristine grain.
In contrast, spectra for the two biotite fragmentsfrom sample B both show argon loss at low tempera-ture steps, indicating the release of argon from weakly
Ž .bonded sites Fig. 4B and C . Both reach noisyplateaux between 2134"428 and 1760"20 Ma.Since K–Ar biotite ages have been used routinely todate Precambrian terrains worldwide, it is instructiveto see how such slight alteration affects K–Ar re-sults. Total gas ages for biotite fragments 1 and 2 ofsample B are 1505"12 and 1540"16 Ma, respec-
Ž .tively Fig. 4B and C, Table 2 .
3.2. UV microprobe analysis
One of the difficulties in working with the UVdata is the small gas volumes produced. In any studyof this sort, the analyst walks a fine line betweenablating sufficient material to gain a high enoughsignal-to-noise ratio and removing small amounts ofmaterial to pick up the increasingly small-scale oscil-lations present in the mineral itself. The difficulty ishighlighted by the large analytical errors presentedby the spot analyses, especially in the altered grains.
A total of 65 spots were analysed in eight grainsof biotite from sample A. Spot ages ranged from1819"54 to 1715"34 Ma, corresponding to a
Ž .weighted mean of 1771"8 Ma Table 3 . A total ofŽ .14 analyses eight from grain 1 alone were carried
Ž .out on relatively altered biotite from sample B.Spot ages for grain 1 ranged from 1697"56 to1565"78 Ma, whereas the other six ages ranged
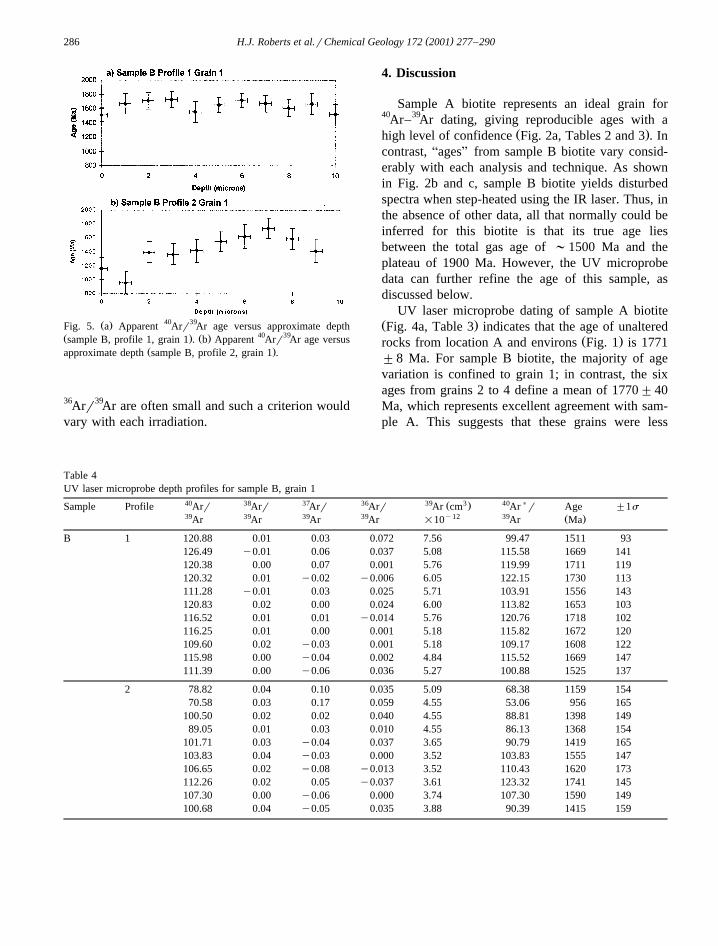
Ž .from 1806"72 to 1740"96 Ma Table 3 .Two age–depth profiles were produced for sam-
Ž .ple B grain 1 , as shown in Fig. 5. Because of thesmall amount of material ablated in each analysis ofthe depth profile, the errors associated with thesedates are relatively high in comparison to the spotsin the same sample. However, both profiles revealsignificant age variation with depth. Apparent agesof biotite layers range from 1730"226 to 1511"
Ž .186 Ma profile 1 and from 1741"290 to 956"230
Ž . Ž . Ž .Fig. 4. A Step-heating spectrum for biotite sample A . BŽ . Ž .Step-heating spectrum for biotite sample B, fragment 1 . C
Ž .Step-heating spectrum for biotite sample B, fragment 2 .
Ž .Ma profile 2 , as indicated in Fig. 5a–b and Table4. These two profiles demonstrate how chlorite varia-tions within individual grains can produce variableprofiles. Fig. 5a shows little variation, whereas Fig.5b shows considerable variation.
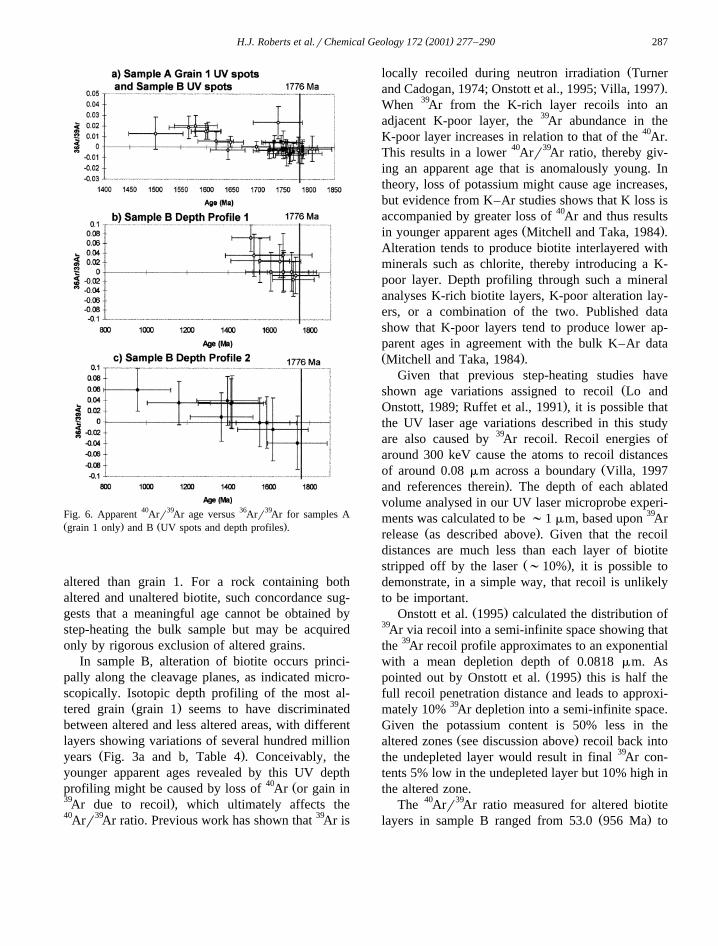
In order to investigate potential relationshipsamong apparent age, biotite composition, androratmospheric content, the ratios of 38Arr39Ar, 37Arr39
Ar and 36Arr39Ar were calculated for all the dataŽ . 36 39from both samples Tables 2–4 . The Arr Ar ra-
tios were plotted against 40Arr39Ar age as shown inFig. 6a, b, and c. Fig. 6a–c consistently show strongcorrelation between the 36Arr39Ar ratio and apparentage, with the younger apparent ages corresponding tothe higher 36Arr39Ar ratios. The 36Arr39Ar ratios for
Žaltered sample B range from y0.006 to 0.072 Table.4 , whereas in unaltered sample A the ratios only
Ž .range from y0.008 to 0.023 Table 3 ; similarly,samples B and A exhibit maximum atmosphericargon of 25% and 5%, respectively. These trends
( )H.J. Roberts et al.rChemical Geology 172 2001 277–290 283
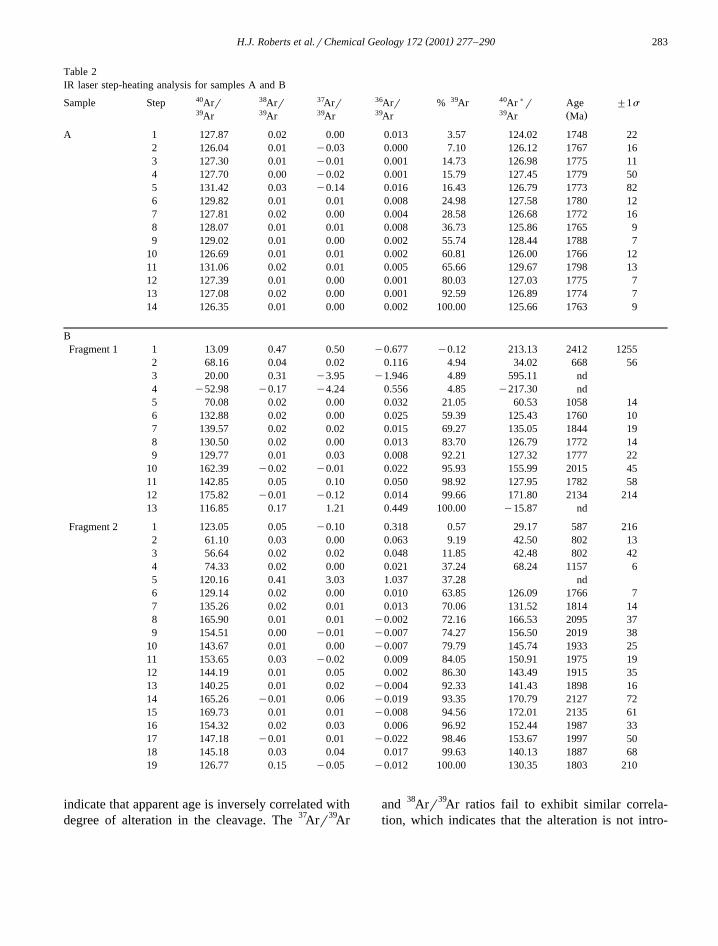
Table 2IR laser step-heating analysis for samples A and B
40 38 37 36 39 40 )Sample Step Arr Arr Arr Arr % Ar Ar r Age "1s39 39 39 39 39 Ž .Ar Ar Ar Ar Ar Ma
A 1 127.87 0.02 0.00 0.013 3.57 124.02 1748 222 126.04 0.01 y0.03 0.000 7.10 126.12 1767 163 127.30 0.01 y0.01 0.001 14.73 126.98 1775 114 127.70 0.00 y0.02 0.001 15.79 127.45 1779 505 131.42 0.03 y0.14 0.016 16.43 126.79 1773 826 129.82 0.01 0.01 0.008 24.98 127.58 1780 127 127.81 0.02 0.00 0.004 28.58 126.68 1772 168 128.07 0.01 0.01 0.008 36.73 125.86 1765 99 129.02 0.01 0.00 0.002 55.74 128.44 1788 7
10 126.69 0.01 0.01 0.002 60.81 126.00 1766 1211 131.06 0.02 0.01 0.005 65.66 129.67 1798 1312 127.39 0.01 0.00 0.001 80.03 127.03 1775 713 127.08 0.02 0.00 0.001 92.59 126.89 1774 714 126.35 0.01 0.00 0.002 100.00 125.66 1763 9
BFragment 1 1 13.09 0.47 0.50 y0.677 y0.12 213.13 2412 1255
2 68.16 0.04 0.02 0.116 4.94 34.02 668 563 20.00 0.31 y3.95 y1.946 4.89 595.11 nd4 y52.98 y0.17 y4.24 0.556 4.85 y217.30 nd5 70.08 0.02 0.00 0.032 21.05 60.53 1058 146 132.88 0.02 0.00 0.025 59.39 125.43 1760 107 139.57 0.02 0.02 0.015 69.27 135.05 1844 198 130.50 0.02 0.00 0.013 83.70 126.79 1772 149 129.77 0.01 0.03 0.008 92.21 127.32 1777 22
10 162.39 y0.02 y0.01 0.022 95.93 155.99 2015 4511 142.85 0.05 0.10 0.050 98.92 127.95 1782 5812 175.82 y0.01 y0.12 0.014 99.66 171.80 2134 21413 116.85 0.17 1.21 0.449 100.00 y15.87 nd
Fragment 2 1 123.05 0.05 y0.10 0.318 0.57 29.17 587 2162 61.10 0.03 0.00 0.063 9.19 42.50 802 133 56.64 0.02 0.02 0.048 11.85 42.48 802 424 74.33 0.02 0.00 0.021 37.24 68.24 1157 65 120.16 0.41 3.03 1.037 37.28 nd6 129.14 0.02 0.00 0.010 63.85 126.09 1766 77 135.26 0.02 0.01 0.013 70.06 131.52 1814 148 165.90 0.01 0.01 y0.002 72.16 166.53 2095 379 154.51 0.00 y0.01 y0.007 74.27 156.50 2019 38
10 143.67 0.01 0.00 y0.007 79.79 145.74 1933 2511 153.65 0.03 y0.02 0.009 84.05 150.91 1975 1912 144.19 0.01 0.05 0.002 86.30 143.49 1915 3513 140.25 0.01 0.02 y0.004 92.33 141.43 1898 1614 165.26 y0.01 0.06 y0.019 93.35 170.79 2127 7215 169.73 0.01 0.01 y0.008 94.56 172.01 2135 6116 154.32 0.02 0.03 0.006 96.92 152.44 1987 3317 147.18 y0.01 0.01 y0.022 98.46 153.67 1997 5018 145.18 0.03 0.04 0.017 99.63 140.13 1887 6819 126.77 0.15 y0.05 y0.012 100.00 130.35 1803 210
indicate that apparent age is inversely correlated withdegree of alteration in the cleavage. The 37Arr39Ar
and 38Arr39Ar ratios fail to exhibit similar correla-tion, which indicates that the alteration is not intro-
( )H.J. Roberts et al.rChemical Geology 172 2001 277–290284
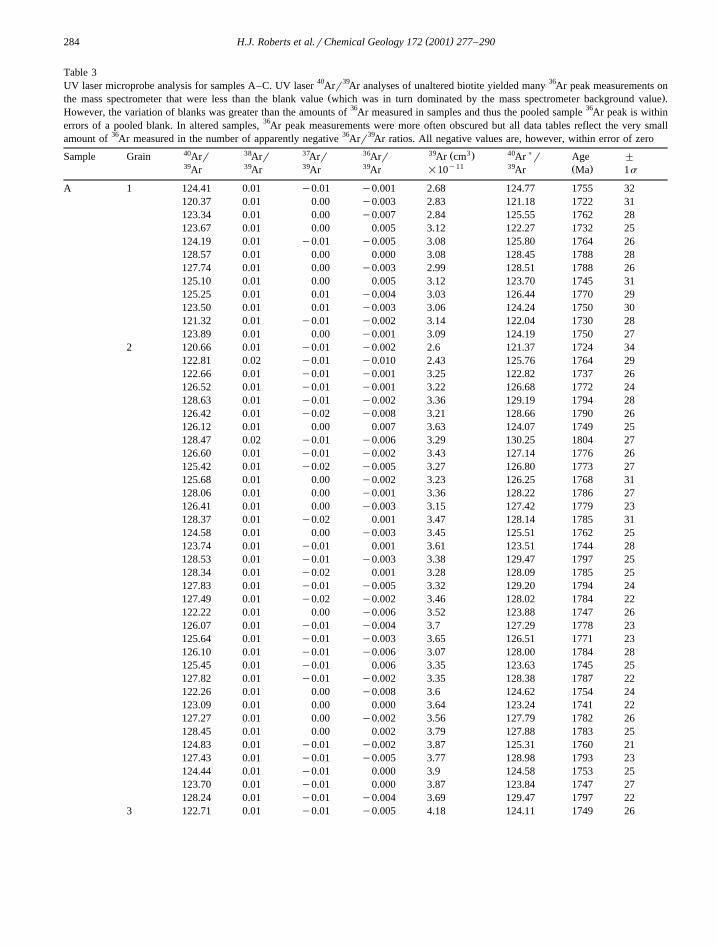
Table 3UV laser microprobe analysis for samples A–C. UV laser 40Arr39Ar analyses of unaltered biotite yielded many 36Ar peak measurements on
Ž .the mass spectrometer that were less than the blank value which was in turn dominated by the mass spectrometer background value .However, the variation of blanks was greater than the amounts of 36Ar measured in samples and thus the pooled sample 36Ar peak is withinerrors of a pooled blank. In altered samples, 36Ar peak measurements were more often obscured but all data tables reflect the very smallamount of 36Ar measured in the number of apparently negative 36Arr39Ar ratios. All negative values are, however, within error of zero
40 38 37 36 39 3 40 )Ž .Sample Grain Arr Arr Arr Arr Ar cm Ar r Age "39 39 39 39 y11 39 Ž .Ar Ar Ar Ar =10 Ar Ma 1s
A 1 124.41 0.01 y0.01 y0.001 2.68 124.77 1755 32120.37 0.01 0.00 y0.003 2.83 121.18 1722 31123.34 0.01 0.00 y0.007 2.84 125.55 1762 28123.67 0.01 0.00 0.005 3.12 122.27 1732 25124.19 0.01 y0.01 y0.005 3.08 125.80 1764 26128.57 0.01 0.00 0.000 3.08 128.45 1788 28127.74 0.01 0.00 y0.003 2.99 128.51 1788 26125.10 0.01 0.00 0.005 3.12 123.70 1745 31125.25 0.01 0.01 y0.004 3.03 126.44 1770 29123.50 0.01 0.01 y0.003 3.06 124.24 1750 30121.32 0.01 y0.01 y0.002 3.14 122.04 1730 28123.89 0.01 0.00 y0.001 3.09 124.19 1750 27
2 120.66 0.01 y0.01 y0.002 2.6 121.37 1724 34122.81 0.02 y0.01 y0.010 2.43 125.76 1764 29122.66 0.01 y0.01 y0.001 3.25 122.82 1737 26126.52 0.01 y0.01 y0.001 3.22 126.68 1772 24128.63 0.01 y0.01 y0.002 3.36 129.19 1794 28126.42 0.01 y0.02 y0.008 3.21 128.66 1790 26126.12 0.01 0.00 0.007 3.63 124.07 1749 25128.47 0.02 y0.01 y0.006 3.29 130.25 1804 27126.60 0.01 y0.01 y0.002 3.43 127.14 1776 26125.42 0.01 y0.02 y0.005 3.27 126.80 1773 27125.68 0.01 0.00 y0.002 3.23 126.25 1768 31128.06 0.01 0.00 y0.001 3.36 128.22 1786 27126.41 0.01 0.00 y0.003 3.15 127.42 1779 23128.37 0.01 y0.02 0.001 3.47 128.14 1785 31124.58 0.01 0.00 y0.003 3.45 125.51 1762 25123.74 0.01 y0.01 0.001 3.61 123.51 1744 28128.53 0.01 y0.01 y0.003 3.38 129.47 1797 25128.34 0.01 y0.02 0.001 3.28 128.09 1785 25127.83 0.01 y0.01 y0.005 3.32 129.20 1794 24127.49 0.01 y0.02 y0.002 3.46 128.02 1784 22122.22 0.01 0.00 y0.006 3.52 123.88 1747 26126.07 0.01 y0.01 y0.004 3.7 127.29 1778 23125.64 0.01 y0.01 y0.003 3.65 126.51 1771 23126.10 0.01 y0.01 y0.006 3.07 128.00 1784 28125.45 0.01 y0.01 0.006 3.35 123.63 1745 25127.82 0.01 y0.01 y0.002 3.35 128.38 1787 22122.26 0.01 0.00 y0.008 3.6 124.62 1754 24123.09 0.01 0.00 0.000 3.64 123.24 1741 22127.27 0.01 0.00 y0.002 3.56 127.79 1782 26128.45 0.01 0.00 0.002 3.79 127.88 1783 25124.83 0.01 y0.01 y0.002 3.87 125.31 1760 21127.43 0.01 y0.01 y0.005 3.77 128.98 1793 23124.44 0.01 y0.01 0.000 3.9 124.58 1753 25123.70 0.01 y0.01 0.000 3.87 123.84 1747 27128.24 0.01 y0.01 y0.004 3.69 129.47 1797 22
3 122.71 0.01 y0.01 y0.005 4.18 124.11 1749 26
( )H.J. Roberts et al.rChemical Geology 172 2001 277–290 285
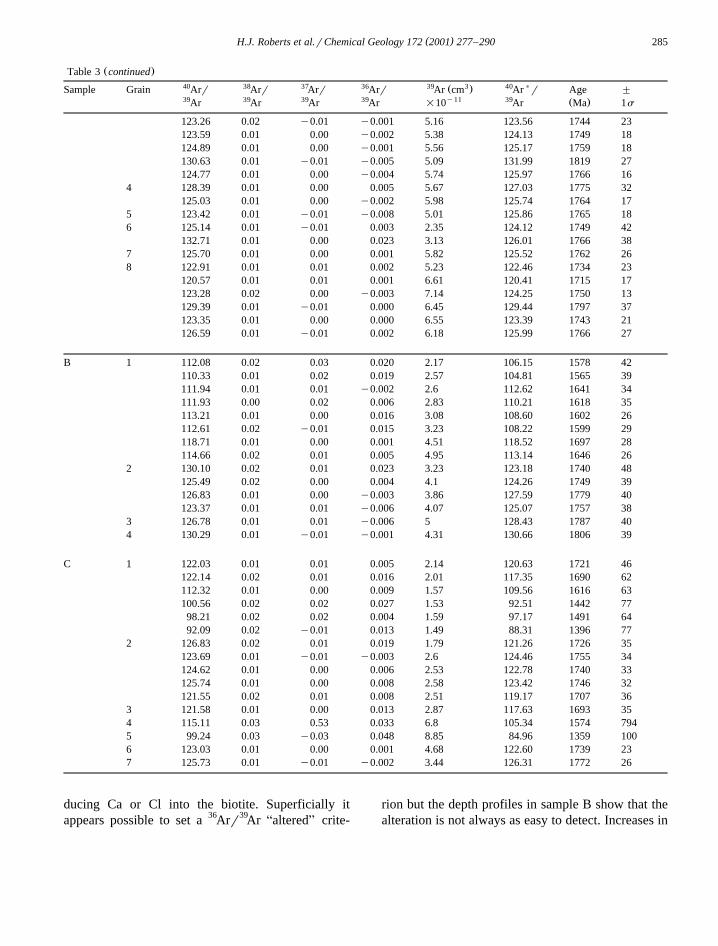
Ž .Table 3 continued40 38 37 36 39 3 40 )Ž .Sample Grain Arr Arr Arr Arr Ar cm Ar r Age "39 39 39 39 y11 39 Ž .Ar Ar Ar Ar =10 Ar Ma 1s
123.26 0.02 y0.01 y0.001 5.16 123.56 1744 23123.59 0.01 0.00 y0.002 5.38 124.13 1749 18124.89 0.01 0.00 y0.001 5.56 125.17 1759 18130.63 0.01 y0.01 y0.005 5.09 131.99 1819 27124.77 0.01 0.00 y0.004 5.74 125.97 1766 16
4 128.39 0.01 0.00 0.005 5.67 127.03 1775 32125.03 0.01 0.00 y0.002 5.98 125.74 1764 17
5 123.42 0.01 y0.01 y0.008 5.01 125.86 1765 186 125.14 0.01 y0.01 0.003 2.35 124.12 1749 42
132.71 0.01 0.00 0.023 3.13 126.01 1766 387 125.70 0.01 0.00 0.001 5.82 125.52 1762 268 122.91 0.01 0.01 0.002 5.23 122.46 1734 23
120.57 0.01 0.01 0.001 6.61 120.41 1715 17123.28 0.02 0.00 y0.003 7.14 124.25 1750 13129.39 0.01 y0.01 0.000 6.45 129.44 1797 37123.35 0.01 0.00 0.000 6.55 123.39 1743 21126.59 0.01 y0.01 0.002 6.18 125.99 1766 27
B 1 112.08 0.02 0.03 0.020 2.17 106.15 1578 42110.33 0.01 0.02 0.019 2.57 104.81 1565 39111.94 0.01 0.01 y0.002 2.6 112.62 1641 34111.93 0.00 0.02 0.006 2.83 110.21 1618 35113.21 0.01 0.00 0.016 3.08 108.60 1602 26112.61 0.02 y0.01 0.015 3.23 108.22 1599 29118.71 0.01 0.00 0.001 4.51 118.52 1697 28114.66 0.02 0.01 0.005 4.95 113.14 1646 26
2 130.10 0.02 0.01 0.023 3.23 123.18 1740 48125.49 0.02 0.00 0.004 4.1 124.26 1749 39126.83 0.01 0.00 y0.003 3.86 127.59 1779 40123.37 0.01 0.01 y0.006 4.07 125.07 1757 38
3 126.78 0.01 0.01 y0.006 5 128.43 1787 404 130.29 0.01 y0.01 y0.001 4.31 130.66 1806 39
C 1 122.03 0.01 0.01 0.005 2.14 120.63 1721 46122.14 0.02 0.01 0.016 2.01 117.35 1690 62112.32 0.01 0.00 0.009 1.57 109.56 1616 63100.56 0.02 0.02 0.027 1.53 92.51 1442 7798.21 0.02 0.02 0.004 1.59 97.17 1491 6492.09 0.02 y0.01 0.013 1.49 88.31 1396 77
2 126.83 0.02 0.01 0.019 1.79 121.26 1726 35123.69 0.01 y0.01 y0.003 2.6 124.46 1755 34124.62 0.01 0.00 0.006 2.53 122.78 1740 33125.74 0.01 0.00 0.008 2.58 123.42 1746 32121.55 0.02 0.01 0.008 2.51 119.17 1707 36
3 121.58 0.01 0.00 0.013 2.87 117.63 1693 354 115.11 0.03 0.53 0.033 6.8 105.34 1574 7945 99.24 0.03 y0.03 0.048 8.85 84.96 1359 1006 123.03 0.01 0.00 0.001 4.68 122.60 1739 237 125.73 0.01 y0.01 y0.002 3.44 126.31 1772 26
ducing Ca or Cl into the biotite. Superficially itappears possible to set a 36Arr39Ar AalteredB crite-
rion but the depth profiles in sample B show that thealteration is not always as easy to detect. Increases in
( )H.J. Roberts et al.rChemical Geology 172 2001 277–290286
Ž . 40 39Fig. 5. a Apparent Arr Ar age versus approximate depthŽ . Ž . 40 39sample B, profile 1, grain 1 . b Apparent Arr Ar age versus
Ž .approximate depth sample B, profile 2, grain 1 .
36Arr39Ar are often small and such a criterion wouldvary with each irradiation.
4. Discussion
Sample A biotite represents an ideal grain for40Ar–39Ar dating, giving reproducible ages with a
Ž .high level of confidence Fig. 2a, Tables 2 and 3 . Incontrast, AagesB from sample B biotite vary consid-erably with each analysis and technique. As shownin Fig. 2b and c, sample B biotite yields disturbedspectra when step-heated using the IR laser. Thus, inthe absence of other data, all that normally could beinferred for this biotite is that its true age liesbetween the total gas age of ;1500 Ma and theplateau of 1900 Ma. However, the UV microprobedata can further refine the age of this sample, asdiscussed below.
UV laser microprobe dating of sample A biotiteŽ .Fig. 4a, Table 3 indicates that the age of unaltered
Ž .rocks from location A and environs Fig. 1 is 1771"8 Ma. For sample B biotite, the majority of agevariation is confined to grain 1; in contrast, the sixages from grains 2 to 4 define a mean of 1770"40Ma, which represents excellent agreement with sam-ple A. This suggests that these grains were less
Table 4UV laser microprobe depth profiles for sample B, grain 1
40 38 37 36 39 3 40 )Ž .Sample Profile Arr Arr Arr Arr Ar cm Ar r Age "1s39 39 39 39 y12 39 Ž .Ar Ar Ar Ar =10 Ar Ma
B 1 120.88 0.01 0.03 0.072 7.56 99.47 1511 93126.49 y0.01 0.06 0.037 5.08 115.58 1669 141120.38 0.00 0.07 0.001 5.76 119.99 1711 119120.32 0.01 y0.02 y0.006 6.05 122.15 1730 113111.28 y0.01 0.03 0.025 5.71 103.91 1556 143120.83 0.02 0.00 0.024 6.00 113.82 1653 103116.52 0.01 0.01 y0.014 5.76 120.76 1718 102116.25 0.01 0.00 0.001 5.18 115.82 1672 120109.60 0.02 y0.03 0.001 5.18 109.17 1608 122115.98 0.00 y0.04 0.002 4.84 115.52 1669 147111.39 0.00 y0.06 0.036 5.27 100.88 1525 137
2 78.82 0.04 0.10 0.035 5.09 68.38 1159 15470.58 0.03 0.17 0.059 4.55 53.06 956 165
100.50 0.02 0.02 0.040 4.55 88.81 1398 14989.05 0.01 0.03 0.010 4.55 86.13 1368 154
101.71 0.03 y0.04 0.037 3.65 90.79 1419 165103.83 0.04 y0.03 0.000 3.52 103.83 1555 147106.65 0.02 y0.08 y0.013 3.52 110.43 1620 173112.26 0.02 0.05 y0.037 3.61 123.32 1741 145107.30 0.00 y0.06 0.000 3.74 107.30 1590 149100.68 0.04 y0.05 0.035 3.88 90.39 1415 159
( )H.J. Roberts et al.rChemical Geology 172 2001 277–290 287
Fig. 6. Apparent 40Arr39Ar age versus 36Arr39Ar for samples AŽ . Ž .grain 1 only and B UV spots and depth profiles .
altered than grain 1. For a rock containing bothaltered and unaltered biotite, such concordance sug-gests that a meaningful age cannot be obtained bystep-heating the bulk sample but may be acquiredonly by rigorous exclusion of altered grains.
In sample B, alteration of biotite occurs princi-pally along the cleavage planes, as indicated micro-scopically. Isotopic depth profiling of the most al-
Ž .tered grain grain 1 seems to have discriminatedbetween altered and less altered areas, with differentlayers showing variations of several hundred million
Ž .years Fig. 3a and b, Table 4 . Conceivably, theyounger apparent ages revealed by this UV depth
40 Žprofiling might be caused by loss of Ar or gain in39 .Ar due to recoil , which ultimately affects the40Arr39Ar ratio. Previous work has shown that 39Ar is
Žlocally recoiled during neutron irradiation Turner.and Cadogan, 1974; Onstott et al., 1995; Villa, 1997 .
When 39Ar from the K-rich layer recoils into anadjacent K-poor layer, the 39Ar abundance in theK-poor layer increases in relation to that of the 40Ar.This results in a lower 40Arr39Ar ratio, thereby giv-ing an apparent age that is anomalously young. Intheory, loss of potassium might cause age increases,but evidence from K–Ar studies shows that K loss isaccompanied by greater loss of 40Ar and thus results
Ž .in younger apparent ages Mitchell and Taka, 1984 .Alteration tends to produce biotite interlayered withminerals such as chlorite, thereby introducing a K-poor layer. Depth profiling through such a mineralanalyses K-rich biotite layers, K-poor alteration lay-ers, or a combination of the two. Published datashow that K-poor layers tend to produce lower ap-parent ages in agreement with the bulk K–Ar dataŽ .Mitchell and Taka, 1984 .
Given that previous step-heating studies haveŽshown age variations assigned to recoil Lo and
.Onstott, 1989; Ruffet et al., 1991 , it is possible thatthe UV laser age variations described in this studyare also caused by 39Ar recoil. Recoil energies ofaround 300 keV cause the atoms to recoil distances
Žof around 0.08 mm across a boundary Villa, 1997.and references therein . The depth of each ablated
volume analysed in our UV laser microprobe experi-ments was calculated to be ;1 mm, based upon 39Ar
Ž .release as described above . Given that the recoildistances are much less than each layer of biotite
Ž .stripped off by the laser ;10% , it is possible todemonstrate, in a simple way, that recoil is unlikelyto be important.
Ž .Onstott et al. 1995 calculated the distribution of39Ar via recoil into a semi-infinite space showing thatthe 39Ar recoil profile approximates to an exponentialwith a mean depletion depth of 0.0818 mm. As
Ž .pointed out by Onstott et al. 1995 this is half thefull recoil penetration distance and leads to approxi-mately 10% 39Ar depletion into a semi-infinite space.Given the potassium content is 50% less in the
Ž .altered zones see discussion above recoil back intothe undepleted layer would result in final 39Ar con-tents 5% low in the undepleted layer but 10% high inthe altered zone.
The 40Arr39Ar ratio measured for altered biotiteŽ .layers in sample B ranged from 53.0 956 Ma to
( )H.J. Roberts et al.rChemical Geology 172 2001 277–290288
Ž . Ž .123.3 1741 Ma see Table 4 . If maximum recoilhad occurred then these measurements were enrichedin 39Ar by 10% which would cause a correspondinglyreduction in 40Arr39Ar by 10%. In other words, the40Arr39Ar ratios would have been 58.5 and 135.7,respectively, before recoil, indicating older actualages of 1034 and 1854 Ma. Thus even if recoil isremoved assuming maximum effect, the youngestage recorded in altered layers was only 1034 Ma,significantly below the age of 1770 Ma recorded inthe unaltered sample, A. In fact, over 60% of theages in the depth profile of sample B are signifi-cantly younger than 1770 Ma even when recoil istaken away at the maximum possible level. There-fore, although recoil may be contributing to the agevariations observed for sample B biotite, it is un-likely to be an important consideration.
We have inferred that the youngest apparent agesare dominated by zones of alteration along the cleav-ages, whereas the oldest ages are locally preserved inunaltered or less altered biotite between the cleav-ages. The older ages in the depth profiles in sample
Ž .B range from 1741"290 Ma 2s to 1711"238Ž . Ž .Ma 2s , which is concordant within large error to
the 1770 Ma age of unaltered biotite in sample A.
Thus, even in the most highly altered grains, appar-ent ages approximating the true age of the samplecan be obtained.
It is important to note in this context that the IRstep-heated biotite from sample B not only yieldedlow ages in the initial release but also anomalouslyhigh ages at high temperature. This effect was notseen in the UV analysis and may truly result fromrecoil of 39Ar from sites releasing at the highertemperatures. In this case, the UV spot analysisrevealed more reliable and reproducible ages thanthe IR step-heating, even though the step-heatingwas undertaken on entire single grains.
5. Application of the technique to slightly alteredbiotite grains
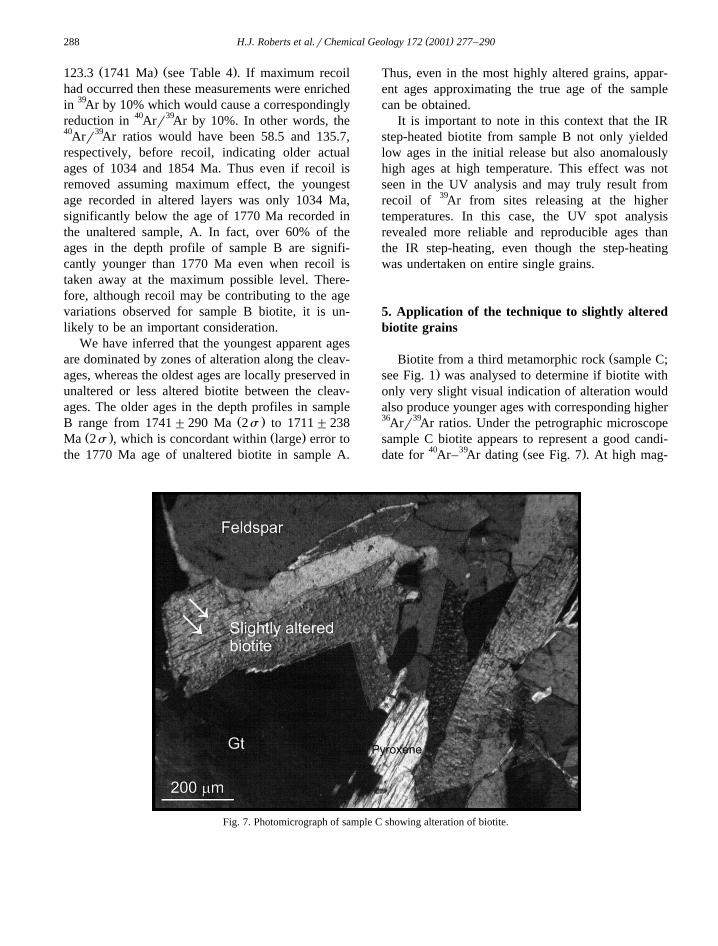
ŽBiotite from a third metamorphic rock sample C;.see Fig. 1 was analysed to determine if biotite with
only very slight visual indication of alteration wouldalso produce younger ages with corresponding higher36Arr39Ar ratios. Under the petrographic microscopesample C biotite appears to represent a good candi-
40 39 Ž .date for Ar– Ar dating see Fig. 7 . At high mag-
Fig. 7. Photomicrograph of sample C showing alteration of biotite.
( )H.J. Roberts et al.rChemical Geology 172 2001 277–290 289
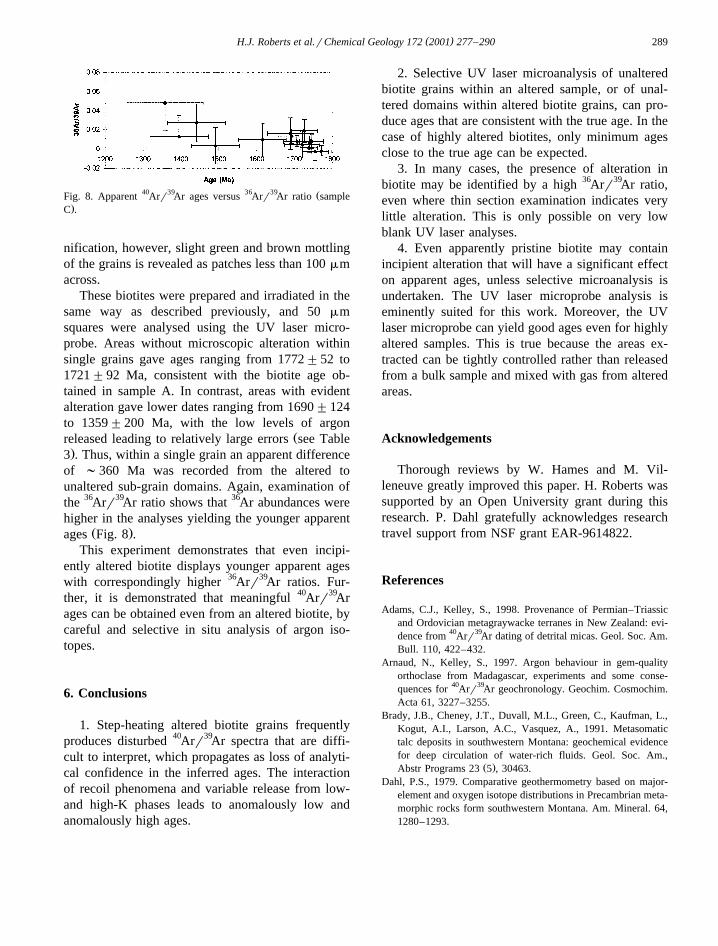
40 39 36 39 ŽFig. 8. Apparent Arr Ar ages versus Arr Ar ratio sample.C .
nification, however, slight green and brown mottlingof the grains is revealed as patches less than 100 mmacross.
These biotites were prepared and irradiated in thesame way as described previously, and 50 mmsquares were analysed using the UV laser micro-probe. Areas without microscopic alteration withinsingle grains gave ages ranging from 1772"52 to1721"92 Ma, consistent with the biotite age ob-tained in sample A. In contrast, areas with evidentalteration gave lower dates ranging from 1690"124to 1359"200 Ma, with the low levels of argon
Žreleased leading to relatively large errors see Table.3 . Thus, within a single grain an apparent difference
of ;360 Ma was recorded from the altered tounaltered sub-grain domains. Again, examination ofthe 36Arr39Ar ratio shows that 36Ar abundances werehigher in the analyses yielding the younger apparent
Ž .ages Fig. 8 .This experiment demonstrates that even incipi-
ently altered biotite displays younger apparent ageswith correspondingly higher 36Arr39Ar ratios. Fur-ther, it is demonstrated that meaningful 40Arr39Arages can be obtained even from an altered biotite, bycareful and selective in situ analysis of argon iso-topes.
6. Conclusions
1. Step-heating altered biotite grains frequentlyproduces disturbed 40Arr39Ar spectra that are diffi-cult to interpret, which propagates as loss of analyti-cal confidence in the inferred ages. The interactionof recoil phenomena and variable release from low-and high-K phases leads to anomalously low andanomalously high ages.
2. Selective UV laser microanalysis of unalteredbiotite grains within an altered sample, or of unal-tered domains within altered biotite grains, can pro-duce ages that are consistent with the true age. In thecase of highly altered biotites, only minimum agesclose to the true age can be expected.
3. In many cases, the presence of alteration inbiotite may be identified by a high 36Arr39Ar ratio,even where thin section examination indicates verylittle alteration. This is only possible on very lowblank UV laser analyses.
4. Even apparently pristine biotite may containincipient alteration that will have a significant effecton apparent ages, unless selective microanalysis isundertaken. The UV laser microprobe analysis iseminently suited for this work. Moreover, the UVlaser microprobe can yield good ages even for highlyaltered samples. This is true because the areas ex-tracted can be tightly controlled rather than releasedfrom a bulk sample and mixed with gas from alteredareas.
Acknowledgements
Thorough reviews by W. Hames and M. Vil-leneuve greatly improved this paper. H. Roberts wassupported by an Open University grant during thisresearch. P. Dahl gratefully acknowledges researchtravel support from NSF grant EAR-9614822.
References
Adams, C.J., Kelley, S., 1998. Provenance of Permian–Triassicand Ordovician metagraywacke terranes in New Zealand: evi-dence from 40Arr39Ar dating of detrital micas. Geol. Soc. Am.Bull. 110, 422–432.
Arnaud, N., Kelley, S., 1997. Argon behaviour in gem-qualityorthoclase from Madagascar, experiments and some conse-quences for 40Arr39Ar geochronology. Geochim. Cosmochim.Acta 61, 3227–3255.
Brady, J.B., Cheney, J.T., Duvall, M.L., Green, C., Kaufman, L.,Kogut, A.I., Larson, A.C., Vasquez, A., 1991. Metasomatictalc deposits in southwestern Montana: geochemical evidencefor deep circulation of water-rich fluids. Geol. Soc. Am.,
Ž .Abstr Programs 23 5 , 30463.Dahl, P.S., 1979. Comparative geothermometry based on major-
element and oxygen isotope distributions in Precambrian meta-morphic rocks form southwestern Montana. Am. Mineral. 64,1280–1293.
( )H.J. Roberts et al.rChemical Geology 172 2001 277–290290
Dahl, P.S., Holm, D.K., Gardner, E.T., Hubacher, F.A., Foland,K.A., 1999. New constraints on the timing of Early Protero-
Ž .zoic tectonism in the Black Hills South Dakota , with impli-cations for docking of the Wyoming province with Laurentia.
Ž .Geol. Soc. Am. Bull. in press .Garihan, J.M., 1979. Geology and structure of the central Ruby
Range, Madison County, Montana. Geol. Soc. Am. Bull. 90,695–788.
Karasevich, L.P., Garihan, J.M., Dahl, P.S., Okuma, A.F., 1981.Summary of Precambrian metamorphic and structural history,Ruby Range, southwest Montana. Mont. Geol. Soc. 225–237.
Kovaric, D.N., Brady, J.B., Cheney, J.T., Grove, M., Jacob, L.T.,King, J.T., 1996. 40Arr39Ar evidence for reheating eventsaffecting basement rocks in the Tobacco Root, Ruby andHighland Mountains, southwest Montana. Geol. Soc. Am.,
Ž .Abstr. Programs 28 7 , A-493.Lo, C.H., Onstott, T.C., 1989. 39Ar recoil artefacts in chloritized
biotite. Geochim. Cosmochim. Acta 53, 2697–2711.Mitchell, J.G., Taka, A.S., 1984. Potassium and argon loss pat-
terns in weathered micas: Implications for detrital mineralstudies, with particular reference to the Triassic palaeogeogra-phy of the British Isles. Sediment. Geol. 39, 27–52.
Mogk, D.M., Henry, D.J., 1988. Metamorphic petrology of thenorthern Archean Wyoming province, southwestern Montana:evidence for Archean collisional tectonics. In: Ernst, W.G.Ž .Ed. , Metamorphism and Crustal Evolution of the WesternUnited States. Rubey Vol. VII, pp. 362–382.
Onstott, T.C., Phillips, D., Pringle-Goodell, L., 1991. Laser mi-croprobe measurement of chlorine and argon zonation inbiotite. Chem. Geol. 90, 145–168.
Onstott, T.C., Miller, M.L., Ewing, R.C., Arnold, G.W., Walsh,D.S., 1995. Recoil refinements: implications for the 40Arr39Ardating technique. Geochim. Cosmochim. Acta 59, 1821–1834.
Ž .Roberts, H.J. 1999 . An investigation of a polymetamorphicterrain using 40Ar–39Ar geochronology. Unpublished PhD the-sis. The Open University.
Ruffet, G., Feraud, G., Amouric, M., 1991. Comparison of 40Ar–´39Ar conventional and laser dating of biotites from the NorthTregor Batholith. Geochim. Cosmochim. Acta 55, 1675–1688.´
Turner, G., Cadogan, P.H., 1974. Possible effects of 39Ar recoil in40Ar–39Ar dating. Proc. Fifth Lunar Sci. Conf. 2, 1601–1615.
Villa, I., 1997. Direct determination of 39Ar recoil distance.Geochim. Cosmochim. Acta 61, 689–691.