Embed Size (px)
Citation preview
ORIGINAL ARTICLE
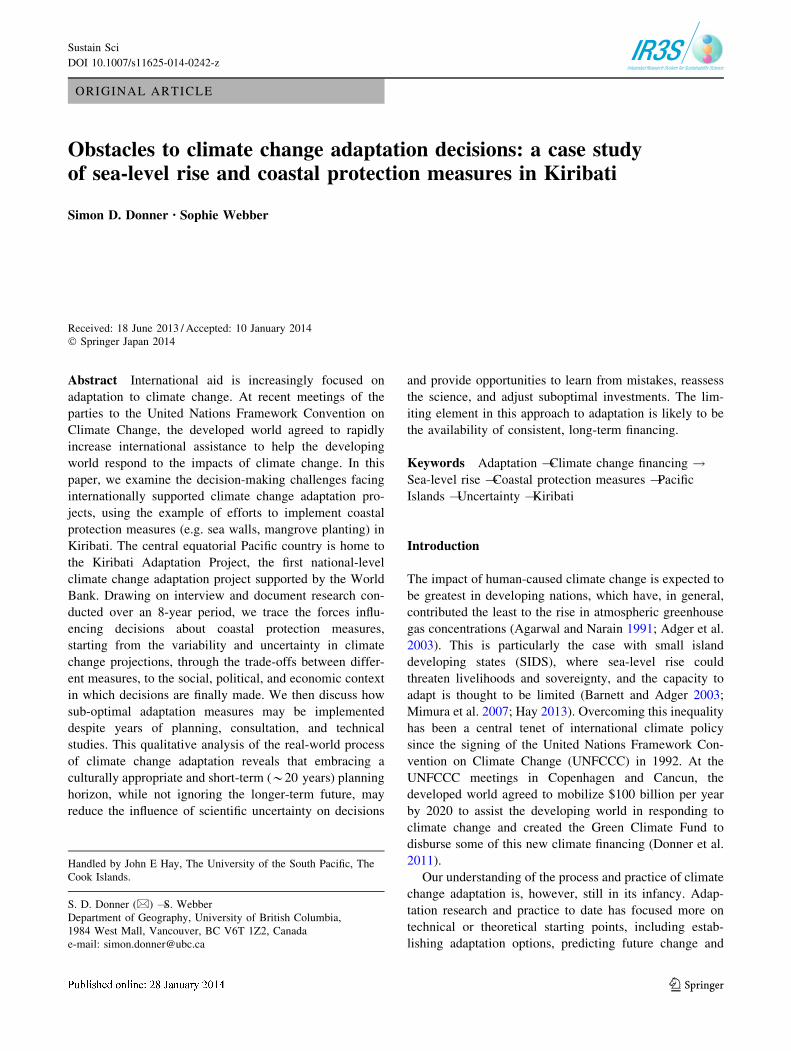
Obstacles to climate change adaptation decisions: a case studyof sea-level rise and coastal protection measures in Kiribati
Simon D. Donner • Sophie Webber
Received: 18 June 2013 / Accepted: 10 January 2014! Springer Japan 2014
Abstract International aid is increasingly focused onadaptation to climate change. At recent meetings of the
parties to the United Nations Framework Convention on
Climate Change, the developed world agreed to rapidlyincrease international assistance to help the developing
world respond to the impacts of climate change. In this
paper, we examine the decision-making challenges facinginternationally supported climate change adaptation pro-
jects, using the example of efforts to implement coastal
protection measures (e.g. sea walls, mangrove planting) inKiribati. The central equatorial Pacific country is home to
the Kiribati Adaptation Project, the first national-level
climate change adaptation project supported by the WorldBank. Drawing on interview and document research con-
ducted over an 8-year period, we trace the forces influ-
encing decisions about coastal protection measures,starting from the variability and uncertainty in climate
change projections, through the trade-offs between differ-
ent measures, to the social, political, and economic contextin which decisions are finally made. We then discuss how
sub-optimal adaptation measures may be implementeddespite years of planning, consultation, and technical
studies. This qualitative analysis of the real-world process
of climate change adaptation reveals that embracing aculturally appropriate and short-term (*20 years) planning
horizon, while not ignoring the longer-term future, may
reduce the influence of scientific uncertainty on decisions
and provide opportunities to learn from mistakes, reassessthe science, and adjust suboptimal investments. The lim-
iting element in this approach to adaptation is likely to be
the availability of consistent, long-term financing.
Keywords Adaptation ! Climate change financing !Sea-level rise ! Coastal protection measures ! Pacific
Islands ! Uncertainty ! Kiribati
Introduction
The impact of human-caused climate change is expected to
be greatest in developing nations, which have, in general,contributed the least to the rise in atmospheric greenhouse
gas concentrations (Agarwal and Narain 1991; Adger et al.
2003). This is particularly the case with small islanddeveloping states (SIDS), where sea-level rise could
threaten livelihoods and sovereignty, and the capacity to
adapt is thought to be limited (Barnett and Adger 2003;Mimura et al. 2007; Hay 2013). Overcoming this inequality
has been a central tenet of international climate policysince the signing of the United Nations Framework Con-
vention on Climate Change (UNFCCC) in 1992. At the
UNFCCC meetings in Copenhagen and Cancun, thedeveloped world agreed to mobilize $100 billion per year
by 2020 to assist the developing world in responding to
climate change and created the Green Climate Fund todisburse some of this new climate financing (Donner et al.
2011).
Our understanding of the process and practice of climatechange adaptation is, however, still in its infancy. Adap-
tation research and practice to date has focused more on
technical or theoretical starting points, including estab-lishing adaptation options, predicting future change and
Handled by John E Hay, The University of the South Pacific, TheCook Islands.
S. D. Donner (&) ! S. WebberDepartment of Geography, University of British Columbia,1984 West Mall, Vancouver, BC V6T 1Z2, Canadae-mail: [email protected]
123
Sustain Sci
DOI 10.1007/s11625-014-0242-z
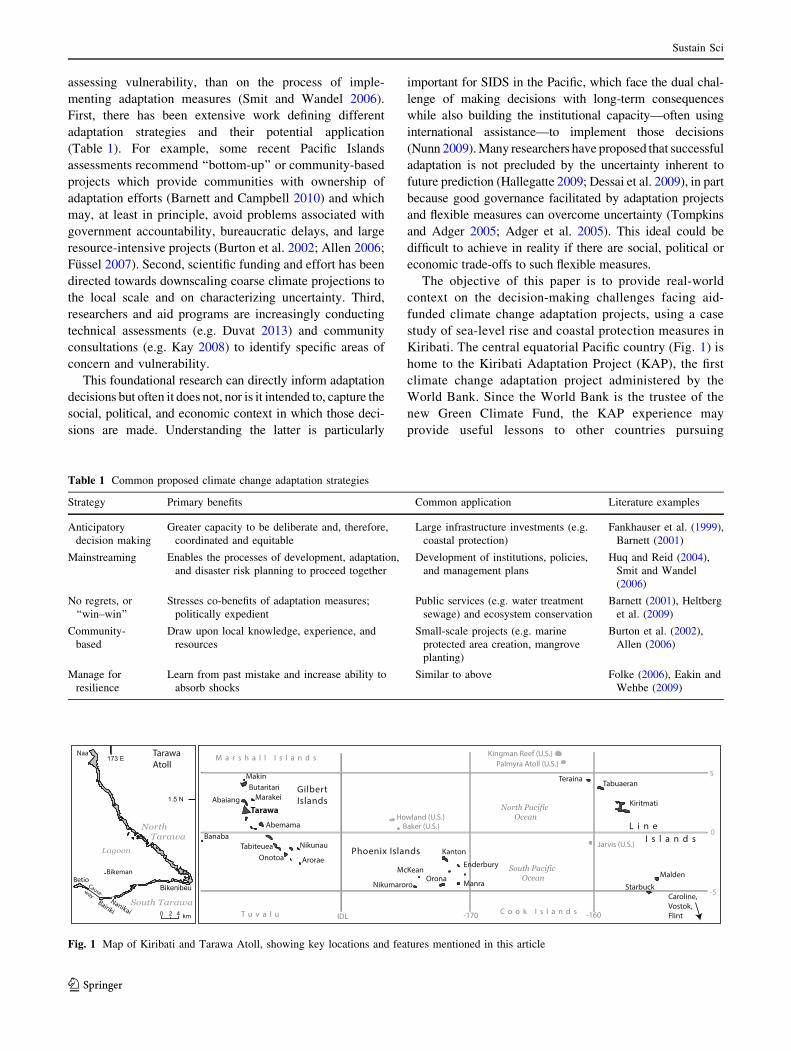
assessing vulnerability, than on the process of imple-
menting adaptation measures (Smit and Wandel 2006).First, there has been extensive work defining different
adaptation strategies and their potential application
(Table 1). For example, some recent Pacific Islandsassessments recommend ‘‘bottom-up’’ or community-based
projects which provide communities with ownership of
adaptation efforts (Barnett and Campbell 2010) and whichmay, at least in principle, avoid problems associated with
government accountability, bureaucratic delays, and largeresource-intensive projects (Burton et al. 2002; Allen 2006;
Fussel 2007). Second, scientific funding and effort has been
directed towards downscaling coarse climate projections tothe local scale and on characterizing uncertainty. Third,
researchers and aid programs are increasingly conducting
technical assessments (e.g. Duvat 2013) and communityconsultations (e.g. Kay 2008) to identify specific areas of
concern and vulnerability.
This foundational research can directly inform adaptationdecisions but often it does not, nor is it intended to, capture the
social, political, and economic context in which those deci-
sions are made. Understanding the latter is particularly
important for SIDS in the Pacific, which face the dual chal-
lenge of making decisions with long-term consequenceswhile also building the institutional capacity—often using
international assistance—to implement those decisions
(Nunn 2009). Many researchers have proposed that successfuladaptation is not precluded by the uncertainty inherent to
future prediction (Hallegatte 2009; Dessai et al. 2009), in part
because good governance facilitated by adaptation projectsand flexible measures can overcome uncertainty (Tompkins
and Adger 2005; Adger et al. 2005). This ideal could bedifficult to achieve in reality if there are social, political or
economic trade-offs to such flexible measures.
The objective of this paper is to provide real-worldcontext on the decision-making challenges facing aid-
funded climate change adaptation projects, using a case
study of sea-level rise and coastal protection measures inKiribati. The central equatorial Pacific country (Fig. 1) is
home to the Kiribati Adaptation Project (KAP), the first
climate change adaptation project administered by theWorld Bank. Since the World Bank is the trustee of the
new Green Climate Fund, the KAP experience may
provide useful lessons to other countries pursuing
Table 1 Common proposed climate change adaptation strategies
Strategy Primary benefits Common application Literature examples
Anticipatorydecision making
Greater capacity to be deliberate and, therefore,coordinated and equitable
Large infrastructure investments (e.g.coastal protection)
Fankhauser et al. (1999),Barnett (2001)
Mainstreaming Enables the processes of development, adaptation,and disaster risk planning to proceed together
Development of institutions, policies,and management plans
Huq and Reid (2004),Smit and Wandel(2006)
No regrets, or‘‘win–win’’
Stresses co-benefits of adaptation measures;politically expedient
Public services (e.g. water treatmentsewage) and ecosystem conservation
Barnett (2001), Heltberget al. (2009)
Community-based
Draw upon local knowledge, experience, andresources
Small-scale projects (e.g. marineprotected area creation, mangroveplanting)
Burton et al. (2002),Allen (2006)
Manage forresilience
Learn from past mistake and increase ability toabsorb shocks
Similar to above Folke (2006), Eakin andWehbe (2009)
Fig. 1 Map of Kiribati and Tarawa Atoll, showing key locations and features mentioned in this article
Sustain Sci
123
adaptation goals via international support (Webber 2013).
We draw upon qualitative field and document research totrace the forces influencing decisions about coastal pro-
tection measures (e.g. sea walls, mangrove planting),
from the climate change projections (Sect. 4), to thetrade-offs between different adaptation options (Sect. 5)
to the governance of aid projects (Sect. 6). We then
discuss how a sub-optimal adaptation measure, in thiscase, a series of technically flawed sea walls, can be
constructed despite years of planning, consultation andtechnical analysis (Sect. 7). This qualitative research
reveals several key themes not evident in the available
technical and theoretical literature, including the value ofembracing multiple, even contradictory, adaptation
strategies and a rolling short-term planning horizon, to
learn from mistakes, adjust suboptimal investments, andprepare for the range of possible futures.
Study design
This study draws upon field research in the GilbertIslands of Kiribati conducted over an 8-year period in
conjunction with coastal monitoring activities (Donner
et al. 2010) and a review of academic literature anddocumentation from adaptation projects. Research visits
were conducted in 2005 (4 weeks, S. Donner), 2009
(6 weeks, S. Donner) and 2010 (8 weeks, S. Donner andS. Webber), 2012 (4 weeks, S. Donner), and 2013
(4 weeks, S. Webber) to five atolls (Tarawa, Abaiang,
Butaritari, Abemema, Marakei) in the Gilbert Islands.Long semi-structured interviews were conducted with
staff from the Office of Te Beretitenti (the President), five
different ministries, religious leaders, village leaders andelders, representatives of non-governmental organiza-
tions, consultants to international adaptation projects and
representatives of donor agencies. Research subjectswere identified via a ‘‘snowballing’’ strategy after initial
contact with the Ministry of Fisheries and Marine
Resource Development and the KAP. Interview tran-scripts and adaptation-related documents were analyzed
for key themes influencing climate change adaptation
projects and decisions. Specific interviews and docu-ments are cited where relevant; interview subjects are
listed by job description to preserve anonymity.
For Sect. 4, tide gauge data for Betio, Tarawa from 1993to 2012 were collected from the Australian Tidal Facility
(ATF), which installed a new gauge in December, 1992.
Additional data from earlier gauges back to 1984, forwhich continuous records were available, were also col-
lected from the University of Hawaii Sea Level Center
archives (UHSLC; http://ilikai.soest.hawaii.edu/uhslc) andcorrected for the change in datum.
Republic of Kiribati
The following section introduces the physical and human
geography of Kiribati and the recent internationally
financed adaptation projects.
Physical geography
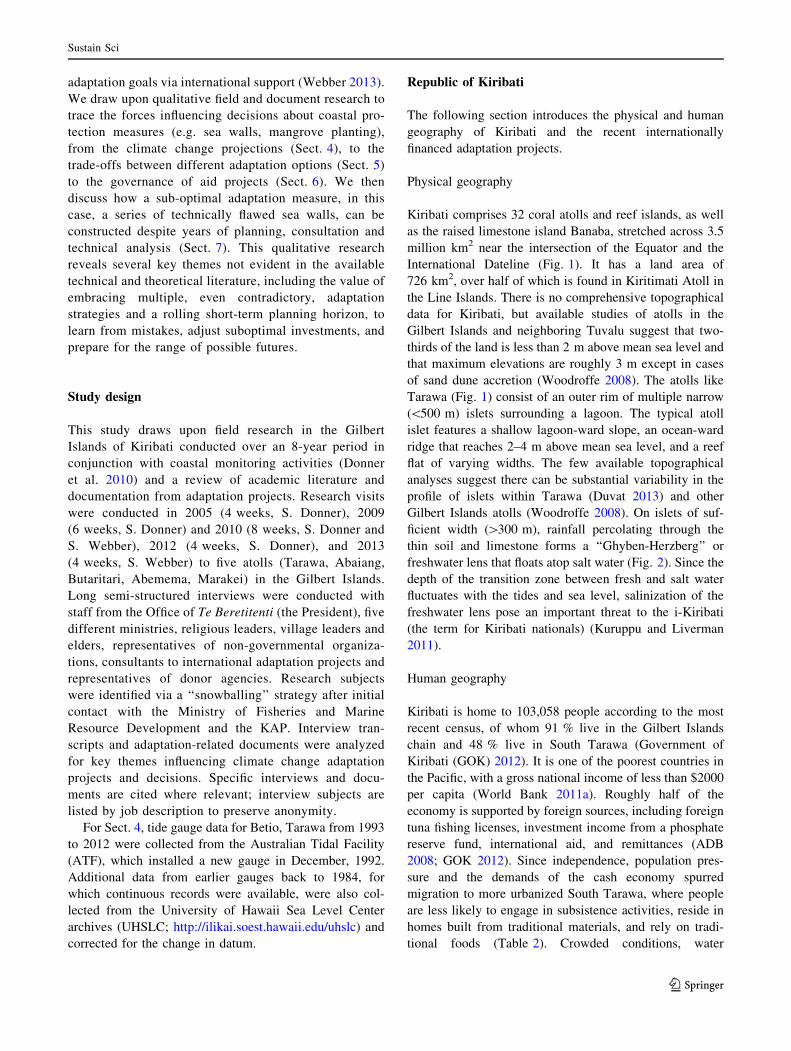
Kiribati comprises 32 coral atolls and reef islands, as well
as the raised limestone island Banaba, stretched across 3.5
million km2 near the intersection of the Equator and theInternational Dateline (Fig. 1). It has a land area of
726 km2, over half of which is found in Kiritimati Atoll in
the Line Islands. There is no comprehensive topographicaldata for Kiribati, but available studies of atolls in the
Gilbert Islands and neighboring Tuvalu suggest that two-
thirds of the land is less than 2 m above mean sea level andthat maximum elevations are roughly 3 m except in cases
of sand dune accretion (Woodroffe 2008). The atolls like
Tarawa (Fig. 1) consist of an outer rim of multiple narrow(\500 m) islets surrounding a lagoon. The typical atoll
islet features a shallow lagoon-ward slope, an ocean-ward
ridge that reaches 2–4 m above mean sea level, and a reefflat of varying widths. The few available topographical
analyses suggest there can be substantial variability in the
profile of islets within Tarawa (Duvat 2013) and otherGilbert Islands atolls (Woodroffe 2008). On islets of suf-
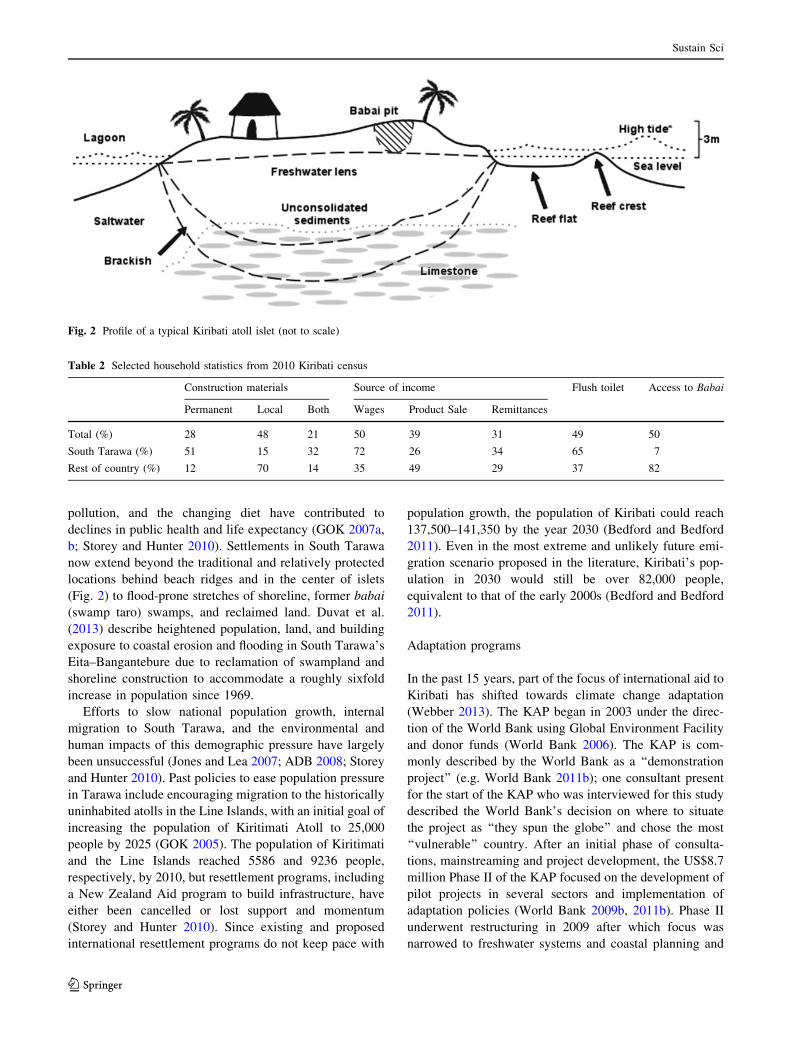
ficient width ([300 m), rainfall percolating through thethin soil and limestone forms a ‘‘Ghyben-Herzberg’’ or
freshwater lens that floats atop salt water (Fig. 2). Since the
depth of the transition zone between fresh and salt waterfluctuates with the tides and sea level, salinization of the
freshwater lens pose an important threat to the i-Kiribati
(the term for Kiribati nationals) (Kuruppu and Liverman2011).
Human geography
Kiribati is home to 103,058 people according to the most
recent census, of whom 91 % live in the Gilbert Islandschain and 48 % live in South Tarawa (Government of
Kiribati (GOK) 2012). It is one of the poorest countries in
the Pacific, with a gross national income of less than $2000per capita (World Bank 2011a). Roughly half of the
economy is supported by foreign sources, including foreign
tuna fishing licenses, investment income from a phosphatereserve fund, international aid, and remittances (ADB
2008; GOK 2012). Since independence, population pres-
sure and the demands of the cash economy spurredmigration to more urbanized South Tarawa, where people
are less likely to engage in subsistence activities, reside in
homes built from traditional materials, and rely on tradi-tional foods (Table 2). Crowded conditions, water
Sustain Sci
123
pollution, and the changing diet have contributed to
declines in public health and life expectancy (GOK 2007a,
b; Storey and Hunter 2010). Settlements in South Tarawanow extend beyond the traditional and relatively protected
locations behind beach ridges and in the center of islets
(Fig. 2) to flood-prone stretches of shoreline, former babai(swamp taro) swamps, and reclaimed land. Duvat et al.
(2013) describe heightened population, land, and building
exposure to coastal erosion and flooding in South Tarawa’sEita–Bangantebure due to reclamation of swampland and
shoreline construction to accommodate a roughly sixfold
increase in population since 1969.Efforts to slow national population growth, internal
migration to South Tarawa, and the environmental and
human impacts of this demographic pressure have largelybeen unsuccessful (Jones and Lea 2007; ADB 2008; Storey
and Hunter 2010). Past policies to ease population pressure
in Tarawa include encouraging migration to the historicallyuninhabited atolls in the Line Islands, with an initial goal of
increasing the population of Kiritimati Atoll to 25,000
people by 2025 (GOK 2005). The population of Kiritimatiand the Line Islands reached 5586 and 9236 people,
respectively, by 2010, but resettlement programs, including
a New Zealand Aid program to build infrastructure, haveeither been cancelled or lost support and momentum
(Storey and Hunter 2010). Since existing and proposed
international resettlement programs do not keep pace with
population growth, the population of Kiribati could reach
137,500–141,350 by the year 2030 (Bedford and Bedford
2011). Even in the most extreme and unlikely future emi-gration scenario proposed in the literature, Kiribati’s pop-
ulation in 2030 would still be over 82,000 people,
equivalent to that of the early 2000s (Bedford and Bedford2011).
Adaptation programs
In the past 15 years, part of the focus of international aid to
Kiribati has shifted towards climate change adaptation(Webber 2013). The KAP began in 2003 under the direc-
tion of the World Bank using Global Environment Facility
and donor funds (World Bank 2006). The KAP is com-monly described by the World Bank as a ‘‘demonstration
project’’ (e.g. World Bank 2011b); one consultant present
for the start of the KAP who was interviewed for this studydescribed the World Bank’s decision on where to situate
the project as ‘‘they spun the globe’’ and chose the most
‘‘vulnerable’’ country. After an initial phase of consulta-tions, mainstreaming and project development, the US$8.7
million Phase II of the KAP focused on the development of
pilot projects in several sectors and implementation ofadaptation policies (World Bank 2009b, 2011b). Phase II
underwent restructuring in 2009 after which focus was
narrowed to freshwater systems and coastal planning and
Fig. 2 Profile of a typical Kiribati atoll islet (not to scale)
Table 2 Selected household statistics from 2010 Kiribati census
Construction materials Source of income Flush toilet Access to Babai
Permanent Local Both Wages Product Sale Remittances
Total (%) 28 48 21 50 39 31 49 50
South Tarawa (%) 51 15 32 72 26 34 65 7
Rest of country (%) 12 70 14 35 49 29 37 82
Sustain Sci
123
protection. It concluded in 2011 having reportedly met
pilot implementation goals (World Bank 2009b, 2011b).A US$10.8 million third phase of KAP continuing the
narrower subject focus began recently (World Bank
2011c). The UN Development Program’s National Adap-tation Plan of Action (NAPA) for Kiribati (GOK 2007b)
and other bilateral adaptation-related projects have been
integrated with KAP activities (GOK 2007a; ADB 2008),and report directly to a centralized climate change planning
office within the Office of Te Berenteiti (World Bank2011c).
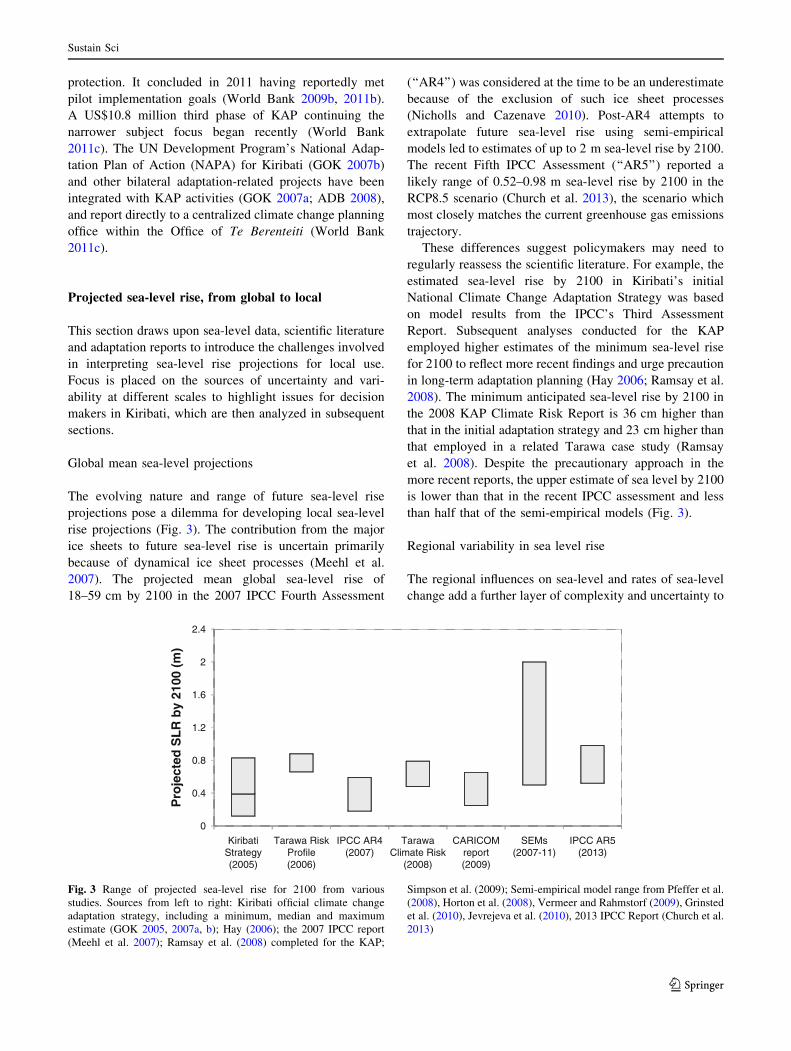
Projected sea-level rise, from global to local
This section draws upon sea-level data, scientific literatureand adaptation reports to introduce the challenges involved
in interpreting sea-level rise projections for local use.
Focus is placed on the sources of uncertainty and vari-ability at different scales to highlight issues for decision
makers in Kiribati, which are then analyzed in subsequent
sections.
Global mean sea-level projections
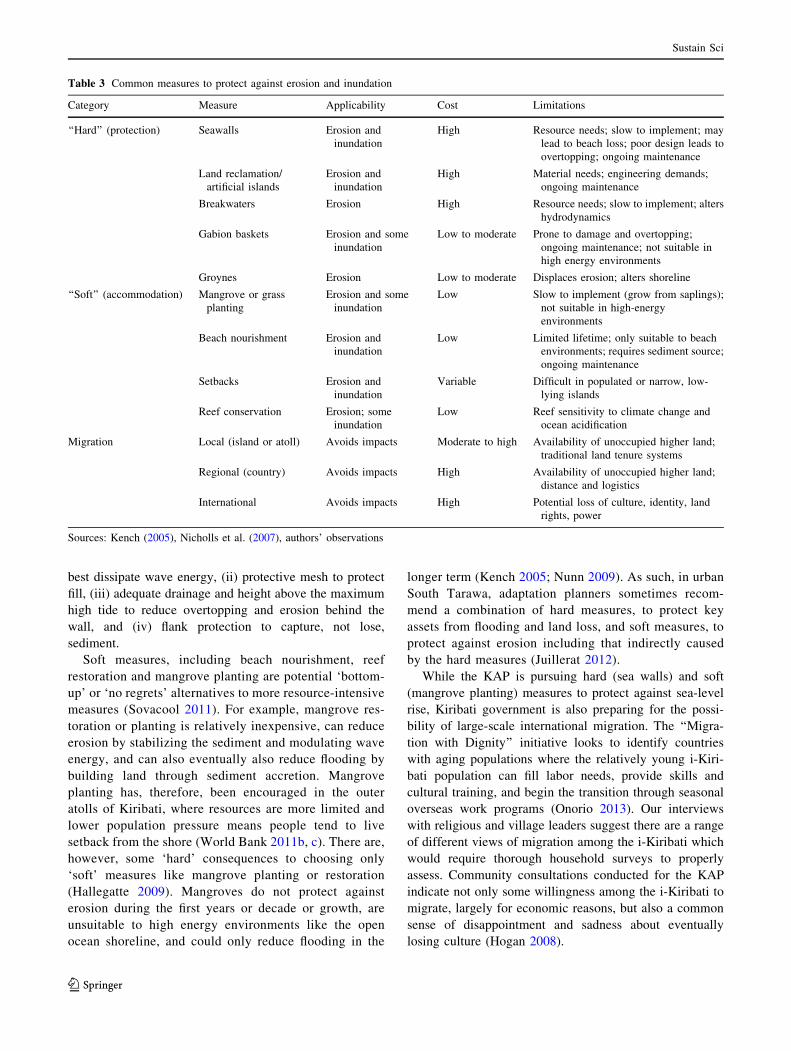
The evolving nature and range of future sea-level rise
projections pose a dilemma for developing local sea-level
rise projections (Fig. 3). The contribution from the majorice sheets to future sea-level rise is uncertain primarily
because of dynamical ice sheet processes (Meehl et al.
2007). The projected mean global sea-level rise of18–59 cm by 2100 in the 2007 IPCC Fourth Assessment
(‘‘AR4’’) was considered at the time to be an underestimate
because of the exclusion of such ice sheet processes(Nicholls and Cazenave 2010). Post-AR4 attempts to
extrapolate future sea-level rise using semi-empirical
models led to estimates of up to 2 m sea-level rise by 2100.The recent Fifth IPCC Assessment (‘‘AR5’’) reported a
likely range of 0.52–0.98 m sea-level rise by 2100 in the
RCP8.5 scenario (Church et al. 2013), the scenario whichmost closely matches the current greenhouse gas emissions
trajectory.These differences suggest policymakers may need to
regularly reassess the scientific literature. For example, the
estimated sea-level rise by 2100 in Kiribati’s initialNational Climate Change Adaptation Strategy was based
on model results from the IPCC’s Third Assessment
Report. Subsequent analyses conducted for the KAPemployed higher estimates of the minimum sea-level rise
for 2100 to reflect more recent findings and urge precaution
in long-term adaptation planning (Hay 2006; Ramsay et al.2008). The minimum anticipated sea-level rise by 2100 in
the 2008 KAP Climate Risk Report is 36 cm higher than
that in the initial adaptation strategy and 23 cm higher thanthat employed in a related Tarawa case study (Ramsay
et al. 2008). Despite the precautionary approach in the
more recent reports, the upper estimate of sea level by 2100is lower than that in the recent IPCC assessment and less
than half that of the semi-empirical models (Fig. 3).
Regional variability in sea level rise
The regional influences on sea-level and rates of sea-levelchange add a further layer of complexity and uncertainty to
0
0.4
0.8
1.2
1.6
2
2.4
KiribatiStrategy(2005)
Tarawa RiskProfile(2006)
IPCC AR4(2007)
TarawaClimate Risk
(2008)
CARICOMreport(2009)
SEMs(2007-11)
IPCC AR5(2013)
Pro
ject
ed S
LR b
y 21
00 (m
)
Fig. 3 Range of projected sea-level rise for 2100 from variousstudies. Sources from left to right: Kiribati official climate changeadaptation strategy, including a minimum, median and maximumestimate (GOK 2005, 2007a, b); Hay (2006); the 2007 IPCC report(Meehl et al. 2007); Ramsay et al. (2008) completed for the KAP;
Simpson et al. (2009); Semi-empirical model range from Pfeffer et al.(2008), Horton et al. (2008), Vermeer and Rahmstorf (2009), Grinstedet al. (2010), Jevrejeva et al. (2010), 2013 IPCC Report (Church et al.2013)
Sustain Sci
123
local sea-level rise projections and adaptation planning.The rate of future sea-level rise will vary regionally
because of ocean dynamics, gravitational effects of ice
sheet melt, and land subsidence (Church et al. 2013).Models employed in AR5 project that sea-level rise in the
central equatorial Pacific by the end of the century will be
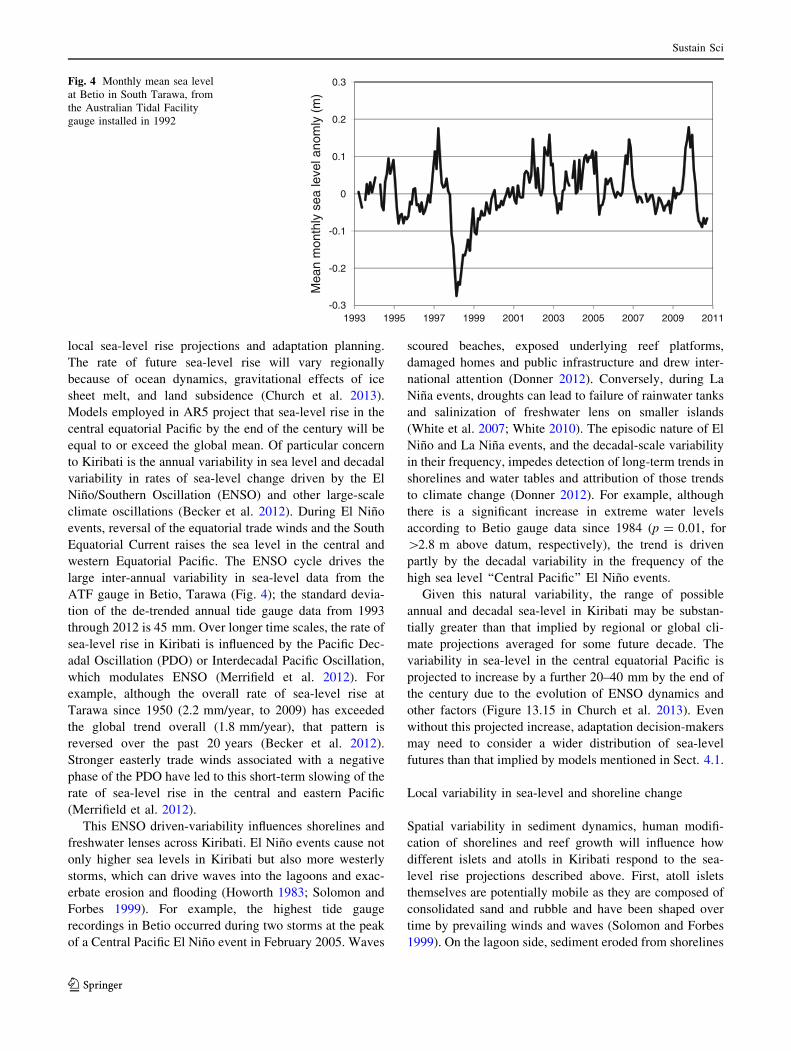
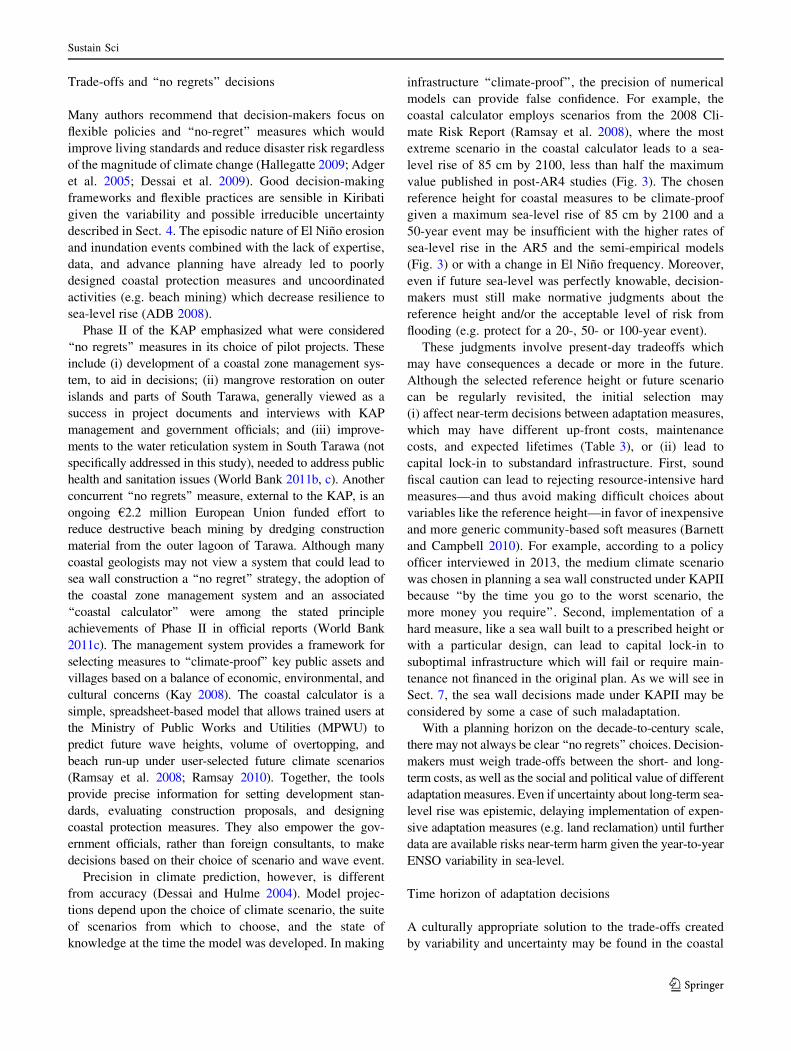
equal to or exceed the global mean. Of particular concernto Kiribati is the annual variability in sea level and decadal
variability in rates of sea-level change driven by the El
Nino/Southern Oscillation (ENSO) and other large-scaleclimate oscillations (Becker et al. 2012). During El Nino
events, reversal of the equatorial trade winds and the South
Equatorial Current raises the sea level in the central andwestern Equatorial Pacific. The ENSO cycle drives the
large inter-annual variability in sea-level data from the
ATF gauge in Betio, Tarawa (Fig. 4); the standard devia-tion of the de-trended annual tide gauge data from 1993
through 2012 is 45 mm. Over longer time scales, the rate of
sea-level rise in Kiribati is influenced by the Pacific Dec-adal Oscillation (PDO) or Interdecadal Pacific Oscillation,
which modulates ENSO (Merrifield et al. 2012). Forexample, although the overall rate of sea-level rise at
Tarawa since 1950 (2.2 mm/year, to 2009) has exceeded
the global trend overall (1.8 mm/year), that pattern isreversed over the past 20 years (Becker et al. 2012).
Stronger easterly trade winds associated with a negative
phase of the PDO have led to this short-term slowing of therate of sea-level rise in the central and eastern Pacific
(Merrifield et al. 2012).
This ENSO driven-variability influences shorelines andfreshwater lenses across Kiribati. El Nino events cause not
only higher sea levels in Kiribati but also more westerly
storms, which can drive waves into the lagoons and exac-erbate erosion and flooding (Howorth 1983; Solomon and
Forbes 1999). For example, the highest tide gauge
recordings in Betio occurred during two storms at the peakof a Central Pacific El Nino event in February 2005. Waves
scoured beaches, exposed underlying reef platforms,damaged homes and public infrastructure and drew inter-
national attention (Donner 2012). Conversely, during La
Nina events, droughts can lead to failure of rainwater tanksand salinization of freshwater lens on smaller islands
(White et al. 2007; White 2010). The episodic nature of El
Nino and La Nina events, and the decadal-scale variabilityin their frequency, impedes detection of long-term trends in
shorelines and water tables and attribution of those trends
to climate change (Donner 2012). For example, althoughthere is a significant increase in extreme water levels
according to Betio gauge data since 1984 (p = 0.01, for
[2.8 m above datum, respectively), the trend is drivenpartly by the decadal variability in the frequency of the
high sea level ‘‘Central Pacific’’ El Nino events.
Given this natural variability, the range of possibleannual and decadal sea-level in Kiribati may be substan-
tially greater than that implied by regional or global cli-
mate projections averaged for some future decade. Thevariability in sea-level in the central equatorial Pacific is
projected to increase by a further 20–40 mm by the end ofthe century due to the evolution of ENSO dynamics and
other factors (Figure 13.15 in Church et al. 2013). Even
without this projected increase, adaptation decision-makersmay need to consider a wider distribution of sea-level
futures than that implied by models mentioned in Sect. 4.1.
Local variability in sea-level and shoreline change
Spatial variability in sediment dynamics, human modifi-cation of shorelines and reef growth will influence how
different islets and atolls in Kiribati respond to the sea-
level rise projections described above. First, atoll isletsthemselves are potentially mobile as they are composed of
consolidated sand and rubble and have been shaped over
time by prevailing winds and waves (Solomon and Forbes1999). On the lagoon side, sediment eroded from shorelines
-0.3
-0.2
-0.1
0
0.1
0.2
0.3
1993 1995 1997 1999 2001 2003 2005 2007 2009 2011M
ean
mon
thly
sea
leve
l ano
mly
(m
)
Fig. 4 Monthly mean sea levelat Betio in South Tarawa, fromthe Australian Tidal Facilitygauge installed in 1992
Sustain Sci
123
is generally deposited elsewhere in the lagoon (Cowell and
Kench 2001). On the ocean side, the existence of aprominent ridge (Fig. 2) suggests periods of past growth
and sediment accretion, rather than erosion (Woodroffe
2008). Second, shorelines in Kiribati have evolved due todirect and inadvertent human modification, including land
reclamation, construction of causeways linking islets and
construction of protective structures like seawalls (Donner2012; Biribo and Woodroffe 2013; Duvat et al. 2013). As
such, human modification and ENSO dynamics mentionedabove may be exerting more control over Kiribati shore-
lines than sea-level rise in recent years (Webb and Kench
2010; Rankey 2011; Donner 2012; Biribo and Woodroffe2013). Third, coastal erosion and wave run-up may be
sensitive to the complexity and height of the reef crest,
which may decline in Kiribati because of coral bleachingand a shift to more homogeneous ‘weedy’ coral species
(Donner et al. 2010). The traditional practice of con-
structing sea walls and fish traps using sediment and coralrock mined from the lagoon has contributed to flooding and
coastal erosion in populated parts of Kiribati (Webb 2005;
Duvat 2013).In setting adaptation priorities within Kiribati, or within
a given atoll, policymakers must consider whether these
local factors exacerbate or mitigate the impact of sea-levelrise on coastal erosion, wave run-up and other concerns.
Given the dynamic nature of these factors and the episodic
nature of ENSO, the locations of concern and the suitableadaptation options in those locations can change over time.
This may be an issue, for example, in South Tarawa where
Bairiki, Nanikai and other populated islets expanded inarea over recent decades due to land reclamation and
causeway construction redirecting sediment flow (Webb
and Kench 2010; Donner 2012; Biribo and Woodroffe2013). This areal expansion, not to be confused with ver-
tical growth, altered the shape of islets, their interaction
with alongshore currents and the balance of erosion andaccretion. Though it is possible that local sediment
dynamics makes some islets naturally resilient to sea-level
change (Webb and Kench 2010), the human interventionsthat drove this observed accretion in South Tarawa tend to
eventually remove sediment and inhibit such natural
resilience (Biribo and Woodroffe 2013). These islet chan-ges show that even with perfect knowledge of regional sea-
level variability and global sea-level projections, local
assessments of shoreline sensitivity to sea-level rise mayneed to be repeated periodically.
Adaptation decision-making given scientific uncertainty
In the section, we examine whether the variability anduncertainty in sea-level projections may influence
adaptation decisions. We introduce the range of coastal
protection options, examine observed trade-offs betweenthose options in Kiribati, and describe areas of potentially
successful compromise based on document research and
interview data.
Options for coastal adaptation
Measures against coastal erosion and inundation can be
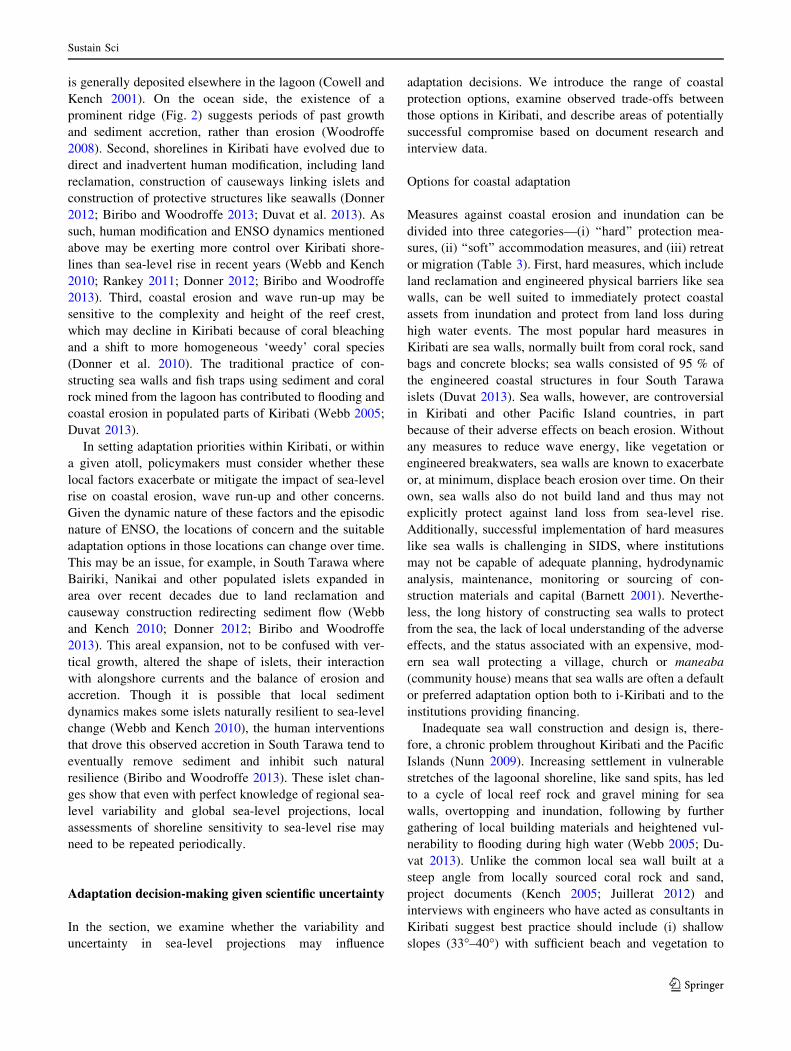
divided into three categories—(i) ‘‘hard’’ protection mea-sures, (ii) ‘‘soft’’ accommodation measures, and (iii) retreat
or migration (Table 3). First, hard measures, which include
land reclamation and engineered physical barriers like seawalls, can be well suited to immediately protect coastal
assets from inundation and protect from land loss during
high water events. The most popular hard measures inKiribati are sea walls, normally built from coral rock, sand
bags and concrete blocks; sea walls consisted of 95 % of
the engineered coastal structures in four South Tarawaislets (Duvat 2013). Sea walls, however, are controversial
in Kiribati and other Pacific Island countries, in part
because of their adverse effects on beach erosion. Withoutany measures to reduce wave energy, like vegetation or
engineered breakwaters, sea walls are known to exacerbate
or, at minimum, displace beach erosion over time. On theirown, sea walls also do not build land and thus may not
explicitly protect against land loss from sea-level rise.
Additionally, successful implementation of hard measureslike sea walls is challenging in SIDS, where institutions
may not be capable of adequate planning, hydrodynamic
analysis, maintenance, monitoring or sourcing of con-struction materials and capital (Barnett 2001). Neverthe-
less, the long history of constructing sea walls to protect
from the sea, the lack of local understanding of the adverseeffects, and the status associated with an expensive, mod-
ern sea wall protecting a village, church or maneaba
(community house) means that sea walls are often a defaultor preferred adaptation option both to i-Kiribati and to the
institutions providing financing.
Inadequate sea wall construction and design is, there-fore, a chronic problem throughout Kiribati and the Pacific
Islands (Nunn 2009). Increasing settlement in vulnerable
stretches of the lagoonal shoreline, like sand spits, has ledto a cycle of local reef rock and gravel mining for sea
walls, overtopping and inundation, following by further
gathering of local building materials and heightened vul-nerability to flooding during high water (Webb 2005; Du-
vat 2013). Unlike the common local sea wall built at a
steep angle from locally sourced coral rock and sand,project documents (Kench 2005; Juillerat 2012) and
interviews with engineers who have acted as consultants in
Kiribati suggest best practice should include (i) shallowslopes (33"–40") with sufficient beach and vegetation to
Sustain Sci
123
best dissipate wave energy, (ii) protective mesh to protect
fill, (iii) adequate drainage and height above the maximumhigh tide to reduce overtopping and erosion behind the
wall, and (iv) flank protection to capture, not lose,
sediment.Soft measures, including beach nourishment, reef
restoration and mangrove planting are potential ‘bottom-
up’ or ‘no regrets’ alternatives to more resource-intensivemeasures (Sovacool 2011). For example, mangrove res-
toration or planting is relatively inexpensive, can reduce
erosion by stabilizing the sediment and modulating waveenergy, and can also eventually also reduce flooding by
building land through sediment accretion. Mangrove
planting has, therefore, been encouraged in the outeratolls of Kiribati, where resources are more limited and
lower population pressure means people tend to livesetback from the shore (World Bank 2011b, c). There are,
however, some ‘hard’ consequences to choosing only
‘soft’ measures like mangrove planting or restoration(Hallegatte 2009). Mangroves do not protect against
erosion during the first years or decade or growth, are
unsuitable to high energy environments like the openocean shoreline, and could only reduce flooding in the
longer term (Kench 2005; Nunn 2009). As such, in urban
South Tarawa, adaptation planners sometimes recom-mend a combination of hard measures, to protect key
assets from flooding and land loss, and soft measures, to
protect against erosion including that indirectly causedby the hard measures (Juillerat 2012).
While the KAP is pursuing hard (sea walls) and soft
(mangrove planting) measures to protect against sea-levelrise, Kiribati government is also preparing for the possi-
bility of large-scale international migration. The ‘‘Migra-
tion with Dignity’’ initiative looks to identify countrieswith aging populations where the relatively young i-Kiri-
bati population can fill labor needs, provide skills and
cultural training, and begin the transition through seasonaloverseas work programs (Onorio 2013). Our interviews
with religious and village leaders suggest there are a rangeof different views of migration among the i-Kiribati which
would require thorough household surveys to properly
assess. Community consultations conducted for the KAPindicate not only some willingness among the i-Kiribati to
migrate, largely for economic reasons, but also a common
sense of disappointment and sadness about eventuallylosing culture (Hogan 2008).
Table 3 Common measures to protect against erosion and inundation
Category Measure Applicability Cost Limitations
‘‘Hard’’ (protection) Seawalls Erosion andinundation
High Resource needs; slow to implement; maylead to beach loss; poor design leads toovertopping; ongoing maintenance
Land reclamation/artificial islands
Erosion andinundation
High Material needs; engineering demands;ongoing maintenance
Breakwaters Erosion High Resource needs; slow to implement; altershydrodynamics
Gabion baskets Erosion and someinundation
Low to moderate Prone to damage and overtopping;ongoing maintenance; not suitable inhigh energy environments
Groynes Erosion Low to moderate Displaces erosion; alters shoreline
‘‘Soft’’ (accommodation) Mangrove or grassplanting
Erosion and someinundation
Low Slow to implement (grow from saplings);not suitable in high-energyenvironments
Beach nourishment Erosion andinundation
Low Limited lifetime; only suitable to beachenvironments; requires sediment source;ongoing maintenance
Setbacks Erosion andinundation
Variable Difficult in populated or narrow, low-lying islands
Reef conservation Erosion; someinundation
Low Reef sensitivity to climate change andocean acidification
Migration Local (island or atoll) Avoids impacts Moderate to high Availability of unoccupied higher land;traditional land tenure systems
Regional (country) Avoids impacts High Availability of unoccupied higher land;distance and logistics
International Avoids impacts High Potential loss of culture, identity, landrights, power
Sources: Kench (2005), Nicholls et al. (2007), authors’ observations
Sustain Sci
123
Trade-offs and ‘‘no regrets’’ decisions
Many authors recommend that decision-makers focus onflexible policies and ‘‘no-regret’’ measures which would
improve living standards and reduce disaster risk regardless
of the magnitude of climate change (Hallegatte 2009; Adgeret al. 2005; Dessai et al. 2009). Good decision-making
frameworks and flexible practices are sensible in Kiribati
given the variability and possible irreducible uncertaintydescribed in Sect. 4. The episodic nature of El Nino erosion
and inundation events combined with the lack of expertise,
data, and advance planning have already led to poorlydesigned coastal protection measures and uncoordinated
activities (e.g. beach mining) which decrease resilience to
sea-level rise (ADB 2008).Phase II of the KAP emphasized what were considered
‘‘no regrets’’ measures in its choice of pilot projects. These
include (i) development of a coastal zone management sys-tem, to aid in decisions; (ii) mangrove restoration on outer
islands and parts of South Tarawa, generally viewed as a
success in project documents and interviews with KAPmanagement and government officials; and (iii) improve-
ments to the water reticulation system in South Tarawa (not
specifically addressed in this study), needed to address publichealth and sanitation issues (World Bank 2011b, c). Another
concurrent ‘‘no regrets’’ measure, external to the KAP, is an
ongoing €2.2 million European Union funded effort toreduce destructive beach mining by dredging construction
material from the outer lagoon of Tarawa. Although many
coastal geologists may not view a system that could lead tosea wall construction a ‘‘no regret’’ strategy, the adoption of
the coastal zone management system and an associated
‘‘coastal calculator’’ were among the stated principleachievements of Phase II in official reports (World Bank
2011c). The management system provides a framework for
selecting measures to ‘‘climate-proof’’ key public assets andvillages based on a balance of economic, environmental, and
cultural concerns (Kay 2008). The coastal calculator is a
simple, spreadsheet-based model that allows trained users atthe Ministry of Public Works and Utilities (MPWU) to
predict future wave heights, volume of overtopping, and
beach run-up under user-selected future climate scenarios(Ramsay et al. 2008; Ramsay 2010). Together, the tools
provide precise information for setting development stan-
dards, evaluating construction proposals, and designingcoastal protection measures. They also empower the gov-
ernment officials, rather than foreign consultants, to make
decisions based on their choice of scenario and wave event.Precision in climate prediction, however, is different
from accuracy (Dessai and Hulme 2004). Model projec-tions depend upon the choice of climate scenario, the suite
of scenarios from which to choose, and the state of
knowledge at the time the model was developed. In making
infrastructure ‘‘climate-proof’’, the precision of numerical
models can provide false confidence. For example, thecoastal calculator employs scenarios from the 2008 Cli-
mate Risk Report (Ramsay et al. 2008), where the most
extreme scenario in the coastal calculator leads to a sea-level rise of 85 cm by 2100, less than half the maximum
value published in post-AR4 studies (Fig. 3). The chosen
reference height for coastal measures to be climate-proofgiven a maximum sea-level rise of 85 cm by 2100 and a
50-year event may be insufficient with the higher rates ofsea-level rise in the AR5 and the semi-empirical models
(Fig. 3) or with a change in El Nino frequency. Moreover,
even if future sea-level was perfectly knowable, decision-makers must still make normative judgments about the
reference height and/or the acceptable level of risk from
flooding (e.g. protect for a 20-, 50- or 100-year event).These judgments involve present-day tradeoffs which
may have consequences a decade or more in the future.
Although the selected reference height or future scenariocan be regularly revisited, the initial selection may
(i) affect near-term decisions between adaptation measures,
which may have different up-front costs, maintenancecosts, and expected lifetimes (Table 3), or (ii) lead to
capital lock-in to substandard infrastructure. First, sound
fiscal caution can lead to rejecting resource-intensive hardmeasures—and thus avoid making difficult choices about
variables like the reference height—in favor of inexpensive
and more generic community-based soft measures (Barnettand Campbell 2010). For example, according to a policy
officer interviewed in 2013, the medium climate scenario
was chosen in planning a sea wall constructed under KAPIIbecause ‘‘by the time you go to the worst scenario, the
more money you require’’. Second, implementation of a
hard measure, like a sea wall built to a prescribed height orwith a particular design, can lead to capital lock-in to
suboptimal infrastructure which will fail or require main-
tenance not financed in the original plan. As we will see inSect. 7, the sea wall decisions made under KAPII may be
considered by some a case of such maladaptation.
With a planning horizon on the decade-to-century scale,there may not always be clear ‘‘no regrets’’ choices. Decision-
makers must weigh trade-offs between the short- and long-
term costs, as well as the social and political value of differentadaptation measures. Even if uncertainty about long-term sea-
level rise was epistemic, delaying implementation of expen-
sive adaptation measures (e.g. land reclamation) until furtherdata are available risks near-term harm given the year-to-year
ENSO variability in sea-level.
Time horizon of adaptation decisions
A culturally appropriate solution to the trade-offs createdby variability and uncertainty may be found in the coastal
Sustain Sci
123
calculator. The calculator allows users to choose the
timeframe of expected protective measures: for the grand-children te tibu (2012–2036), the great-grand-children tibu-
toru (2036–2050) or the great-great-grand-children tibu-
mwamwanu (2060–2084) (Ramsay 2010). A precautionaryapproach of adapting to the highest projected sea-level rise
may not be prohibitively expensive if the measures are only
designed for te tibu. The anticipated sea-level rise in Tar-awa for the year 2025 in GOK planning assumptions is
3–10 cm. The AR5 projections and semi-empirical modelssuggest that the upper limit may need to be roughly twice
the planning assumption (Sect. 3.1). With this short time
horizon, increasing the sea-level planning assumptionmight not substantially affect the choice between adapta-
tion measures. On a household level, many structures are
renewed on a te tibu time scale since they are constructedby choice or out of necessity from local natural building
materials (Table 2). If only a small fraction of the shoreline
containing recognized key public assets like maneabas,churches, and other public facilities are protected for
beyond te tibu, the scientific uncertainty about sea-level
rise need not be a major limiting factor in many shorelineprotection decisions. Thus, as in KAP II, resources could
be directed towards mangrove planting and restoration on
lagoon shorelines, improving the freshwater distributionsystem, and the investing in hard measures built following
best practices (Sect. 5.1) to protect key public assets.
A multi-decadal planning horizon required for otherassets and community planning may lead to the afore-
mentioned trade-offs, given existing scientific uncertainty.
The GOK assumption for 2050—the end of the tibu-toruperiod—is 6–26 cm sea-level rise, with a mean of 14 cm.
In that case, there may be a difference between the mea-
sures chosen for adapting to the mean (14 cm), originalmaximum (26 cm), and a precautionary maximum sea-
level rise reflecting more recent projections (e.g. 32 cm
globally in AR5; Church et al. 2013) and/or ENSO vari-ability. Planning for a precautionary maximum rise could,
for example, involve land reclamation measures; redevel-
oping flood-prone South Tarawa villages to incorporatesetbacks; migration to wider islets (with more freshwater)
or those with greater protection and water infrastructure;
and further investment in a migration strategy (Table 3).The longer the planning horizon, the more the uncertainty
and variability in sea-level rise projections may influence
adaptation decisions.A compromise solution may be a rolling te-tebu plan-
ning horizon, allowing for gradual revision of policies and
measures in response to observed sea-level rise and newscientific findings. While further investment in research
may not reduce uncertainty in global climate predictions
(Dessai et al. 2009), there are disciplines and regions forwhich additional research and model development could
help constrain decision-making. For example, restricting
analysis to climate models with highest ENSO skill couldconstrain predictions of the frequency of wave overtopping
events in Tarawa. In addition, further effort to characterize
local hydrodynamics, topography, susceptibility to flood-ing, and the effects of human shoreline manipulation could
help guide near-term decision-making (Rankey 2011; Du-
vat 2013; Duvat et al. 2013). Although the output ofmodels like the coastal calculator ultimately depend on
assumptions about global mean sea-level rise, better char-acterization of local hydrodynamics could identify islets
that will be relatively more prone to erosion and
inundation.One risk of a short-term planning horizon is a bias
towards inexpensive measures which may be inadequate to
combat the more existential decade-century scale threatsfrom sea-level rise. Without concurrent long-term or tibu-
mwamwanu planning, the more resource-intensive adapta-
tion measures, like land reclamation and internationalmigration, will be more challenging to implement. Thus
while the KAP has targeted ‘‘no regrets’’ measures and
‘‘climate-proofing’’ key infrastructure, Kiribati PresidentAnote Tong has spoken broadly about the ‘‘Migration with
Dignity’’ initiative and a land purchase in Fiji. Though
there is skepticism about these initiatives—officials fromgovernment ministries and adaptation programs inter-
viewed about the KAP since 2009 expressed concerns that
the high-profile public statements about migration wouldundermine efforts to raise international funds for the
KAP—the uncertainty about the magnitude of sea-level
rise past mid-century warrants investment in both in-country adaptation and international migration strategies.
Adaptation planning in an aid environment
Small developing nations, which generally lack resourcesor technical expertise, are heavily reliant on international
aid for development and adaptation (Barnett and Adger
2003). Kiribati has increasingly attracted climate changeaid due to the country’s developing status, perceived vul-
nerability to the effects of climate change, and minimal
contribution to the causes of climate change. The gover-nance of aid projects and the general aid environment
further influences climate change adaptation decisions in
Kiribati. The KAP experience illustrates three problemscommonly associated with international aid—(i) aid com-
petition, (ii) pressure on local human resources, and (iii)
changing money flows and priorities—which together canslow project implementation and compromise the goal of
making optimal adaptation decisions.
First, aid competition or ‘‘competitive humanitarianism’’(Stirrat 2006) can result in ineffective solutions and poor
Sustain Sci
123
governance in small but high ‘demand’ countries. The
challenge of coordinating multiple donor-driven projectsand meeting foreign reporting requirements results in
bureaucratic logjams, redundancy, and the appearance of
corruption. For example, there have been nine differentinternationally funded reports on Tarawa’s water supply
problems since 1992, all of which assert the same basic
points (White 2010). Different management structures forinitial adaptation projects in Kiribati initially led to com-
petition for resources and slow progress on project imple-mentation (ADB 2008). Although these problems were
assuaged by the creation of a cross-ministry climate change
team under the direction of the Office of Te Berenteiti, theslow progress led to internal cynicism about the use of
international funds and ability of local institutions to
deliver results. Consultants and government policy officers(interviewed in 2007, 2009, 2010 and 2013) commonly
responded to questions about the challenges of the KAP
with concerns the locally unsuitable and ‘‘cumbersome’’World Bank procedures, referred to as a ‘‘bureaucratic
nightmare’’ by one consultant. Such concerns about the
‘‘absorptive capacity’’ of developing nations are also at theforefront of international discussions about climate change
financing (Muller 2008).
Second, genuine efforts to build local capacity to meetinternational standards for project management and to
‘‘mainstream’’ climate change adaptation into govern-
ment business can be undermined by the pressure on localhuman resources. Countries that receive development aid
contribute hidden overheads to the development projects
in the form of the use of limited personnel and facilities(Barnett and Campbell 2010), a problem that is exag-
gerated in small developing countries with limited access
to higher education (Kandlikar et al. 2011). A smallnumber of well-trained i-Kiribati often get recruited to
work on new government projects or out the country
entirely to regional organizations, thus limiting institu-tional memory. Others must direct a large fraction of
their time to the challenge of meeting the unfamiliar
reporting requirements mentioned above and to attendingoverseas meetings, rather than to meeting in-country
needs like training people in their unit and implementing
projects. Phase II of the KAP faced ‘‘severe humanresources and logistical’’ problems, due to lack of spe-
cialist skills and difficulty retaining personnel (World
Bank 2009b). KAP documents (e.g. Kay 2008) and expertinterviews from 2010 to 2013 revealed that technical
capacity-building efforts were hurt by the aforemen-
tioned bureaucratic obstacles shortening planned stafftraining opportunities and by reassignment of the gov-
ernment staff that were trained under KAP consultancies.
The frequent absence of staff due to international com-mitments, noted by Nunn (2009) as a problem throughout
the Pacific, was also reported to us by government staff
and consultants during each of the field visits.Finally, the inconsistent and short-term nature of aid
flows limits implementation and long-term maintenance of
knowledge, equipment, and infrastructure. Expensive, hardmeasures require regular maintenance; there are so many
broken aid-funded sea walls, roads, and water systems in
South Tarawa that the KAPII final report labelled the atolla ‘‘graveyard of short-lived infrastructure investments’’
(Hughes 2011). Similarly, measures aiming at behavioralor system changes, like new coastal planning or decision-
making systems, require a long-term commitment to
training and monitoring. With different donors, ministries,and consultants involved at different stages (see above),
there can be a lack of ownership of these efforts; reports
produced by past projects, like the water system reportsmentioned above (White 2010), are thus not considered by
subsequent projects. The international consultancies, typi-
cally measured in weeks, producing this work are too shortto provide outsiders with sufficient understanding of local
culture to install a new management system. For example,
the i-Kiribati custom of respecting and not confrontingelders and guests can lead government officials to defer
some decisions to foreign experts and consultants, who are
often only in Kiribati for short visits (Watters 2009; Don-ner, pers. obs.). Government policy officers, aid represen-
tatives and KAP documents (Kay 2008) frequently stated
that capacity-building programs tended to be too short togain the staff trust, develop staff commitment to the pro-
gram, or to adequately prepare staff to do the work for
which they were trained or to train others to do that work.Lack of staff confidence to train others is especially critical
given the uncertainty of long-term funding and the afore-
mentioned personnel turnover. One solution to thesechallenges, proposed by two engineering consultants
interviewed in 2013, is increasing the contribution of the
well-equipped regional agencies like the South PacificApplied Geosciences Commission (SOPAC) and the Sec-
retariat of the Pacific Community (SPC) to adaptation
research, monitoring, and training.Taken together, these challenges posed by the aid
environment can directly slow project approval and
implementation. More than 2 years into the 3-year Phase IIof the KAP, 73 % of the project management budget had
been used, but 96 % of the ‘‘land use, physical structures,
and ecosystem’’ funds, which includes coastal protectionmeasures, remained (World Bank, 2009b). Among the
stated challenges in spending implementation funds was
the broad scope, the large number of independent consul-tants, local struggles with the World Bank procurement
systems, and the limited capacity at the MPWU to process
applications for coastal measures through the new coastalzone management framework. In the latter case, a long lag
Sustain Sci
123
in approvals could have led to a ‘‘vicious circle’’ in which
pressure for reactive management reduces the time andenergy available for proactive or longer-term management
which fully considers climate change (Kay 2008). As a
result, KAPII was extended for a year and restructuredwith the narrower focus and key consulting contracts
offered to fewer, larger firms.
Questionable decisions: the KAPII sea walls
In general, delays in implementation may create frustration
within government, among the local people, who hear ofmulti-million dollar international aid projects but do not
see results, and among the financers, who wish to see the
impact of their aid investments. As in other former colo-nies, the legacy of colonialism and the history of interna-
tional development interventions have undermined actual
and perceived adaptive capacity in Kiribati (Watters 2009).Some of the Kiribati public expects that their government
is responsible for development, while some in the gov-
ernment expect that the international community isresponsible for development (Watters 2009; Donner, pers.
obs.). Confirming our anecdotal observations, Kuruppu and
Liverman (2011) found evidence that residents of SouthTarawa expressed lower confidence in their ability to cope
with climate change than residents of outer islands, who
receive limited aid or government support. The slowimplementation of adaptation measures dims public views
of government-run adaptation projects and dims govern-
ment views of the international financers of the project. Acommon local complaint is that the government—or the
international financer—holds plenty of community con-
sultations but fails to implement actions.Under the KAP, these dynamics contributed to com-
promises that may have undermined the initial goal of ‘‘no
regrets’’ adaptation planning. After the restructuring ofPhase II, a new foreign firm was contracted to manage all
coastal projects. A top priority was constructing locally
replicable sea walls protecting the airport runway and threeother pilot implementation sites. The walls were con-
structed using a new variation of the vertical sandbag
design commonly used in the past in Kiribati. This newdesign included an apron to help maintain the wall struc-
ture over time, but no specific measures to protect against
erosion at the base or edges of the walls. Thus, after yearsof investing in capacity-building for coastal zone man-
agement, establishing approval systems for coastal pro-
jects, and developing predictive models, a major output ofthe KAPII was a set of sea walls that did meet best practice
standards.
Within months of their construction, the Office of TeBerenteiti complained that ‘‘the KAPII seawalls have
serious erosion problems’’ (World Bank 2011b). Erosion
occurred at the ends of some of the walls shortly afterconstruction. Interview subjects with coastal expertise and
experience in Kiribati all agreed this was to be expected
from a design that poorly dissipates wave energy. Of the 26experts questioned in 2013 about any general failures and
challenges of the KAP, twelve were able to answer, seven
of whom volunteered the sea walls and erosion as anexample; the other five focused on broader issues like
World Bank procedures. The walls themselves werebroadly seen as sub-standard and described using terms
including ‘‘embarrassing’’, ‘‘built wrong’’, ‘‘poorly done’’,
‘‘not best practice’’, and ‘‘not right’’ in interviews.Interviews and project documents (Hughes 2011; Juill-
erat 2012) revealed that a genuine effort to implement a
locally appropriate solution combined with the pressure totake visible action, aid dynamics and momentum led to the
construction of the sea walls. After numerous delays and
problems, the project was under pressure to do somethingfiguratively and literally concrete; one interview subject
referred to ‘‘scrambling around to slap up sea walls’’.
Though questioned by many as adaptation measures, theadverse effects of sea walls are not well understood in
Kiribati, so sea walls continue to carry status and be a clear
way to demonstrate public spending on adaptation. Thenew firm was tasked with building walls that could real-
istically be replicated in Kiribati by the MPWU; the design
may not reflect best practices developed for the KAP, butstill represents a technical improvement on the traditional
i-Kiribati design. Momentum and World Bank procedures
may have also influenced the final construction decision.Despite the Kiribati government ostensibly being in charge
of KAP decisions, the World Bank process of hiring for-
eign consultants to provide recommendations leads theKiribati government to conclude, in the words of a senior
government policy officer, ‘‘either we do that [their rec-
ommendations], or we just do away with the money’’.Most interview subjects viewed the sea walls as a failure
from an engineering perspective. However, positive com-
ments about the process demonstrated that there are variousways of defining ‘‘success’’. Three of the 2013 interview
subjects—a project manager, an engineer and a policy
officer—who were critical of the sea wall design none-theless emphasized that the goal was to find a compromise
that the existing MPWU sea wall team could easily repli-
cate. Each subject recognized the design flaws but also thechallenge of implementing any large coastal protection
project in Kiribati; regardless of the design issues, the sea
walls have in the end provided at least near-term protectionto key infrastructure. Currently, under Phase III of KAP,
there are plans to add flank protection, wave dissipating
structures and new geotextiles, and to develop new provi-sions about this revised design and incorporation of soft
Sustain Sci
123
measures into the Planning Act. These actions, however,
will depend on the availability of resources.From a policy perspective, the sea walls could then be
viewed as part of the learning process. Given the scientific
uncertainty, the resource limitations, the training chal-lenges, the many actors involved, and the expenditure, the
implementation of any adaptation measure, suboptimal or
not, will be considered by many a preliminary success.
Conclusions
The physical impacts of climate change can be difficult todetect, even in the low-lying atolls of Kiribati (Donner
2012). The physical impacts of the climate change adap-
tation projects, however, are becoming easily visible.Visitors to Tarawa can see the office of the KAP, public
notices and signs, new seawalls, equipment for the mid-
lagoon dredging project, mangrove saplings plantedalongside several causeways, new water tanks in certain
villages, and construction of new water pipes for the
reticulation system. Like all first steps, these initial actionstowards adapting to an uncertain future are cautious,
unsure, and sometimes backwards.
Our qualitative analysis of climate change adaptationefforts in Kiribati reveals several key themes, which may
not be apparent from more a technical assessment of cli-
mate change adaptation. First, a culturally appropriateshort-term (*20 years) planning horizon may help reduce
uncertainty and the trade-offs between adaptation options.
In the short-term or te-tibu, the range of sea-level predic-tions may be small enough to not seriously confound
adaptation decisions. Second, these decisions must be
regularly revisited, based on data collected on their effec-tiveness and reviews of the latest global sea-level data and
predictions. Third, a broad adaptation program needs a
concurrent mid- to late-century planning horizon, whichconsiders expensive adaptation measures (e.g. land recla-
mation) and international migration, as a precautionary
measure and to avoid biasing all adaptation decisionstowards easier short-term actions. Finally, revisiting deci-
sions and maintaining multiple planning horizons require
consistent long-term financial support and personnel.Otherwise, new projects and new personnel will expend
time and resources maintaining, repairing or replacing old
systems and infrastructure.The financial cost of such adaptation may match or
exceed that of mitigation (Donner et al. 2011). The
financing required to further notoriously sluggish capacitybuilding efforts, to maintain rolling short-term implemen-
tation efforts, and to correct mistakes is enormous. For
example, Phase III of the KAP budgeted US$2.8 millionfor coastal protection, which includes protecting an
ambitious 1.6 km of shoreline for a 25-year period using
various measures, maintenance funds for three of the25 years, as well as advisory support and other inexpensive
supporting projects. At that rate, protecting the shoreline of
South Tarawa, one of dozens of atolls in the Pacific andIndian Ocean, would cost well in excess of US$100 mil-
lion, without accounting for maintenance costs, rehabili-
tation or reconstruction after storm events, or the sourcingof material. While it is neither realistic nor advisable to
construct such protective measures along the entire shore-line of South Tarawa, the estimate is demonstrative of the
scale of financing that may be required for climate change
adaptation in one small nation.
Acknowledgments The authors thank the Ministry of Fisheries andMarine Resource Development and the Kiribati Adaptation Programfor their assistance throughout this research. Special thanks go to T.Kirata, A. Tekiau, T. Teema and T. Beiateuea for all their help overthe years in coordinating field visits, providing an informal educationon i-Kiribati culture, and nursing the lead author to health during about with dengue fever. The authors also thank two anonymousreviewers for their constructive criticism of earlier drafts, and J.Lehman for her assistance in initial literature research. This work wassupported by the NSERC Discovery Program (S. Donner), an SSHRCgraduate award (S. Webber), and a UBC Hampton Award (S.Donner).
References
Adger WN, Huq S, Brown K, Hulme M (2003) Adaptation to climatechange in the developing world. Prog Dev Stud 3:179–195
Adger WN, Arnell NW, Tompkins EL (2005) Successful adaptationto climate change across scales. Glob Env Chang Part A15:77–86
Agarwal A, Narain S (1991) Global warming in an unequal world: acase of environmental colonialism. Centre for Science andEnvironment, New Delhi, p 34
Allen KM (2006) Community-based disaster preparedness andclimate adaptation: local capacity-building in the Philippines.Disasters 30:81–101
Asian Development Bank (ADB) (2008). Kiribati social andeconomic report 2008: managing development risk. Mandalu-yong City, Philippines
Barnett L (2001) Adapting to climate change in Pacific IslandCountries: the problem of uncertainty. World Dev 29:977–993
Barnett J, Adger WN (2003) Climate dangers and atoll countries.Clim Chang 61:321–337
Barnett J, Campbell J (2010) Climate change and small island states:power, knowledge and the South Pacific. Earthscan, London
Becker MB, Meyssignac C, Letetrel C, Llovel W, Cazenave A,Delcroix T (2012) Sea level variations at tropical Pacific islandssince 1950. Glob Planet Chang 80–81:85–98. doi:10.106/j.gloplacha.2011.09.004
Bedford R, Bedford C (2011) International migration and climatechange: a post-Copenhagen perspective on options for Kiribatiand Tuvalu. In: Climate change and migration: South Pacificperspectives. pp 89–134
Biribo N, Woodroffe CD (2013) Historical area and shoreline changeof reef islands around Tarawa Atoll, Kiribati. Sustain Sci. doi:10.1007/s11625-013-0210-z
Sustain Sci
123
Burton I, Huq S, Lim B, Pilifosova O, Schipper EL (2002) Fromimpacts assessment to adaptation priorities: the shaping ofadaptation policy. Clim Policy 2:145–159
Church JA, Clark PU, Cazenave A, Gregory JM, Jevrejeva S,Levermann A, Merrifield MA, Milne GA, Nerem RS, Nunn PD,Payne AJ, W. Pfeffer WT, Stammer D. Unnikrishnan AS (2013)Chapter 13: Sea Level Change. In: Climate Change 2013: ThePhysical Science Basis Contribution of Working Group I to theFifth Assessment Report of the Intergovernmental Panel onClimate Change
Cowell PJ, Kench PS (2001) The morphological response of atollislands to sea level rise. Part 1: Modifications to the modifiedshoreface translation model. J Coast Res 34:633–644
Dessai S, Hulme M (2004) Does climate adaptation policy needprobabilities? Clim Policy 4:107–128
Dessai S, Hulme M, Lempert R, Pielke R (2009) Do we need betterpredictions to adapt to a changing climate? EOS Trans AGU90:111–112
Donner SD (2012) Sea level rise and the Battle of Tarawa. EOS TransAGU 93:169–170
Donner SD, Kirata T, Vieux C (2010) Recovery for 2004–2005 masscoral bleaching in the Gilbert Islands. Kiribati, Atoll Res Bull No587
Donner SD, Kandlikar M, Zerriffi H (2011) Preparing to manageclimate change financing. Science 334:908–909
Duvat V (2013) Coastal protection structures in Tarawa Atoll, Republicof Kiribati. Sustain Sci. doi:10.1007/s11625-013-0205-9
Duvat V, Magnan A, Pouget F (2013) Exposure of atoll population tocoastal erosion and flooding: a South Tarawa assessment,Kiribati. Sustain Sci 8:423–440
Eakin HC, Wehbe MB (2009) Linking local vulnerability to systemsustainability in a resilience framework: two cases from LatinAmerica. Clim Chang 93:355–377
Fankhauser S, Smith JB, Tol RSJ (1999) Weathering climate change:some simple rules to guide adaptation decisions. Ecol Econ30:67–78
Folke C (2006) Resilience: The emergence of a perspective for social-ecological systems analyses. Glob Env Chang 16:253–267
Fussel HM (2007) Adaptation planning for climate change: concepts,assessment approaches, and key lessons. Sustain Sci 2:265–275
GOK (2007a) Kiribati Millennium Development Goals Report.Ministry of Environment, Land and Agricultural Development
GOK (2007b) Kiribati National Adaptation Program of Action(NAPA) Climate Change Study Team, Environment and Con-servation Division, Ministry of Environment, Land and Agri-cultural Development
GOK (2012) Report on the Kiribati 2010 census of population andhousing. National Statistics Office, Ministry of Finance andEconomic Planning, Bairiki, Tarawa
Government of Kiribati (GOK) (2005) Kiribati climate changeadaptation strategy. Bairiki, Tarawa, Kiribati
Grinsted A, Moore JC, Jefrejeva S (2010) Reconstructing sea levelfrom paleo and projected temperatures 200 to 2100 AD. ClimDyn 34:461–472
Hallegatte S (2009) Strategies to adapt to an uncertain climatechange. Glob Env Chang 19:240–247
Hay JE (2006) Climate risk profile for Kiribati. John Hay andAssociates Limited, New Zealand
Hay JE (2013) Small island developing states: coastal systems, globalchange and sustainability. Sustain Sci 8:309–326
Heltberg R, Siegel PB, Jorgensen SL (2009) Addressing humanvulnerability to climate change: toward a ‘no-regrets’ approach.Glob Env Chang 19:89–99
Hogan C (2008). Survey of public awareness and attitudes towardsclimate change issues and challenges. KAP Stage II BaselineStudy Report. Tarawa, Kiribati
Horton R, Herweijer C, Rosenzweig C, Liu J, Gornitz V, Ruane AC(2008) Sea level rise projections for current generation CGCMsbased on the semi-empirical method. Geophys Res Let 35.doi:10.1029/2007GL032486
Howorth R (1983) Coastal erosion in Kiribati; visit to South Tarawa23 August to 8 September 1983. CCOP/SOPAC TechnicalReport 31
Hughes T (2011) Unfinished business. KAPII Implementation Com-pletion Report for Government of Kiribati, KAP, Tarawa,Kiribati
Huq S, Reid H (2004) Mainstreaming adaptation in development. IDSBull 35:15–21
Jevrejeva S, Moore JC, Grinsted A (2010) How will sea level respondto changes in natural and anthropogenic forcings by 2100?Geophys Res Let 37:L07703. doi:10.1029/2010GL042947
Jones P, Lea J (2007) What has happened to urban reform in theisland Pacific? Some lessons from Kiribati and Samoa. Pac Aff80:473–491
Juillerat C (2012) Site Visit/Technical Assessment Nippon causewayBairiki side seawall/land reclamation for Maiana Maneaba.Report prepared by Cliff Juillerat, Senior Coastal/Civil EngineerMinistry of Public Works and Utilities, Tarawa, Kiribati
Kandlikar M, Zerriffi H, Ho Lem C (2011) Science, decision-makingand development: managing the risks of climate variation in less-industrialized countries. Wiley Interdiscipl Rev Clim Chang2:201–219. doi:10.1002/wcc.98
Kay R (2008) Development of an integrated climate changeadaptation risk diagnosis and planning process: final report.Report prepared for the KAP Project, Phase II. Coastal ZoneManagement Pty Ltd, Perth
Kench P (2005) Coastal protection measures report: Kiribati adap-tation program. Preparation for Phase II Project. KiribatiAdaptation Program, Tarawa, Kiribati
Kuruppu N, Liverman D (2011) Mental preparation for climateadaptation: the role of cognition and culture in enhancingadaptive capacity of water management in Kiribati. GlobEnviron Chang 21:657–669
Lieber MD (1977) Exiles and migrants in oceania. Association forSocial Anthropology in Oceania Monograph Series. The Uni-versity Press of Hawaii, Honolulu
Meehl, GA, Stocker TF, Collins WD, Friedlingstein P, Gaye AT,Gregory JM, Kitoh A, Knutti R, Murphy JM, Noda A, RaperSCR, Watterson IG, Weaver AJ, Zhao, ZC (2007) Global climateprojections. In: Solomon S, Qin D, Manning M, Chen X MarquisM, Avery KB, Tignor M, Miller HL (eds). Climate change 2007:the physical science basis. Contribution of Working Group I tothe Fourth Assessment Report of the Intergovernmental Panel onClimate Change, Cambridge University Press, Cambridge
Merrifield MA, Thompson PR, Lander M (2012) Multidecadal sealevel anomalies and trends in the western tropical Pacific.Geophys Res Lett 39. doi:10.1029/2012GL052032
Mimura N, Nurse L, McLean RF, Agard L, Briguglio L, Lefale P,Payet R, Sem G (2007) Small islands. In: Parry ML, CanzianiOF, Palutikof JP, Van der Linden PJ, Hanson CE (eds) Climatechange 2007: impacts, adaptation and vulnerability. Contributionof Working Group II to the Fourth Assessment Report of theIntergovernmental Panel on Climate Change. Cambridge Uni-versity Press, Cambridge
Muller B (2008) International adaptation finance: the need for aninnovative and strategic approach. Oxford Institute for EnergyStudies, Oxford
Nicholls RJ, Cazenave A (2010) Sea-level rise and its impact oncoastal zones. Science 328:1517–1520
Nicholls RJ, Wong PP, Burkett VR, Codignotto JO, Hay JE, McLeanRF, Ragoonaden S, Woodroffe SD (2007) Coastal systems andlow-lying areas. In: Parry ML, Canziani OF, Palutikof JP, Van
Sustain Sci
123
der Linden PJ, Hanson CE (eds) Climate change 2007: impacts,adaptation and vulnerability. Contribution of Working Group IIto the Fourth Assessment Report of the Intergovernmental Panelon Climate Change. Cambridge University Press, Cambridge
Nunn PD (2009) Responding to the challenges of climate change inthe Pacific Islands: management and technological imperatives.Clim Res 40:211–231
Onorio T (2013) Key note address by Hon. Vice President TeimaOnorio on the occasion of the Nansen Initiative Pacific RegionalConsultations. Edgewater Resort, Rarotonga, May 21–25, 2013.http://www.nanseninitiative.org/
Pfeffer WT, Harper JT, O’Neel S (2008) Kinematic constraints onglacier contributions to 21st-century sea-level rise. Science321:1340
Ramsay D (2010) Kiribati Adaptation Program Phase II. Informationfor Climate Risk Management: Coastal Calculator operationalHandbook. NIWA Report: HAM 2009-165. National Institute ofWater and Atmospheric Research Ltd., Hamilton, NZ
Ramsay D, Stephens S, Gorman R, Oldman J, Bell R (2008) KiribatiAdaptation Program. Phase II. Information for climate riskmanagement: sea-levels, waves, run-up and overtopping. NIWAReport: HAM 2008-022. National Institute of Water andAtmospheric Research Ltd., Hamilton, New Zealand
Rankey EC (2011) Nature and stability of atoll island shorelines:Gilbert Island chain, Kiribati, equatorial Pacific. Sedimentology58:1831–1859
Smit B, Wandel J (2006) Adaptation, adaptive capacity and vulner-ability. Glob Env Chang 16:282–292
Solomon SM, Forbes DL (1999) Coastal hazards and associatedmanagement issues on South Pacific Islands. Ocean Coast Man42:523–554
Sovacool BK (2011) Hard and soft paths for climate changeadaptation. Clim Pol 11:1177–1183
Stirrat J (2006) Competitive humanitarianism. Anthro Today 22:11Storey D, Hunter S (2010) Kiribati: an environmental ‘perfect storm’.
Aust Geogr 41:167–181. doi:10.1080/00049181003742294Tompkins EL, Adger NW (2005) Defining response capacity to
enhance climate change policy. Env Sci Pol 8:562–571Vermeer M, Rahmstorf S (2009) Global sea level linked to global
temperature. Proc Nat Acad Sci 106:21527Watters R (2009) Journeys towards progress: essays of a geographer
on development and change in Oceania. Victoria UniversityPress, Wellington
Webb A (2005) Technical report—an assessment of coastal pro-cesses, impacts, erosion mitigation options and beach mining(Bairiki/Nanikai causeway, Tungaru Central Hospital coastlineand Bonriki runway—South Tarawa, Kiribati), EU-SOPACProject Report 46, South Pacific Applied Geosciences Commis-sion, Suva, Fiji
Webb AP, Kench PS (2010) The dynamic response of reef islands tosea-level rise: evidence from multi-decadal analysis of islandchange in the Central Pacific. Glob Planet Chang 72:234–246.doi:10.1016/j.gloplacha.2010.05.003
Webber S (2013) Performative vulnerability: climate change adap-tation policies and financing in Kiribati. Environ Plann A45:2717–2733
White I (2010) Tarawa water master plan: Te Ran-Maitira aeKainanoaki, future water demand. KAP Phase II Water Com-ponent 3.2.1, December 2010, Australian National University
White I, Falkland A, Metutera T, Metai E, Overmars M, Perez P,Dray A (2007) Climatic and human influences on groundwater inlow atolls. Vadose Zone J 6:581–590
Woodroffe CD (2008) Reef-island topography and the vulnerabilityof atolls to sea-level rise. Glob Planet Chang 62:77–96. doi:10.1016/j.gloplacha.2007.11.001
World Bank (2006) Project appraisal document on a proposed grantfrom the Global Environment Facility Trust Fund. Report No.35969-KI. Rural Development and Natural Resources SectorUnit East Asia and Pacific Region, World Bank, Washington,DC
World Bank (2009b) Kiribati Adaptation Project—ImplementationPhase (KAPII): restructuring. Washington, DC
World Bank (2011a) Country Assistance Strategy for the Republic ofKiribati: FY2011-2014. Report No. 59355-KI, Timor Leste,Papua New Guinea, and Pacific Islands Country ManagementUnit, East Asia and Pacific Region, International FinanceCorporation, World Bank, Washington DC
World Bank (2011b) Kiribati Adaptation Project—ImplementationPhase (KAPII): Project Implementation Completion and ResultsReport. Report No: ICR00001751. Washington, DC
World Bank (2011c) Kiribati Adaptation Program Phase III ProjectAppraisal Document. Report No: 63874-KI. World Bank,Washington, DC
Sustain Sci
123


![Biomimetic Motor Behavior for Simultaneous Adaptation of ... · requires continuous adaptation of force, impedance, and, to avoid obstacles, of trajectory [5]. If a task has reproducible](https://img.pdfslide.us/doc/110x75/5e8a63187f25ba775413dab5/biomimetic-motor-behavior-for-simultaneous-adaptation-of-requires-continuous.jpg)