Embed Size (px)
Citation preview

Corporate PresentationAugust 2017
ObsidianEnergy.com | TSX/NYSE: OBE
Important Notices to the Readers
This presentation should be read in conjunction with the Company's audited consolidated financial statements, management's discussion and analysis ("MD&A") for the three and six months ended June 30, 2017. All dollar amounts contained in this presentation are expressed in millions of Canadian dollars unless otherwise indicated.
Certain financial measures included in this presentation do not have a standardized meaning prescribed by International Financial Reporting Standards (“IFRS”) and therefore are considered non-generally accepted accounting practice ("non-GAAP") measures; accordingly, they may not be comparable to similar measures provided by other issuers. This presentation also contains oil and gas disclosures, various industry terms, and forward-looking statements, including various assumptions on which such forward-looking statements are based and related risk factors. Please see the Company's disclosures located in the Appendix at the end of this presentation for further details regarding these matters.
2
ObsidianEnergy.com | TSX/NYSE: OBE
3
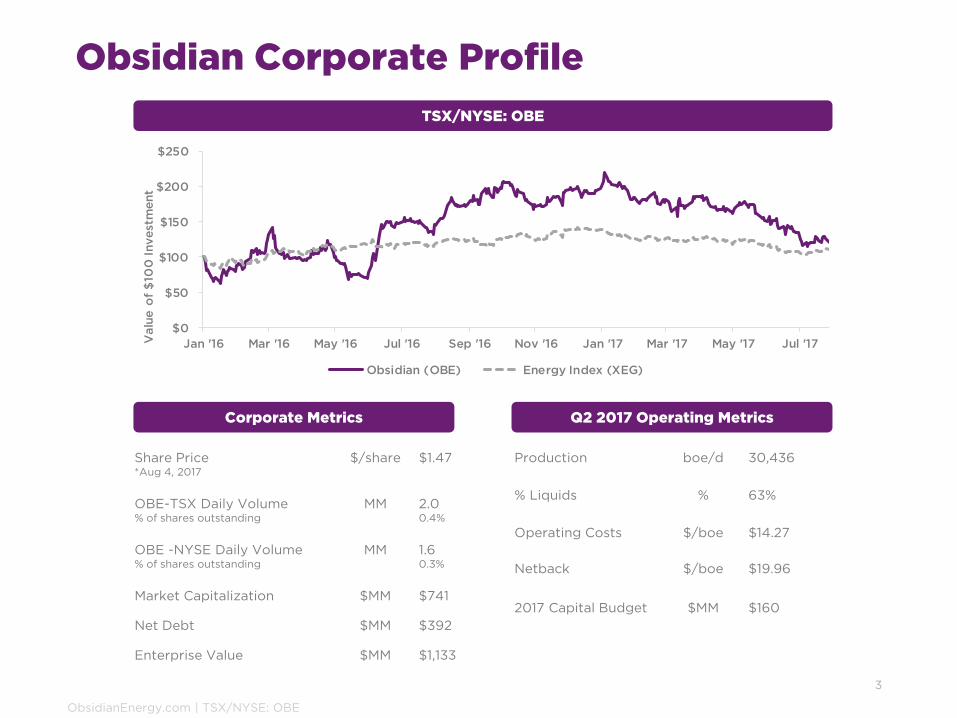
Obsidian Corporate Profile
TSX/NYSE: OBE
Production boe/d 30,436
% Liquids % 63%
Operating Costs $/boe $14.27
Netback $/boe $19.96
2017 Capital Budget $MM $160
$0
$50
$100
$150
$200
$250
Jan '16 Mar '16 May '16 Jul '16 Sep '16 Nov '16 Jan '17 Mar '17 May '17 Jul '17Valu
e o
f $
100
Invest
ment
Obsidian (OBE) Energy Index (XEG)
Share Price*Aug 4, 2017
$/share $1.47
OBE-TSX Daily Volume% of shares outstanding
MM 2.00.4%
OBE -NYSE Daily Volume% of shares outstanding
MM 1.60.3%
Market Capitalization $MM $741
Net Debt $MM $392
Enterprise Value $MM $1,133
Corporate Metrics Q2 2017 Operating Metrics

ObsidianEnergy.com | TSX/NYSE: OBE
What Obsidian Energy Means to Us
The name honours that our foundation is a natural resource that is honed to support the good of mankind. To us, the name, Obsidian Energy, reflects that we will build a bright future shaped by discipline and precision; our Company will be intentional and professional in everything we do.
4
Disciplined
Technically and commercially guided by clear purpose and intention, with focused resources and capability to act and learn.
Relentless
Passionately driven to meet our goals and deliver meaningful results.
Accountable
Deeply committed to one another, our shareholders, our partners, and our neighbours to be the company of choice.
ObsidianEnergy.com | TSX/NYSE: OBE
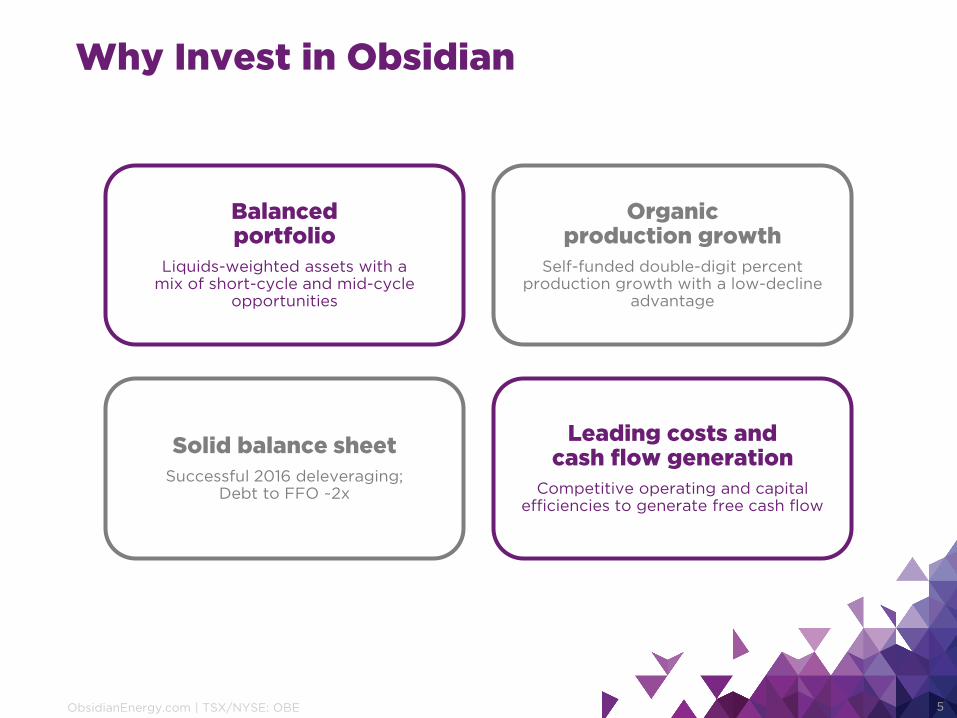
Why Invest in Obsidian
5
Balancedportfolio
Liquids-weighted assets with amix of short-cycle and mid-cycle
opportunities
Organicproduction growth
Self-funded double-digit percent production growth with a low-decline
advantage
Leading costs andcash flow generation
Competitive operating and capital efficiencies to generate free cash flow
Solid balance sheet
Successful 2016 deleveraging;Debt to FFO ~2x
ObsidianEnergy.com | TSX/NYSE: OBE
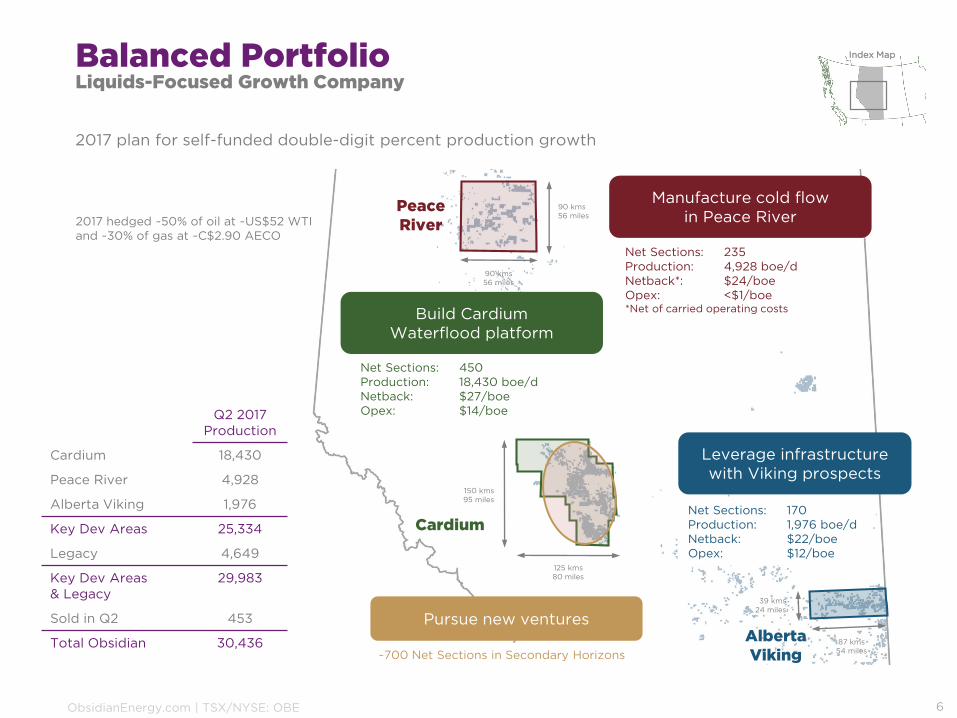
Balanced PortfolioLiquids-Focused Growth Company
6
AlbertaViking
Cardium
150 kms95 miles
125 kms80 miles
39 kms24 miles
87 kms54 miles
PeaceRiver
90 kms56 miles
90 kms56 miles
Build CardiumWaterflood platform
Pursue new ventures
Net Sections: 450Production: 18,430 boe/dNetback: $27/boeOpex: $14/boe
Net Sections: 235Production: 4,928 boe/dNetback*: $24/boeOpex: <$1/boe*Net of carried operating costs
Net Sections: 170Production: 1,976 boe/dNetback: $22/boeOpex: $12/boe
Manufacture cold flowin Peace River
Leverage infrastructure with Viking prospects
~700 Net Sections in Secondary Horizons
2017 plan for self-funded double-digit percent production growth
Index Map
2017 hedged ~50% of oil at ~US$52 WTI and ~30% of gas at ~C$2.90 AECO
Q2 2017 Production
Cardium 18,430
Peace River 4,928
Alberta Viking 1,976
Key Dev Areas 25,334
Legacy 4,649
Key Dev Areas& Legacy
29,983
Sold in Q2 453
Total Obsidian 30,436
ObsidianEnergy.com | TSX/NYSE: OBE
3
10
21
7
5
26
3
10
26
33
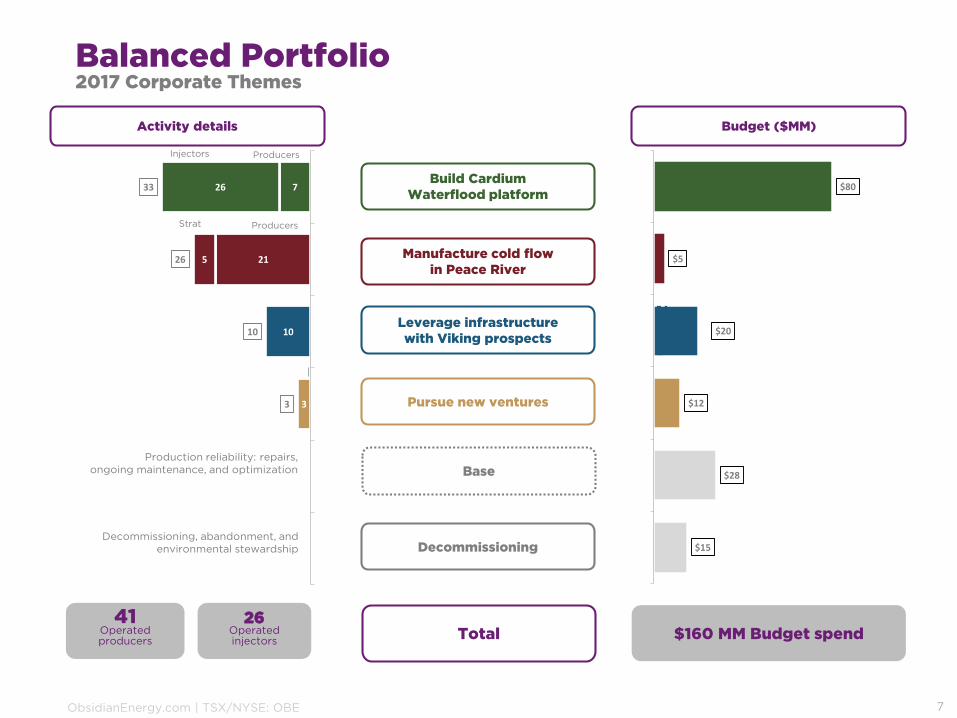
$15
$28
$12
$20
$5
$80
Balanced Portfolio2017 Corporate Themes
7
Activity details Budget ($MM)
Build Cardium Waterflood platform
Manufacture cold flowin Peace River
Leverage infrastructurewith Viking prospects
Pursue new ventures
Base
Decommissioning
ProducersInjectors
Strat Producers
Total
Production reliability: repairs,ongoing maintenance, and optimization
Decommissioning, abandonment, and environmental stewardship
$160 MM Budget spend41
Operatedproducers
26Operatedinjectors
ObsidianEnergy.com | TSX/NYSE: OBE
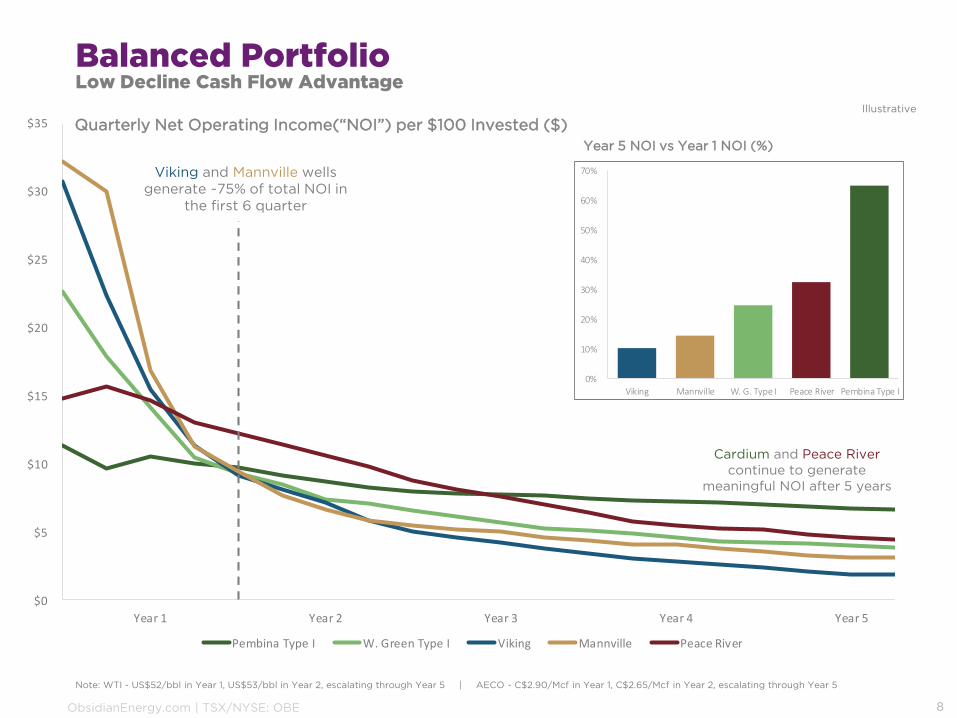
$0
$5
$10
$15
$20
$25
$30
$35
Year 1 Year 2 Year 3 Year 4 Year 5
Pembina Type I W. Green Type I Viking Mannville Peace River
Balanced PortfolioLow Decline Cash Flow Advantage
8
Note: WTI - US$52/bbl in Year 1, US$53/bbl in Year 2, escalating through Year 5 | AECO - C$2.90/Mcf in Year 1, C$2.65/Mcf in Year 2, escalating through Year 5
Illustrative
0%
10%
20%
30%
40%
50%
60%
70%
Viking Mannville W. G. Type I Peace River Pembina Type I
Viking and Mannville wells generate ~75% of total NOI in
the first 6 quarter
Cardium and Peace River continue to generate
meaningful NOI after 5 years
Quarterly Net Operating Income(“NOI”) per $100 Invested ($)
Year 5 NOI vs Year 1 NOI (%)
ObsidianEnergy.com | TSX/NYSE: OBE
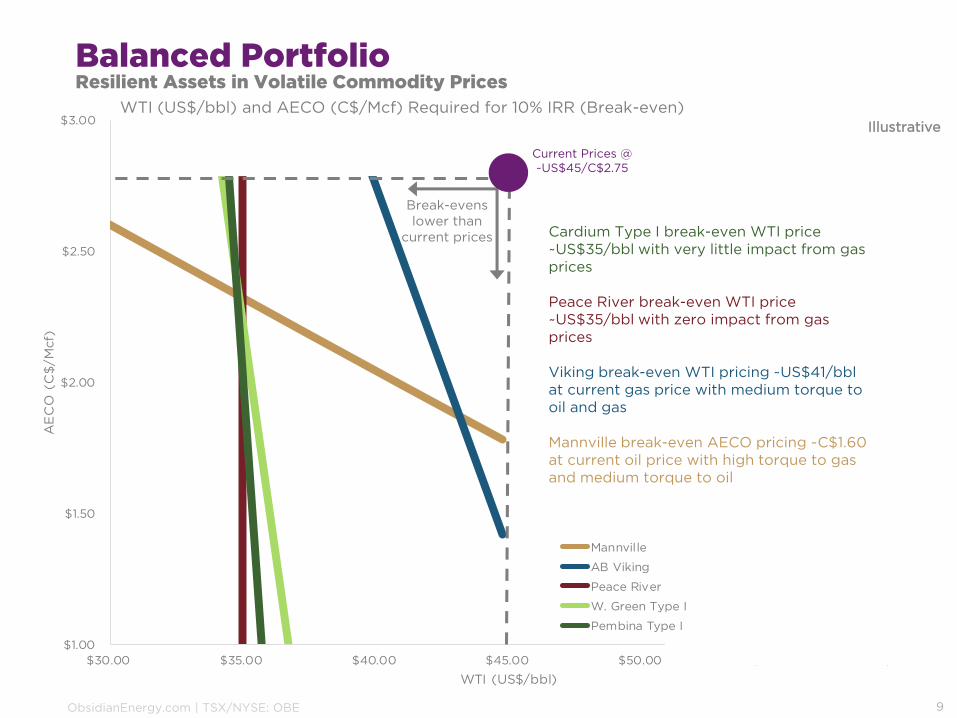
$1.00
$1.50
$2.00
$2.50
$3.00
$30.00 $35.00 $40.00 $45.00 $50.00 $55.00 $60.00
AE
CO
(C
$/M
cf)
WTI (US$/bbl)
Mannville
AB Viking
Peace River
W. Green Type I
Pembina Type I
Balanced PortfolioResilient Assets in Volatile Commodity Prices
Current Prices @ ~US$45/C$2.75
Break-evens lower than
current prices
Illustrative
Cardium Type I break-even WTI price ~US$35/bbl with very little impact from gas prices
Peace River break-even WTI price ~US$35/bbl with zero impact from gas prices
Viking break-even WTI pricing ~US$41/bbl at current gas price with medium torque to oil and gas
Mannville break-even AECO pricing ~C$1.60 at current oil price with high torque to gas and medium torque to oil
WTI (US$/bbl) and AECO (C$/Mcf) Required for 10% IRR (Break-even)
9
ObsidianEnergy.com | TSX/NYSE: OBE
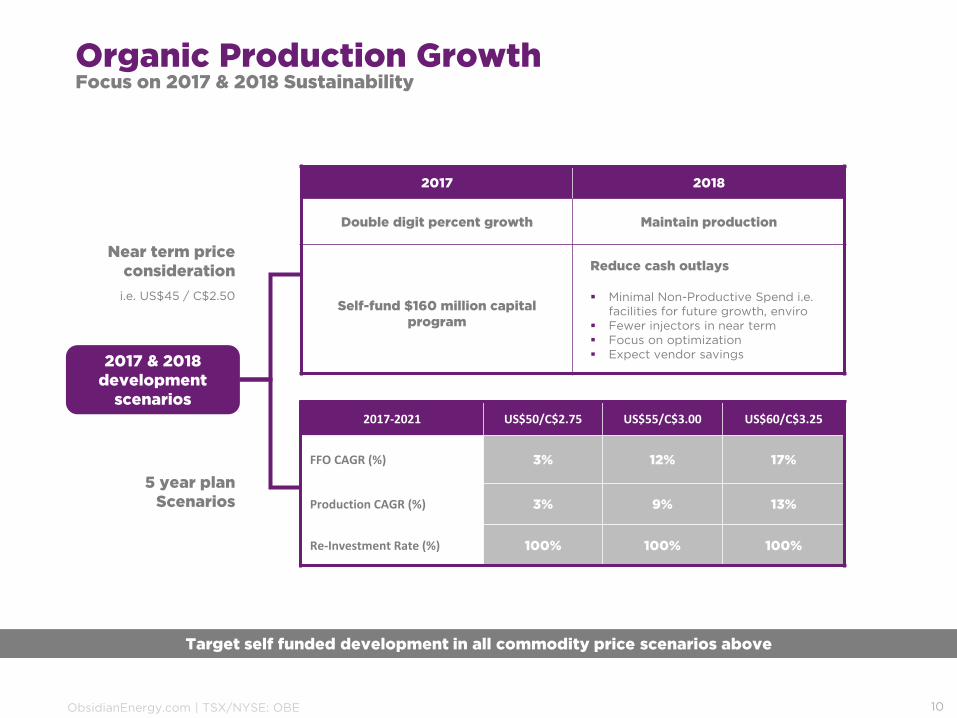
Organic Production GrowthFocus on 2017 & 2018 Sustainability
10
2017 & 2018 development
scenarios
Near term price consideration
i.e. US$45 / C$2.50
2017 2018
Double digit percent growth Maintain production
Self-fund $160 million capital program
Reduce cash outlays
▪ Minimal Non-Productive Spend i.e. facilities for future growth, enviro
▪ Fewer injectors in near term▪ Focus on optimization▪ Expect vendor savings
5 year planScenarios
Target self funded development in all commodity price scenarios above
2017-2021 US$50/C$2.75 US$55/C$3.00 US$60/C$3.25
FFO CAGR (%) 3% 12% 17%
Production CAGR (%) 3% 9% 13%
Re-Investment Rate (%) 100% 100% 100%
ObsidianEnergy.com | TSX/NYSE: OBE
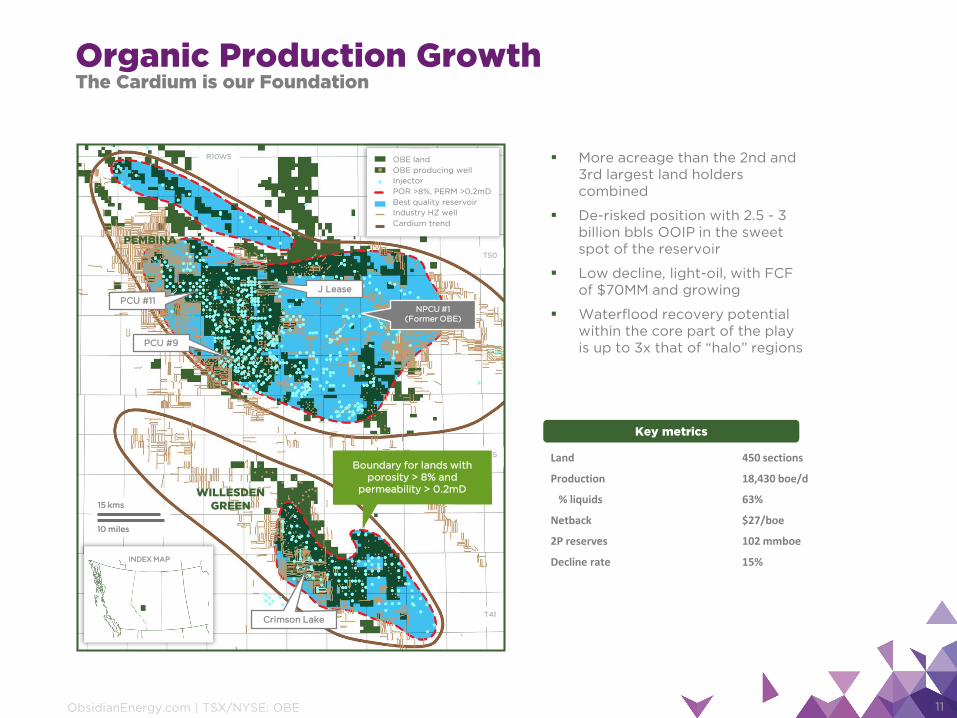
Organic Production GrowthThe Cardium is our Foundation
11
R5R10W5
INDEX MAP
10 miles
15 kms
PEMBINA
WILLESDENGREEN
T50
T45
T41
Boundary for lands withporosity > 8% and
permeability > 0.2mD
NPCU #1(Former OBE)
PCU #11
J Lease
Crimson Lake
PCU #9
OBE land
OBE producing well
Injector
POR >8%, PERM >0.2mD
Best quality reservoir
Industry HZ well
Cardium trend
Key metrics
▪ More acreage than the 2nd and 3rd largest land holders combined
▪ De-risked position with 2.5 - 3 billion bbls OOIP in the sweet spot of the reservoir
▪ Low decline, light-oil, with FCF of $70MM and growing
▪ Waterflood recovery potential within the core part of the play is up to 3x that of “halo” regions
Land 450 sections
Production 18,430 boe/d
% liquids 63%
Netback $27/boe
2P reserves 102 mmboe
Decline rate 15%
ObsidianEnergy.com | TSX/NYSE: OBE
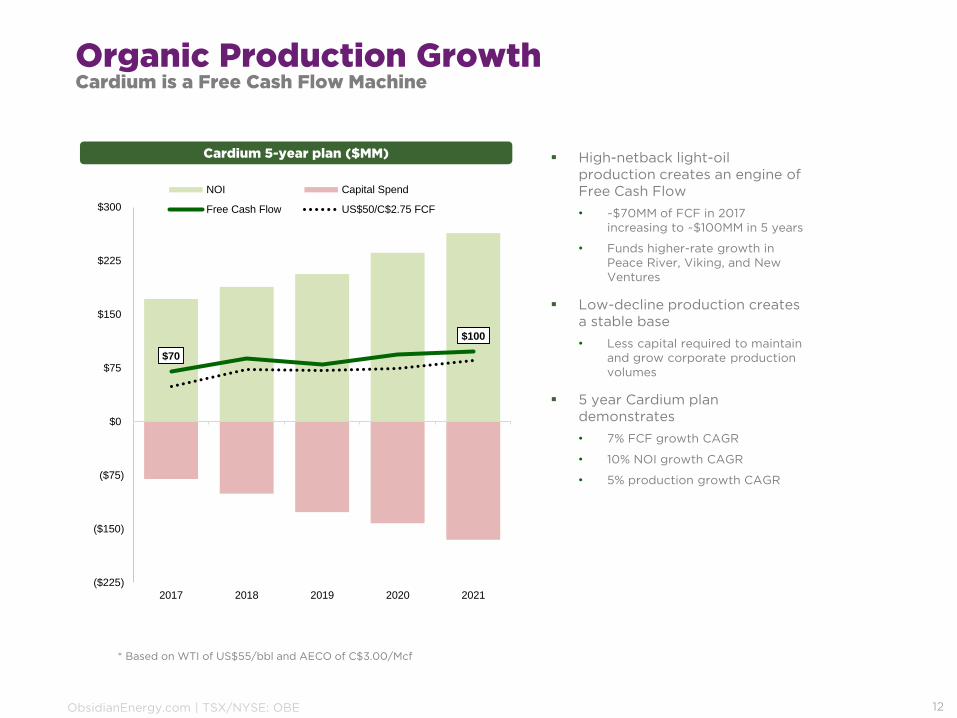
Organic Production GrowthCardium is a Free Cash Flow Machine
12
▪ High-netback light-oil production creates an engine of Free Cash Flow
• ~$70MM of FCF in 2017 increasing to ~$100MM in 5 years
• Funds higher-rate growth in Peace River, Viking, and New Ventures
▪ Low-decline production createsa stable base
• Less capital required to maintain and grow corporate production volumes
▪ 5 year Cardium plan demonstrates
• 7% FCF growth CAGR
• 10% NOI growth CAGR
• 5% production growth CAGR
Cardium 5-year plan ($MM)
$70
$100
($225)
($150)
($75)
$0
$75
$150
$225
$300
2017 2018 2019 2020 2021
NOI Capital Spend
Free Cash Flow US$50/C$2.75 FCF
* Based on WTI of US$55/bbl and AECO of C$3.00/Mcf
ObsidianEnergy.com | TSX/NYSE: OBE
A Lease
Bear Lake
Ca rrot Creek
Crimson Lake
D Lease
Easyford
F Lease
F araway
G Lease
J Lease
Lobstick
Lodgepole
NPCU #1
NW PCU #1
Open Creek
Paddy Creek
PCU #11
PCU #9
Rose Creek
0%
20%
40%
60%
80%
100%
120%
0% 5% 10% 15% 20% 25% 30% 35% 40% 45%
Wat
ercu
t (%
)
Recovery Factor (%)
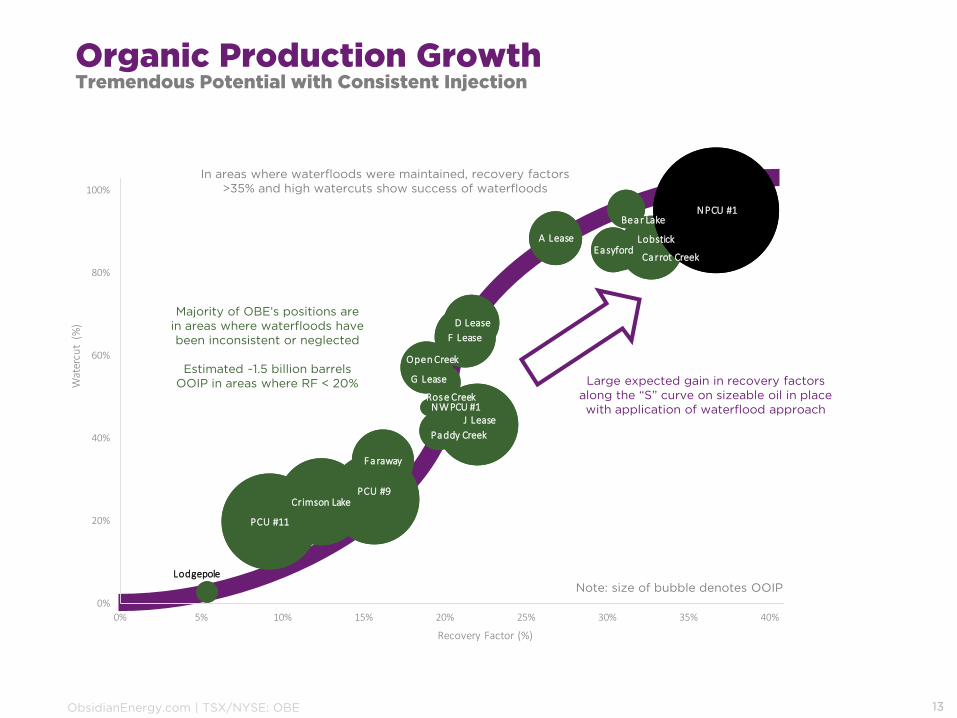
In areas where waterfloods were maintained, recovery factors >35% and high watercuts show success of waterfloods
Large expected gain in recovery factors along the “S” curve on sizeable oil in place with application of waterflood approach
Majority of OBE’s positions are in areas where waterfloods have been inconsistent or neglected
Estimated ~1.5 billion barrels OOIP in areas where RF < 20%
Note: size of bubble denotes OOIP
Organic Production GrowthTremendous Potential with Consistent Injection
13

ObsidianEnergy.com | TSX/NYSE: OBE
TYPE IHz Producers, Vert Injectors
TYPE IIHz Injector Conversions
TYPE IIIVert Infill Producer/Injector
TYPE IVNo Infill/Opt Existing WF
A pattern is made up ofone horizontal producer that is supported by 3 vertical water injectors
Infill drilling of vertical producers or injectors to
complete patterns
Reactivate injector
Stimulate injector
Optimize producer
Re-frac injector
Convert existing horizontal producers to
injection
~80-85% of Cardium developed
with Type I
~5-10% of Cardium developed
With Type II
~5% of Cardiumdeveloped with
Type III
~5% of Cardiumdeveloped with
Type IV
Organic Production GrowthFour Cardium Development Types
14
ObsidianEnergy.com | TSX/NYSE: OBE
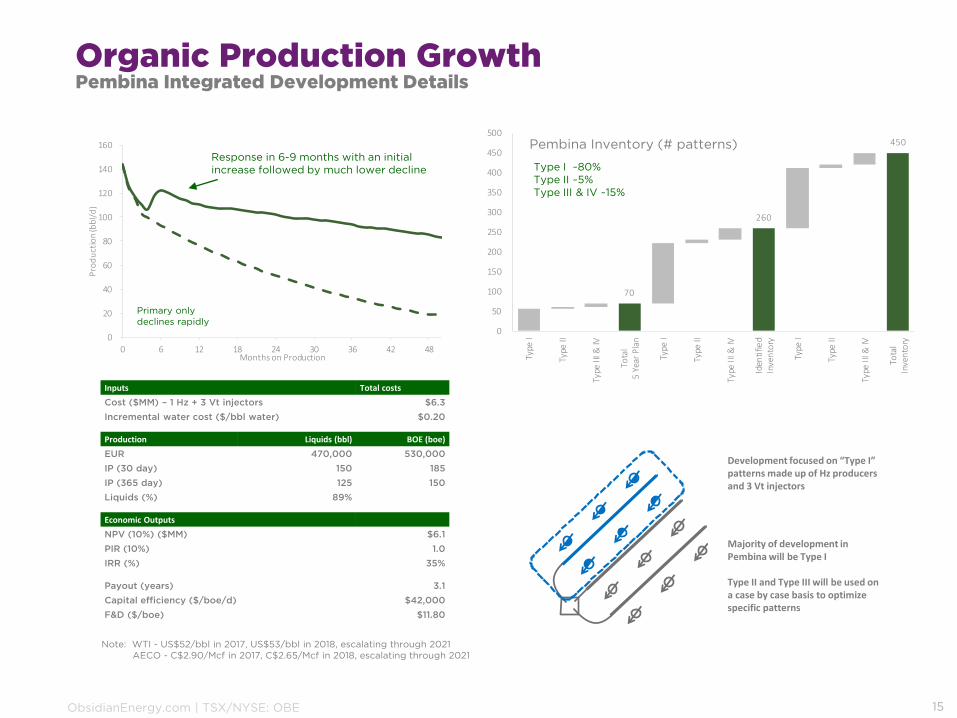
Inputs Total costs
Cost ($MM) – 1 Hz + 3 Vt injectors $6.3
Incremental water cost ($/bbl water) $0.20
Production Liquids (bbl) BOE (boe)
EUR 470,000 530,000
IP (30 day) 150 185
IP (365 day) 125 150
Liquids (%) 89%
Economic Outputs
NPV (10%) ($MM) $6.1
PIR (10%) 1.0
IRR (%) 35%
Payout (years) 3.1
Capital efficiency ($/boe/d) $42,000
F&D ($/boe) $11.80
Organic Production GrowthPembina Integrated Development Details
15
0
20
40
60
80
100
120
140
160
0 6 12 18 24 30 36 42 48
Pro
du
ctio
n (b
bl/
d)
Months on Production
Development focused on “Type I” patterns made up of Hz producers and 3 Vt injectors
Response in 6-9 months with an initial increase followed by much lower decline
70
260
450
0
50
100
150
200
250
300
350
400
450
500
Type
I
Type
II
Type
III &
IV
Tota
l5
Year
Pla
n
Type
I
Type
II
Type
III &
IV
Iden
tifie
dIn
ven
tory
Type
I
Type
II
Type
III &
IV
Tota
lIn
ven
tory
Majority of development in Pembina will be Type I
Type II and Type III will be used on a case by case basis to optimize specific patterns
Primary only declines rapidly
Note: WTI - US$52/bbl in 2017, US$53/bbl in 2018, escalating through 2021AECO - C$2.90/Mcf in 2017, C$2.65/Mcf in 2018, escalating through 2021
Pembina Inventory (# patterns)
Type I ~80%Type II ~5%Type III & IV ~15%

ObsidianEnergy.com | TSX/NYSE: OBE
0
50
100
150
200
250
300
350
0 6 12 18 24 30 36 42 48 54 60
Pro
du
ctio
n (b
bl/
d)
Months
50
120
250
0
50
100
150
200
250
300
Type
I
Type
II
Type
IV
Tota
l5
Year
Pla
n
Type
I
Type
II
Type
IV
Iden
tifie
dIn
ven
tory
Type
I
Type
II
Type
IV
Tota
lIn
ven
tory
Organic Production GrowthWillesden Green Integrated Development Details
16
Willesden Green Inventory (# patterns)
Type I ~85%Type II ~10%Type IV ~5%Integrated Waterflood approach
results in lower declines from day 1
Primary only declines rapidly
Inputs Total costs
Cost ($MM) – 1 Hz + 3 Vt injectors $6.5
Incremental water cost ($/bbl water) $0.20
Production Liquids (bbl) BOE (boe)
EUR 435,000 545,000
IP (30 day) 295 340
IP (365 day) 200 265
Liquids (%) 80%
Economic Outputs
NPV (10%) ($MM) $5.0
PIR (10%) 0.8
IRR (%) 35%
Payout (years) 2.5
Capital efficiency ($/boe/d) $24,500
F&D ($/boe) $11.95
Note: WTI - US$52/bbl in 2017, US$53/bbl in 2018, escalating through 2021AECO - C$2.90/Mcf in 2017, C$2.65/Mcf in 2018, escalating through 2021
Development focused on “Type I” patterns made up of Hz producers and 3 Vt injectors
Majority of Willesden Green will be developed using Type I
Southern portion of Crimson will be developed using Type II due to tight-spacing on existing infill wells

ObsidianEnergy.com | TSX/NYSE: OBE
Crimson Section 01-042-08W5 Waterflood project
100
1,000
10,000
100,000
10
100
1,000
10,000
GO
R (
scf/
bb
l)
Rate
(b
bl/
day)
Oil Prod rate, bbl/d
Water Inj rate, bbl/d
Prod. GOR Mcf/bbl
3
Injection shut in for WF infrastructure upgrades
4
0
0.2
0.4
0.6
0.8
1
1.2
1.4
0 2 4 6 8
Cu
m P
ress
ure
Dif
fere
nti
al
Cum Injection Volume
1 Injection start
Hall Plot2
Organic Production GrowthSignpost Demonstration in Crimson Lake (2 Hz injectors + 2 Hz producers)
17
Production doubled after 12 months and no water break through
ObsidianEnergy.com | TSX/NYSE: OBE
Key metrics
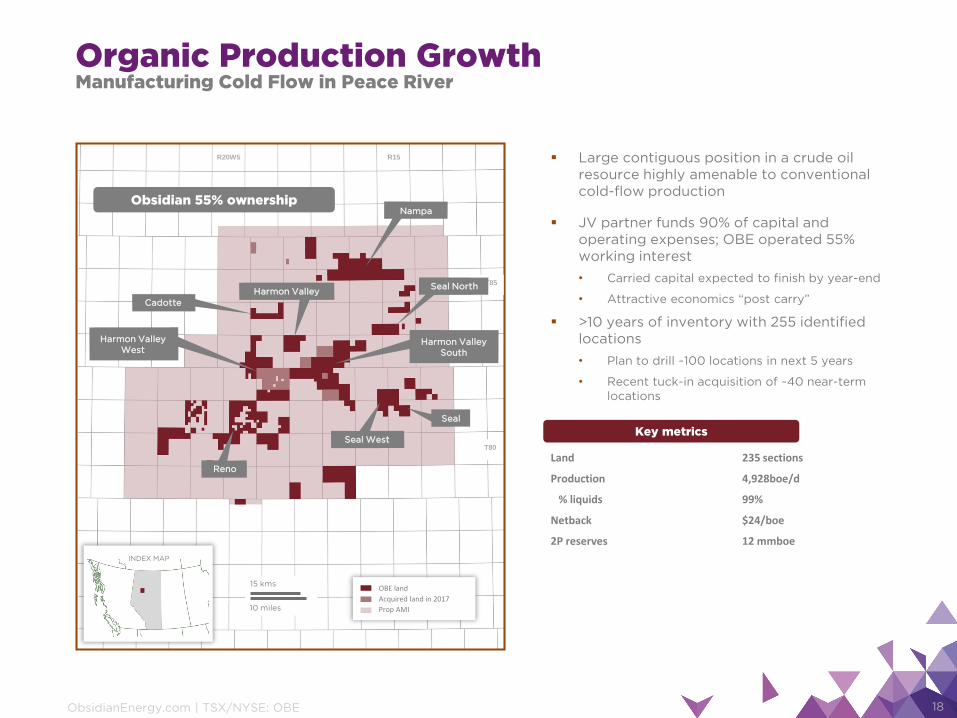
▪ Large contiguous position in a crude oil resource highly amenable to conventional cold-flow production
▪ JV partner funds 90% of capital and operating expenses; OBE operated 55% working interest
• Carried capital expected to finish by year-end
• Attractive economics “post carry”
▪ >10 years of inventory with 255 identified locations
• Plan to drill ~100 locations in next 5 years
• Recent tuck-in acquisition of ~40 near-term locations
Land 235 sections
Production 4,928boe/d
% liquids 99%
Netback $24/boe
2P reserves 12 mmboe
Organic Production GrowthManufacturing Cold Flow in Peace River
18
R15R20W5
INDEX MAP
10 miles
15 kms
T85
T80
Nampa
Harmon Valley West
Harmon Valley
Seal
Seal North
Cadotte
Reno
Seal West
Harmon Valley South
OBE land
Acquired land in 2017
Prop AMI
Obsidian 55% ownership
ObsidianEnergy.com | TSX/NYSE: OBE
0
50
100
150
200
250
0 6 12 18 24 30 36 42 48
Pro
ducti
on (
bo
e/d
)
Months on Production
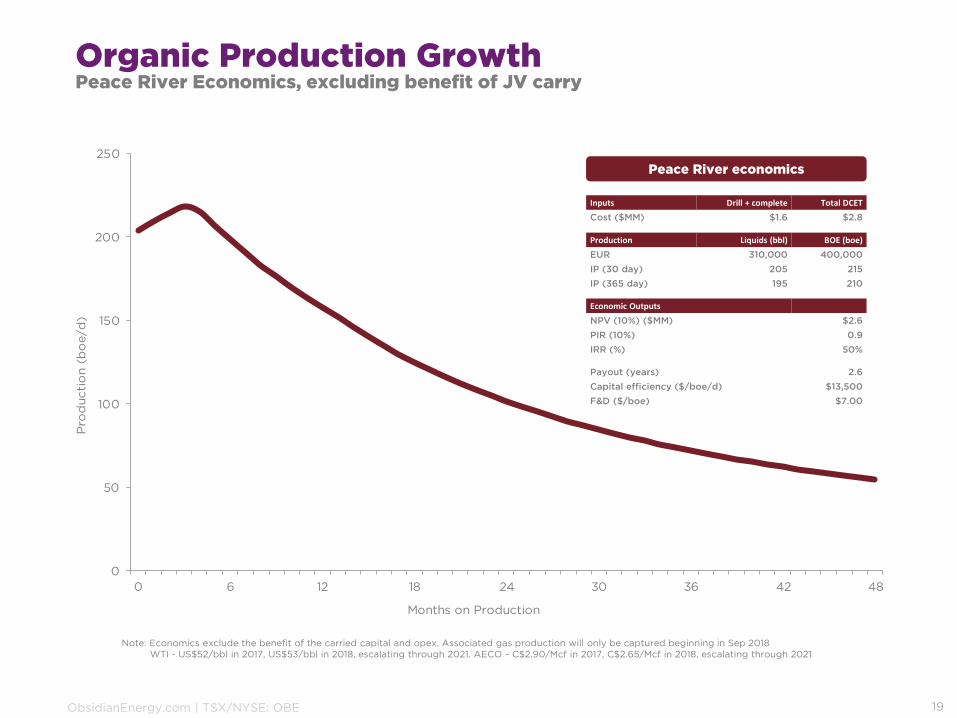
Organic Production GrowthPeace River Economics, excluding benefit of JV carry
19
Note: Economics exclude the benefit of the carried capital and opex. Associated gas production will only be captured beginning in Sep 2018WTI - US$52/bbl in 2017, US$53/bbl in 2018, escalating through 2021. AECO - C$2.90/Mcf in 2017, C$2.65/Mcf in 2018, escalating through 2021
Inputs Drill + complete Total DCET
Cost ($MM) $1.6 $2.8
Production Liquids (bbl) BOE (boe)
EUR 310,000 400,000
IP (30 day) 205 215
IP (365 day) 195 210
Economic Outputs
NPV (10%) ($MM) $2.6
PIR (10%) 0.9
IRR (%) 50%
Payout (years) 2.6
Capital efficiency ($/boe/d) $13,500
F&D ($/boe) $7.00
Peace River economics
ObsidianEnergy.com | TSX/NYSE: OBE
R1W4R5
INDEX MAP
10 miles
15 kms
T35
T30
T25
R10
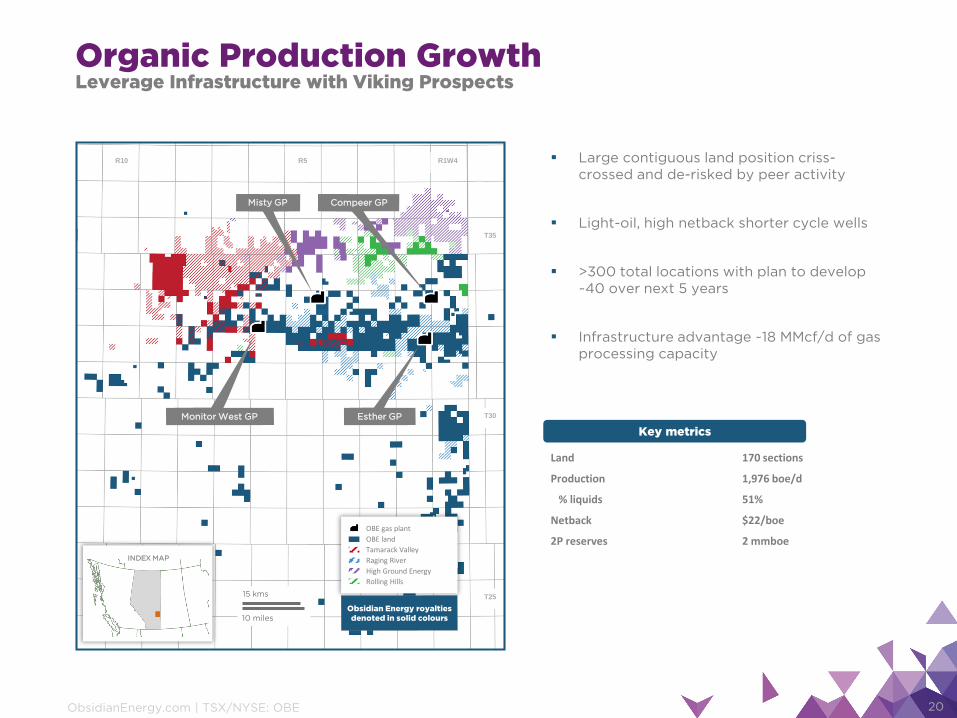
Monitor West GP Esther GP
Misty GP Compeer GP
OBE gas plant
OBE land
Tamarack Valley
Raging River
High Ground Energy
Rolling Hills
Obsidian Energy royalties denoted in solid colours
Key metrics
▪ Large contiguous land position criss-crossed and de-risked by peer activity
▪ Light-oil, high netback shorter cycle wells
▪ >300 total locations with plan to develop ~40 over next 5 years
▪ Infrastructure advantage ~18 MMcf/d of gas processing capacity
Land 170 sections
Production 1,976 boe/d
% liquids 51%
Netback $22/boe
2P reserves 2 mmboe
Organic Production GrowthLeverage Infrastructure with Viking Prospects
20
ObsidianEnergy.com | TSX/NYSE: OBE
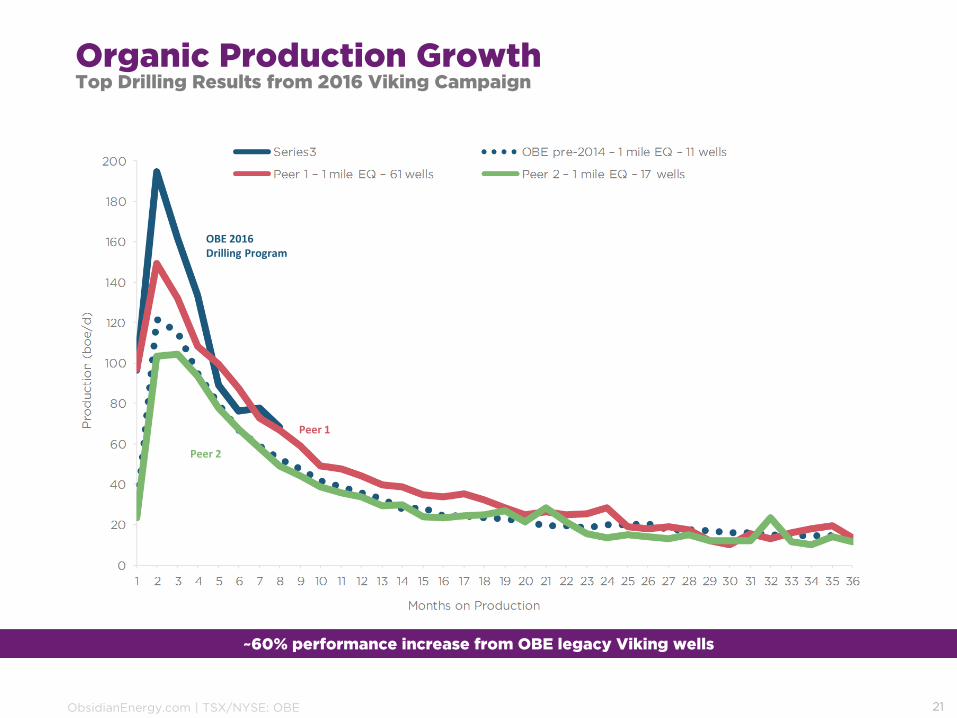
Organic Production GrowthTop Drilling Results from 2016 Viking Campaign
21
OBE 2016 Drilling Program
Peer 1
Peer 2
~60% performance increase from OBE legacy Viking wells
ObsidianEnergy.com | TSX/NYSE: OBE
0
20
40
60
80
100
120
140
160
180
200
1 7 13 19 25 31 37 43 49
Pro
ducti
on
Months on Production
Total Production (boe/d) Liquids Production (bbl/d)
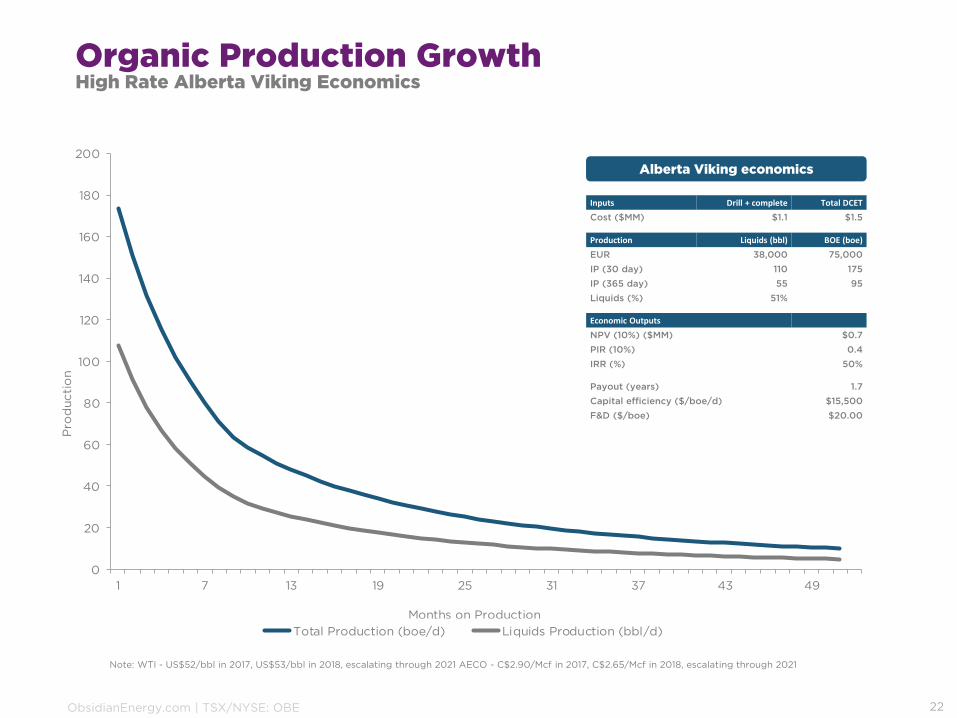
Inputs Drill + complete Total DCET
Cost ($MM) $1.1 $1.5
Production Liquids (bbl) BOE (boe)
EUR 38,000 75,000
IP (30 day) 110 175
IP (365 day) 55 95
Liquids (%) 51%
Economic Outputs
NPV (10%) ($MM) $0.7
PIR (10%) 0.4
IRR (%) 50%
Payout (years) 1.7
Capital efficiency ($/boe/d) $15,500
F&D ($/boe) $20.00
Note: WTI - US$52/bbl in 2017, US$53/bbl in 2018, escalating through 2021 AECO - C$2.90/Mcf in 2017, C$2.65/Mcf in 2018, escalating through 2021
Organic Production GrowthHigh Rate Alberta Viking Economics
22
Alberta Viking economics
ObsidianEnergy.com | TSX/NYSE: OBE
R8W5
INDEX MAP
WILLESDENGREEN
T45
T40
5 miles
10 kms
F O R M A T I O N
CR
ET
AC
EO
US
BELLY RIVER
COLORADO SHALE
CARDIUM
COLORADO SHALE
MA
NN
VI
LL
E
SP
IR
IT
R
IV
ER
NOTIKEWIN
FALHER
WILRICH
GLAUCONITIC SANDSTONE
OSTRACOD BEDS
ELLERSLIE
FERNIE SHALE
ROCK CREEK
FERNIE SHALE
NORDEGG
FERNIE SHALE
R5OBE land
OBE operated Cardium unit
Cardium trend
OBE 2017 upper Mannville well
Analogue upper Manville producer
Falher BTrend
Main Upper Mannville Industry Activity Trend
Open Creek
Faraway
Crimson Lake
Crimson
Gas Plant
BXE 13-16-44-9Falher C
IP30: 6.8 MMcf/d
BXE 16-10-44-9Falher E
IP30: 5.0 MMcf/d
TQN 4-5-44-9Falher D
IP30: 7.1 MMcf/d
TVE 4-13-45-7Falher B
IP30: 3.2 MMcf/d
BXE 16-25-43-8Falher B
IP30: 6.8 MMcf/d
BXE 16-36-44-7Falher B
IP30: 5.2 MMcf/d
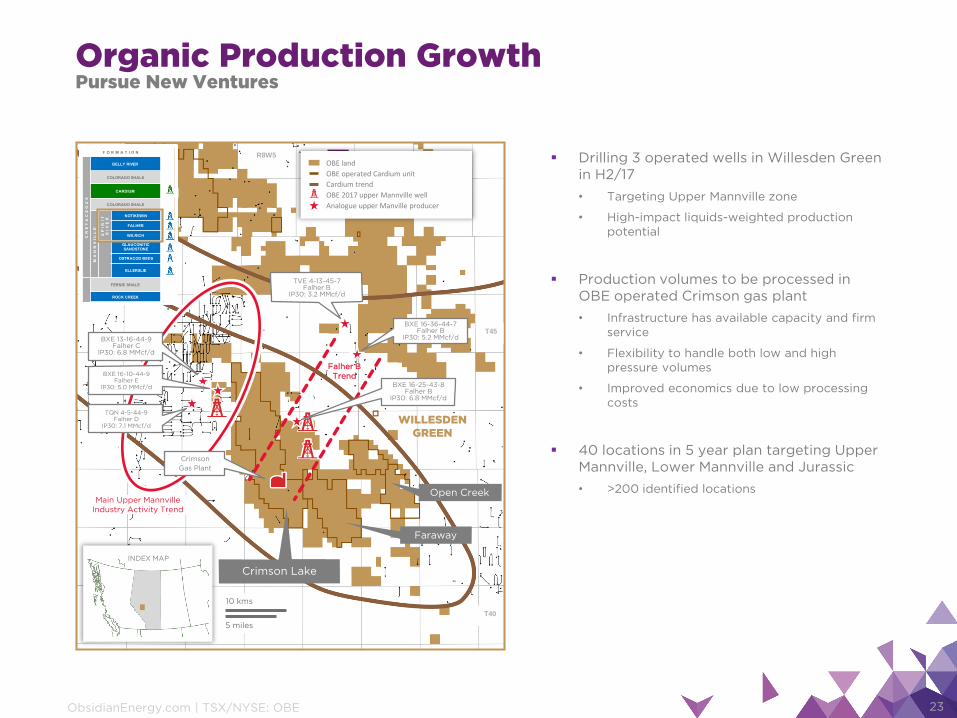
Organic Production GrowthPursue New Ventures
23
▪ Drilling 3 operated wells in Willesden Green in H2/17
• Targeting Upper Mannville zone
• High-impact liquids-weighted production potential
▪ Production volumes to be processed in OBE operated Crimson gas plant
• Infrastructure has available capacity and firm service
• Flexibility to handle both low and high pressure volumes
• Improved economics due to low processing costs
▪ 40 locations in 5 year plan targeting Upper Mannville, Lower Mannville and Jurassic
• >200 identified locations

ObsidianEnergy.com | TSX/NYSE: OBE
0
1,000
2,000
3,000
4,000
5,000
6,000
7,000
8,000
0 6 12 18 24 30 36 42 48
Ga
s Pr
od
ucti
on (M
cf/d
)
Months on Production
Type Curve (Mcf/d) 16-25-43-8 offset 16-36-44-7 offset 4-13-45-7 offset
16-36
4-13
16-25
Organic Production GrowthMannville Fahler B Type Curve and Offsetting Wells
24
Inputs Drill + complete Total DCET
Cost ($MM) $3.0 $4.0
Production Liquids (bbl) BOE (boe)
EUR 140,000 720,000
IP (30 day) 230 1,030
IP (365 day) 130 620
Liquids (%) 19%
Economic Outputs
NPV (10%) ($MM) $3.4
PIR (10%) 0.9
IRR (%) 60%
Payout (years) 1.5
Capital efficiency ($/boe/d) $6,500
F&D ($/boe) $5.50
Note: WTI - US$52/bbl in 2017, US$53/bbl in 2018, escalating through 2021 AECO - C$2.90/Mcf in 2017, C$2.65/Mcf in 2018, escalating through 2021
ObsidianEnergy.com | TSX/NYSE: OBE
5YP @ US$50/C$2.75
5YP @
US$55/C$3.00
5YP @ US$60/C$3.25
10%
12%
14%
16%
18%
20%
22%
24%
26%
28%
30%
0% 5% 10% 15%
20
21
Co
rpo
rate
De
clin
e (
%)
5 Year Growth CAGR (%)
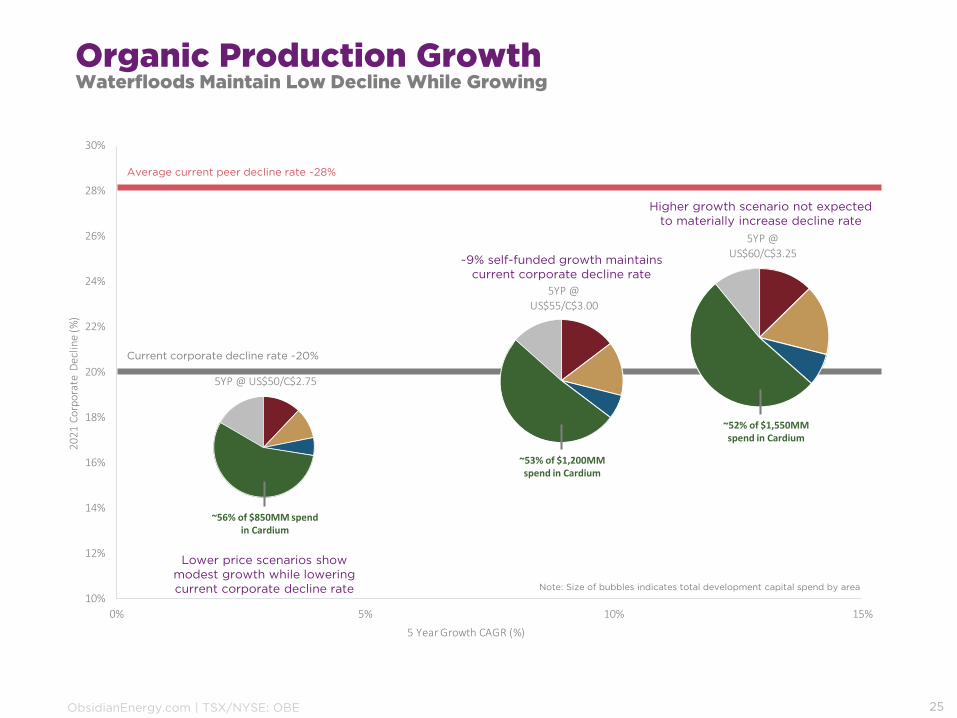
Organic Production GrowthWaterfloods Maintain Low Decline While Growing
25
Current corporate decline rate ~20%
Average current peer decline rate ~28%
Note: Size of bubbles indicates total development capital spend by area
Lower price scenarios show modest growth while lowering current corporate decline rate
~9% self-funded growth maintains current corporate decline rate
Higher growth scenario not expected to materially increase decline rate
~52% of $1,550MM spend in Cardium
~53% of $1,200MM spend in Cardium
~56% of $850MM spendin Cardium

ObsidianEnergy.com | TSX/NYSE: OBE
Solid Balance SheetMajor 2016 Restructuring Now Complete
26
$1,940
$469 $392
($1,392)
($79)($70)
($7)
YE 2015 Dispositions FX & Other YE 2016 A&D Closed FCF & Other Q2 2017
Long Term Debt Reduction since YE 2015 ($MM)
Discounted Asset Retirement Obligations ($MM) Well Count (#)
13,200
4,900
YE 2015 Q2 2016
Producing Injecting Inactive
$397
$180
YE 2015 Q2 2016
Wells Pipelines Facilities

ObsidianEnergy.com | TSX/NYSE: OBE
Leading Costs and Cash GenerationStrong Hedge Position
27
▪ Corporate forecasting and hedging program extends six quarters
▪ Allows for planning and line of sight past each Spring breakup cycle
2.84 C$/Mcf
3.00 C$/Mcf
2.83 C$/Mcf
2.72 C$/Mcf
2.67 C$/Mcf
2.67 C$/Mcf
19,000
20,900
28,400
22,700
17,100
15,200
Q3 Q4 Q1 Q2 Q3 Q4
2017 2018
51.96 US$/bbl
52.17 US$/bbl
51.31 US$/bbl
50.59 US$/bbl
49.96 US$/bbl
49.07US$/bbl
7,400 7,900 8,000 8,000
5,000
4,000
Q3 Q4 Q1 Q2 Q3 Q4
2017 2018
Oil volumes hedged (bbl/d) Gas volumes hedged (Mcf/d)
~50% of Net Oil Volumes Hedged for FY 2017 ~30% of Net Gas Volumes Hedged for FY 2017
ObsidianEnergy.com | TSX/NYSE: OBE
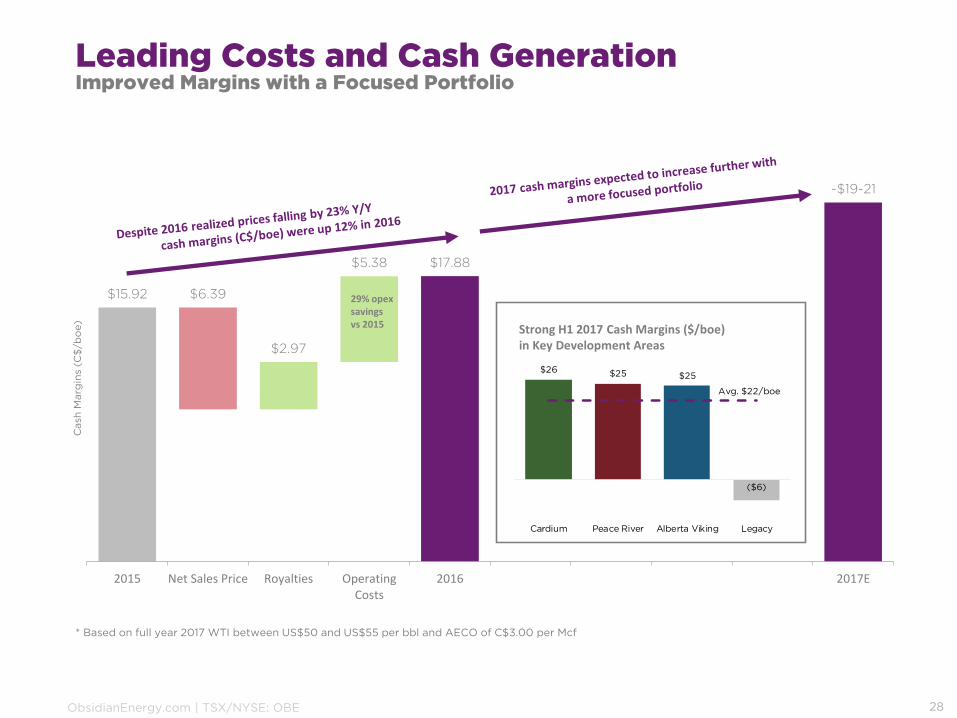
$15.92
$2.97
$5.38 $17.88
~$19-21
$6.39
2015 Net Sales Price Royalties OperatingCosts
2016 2017E
29% opexsavings vs 2015
Cash
Marg
ins
(C$
/b
oe)
$26 $25 $25
($6)
Avg. $22/boe
Cardium Peace River Alberta Viking Legacy
Strong H1 2017 Cash Margins ($/boe) in Key Development Areas
Leading Costs and Cash GenerationImproved Margins with a Focused Portfolio
28
* Based on full year 2017 WTI between US$50 and US$55 per bbl and AECO of C$3.00 per Mcf

ObsidianEnergy.com | TSX/NYSE: OBE
$4.75 $3.25 $1.50 ($1.50) ($3.00) ($4.50)
$13.25 $13.25
$13.25 $13.25 $13.25 $13.25 $13.25
$1.25 $1.50
$2.00 $2.50 $3.00 $3.75 $4.75
$1.75 $1.75
$1.75 $1.75 $1.75 $1.75
$1.75
$13.50 $15.75 $17.50 $19.25 $21.25
$23.00 $24.25
US$35 US$40 US$45 US$50 US$55 US$60 US$65
Oil & Gas Hedging OPEX Royalties Transportation Netback Incl. Hedging
Implied FX Rate (CAD/USD) 1.325
All numbers are C$/boe
Assumes illustrative 62% liquids and 38% natural gas production with constant ~C$3.00 AECO
$41.75 $48.50 $55.00 $61.50 $68.25 $74.75 $81.50Implied C$ Ed Par
Implied C$ Liquids Realization
Implied C$ Portfolio Realization
$29.75 $36.25 $43.00 $49.50 $56.25 $62.75 $69.50
$25.50 $29.75 $34.00 $38.00 $42.00 $46.25 $50.25
Leading Costs and Cash GenerationMargins Are An Excellent Engine for Cash
29

ObsidianEnergy.com | TSX/NYSE: OBE
David French
President and
Chief Executive Officer
Andrew Sweerts
VP, Production &
Technical Services
David Hendry
Chief Financial Officer
Mark Hodgson
VP, Business Development &
Commercial
Tony Berthelet
VP, Development &
Operations
Robert Wood
General Counsel
Obsidian Management
30
ObsidianEnergy.com | TSX/NYSE: OBE
Appendix OneWaterflood Examples

ObsidianEnergy.com | TSX/NYSE: OBE
Crimson Cardium Waterflood Update
32
▪ 3 areas of waterflood performance
• Central @ Section 32,33,34-042 08W5
• Section 15 @ 15-042-08W5
• Section 1 @ 01-042-08W5
▪ 2 successful WF patterns in Section 1 and 15 in Type II WF design
▪ Central WF area a combination of Type I and Type II waterflood
▪ New projects showing response sooner than anticipated
2 miles
3 kms
INDEX MAP
OBE land
Well
Central WF
Section 15
Section 1
R8W5R9 R7
T43
T42

ObsidianEnergy.com | TSX/NYSE: OBE
100
1,000
10,000
10
100
1,000
GO
R (
scf/
bb
l)
Rate
(b
bl/
day)
Oil Prod rate, bbl/d
Water Inj rate, bbl/d
Gas Oil Ratio scf/bbl
GOR flattens3
4
1 Injection start
Crimsom Central Waterflood Response1 Hz Injector + 1 Hz Producer
33
Oil response 3 months after injection started
Hz Producer onstream Jan 2016Converted 1 Hz to injection Dec 2016
Based on HZ Injector 00/16-27-042-08W5 / HZ Producer 00/01-34-042-08W5
ObsidianEnergy.com | TSX/NYSE: OBE
1,000
10,000
100,000
10
100
1,000
10,000
GO
R (
scf/
bb
l)
Rate
(b
bl/
day)
Oil Prod rate, bbl/d
Water Inj rate, bbl/d
Gas Oil Ratio scf/bbl
3
4 Oil rate flattened significantly
1 Injection start
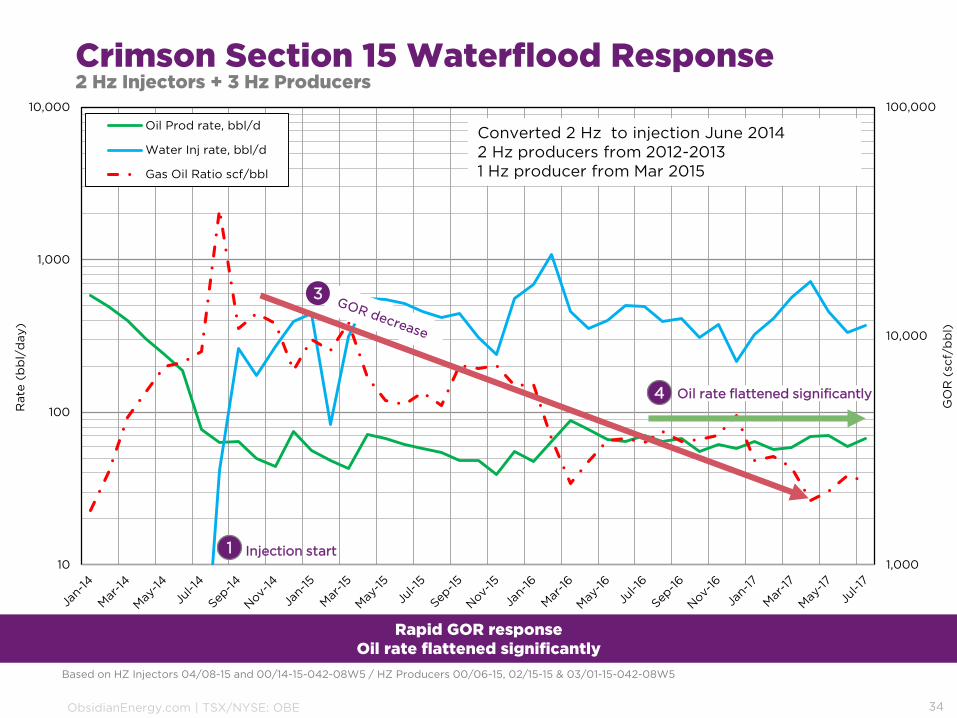
Crimson Section 15 Waterflood Response2 Hz Injectors + 3 Hz Producers
34
Rapid GOR responseOil rate flattened significantly
Converted 2 Hz to injection June 20142 Hz producers from 2012-20131 Hz producer from Mar 2015
Based on HZ Injectors 04/08-15 and 00/14-15-042-08W5 / HZ Producers 00/06-15, 02/15-15 & 03/01-15-042-08W5
ObsidianEnergy.com | TSX/NYSE: OBE
100
1,000
10,000
100,000
10
100
1,000
10,000
GO
R (
scf/
bb
l)
Rate
(b
bl/
day)
Oil Prod rate, bbl/d
Water Inj rate, bbl/d
Gas Oil Ratio scf/bbl
3
Injection shut in for WF infrastructure upgrades
4
1 Injection start
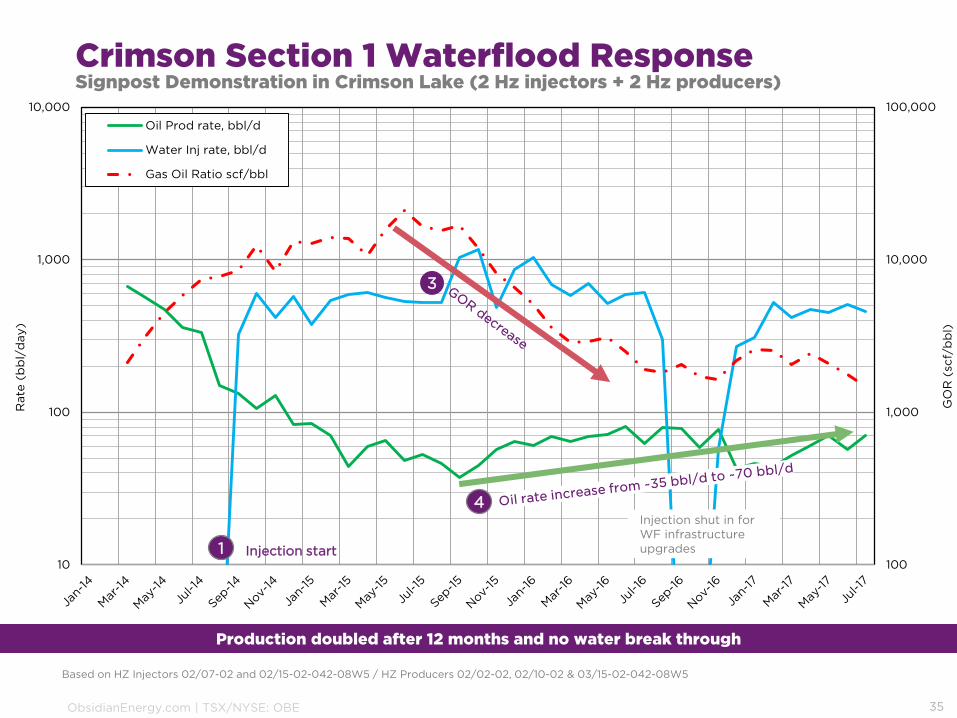
Crimson Section 1 Waterflood ResponseSignpost Demonstration in Crimson Lake (2 Hz injectors + 2 Hz producers)
35
Production doubled after 12 months and no water break through
Based on HZ Injectors 02/07-02 and 02/15-02-042-08W5 / HZ Producers 02/02-02, 02/10-02 & 03/15-02-042-08W5

ObsidianEnergy.com | TSX/NYSE: OBE
100
1,000
10,000
10
100
1,000
GO
R (
scf/
bb
l)
Rate
(b
bl/
day)
Oil Prod rate, bbl/d
Water Inj rate, bbl/d
Gas Oil Ratio scf/bbl
GOR stabilizes and begins to fall
1 injector reactivation
PCU#9 Section 36 Injector Reactivations6 Injector Reactions
36
Oil rate increase from 105 to 145 bbl/d
5 additional vertical reactivations
Appendix 2Supplementary information
37

ObsidianEnergy.com | TSX/NYSE: OBE
End Notes
All slides should be read in conjunction with “Definitions and Industry Terms”, “Non-GAAP Measure Advisory”, “Oil and Gas Disclosures Advisory” and “Forward-Looking Advisory”
Slide 3. Obsidian Corporate Profile
Daily Volume (shares) is the 30 day average share volume traded on Canadian and US Exchanges per Bloomberg. Production, % Liquids, Operating Costs, and Netback are based on Q2 2017 results.
Slide 6. Liquids-focused growth company
Production metrics and netback metrics are based on operating lease statements for Q2 2017, with play boundaries defined as per internal standards. Obsidian Energy land position is as at June 30, 2017. Net Sections based on internal identified inventory. All crude oil hedges have been entered into on a C$WTI basis. US$ price is implied using foreign exchange rates as of June 30, 2017.
Slide 8. Low decline cash flow advantage
Type curve production and economics are based on internal estimates at WTI - US$52/bbl in 2017, US$53/bbl in 2018, escalating through 2021 and AECO - C$2.90/Mcf in 2017, C$2.65/Mcf in 2018, escalating through 2021. Economic analysis is performed based on internal estimates and economic assumptions and is not meant to be construed as guidance.
Slide 9. Resilient assets in volatile commodity prices
Break-even is calculated as the required WTI and/or AECO price for a project to achieve a 10% internal rate of return. Economic analysis is performed based on internal estimates and economic assumptions and is not meant to be construed as guidance.
Slide 10. Focus on 2017 and 2018 sustainability
Company 5 Year Plan (“5YP”) based on internal estimates and economic assumptions and is for illustrative purposes and not to be construed as guidance. The 5YP is based on WTI of US$55/bbl and AECO of C$3.00/Mcf with alternative WTI and AECO cases shown as guidance.
38
ObsidianEnergy.com | TSX/NYSE: OBE
End Notes
Slide 11. The Cardium is our foundation
Free Cash Flow figures are based on the Company’s 5 year plan based on a flat US$55 WTI and C$3.00 AECO.
Land position is based on internal estimates and is rounded. Production, % Liquids, and Netback are rounded based on Q2 2017 actual results. 2P Reserves are based on year-end 2016 reserves performed by our independent auditor.
All other figures are internal estimates and are illustrative in nature.
Original Oil In Place (OOIP) means Discovered Petroleum Initially In Place(DPIIP) as at December 31, 2016. OOIP/DPIIP estimates and recovery rates are as at December 31, 2016, and are based on current accepted technology and have been prepared by internal geologists and reservoir engineers. DPIIP, as defined in the Canadian Oil and Gas Evaluations Handbook (COGEH), is that quantity of petroleum that is estimated, as of a given date, to be contained in known accumulations prior to production. The recoverable portion of DPIIP includes production, reserves and contingent resources; the remainder is unrecoverable. There is significantuncertainty regarding the ultimate recoverability and the commercial viability to produce any portion of this OOIP/DPIIP. TheCompany’s average working interest in the Cardium is 79%. Notwithstanding the uncertainty regarding recoverability of OOIP/DPIIP, the Company believes that it is the most appropriate measure to properly consider the effects of the integrated waterflood program, particularly the effect of changes to recovery factor on potential ultimate resource recovery.
Slide 12. Cardium is a free cash flow machine
Outputs from the Company’s 5 year plan are based on a flat US$55 WTI and C$3.00 AECO.
Slide 13. Tremendous potential with consistent injection
See comments on the uncertainty of recoverability of OOIP/DPIIP under the endnotes to slide 11 above.
Recovery factors, historical and forward looking, are based on internal Company estimates.
Slide 15. Pembina integrated development details
Type curve production and economics are based on internal estimates at WTI - US$52/bbl in 2017, US$53/bbl in 2018, escalating through 2021 and AECO - C$2.90/Mcf in 2017, C$2.65/Mcf in 2018, escalating through 2021. Inventory is based on internal estimates.
Slide 16. Willesden Green integrated development details
Type curve production and economics are based on internal estimates at WTI - US$52/bbl in 2017, US$53/bbl in 2018, escalating through 2021 and AECO - C$2.90/Mcf in 2017, C$2.65/Mcf in 2018, escalating through 2021. Inventory is based on internal estimates.
39

ObsidianEnergy.com | TSX/NYSE: OBE
End Notes
Slide 17. Signpost demonstration in Crimson Lake
Hall Plot y axis is Cum (delta Pinj x dt), (kPa-days) x E06 and x axis is Cum Injection, ths. M3
Slide 18. Manufacturing cold flow in Peace River
Land position is based on internal estimates and is rounded. Production, % Liquids, and Netback are rounded based on Q2 2017 actual results. 2P Reserves are based on year-end 2016 reserves performed by our independent auditor.
All other figures are internal estimates and are illustrative in nature.
Slide 19. Peace River economics, excluding benefit of JV carry
Type curve production and economics are based on internal estimates at WTI - US$52/bbl in 2017, US$53/bbl in 2018, escalating through 2021 and AECO - C$2.90/Mcf in 2017, C$2.65/Mcf in 2018, escalating through 2021. Inventory is based on internal estimates.
Slide 20. Leverage infrastructure with Viking prospects
Land position is based on internal estimates and is rounded. Production, % Liquids, and Netback are rounded based on Q2 2017 actual results. 2P Reserves are based on year-end 2016 reserves performed by our independent auditor.
All other figures are internal estimates and are illustrative in nature.
Slide 22. High rate Alberta Viking economics
Type curve production and economics are based on internal estimates at WTI - US$52/bbl in 2017, US$53/bbl in 2018, escalating through 2021 and AECO - C$2.90/Mcf in 2017, C$2.65/Mcf in 2018, escalating through 2021. Inventory is based on internal estimates.
Slide 24. Mannville Fahler B type curve and offsetting wells
Type curve production and economics are based on internal estimates at WTI - US$52/bbl in 2017, US$53/bbl in 2018, escalating through 2021 and AECO - C$2.90/Mcf in 2017, C$2.65/Mcf in 2018, escalating through 2021. Inventory is based on internal estimates.
40
ObsidianEnergy.com | TSX/NYSE: OBE
End Notes
Slide 25. Waterfloods maintain low decline while growing
Current corporate decline is based on internal estimates. Average current peer decline rate is based on a combination of peerdisclosures, internal estimates, and sell-side analyst reports.
Slide 27. Strong hedge position
All crude oil hedges have been entered into on a C$WTI basis. US$ price is implied using foreign exchange rates as of June 30, 2017.
Slide 28. Improved margins with a focused portfolio
2017 cash margins are illustrative in nature for the reader and is not to be construed as guidance for the Company. Cash Margins in Key Development Area metrics are based on operating lease statements for Q1 2017 and Q2 2017, with play boundaries defined asper internal standards.
Slide 29. Margins are an excellent engine for cash
NOI contribution analysis is illustrative in nature for the reader and is not to be construed as guidance for the Company. Revenue and Royalties per boe is based on internal assumptions around light oil, natural gas and field level offsets, and assumes FX rates of 1.325 CAD/USD for all cases. Does not include crude oil assignment and realized FX hedge gains/losses. Transportation expense is illustrative. Natural Gas prices are held constant at ~C$3.00 AECO. Opex assumes Key Development Area operating cost run rate of $13.25 per boe, at the mid-point of guidance of $13.00 to $13.50 per boe. Hedging contribution is based on hedges outstanding as of August 8, 2017. Please note that the numbers contained in the slide have been rounded for ease of illustration.
Slides 33-38.
Company 5 year plan based on internal estimates and economic assumptions and is for illustrative purposes and not to be construed as guidance. The 5YP is based on WTI of US$55/bbl and AECO of C$3.00/Mcf with alternative WTI and AECO cases shown as guidance.
Slide 36 – PCU#9 Section 36 Injector Reactivations
2 Hz producers 102/07-36 & 103/08-36-047-10W5 drilled in 2014; 2 injector 100/06-36 & 100/10-36-047-10W5 recommenced injection in 2015/16. 5 injectors re-activated in early 2017: 100/03-31, 100/06-31 & 102/06-31-047-09W5, 102/04-25 & 100/06-25-047-10W5
41
ObsidianEnergy.com | TSX/NYSE: OBE
Definitions and Industry Terms
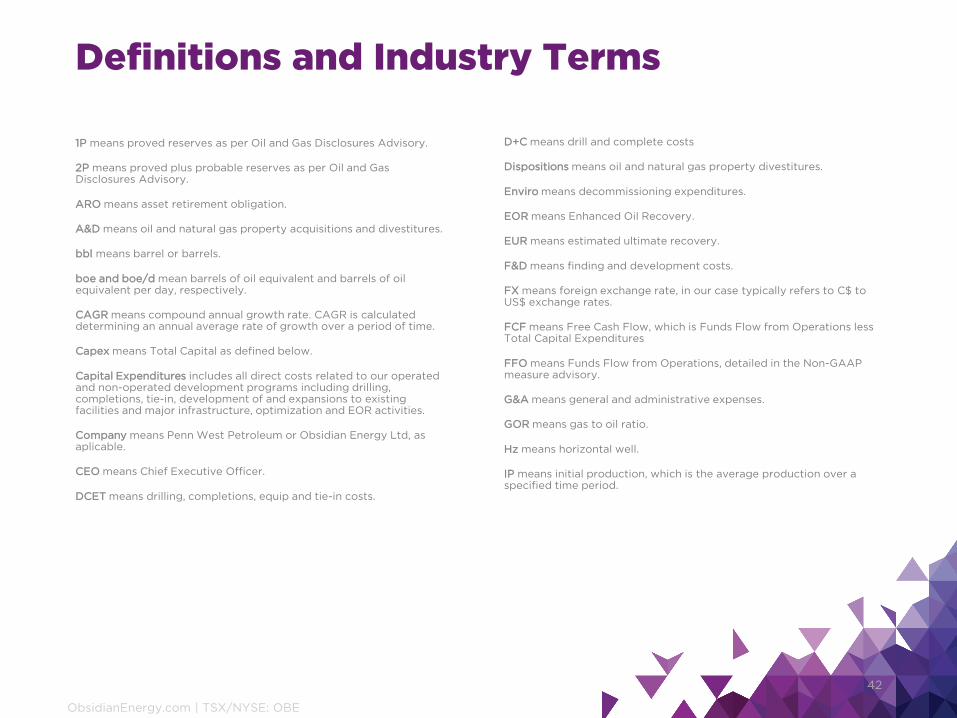
1P means proved reserves as per Oil and Gas Disclosures Advisory.
2P means proved plus probable reserves as per Oil and Gas Disclosures Advisory.
ARO means asset retirement obligation.
A&D means oil and natural gas property acquisitions and divestitures.
bbl means barrel or barrels.
boe and boe/d mean barrels of oil equivalent and barrels of oil equivalent per day, respectively.
CAGR means compound annual growth rate. CAGR is calculated determining an annual average rate of growth over a period of time.
Capex means Total Capital as defined below.
Capital Expenditures includes all direct costs related to our operated and non-operated development programs including drilling, completions, tie-in, development of and expansions to existing facilities and major infrastructure, optimization and EOR activities.
Company means Penn West Petroleum or Obsidian Energy Ltd, as aplicable.
CEO means Chief Executive Officer.
DCET means drilling, completions, equip and tie-in costs.
42
D+C means drill and complete costs
Dispositions means oil and natural gas property divestitures.
Enviro means decommissioning expenditures.
EOR means Enhanced Oil Recovery.
EUR means estimated ultimate recovery.
F&D means finding and development costs.
FX means foreign exchange rate, in our case typically refers to C$ to US$ exchange rates.
FCF means Free Cash Flow, which is Funds Flow from Operations less Total Capital Expenditures
FFO means Funds Flow from Operations, detailed in the Non-GAAP measure advisory.
G&A means general and administrative expenses.
GOR means gas to oil ratio.
Hz means horizontal well.
IP means initial production, which is the average production over a specified time period.

ObsidianEnergy.com | TSX/NYSE: OBE
Definitions and Industry Terms
IRR means Internal Rate of Return which is the interest rate at which the NPV equals zero.
JV means joint venture.
K means thousands.
Key Development Area means Obsidian Energy’s assets in the Cardium, Alberta Viking, and Peace River areas and include additional royalty volume and minor non-core production throughout Alberta, and will form the basis of our 2017 growth projections
Liquids % means the percentage of crude oil and NGLs from the total barrels of oil equivalent of production.
Md means millidarcy.
Mmcf means million cubic feet.
MMboe means million barrels of oil equivalent.
MM means millions.
NAV means Net Asset Value.
Net Debt means Senior Debt plus bank debt plus non-cash working capital deficit, detailed in the Non-GAAP measure advisory.
NGL means natural gas liquids which includes hydrocarbon not marketed as natural gas (methane) or various classes of oil.
43
NOI refers to Net Operating Income which means revenue net or royalties less operating costs.
NPV means Net Present Value which is the sum of the present values of income and outgoing cash flows over a period of time.
Opex means operating costs.
PDP means Developed producing reserves as per Oil and Gas Disclosures Advisory.
PDNP means Developed non-producing reserves as per Oil and Gas Disclosures Advisory.
PIR means the profitability investment ratio, defined as the NPV divided by the discounted capital costs.
PUD means Undeveloped reserves as per Oil and Gas Disclosures Advisory.
ROI means Return on Investment.
RF means Recovery Factor.
Total Capital includes all direct costs related to our operated and non-operated development and base programs including DCET, facilities and major infrastructure capital, optimization, EOR, corporate and other capital.
Vt means vertical well.
ObsidianEnergy.com | TSX/NYSE: OBE
Non-GAAP Measures Advisory
Non-GAAP measures advisory
In this presentation, we refer to certain financial measures that are not determined in accordance with IFRS. These measures as presented do not have any standardized meaning prescribed by IFRS and therefore they may not be comparable with calculations of similar measures for other companies. We believe that, in conjunction with results presented in accordance with IFRS, these measures assist in providing a more complete understanding of certain aspects of our results of operations and financial performance. You are cautioned, however, that these measures should not be construed as an alternative to measures determined inaccordance with IFRS as an indication of our performance. These measures include the following:
EBITDA is cash flow from operations excluding the impact of changes in non-cash working capital, decommissioning expenditures, financing expenses, realized gains and losses on foreign exchange hedges on prepayments, realized foreign exchange gains and losses on debt prepayments and restructuring expenses. EBITDA as defined by Obsidian Energy’s debt agreements excludes the EBITDA contribution from assets sold in the prior 12 months and is used within Obsidian Energy’s covenant calculations related to its syndicated bank facility and senior notes;
Funds flow from operations is cash flow from operating activities before changes in non-cash working capital and decommissioning expenditures, excluding the effects of financing related transactions from foreign exchange contracts and debt repayments/pre-payments. Funds Flow from Operations is more representative of cash related to continuing operations and is used to assess the Company’s ability to fund dividend and planned capital programs. For additional information relating to Funds Flow from Operations see our latest management's discussion and analysis which is available in Canada at www.sedar.com and in the United States at www.sec.gov;
Netback is a measure of cash operating margin on an absolute or per-unit-of-production basis and is calculated as the absolute or per-unit-of-production amount of revenue less royalties, operating costs and transportation. The measure is used to assess the operational profitability of the company as well as relative profitability of individual assets. For additional information relating to netbacks, including a detailed calculation of our netbacks, see our latest management's discussion and analysis which is available in Canada at www.sedar.com and in the United States at www.sec.gov;
Net debt is the amount of long-term debt, comprised of long-term notes and bank debt, plus net working capital (surplus)/deficit. Net debt is a measure of leverage and liquidity; and
Net working capital (surplus)/deficit is accounts payable and accrued liabilities plus dividends payable less the sum of accounts receivable and other current assets. Also includes the net working capital portion of assets held for sale. We use this as a measure of net cash obligations to be settled in the near-term under the course of normal business operations.
44
ObsidianEnergy.com | TSX/NYSE: OBE
Oil and Gas Disclosures Advisory.Reserves disclosures and definitions
Any reference to reserves in this presentation are based on the report ("Sproule Report") prepared by Sproule Associates Limited dated February 22, 2017 where they evaluated one hundred percent of the crude oil, natural gas and natural gas liquids reserves of Obsidian and the net present value of future net revenue attributable to those reserves effective as at December 31, 2016. For further information regarding the Sproule Report, see Appendix A to our Annual Information Form dated March 14, 2017 ("AIF"). It should not be assumed that the estimates of future net revenues presented herein represent the fair market value of the reserves. There is no assurance that the forecast price and cost assumptions will be attained and variances could be material. The recovery and reserves estimates of crude oil, natural gas liquids and natural gas reserves provided herein are estimates only and there is no guarantee that the estimated reserves will be recovered. Actual crude oil, natural gas and natural gas liquid reserves may be greater than or less than the estimates provided herein. The estimates of reserves for individual properties may not reflect the same confidence level as estimates of reserves for all properties, due to the effects of aggregation.
Production and reserves
The use of the word "gross" in this presentation (i) in relation to our interest in production and reserves, means our working interest (operating or non-operating) share before deduction of royalties and without including our royalty interests, (ii) in relation to wells, means the total number of wells in which we have an interest, and (iii) in relation to properties, means the total area of properties in which we have an interest. The use of the word "net" in this presentation (i) in relation to our interest in production and reserves, means our working interest (operating or non-operating) share after deduction of royalty obligations, plus our royalty interests, (ii) in relation to our interest in wells, means the number of wells obtained by aggregating our working interest in each of our gross wells, and (iii) in relation to our interest in a property, means the total area in which we have an interest multiplied by the working interest owned by us. Unless otherwise stated, production volumes and reserves estimates in this presentation are stated on a gross basis. All references to well counts are net to the Company, unless otherwise indicated.
Reserve definitions
reserves are estimated remaining quantities of oil and natural gas and related substances anticipated to be recoverable from known accumulations, as of a given date, based on the analysis of drilling, geological, geophysical, and engineering data; the use of established technology; and specified economic conditions, which are generally accepted as being reasonable. Reserves are classified according to the degree of certainty associated with the estimates.
probable reserves are those additional reserves that are less certain to be recovered than proved reserves. It is equally likely that the actual remaining quantities recovered will be greater or less than the sum of the estimated proved plus probable reserves.
proved reserves are those reserves that can be estimated with a high degree of certainty to be recoverable. It is likely that the actual remaining quantities recovered will exceed the estimated proved reserves.
Each of the reserves categories (proved and probable) may be divided into developed and undeveloped categories:
Developed reserves are those reserves that are expected to be recovered from existing wells and installed facilities or, if facilities have not been installed, that would involve a low expenditure (for example, when compared to the cost of drilling a well) to put the reserves on production. The developed category may be subdivided into producing and non-producing.
Developed producing reserves are those reserves that are expected to be recovered from completion intervals open at the time of the estimate. These reserves may be currently producing or, if shut-in, they must have previously been on production, and the date of resumption of production must be known with reasonable certainty.
Developed non-producing reserves are those reserves that either have not been on production, or have previously been on production, but are shut-in, and the date of resumption of production is unknown.
Undeveloped reserves are those reserves expected to be recovered from known accumulations where a significant expenditure (for example, when compared to the cost of drilling a well) is required to render them capable of production. They must fully meet the requirements of the reserves category (proved, probable) to which they are assigned.
For additional reserve definitions, see "Notes to Reserves Data Tables" in our AIF.
45
ObsidianEnergy.com | TSX/NYSE: OBE
Forward-Looking Information Advisory
46
Certain statements contained in this presentation constitute forward-looking statements or information (collectively "forward-looking statements") within the meaning of the "safe harbour" provisions
of applicable securities legislation. In particular, this presentation contains, without limitation, forward-looking statements pertaining to the following: our expected approach to development
including the area-specific asset development plans; the timing and our expectations of such development activities including our expectations for self-funded growth in all above commodity price
scenarios; our expected percentage production growth rate and weighting; our anticipated budget spend for 2017; our expected net operating income over the next 5 years and how it is generated;
our expected break-even points at the various location and what impacts those break-evens; the Original Oil in Place and our ability to exploit it; our expectation to maintain production in 2018
despite the reduction of certain cash outlays; the anticipated potential recovery factors and decline rates at various locations; the effects of our integrated waterflood approach; that high-netback
light-oil production will create free cash flow and that low decline production will create a stable base; our intended approach to planning and operations and the effects of that approach on
operating costs and capital efficiency; that there is a large inventory that the Company can use going forward; the various expected costs and reliability of different injector types; our drilling
inventory at Peace River; that our non-productive capital costs are minimal in the future in the area; our assessment of future drilling inventory and capacity in the Alberta Viking; our intended
approach to assessing and pursuing New Ventures and the future success of such ventures; our ability to process certain production volumes at the Company operated Crimson gas plant; that the
waterflood maintains a low decline rate for the Company even while growing; that our hedging programs allows for planning and line of sight past each Spring breakup cycle; and that our cash
margins are expected to increase further with a more focused portfolio.
The key metrics for the Cardium, Alberta Viking, Peace River and New Venture assets and the Company as a whole set forth in this presentation may be considered to be future-oriented financial
information or a financial outlook for the purposes of applicable Canadian securities laws. Financial outlook and future-oriented financial information contained in this presentation are based on
assumptions about future events based on management's assessment of the relevant information currently available. In particular, this presentation contains projected operational and financial
information for 2017 and beyond for the Cardium, Alberta Viking , Peace River and New Venture assets and Company as a whole. The future-oriented financial information and financial outlooks
contained in this presentation have been approved by management as of the date of this presentation. Readers are cautioned that any such financial outlook and future-oriented financial
information contained herein should not be used for purposes other than those for which it is disclosed herein.
With respect to forward-looking statements contained in this document, we have made assumptions regarding, among other things: our ability to complete asset sales and the terms and timing of
any such sales; the economic returns that we anticipate realizing from expenditures made on our assets; future crude oil, natural gas liquids and natural gas prices and differentials between light,
medium and heavy oil prices and Canadian, WTI and world oil and natural gas prices; future capital expenditure levels; future crude oil, natural gas liquids and natural gas production levels; drilling
results; future exchange rates and interest rates; future taxes and royalties; the continued suspension of our dividend; our ability to execute our capital programs as planned without significant
adverse impacts from various factors beyond our control, including weather, infrastructure access and delays in obtaining regulatory approvals and third party consents; our ability to obtain
equipment in a timely manner to carry out development activities and the costs thereof; our ability to market our oil and natural gas successfully; our ability to obtain financing on acceptable terms,
including our ability to renew or replace our reserve based loan; our ability to finance the repayment of our senior secured notes on maturity; and our ability to add production and reserves through
our development and exploitation activities. In addition, many of the forward-looking statements contained in this document are located proximate to assumptions that are specific to those forward-
looking statements, and such assumptions should be taken into account when reading such forward-looking statements. Please note that illustrative examples are not to be construed as guidance
for the Company and further details on assumptions can be found in the Endnotes section of the presentation.
Although Obsidian Energy believes that the expectations and assumptions on which such forward-looking information is based are reasonable, undue reliance should not be placed on the forward-
looking information because Obsidian Energy can give no assurances that they will prove to be correct. Since forward-looking information addresses future events and conditions, by its very nature
it involves inherent risks and uncertainties. Actual results could differ materially from those currently anticipated due to a number of factors and risks. These include, but are not limited to: the risks
associated with the oil and gas industry in general such as operational risks in development, exploration and production; the possibility that the semi-annual borrowing base re-determination under
our of our reserve-base loan is not acceptable to the Company or that we breach one or more of the financial covenants pursuant to our amending agreements with holders of our senior, secured
notes; delays or changes in plans with respect to exploration or development projects or capital expenditures; the uncertainty of estimates and projections relating to reserves, production, costs
and expenses; health, safety and environmental risks; commodity price and exchange rate fluctuations; interest rate fluctuations; marketing and transportation; loss of markets; environmental
risks; competition; incorrect assessment of the value of acquisitions; failure to complete or realize the anticipated benefits of acquisitions or dispositions; ability to access sufficient capital from
internal and external sources; failure to obtain required regulatory and other approvals; reliance on third parties; and changes in legislation, including but not limited to tax laws, royalties and
environmental regulations. Readers are cautioned that the foregoing list of factors is not exhaustive.
Additional information on these and other factors that could affect Obsidian Energy, or its operations or financial results, are included in the Company's most recently filed Management's
Discussion and Analysis (See "Forward-Looking Statements" therein)), Annual Information Form (See "Risk Factors" and "Forward-Looking Statements" therein) and other reports on file with
applicable securities regulatory authorities and may be accessed through the SEDAR website (www.sedar.com), EDGAR website (www.sec.gov) or Obsidian Energy's website.
Unless otherwise specified, the forward-looking statements contained in this document speak only as of August 8, 2017. Except as expressly required by applicable securities laws, we do not
undertake any obligation to publicly update or revise any forward-looking statements, whether as a result of new information, future events or otherwise. The forward-looking statements contained
in this document are expressly qualified by this cautionary statement.