Embed Size (px)
Citation preview

Observing the Origin of the Universe
byNed Wright (UCLA)
•http://www.astro.ucla.edu/~wright/intro.html
•http://www.astro.ucla.edu/~wright/cosmolog.htm
•http://www.astro.ucla.edu/~wright/CMB-DT.html
•http://map.gsfc.nasa.gov

A Big Media Splash in 1992:
25 April 1992
Prof. Stephen Hawking of Cambridge University, not usually noted for overstatement, said: “It is the discovery of the century, if not of all time.”

The oval is an all-sky map in galactic coordinates:

An equal area projection:

Color Means Temperature• Red areas are 30 µK hotter than average
and the blue areas are 30 µK colder than average.
• As on the Earth map, color also maps into gravitational potential, with red=high and blue=low.

But really, what have we learned since 1905?
• Expansion of the Universe in 1929• The Universe is homogeneous &
isotropic.• Dark matter in 1932• Cosmic Microwave Background in 1964• Accelerating Expansion in 1998
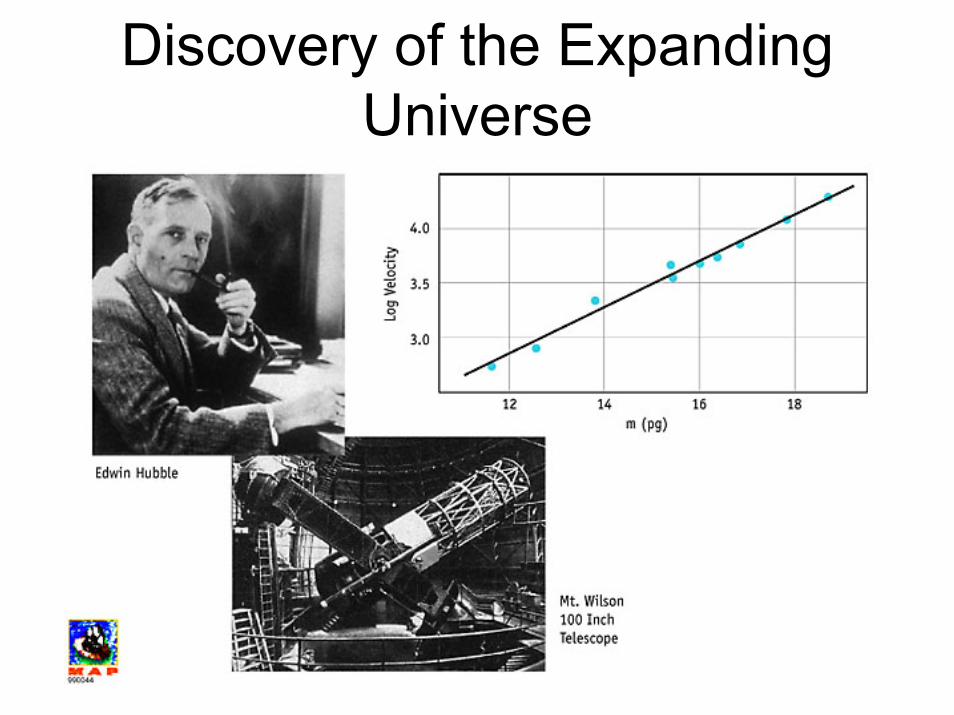
Discovery of the Expanding Universe

Linear v vs D law does not distort
v ∝ D0 v ∝ D1 v ∝ D2

The Cosmological Principle• The Universe is homogeneous and isotropic
Not isotropic Not homogeneous
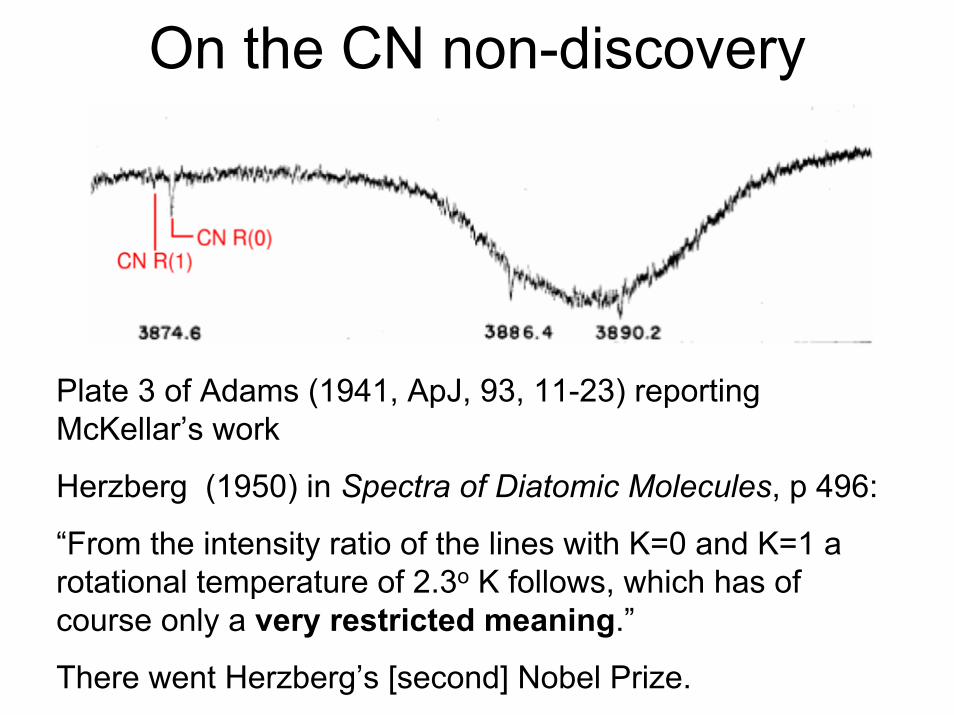
On the CN non-discovery
Plate 3 of Adams (1941, ApJ, 93, 11-23) reporting McKellar’s work
Herzberg (1950) in Spectra of Diatomic Molecules, p 496:
“From the intensity ratio of the lines with K=0 and K=1 a rotational temperature of 2.3o K follows, which has of course only a very restricted meaning.”
There went Herzberg’s [second] Nobel Prize.
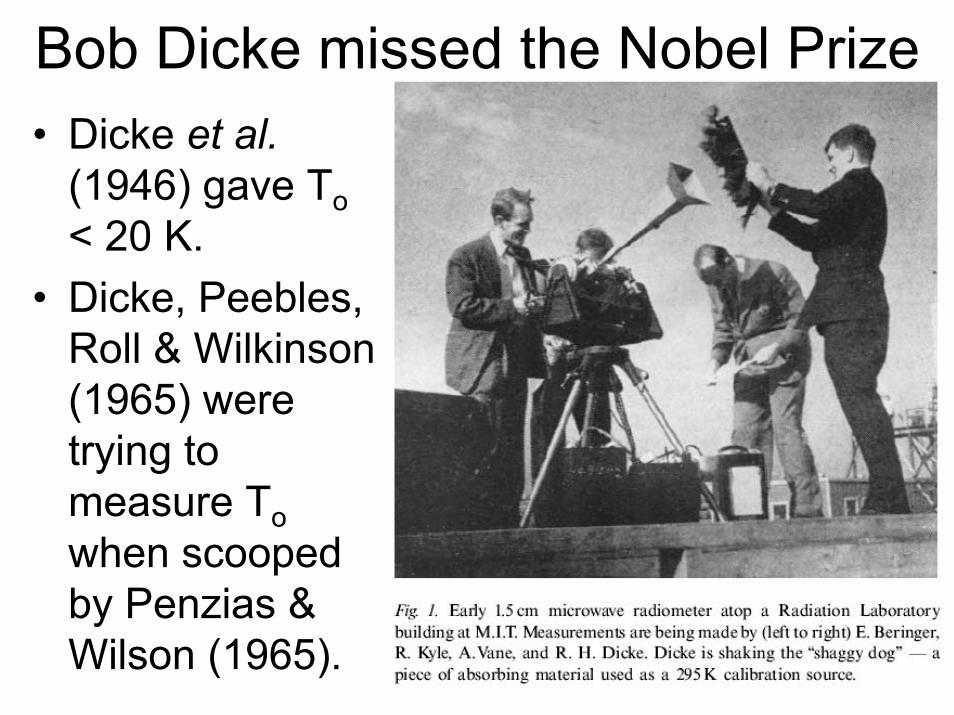
Bob Dicke missed the Nobel Prize• Dicke et al.
(1946) gave To< 20 K.
• Dicke, Peebles, Roll & Wilkinson (1965) were trying to measure Towhen scooped by Penzias & Wilson (1965).
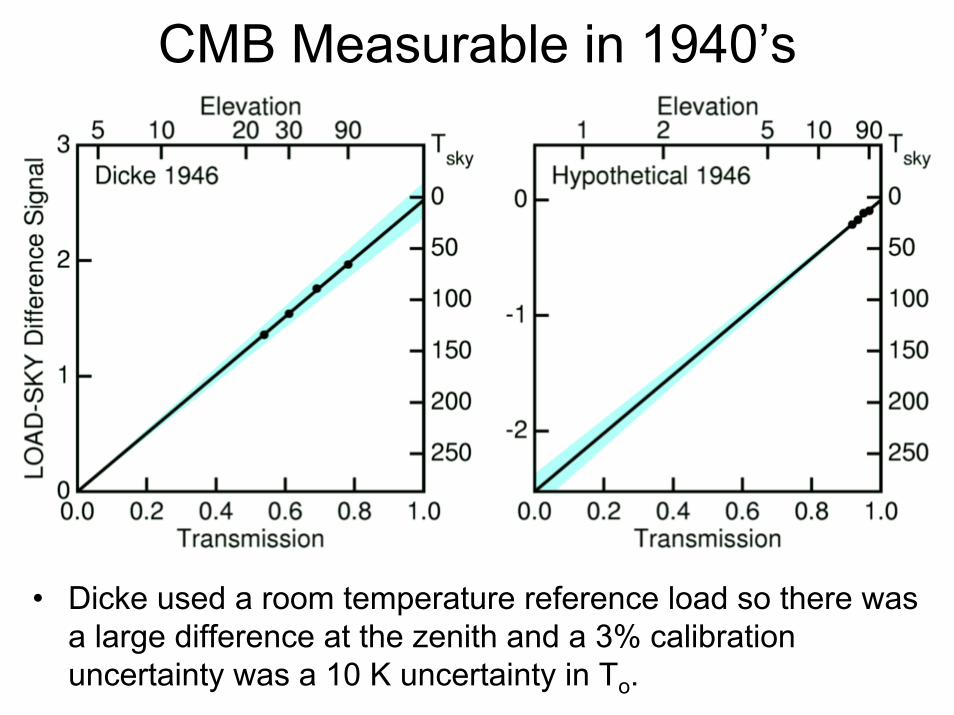
CMB Measurable in 1940’s
• Dicke used a room temperature reference load so there was a large difference at the zenith and a 3% calibration uncertainty was a 10 K uncertainty in To.

But Dicke was distracted by WW II
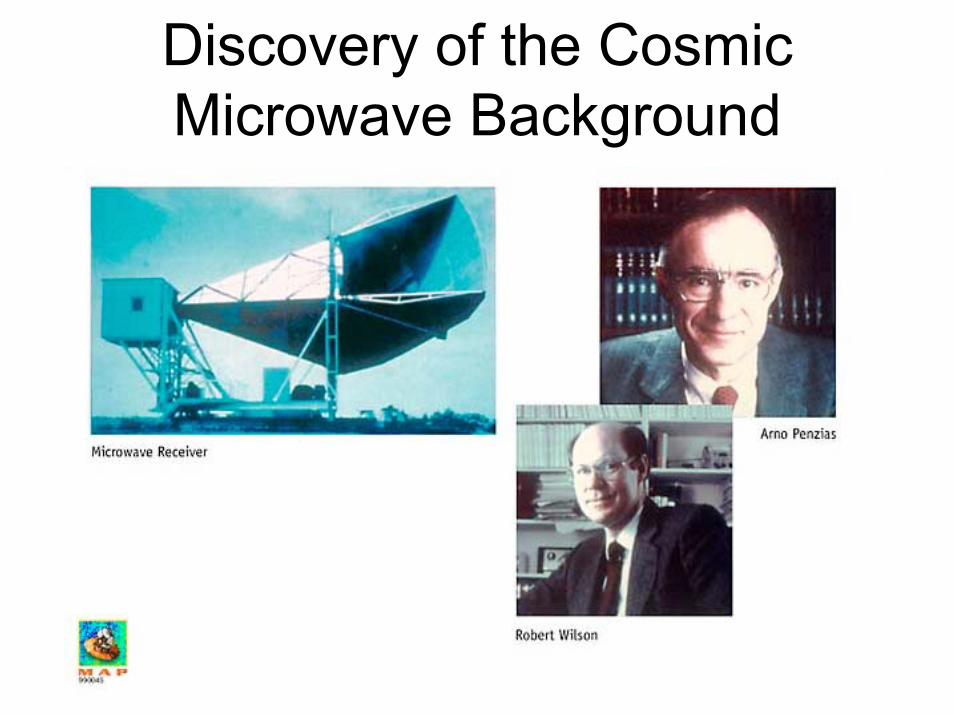
Discovery of the Cosmic Microwave Background

CMB Spectrum is a Blackbody• A blackbody is an opaque, non-reflective,
isothermal body.• The best laboratory blackbodies use cavities
with small entrances so light is almost trapped inside, giving very small reflections.
“hohlraum”

Interferogram
Spectrum
Water lines @ 19 & 25 cm-1 in lab air
Personal History: my FIRAS breadboard at MIT
Beamsplitter
Dihedral

Diagram of FIRAS
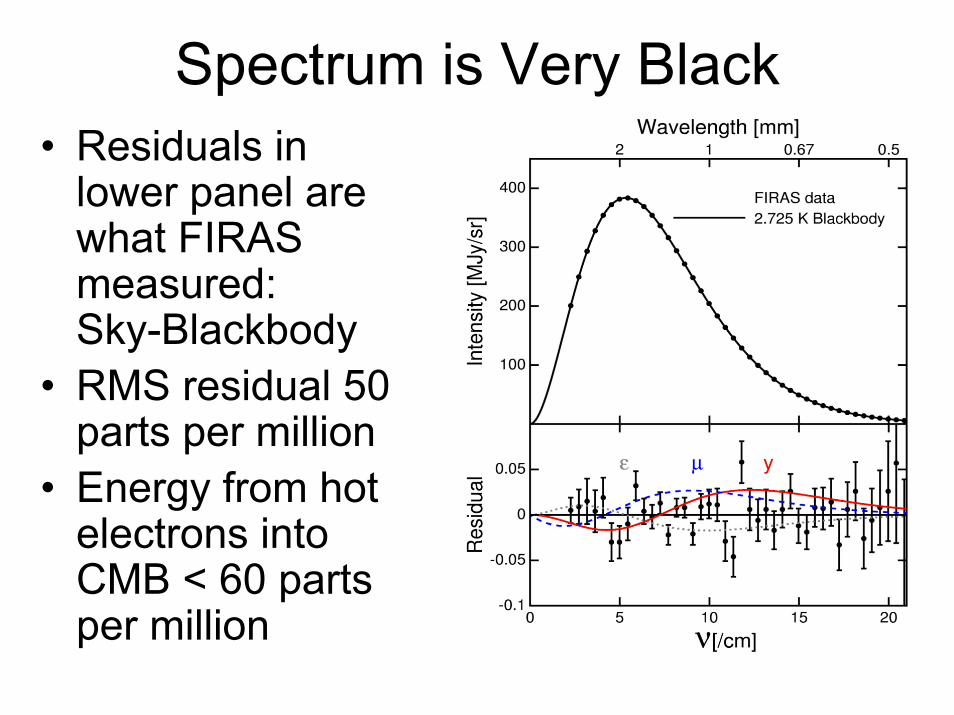
Spectrum is Very Black• Residuals in
lower panel are what FIRAS measured: Sky-Blackbody
• RMS residual 50 parts per million
• Energy from hot electrons into CMB < 60 parts per million

CMB Disproved the Steady State• A blackbody spectrum comes from an
opaque, isothermal source.• The Universe now is transparent, not
opaque.• The Universe now has a wide range of
temperatures.• Therefore, the Universe must have evolved
from an opaque, isothermal state into its present condition, which contradicts the Steady State hypothesis.

Fred Hoyle missed the Nobel Prize• Hoyle (1950), reviewing a
book by Gamow & Critchfield: “[the Big Bang model] would lead to a temperature of the radiation at present maintained throughout the whole of space much greater than McKellar'sdetermination for some regions within the Galaxy.”
• This book implied To = 11 K. Gamow in 1956 Scientific American implied 6 K. Alpher& Herman explicitly gave 5 K or 1 K in 1949 Phys Rev.
• Nobody followed this up!

CN followup after Penzias & Wilson
• Reworking and reobserving the CN lines gave 2.78±0.10 K at 2.64 mm. (Thaddeus, 1972, ARAA, 10, 305-334)
• By 1993, 2.73±0.03 K (Roth, Meyer & Hawkins* 1993)
(*) was at LLNL (UCLA PhD’s)
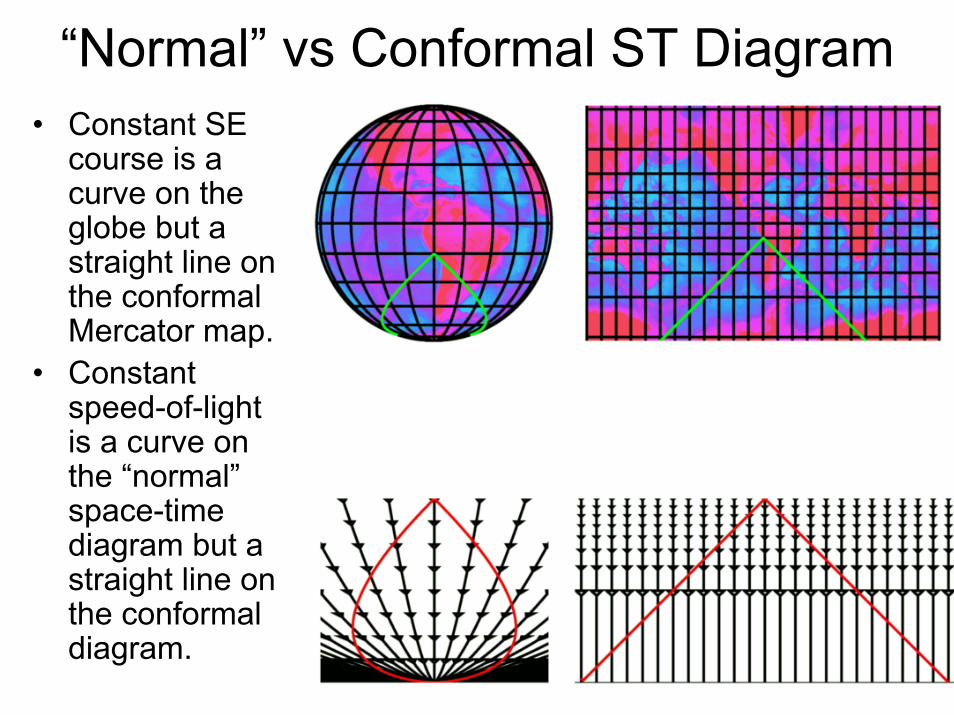
“Normal” vs Conformal ST Diagram• Constant SE
course is a curve on the globe but a straight line on the conformal Mercator map.
• Constant speed-of-light is a curve on the “normal” space-time diagram but a straight line on the conformal diagram.

Horizon ProblemRegions seen on left and right of sky can only be influenced by the yellow areas in their past lightcones. These are disjoint, so why is the CMB T the same in both?

True Contrast CMB Sky
33, 41 & 94 GHz as RGB, 0-4 K scale

Enhanced Contrast:
• Conklin 1969 - 2σ• Henry 1971 - 3σ• Corey & Wilkinson
1976 - 4σ• Smoot et al. 1977 - 6σ

Just So?

Geometry, Density, DestinyDensity < critical, negative curvature, expand forever
Density = critical, zero curvature, expand forever
Density > critical, positive curvature, recollapse

Density must be fine-tuned

Just So?

Inflation to the rescue!• A vacuum
energy density is equivalent to Einstein’s cosmological constant: Λ
• Quantum fluctuations could lead to a vacuum energy density.

Vacuum Energy is Repulsive• In General Relativity energy has gravitational
effects.• A pressurized volume has energy, PV.• Vacuum energy density must have a
negative pressure, P = -ρc2.• If P = -ρc2 the stress-energy tensor of the
vacuum is Lorentz invariant so you cannot measure your velocity relative to the vacuum.
• Net gravity from positive vacuum energy density plus negative pressure is repulsive.
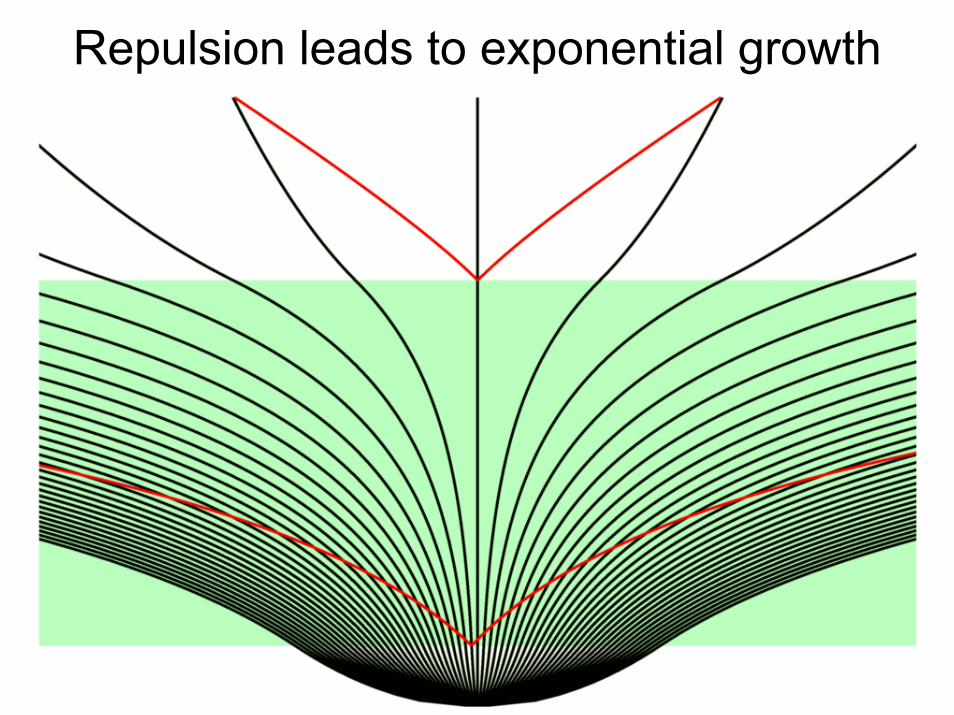
Repulsion leads to exponential growth

Solving Horizon & Flatness-Oldness• A small patch
grows to be bigger than the observable Universe. T=const is explained.
• Whatever the curvature of the patch may be, it will look flat. Density=critical is explained.
Inflationary Scenario• The exponential growth during the period
when there was a non-zero vacuum energy is called “inflation”.
• Inflation “postdicts” solutions to the flatness-oldness and horizon problems.
• It also solves the “monopole” problem.• Does it predict anything that we can test?

Quantum Fluctuations Get Very Big

Quantum Fluctuations get Very Big• QFs occur
uniformly throughout space-time.
• Their future light-cones expand beyond the observable Universe.
• New QFs continue to add small-scale structure.
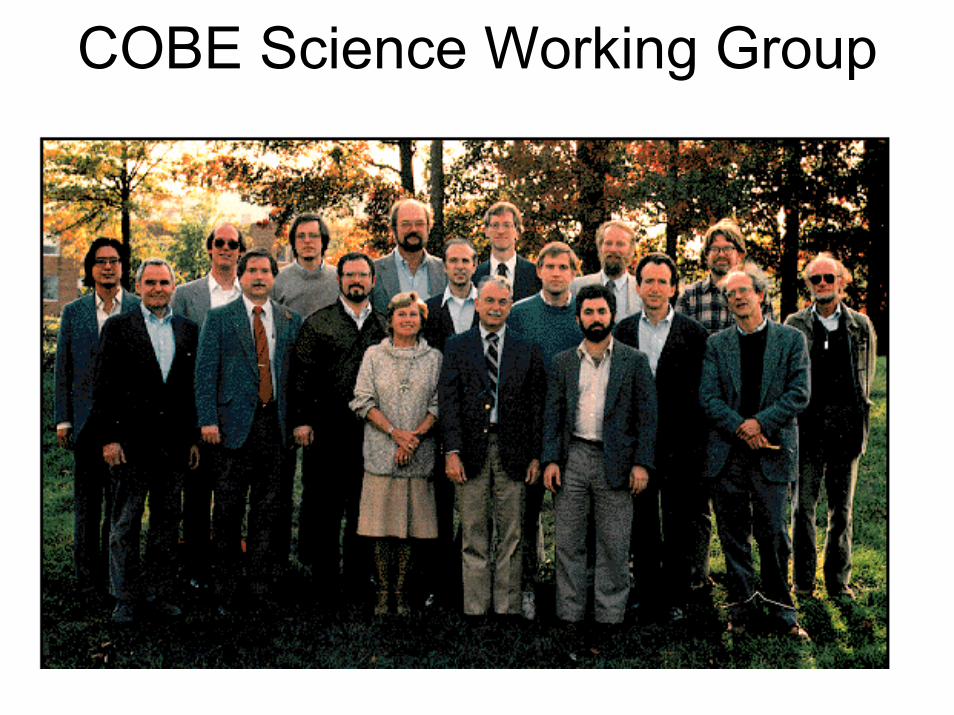
COBE Science Working Group

COBE
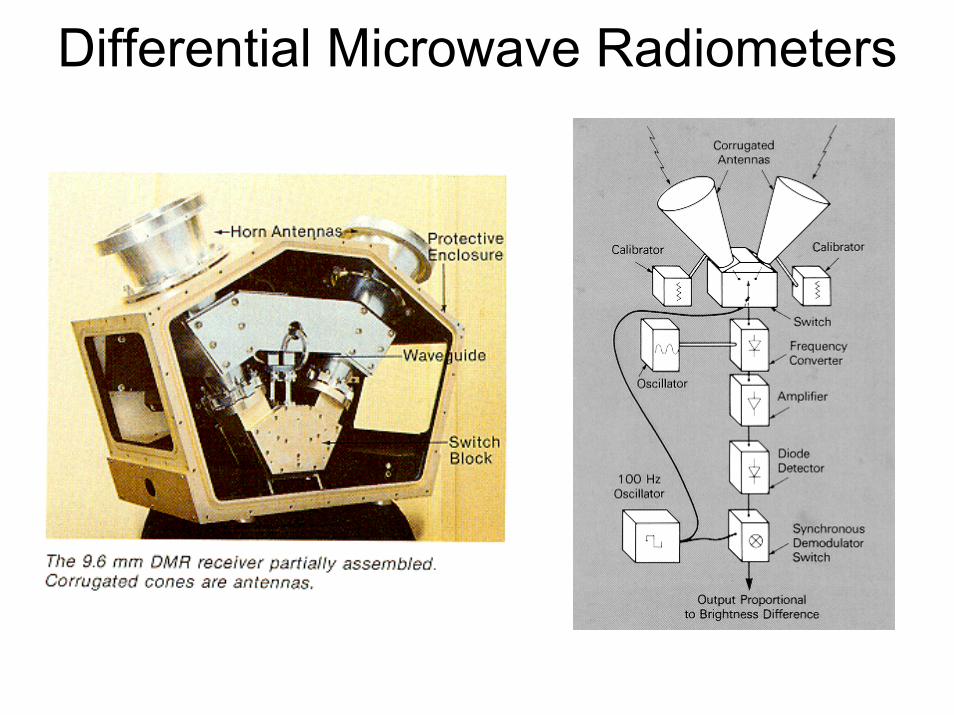
Differential Microwave Radiometers

Personal History: Anisotropy

COBE DMR vs EPAS
“Chi-by-eye” suggests that the “Equal Power on All Scales” prediction of inflation is correct.

Sachs-Wolfe Effect

Measured ∆φ Leads to Structure

Need Cold Dark Matter
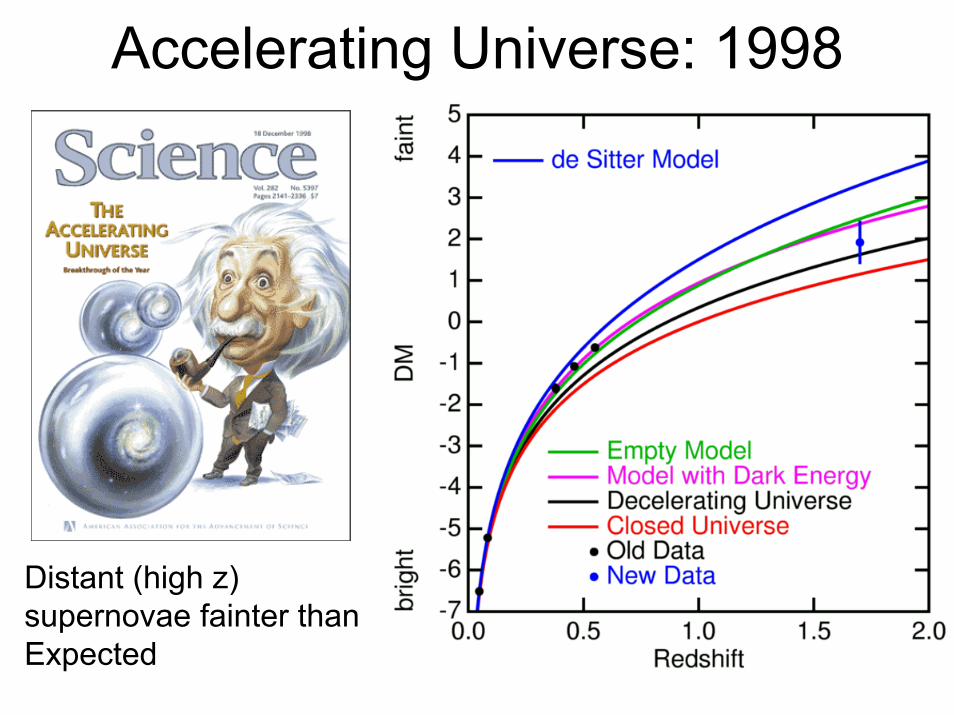
Accelerating Universe: 1998
Distant (high z) supernovae fainter than Expected

Acceleration causes Faintness

COBE View was Blurry

Two Fluids in the Early Universe• Most of the mass is dark matter
– 80-90% of the density– Zero pressure– Sound speed is zero
• The baryon-photon fluid– baryons are protons & neutrons = all ordinary
matter– energy density of the photons is bigger than c2
times the mass density of baryons– Pressure of photons = u/3 = (1/3)ρ c2
– Sound speed is about c/√3 = 170,000 km/sec

Traveling Sound Wave: cs = c/√3
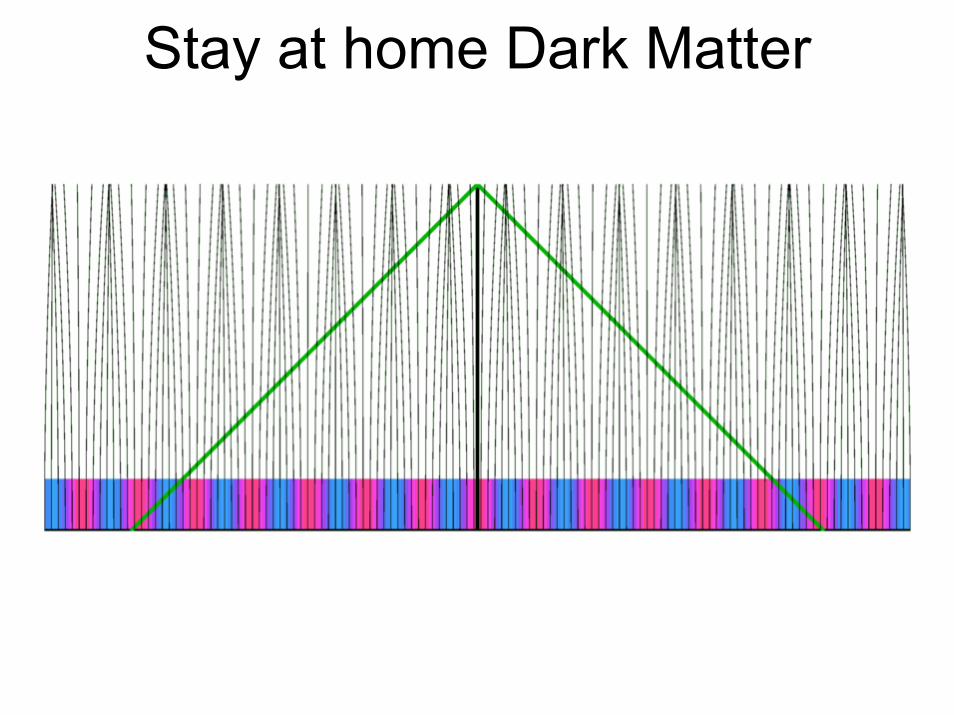
Stay at home Dark Matter
Interference at last scattering• For the wavelength illustrated [1/2 period
between the Big Bang and recombination], the denser = hotter effect and potential well = cooler effect have gotten in phase.
• For larger wavelengths they are still out of phase at recombination.
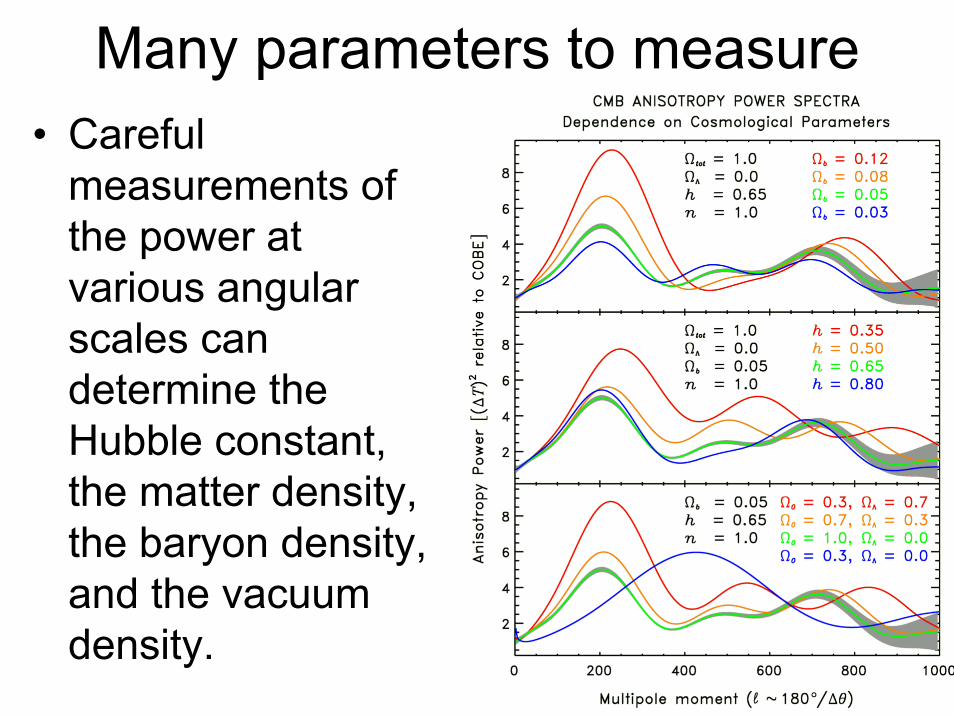
Many parameters to measure• Careful
measurements of the power at various angular scales can determine the Hubble constant, the matter density, the baryon density, and the vacuum density.

A New Cosmology Satellite
WMAP Science Working Group

WMAP Status on 30 Jun 2001

and WMAP has a NED Controller!
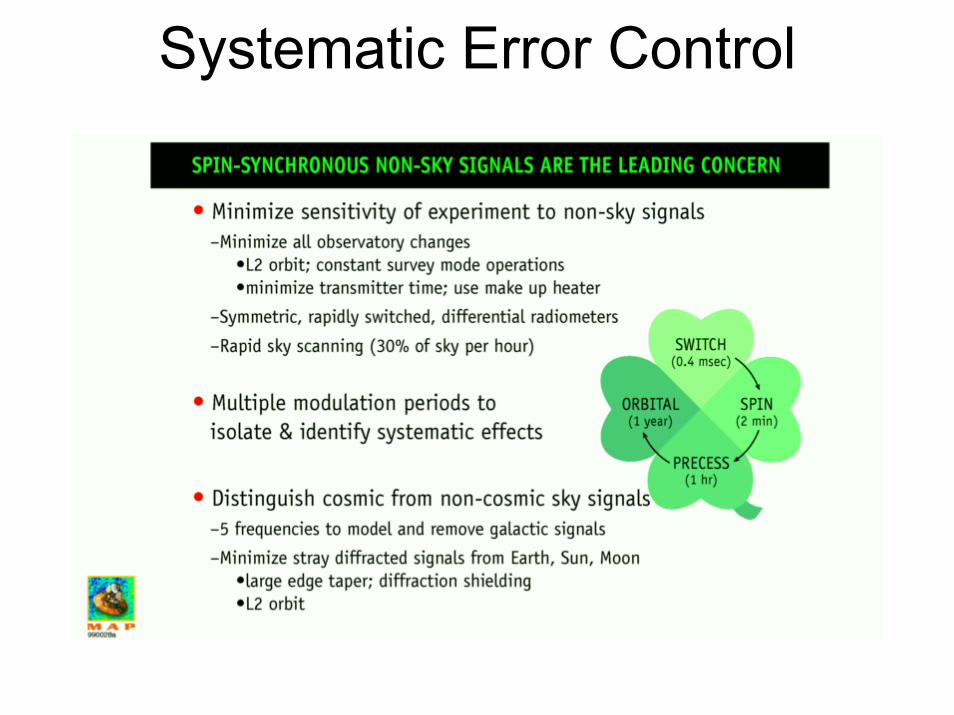
Systematic Error Control

WMAP’s Scan Pattern like COBE’s

WMAP’s Orbit

Combination to remove foreground

QVW as RGB

Effects on Peak Position: lpk
+ Open or vacuum dominated Universes give larger distance to last scattering surface
+ High matter density gives smaller wavelength

Results With WMAP

Info from peak & trough heights• Overall Amplitude of the perturbations
– Agrees with large scale structure if almost all the dark matter is COLD dark matter
• Primordial power spectrum power law spectral index: n = 0.99 ± 0.04 without running index.– EPAS inflationary prediction is n = 1
• Baryon/photon and DM/baryon density ratios– ρb = 0.42 yoctograms/m3 = 0.42×10⁻³⁰ gm/cc– ρcdm = 2.1 yg/m3 [ω ≡ Ωh2 = ρ/18.8 yg/m3]

Results With WMAP
Note the new BBNS value from astro-ph/0302006

Key to Models
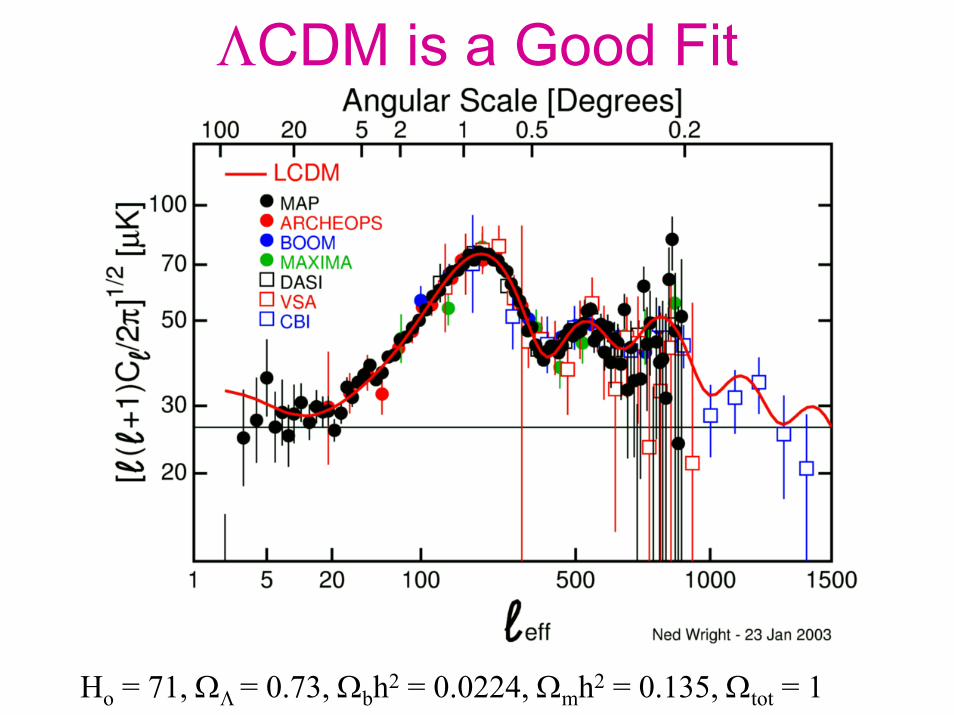
ΛCDM is a Good Fit
Ho = 71, ΩΛ = 0.73, Ωbh2 = 0.0224, Ωmh2 = 0.135, Ωtot = 1

But What Can We SLAY?

Einstein – de Sitter Model Fails
Ho = 50, ΩΛ = 0, Ωbh2 = 0.0236, Ωmh2 = 0.25, Ωtot = 1

Late ISW Effect
Potential only changes if Ωm ≠ 1 (or in non-linear collapse, but that’s another story [Rees-Sciama effect]).

Potential decays at z ≈ 0.6

CMB-LSS correlation seen by WMAP
• This late ISW effect occurs on our past light cone so the ∆T we see is due to structures we also see.
• Correlation between WMAP and LSS seen by:– Boughn & Crittenden (astro-ph/0305001) at 2.75σ with hard
X-ray background and 2.25σ with NVSS– Nolta et al. (astro-ph/0305097) at 2σ with NVSS– Ashfordi et al (astro-ph/0308260) at 2.5σ with 2MASS

WIDE-FIELD INFRARED SURVEY EXPLORERWIDE-FIELD INFRARED SURVEY EXPLORER
I am the PI on a MIDEX called WISE, an all-sky survey in 4 bands from 3.3 to 24 µm. WISE will find and study the closest stars to the Sun, the most luminous galaxies in the Universe, and also map the large-scale structure out to redshift z=1, covering the era when the late ISW effect should be generated.
WISE will fly in 2008.

We (and all of chemistry) are a small minority in the Universe.

Conclude: Big Cosmic News of 2003• The Universe is 13.7±0.2 Gyr
old• Hot stars reionized the
Universe only 200 Myr after the Big Bang
• We know what the Universe is made of, but most of it is “dark energy” [or “smooth tension”] and cold dark matter. Finding the nature of these dark components gives cosmologists plenty to work on.