Embed Size (px)
Citation preview
Wofford CollegeDigital Commons @ Wofford
Student Scholarship
5-2015
Observing Enzymatic Production of Fatty Acids inthe MouthNeelam J. MuljiWofford College
Follow this and additional works at: http://digitalcommons.wofford.edu/studentpubs
Part of the Food Chemistry Commons, and the Medicinal-Pharmaceutical Chemistry Commons
This Honors Thesis is brought to you for free and open access by Digital Commons @ Wofford. It has been accepted for inclusion in StudentScholarship by an authorized administrator of Digital Commons @ Wofford. For more information, please contact [email protected].
Recommended CitationMulji, Neelam J., "Observing Enzymatic Production of Fatty Acids in the Mouth" (2015). Student Scholarship. Paper 7.http://digitalcommons.wofford.edu/studentpubs/7
OBSERVING ENZYMATIC PRODUCTION OF FATTY ACIDS IN THE MOUTH
By
Neelam Mulji
A thesis submitted in partial fulfillment of the requirements for graduation with
GENERAL HONORS
from the department of
CHEMISTRY
Examining Committee:
Bryan Splawn, Thesis Advisor
Chemistry
Caleb Arrington, Member Chemistry
David Pittman, Member
Psychology
WOFFORD COLLEGE
MAY 2015
I
LIST OF ABBREVIATIONS
FFA: Free Fatty Acid
NEFA: Non-esterified fatty acid
LA: Linoleic acid
OA: Oleic acid
PA: Palmitic acid
SA: Stearic acid
GC/MS: Gas Chromatograph / Mass Spectrometer
HPLC: High Performance Liquid Chromatography
GTB: Glycerol tributyrate
FAME: Fatty Acid Methyl Ester
mAU: Milliabsorption units
UV/Vis: Ultraviolet / Visible light
II
LIST OF FIGURES
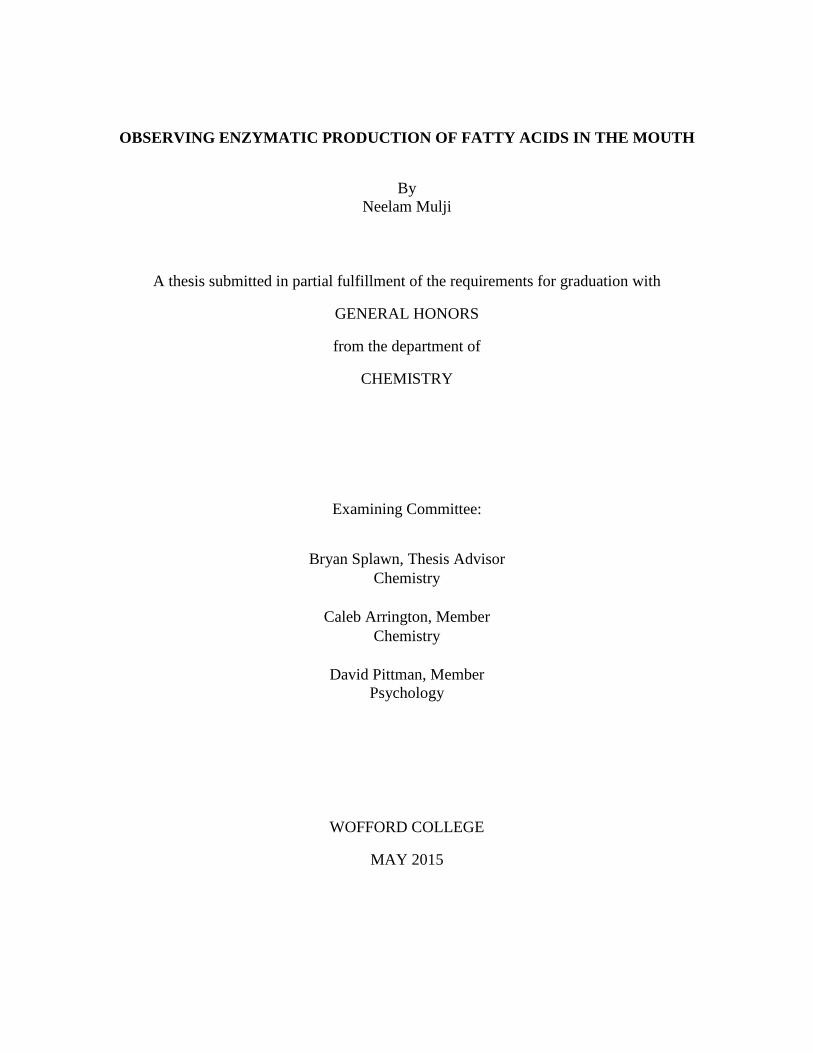
Figure 1. Visual representation of differing rates of obesity within the global population. The United States, the country of interest, reveals a >30% prevalence of obesity in the adult
population [A].
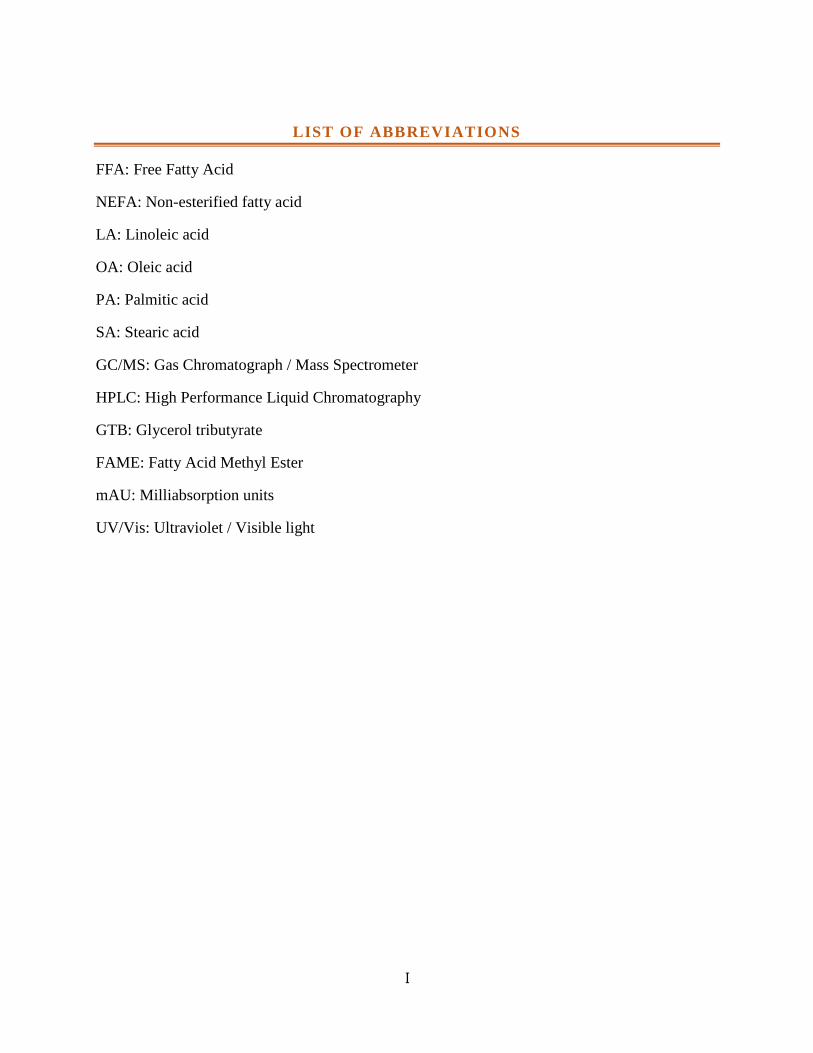
Figure 2. Schematic of formation of a triglyceride in a hydrolysis reaction [B].
III
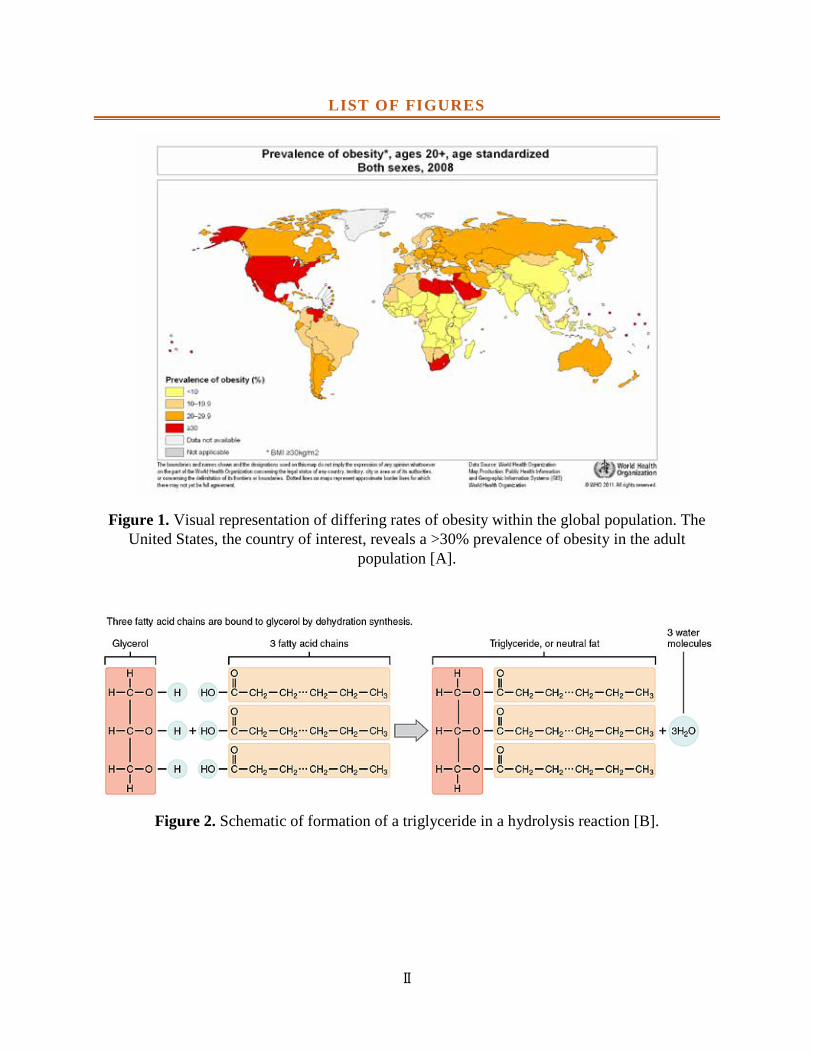
Figure 3. Comparison of the four fatty acids studied, including their corresponding molecular diagrams and formulas [C].
Figure 4. Flow diagram of a High Pressure Liquid Chromatography system [D].
IV
Figure 5. Internal view of the silanol groups and C18 chains in the HPLC column [E].
Figure 6. General reaction mechanism of esterifying triglycerides and fatty acids [F].
V
Figure 7. Saponification mechanism [G].
Figure 8. The effects of polarity and volatility choices in relation to the sample molecule injected into the HPLC [H].
VI
Figure 9. Elution process observed in the HPLC column [I].
Figure 10. Henderson-Hasselbalch equation used for buffer calculations [J].
Figure 11. Acetonitrile molecule [K].
VII
Figure 12. Schematic of the Agilent 1200 series photodiode array detector instrumentation [L].

VIII
FIGURE REFERENCES
A. Obesity. Digital Image. World Health Organization. 1 Jan. 2015. Web.
B. Triglycerides. Digital image. Wikimedia Commons. 16 May 2013. Web.
C. Fatty Acids. Digital Image. RxList Inc. 02 Feb. 2009. Web.
D. HPLC. Digital Image. Waters Corporation. 2015. Web.
E. Silanol Groups. Digital Image. Separation Science. 1 April 2015. Web.
F. Esterification. Digital Image. Hong Kong Polytechnic University. 2015. Web.
G. Saponification. Digital Image. Cornell University. 2015. Web.
H. Solvent Selection. Digital Image. Agilent Technologies, Inc. 2009. PowerPoint Presentation.
I. Elution. Chapter on High Performance Liquid Chromatography. Quantitative Chemical Analysis. 2007. Print.
J. Henderson-Hasselbalch Equation. Digital Image. ChemTeam. 2015. Web.
K. Acetonitrile. Digital Image. IndiaMART. 2015. Web.
L. Diode Array Detector. Digital Image. Agilent Technologies, Inc. 2009. PowerPoint Presentation.
1
INTRODUCTION
THE OBESITY TREND
As one of the leading preventable medical conditions in the world, obesity persists to
exist within the global population. According to the World Health Organization (WHO), obesity
is defined as excessive fat accumulation. A more quantitative definition is Body Mass Index
(BMI), which is a ratio of height and mass of an individual. Key benchmark levels, BMI > 25
defining overweight and BMI > 30 defining obese, have been implemented for decades in
understanding and defining the population at risk [1]. Figure 1 demonstrates the percentages of
each national population's obesity occurrences. Alarmingly increasing rates of obesity within the
adult as well as juvenile population warrants concern and necessitates further research of the
contributing factors [2].
As a brief overview of the pandemic at hand, access to fast food, urbanization, high
dietary salt, fat and simple sugars levels, genetic contribution as well as a decrease in physical
activity has fostered a sedentary life and bad eating habits within the American population. To be
overweight or obese can seriously harm an individual's health. Commonly known consequences
of such a lifestyle include heart disease, the primary cause of death in the United States, diabetes
and asthma amongst other conditions [2].
DIET AND TASTE PREFERENCES
The purpose of this thesis is to determine the role that triglycerides and consequently
fatty acids play in accordance to our taste sense of fat. We have hypothesized that humans are
more inclined to consume fat laden fast foods such as McDonalds ® cheeseburgers or Krispy
2
Kreme ® doughnuts because we are able to detect a certain threshold of fat in our mouths. The
following process of thinking can draw the general hypothesis: Due to an enzymatic process
within the oral cavity, triglycerides are degraded into individual fatty acid components. In turn,
the free fatty acids (FFA) interact with our various taste buds and once a certain threshold has
been surpassed, we may be able to sense and categorize a particular taste as "fatty." For example,
the choice of a slice of cake over a piece of fruit could be tied to the combination of sweet and
fat tastes that make the sensation pleasurable. Because this correlates with an equally pleasurable
or disagreeable sensation, it could indicate a basis for why we have food choices.
LITERATURE REVIEW: CURRENT STUDIES
A variety of physiological and behavioral studies have been conducted with results in
favor of the formation of our hypothesis. The majority of rat model studies suggest the
possibility of FFAs enhancing the palatability of sugary and sweet food products. A
representative example of such findings has been replicated by a 2003 study conducted by
researchers, Kawai and Fushiki. They observed that rats have a preference for concentrations of
fatty acids at a certain threshold, based upon lick rates [3]. Studies conducted a couple of years
later substantiated this evidence using rat models and a behavioral approach of conditioned taste
aversion. As demonstrated again, a threshold was hypothesized and proposed [4].
Eventually movement towards human subjects was made. Studies began to exhibit
promise in that the enzymatic breakdown of triglycerides into FFAs does occur, even if at small
amounts. A study conducted in 2012 by Kulkarni and Mattes proposed that though lingual lipase
activity is small, there were increases in the concentrations of non-esterified fatty acids (NEFA),
in particular that of linoleic acid. They eventually went on to hypothesize that "20-60 μM
3
concentrations are necessary to detect activity in the gustatory nerves" of which they recorded
nerve impulse activity as a direct correlation of threshold [5].
Such literature has provided an impetus and hope for our project. This research project
focuses on the quantitative and qualitative analysis of the products from the enzymatic process
occurring in the oral cavity with lingual lipases and triglycerides. To begin, triglycerides are the
molecules present in most foods we eat. As seen in Figure 2, the molecule comprises of a
glycerol backbone chain with three fatty acid chains. Triglycerides act as the substrate to human
lingual lipase, a type of an enzyme that "hydrolyzes ester bonds between fatty acid and glycerol
moieties of dietary triacylglycerol to produce mono and diacylglycerols and free (non-esterified)
fatty acids (NEFA)" [5]. Located in the oral cavity, the lipase acts upon lipids or triglycerides,
breaking down the molecule and consequently ester bonds into the individual FFAs.
Linoleic acid (LA), oleic acid (OA), palmitic acid (PA) and stearic acid (SA) were the
fatty acids tested. Selection of these fatty acids was based upon their naturally high occurring
levels in everyday dietary foods. Figure 3 depicts the specific molecular composition of each
fatty acid. The linoleic and oleic acids are characterized by double bonds with two and one
double bonds, respectively. Palmitic and stearic acid do not have this conjugation and instead
consist of a long hydrocarbon fatty acid chain of eighteen carbons and more. Each fatty acid can
be distinguished based on molecular formula differences.
EXPERIMENTAL SECTION
Various scientific approaches have been explored and implemented in regards to fatty
acid research. The nature of the instrumentation and methods utilized must be well understood
and is essential to understanding how to extract and manipulate the specific structure of the fatty
4
acid molecules. Additional studies have commonly employed the use of Gas Chromatograph /
Mass Spectrometer (GC/MS) instrumentation. However, High Performance Liquid
Chromatography (HPLC) was examined in the construction of our method as a means of
publishing unique data and providing another technique to measure the hydrolysis rate of
triglycerides.
UNDERSTANDING THE BASICS OF THE HPLC
Liquid chromatography was recognized in the early 1900s by the Russian botanist,
Mikhail Tsvet, through his discovery of separating plant pigments into a series of colored bands
on a packed column. Shortly thereafter, other scientists began to develop and manipulate the
basic concept of the technique towards more sophisticated molecular separations. Such examples
include ion-exchange chromatography, size exclusion chromatography, the uses of normal phase
and reversed phase and a manipulation of eluent gradients. With these contributions, HPLC
began to be suitable to a variety of useful applications including medicinal and pharmaceutical
analyses as well as for legal purposes (i.e performance enhancing drugs in urine) and chemical
research [6].
HPLC analysis begins with the injection of a small volume of 2 μL of the liquidized form
of the sample in question. The sample then runs through a column of packed silica particles, by
means of a highly pressurized system. Depending upon the polarity or lack of polarity of the
sample in question, the sample will interact with the column particles. Simultaneously, solvent is
pumped throughout the system, affecting the structural chemistry occurring between the column
and sample. The rate at which the sample will exit or elute from the column directly correlates to
the strength of the interactions aforementioned. Upon elution, the sample is then detected at a
5
preset wavelengths and exits to the waste container. Figure 4 provides a pictorial representation
of the process described.
The fatty acid molecules are derived from an enzymatic process breaking down the
structure of the triglyceride substrate. The fatty acids examined consisted of long hydrocarbon
chains and a carboxylic acid group. This suggests a highly nonpolar character by means of the
hydrophobic hydrocarbon chain and small polar character by means of the hydrophilic
carboxylic acid group. Overall, however, the nonpolar character dominates because of sheer
length of the hydrocarbon chain in comparison to the two carbon oxygen bonds.
The stationary phase is material packed into the HPLC column consisting of a porous
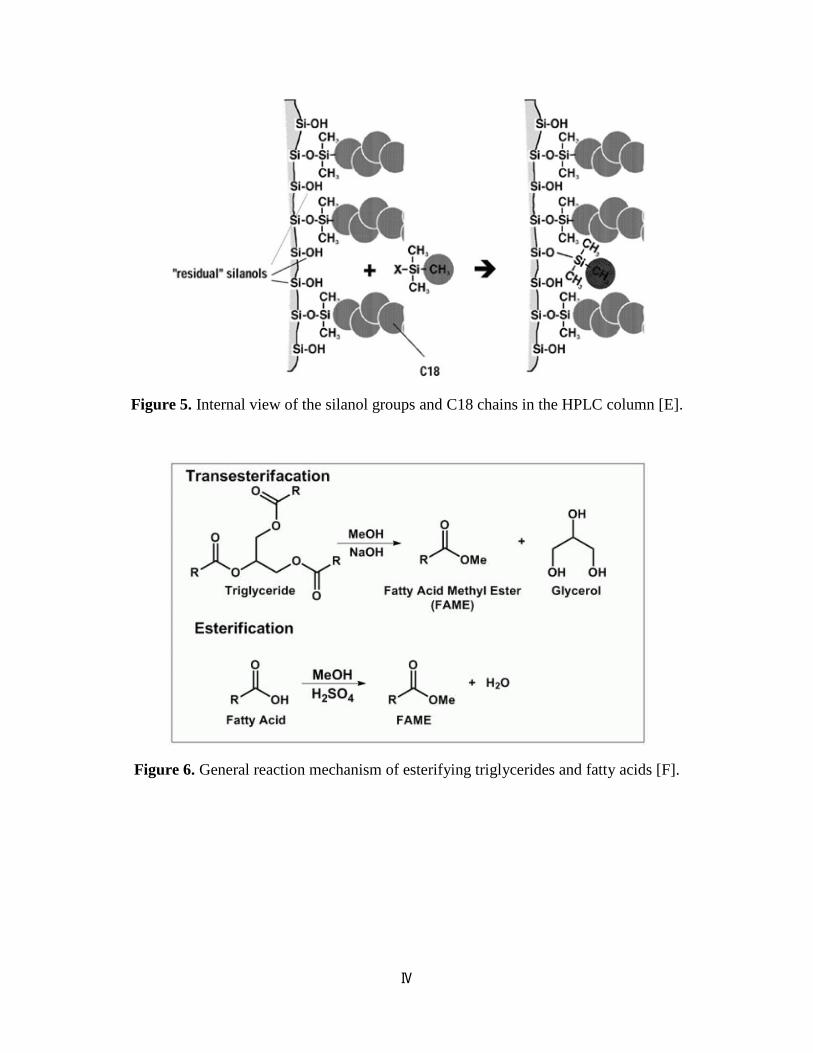
silica particle platform. On the surface of these silica particles are silanol groups, containing a
polar hydroxyl group (Figure 5). According to Sigma-Aldrich, a prominent manufacturer of
HPLC components, this platform provides the benefits of "mechanical strength, high surface
area, easy chemical modification (reactive) and can be manipulated according to different
surface chemistries..." [7]. Depending on the type of chromatography to be utilized as well as the
structural polarity of the molecules in the sample, the silanol groups can be modified to favor
attraction with nonpolar or polar mobile phases. Because the FFAs entailed in this research
involve long, nonpolar hydrocarbon character, the silanol groups were modified with an 18-
carbon (C18) chain. Considerations to be made about the stationary phase relate to its non-
uniformity, reactivity and potential degradation at low pH levels. While there are serious
drawbacks, precautions can be taken to easily prevent them, justifying its popular use in HPLC
research.
6
SAMPLE PREPARATION
This research involved the preparation of two different samples: standards and
experimental (salive and oil). Standards of the FFAs were prepared in a methanol solvent due to
good solubility due to the polar carboxylic groups. In previous sample preparation methods,
different solvents such as acetonitrile and hexane were examined in a variety of dissolving
conditions including heat and vigorous stirring. However, once it was determined methanol was
an appropriate solvent for the standards, it was continually employed. Additionally, standards
containing a combination of all of the individual FFAs were prepared. All standards originally
included a doubled concentration of glycerol tributyrate (GTB) in relation to the concentration of
the individual fatty acid components. The purpose of GTB is to serve as a marker of comparison
against the peaks of the fatty acids detected by the diode array detector. The volumes and
concentrations of the standards were kept constant throughout the research at 0.045g and 0.090g
of the FFA dissolved in 50mL methanol. These concentrations were chosen based off the
effectiveness of the detection at these concentrations in a previously conducted experiment
attempting to carry out a similar purpose - separating the components of diet soft drinks [8,9].
Standards used for the design of a calibration curve were prepared differently. Calibration
curves are designed for the purpose of determining an unknown concentration of a substance
from a sample. The curve records known concentration as a function of signal detected by the
detector. External standards were prepared at specific, predetermined concentrations of the
FFAs. Their purpose allows for the possibility to analyze a large series of samples using a single
calibration curve.
7
While standards were prepared the majority of the research term, some experimental
samples were prepared. Their preparation method was derived from a previous study that
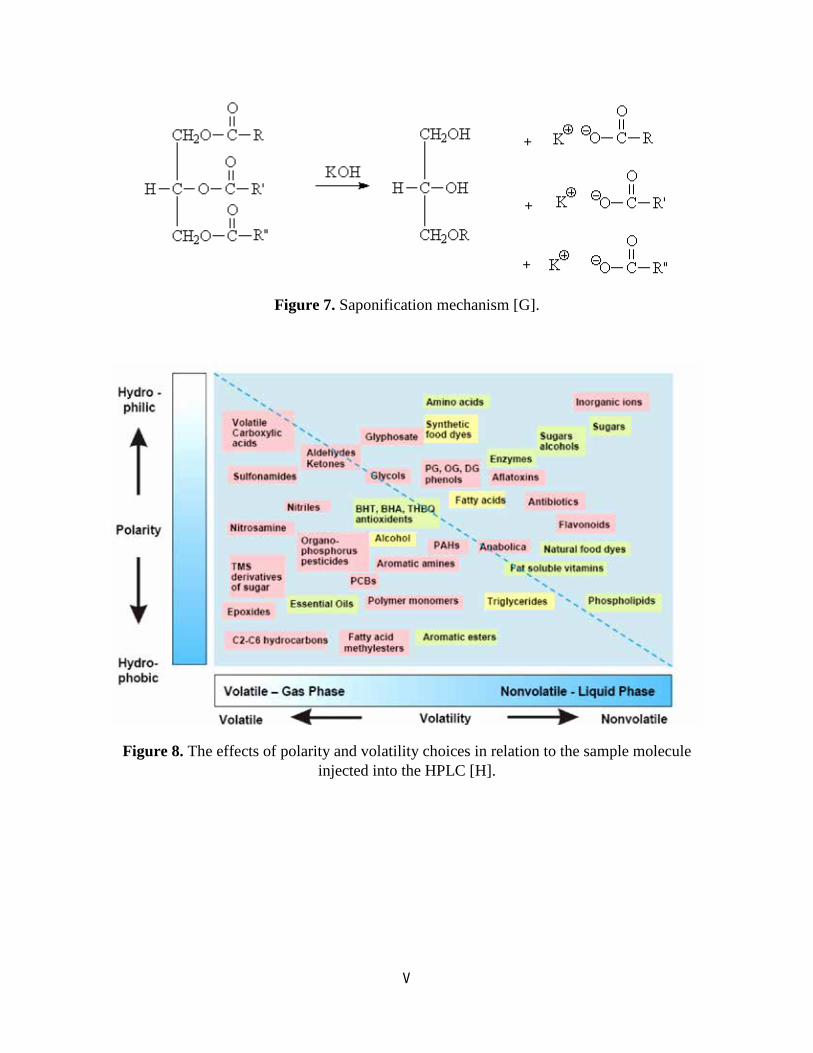
derivatized the fatty acid molecules for the purpose of better detection [10]. An esterification
mechanism was utilized so as to replace the hydroxyl group of the fatty acid carboxylic group
with a methanol group, as demonstrated in Figure 6. The procedure consisted of adding 1 mL of
hexane, 0.1 mL of the standard and 1 mL of a mixture of 1.55g NaOH in 50 mL ethanol together
in a test tube. It was then vortexed for 3 minutes to ensure proper mixing. Once the nonpolar
hexane and polar fatty acid methyl ester (FAME) layers separate, 0.5mL of the top layer
containing the highly nonpolar FAME is extracted. It is transferred to a 1.5mL HPLC vial and
filled to the 1.5 mL mark with hexane. The sample is run in the HPLC with a wash vial cleaning
the needle between each run.
The same procedure was repeated to determine the FFA background of the olive oil in the
HPLC, replacing the 0.1mL of standard with 0.1mL of olive oil. Samples containing saliva were
run in the same manner but with additional steps. Approximately ten milliliters of saliva were
obtained from my research partner. A portion of this saliva extract, 9.5mL, was mixed with
0.5mL olive oil and vortexed for three minutes. Two milliliters of ethanol were then added so as
to denature the enzymes present in the saliva and vortexed for another three minutes to ensure
complete denaturation. Additional modifications were made on these samples for the purpose of
obtaining as much of the top layer as possible. Two milliliters of hexane and two milliliters of
the sodium hydroxide and methanol mixture replaced the one-milliliter volumes. The standard
sample volume was tripled so as to ensure a large amount of extracted product for HPLC
injection.
8
To continue the esterification method, the structure of pure olive oil was also modified,
similar to the esterification of the individual FFA standards aforementioned. The mechanism of
the process utilized is called saponification (Figure 7). In essence, the individual fatty acid and
glycerol backbone chains re-form and the presence of triglycerides diminish. The process of
degrading the triglycerides without the presence of an enzyme is a direct measure of the
concentrations of the FFAs. The comparison of these two methods of esterification and
saponification should theoretically be very similar.
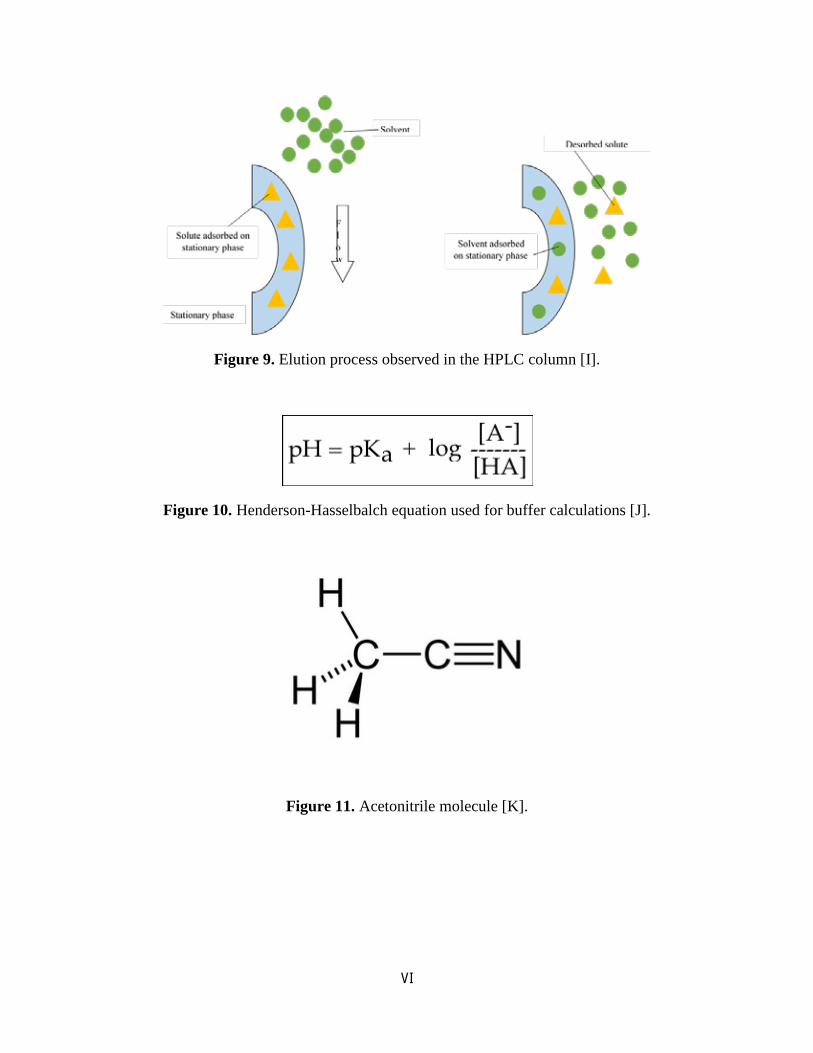
ELUTION PROCESS
In order to understand the results of the process, one must understand important concepts
in regard to the column chemistry. The type of liquid chromatography used is called adsorption
chromatography. When the solvent and solute molecules are injected into the column, they
compete for sites on the silica stationary phase. Solvent molecules will eventually displace the
solute molecules leading to elution of the compound. The stronger the eluent strength (ε°) of a
solvent, the better the solvent is at adsorbing to the column surface and eluting the solutes or
sample molecules. Depending on the composition of the sample molecule, specific solvents must
be chosen carefully with consideration of the polarity, volatility and eluent strength (Figure 8).
More specifically, the type of adsorption chromatography employed is termed reverse
phase chromatography. Simply put, the stationary and mobile phases are nonpolar and relatively
nonpolar, respectively. As one would think, reverse phase chromatography works opposite of the
theory of normal phase chromatography. Figure 9 offers a visual representation of the process to
be described. The nonpolar FFA will react with the nonpolar stationary phase in a process called
adsorption. The solvent with nonpolar and polar properties will compete with the solute to
9
adsorb to the surface of the stationary phase. For example, solvents such as acetonitrile (ε°=
0.52) have high eluent strength and are nonpolar enough to desorb and compete with the solute.
As this process of solute desorption occurs, the solvent pushes the solute through the column and
it finally elutes to be detected.
The common component to the elution methods implemented through the course of the
project is a phosphate buffer at a pH = 3. According to the Henderson-Hasselbalch equation, the
buffer was prepared 2 pKa units lower than that of the fatty acids which generally varied at pH =
5 (Figure 10). Buffers are essential to the functioning of the elution process due to their ability to
maintain the pH constant. If the pH of the column is not accounted for and crosses an acidity
threshold, one faces the risk of silica column degradation, which can cause peak tailing in the
detection readings. The alcohol group attached to the carbonyl carbon of the fatty acid carboxylic
group could deprotonate, leaving positively charged protons running through the column. This
possibility of ionization of the fatty acids calls for the use of the buffer. Additionally, the
aqueous nature of the buffer aids in exploiting the polar carboxylic acid group characteristics of
the fatty acids.
GRADIENT METHODS
The initial elution method used in the experiment entailed the use of methanol as the
solvent. Methanol, CH3OH, is a polar molecule. While methanol has the highest eluent strength
for normal phase chromatography, it has the lowest for the reversed phase chromatography used.
Acetonitrile has an eluent strength difference of 0.20 lower than that of methanol, making it a
suitable choice for the instrumentation. Another note to take into consideration is the solvent's
ultraviolet cutoff (nm) variables. It is important that the solvent and the molecule in question are
10
detected at slightly different wavelengths. While the molecules were being measured at 205nm,
methanol has an ultraviolet cutoff variable of 205nm as well. The overlap of the sample and
solvent could show a high background signal in the chromatogram (i.e. instrument signal vs.
time) results leading to possible misinterpretation of the reading. Therefore, acetonitrile proved
itself a viable option due to its similarly high eluent strength and ultraviolet cutoff at 190nm,
rather than 205nm. In terms of structure, acetonitrile is a primarily polar structure due to its
carbon-nitrogen bond, however it possesses a slightly nonpolar structure due to the methyl group
attached to the carbon (Figure 11). This duality proves useful in extracting the polar and
nonpolar portions of the fatty acid molecule.
The final method used consisted of a mixture of acetonitrile and aqueous buffer for the
aforementioned reasons. Because isocratic or one solvent elution methods were not resulting in
good compound separation, a gradient elution was considered. According to Quantitative
Chemical Analysis, a gradient elution is defined as "a continuous change of solvent composition
to increase eluent strength. Gradient elution in HPLC is analogous to temperature programming
in gas chromatography. Increased eluent strength is required to elute more strongly retained
solutes" [11]. The gradient began with 70% HPLC grade acetonitrile and 30% phosphate buffer
and ended with 100% acetonitrile and 0% phosphate buffer. The ratio effectively extracted out
compounds upon initial readings with the implementation of the method. Due to this
effectiveness, it was used throughout the rest of the data collection period.
Other essential parameters to examine include column temperature and mobile phase.
Temperature can be manipulated to adjust the selectivity of the molecule separation. Increase in
the temperature was examined in the method development phase for the purpose of shortening
the run time and increasing the speed at which the sample passes through the column. The
11
temperature of the column was set at 35°C for the purpose of keeping the mobile phase well
solvated [12]. Sigma Aldrich also cites improvements in efficiency and resolution of the peaks,
lower consumption of organic solvents (green chromatography) and improved detectability as a
result of temperature increase [7].
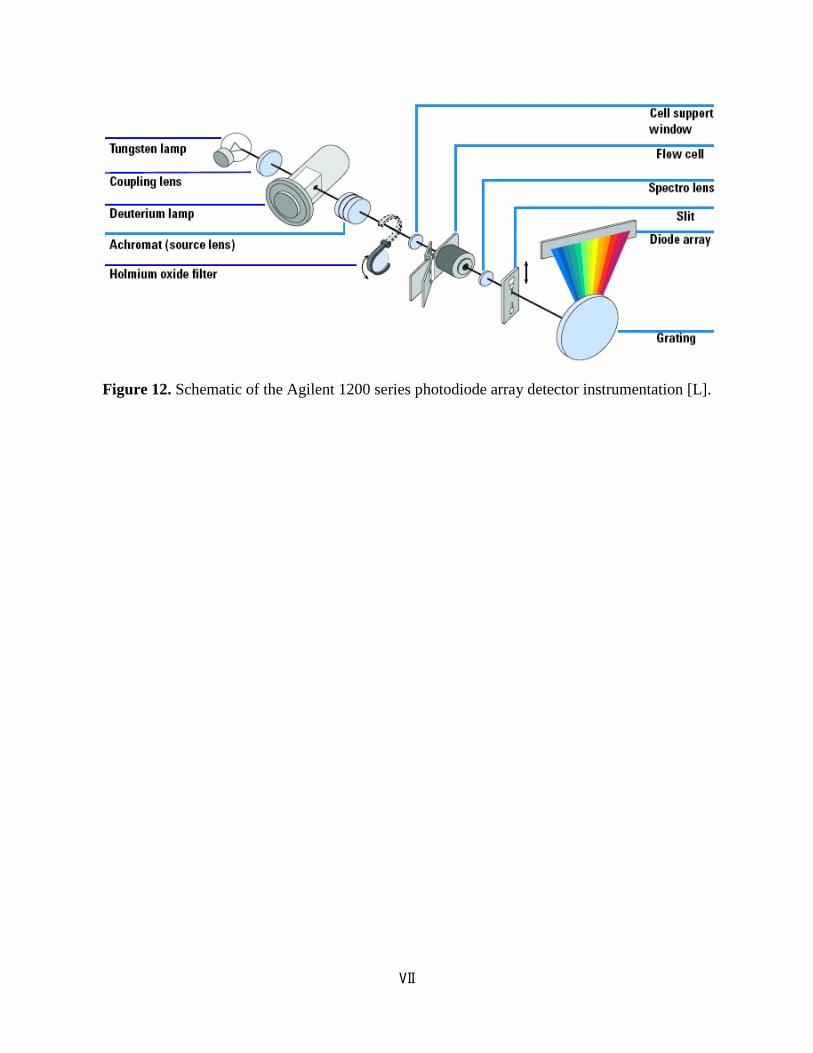
DETECTION
As the compounds leave the column or elute, a detector, more specifically, the Agilent
1200 Series Diode Array and Multiple Wavelength Detector SL, measures them. Since some
solutes absorb ultraviolet light, the user can choose specific wavelengths at which to measure the
molecules. A diagram of the photodiode array detector demonstrates its basic components
(Figure 12). Light is projected from a light source, reflecting off of an elliptical mirror, passing
through the sample. This light continues until it reflects off another mirror, which directs it to the
grating polychromator, which disperses this beam of light into different component wavelengths.
The slits in the polychromator are functions of peak resolution, measuring at 4nm in this
particular instrumentation. Finally, the component wavelengths are focused onto the photodiode
array detector, each diode receiving a different component. The detector simultaneously reads
the incoming waves and reports it onto the computer in the form of a chromatogram.
RESULTS
METHOD DEVELOPMENT
The beginning of the research involved the development of an appropriate method. The
first step of this process was the selection of a solvent that did not absorb at the detection
wavelength, and result in high background or in the baseline signal in chromatograms. This
12
requirement was vital for reading future experimental sample chromatograms. If the background
noise is present, it could misconstrue the actual detection of the components in the sample.
The first solvent selection was methanol, and then acetonitrile. In each instance,
phosphate buffer was run with each solvent. The polar nature of the buffer and the nonpolar
nature of the organic solvent were coordinated to effectively elute the FFA solutes. Throughout
the experiment, the method was modified to obtain the best resolution. Initially, the temperature
of the column was set at room temperature (25°C) and the wavelengths considered was 235nm,
254nm, 265nm, 275nm, 280nm to cover a broad range of detection limits. After discovering that
the optimal wavelengths for HPLC solvents usually are at 200nm, 192nm was chosen as a
standard wavelength for detection because acetonitrile had a relatively low background
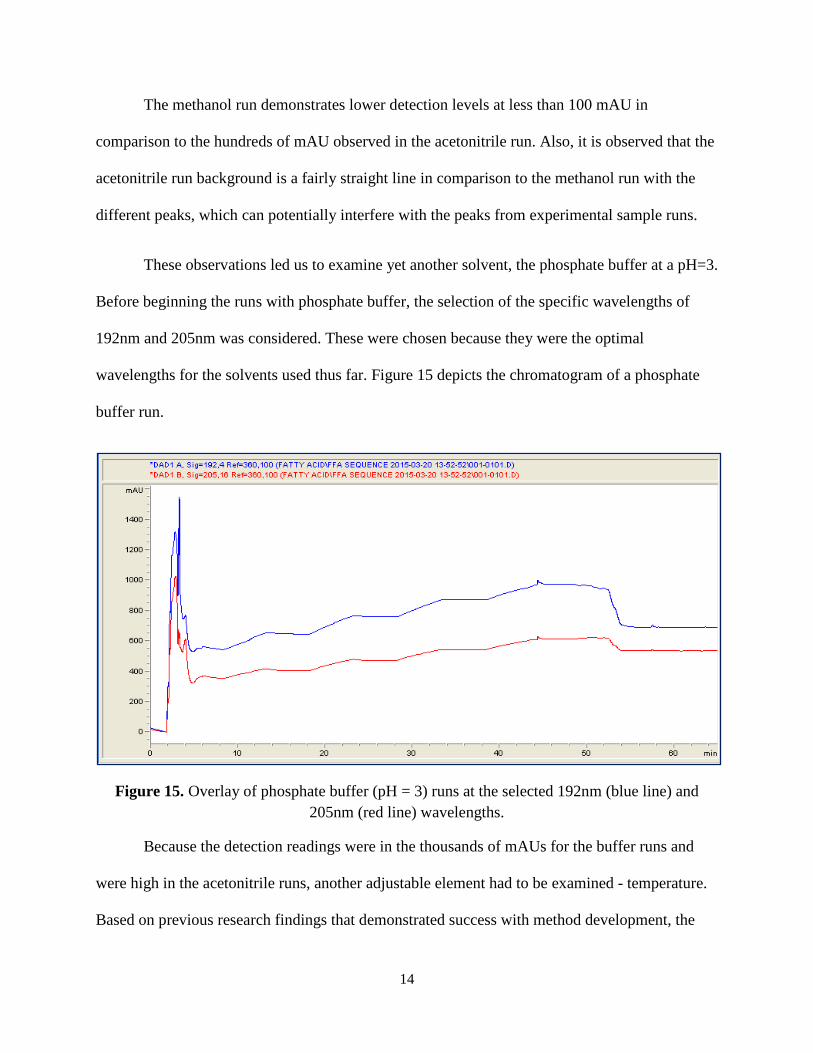
absorbance at this wavelength. A comparison of the overlaid signal chromatograms in Figures 13
and 14 depict completed solvent runs.
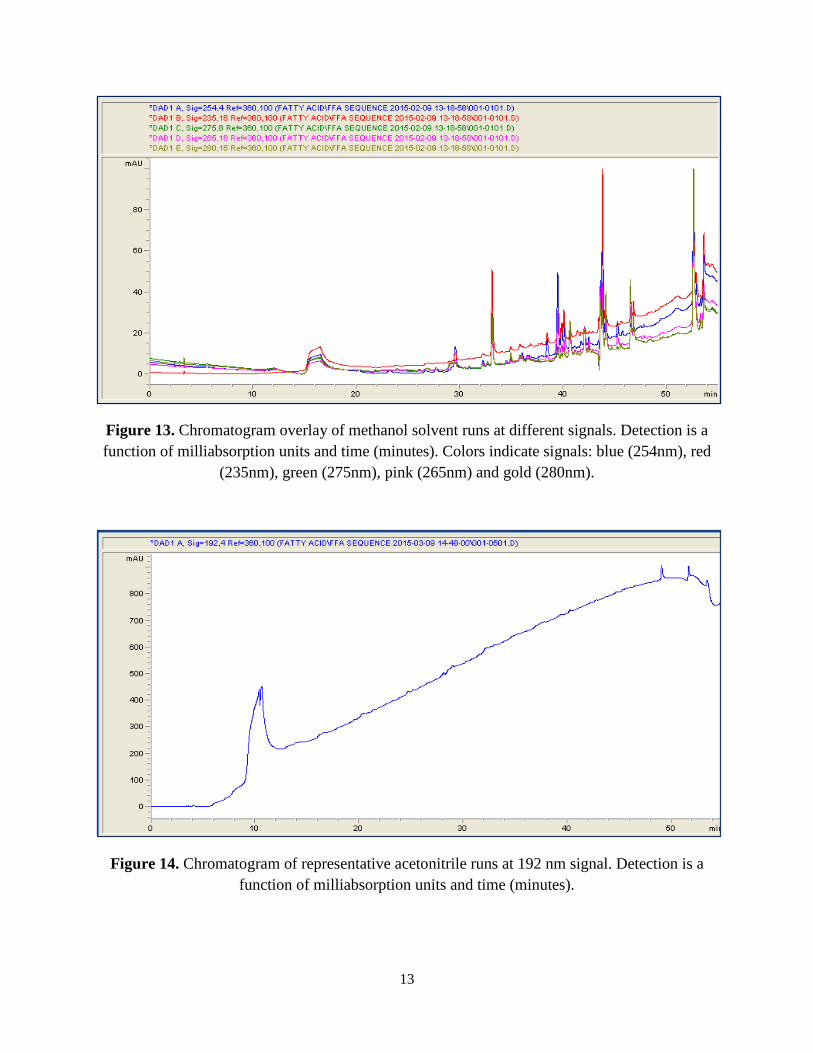
13
Figure 13. Chromatogram overlay of methanol solvent runs at different signals. Detection is a function of milliabsorption units and time (minutes). Colors indicate signals: blue (254nm), red
(235nm), green (275nm), pink (265nm) and gold (280nm).
Figure 14. Chromatogram of representative acetonitrile runs at 192 nm signal. Detection is a function of milliabsorption units and time (minutes).
14
The methanol run demonstrates lower detection levels at less than 100 mAU in
comparison to the hundreds of mAU observed in the acetonitrile run. Also, it is observed that the
acetonitrile run background is a fairly straight line in comparison to the methanol run with the
different peaks, which can potentially interfere with the peaks from experimental sample runs.
These observations led us to examine yet another solvent, the phosphate buffer at a pH=3.
Before beginning the runs with phosphate buffer, the selection of the specific wavelengths of
192nm and 205nm was considered. These were chosen because they were the optimal
wavelengths for the solvents used thus far. Figure 15 depicts the chromatogram of a phosphate
buffer run.
Figure 15. Overlay of phosphate buffer (pH = 3) runs at the selected 192nm (blue line) and 205nm (red line) wavelengths.
Because the detection readings were in the thousands of mAUs for the buffer runs and
were high in the acetonitrile runs, another adjustable element had to be examined - temperature.
Based on previous research findings that demonstrated success with method development, the
15
column temperature was adjusted to 35 °C to keep the sample sufficiently dissolved. Any
temperature significantly higher than this runs risks of changing the ongoing structural chemistry
in the column or the structural integrity of the column. Running the acetonitrile and buffer runs
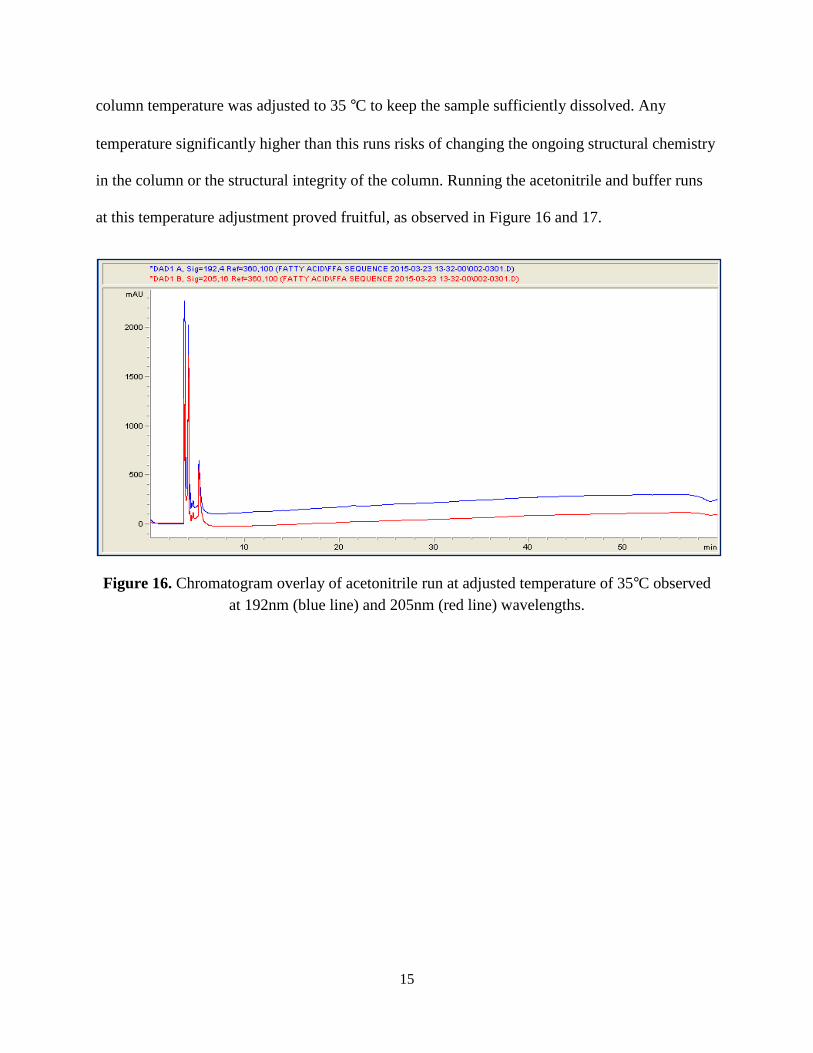
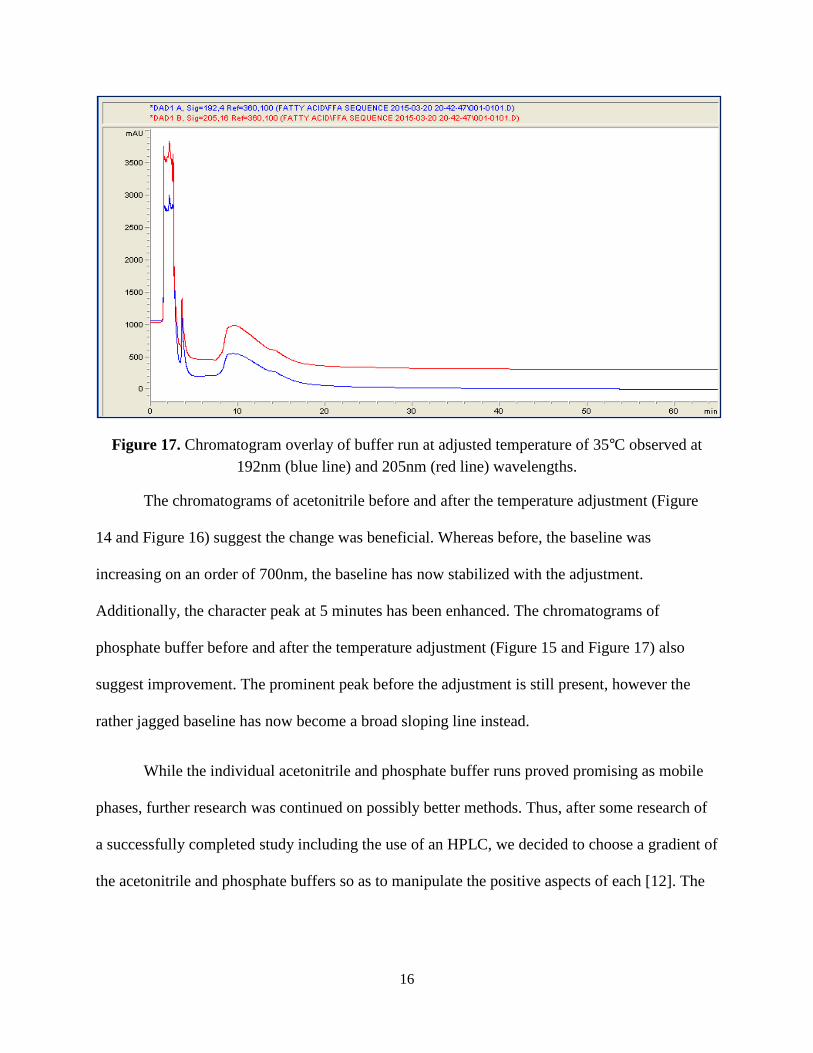
at this temperature adjustment proved fruitful, as observed in Figure 16 and 17.
Figure 16. Chromatogram overlay of acetonitrile run at adjusted temperature of 35°C observed at 192nm (blue line) and 205nm (red line) wavelengths.
16
Figure 17. Chromatogram overlay of buffer run at adjusted temperature of 35°C observed at 192nm (blue line) and 205nm (red line) wavelengths.
The chromatograms of acetonitrile before and after the temperature adjustment (Figure
14 and Figure 16) suggest the change was beneficial. Whereas before, the baseline was
increasing on an order of 700nm, the baseline has now stabilized with the adjustment.
Additionally, the character peak at 5 minutes has been enhanced. The chromatograms of
phosphate buffer before and after the temperature adjustment (Figure 15 and Figure 17) also
suggest improvement. The prominent peak before the adjustment is still present, however the
rather jagged baseline has now become a broad sloping line instead.
While the individual acetonitrile and phosphate buffer runs proved promising as mobile
phases, further research was continued on possibly better methods. Thus, after some research of
a successfully completed study including the use of an HPLC, we decided to choose a gradient of
the acetonitrile and phosphate buffers so as to manipulate the positive aspects of each [12]. The
17
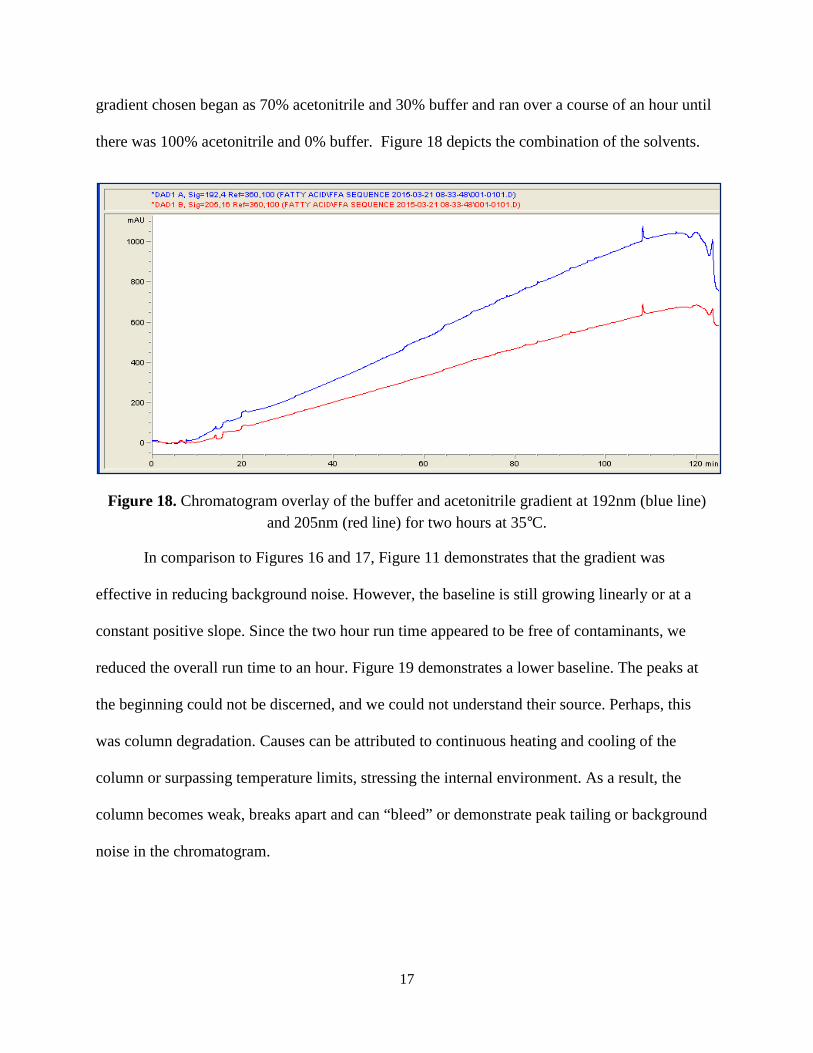
gradient chosen began as 70% acetonitrile and 30% buffer and ran over a course of an hour until
there was 100% acetonitrile and 0% buffer. Figure 18 depicts the combination of the solvents.
Figure 18. Chromatogram overlay of the buffer and acetonitrile gradient at 192nm (blue line) and 205nm (red line) for two hours at 35°C.
In comparison to Figures 16 and 17, Figure 11 demonstrates that the gradient was
effective in reducing background noise. However, the baseline is still growing linearly or at a
constant positive slope. Since the two hour run time appeared to be free of contaminants, we
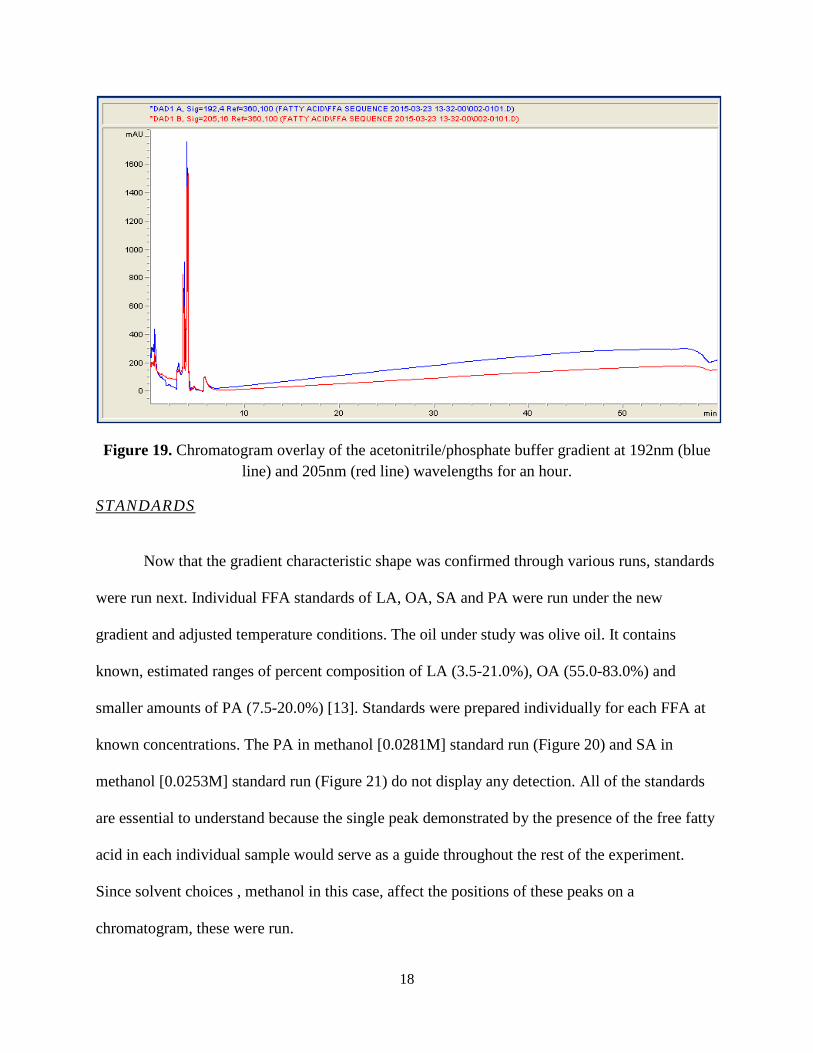
reduced the overall run time to an hour. Figure 19 demonstrates a lower baseline. The peaks at
the beginning could not be discerned, and we could not understand their source. Perhaps, this
was column degradation. Causes can be attributed to continuous heating and cooling of the
column or surpassing temperature limits, stressing the internal environment. As a result, the
column becomes weak, breaks apart and can “bleed” or demonstrate peak tailing or background
noise in the chromatogram.
18
Figure 19. Chromatogram overlay of the acetonitrile/phosphate buffer gradient at 192nm (blue line) and 205nm (red line) wavelengths for an hour.
STANDARDS
Now that the gradient characteristic shape was confirmed through various runs, standards
were run next. Individual FFA standards of LA, OA, SA and PA were run under the new
gradient and adjusted temperature conditions. The oil under study was olive oil. It contains
known, estimated ranges of percent composition of LA (3.5-21.0%), OA (55.0-83.0%) and
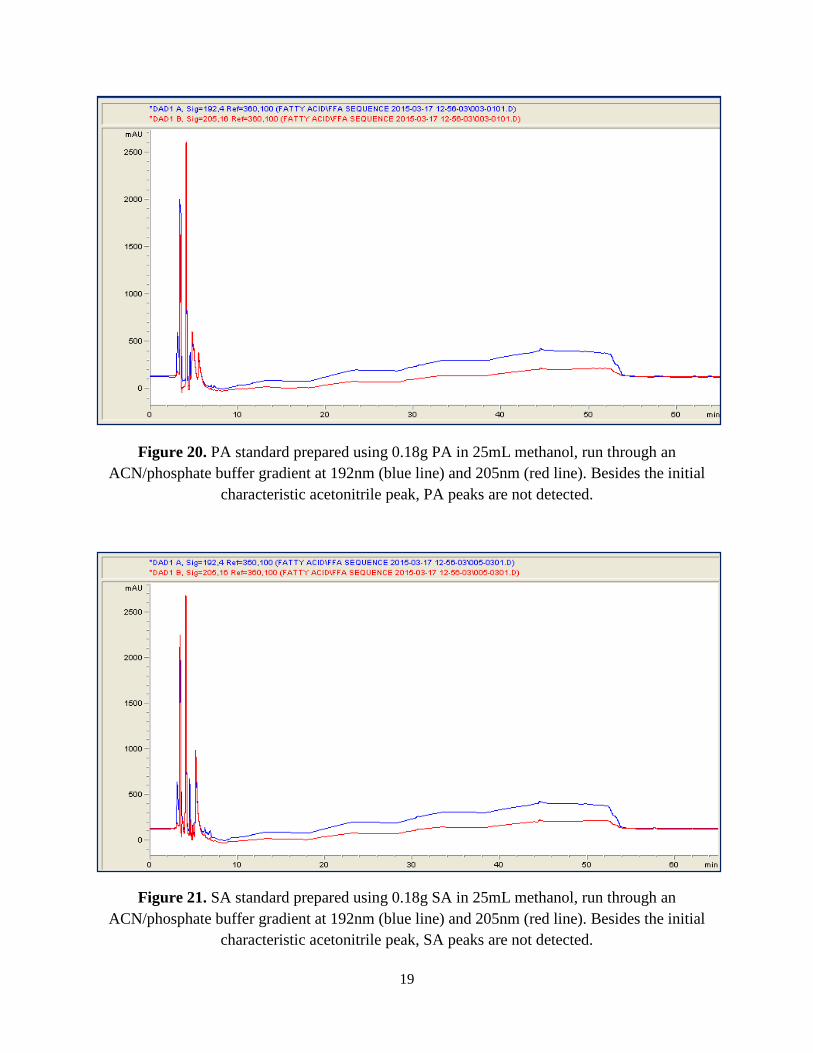
smaller amounts of PA (7.5-20.0%) [13]. Standards were prepared individually for each FFA at
known concentrations. The PA in methanol [0.0281M] standard run (Figure 20) and SA in
methanol [0.0253M] standard run (Figure 21) do not display any detection. All of the standards
are essential to understand because the single peak demonstrated by the presence of the free fatty
acid in each individual sample would serve as a guide throughout the rest of the experiment.
Since solvent choices , methanol in this case, affect the positions of these peaks on a
chromatogram, these were run.
19
Figure 20. PA standard prepared using 0.18g PA in 25mL methanol, run through an ACN/phosphate buffer gradient at 192nm (blue line) and 205nm (red line). Besides the initial
characteristic acetonitrile peak, PA peaks are not detected.
Figure 21. SA standard prepared using 0.18g SA in 25mL methanol, run through an ACN/phosphate buffer gradient at 192nm (blue line) and 205nm (red line). Besides the initial
characteristic acetonitrile peak, SA peaks are not detected.
20
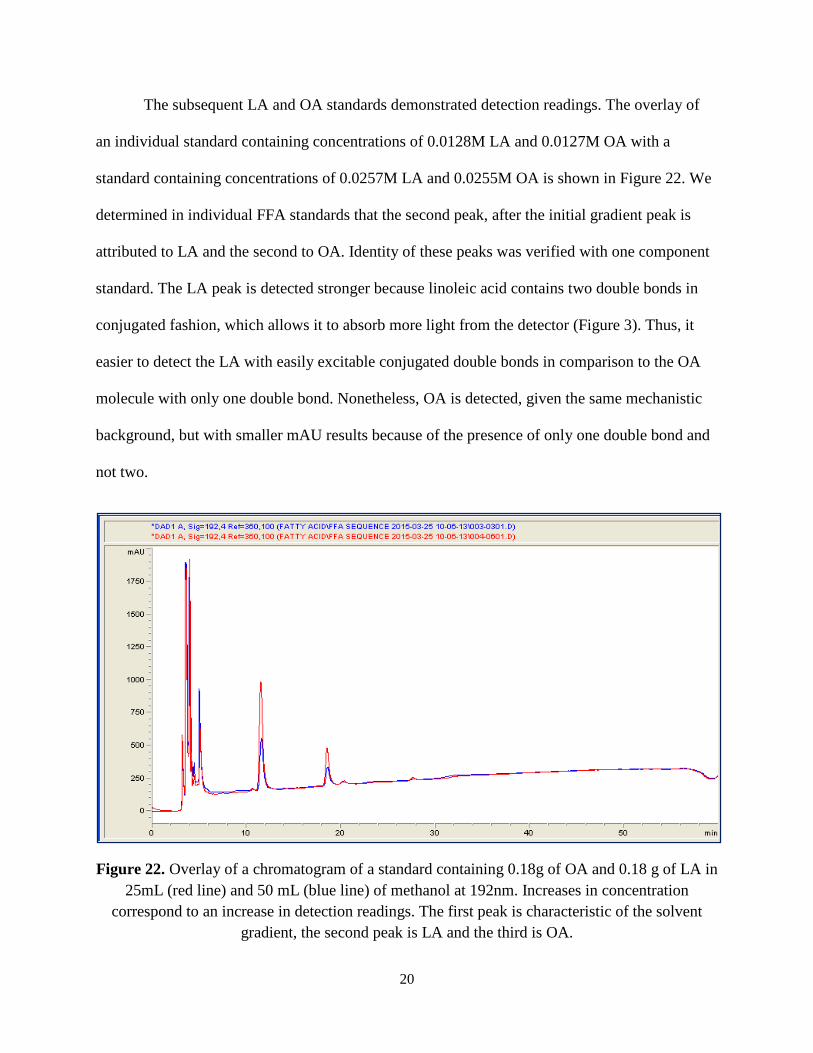
The subsequent LA and OA standards demonstrated detection readings. The overlay of
an individual standard containing concentrations of 0.0128M LA and 0.0127M OA with a
standard containing concentrations of 0.0257M LA and 0.0255M OA is shown in Figure 22. We
determined in individual FFA standards that the second peak, after the initial gradient peak is
attributed to LA and the second to OA. Identity of these peaks was verified with one component
standard. The LA peak is detected stronger because linoleic acid contains two double bonds in
conjugated fashion, which allows it to absorb more light from the detector (Figure 3). Thus, it
easier to detect the LA with easily excitable conjugated double bonds in comparison to the OA
molecule with only one double bond. Nonetheless, OA is detected, given the same mechanistic
background, but with smaller mAU results because of the presence of only one double bond and
not two.
Figure 22. Overlay of a chromatogram of a standard containing 0.18g of OA and 0.18 g of LA in 25mL (red line) and 50 mL (blue line) of methanol at 192nm. Increases in concentration
correspond to an increase in detection readings. The first peak is characteristic of the solvent gradient, the second peak is LA and the third is OA.
21
EFFECTS OF ESTERIFICATION
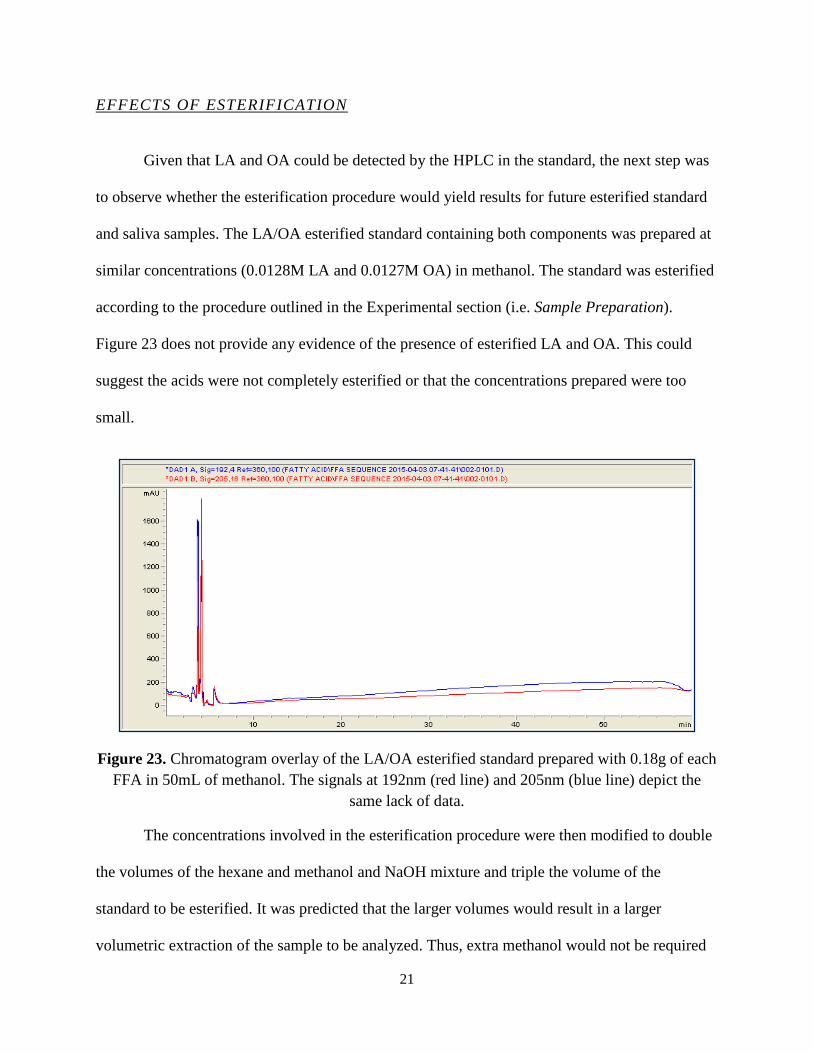
Given that LA and OA could be detected by the HPLC in the standard, the next step was
to observe whether the esterification procedure would yield results for future esterified standard
and saliva samples. The LA/OA esterified standard containing both components was prepared at
similar concentrations (0.0128M LA and 0.0127M OA) in methanol. The standard was esterified
according to the procedure outlined in the Experimental section (i.e. Sample Preparation).
Figure 23 does not provide any evidence of the presence of esterified LA and OA. This could
suggest the acids were not completely esterified or that the concentrations prepared were too
small.
Figure 23. Chromatogram overlay of the LA/OA esterified standard prepared with 0.18g of each FFA in 50mL of methanol. The signals at 192nm (red line) and 205nm (blue line) depict the
same lack of data.
The concentrations involved in the esterification procedure were then modified to double
the volumes of the hexane and methanol and NaOH mixture and triple the volume of the
standard to be esterified. It was predicted that the larger volumes would result in a larger
volumetric extraction of the sample to be analyzed. Thus, extra methanol would not be required
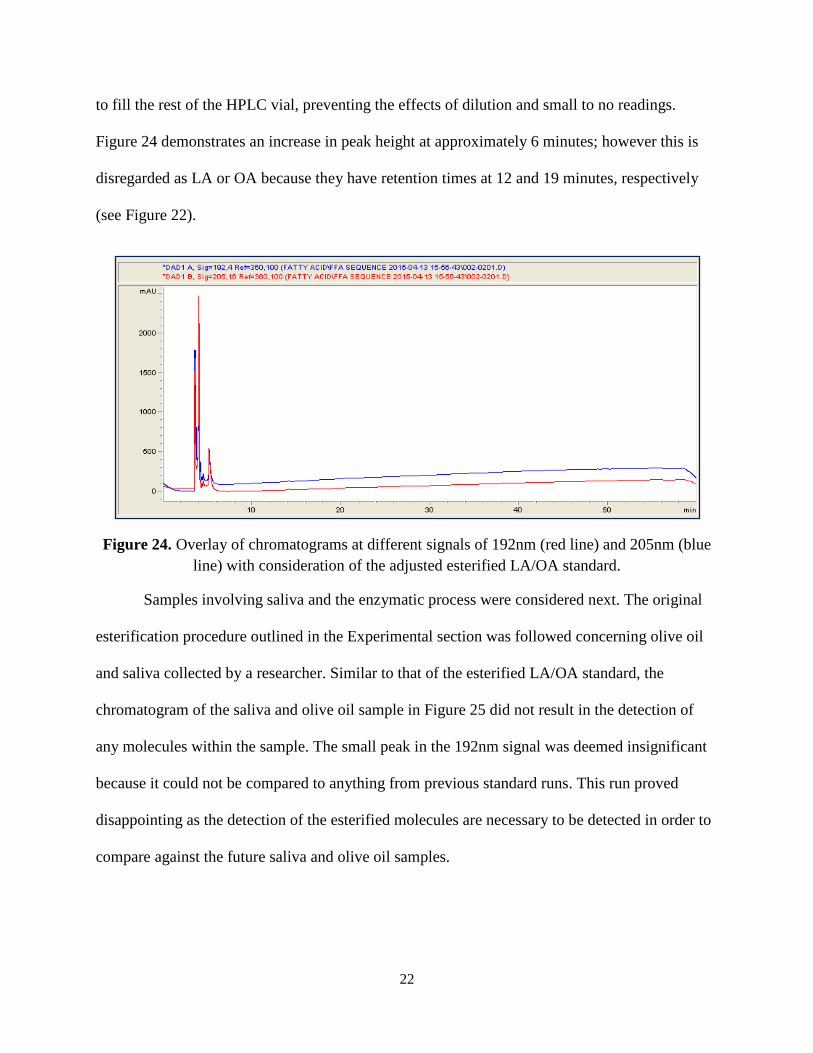
22
to fill the rest of the HPLC vial, preventing the effects of dilution and small to no readings.
Figure 24 demonstrates an increase in peak height at approximately 6 minutes; however this is
disregarded as LA or OA because they have retention times at 12 and 19 minutes, respectively
(see Figure 22).
Figure 24. Overlay of chromatograms at different signals of 192nm (red line) and 205nm (blue line) with consideration of the adjusted esterified LA/OA standard.
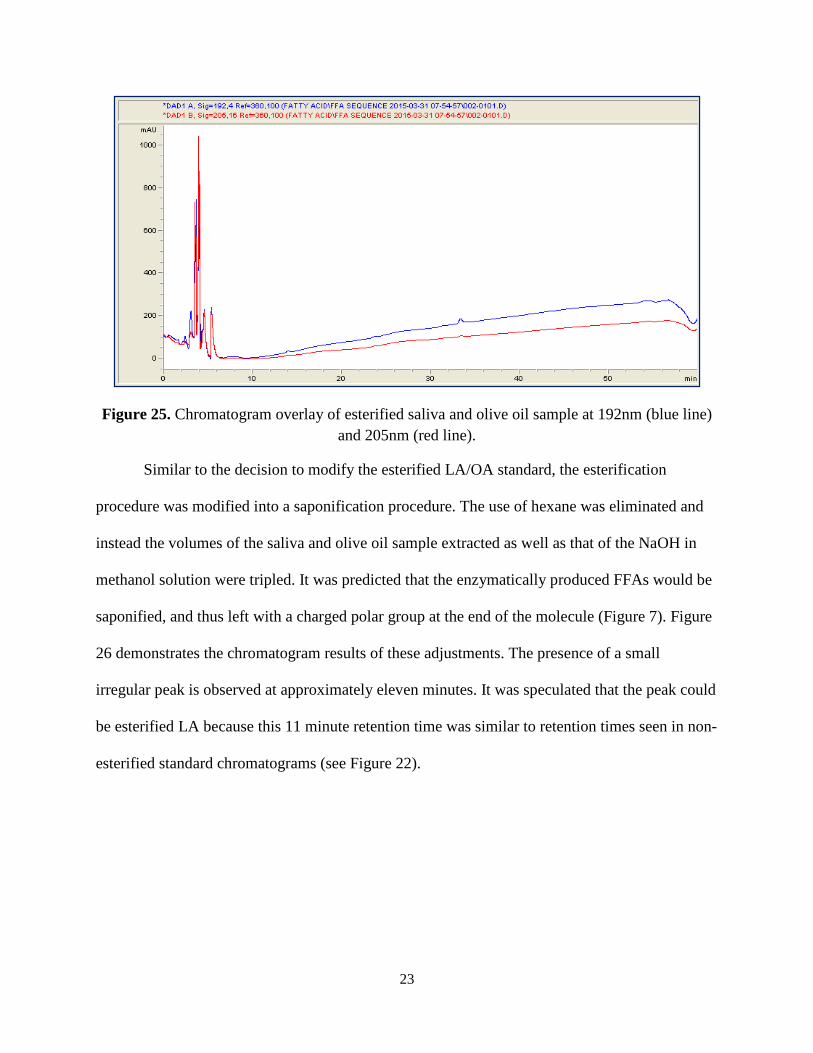
Samples involving saliva and the enzymatic process were considered next. The original
esterification procedure outlined in the Experimental section was followed concerning olive oil
and saliva collected by a researcher. Similar to that of the esterified LA/OA standard, the
chromatogram of the saliva and olive oil sample in Figure 25 did not result in the detection of
any molecules within the sample. The small peak in the 192nm signal was deemed insignificant
because it could not be compared to anything from previous standard runs. This run proved
disappointing as the detection of the esterified molecules are necessary to be detected in order to
compare against the future saliva and olive oil samples.
23
Figure 25. Chromatogram overlay of esterified saliva and olive oil sample at 192nm (blue line) and 205nm (red line).
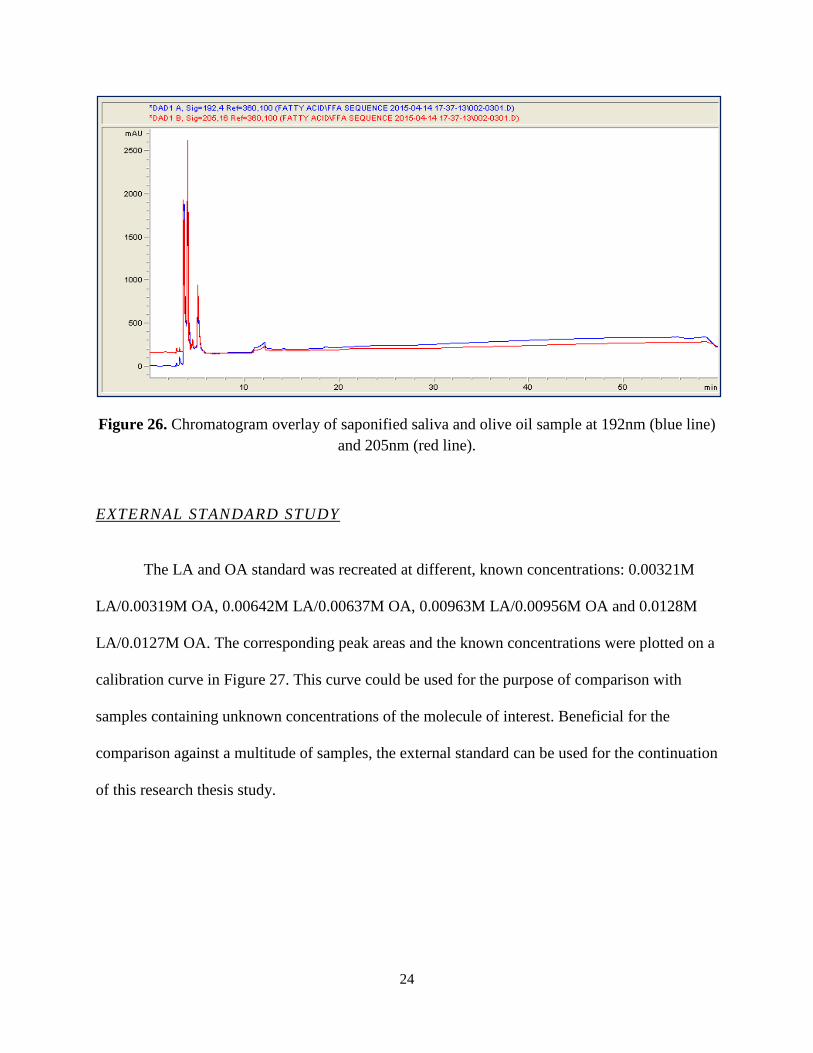
Similar to the decision to modify the esterified LA/OA standard, the esterification
procedure was modified into a saponification procedure. The use of hexane was eliminated and
instead the volumes of the saliva and olive oil sample extracted as well as that of the NaOH in
methanol solution were tripled. It was predicted that the enzymatically produced FFAs would be
saponified, and thus left with a charged polar group at the end of the molecule (Figure 7). Figure
26 demonstrates the chromatogram results of these adjustments. The presence of a small
irregular peak is observed at approximately eleven minutes. It was speculated that the peak could
be esterified LA because this 11 minute retention time was similar to retention times seen in non-
esterified standard chromatograms (see Figure 22).
24
Figure 26. Chromatogram overlay of saponified saliva and olive oil sample at 192nm (blue line) and 205nm (red line).
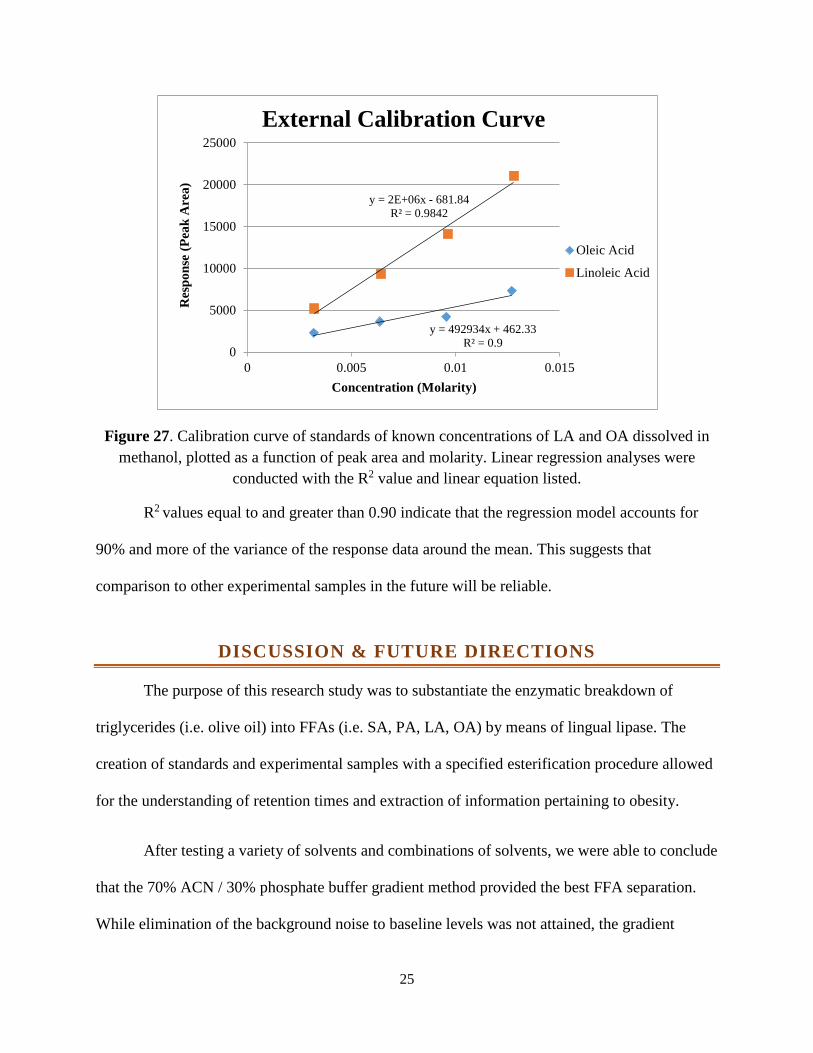
EXTERNAL STANDARD STUDY
The LA and OA standard was recreated at different, known concentrations: 0.00321M
LA/0.00319M OA, 0.00642M LA/0.00637M OA, 0.00963M LA/0.00956M OA and 0.0128M
LA/0.0127M OA. The corresponding peak areas and the known concentrations were plotted on a
calibration curve in Figure 27. This curve could be used for the purpose of comparison with
samples containing unknown concentrations of the molecule of interest. Beneficial for the
comparison against a multitude of samples, the external standard can be used for the continuation
of this research thesis study.
25
Figure 27. Calibration curve of standards of known concentrations of LA and OA dissolved in methanol, plotted as a function of peak area and molarity. Linear regression analyses were
conducted with the R2 value and linear equation listed.
R2 values equal to and greater than 0.90 indicate that the regression model accounts for
90% and more of the variance of the response data around the mean. This suggests that
comparison to other experimental samples in the future will be reliable.
DISCUSSION & FUTURE DIRECTIONS
The purpose of this research study was to substantiate the enzymatic breakdown of
triglycerides (i.e. olive oil) into FFAs (i.e. SA, PA, LA, OA) by means of lingual lipase. The
creation of standards and experimental samples with a specified esterification procedure allowed
for the understanding of retention times and extraction of information pertaining to obesity.
After testing a variety of solvents and combinations of solvents, we were able to conclude
that the 70% ACN / 30% phosphate buffer gradient method provided the best FFA separation.
While elimination of the background noise to baseline levels was not attained, the gradient
y = 492934x + 462.33R² = 0.9
y = 2E+06x - 681.84R² = 0.9842
0
5000
10000
15000
20000
25000
0 0.005 0.01 0.015
Res
pons
e (P
eak
Are
a)
Concentration (Molarity)
External Calibration Curve
Oleic Acid
Linoleic Acid
26
offered a comparable solution with minimal background. Once a solvent system was established,
other factors such as temperature and run time were adjusted. Temperature was raised from room
temperature so as to keep the FFAs soluble in the acetonitrile / phosphate buffer solvent system.
Meanwhile, run time was shortened to an hour for efficiency sake.
Thereafter, standard samples were run to provide background levels of the olive oil.
These were successful in identifying two of the FFA common to the oil - LA and OA. However,
the results of the two variations of the same esterification method were not consistent. The
adjustment to the original esterification method should have produced large peaks, however
nothing was shown. The saliva samples were prepared following the standards and also lead to
inconclusive results. While the variation of the esterification method was different than with the
standards, the large volume of NaOH should have saponified the sample thoroughly but very
minimal peaks were observed.
One consideration that was not pursued is the possibility of derivatizing the fatty acid
molecules as well as triglycerides for better detection purposes. Because UV/Vis light is partial
to double bonds, conjugation and aromatic groups, addition to and modification of the FFA
molecules could allow for visible peaks in the chromatograms. Perhaps the void chromatograms
seen throughout the sample runs have peaks, which are not large enough to overcome the solvent
gradient baseline. This adjustment would simply affect the structure and its consequent detection
and not the concentration of the sample injected into the HPLC. In future studies, more research
can be collected on how to derivatize FFA molecules.
With the growing global health concern of obesity, research such as this is necessary to
understand its possible foundations. Research into the underlying chemical aspects of the obesity
27
epidemic could provide a clue into the mechanism of the digestion and the existence of a
preference for fatty foods. This research thesis is the first step in the right direction. Now that the
method is reliably consistent, more samples can be run and future considerations deliberated. If
sample results can be detected well and conclusions can be made, our knowledge of obesity can
be expounded upon and efficient solutions can be offered.
28
REFERENCES
1. "Obesity." Health Topics. World Health Organization, 1 Jan. 2015. Web. 27 Apr. 2015. <http://www.who.int/topics/obesity/en/>.
2. "Overweight and Obesity Statistics." National Institute of Diabetes and Digestive and Kidney Diseases, 1 Oct. 2012. Web. 27 Apr. 2015. <http://www.niddk.nih.gov/health-information/health-statistics/Pages/overweight-obesity-statistics.aspx>.
3. Kawai, T. and Fushiki T., Importance of Lipolysis in Oral Cavity for Orosensory Detection of Fat, Am. J. Physiol. Regul. Integr. Comp. Physiol, 285:R447-R454 (2003).
4. McCormack, D.N., Clyburn, V.L., and Pittman, D.W., Detection of free fatty acids following a conditioned taste aversion in rats, Physiol. & Behav., 87: 582-594 (2006).
5. Kulkarni, B., and Mattes, R., Evidence for Presence of Nonesterified Fatty Acids as Potential Gustatory Signaling Molecules in Humans, Chem. Senses, 38:119-27 (2012).
6. Heftmann, E., Chapter 2: History of chromatography and electrophoresis, J. Chrom. Lib., 22: A19-A26 (1983).
7. Alternate Selectivity in HPLC 1: Intro to Stationary Phases. Perf. Richard Henry. Sigma-Aldrich Co., LLC, n.d. Web.
8. Skoog, D., Holler, F.J., and Nieman, T. Principles of Instrumental Analysis. 5th ed. Philadelphia: Saunders College Publishing, 1998. Print.
9. Bidlingmeyer, B.A., and Schmitz, S., The analysis of artificial sweeteners and additives in beverages by HPLC: An undergraduate experiment, J. Chem. Educ., 68: A195-A200 (1991).
10. Eqbal, M.A., Halimah Abdullah Sani, A. A., and Mohd Kasim, Z., Fatty Acids Composition of Four Different Vegetable Oils (Red Palm Olein, Palm Olein, corn Oil and Coconut Oil) by Gas Chromatography, IPCBEE, 14: 31-34 (2011).
11. Harris, Daniel. "High-Performance Liquid Chromatography." Quantitative Chemical Analysis. 7th ed. New York: W.H. Freeman, 2007. 556-582. Print.
12. Aveldano, M.I., VanRollins, M., and Horrocks, L.A. "Separation and quantitation of free fatty acids and fatty acid methyl esters by reverse phase high pressure liquid chromatography, J. of Lipid Res., 24: 83-93 (1983).
13. Mailer, R.J., Rapid evaluation of olive oil quality by NIR reflectance spectroscopy, Journ. of the Amer. Oil Chem. Soc., 81: 823-827 (2004).


![Inhibition of peptide aggregation by means of enzymatic ... · peptides [47]. Enzymatic phosphorylation To investigate the influence of enzymatic phosphorylation on the aggregation](https://img.pdfslide.us/doc/110x75/5f0b59c57e708231d43015a6/inhibition-of-peptide-aggregation-by-means-of-enzymatic-peptides-47-enzymatic.jpg)