Embed Size (px)
Citation preview
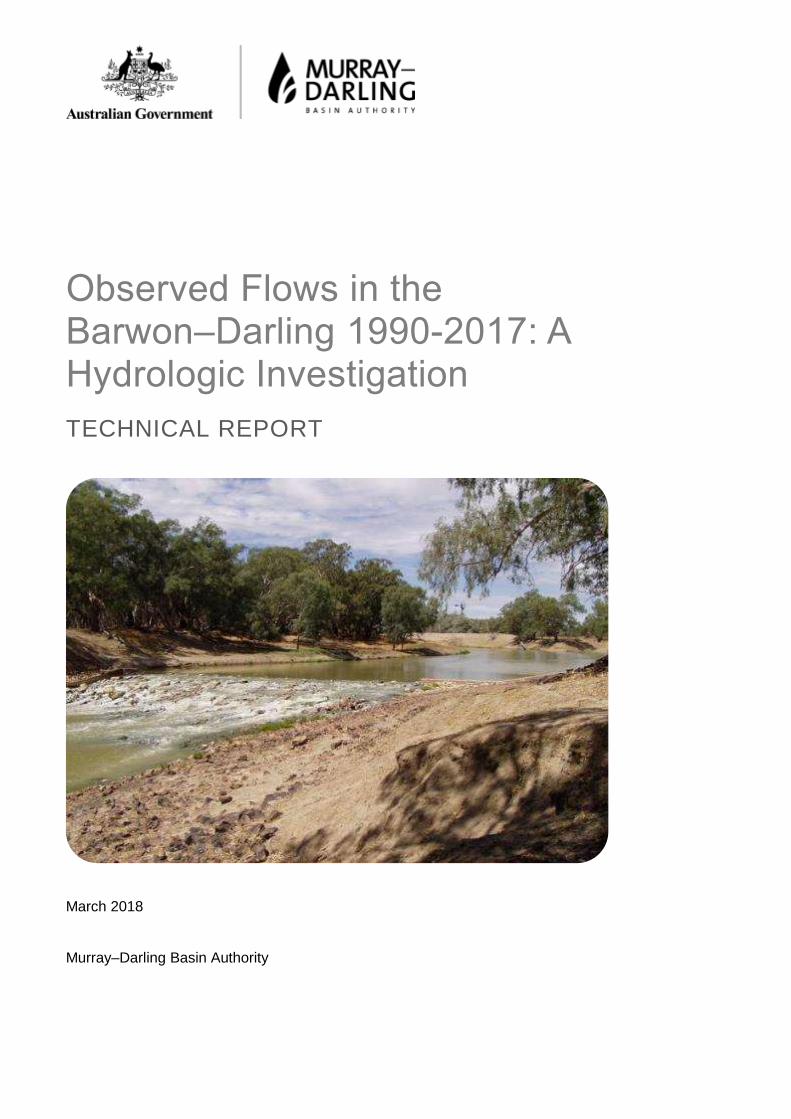
Observed Flows in the Barwon–Darling 1990-2017: A Hydrologic Investigation
TECHNICAL REPORT
March 2018
Murray–Darling Basin Authority
Published by the Murray–Darling Basin Authority
© Murray–Darling Basin Authority 2017
With the exception of the Commonwealth Coat of Arms,
the MDBA logo, trademarks and any exempt
photographs and graphics (these are identified), this
publication is provided under a Creative Commons
Attribution 4.0 licence.
https://creativecommons.org/licenses/by/4.0
The Murray‒Darling Basin Authority’s preference is that you attribute this publication (and any Murray‒
Darling Basin Authority material sourced from it) using the following wording within your work:
Title: Observed Flows in the Barwon–Darling 1990-2017, A Hydrologic Investigation - list
of references and source material
Source: Licensed from the Murray‒Darling Basin Authority under a Creative Commons Attribution
4.0 Licence
Accessibility
The Murray‒Darling Basin Authority makes its documents and information available in accessible formats.
On some occasions the highly technical nature of the document means that we cannot make some
sections fully accessible. If you encounter accessibility problems or the document is in a format that you
cannot access, please contact us.
Acknowledgement of the Traditional Owners of the Murray–Darling Basin
The Murray–Darling Basin Authority acknowledges and pays respect to the Traditional Owners, and their
Nations, of the Murray–Darling Basin, who have a deep cultural, social, environmental, spiritual and
economic connection to their lands and waters. The MDBA understands the need for recognition of
Traditional Owner knowledge and cultural values in natural resource management associated with the Basin.
The approach of Traditional Owners to caring for the natural landscape, including water, can be expressed
in the words of the Northern Basin Aboriginal Nations Board:
…As the First Nations peoples (Traditional Owners) we are the knowledge holders, connected to
Country and with the cultural authority to share our knowledge. We offer perspectives to balance
and challenge other voices and viewpoints. We aspire to owning and managing water to protect
our totemic obligations, to carry out our way of life, and to teach our younger generations to
maintain our connections and heritage through our law and customs. When Country is happy, our
spirits are happy.
Cover image: Small in-channel fresh at Louth Weir on 17 March 2006
GPO Box 1801, Canberra ACT 2601
02 6279 0100
mdba.gov.au
Contents Executive Summary ..................................................................................................................... 2
Introduction .................................................................................................................................. 5
Understanding the Gauged Data (1990 – 2017) ........................................................................... 6
Gauged Data versus Hydrologic Modelling for the Barwon–Darling .......................................... 6
Data Availability and Sources ................................................................................................... 7
Determining the "Best Available" data....................................................................................... 7
Understanding the Hydrology ..................................................................................................... 10
Annual Flow Volumes and Climate ......................................................................................... 10
Identifying Individual Flow Events ........................................................................................... 11
Matching of Flow Events - Attenuation and Outliers ................................................................ 12
Flow Event Analysis by Reach ................................................................................................... 13
Mungindi to Collarenebri ......................................................................................................... 14
Collarenebri to Walgett ........................................................................................................... 15
Walgett to Brewarrina ............................................................................................................. 17
Extension to 1980 ............................................................................................................... 19
Brewarrina to Bourke .............................................................................................................. 20
Bourke to Wilcannia ................................................................................................................ 21
Dry Spells - Periods of Low or No Flow ...................................................................................... 23
Conclusions ............................................................................................................................... 27
References ................................................................................................................................. 29
Appendix A – Timeline of Major Barwon–Darling Water Management Development .................. 30
Appendix B – Hydrographs of Anomalous Flow Events – six 100% loss events in the Walgett to
Brewarrina Reach ...................................................................................................................... 31
Appendix C - Catalogue of Gauged Flow Events 1990 - 2017 .................................................... 33
Appendix D - Matched Flow Events per River Reach ............................................................... 116
Mungindi to Collarenebri ....................................................................................................... 116
Collarenebri to Walgett ......................................................................................................... 128
Walgett to Brewarrina ........................................................................................................... 136
Brewarrina to Bourke ............................................................................................................ 141
Bourke to Wilcannia .............................................................................................................. 146
Appendix E – Analysis of the Walgett to Brewarrina Reach Extension to 1980 ........................ 149
Catalogue of Gauged Flow Events 1980 – 1989 ................................................................... 149
Matched Flow Events ........................................................................................................... 156
Observed Flows in the Barwon–Darling 1990-2017: A Hydrologic Investigation
Page 2
Executive Summary
In November 2016 the MDBA released the findings from the Northern Basin Review,
recommending a reduction in the total volume of water to be recovered for the environment
across the Northern Basin. As a result of the Northern Basin Review’s extensive research and
community consultation, the MDBA recommended that the 390 GL recovery volume set in 2012
be reduced to 320 GL, contingent upon commitments from governments to implement a range of
‘toolkit measures’.
The purpose of the toolkit measures is to improve water management practices. The Authority
believes that implementing these measures will provide improved environmental outcomes and
lessen the social and economic impacts compared with the original 390 GL Basin Plan recovery
settings.
One of these measures specifies the need for the protection of smaller but ecologically significant
flows across the Northern Basin. Smaller flows are critical for both communities and the
environment, particularly in dry-times. The Authority believes that the protection of the most
ecologically significant small flows is critical to achieve the desired outcomes of the Basin Plan,
particularly in the Barwon-Darling. This sentiment was reiterated by stakeholders from their lived
experience of living and working on the river. Protecting environmental water and restoring
ecologically important small flows was also identified as a policy priority to be addressed by
Basin governments by the recent MDBA Compliance review and Ken Matthews Review
(Matthews, 2017) commissioned by the NSW government.
This report forms an important component of the next step, helping understand the observed flow
behaviour of the Barwon-Darling to better characterise the requirements for sustainable small
flows. This forms one line of evidence which feeds into ongoing work by NSW and the
Commonwealth on the protection of environmental flows.
This report presents a hydrologic analysis of observed low flow and small fresh events at major
gauges in the Barwon–Darling river system from 1990–2017 using publicly-available observed
gauge data (NSW DPI). The aim of this analysis was to detect any observable change in the
historical characteristics of this part of the flow regime.
For the purpose of this analysis, ‘low flow and small fresh events’ have been defined to be those
less than 2,000 ML/d, which carry ecological significance as described in previous studies
(Thoms et al. 1996, MDBA 2011 and NSW DPI 2015). A separate report (MDBA 2018) outlines
the ecological significance of these flows.
The results presented here suggest a change to the hydrologic behaviour of the Barwon–Darling
has occurred since the turn of the Millennium (particularly in the mid-sections of the system)
reflected in the characteristics of both individual low and fresh flow events, and in the dry spells
between events.
Some individual flow events in the post-2000 period were seen to be very heavily attenuated in
both the Collarenebri-to-Walgett and (particularly) the Walgett-to-Brewarrina reaches, contrary to
the established pre-2000 trend. Of these, a small number of individual flow events were
attenuated to zero after passing Walgett and Geera gauges and before reaching Brewarrina
gauge. That is, flow events recorded at Walgett (and Geera) at the upstream end or mid sections
Observed Flows in the Barwon–Darling 1990-2017: A Hydrologic Investigation
Page 3
of a river reach were found to have disappeared completely with no corresponding flow recorded
50 km downstream at Brewarrina.
Additionally, periods of low or no flow were found to have increased significantly in length for
gauges downstream of Bourke post 2000 when compared to pre 2000, which includes a climate
signal originating from the Millennium Drought. When studying dry spells for particular reaches
however, it was found that dry spells since the Millennium Drought were as long as during the
drought itself for the mid-sections of the Barwon–Darling, again particularly in the Walgett to
Brewarrina section. Furthermore, additional work by Sheldon (2017) has shown a break in the
correlation between Barwon–Darling flows and the Southern Oscillation Index (SOI) from 2001
onwards, again indicating that climate is not the only driver of the observed change in
hydrological behaviour. Any marked reduction in low-to-fresh flow event frequency has significant
social, cultural, economic and environmental impacts on the river system, especially at the most
downstream locations.
It is important to note that the movement of flows along a river system can be attributed to a
number of factors, both natural and development-related. Natural hydrological behaviour (such
as groundwater seepage, pool recharge, evapotranspiration) can vary greatly from event-to-
event in an ephemeral river such as the Barwon–Darling, hence it is possible that the change
observed in the early 2000s is naturally derived. It is also possible that changed extraction
behaviour in the tributaries has contributed to the observed trend.
But there are a number of compelling signs indicating that river extraction on the Barwon–Darling
is a significant contributor to the heavy attenuation of these events—they occurred only in
specific reaches (Collarenebri-to-Walgett and Walgett-to-Brewarrina), only in the post-2000
period, they often occurred in pairs, and often at similar times of the year (i.e. spring/summer).
Additional work is required to disentangle the relative contributions of both the natural and
development-related process to the observed change, which includes the need for additional
data such as water usage information, cropping patterns, on-farm business and infrastructure
changes, market information, development within Barwon-Darling tributaries, more detailed
climate information and geomorphological change. Also, satellite imagery could be used to check
if any visible cause of flow impact can be seen in the landscape. This work is beyond the scope
of this report. However, the analysis presented here indicates that it is likely that a significant
anthropogenic impact has occurred in the small and low-to-zero flow part of the Barwon–Darling
flow regime since the year 2000, which is difficult to fully attribute to climate.
The use of data analysis, such as that outlined in this report, for compliance related activities has
attracted considerable attention in recent times. Whilst not a principle focus of the report it is
noted that analysis of this nature can provide a very useful tool by providing a relatively rapid
assessment of flows as measured in near-real-time on the river, allowing regulators information
to rapidly assess risk and target traditional compliance activities. The analysis does not, however,
enable actual levels of water extraction to be measured.
Irrespective of the attribution of the attenuation of small and low flows in the system, assessment
of the ecological needs of the system (MDBA 2018) indicates that strengthened protection of
small and low flows will be required to maintain the ecological integrity of the system. Any policy
response will also require consideration of any impacts on water users. This report is focussed
on historical trends in hydrological patterns. It provides a compelling case and can inform the
Observed Flows in the Barwon–Darling 1990-2017: A Hydrologic Investigation
Page 4
NSW policy review process. It is one line of evidence to be considered by policy makers in
responding to the Northern Basin Review and subsequent calls for strengthened protection of
environmental water including small and low flows within the northern Basin.
Observed Flows in the Barwon–Darling 1990-2017: A Hydrologic Investigation
Page 5
Introduction
The Barwon–Darling River flows through north-western New South Wales, from upstream of
Mungindi on the New South Wales and Queensland border to the Murray-Darling junction near
Wentworth. The catchment is very dry and experiences an arid climate with highly variable flows
originating from a complex system of tributaries. Several towns such as Mungindi, Brewarrina,
Walgett, Bourke, Wilcannia and Menindee rely on the Barwon–Darling for town water supply.
Users utilise water for livestock grazing and irrigated agriculture, particularly cotton.
The Barwon–Darling is a naturally ephemeral river reflecting the highly variable hydrology that is
characteristic of Australian semi-arid rivers. During extreme dry periods, the river will cease to
flow and become a series of disconnected waterholes. These waterholes provide refuges for fish
and other water dependent aquatic biota. Refreshment flows which provide connectivity are
critical during dry periods to provide an adequate level and quality of water in the waterholes. The
waterholes also have significant social and cultural value.
The Barwon–Darling is an unregulated system, with users holding unregulated water licenses,
with sharing arrangements prescribed in the Water Sharing Plan (WSP) for the Barwon–Darling
Unregulated and Alluvial Water Sources which commenced on 4 October 2012. The WSP
comprises rules for managing extraction from Mungindi to upstream of Lake Wetherell. This
includes specifying commence-to-pump thresholds for four classes of licenses, namely A, B and
C, and Stock & Domestic. The New South Wales Government is currently in the process of
developing a Water Resource Plan for the Barwon–Darling system which, under the Basin Plan,
must be accredited by mid-2019. A timeline of major water management development for the
Barwon–Darling is presented in Appendix A.
A number of concerns have been raised by stakeholders and the media surrounding existing
water management arrangements in the Barwon–Darling river system, including specific
allegations of non-compliance with the rules of the WSP and an overall lack of compliance
regulation by the NSW Government (Matthews, 2017; MDBA, 2017). Another major concern is a
lack of flow protection in the Barwon–Darling within current WSP rules. Statements have been
made that the current rules are resulting in entire flow events, including those which include a
portion of Commonwealth environmental water delivered from upstream tributaries, being taken
for productive use, with a subsequent negative impact on achieving Basin Plan outcomes, as well
as significant socio-economic impacts in downstream reaches of the river.
As part of the Northern Basin Review (MDBA, 2016a,b,c) the MDBA recommended a set of
‘toolkit measures’ to maximise the environmental benefits and minimise the economic impacts of
the Basin Plan. These measures encompass a broad range of actions, and are largely based on
local knowledge and perspectives provided by communities and members of the Northern Basin
Advisory Committee. One of these measures recommended improvements to state water
management arrangements to safeguard low flows across the Northern Basin, particularly in the
Condamine–Balonne and Barwon–Darling. This measure also recommended an event-based
management approach to improve the effectiveness of environmental water use.
These measures were agreed by the Commonwealth, NSW and Queensland governments, and
they are currently working through the implementation of these measures. The purpose of the
work described in this report is to analyse the observed hydrology of low flow and small fresh
Observed Flows in the Barwon–Darling 1990-2017: A Hydrologic Investigation
Page 6
events in the Barwon–Darling from 1990-2017 and to gain an understanding of the behaviour of
these individual flows as they passed through the system.
‘Low flow and small fresh events’ for this purpose are defined from an ecological perspective,
comprising flow events of less than 2,000 ML/d. This threshold has been applied to the analysis,
and is significantly higher than flow rates associated with A-class commence to pump thresholds
and stock and domestic thresholds throughout the system.
This work will become part of the information base to assist efforts to improve water management
in the system for all users, including the environment. Through the analysis, this investigation
aimed to answer the following questions:
How have low flow and small fresh events typically behaved as they passed through the
system?
a. Is there any evidence of a typical behaviour? If so, when does it occur and in
which part of the system?
What are the trends in the length and frequency of dry spells spatially and temporally?
a. Do dry spells behave differently in recent times when compared to more historical
behaviour?
The focus is on low and small fresh flows, which, as previously described are defined as flows
less than 2,000 ML/d as measured at major gauges along the length of the river. Barwon–Darling
A-class licence holders can access flows of typically a few hundred ML/d (depending on their
location), with B and C-class licences activating progressively for increasing flow rates up to
12,000 ML/d, depending on location. Therefore low flows and small freshes are highly
susceptible to impacts through extraction.
Understanding the Gauged Data (1990 – 2017)
Gauged Data versus Hydrologic Modelling for the Barwon–Darling
Although susceptible to errors of measurement, observed gauged data provide the best available
representation of actual individual flow event-by-event behaviour and on-ground hydrological
change as it has occurred historically. Observed data also typically reflects the lived experience
of local stakeholders who are dependent on the river, and reflects any on-ground decisions that
have affected flow behaviour in the landscape.
Hydrologic modelling provides one mechanism to test flow behaviour over the long-term with
assumed management practices and behaviours. As such modelling is good for assessing
different management options on overall flow behaviour but does not represent individual
decisions that can have a large impact on flows actually observed in the river. Models also do not
represent all parts of the flow regime equally well and are notoriously uncertain when dealing with
low flows or for event by event analysis, making them not fit for purpose for this work. Due to
these reasons it was decided hydrologic modelling would provide too much uncertainty to assist
with this analysis.
Observed Flows in the Barwon–Darling 1990-2017: A Hydrologic Investigation
Page 7
Data Availability and Sources
To analyse hydrologic behaviour, a continuous historical record (hydrograph) of observed flow
data was required. The Barwon–Darling WSP specifies commence to pump thresholds at
15 gauges along the system. This analysis used a subset of these gauges, to split the river into a
series of reaches, using those gauges with complete data availability from 1990 and sufficient
spatial coverage from Mungindi to Wilcannia. Flow data is collected and owned by the New
South Wales Department of Primary Industries (NSW DPI) and is publically available on the
NSW RealTimeData website1. Data was downloaded for these gauges for 1/1/1990 to 30/6/2017
for the subset of gauges.
It can be common for hydrographs to contain gaps (no flow data available for a period of time). If
any gaps were present, additional data from the MDBA's internal Hydstra and Hydro databases
was used if it existed for those periods with gaps. The Hydstra database stores all telemetry,
operational and hydrographic data which is supplied to the MDBA by partner government
agencies (or their contractors), including NSW. Critical processes occur in Hydstra such as the
validation of telemetry data and the export of the operational and hydrographic data. The
operational and hydrographic data is exported to the MDBA's Hydro database and to the Bureau
of Meteorology and published on the MDBA's website as Live River Data.
Determining the "Best Available" data
Once the State, Hydstra and Hydro data sets were obtained, the gap-filling process (if required)
was performed automatically through in-house developed software. This software determines
where there were gaps or data of poor quality (using NSW-derived quality control flags assigned
to the data) and filled these gaps by replacing the poor-quality data with better quality data. This
resulted in a single time series for each of the 15 gauges.
It is still possible for gaps to exist in the data. Attenuation-derived flow estimates or modelled
data can be used to further fill gaps although this was not necessary for this investigation. Data
completeness was calculated for each of the gauges (the percentage of days in a year where
data is present) and it was found that a sufficient portion of the gauges had 100% completeness
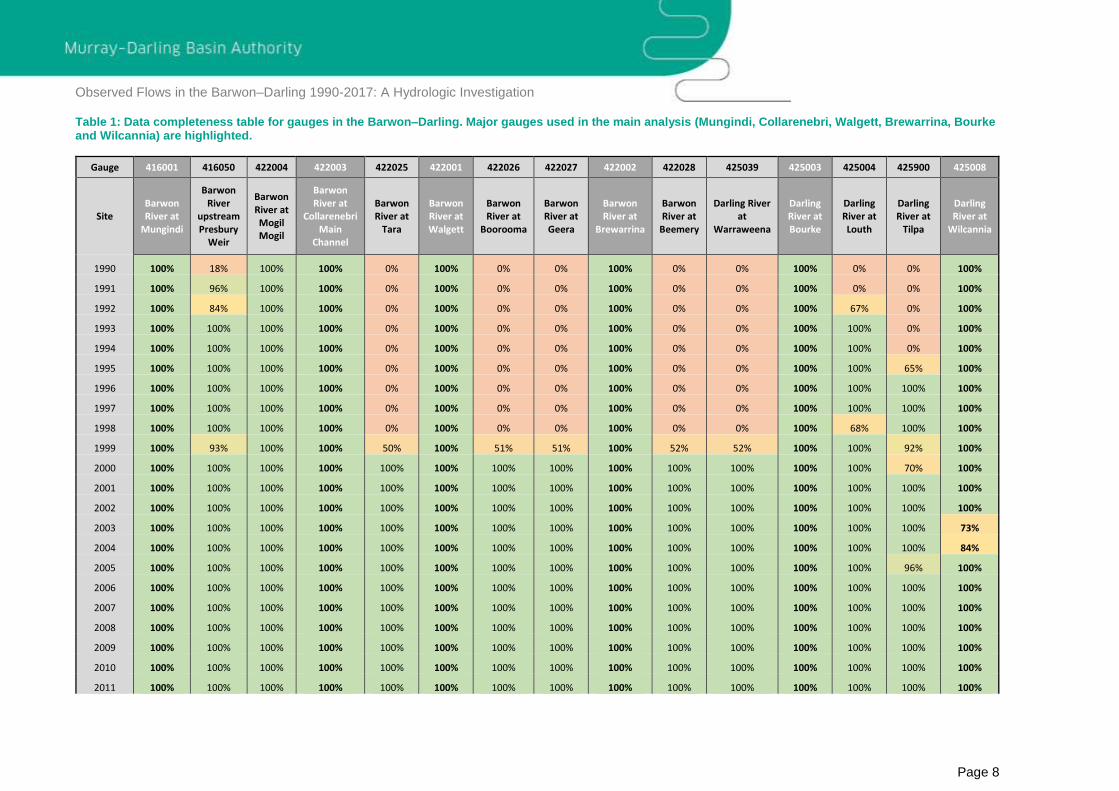
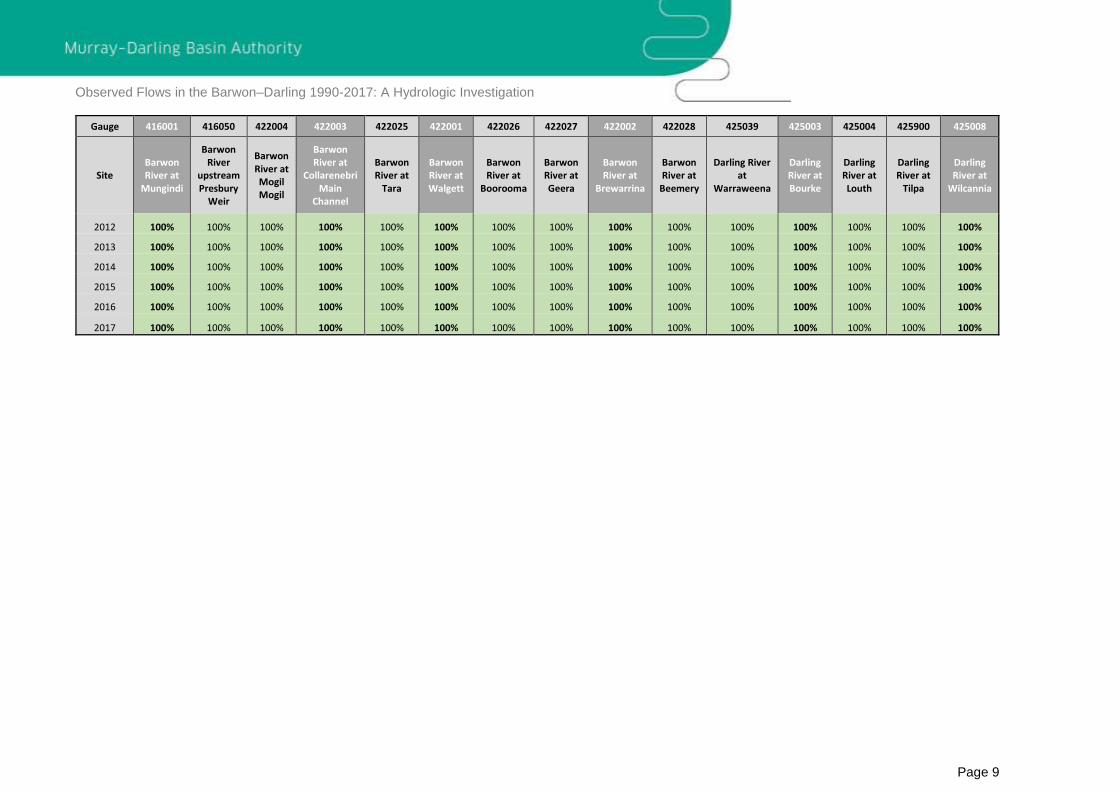
to perform a sound investigation. Table 1 shows the data completeness for each of the gauges
for each water year and Table 2 shows how much of the data originated where. Figure 1 shows
the location of these gauges in the system.
Table 1 shows that 100% data completeness was found between 1990 and 2017 for the major
reliable gauges at Mungindi, Collarenebri, Walgett, Brewarrina and Bourke. The reaches studied
in this investigation are hence between these gauges. A fifth reach, between Bourke and
Wilcannia was also included as that location has a near-complete set of data (between 1990 and
2017 it is 98% complete) and it was important to include this downstream reach to reveal any
wider spatial trends. As can be seen in Figure 1, this set of gauges provides near-whole-of-length
coverage of the Barwon–Darling system, albeit with hundreds of kilometres between gauges.
1 'Real Time Data - Rivers And Streams' NSW DPI,
http://realtimedata.water.nsw.gov.au/water.stm?ppbm=SURFACE_WATER&rs&3&rskm_url
Observed Flows in the Barwon–Darling 1990-2017: A Hydrologic Investigation
Page 8
Table 1: Data completeness table for gauges in the Barwon–Darling. Major gauges used in the main analysis (Mungindi, Collarenebri, Walgett, Brewarrina, Bourke and Wilcannia) are highlighted.
Gauge 416001 416050 422004 422003 422025 422001 422026 422027 422002 422028 425039 425003 425004 425900 425008
Site Barwon River at
Mungindi
Barwon River
upstream Presbury
Weir
Barwon River at Mogil Mogil
Barwon River at
Collarenebri Main
Channel
Barwon River at
Tara
Barwon River at Walgett
Barwon River at
Boorooma
Barwon River at Geera
Barwon River at
Brewarrina
Barwon River at
Beemery
Darling River at
Warraweena
Darling River at Bourke
Darling River at Louth
Darling River at
Tilpa
Darling River at
Wilcannia
1990 100% 18% 100% 100% 0% 100% 0% 0% 100% 0% 0% 100% 0% 0% 100%
1991 100% 96% 100% 100% 0% 100% 0% 0% 100% 0% 0% 100% 0% 0% 100%
1992 100% 84% 100% 100% 0% 100% 0% 0% 100% 0% 0% 100% 67% 0% 100%
1993 100% 100% 100% 100% 0% 100% 0% 0% 100% 0% 0% 100% 100% 0% 100%
1994 100% 100% 100% 100% 0% 100% 0% 0% 100% 0% 0% 100% 100% 0% 100%
1995 100% 100% 100% 100% 0% 100% 0% 0% 100% 0% 0% 100% 100% 65% 100%
1996 100% 100% 100% 100% 0% 100% 0% 0% 100% 0% 0% 100% 100% 100% 100%
1997 100% 100% 100% 100% 0% 100% 0% 0% 100% 0% 0% 100% 100% 100% 100%
1998 100% 100% 100% 100% 0% 100% 0% 0% 100% 0% 0% 100% 68% 100% 100%
1999 100% 93% 100% 100% 50% 100% 51% 51% 100% 52% 52% 100% 100% 92% 100%
2000 100% 100% 100% 100% 100% 100% 100% 100% 100% 100% 100% 100% 100% 70% 100%
2001 100% 100% 100% 100% 100% 100% 100% 100% 100% 100% 100% 100% 100% 100% 100%
2002 100% 100% 100% 100% 100% 100% 100% 100% 100% 100% 100% 100% 100% 100% 100%
2003 100% 100% 100% 100% 100% 100% 100% 100% 100% 100% 100% 100% 100% 100% 73%
2004 100% 100% 100% 100% 100% 100% 100% 100% 100% 100% 100% 100% 100% 100% 84%
2005 100% 100% 100% 100% 100% 100% 100% 100% 100% 100% 100% 100% 100% 96% 100%
2006 100% 100% 100% 100% 100% 100% 100% 100% 100% 100% 100% 100% 100% 100% 100%
2007 100% 100% 100% 100% 100% 100% 100% 100% 100% 100% 100% 100% 100% 100% 100%
2008 100% 100% 100% 100% 100% 100% 100% 100% 100% 100% 100% 100% 100% 100% 100%
2009 100% 100% 100% 100% 100% 100% 100% 100% 100% 100% 100% 100% 100% 100% 100%
2010 100% 100% 100% 100% 100% 100% 100% 100% 100% 100% 100% 100% 100% 100% 100%
2011 100% 100% 100% 100% 100% 100% 100% 100% 100% 100% 100% 100% 100% 100% 100%
Observed Flows in the Barwon–Darling 1990-2017: A Hydrologic Investigation
Page 9
Gauge 416001 416050 422004 422003 422025 422001 422026 422027 422002 422028 425039 425003 425004 425900 425008
Site Barwon River at
Mungindi
Barwon River
upstream Presbury
Weir
Barwon River at Mogil Mogil
Barwon River at
Collarenebri Main
Channel
Barwon River at
Tara
Barwon River at Walgett
Barwon River at
Boorooma
Barwon River at Geera
Barwon River at
Brewarrina
Barwon River at
Beemery
Darling River at
Warraweena
Darling River at Bourke
Darling River at Louth
Darling River at
Tilpa
Darling River at
Wilcannia
2012 100% 100% 100% 100% 100% 100% 100% 100% 100% 100% 100% 100% 100% 100% 100%
2013 100% 100% 100% 100% 100% 100% 100% 100% 100% 100% 100% 100% 100% 100% 100%
2014 100% 100% 100% 100% 100% 100% 100% 100% 100% 100% 100% 100% 100% 100% 100%
2015 100% 100% 100% 100% 100% 100% 100% 100% 100% 100% 100% 100% 100% 100% 100%
2016 100% 100% 100% 100% 100% 100% 100% 100% 100% 100% 100% 100% 100% 100% 100%
2017 100% 100% 100% 100% 100% 100% 100% 100% 100% 100% 100% 100% 100% 100% 100%
Observed Flows in the Barwon–Darling 1990-2017: A Hydrologic Investigation
Page 10
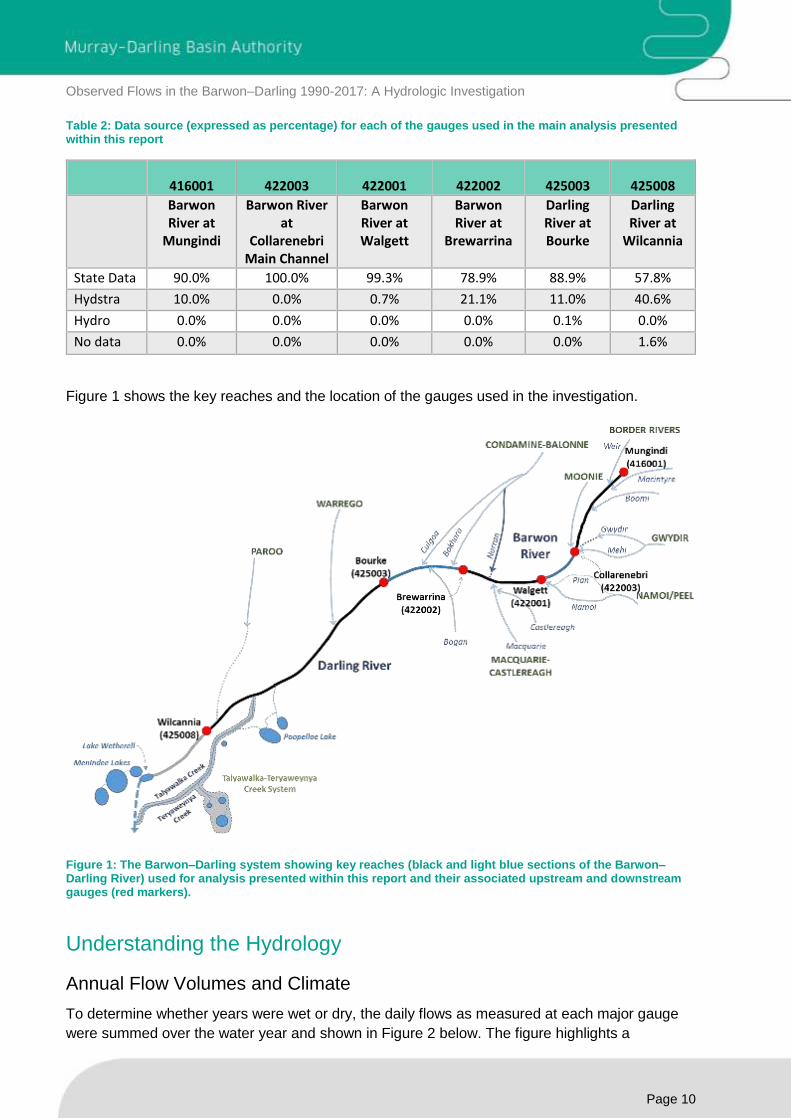
Table 2: Data source (expressed as percentage) for each of the gauges used in the main analysis presented within this report
416001 422003 422001 422002 425003 425008 Barwon River at
Mungindi
Barwon River at
Collarenebri Main Channel
Barwon River at Walgett
Barwon River at
Brewarrina
Darling River at Bourke
Darling River at
Wilcannia
State Data 90.0% 100.0% 99.3% 78.9% 88.9% 57.8%
Hydstra 10.0% 0.0% 0.7% 21.1% 11.0% 40.6%
Hydro 0.0% 0.0% 0.0% 0.0% 0.1% 0.0%
No data 0.0% 0.0% 0.0% 0.0% 0.0% 1.6%
Figure 1 shows the key reaches and the location of the gauges used in the investigation.
Figure 1: The Barwon–Darling system showing key reaches (black and light blue sections of the Barwon–Darling River) used for analysis presented within this report and their associated upstream and downstream gauges (red markers).
Understanding the Hydrology
Annual Flow Volumes and Climate
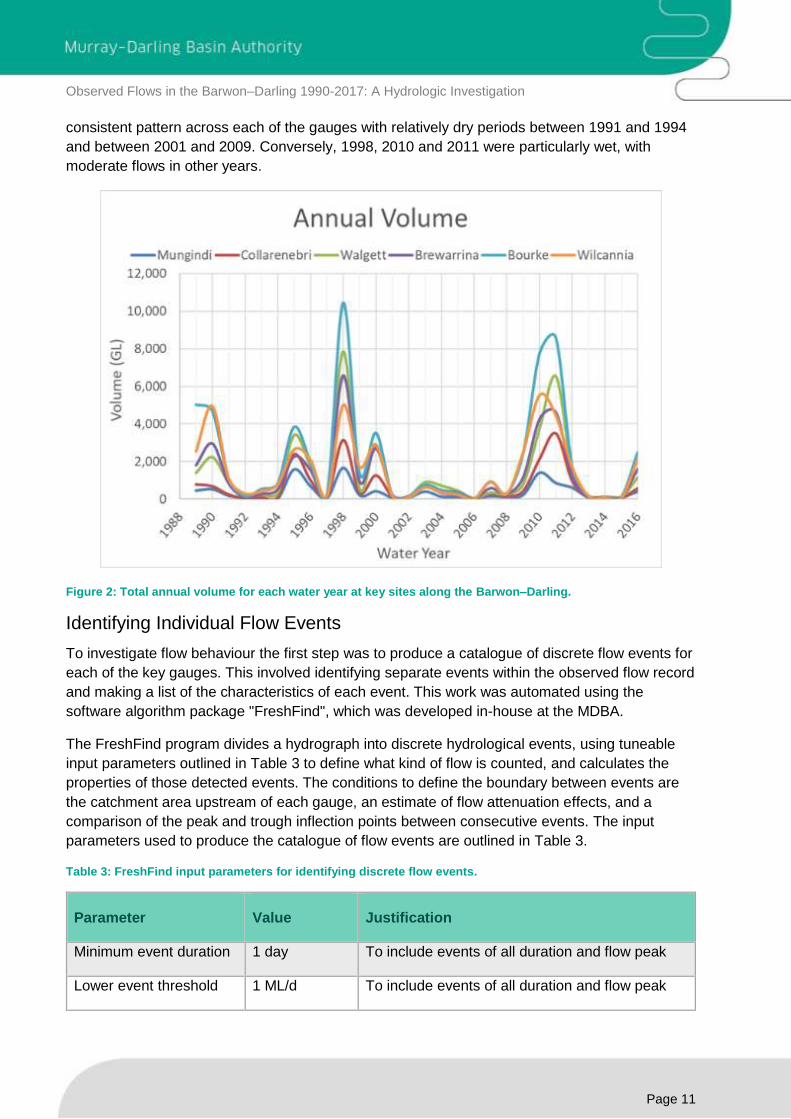
To determine whether years were wet or dry, the daily flows as measured at each major gauge
were summed over the water year and shown in Figure 2 below. The figure highlights a
Observed Flows in the Barwon–Darling 1990-2017: A Hydrologic Investigation
Page 11
consistent pattern across each of the gauges with relatively dry periods between 1991 and 1994
and between 2001 and 2009. Conversely, 1998, 2010 and 2011 were particularly wet, with
moderate flows in other years.
Figure 2: Total annual volume for each water year at key sites along the Barwon–Darling.
Identifying Individual Flow Events
To investigate flow behaviour the first step was to produce a catalogue of discrete flow events for
each of the key gauges. This involved identifying separate events within the observed flow record
and making a list of the characteristics of each event. This work was automated using the
software algorithm package "FreshFind", which was developed in-house at the MDBA.
The FreshFind program divides a hydrograph into discrete hydrological events, using tuneable
input parameters outlined in Table 3 to define what kind of flow is counted, and calculates the
properties of those detected events. The conditions to define the boundary between events are
the catchment area upstream of each gauge, an estimate of flow attenuation effects, and a
comparison of the peak and trough inflection points between consecutive events. The input
parameters used to produce the catalogue of flow events are outlined in Table 3.
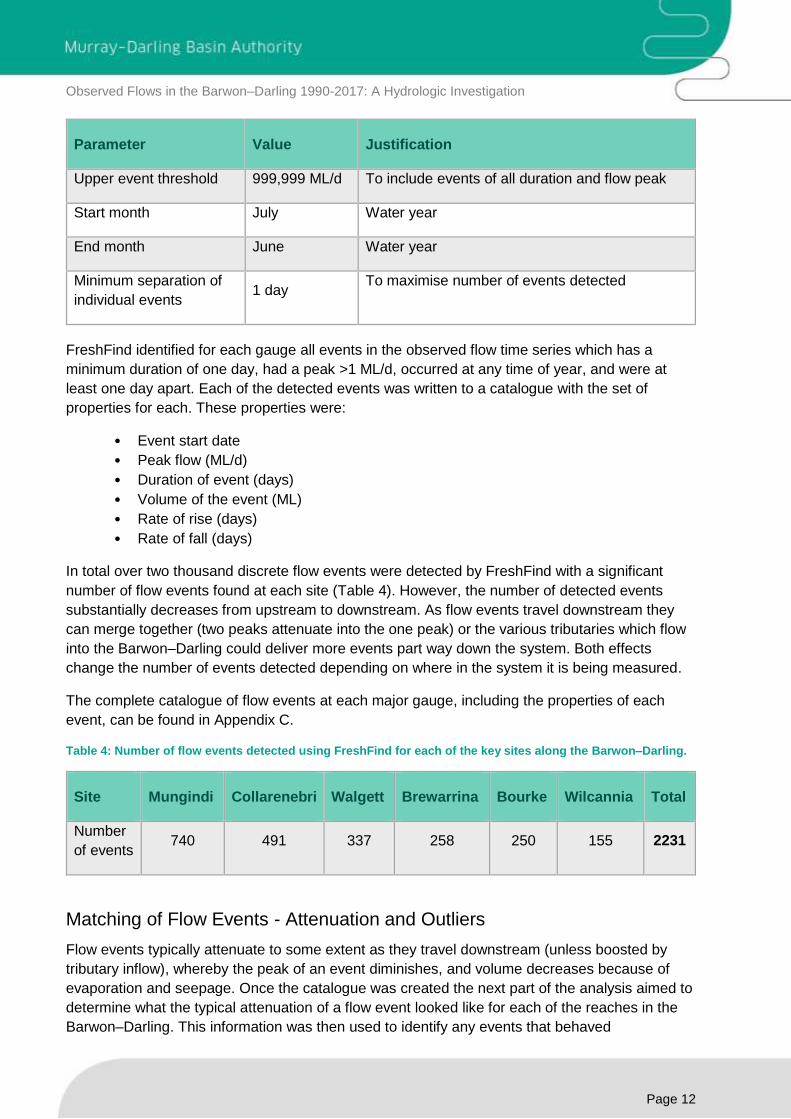
Table 3: FreshFind input parameters for identifying discrete flow events.
Parameter Value Justification
Minimum event duration 1 day To include events of all duration and flow peak
Lower event threshold 1 ML/d To include events of all duration and flow peak
Observed Flows in the Barwon–Darling 1990-2017: A Hydrologic Investigation
Page 12
Parameter Value Justification
Upper event threshold 999,999 ML/d To include events of all duration and flow peak
Start month July Water year
End month June Water year
Minimum separation of
individual events 1 day
To maximise number of events detected
FreshFind identified for each gauge all events in the observed flow time series which has a
minimum duration of one day, had a peak >1 ML/d, occurred at any time of year, and were at
least one day apart. Each of the detected events was written to a catalogue with the set of
properties for each. These properties were:
• Event start date
• Peak flow (ML/d)
• Duration of event (days)
• Volume of the event (ML)
• Rate of rise (days)
• Rate of fall (days)
In total over two thousand discrete flow events were detected by FreshFind with a significant
number of flow events found at each site (Table 4). However, the number of detected events
substantially decreases from upstream to downstream. As flow events travel downstream they
can merge together (two peaks attenuate into the one peak) or the various tributaries which flow
into the Barwon–Darling could deliver more events part way down the system. Both effects
change the number of events detected depending on where in the system it is being measured.
The complete catalogue of flow events at each major gauge, including the properties of each
event, can be found in Appendix C.
Table 4: Number of flow events detected using FreshFind for each of the key sites along the Barwon–Darling.
Site Mungindi Collarenebri Walgett Brewarrina Bourke Wilcannia Total
Number
of events 740 491 337 258 250 155 2231
Matching of Flow Events - Attenuation and Outliers
Flow events typically attenuate to some extent as they travel downstream (unless boosted by
tributary inflow), whereby the peak of an event diminishes, and volume decreases because of
evaporation and seepage. Once the catalogue was created the next part of the analysis aimed to
determine what the typical attenuation of a flow event looked like for each of the reaches in the
Barwon–Darling. This information was then used to identify any events that behaved
Observed Flows in the Barwon–Darling 1990-2017: A Hydrologic Investigation
Page 13
unexpectedly compared to the typical attenuation. Any unexpected differences indicates an
impact to that event which could be explained by either natural processes such as higher than
normal evaporation and seepage rates or indicate an anthropogenic impact through consumptive
users extraction.
A further MDBA software package "FlowMatch", was used to match flow events from one gauge
to the nearest downstream gauge. FlowMatch uses typical attenuation and travel time estimates
to match an event at the upstream gauge with the same event at the downstream gauge.
Matched flow events identified using FlowMatch were plotted and visually checked to see if the
matches were logical.
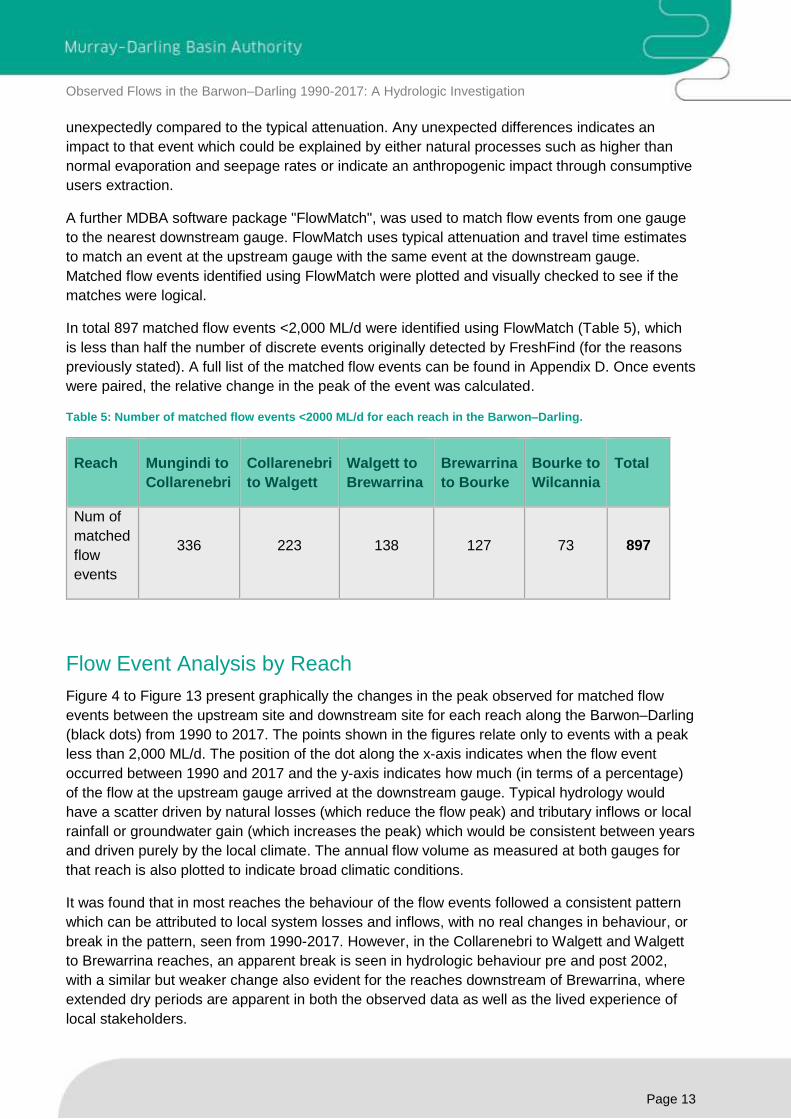
In total 897 matched flow events <2,000 ML/d were identified using FlowMatch (Table 5), which
is less than half the number of discrete events originally detected by FreshFind (for the reasons
previously stated). A full list of the matched flow events can be found in Appendix D. Once events
were paired, the relative change in the peak of the event was calculated.
Table 5: Number of matched flow events <2000 ML/d for each reach in the Barwon–Darling.
Reach Mungindi to
Collarenebri
Collarenebri
to Walgett
Walgett to
Brewarrina
Brewarrina
to Bourke
Bourke to
Wilcannia
Total
Num of
matched
flow
events
336 223 138 127 73 897
Flow Event Analysis by Reach
Figure 4 to Figure 13 present graphically the changes in the peak observed for matched flow
events between the upstream site and downstream site for each reach along the Barwon–Darling
(black dots) from 1990 to 2017. The points shown in the figures relate only to events with a peak
less than 2,000 ML/d. The position of the dot along the x-axis indicates when the flow event
occurred between 1990 and 2017 and the y-axis indicates how much (in terms of a percentage)
of the flow at the upstream gauge arrived at the downstream gauge. Typical hydrology would
have a scatter driven by natural losses (which reduce the flow peak) and tributary inflows or local
rainfall or groundwater gain (which increases the peak) which would be consistent between years
and driven purely by the local climate. The annual flow volume as measured at both gauges for
that reach is also plotted to indicate broad climatic conditions.
It was found that in most reaches the behaviour of the flow events followed a consistent pattern
which can be attributed to local system losses and inflows, with no real changes in behaviour, or
break in the pattern, seen from 1990-2017. However, in the Collarenebri to Walgett and Walgett
to Brewarrina reaches, an apparent break is seen in hydrologic behaviour pre and post 2002,
with a similar but weaker change also evident for the reaches downstream of Brewarrina, where
extended dry periods are apparent in both the observed data as well as the lived experience of
local stakeholders.
Observed Flows in the Barwon–Darling 1990-2017: A Hydrologic Investigation
Page 14
A total of thirteen flow events are very heavily attenuated in the Collarenebri to Walgett and
Walgett to Brewarrina reaches, some reduced to zero before reaching Brewarrina, with no direct
example observed pre 2002. These flow events are correlated in terms of time of the year and
often occur in pairs, and only occur in these two reaches of the system, despite local climate
conditions being experienced by all reaches of the river at those times. Although not impossible,
it is difficult to attribute the behaviour of these individual flow events purely to the local climate.
While climate does play a role in all hydrologic analysis, significant additional data is required to
accurately disentangle the degree to which climate is driving the results—a work program beyond
the scope of this report.
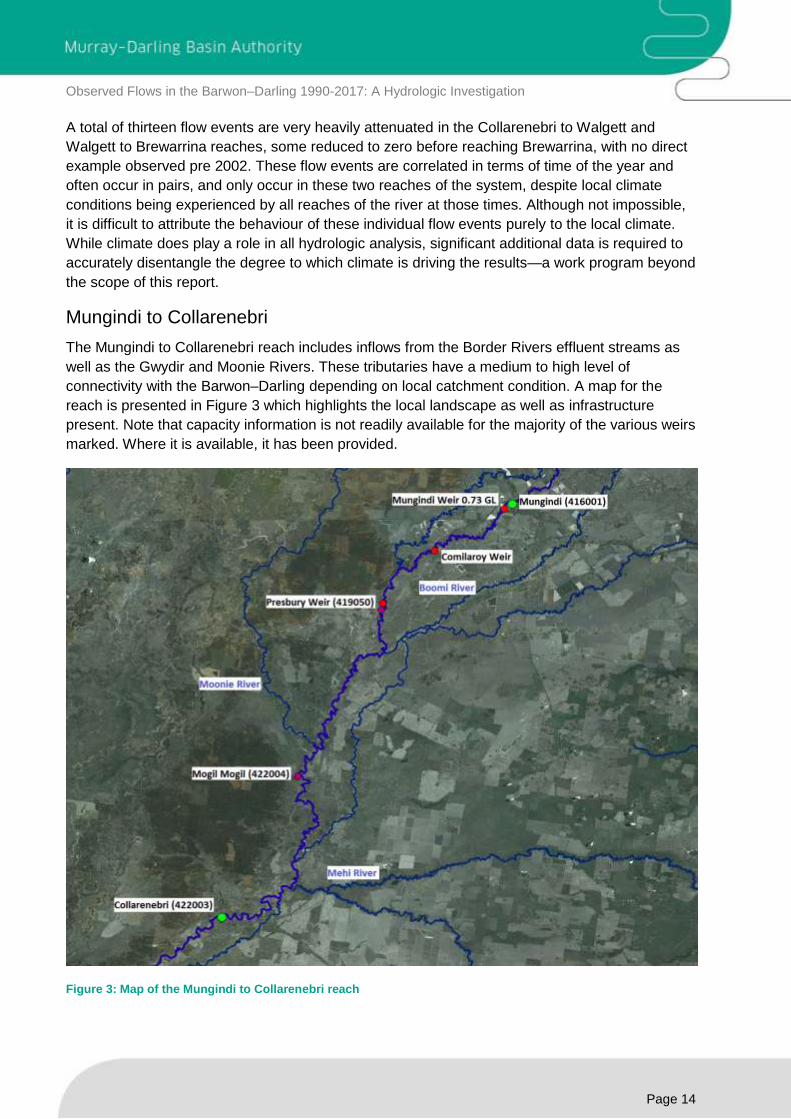
Mungindi to Collarenebri
The Mungindi to Collarenebri reach includes inflows from the Border Rivers effluent streams as
well as the Gwydir and Moonie Rivers. These tributaries have a medium to high level of
connectivity with the Barwon–Darling depending on local catchment condition. A map for the
reach is presented in Figure 3 which highlights the local landscape as well as infrastructure
present. Note that capacity information is not readily available for the majority of the various weirs
marked. Where it is available, it has been provided.
Figure 3: Map of the Mungindi to Collarenebri reach
Observed Flows in the Barwon–Darling 1990-2017: A Hydrologic Investigation
Page 15
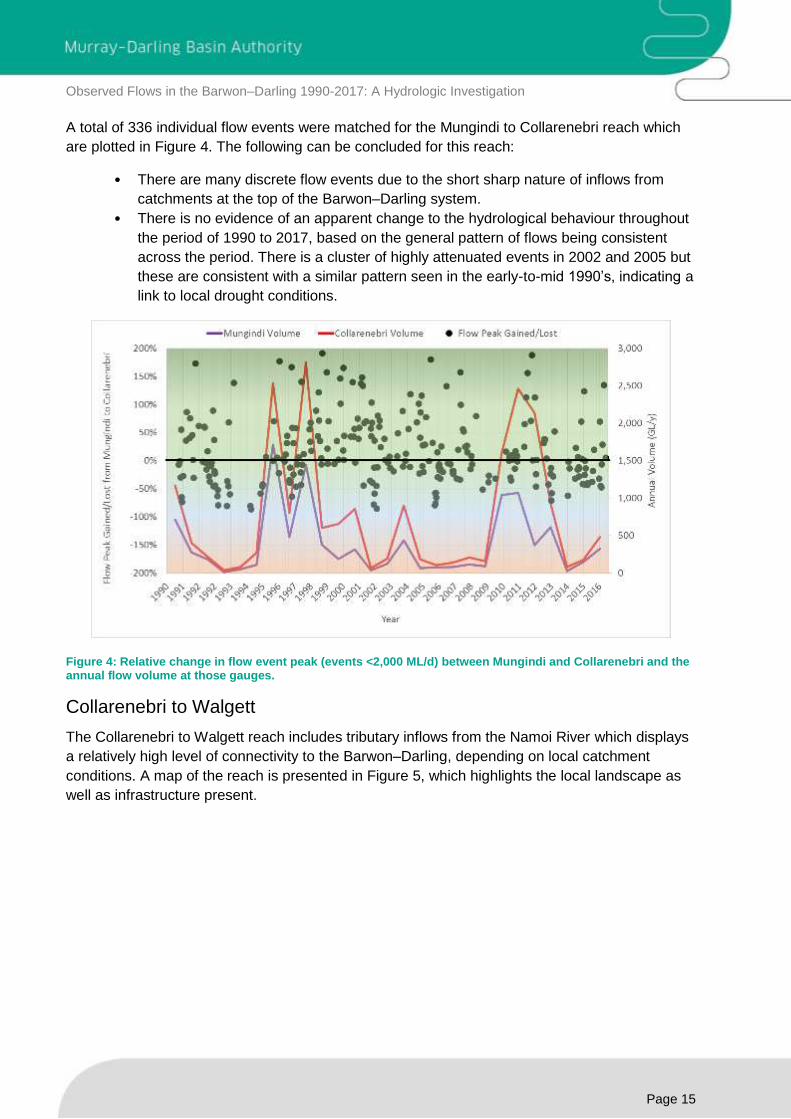
A total of 336 individual flow events were matched for the Mungindi to Collarenebri reach which
are plotted in Figure 4. The following can be concluded for this reach:
• There are many discrete flow events due to the short sharp nature of inflows from
catchments at the top of the Barwon–Darling system.
• There is no evidence of an apparent change to the hydrological behaviour throughout
the period of 1990 to 2017, based on the general pattern of flows being consistent
across the period. There is a cluster of highly attenuated events in 2002 and 2005 but
these are consistent with a similar pattern seen in the early-to-mid 1990’s, indicating a
link to local drought conditions.
Figure 4: Relative change in flow event peak (events <2,000 ML/d) between Mungindi and Collarenebri and the annual flow volume at those gauges.
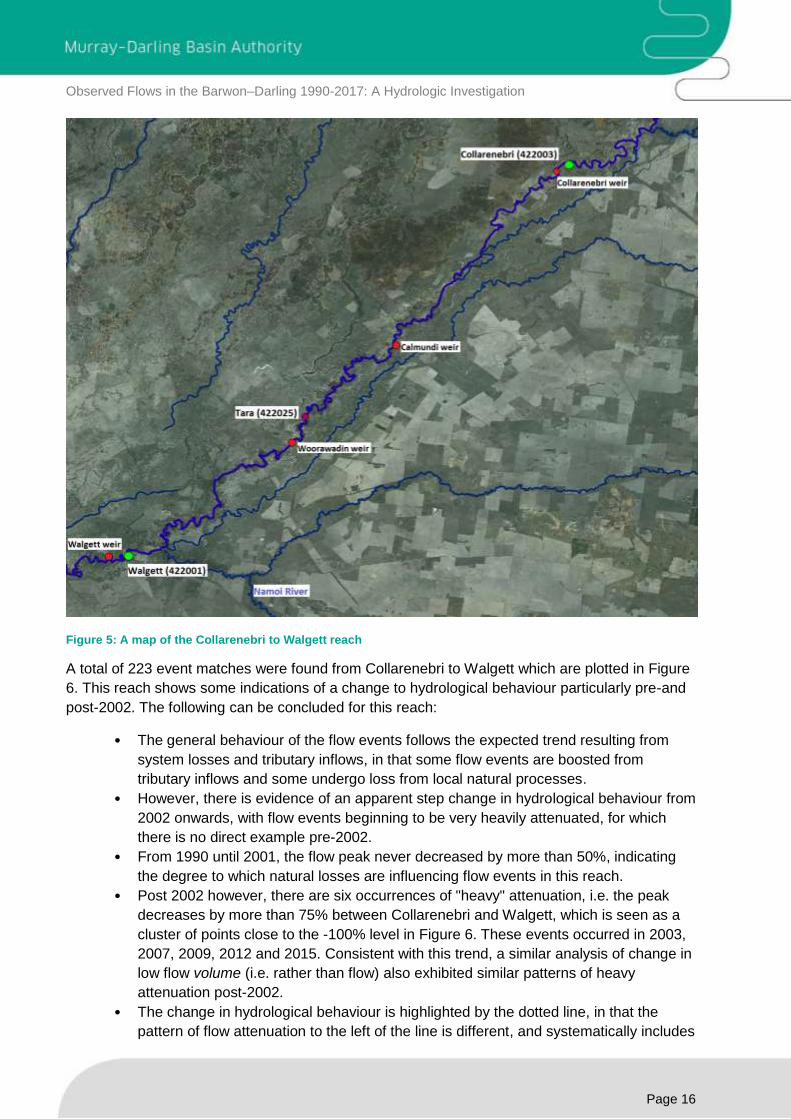
Collarenebri to Walgett
The Collarenebri to Walgett reach includes tributary inflows from the Namoi River which displays
a relatively high level of connectivity to the Barwon–Darling, depending on local catchment
conditions. A map of the reach is presented in Figure 5, which highlights the local landscape as
well as infrastructure present.
Observed Flows in the Barwon–Darling 1990-2017: A Hydrologic Investigation
Page 16
Figure 5: A map of the Collarenebri to Walgett reach
A total of 223 event matches were found from Collarenebri to Walgett which are plotted in Figure
6. This reach shows some indications of a change to hydrological behaviour particularly pre-and
post-2002. The following can be concluded for this reach:
• The general behaviour of the flow events follows the expected trend resulting from
system losses and tributary inflows, in that some flow events are boosted from
tributary inflows and some undergo loss from local natural processes.
• However, there is evidence of an apparent step change in hydrological behaviour from
2002 onwards, with flow events beginning to be very heavily attenuated, for which
there is no direct example pre-2002.
• From 1990 until 2001, the flow peak never decreased by more than 50%, indicating
the degree to which natural losses are influencing flow events in this reach.
• Post 2002 however, there are six occurrences of "heavy" attenuation, i.e. the peak
decreases by more than 75% between Collarenebri and Walgett, which is seen as a
cluster of points close to the -100% level in Figure 6. These events occurred in 2003,
2007, 2009, 2012 and 2015. Consistent with this trend, a similar analysis of change in
low flow volume (i.e. rather than flow) also exhibited similar patterns of heavy
attenuation post-2002.
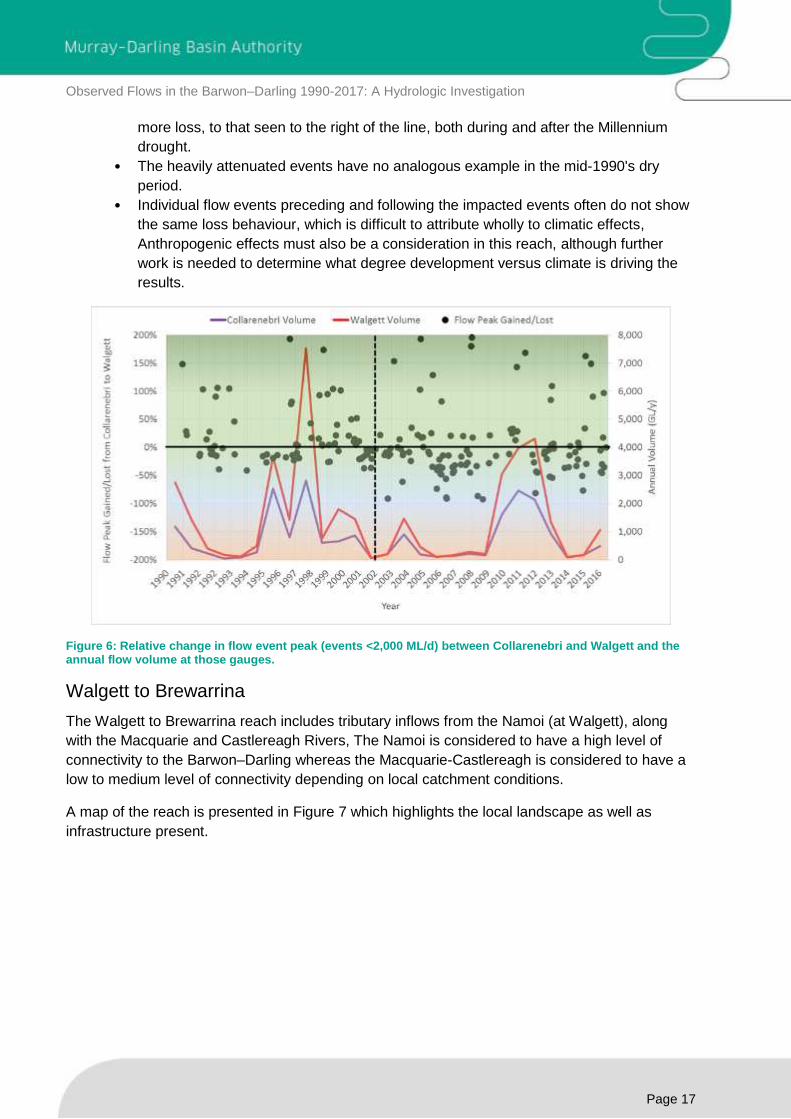
• The change in hydrological behaviour is highlighted by the dotted line, in that the
pattern of flow attenuation to the left of the line is different, and systematically includes
Observed Flows in the Barwon–Darling 1990-2017: A Hydrologic Investigation
Page 17
more loss, to that seen to the right of the line, both during and after the Millennium
drought.
• The heavily attenuated events have no analogous example in the mid-1990's dry
period.
• Individual flow events preceding and following the impacted events often do not show
the same loss behaviour, which is difficult to attribute wholly to climatic effects,
Anthropogenic effects must also be a consideration in this reach, although further
work is needed to determine what degree development versus climate is driving the
results.
Figure 6: Relative change in flow event peak (events <2,000 ML/d) between Collarenebri and Walgett and the annual flow volume at those gauges.
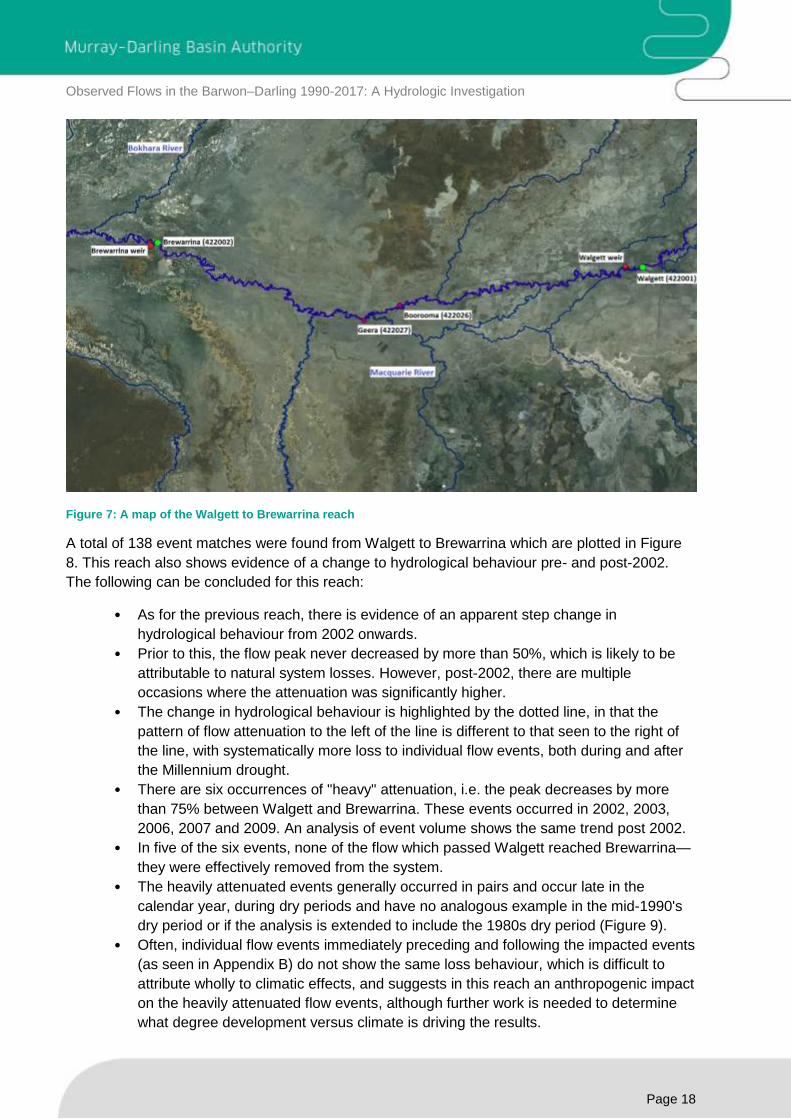
Walgett to Brewarrina
The Walgett to Brewarrina reach includes tributary inflows from the Namoi (at Walgett), along
with the Macquarie and Castlereagh Rivers, The Namoi is considered to have a high level of
connectivity to the Barwon–Darling whereas the Macquarie-Castlereagh is considered to have a
low to medium level of connectivity depending on local catchment conditions.
A map of the reach is presented in Figure 7 which highlights the local landscape as well as
infrastructure present.
Observed Flows in the Barwon–Darling 1990-2017: A Hydrologic Investigation
Page 18
Figure 7: A map of the Walgett to Brewarrina reach
A total of 138 event matches were found from Walgett to Brewarrina which are plotted in Figure
8. This reach also shows evidence of a change to hydrological behaviour pre- and post-2002.
The following can be concluded for this reach:
• As for the previous reach, there is evidence of an apparent step change in
hydrological behaviour from 2002 onwards.
• Prior to this, the flow peak never decreased by more than 50%, which is likely to be
attributable to natural system losses. However, post-2002, there are multiple
occasions where the attenuation was significantly higher.
• The change in hydrological behaviour is highlighted by the dotted line, in that the
pattern of flow attenuation to the left of the line is different to that seen to the right of
the line, with systematically more loss to individual flow events, both during and after
the Millennium drought.
• There are six occurrences of "heavy" attenuation, i.e. the peak decreases by more
than 75% between Walgett and Brewarrina. These events occurred in 2002, 2003,
2006, 2007 and 2009. An analysis of event volume shows the same trend post 2002.
• In five of the six events, none of the flow which passed Walgett reached Brewarrina—
they were effectively removed from the system.
• The heavily attenuated events generally occurred in pairs and occur late in the
calendar year, during dry periods and have no analogous example in the mid-1990's
dry period or if the analysis is extended to include the 1980s dry period (Figure 9).
• Often, individual flow events immediately preceding and following the impacted events
(as seen in Appendix B) do not show the same loss behaviour, which is difficult to
attribute wholly to climatic effects, and suggests in this reach an anthropogenic impact
on the heavily attenuated flow events, although further work is needed to determine
what degree development versus climate is driving the results.
Observed Flows in the Barwon–Darling 1990-2017: A Hydrologic Investigation
Page 19
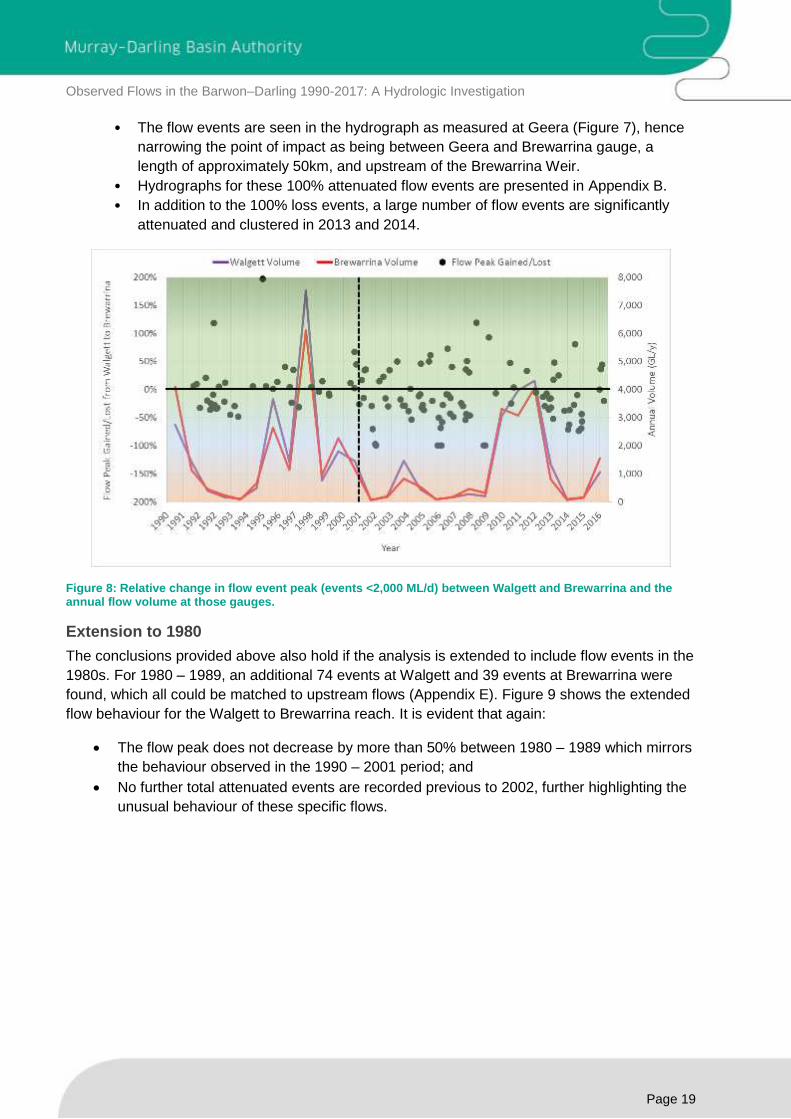
• The flow events are seen in the hydrograph as measured at Geera (Figure 7), hence
narrowing the point of impact as being between Geera and Brewarrina gauge, a
length of approximately 50km, and upstream of the Brewarrina Weir.
• Hydrographs for these 100% attenuated flow events are presented in Appendix B.
• In addition to the 100% loss events, a large number of flow events are significantly
attenuated and clustered in 2013 and 2014.
Figure 8: Relative change in flow event peak (events <2,000 ML/d) between Walgett and Brewarrina and the annual flow volume at those gauges.
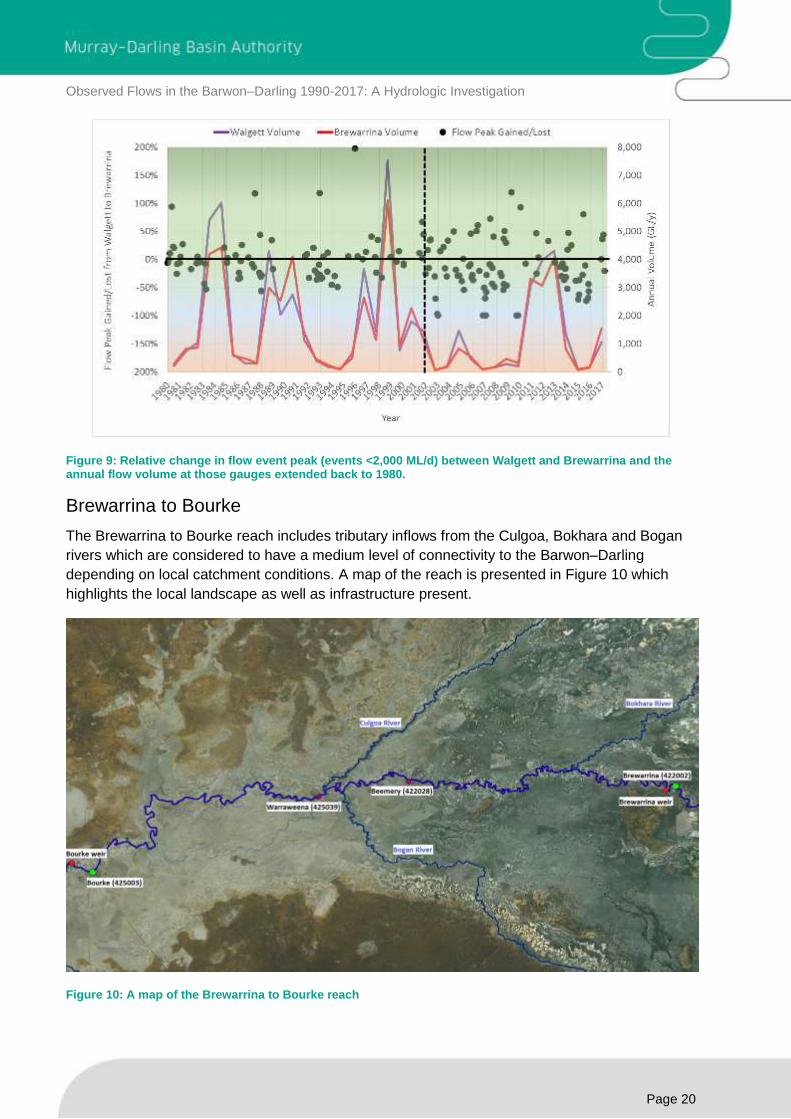
Extension to 1980
The conclusions provided above also hold if the analysis is extended to include flow events in the
1980s. For 1980 – 1989, an additional 74 events at Walgett and 39 events at Brewarrina were
found, which all could be matched to upstream flows (Appendix E). Figure 9 shows the extended
flow behaviour for the Walgett to Brewarrina reach. It is evident that again:
The flow peak does not decrease by more than 50% between 1980 – 1989 which mirrors
the behaviour observed in the 1990 – 2001 period; and
No further total attenuated events are recorded previous to 2002, further highlighting the
unusual behaviour of these specific flows.
Observed Flows in the Barwon–Darling 1990-2017: A Hydrologic Investigation
Page 20
Figure 9: Relative change in flow event peak (events <2,000 ML/d) between Walgett and Brewarrina and the annual flow volume at those gauges extended back to 1980.
Brewarrina to Bourke
The Brewarrina to Bourke reach includes tributary inflows from the Culgoa, Bokhara and Bogan
rivers which are considered to have a medium level of connectivity to the Barwon–Darling
depending on local catchment conditions. A map of the reach is presented in Figure 10 which
highlights the local landscape as well as infrastructure present.
Figure 10: A map of the Brewarrina to Bourke reach
Observed Flows in the Barwon–Darling 1990-2017: A Hydrologic Investigation
Page 21
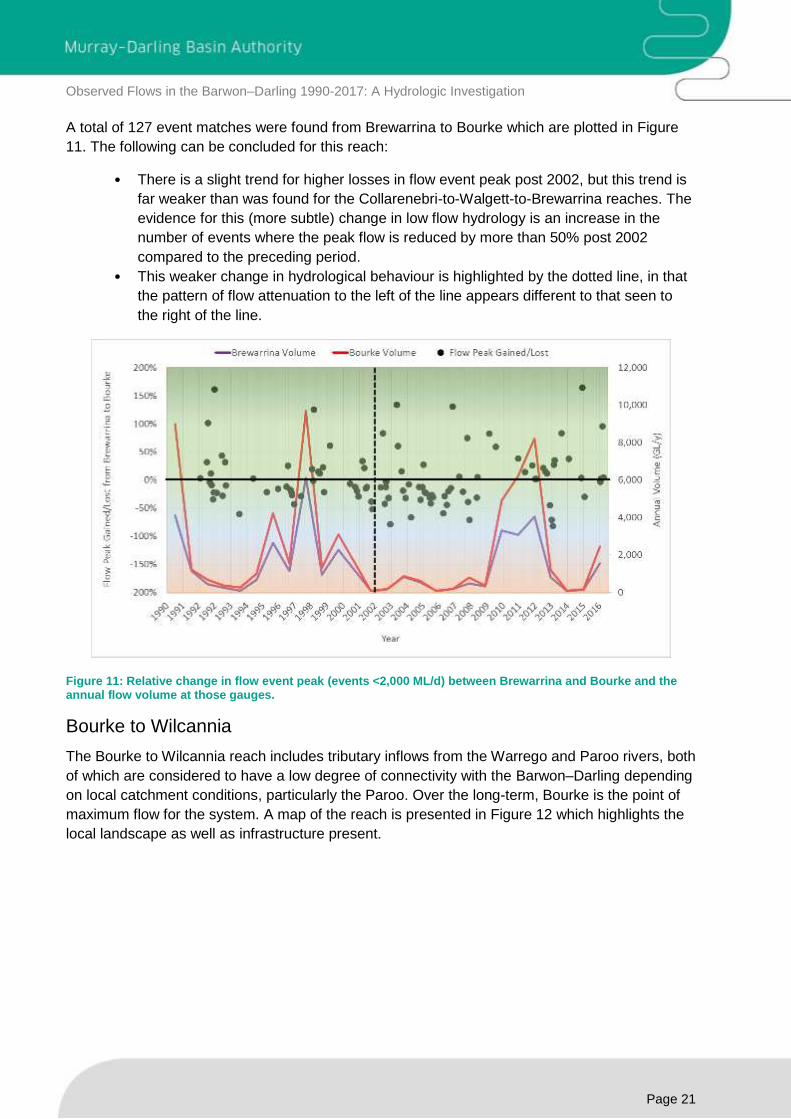
A total of 127 event matches were found from Brewarrina to Bourke which are plotted in Figure
11. The following can be concluded for this reach:
• There is a slight trend for higher losses in flow event peak post 2002, but this trend is
far weaker than was found for the Collarenebri-to-Walgett-to-Brewarrina reaches. The
evidence for this (more subtle) change in low flow hydrology is an increase in the
number of events where the peak flow is reduced by more than 50% post 2002
compared to the preceding period.
• This weaker change in hydrological behaviour is highlighted by the dotted line, in that
the pattern of flow attenuation to the left of the line appears different to that seen to
the right of the line.
Figure 11: Relative change in flow event peak (events <2,000 ML/d) between Brewarrina and Bourke and the annual flow volume at those gauges.
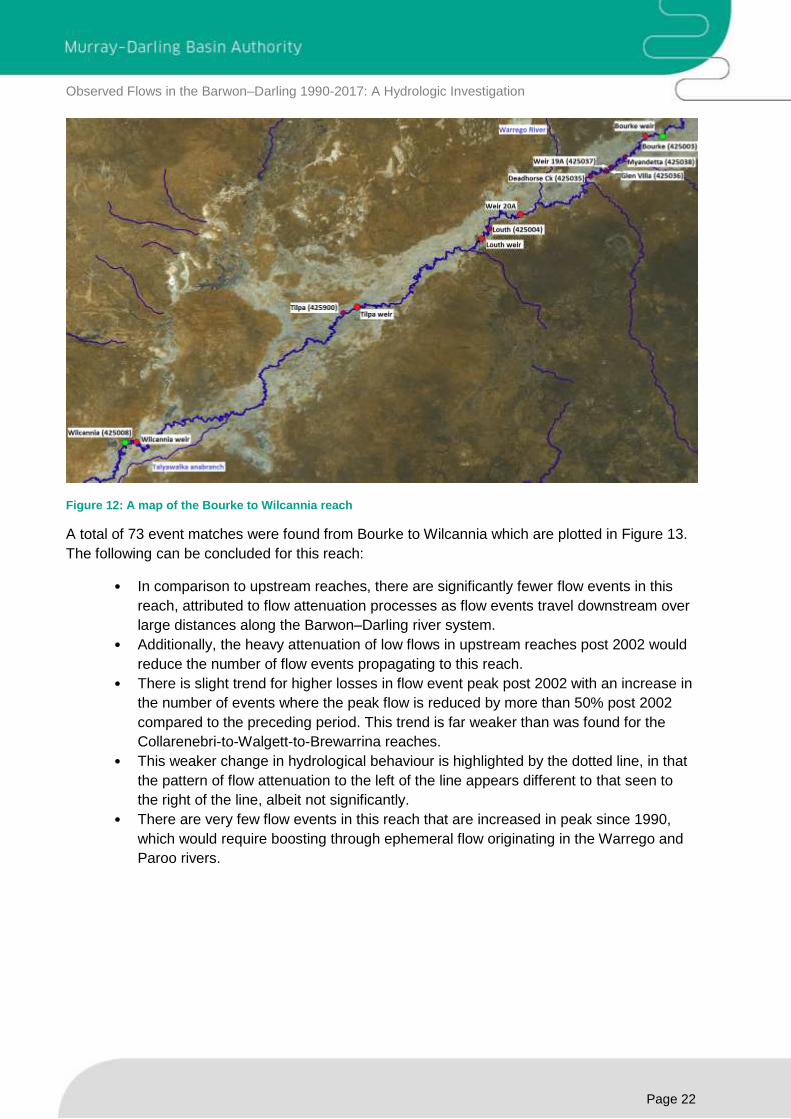
Bourke to Wilcannia
The Bourke to Wilcannia reach includes tributary inflows from the Warrego and Paroo rivers, both
of which are considered to have a low degree of connectivity with the Barwon–Darling depending
on local catchment conditions, particularly the Paroo. Over the long-term, Bourke is the point of
maximum flow for the system. A map of the reach is presented in Figure 12 which highlights the
local landscape as well as infrastructure present.
Observed Flows in the Barwon–Darling 1990-2017: A Hydrologic Investigation
Page 22
Figure 12: A map of the Bourke to Wilcannia reach
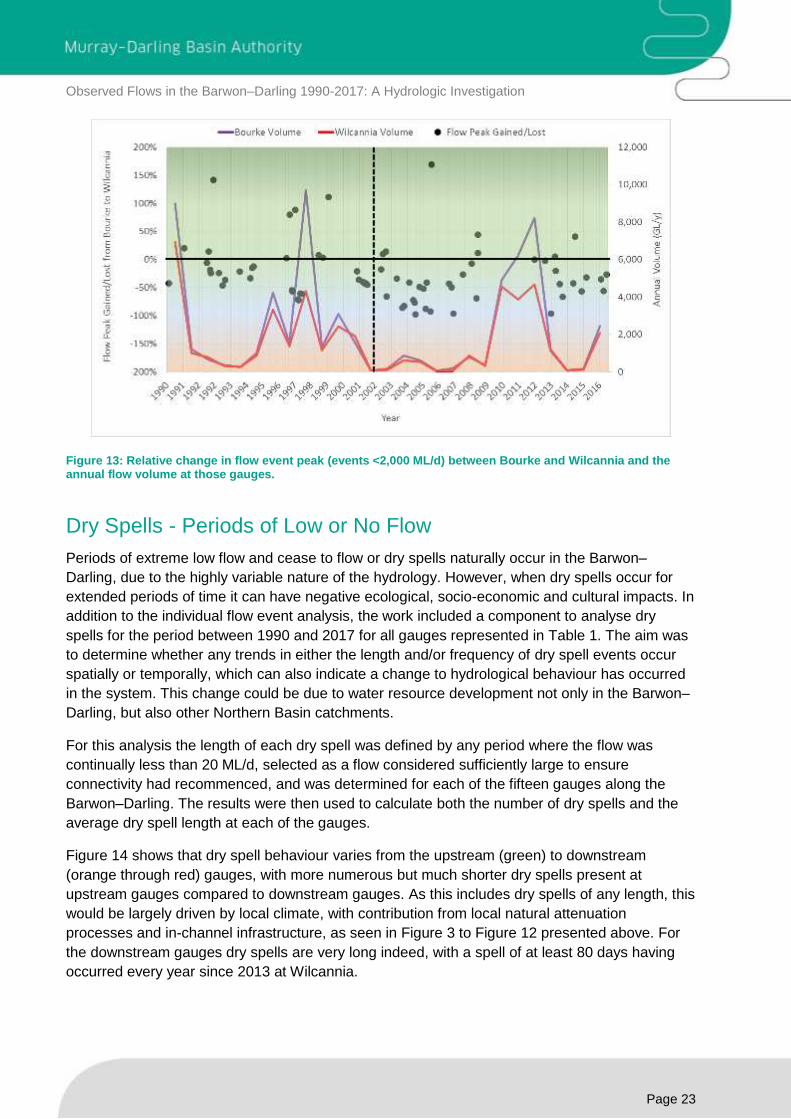
A total of 73 event matches were found from Bourke to Wilcannia which are plotted in Figure 13.
The following can be concluded for this reach:
• In comparison to upstream reaches, there are significantly fewer flow events in this
reach, attributed to flow attenuation processes as flow events travel downstream over
large distances along the Barwon–Darling river system.
• Additionally, the heavy attenuation of low flows in upstream reaches post 2002 would
reduce the number of flow events propagating to this reach.
• There is slight trend for higher losses in flow event peak post 2002 with an increase in
the number of events where the peak flow is reduced by more than 50% post 2002
compared to the preceding period. This trend is far weaker than was found for the
Collarenebri-to-Walgett-to-Brewarrina reaches.
• This weaker change in hydrological behaviour is highlighted by the dotted line, in that
the pattern of flow attenuation to the left of the line appears different to that seen to
the right of the line, albeit not significantly.
• There are very few flow events in this reach that are increased in peak since 1990,
which would require boosting through ephemeral flow originating in the Warrego and
Paroo rivers.
Observed Flows in the Barwon–Darling 1990-2017: A Hydrologic Investigation
Page 23
Figure 13: Relative change in flow event peak (events <2,000 ML/d) between Bourke and Wilcannia and the annual flow volume at those gauges.
Dry Spells - Periods of Low or No Flow
Periods of extreme low flow and cease to flow or dry spells naturally occur in the Barwon–
Darling, due to the highly variable nature of the hydrology. However, when dry spells occur for
extended periods of time it can have negative ecological, socio-economic and cultural impacts. In
addition to the individual flow event analysis, the work included a component to analyse dry
spells for the period between 1990 and 2017 for all gauges represented in Table 1. The aim was
to determine whether any trends in either the length and/or frequency of dry spell events occur
spatially or temporally, which can also indicate a change to hydrological behaviour has occurred
in the system. This change could be due to water resource development not only in the Barwon–
Darling, but also other Northern Basin catchments.
For this analysis the length of each dry spell was defined by any period where the flow was
continually less than 20 ML/d, selected as a flow considered sufficiently large to ensure
connectivity had recommenced, and was determined for each of the fifteen gauges along the
Barwon–Darling. The results were then used to calculate both the number of dry spells and the
average dry spell length at each of the gauges.
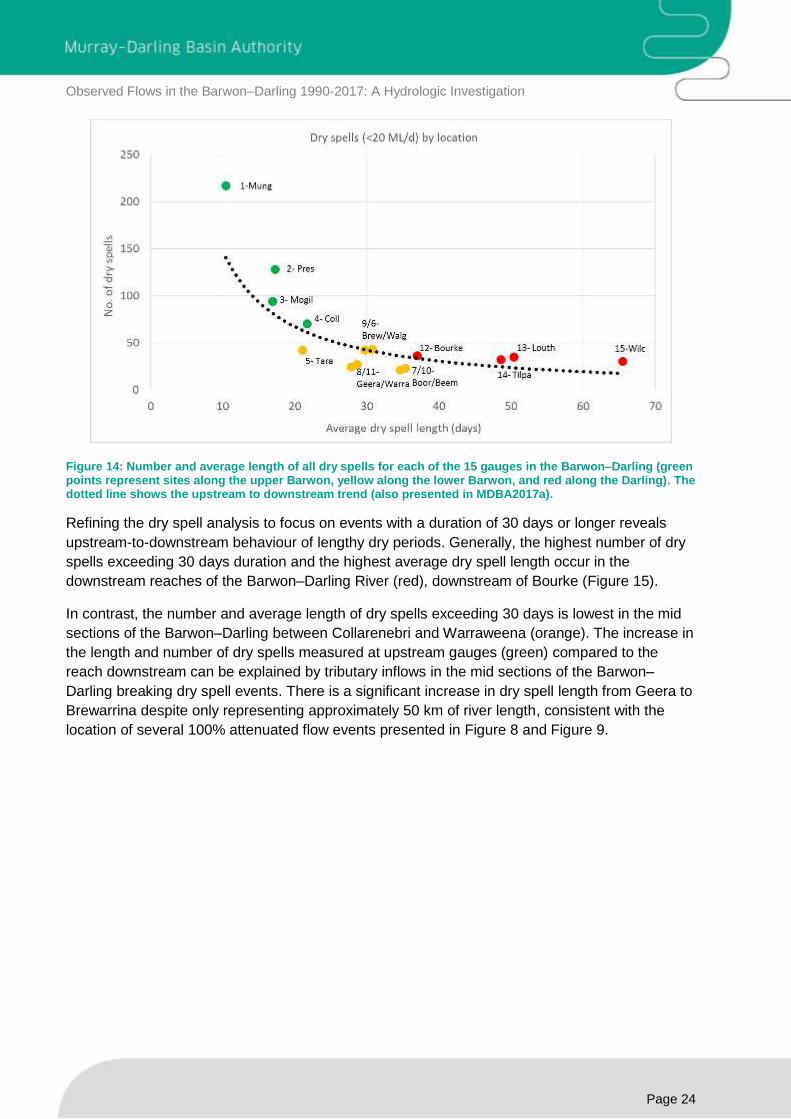
Figure 14 shows that dry spell behaviour varies from the upstream (green) to downstream
(orange through red) gauges, with more numerous but much shorter dry spells present at
upstream gauges compared to downstream gauges. As this includes dry spells of any length, this
would be largely driven by local climate, with contribution from local natural attenuation
processes and in-channel infrastructure, as seen in Figure 3 to Figure 12 presented above. For
the downstream gauges dry spells are very long indeed, with a spell of at least 80 days having
occurred every year since 2013 at Wilcannia.
Observed Flows in the Barwon–Darling 1990-2017: A Hydrologic Investigation
Page 24
Figure 14: Number and average length of all dry spells for each of the 15 gauges in the Barwon–Darling (green points represent sites along the upper Barwon, yellow along the lower Barwon, and red along the Darling). The dotted line shows the upstream to downstream trend (also presented in MDBA2017a).
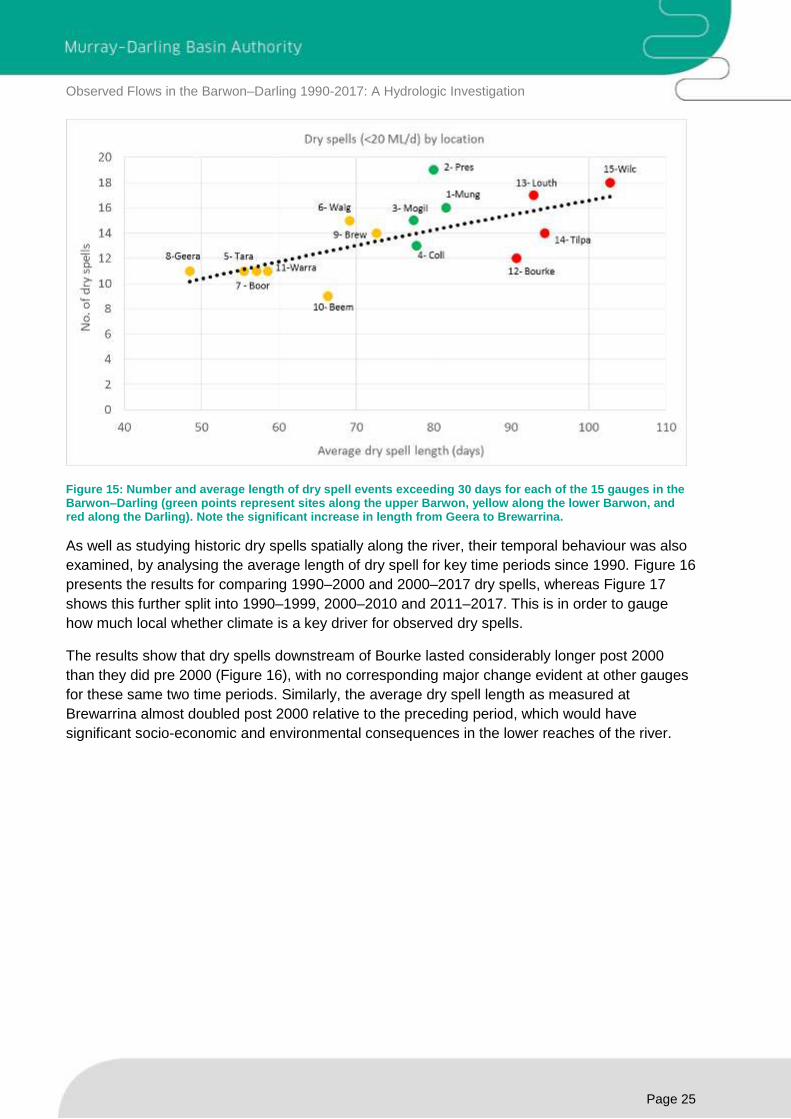
Refining the dry spell analysis to focus on events with a duration of 30 days or longer reveals
upstream-to-downstream behaviour of lengthy dry periods. Generally, the highest number of dry
spells exceeding 30 days duration and the highest average dry spell length occur in the
downstream reaches of the Barwon–Darling River (red), downstream of Bourke (Figure 15).
In contrast, the number and average length of dry spells exceeding 30 days is lowest in the mid
sections of the Barwon–Darling between Collarenebri and Warraweena (orange). The increase in
the length and number of dry spells measured at upstream gauges (green) compared to the
reach downstream can be explained by tributary inflows in the mid sections of the Barwon–
Darling breaking dry spell events. There is a significant increase in dry spell length from Geera to
Brewarrina despite only representing approximately 50 km of river length, consistent with the
location of several 100% attenuated flow events presented in Figure 8 and Figure 9.
Observed Flows in the Barwon–Darling 1990-2017: A Hydrologic Investigation
Page 25
Figure 15: Number and average length of dry spell events exceeding 30 days for each of the 15 gauges in the Barwon–Darling (green points represent sites along the upper Barwon, yellow along the lower Barwon, and red along the Darling). Note the significant increase in length from Geera to Brewarrina.
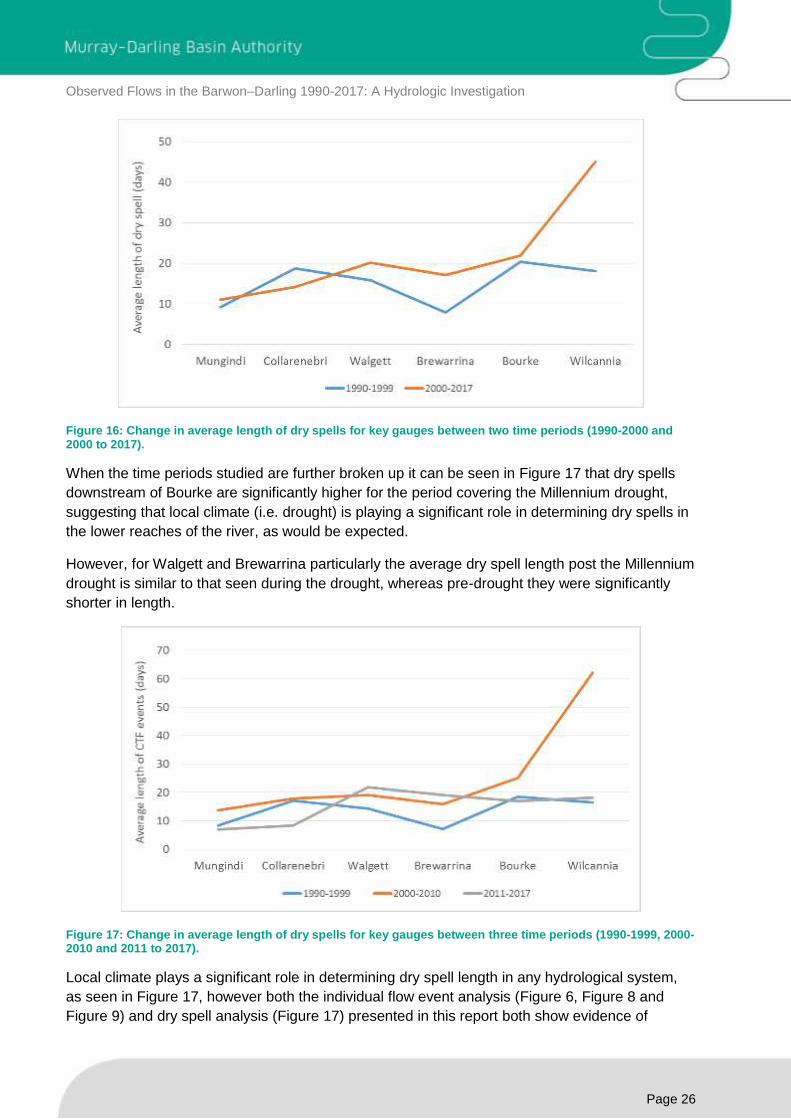
As well as studying historic dry spells spatially along the river, their temporal behaviour was also
examined, by analysing the average length of dry spell for key time periods since 1990. Figure 16
presents the results for comparing 1990–2000 and 2000–2017 dry spells, whereas Figure 17
shows this further split into 1990–1999, 2000–2010 and 2011–2017. This is in order to gauge
how much local whether climate is a key driver for observed dry spells.
The results show that dry spells downstream of Bourke lasted considerably longer post 2000
than they did pre 2000 (Figure 16), with no corresponding major change evident at other gauges
for these same two time periods. Similarly, the average dry spell length as measured at
Brewarrina almost doubled post 2000 relative to the preceding period, which would have
significant socio-economic and environmental consequences in the lower reaches of the river.
Observed Flows in the Barwon–Darling 1990-2017: A Hydrologic Investigation
Page 26
Figure 16: Change in average length of dry spells for key gauges between two time periods (1990-2000 and 2000 to 2017).
When the time periods studied are further broken up it can be seen in Figure 17 that dry spells
downstream of Bourke are significantly higher for the period covering the Millennium drought,
suggesting that local climate (i.e. drought) is playing a significant role in determining dry spells in
the lower reaches of the river, as would be expected.
However, for Walgett and Brewarrina particularly the average dry spell length post the Millennium
drought is similar to that seen during the drought, whereas pre-drought they were significantly
shorter in length.
Figure 17: Change in average length of dry spells for key gauges between three time periods (1990-1999, 2000-2010 and 2011 to 2017).
Local climate plays a significant role in determining dry spell length in any hydrological system,
as seen in Figure 17, however both the individual flow event analysis (Figure 6, Figure 8 and
Figure 9) and dry spell analysis (Figure 17) presented in this report both show evidence of
Observed Flows in the Barwon–Darling 1990-2017: A Hydrologic Investigation
Page 27
hydrological impact in the central regions of the Barwon–Darling, particularly between Walgett
and Brewarrina which is difficult to reconcile with impacts purely caused by climate.
Sheldon (2017) analysed dry spells using the same data as in this report and compared the
results with information from the Southern Oscillation Index (SOI), which is known to have a
strong correlation with Barwon–Darling flows. A divergence in the correlation was observed from
2001 -2017 when compared to historical trends which is attributed in that report to increased
extractions in the system.
Additional work in addition to that of Sheldon 2017 is required to help tease apart how much of a
role climate is playing on the results, on both local and more broad scales. Currently the
evidence is compelling that climate is not the only factor at work and that water resource
development must also play a critical role.
Conclusions
This report has presented the results of a detailed investigation into the historical behaviour of
observed low and small fresh (<2,000 ML/d) flow events in the Barwon–Darling river system from
1990-2017 using publicly available data. The analysis sought to assess changes in behaviour of
individual flow events and periods of no or low flow as measured along the river since 1990.
Analysis such as that presented here can provide a very useful tool in terms of compliance and
enforcement activities into the future by providing a relatively rapid assessment of flows as
measured in near-real-time on the river, allowing regulators information to rapidly assess risk and
any need for subsequent further investigation. However, it is important to understand that
analysis of this kind does not, in its own right, provide any direct evidence of extraction by
individual water users.
The work produced a comprehensive catalogue of individual flow events, more than 2000 in all,
which had their individual properties mapped. The results presented here suggest a change to
the hydrologic behaviour of the Barwon–Darling has occurred since the turn of the Millennium,
particularly in the mid-sections of the system. A number of individual flow events from the post-
2002 period were identified to have exhibited unusual gauge-to-gauge behaviour with large
amounts of loss and, in some cases, flow events have been removed from the system entirely.
Most of the heavily attenuated flow events share common attributes in that they occurred only
between Collarenebri and Walgett or Walgett/Geera and Brewarrina (a 50km reach from Geera
to Brewarrina), often occurred in pairs, only occurred since 2002, and often around the end of the
calendar year. While further work is needed to pinpoint the exact cause, the common
characteristics of these flow events suggests an element of anthropogenic impact most likely
through water resource development.
In addition to the event-by-event analysis, this work included an analysis of dry spells, calculating
the number and average length of periods of no-to-low-flow since 1990 both spatially and
temporally. The results have shown that downstream of Bourke dry spells since the year 2000
were significantly longer than pre 2000, which includes a signal originating from local climate,
particularly the Millennium Drought. When studying the drought period separately it was found
that dry spells in the Walgett to Brewarrina reach are similar since the Millennium Drought (2011-
2017) as they were during it (2000-2010), which is difficult to reconcile to climate alone. Sheldon
Observed Flows in the Barwon–Darling 1990-2017: A Hydrologic Investigation
Page 28
2017 has also shown a break in the correlation between Barwon–Darling flow and the Southern
Oscillation Index, since 2001.
This analysis is part of ongoing work to understand and characterise the hydrology of the
Barwon–Darling river system and ultimately use science and the best available information,
including the lived experience of local stakeholders, to help frame options for protecting low and
small fresh outcomes, in line with the conclusions of the Northern Basin Review and both the
MDBA and NSW compliance reviews.
Observed Flows in the Barwon–Darling 1990-2017: A Hydrologic Investigation
Page 29
References
Matthews (2017), Independent investigation into NSW water management and compliance –
Final Report, Advice on implementation, NSW Department of Industry.
MDBA (2011), The proposed ‘environmentally sustainable Level of take’ for surface water of the
Murray-Darling Basin: methods and outcomes, Murray-Darling Basin Authority, Canberra.
MDBA (2016a) The Northern Basin Review: Understanding the economic, social and
environmental outcomes from water recovery in the northern Basin, MDBA publication no: 39/16
MDBA (2016b), Hydrological Modelling for the Northern Basin Review, Murray-Darling Basin
Authority, Canberra.
MDBA (2016c), Northern Basin Review – Community consultation report, Murray-Darling Basin
Authority, Canberra.
MDBA (2018), Ecological needs of low flows in the Barwon–Darling, Murray-Darling Basin
Authority, Canberra.
MDBA (2017), The Murray-Darling Basin Water Compliance Review, Containing reports by the
Murray-Darling Basin Authority and Independent Review Panel, Murray-Darling Basin Authority,
Canberra.
NSW DPI (2015), Fish and flows in the Northern Basin - responses of fish to changes in flow in
the Northern Murray-Darling Basin, reach scale report, New South Wales Department of Primary
Industries - Fisheries, prepared for the MDBA.
Sheldon (2017), Changes in the ‘low-flow hydrology’ of the Barwon–Darling River, Australian
Rivers Institute, Griffith University, Advice to the Commonwealth Environmental Water Holder
Office.
Thoms, M., Sheldon, F., Roberts, J., Harris, J. and Hillman, T. (1996), Scientific panel
assessment of environmental flows for the Barwon–Darling river system, a report to the technical
services division of the NSW Department of Land and Water Conservation.
Observed Flows in the Barwon–Darling 1990-2017: A Hydrologic Investigation
Page 30
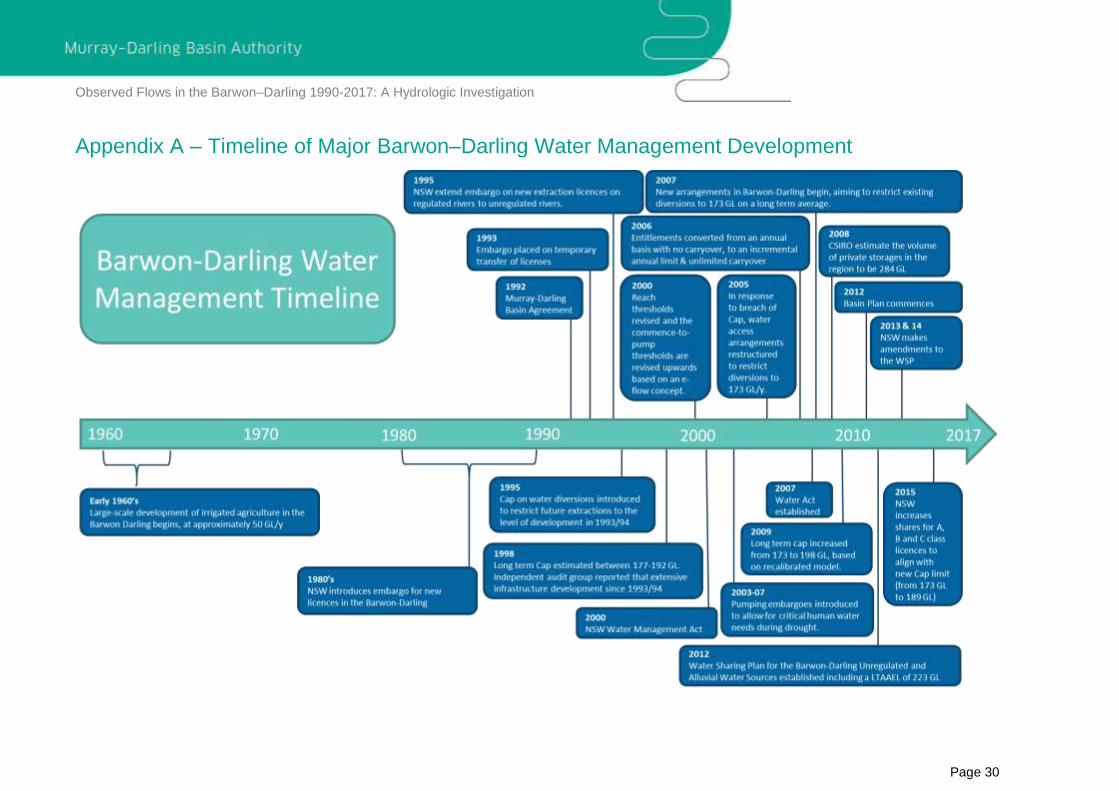
Appendix A – Timeline of Major Barwon–Darling Water Management Development
Observed Flows in the Barwon–Darling 1990-2017: A Hydrologic Investigation
Page 31
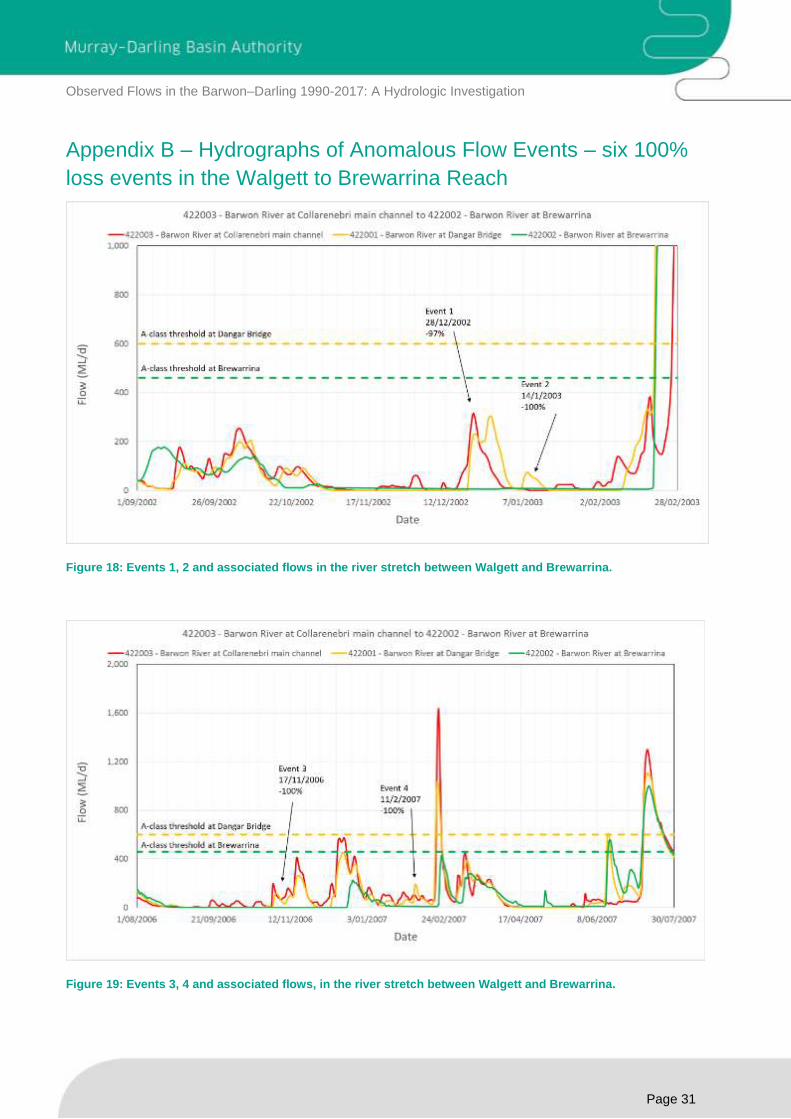
Appendix B – Hydrographs of Anomalous Flow Events – six 100%
loss events in the Walgett to Brewarrina Reach
Figure 18: Events 1, 2 and associated flows in the river stretch between Walgett and Brewarrina.
Figure 19: Events 3, 4 and associated flows, in the river stretch between Walgett and Brewarrina.
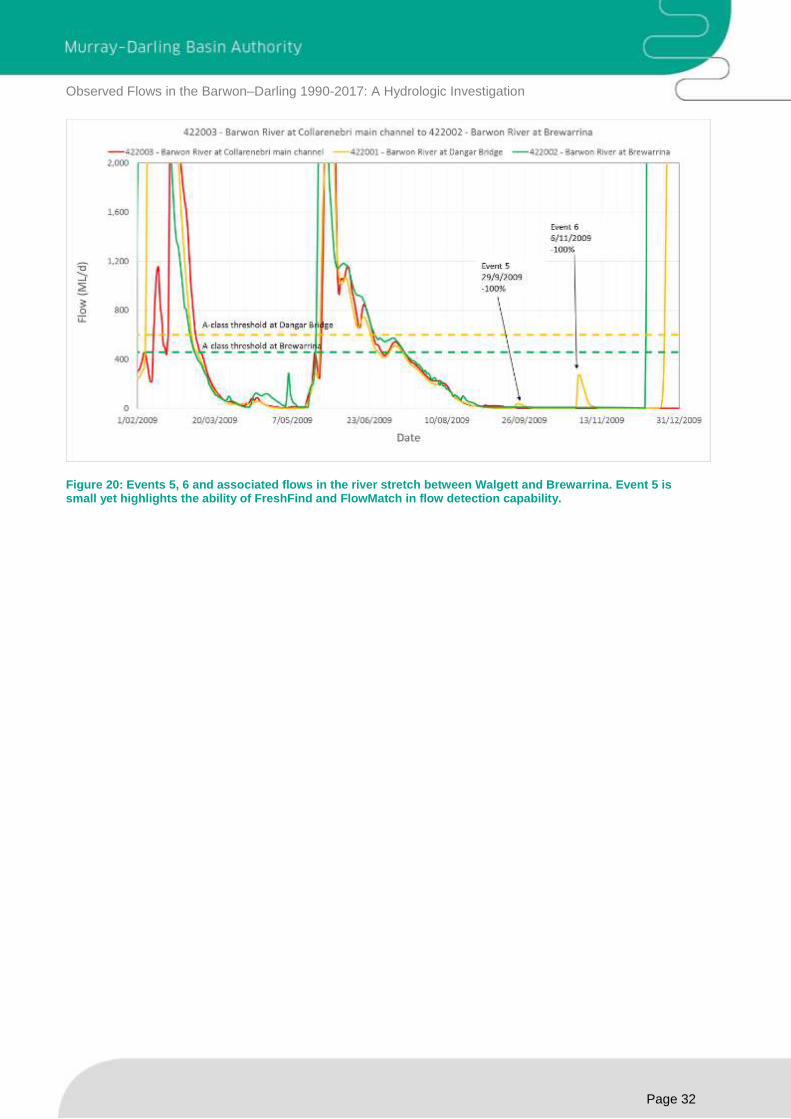
Observed Flows in the Barwon–Darling 1990-2017: A Hydrologic Investigation
Page 32
Figure 20: Events 5, 6 and associated flows in the river stretch between Walgett and Brewarrina. Event 5 is small yet highlights the ability of FreshFind and FlowMatch in flow detection capability.
Observed Flows in the Barwon–Darling 1990-2017: A Hydrologic Investigation
Page 33
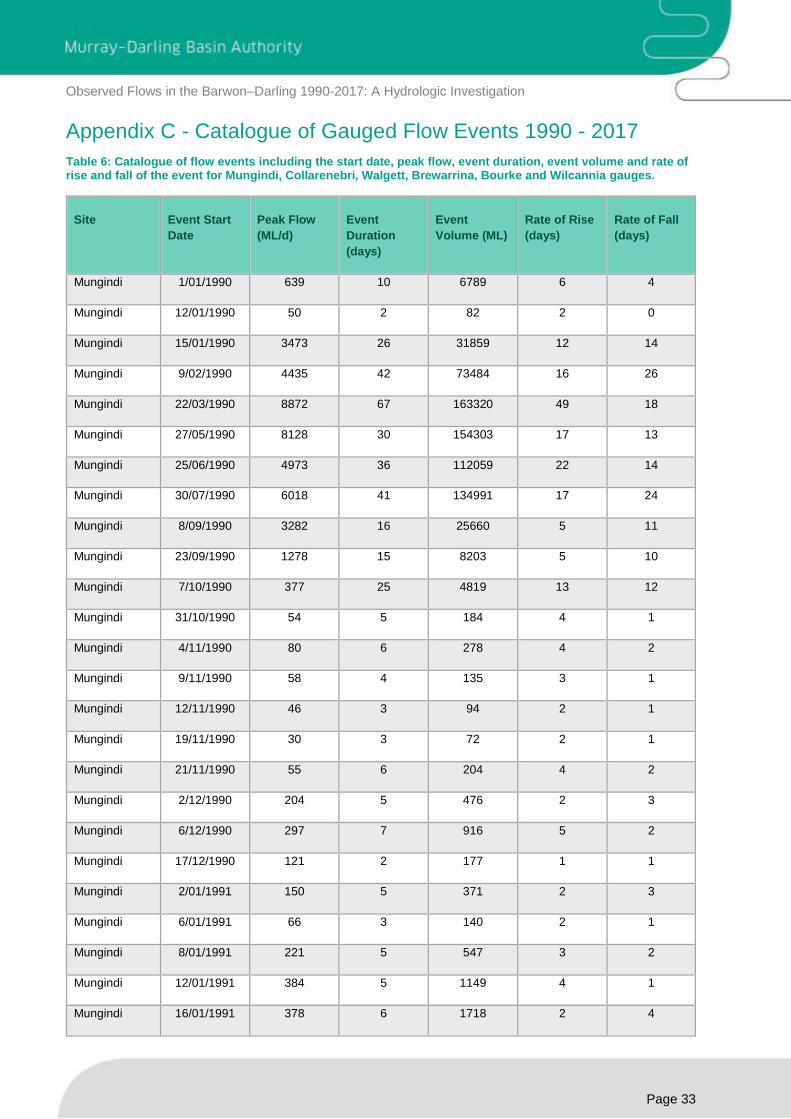
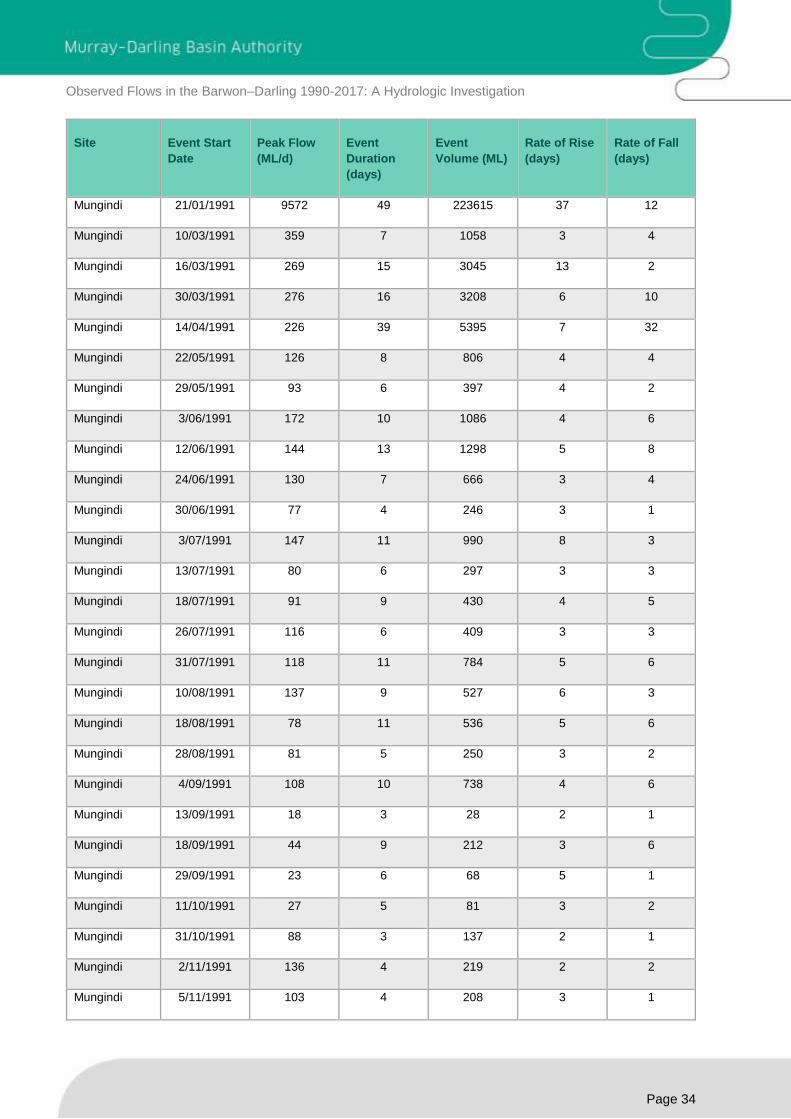
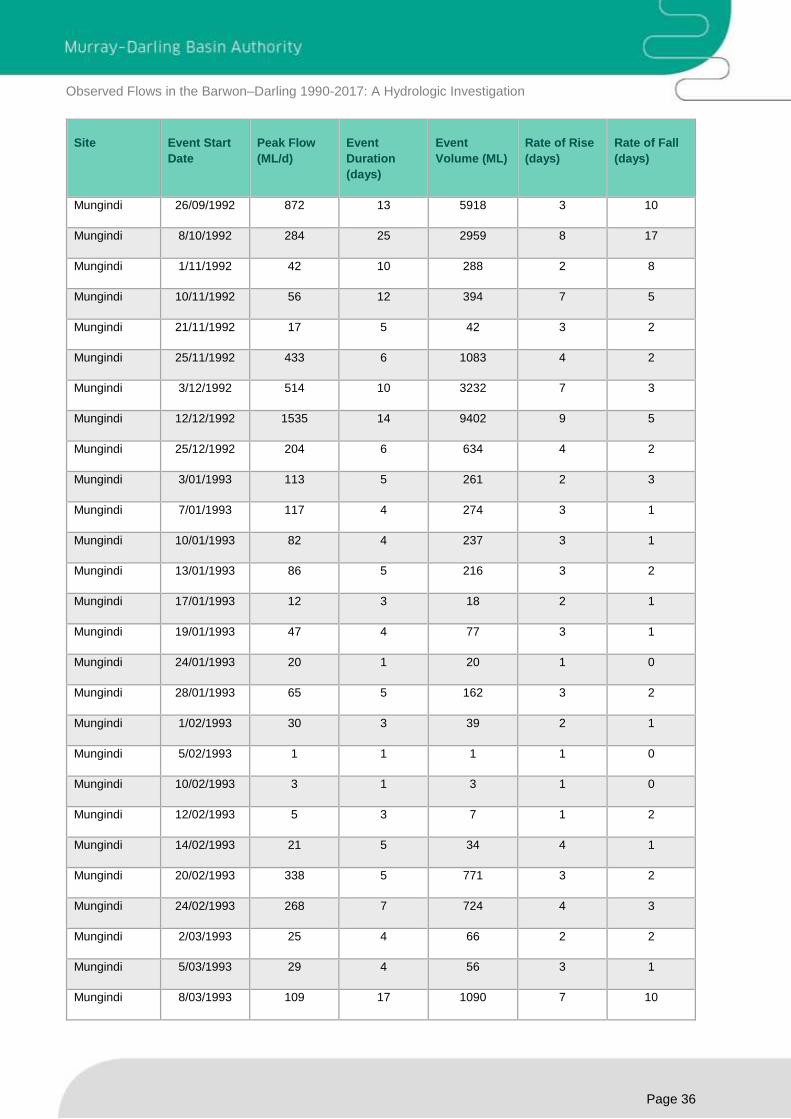
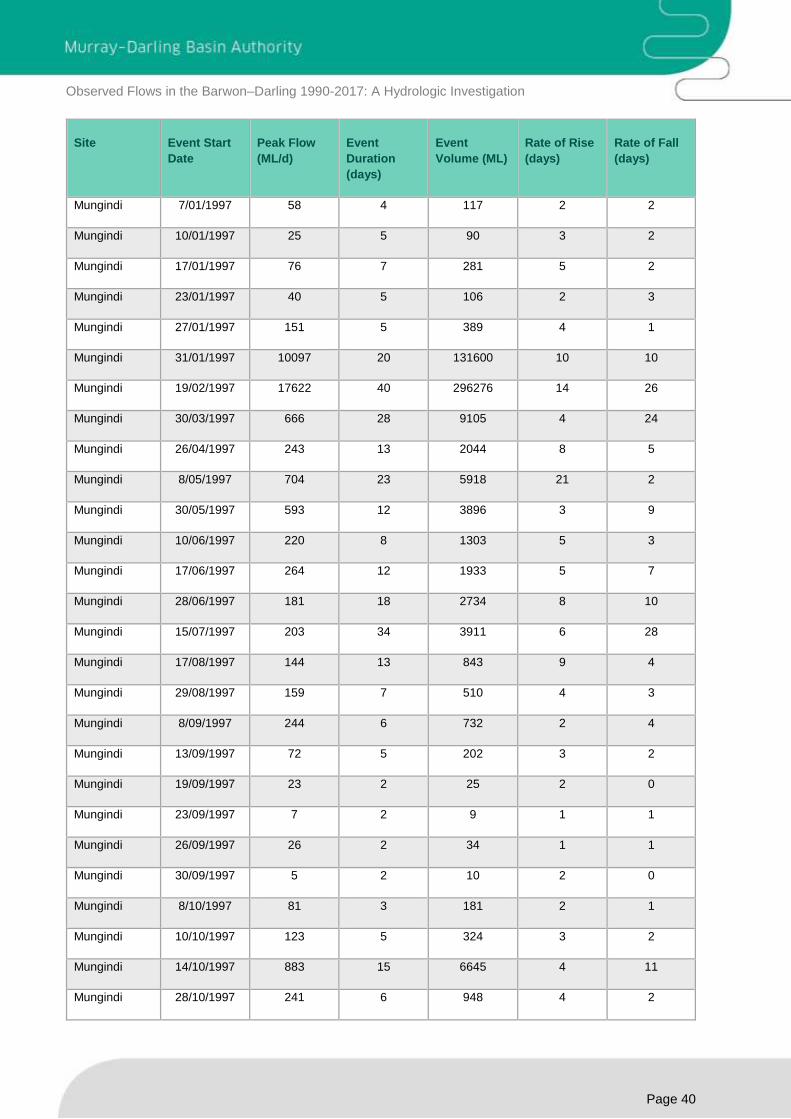
Appendix C - Catalogue of Gauged Flow Events 1990 - 2017
Table 6: Catalogue of flow events including the start date, peak flow, event duration, event volume and rate of rise and fall of the event for Mungindi, Collarenebri, Walgett, Brewarrina, Bourke and Wilcannia gauges.
Site Event Start
Date
Peak Flow
(ML/d)
Event
Duration
(days)
Event
Volume (ML)
Rate of Rise
(days)
Rate of Fall
(days)
Mungindi 1/01/1990 639 10 6789 6 4
Mungindi 12/01/1990 50 2 82 2 0
Mungindi 15/01/1990 3473 26 31859 12 14
Mungindi 9/02/1990 4435 42 73484 16 26
Mungindi 22/03/1990 8872 67 163320 49 18
Mungindi 27/05/1990 8128 30 154303 17 13
Mungindi 25/06/1990 4973 36 112059 22 14
Mungindi 30/07/1990 6018 41 134991 17 24
Mungindi 8/09/1990 3282 16 25660 5 11
Mungindi 23/09/1990 1278 15 8203 5 10
Mungindi 7/10/1990 377 25 4819 13 12
Mungindi 31/10/1990 54 5 184 4 1
Mungindi 4/11/1990 80 6 278 4 2
Mungindi 9/11/1990 58 4 135 3 1
Mungindi 12/11/1990 46 3 94 2 1
Mungindi 19/11/1990 30 3 72 2 1
Mungindi 21/11/1990 55 6 204 4 2
Mungindi 2/12/1990 204 5 476 2 3
Mungindi 6/12/1990 297 7 916 5 2
Mungindi 17/12/1990 121 2 177 1 1
Mungindi 2/01/1991 150 5 371 2 3
Mungindi 6/01/1991 66 3 140 2 1
Mungindi 8/01/1991 221 5 547 3 2
Mungindi 12/01/1991 384 5 1149 4 1
Mungindi 16/01/1991 378 6 1718 2 4
Observed Flows in the Barwon–Darling 1990-2017: A Hydrologic Investigation
Page 34
Site Event Start
Date
Peak Flow
(ML/d)
Event
Duration
(days)
Event
Volume (ML)
Rate of Rise
(days)
Rate of Fall
(days)
Mungindi 21/01/1991 9572 49 223615 37 12
Mungindi 10/03/1991 359 7 1058 3 4
Mungindi 16/03/1991 269 15 3045 13 2
Mungindi 30/03/1991 276 16 3208 6 10
Mungindi 14/04/1991 226 39 5395 7 32
Mungindi 22/05/1991 126 8 806 4 4
Mungindi 29/05/1991 93 6 397 4 2
Mungindi 3/06/1991 172 10 1086 4 6
Mungindi 12/06/1991 144 13 1298 5 8
Mungindi 24/06/1991 130 7 666 3 4
Mungindi 30/06/1991 77 4 246 3 1
Mungindi 3/07/1991 147 11 990 8 3
Mungindi 13/07/1991 80 6 297 3 3
Mungindi 18/07/1991 91 9 430 4 5
Mungindi 26/07/1991 116 6 409 3 3
Mungindi 31/07/1991 118 11 784 5 6
Mungindi 10/08/1991 137 9 527 6 3
Mungindi 18/08/1991 78 11 536 5 6
Mungindi 28/08/1991 81 5 250 3 2
Mungindi 4/09/1991 108 10 738 4 6
Mungindi 13/09/1991 18 3 28 2 1
Mungindi 18/09/1991 44 9 212 3 6
Mungindi 29/09/1991 23 6 68 5 1
Mungindi 11/10/1991 27 5 81 3 2
Mungindi 31/10/1991 88 3 137 2 1
Mungindi 2/11/1991 136 4 219 2 2
Mungindi 5/11/1991 103 4 208 3 1

Observed Flows in the Barwon–Darling 1990-2017: A Hydrologic Investigation
Page 35
Site Event Start
Date
Peak Flow
(ML/d)
Event
Duration
(days)
Event
Volume (ML)
Rate of Rise
(days)
Rate of Fall
(days)
Mungindi 11/11/1991 78 4 149 2 2
Mungindi 14/11/1991 57 4 97 3 1
Mungindi 22/11/1991 123 7 325 5 2
Mungindi 10/12/1991 516 8 1353 5 3
Mungindi 17/12/1991 4077 12 24264 6 6
Mungindi 1/01/1992 302 3 346 2 1
Mungindi 6/01/1992 2710 11 12811 8 3
Mungindi 16/01/1992 2485 10 11493 6 4
Mungindi 25/01/1992 133 7 559 3 4
Mungindi 31/01/1992 197 7 985 4 3
Mungindi 6/02/1992 3189 11 17259 6 5
Mungindi 16/02/1992 6132 35 82111 12 23
Mungindi 21/03/1992 278 28 4620 7 21
Mungindi 17/04/1992 78 10 636 7 3
Mungindi 26/04/1992 98 11 736 4 7
Mungindi 6/05/1992 71 20 1037 4 16
Mungindi 25/05/1992 338 21 3397 15 6
Mungindi 14/06/1992 324 14 2223 4 10
Mungindi 27/06/1992 87 7 471 3 4
Mungindi 3/07/1992 85 7 488 3 4
Mungindi 9/07/1992 146 26 2163 11 15
Mungindi 3/08/1992 187 16 1786 8 8
Mungindi 18/08/1992 688 8 2335 4 4
Mungindi 25/08/1992 80 4 249 2 2
Mungindi 28/08/1992 202 7 839 5 2
Mungindi 3/09/1992 102 5 309 3 2
Mungindi 7/09/1992 1260 20 12768 7 13
Observed Flows in the Barwon–Darling 1990-2017: A Hydrologic Investigation
Page 36
Site Event Start
Date
Peak Flow
(ML/d)
Event
Duration
(days)
Event
Volume (ML)
Rate of Rise
(days)
Rate of Fall
(days)
Mungindi 26/09/1992 872 13 5918 3 10
Mungindi 8/10/1992 284 25 2959 8 17
Mungindi 1/11/1992 42 10 288 2 8
Mungindi 10/11/1992 56 12 394 7 5
Mungindi 21/11/1992 17 5 42 3 2
Mungindi 25/11/1992 433 6 1083 4 2
Mungindi 3/12/1992 514 10 3232 7 3
Mungindi 12/12/1992 1535 14 9402 9 5
Mungindi 25/12/1992 204 6 634 4 2
Mungindi 3/01/1993 113 5 261 2 3
Mungindi 7/01/1993 117 4 274 3 1
Mungindi 10/01/1993 82 4 237 3 1
Mungindi 13/01/1993 86 5 216 3 2
Mungindi 17/01/1993 12 3 18 2 1
Mungindi 19/01/1993 47 4 77 3 1
Mungindi 24/01/1993 20 1 20 1 0
Mungindi 28/01/1993 65 5 162 3 2
Mungindi 1/02/1993 30 3 39 2 1
Mungindi 5/02/1993 1 1 1 1 0
Mungindi 10/02/1993 3 1 3 1 0
Mungindi 12/02/1993 5 3 7 1 2
Mungindi 14/02/1993 21 5 34 4 1
Mungindi 20/02/1993 338 5 771 3 2
Mungindi 24/02/1993 268 7 724 4 3
Mungindi 2/03/1993 25 4 66 2 2
Mungindi 5/03/1993 29 4 56 3 1
Mungindi 8/03/1993 109 17 1090 7 10

Observed Flows in the Barwon–Darling 1990-2017: A Hydrologic Investigation
Page 37
Site Event Start
Date
Peak Flow
(ML/d)
Event
Duration
(days)
Event
Volume (ML)
Rate of Rise
(days)
Rate of Fall
(days)
Mungindi 24/03/1993 55 12 545 8 4
Mungindi 4/04/1993 51 19 527 4 15
Mungindi 22/04/1993 20 20 227 7 13
Mungindi 11/05/1993 14 13 81 4 9
Mungindi 23/05/1993 6 10 51 5 5
Mungindi 1/06/1993 82 7 184 3 4
Mungindi 7/06/1993 28 11 147 5 6
Mungindi 17/06/1993 18 22 276 7 15
Mungindi 8/07/1993 85 10 377 3 7
Mungindi 17/07/1993 25 16 296 6 10
Mungindi 1/08/1993 10 15 63 3 12
Mungindi 13/09/1993 17 11 62 3 8
Mungindi 29/09/1993 9 2 13 2 0
Mungindi 4/10/1993 24 7 74 3 4
Mungindi 10/10/1993 10 17 62 7 10
Mungindi 3/11/1993 19 1 19 1 0
Mungindi 5/11/1993 10 7 31 4 3
Mungindi 11/11/1993 5 4 12 3 1
Mungindi 14/11/1993 109 6 166 3 3
Mungindi 19/11/1993 6 5 21 3 2
Mungindi 3/12/1993 47 5 76 4 1
Mungindi 7/12/1993 29 4 51 2 2
Mungindi 16/12/1993 32 2 38 1 1
Mungindi 17/12/1993 135 7 492 3 4
Mungindi 23/12/1993 25 3 44 2 1
Mungindi 25/12/1993 40 4 63 3 1
Mungindi 30/12/1993 80 4 117 3 1

Observed Flows in the Barwon–Darling 1990-2017: A Hydrologic Investigation
Page 38
Site Event Start
Date
Peak Flow
(ML/d)
Event
Duration
(days)
Event
Volume (ML)
Rate of Rise
(days)
Rate of Fall
(days)
Mungindi 21/01/1994 20 1 20 1 0
Mungindi 24/01/1994 2 1 2 1 0
Mungindi 6/02/1994 101 6 376 2 4
Mungindi 11/02/1994 72 6 245 3 3
Mungindi 16/02/1994 4930 16 40843 7 9
Mungindi 3/03/1994 185 3 359 2 1
Mungindi 5/03/1994 187 4 372 2 2
Mungindi 8/03/1994 154 4 264 3 1
Mungindi 11/03/1994 989 9 4233 5 4
Mungindi 19/03/1994 588 7 2367 3 4
Mungindi 27/03/1994 4 1 4 1 0
Mungindi 29/03/1994 112 8 543 4 4
Mungindi 5/04/1994 76 17 445 3 14
Mungindi 21/04/1994 19 27 180 14 13
Mungindi 18/07/1994 6 13 41 3 10
Mungindi 15/01/1995 376 4 1167 2 2
Mungindi 18/01/1995 558 8 2744 7 1
Mungindi 27/01/1995 2228 16 13607 6 10
Mungindi 11/02/1995 260 10 1268 3 7
Mungindi 20/02/1995 36 5 135 3 2
Mungindi 24/02/1995 81 4 195 2 2
Mungindi 27/02/1995 109 4 238 4 0
Mungindi 4/03/1995 103 5 239 1 4
Mungindi 8/03/1995 87 7 344 5 2
Mungindi 16/03/1995 119 7 516 3 4
Mungindi 22/03/1995 94 7 454 3 4
Mungindi 28/03/1995 73 22 680 4 18

Observed Flows in the Barwon–Darling 1990-2017: A Hydrologic Investigation
Page 39
Site Event Start
Date
Peak Flow
(ML/d)
Event
Duration
(days)
Event
Volume (ML)
Rate of Rise
(days)
Rate of Fall
(days)
Mungindi 20/10/1995 302 4 538 2 2
Mungindi 23/10/1995 293 8 994 6 2
Mungindi 30/10/1995 336 16 2789 5 11
Mungindi 14/11/1995 2102 10 6902 7 3
Mungindi 23/11/1995 6534 22 72968 6 16
Mungindi 14/12/1995 15 3 33 2 1
Mungindi 16/12/1995 381 6 776 3 3
Mungindi 21/12/1995 424 5 947 3 2
Mungindi 25/12/1995 312 9 1324 2 7
Mungindi 2/01/1996 51745 30 588203 22 8
Mungindi 31/01/1996 51309 30 579669 4 26
Mungindi 29/02/1996 834 8 3374 5 3
Mungindi 7/03/1996 2179 22 17078 5 17
Mungindi 28/03/1996 217 10 1664 5 5
Mungindi 6/04/1996 272 19 2867 10 9
Mungindi 24/04/1996 168 8 964 4 4
Mungindi 1/05/1996 22578 97 358028 20 77
Mungindi 5/08/1996 1674 24 18825 7 17
Mungindi 28/08/1996 478 9 3048 4 5
Mungindi 5/09/1996 3707 22 29430 9 13
Mungindi 26/09/1996 2512 11 15664 7 4
Mungindi 6/10/1996 6144 43 115085 17 26
Mungindi 17/11/1996 903 21 8622 4 17
Mungindi 7/12/1996 258 7 1159 4 3
Mungindi 13/12/1996 422 6 1574 3 3
Mungindi 18/12/1996 355 8 1622 3 5
Mungindi 25/12/1996 1194 14 5428 5 9
Observed Flows in the Barwon–Darling 1990-2017: A Hydrologic Investigation
Page 40
Site Event Start
Date
Peak Flow
(ML/d)
Event
Duration
(days)
Event
Volume (ML)
Rate of Rise
(days)
Rate of Fall
(days)
Mungindi 7/01/1997 58 4 117 2 2
Mungindi 10/01/1997 25 5 90 3 2
Mungindi 17/01/1997 76 7 281 5 2
Mungindi 23/01/1997 40 5 106 2 3
Mungindi 27/01/1997 151 5 389 4 1
Mungindi 31/01/1997 10097 20 131600 10 10
Mungindi 19/02/1997 17622 40 296276 14 26
Mungindi 30/03/1997 666 28 9105 4 24
Mungindi 26/04/1997 243 13 2044 8 5
Mungindi 8/05/1997 704 23 5918 21 2
Mungindi 30/05/1997 593 12 3896 3 9
Mungindi 10/06/1997 220 8 1303 5 3
Mungindi 17/06/1997 264 12 1933 5 7
Mungindi 28/06/1997 181 18 2734 8 10
Mungindi 15/07/1997 203 34 3911 6 28
Mungindi 17/08/1997 144 13 843 9 4
Mungindi 29/08/1997 159 7 510 4 3
Mungindi 8/09/1997 244 6 732 2 4
Mungindi 13/09/1997 72 5 202 3 2
Mungindi 19/09/1997 23 2 25 2 0
Mungindi 23/09/1997 7 2 9 1 1
Mungindi 26/09/1997 26 2 34 1 1
Mungindi 30/09/1997 5 2 10 2 0
Mungindi 8/10/1997 81 3 181 2 1
Mungindi 10/10/1997 123 5 324 3 2
Mungindi 14/10/1997 883 15 6645 4 11
Mungindi 28/10/1997 241 6 948 4 2

Observed Flows in the Barwon–Darling 1990-2017: A Hydrologic Investigation
Page 41
Site Event Start
Date
Peak Flow
(ML/d)
Event
Duration
(days)
Event
Volume (ML)
Rate of Rise
(days)
Rate of Fall
(days)
Mungindi 2/11/1997 165 4 472 2 2
Mungindi 5/11/1997 187 10 1424 7 3
Mungindi 14/11/1997 375 8 2025 6 2
Mungindi 21/11/1997 904 12 5614 4 8
Mungindi 2/12/1997 161 5 453 2 3
Mungindi 6/12/1997 319 10 1777 6 4
Mungindi 15/12/1997 632 9 1792 3 6
Mungindi 23/12/1997 176 5 324 3 2
Mungindi 27/12/1997 216 6 456 3 3
Mungindi 7/01/1998 70 2 98 2 0
Mungindi 11/01/1998 97 2 110 1 1
Mungindi 17/01/1998 180 5 333 2 3
Mungindi 27/01/1998 100 7 279 2 5
Mungindi 2/02/1998 24 3 50 3 0
Mungindi 8/02/1998 114 6 465 2 4
Mungindi 13/02/1998 120 7 645 5 2
Mungindi 19/02/1998 832 8 3133 3 5
Mungindi 26/02/1998 129 4 298 3 1
Mungindi 1/03/1998 192 4 588 3 1
Mungindi 4/03/1998 261 10 1516 4 6
Mungindi 13/03/1998 163 26 2421 9 17
Mungindi 7/04/1998 320 34 4610 30 4
Mungindi 10/05/1998 426 7 1591 4 3
Mungindi 16/05/1998 540 6 1331 4 2
Mungindi 21/05/1998 24 3 33 2 1
Mungindi 23/05/1998 139 6 309 4 2
Mungindi 28/05/1998 116 7 552 4 3

Observed Flows in the Barwon–Darling 1990-2017: A Hydrologic Investigation
Page 42
Site Event Start
Date
Peak Flow
(ML/d)
Event
Duration
(days)
Event
Volume (ML)
Rate of Rise
(days)
Rate of Fall
(days)
Mungindi 3/06/1998 242 8 792 3 5
Mungindi 10/06/1998 105 10 573 5 5
Mungindi 19/06/1998 117 16 1144 13 3
Mungindi 4/07/1998 485 11 2637 9 2
Mungindi 14/07/1998 466 5 1602 2 3
Mungindi 18/07/1998 1181 7 4425 3 4
Mungindi 24/07/1998 29325 37 477941 20 17
Mungindi 29/08/1998 61393 48 863194 10 38
Mungindi 15/10/1998 1741 14 19029 5 9
Mungindi 28/10/1998 5109 25 58467 7 18
Mungindi 21/11/1998 1374 13 11061 4 9
Mungindi 3/12/1998 482 9 1802 4 5
Mungindi 11/12/1998 332 7 702 5 2
Mungindi 17/12/1998 134 7 637 5 2
Mungindi 23/12/1998 48 4 85 2 2
Mungindi 26/12/1998 593 16 3742 7 9
Mungindi 10/01/1999 235 6 628 3 3
Mungindi 18/01/1999 122 3 244 2 1
Mungindi 20/01/1999 248 6 677 3 3
Mungindi 25/01/1999 357 14 1984 9 5
Mungindi 7/02/1999 344 7 1272 5 2
Mungindi 13/02/1999 929 7 2217 3 4
Mungindi 19/02/1999 187 8 878 4 4
Mungindi 26/02/1999 452 6 1800 5 1
Mungindi 3/03/1999 12748 43 185053 21 22
Mungindi 14/04/1999 1601 43 22959 5 38
Mungindi 26/05/1999 256 15 2914 9 6
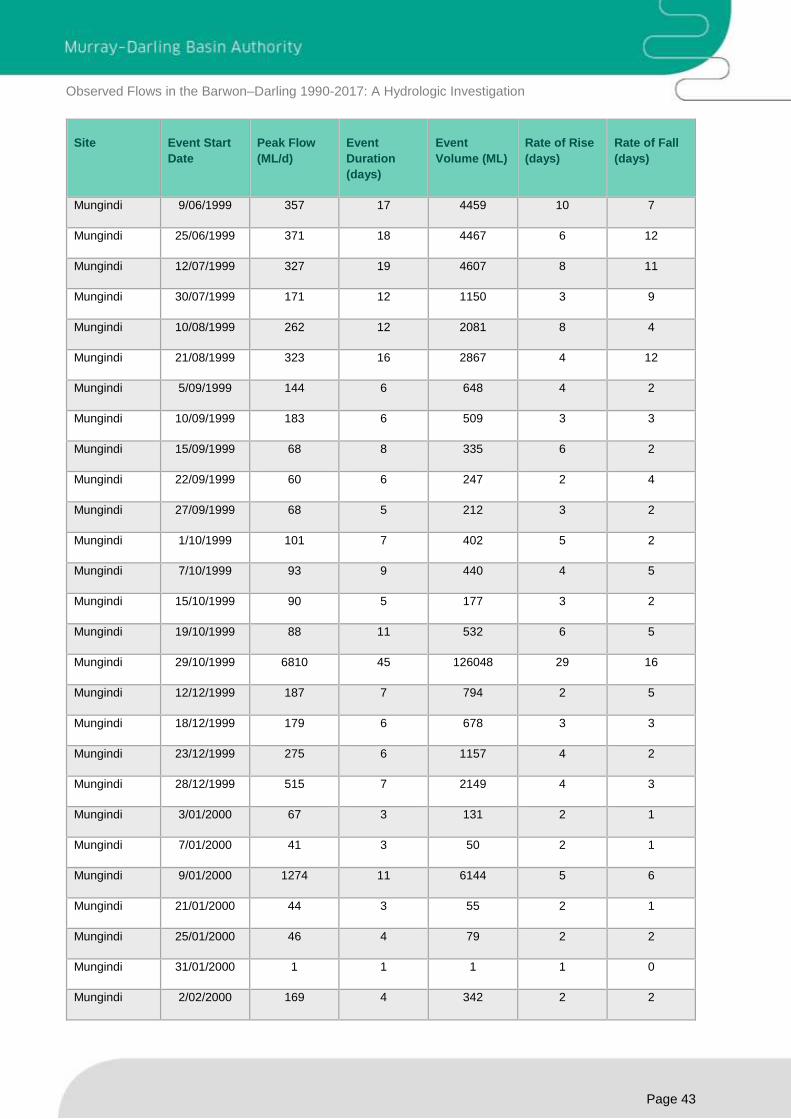
Observed Flows in the Barwon–Darling 1990-2017: A Hydrologic Investigation
Page 43
Site Event Start
Date
Peak Flow
(ML/d)
Event
Duration
(days)
Event
Volume (ML)
Rate of Rise
(days)
Rate of Fall
(days)
Mungindi 9/06/1999 357 17 4459 10 7
Mungindi 25/06/1999 371 18 4467 6 12
Mungindi 12/07/1999 327 19 4607 8 11
Mungindi 30/07/1999 171 12 1150 3 9
Mungindi 10/08/1999 262 12 2081 8 4
Mungindi 21/08/1999 323 16 2867 4 12
Mungindi 5/09/1999 144 6 648 4 2
Mungindi 10/09/1999 183 6 509 3 3
Mungindi 15/09/1999 68 8 335 6 2
Mungindi 22/09/1999 60 6 247 2 4
Mungindi 27/09/1999 68 5 212 3 2
Mungindi 1/10/1999 101 7 402 5 2
Mungindi 7/10/1999 93 9 440 4 5
Mungindi 15/10/1999 90 5 177 3 2
Mungindi 19/10/1999 88 11 532 6 5
Mungindi 29/10/1999 6810 45 126048 29 16
Mungindi 12/12/1999 187 7 794 2 5
Mungindi 18/12/1999 179 6 678 3 3
Mungindi 23/12/1999 275 6 1157 4 2
Mungindi 28/12/1999 515 7 2149 4 3
Mungindi 3/01/2000 67 3 131 2 1
Mungindi 7/01/2000 41 3 50 2 1
Mungindi 9/01/2000 1274 11 6144 5 6
Mungindi 21/01/2000 44 3 55 2 1
Mungindi 25/01/2000 46 4 79 2 2
Mungindi 31/01/2000 1 1 1 1 0
Mungindi 2/02/2000 169 4 342 2 2

Observed Flows in the Barwon–Darling 1990-2017: A Hydrologic Investigation
Page 44
Site Event Start
Date
Peak Flow
(ML/d)
Event
Duration
(days)
Event
Volume (ML)
Rate of Rise
(days)
Rate of Fall
(days)
Mungindi 5/02/2000 221 7 545 3 4
Mungindi 15/02/2000 345 6 1125 2 4
Mungindi 20/02/2000 408 8 1728 5 3
Mungindi 27/02/2000 410 12 3549 3 9
Mungindi 9/03/2000 277 9 2001 5 4
Mungindi 17/03/2000 3456 14 14663 11 3
Mungindi 30/03/2000 894 6 3481 2 4
Mungindi 4/04/2000 519 56 11514 7 49
Mungindi 29/05/2000 374 36 5279 16 20
Mungindi 3/07/2000 143 48 4748 32 16
Mungindi 19/08/2000 75 12 675 7 5
Mungindi 30/08/2000 168 9 680 6 3
Mungindi 7/09/2000 79 6 329 3 3
Mungindi 12/09/2000 46 5 129 3 2
Mungindi 18/09/2000 201 7 527 4 3
Mungindi 24/09/2000 17 4 32 2 2
Mungindi 29/09/2000 36 4 89 2 2
Mungindi 2/10/2000 41 4 68 2 2
Mungindi 5/10/2000 17 3 23 2 1
Mungindi 10/10/2000 32 2 44 1 1
Mungindi 13/10/2000 10 3 14 2 1
Mungindi 19/10/2000 318 6 1188 2 4
Mungindi 24/10/2000 411 12 3370 8 4
Mungindi 4/11/2000 442 9 2354 4 5
Mungindi 12/11/2000 1540 6 3885 5 1
Mungindi 17/11/2000 11672 27 116152 19 8
Mungindi 13/12/2000 56 3 126 3 0

Observed Flows in the Barwon–Darling 1990-2017: A Hydrologic Investigation
Page 45
Site Event Start
Date
Peak Flow
(ML/d)
Event
Duration
(days)
Event
Volume (ML)
Rate of Rise
(days)
Rate of Fall
(days)
Mungindi 18/12/2000 763 11 2823 7 4
Mungindi 31/12/2000 99 6 334 4 2
Mungindi 5/01/2001 150 5 508 3 2
Mungindi 9/01/2001 254 5 649 3 2
Mungindi 13/01/2001 55 4 140 3 1
Mungindi 16/01/2001 159 8 553 3 5
Mungindi 25/01/2001 114 4 313 3 1
Mungindi 31/01/2001 322 7 1505 2 5
Mungindi 6/02/2001 12611 21 114249 14 7
Mungindi 26/02/2001 272 8 1543 4 4
Mungindi 5/03/2001 237 4 767 3 1
Mungindi 8/03/2001 4779 23 48657 19 4
Mungindi 30/03/2001 5622 23 70593 13 10
Mungindi 21/04/2001 1001 47 26002 17 30
Mungindi 6/06/2001 468 26 8922 17 9
Mungindi 1/07/2001 228 7 1257 3 4
Mungindi 7/07/2001 185 4 587 2 2
Mungindi 10/07/2001 236 15 2594 4 11
Mungindi 24/07/2001 831 6 2317 4 2
Mungindi 29/07/2001 1685 20 14165 8 12
Mungindi 17/08/2001 345 14 2710 5 9
Mungindi 30/08/2001 139 8 822 3 5
Mungindi 6/09/2001 307 9 1501 5 4
Mungindi 14/09/2001 158 6 440 3 3
Mungindi 19/09/2001 272 9 1201 7 2
Mungindi 27/09/2001 226 15 1133 3 12
Mungindi 14/10/2001 3 6 15 5 1

Observed Flows in the Barwon–Darling 1990-2017: A Hydrologic Investigation
Page 46
Site Event Start
Date
Peak Flow
(ML/d)
Event
Duration
(days)
Event
Volume (ML)
Rate of Rise
(days)
Rate of Fall
(days)
Mungindi 22/10/2001 66 29 1044 22 7
Mungindi 19/11/2001 101 6 429 5 1
Mungindi 24/11/2001 168 5 492 3 2
Mungindi 28/11/2001 937 9 3233 7 2
Mungindi 6/12/2001 1261 10 7916 6 4
Mungindi 15/12/2001 287 8 1317 3 5
Mungindi 22/12/2001 139 6 468 5 1
Mungindi 27/12/2001 241 9 1156 5 4
Mungindi 4/01/2002 108 4 299 3 1
Mungindi 9/01/2002 24 2 30 1 1
Mungindi 13/01/2002 32 5 76 3 2
Mungindi 17/01/2002 4 2 6 2 0
Mungindi 25/01/2002 21 2 25 1 1
Mungindi 31/01/2002 337 8 1298 4 4
Mungindi 9/02/2002 128 7 654 4 3
Mungindi 15/02/2002 88 5 210 2 3
Mungindi 26/02/2002 352 13 3265 4 9
Mungindi 10/03/2002 230 5 787 3 2
Mungindi 14/03/2002 141 16 1351 4 12
Mungindi 29/03/2002 1867 15 8331 12 3
Mungindi 15/04/2002 257 48 6409 5 43
Mungindi 1/06/2002 106 19 969 4 15
Mungindi 19/06/2002 83 42 2421 18 24
Mungindi 30/07/2002 59 18 789 5 13
Mungindi 16/08/2002 47 14 410 11 3
Mungindi 29/08/2002 62 5 183 4 1
Mungindi 7/09/2002 24 3 41 2 1

Observed Flows in the Barwon–Darling 1990-2017: A Hydrologic Investigation
Page 47
Site Event Start
Date
Peak Flow
(ML/d)
Event
Duration
(days)
Event
Volume (ML)
Rate of Rise
(days)
Rate of Fall
(days)
Mungindi 12/09/2002 51 6 198 4 2
Mungindi 17/09/2002 98 6 207 2 4
Mungindi 22/09/2002 91 4 127 3 1
Mungindi 27/09/2002 65 5 191 2 3
Mungindi 1/10/2002 125 10 588 5 5
Mungindi 10/10/2002 51 5 156 3 2
Mungindi 14/10/2002 57 6 218 3 3
Mungindi 19/10/2002 156 7 612 4 3
Mungindi 25/10/2002 103 12 512 6 6
Mungindi 7/11/2002 44 8 224 3 5
Mungindi 14/11/2002 60 6 241 4 2
Mungindi 19/11/2002 97 11 401 5 6
Mungindi 2/12/2002 70 3 164 2 1
Mungindi 6/12/2002 76 7 349 5 2
Mungindi 12/12/2002 232 10 1003 5 5
Mungindi 24/12/2002 21 2 32 1 1
Mungindi 25/12/2002 32 4 94 2 2
Mungindi 28/12/2002 52 5 144 2 3
Mungindi 3/01/2003 36 3 82 2 1
Mungindi 5/01/2003 38 3 68 2 1
Mungindi 18/01/2003 43 4 119 2 2
Mungindi 24/01/2003 295 4 677 2 2
Mungindi 27/01/2003 236 8 778 3 5
Mungindi 3/02/2003 33 7 133 2 5
Mungindi 9/02/2003 157 10 797 6 4
Mungindi 20/02/2003 212 11 1070 5 6
Mungindi 2/03/2003 1653 27 24935 7 20

Observed Flows in the Barwon–Darling 1990-2017: A Hydrologic Investigation
Page 48
Site Event Start
Date
Peak Flow
(ML/d)
Event
Duration
(days)
Event
Volume (ML)
Rate of Rise
(days)
Rate of Fall
(days)
Mungindi 28/03/2003 656 9 4563 4 5
Mungindi 5/04/2003 694 9 5144 4 5
Mungindi 13/04/2003 794 12 6734 3 9
Mungindi 24/04/2003 1053 13 9019 5 8
Mungindi 6/05/2003 351 6 1600 2 4
Mungindi 11/05/2003 298 39 6013 4 35
Mungindi 18/06/2003 219 54 7994 36 18
Mungindi 10/08/2003 218 23 1688 4 19
Mungindi 9/09/2003 7 6 28 2 4
Mungindi 19/09/2003 46 10 240 3 7
Mungindi 28/09/2003 75 10 378 5 5
Mungindi 7/10/2003 1614 38 21718 13 25
Mungindi 13/11/2003 241 16 1966 8 8
Mungindi 28/11/2003 125 9 531 4 5
Mungindi 6/12/2003 3594 20 25208 16 4
Mungindi 25/12/2003 1127 14 8156 3 11
Mungindi 7/01/2004 178 10 761 9 1
Mungindi 16/01/2004 15307 27 211188 15 12
Mungindi 11/02/2004 1431 30 20767 5 25
Mungindi 11/03/2004 799 5 2304 4 1
Mungindi 15/03/2004 11519 51 84373 7 44
Mungindi 4/05/2004 160 18 2093 7 11
Mungindi 21/05/2004 117 67 3674 7 60
Mungindi 26/07/2004 16 7 91 2 5
Mungindi 1/08/2004 15 18 203 4 14
Mungindi 18/08/2004 41 26 604 23 3
Mungindi 12/09/2004 1302 48 17075 9 39

Observed Flows in the Barwon–Darling 1990-2017: A Hydrologic Investigation
Page 49
Site Event Start
Date
Peak Flow
(ML/d)
Event
Duration
(days)
Event
Volume (ML)
Rate of Rise
(days)
Rate of Fall
(days)
Mungindi 29/10/2004 48 12 333 9 3
Mungindi 9/11/2004 49 4 146 2 2
Mungindi 12/11/2004 1361 17 3152 15 2
Mungindi 28/11/2004 356 7 1388 2 5
Mungindi 4/12/2004 14629 16 76217 11 5
Mungindi 19/12/2004 1137 7 5253 4 3
Mungindi 25/12/2004 759 11 5038 4 7
Mungindi 4/01/2005 923 9 3083 3 6
Mungindi 12/01/2005 299 8 1356 3 5
Mungindi 19/01/2005 247 6 1145 2 4
Mungindi 24/01/2005 1192 6 2365 4 2
Mungindi 29/01/2005 242 12 1668 4 8
Mungindi 9/02/2005 74 9 478 4 5
Mungindi 17/02/2005 61 13 560 8 5
Mungindi 1/03/2005 120 27 1213 8 19
Mungindi 27/03/2005 18 19 173 5 14
Mungindi 12/06/2005 19 8 66 4 4
Mungindi 19/06/2005 5 5 17 2 3
Mungindi 28/06/2005 1010 10 2617 8 2
Mungindi 7/07/2005 584 3 1333 2 1
Mungindi 9/07/2005 1415 6 5366 3 3
Mungindi 14/07/2005 872 19 8016 3 16
Mungindi 1/08/2005 265 42 4779 4 38
Mungindi 11/09/2005 65 10 355 4 6
Mungindi 20/09/2005 237 26 2131 14 12
Mungindi 15/10/2005 81 8 407 3 5
Mungindi 22/10/2005 90 24 1220 6 18

Observed Flows in the Barwon–Darling 1990-2017: A Hydrologic Investigation
Page 50
Site Event Start
Date
Peak Flow
(ML/d)
Event
Duration
(days)
Event
Volume (ML)
Rate of Rise
(days)
Rate of Fall
(days)
Mungindi 14/11/2005 118 10 652 6 4
Mungindi 23/11/2005 1275 19 12076 15 4
Mungindi 11/12/2005 1034 4 2881 2 2
Mungindi 14/12/2005 936 12 8997 4 8
Mungindi 25/12/2005 1070 11 5104 3 8
Mungindi 4/01/2006 162 3 318 2 1
Mungindi 6/01/2006 121 6 508 3 3
Mungindi 11/01/2006 107 3 229 2 1
Mungindi 13/01/2006 377 5 644 3 2
Mungindi 17/01/2006 461 9 2497 7 2
Mungindi 25/01/2006 1588 19 11240 7 12
Mungindi 12/02/2006 263 5 1011 3 2
Mungindi 16/02/2006 1725 10 6060 8 2
Mungindi 25/02/2006 1523 60 31433 7 53
Mungindi 25/04/2006 131 46 2238 10 36
Mungindi 11/06/2006 14 8 63 2 6
Mungindi 25/07/2006 65 13 359 3 10
Mungindi 6/08/2006 17 15 141 5 10
Mungindi 10/09/2006 30 13 306 9 4
Mungindi 22/09/2006 145 7 429 3 4
Mungindi 28/09/2006 137 7 566 5 2
Mungindi 4/10/2006 128 4 380 3 1
Mungindi 7/10/2006 120 5 432 2 3
Mungindi 11/10/2006 110 6 519 4 2
Mungindi 16/10/2006 139 12 963 4 8
Mungindi 27/10/2006 48 12 480 3 9
Mungindi 7/11/2006 139 5 366 3 2

Observed Flows in the Barwon–Darling 1990-2017: A Hydrologic Investigation
Page 51
Site Event Start
Date
Peak Flow
(ML/d)
Event
Duration
(days)
Event
Volume (ML)
Rate of Rise
(days)
Rate of Fall
(days)
Mungindi 11/11/2006 581 14 3391 7 7
Mungindi 24/11/2006 107 6 450 5 1
Mungindi 29/11/2006 75 4 209 2 2
Mungindi 2/12/2006 126 4 363 3 1
Mungindi 5/12/2006 219 7 693 4 3
Mungindi 11/12/2006 655 13 5632 6 7
Mungindi 23/12/2006 454 9 2355 4 5
Mungindi 31/12/2006 201 11 971 5 6
Mungindi 10/01/2007 256 6 637 4 2
Mungindi 15/01/2007 161 6 635 2 4
Mungindi 20/01/2007 84 3 148 2 1
Mungindi 22/01/2007 140 5 377 3 2
Mungindi 26/01/2007 150 4 246 2 2
Mungindi 29/01/2007 60 7 223 4 3
Mungindi 4/02/2007 19 4 43 3 1
Mungindi 7/02/2007 78 6 241 5 1
Mungindi 12/02/2007 56 5 190 2 3
Mungindi 16/02/2007 47 5 158 3 2
Mungindi 20/02/2007 101 10 632 3 7
Mungindi 1/03/2007 106 14 630 10 4
Mungindi 14/03/2007 342 45 5572 4 41
Mungindi 27/04/2007 19 8 63 3 5
Mungindi 18/05/2007 6 2 8 2 0
Mungindi 6/06/2007 49 6 189 3 3
Mungindi 11/06/2007 33 23 354 2 21
Mungindi 3/07/2007 1363 60 20045 10 50
Mungindi 31/08/2007 1338 29 17036 6 23

Observed Flows in the Barwon–Darling 1990-2017: A Hydrologic Investigation
Page 52
Site Event Start
Date
Peak Flow
(ML/d)
Event
Duration
(days)
Event
Volume (ML)
Rate of Rise
(days)
Rate of Fall
(days)
Mungindi 28/09/2007 134 7 683 3 4
Mungindi 4/10/2007 116 12 938 3 9
Mungindi 15/10/2007 56 11 424 4 7
Mungindi 25/10/2007 68 8 247 6 2
Mungindi 1/11/2007 175 8 876 4 4
Mungindi 8/11/2007 858 12 3665 7 5
Mungindi 19/11/2007 86 4 265 2 2
Mungindi 22/11/2007 115 8 683 3 5
Mungindi 29/11/2007 169 8 876 3 5
Mungindi 6/12/2007 100 4 317 2 2
Mungindi 9/12/2007 132 4 377 2 2
Mungindi 12/12/2007 3318 31 27072 11 20
Mungindi 11/01/2008 1066 25 14535 16 9
Mungindi 4/02/2008 3152 10 16329 5 5
Mungindi 13/02/2008 2717 14 23089 9 5
Mungindi 26/02/2008 1055 34 13384 5 29
Mungindi 30/03/2008 89 8 518 4 4
Mungindi 6/04/2008 113 14 762 3 11
Mungindi 19/04/2008 30 8 163 3 5
Mungindi 26/04/2008 48 14 266 4 10
Mungindi 12/06/2008 84 14 452 3 11
Mungindi 25/06/2008 53 30 915 11 19
Mungindi 24/07/2008 54 25 569 9 16
Mungindi 5/09/2008 38 6 122 2 4
Mungindi 10/09/2008 202 13 1196 4 9
Mungindi 22/09/2008 230 20 1334 4 16
Mungindi 30/10/2008 36 5 78 2 3
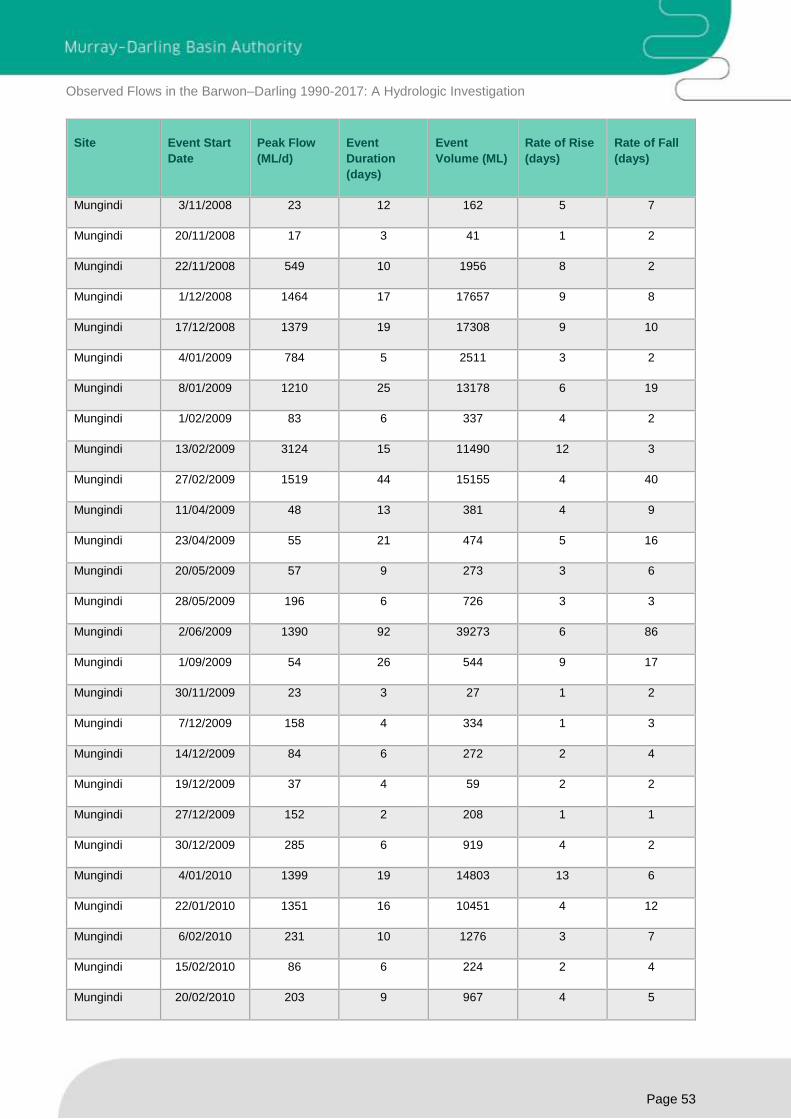
Observed Flows in the Barwon–Darling 1990-2017: A Hydrologic Investigation
Page 53
Site Event Start
Date
Peak Flow
(ML/d)
Event
Duration
(days)
Event
Volume (ML)
Rate of Rise
(days)
Rate of Fall
(days)
Mungindi 3/11/2008 23 12 162 5 7
Mungindi 20/11/2008 17 3 41 1 2
Mungindi 22/11/2008 549 10 1956 8 2
Mungindi 1/12/2008 1464 17 17657 9 8
Mungindi 17/12/2008 1379 19 17308 9 10
Mungindi 4/01/2009 784 5 2511 3 2
Mungindi 8/01/2009 1210 25 13178 6 19
Mungindi 1/02/2009 83 6 337 4 2
Mungindi 13/02/2009 3124 15 11490 12 3
Mungindi 27/02/2009 1519 44 15155 4 40
Mungindi 11/04/2009 48 13 381 4 9
Mungindi 23/04/2009 55 21 474 5 16
Mungindi 20/05/2009 57 9 273 3 6
Mungindi 28/05/2009 196 6 726 3 3
Mungindi 2/06/2009 1390 92 39273 6 86
Mungindi 1/09/2009 54 26 544 9 17
Mungindi 30/11/2009 23 3 27 1 2
Mungindi 7/12/2009 158 4 334 1 3
Mungindi 14/12/2009 84 6 272 2 4
Mungindi 19/12/2009 37 4 59 2 2
Mungindi 27/12/2009 152 2 208 1 1
Mungindi 30/12/2009 285 6 919 4 2
Mungindi 4/01/2010 1399 19 14803 13 6
Mungindi 22/01/2010 1351 16 10451 4 12
Mungindi 6/02/2010 231 10 1276 3 7
Mungindi 15/02/2010 86 6 224 2 4
Mungindi 20/02/2010 203 9 967 4 5

Observed Flows in the Barwon–Darling 1990-2017: A Hydrologic Investigation
Page 54
Site Event Start
Date
Peak Flow
(ML/d)
Event
Duration
(days)
Event
Volume (ML)
Rate of Rise
(days)
Rate of Fall
(days)
Mungindi 28/02/2010 9253 43 165509 22 21
Mungindi 11/04/2010 217 60 5129 13 47
Mungindi 21/06/2010 345 23 3892 3 20
Mungindi 13/07/2010 701 29 10087 20 9
Mungindi 10/08/2010 4166 33 63664 29 4
Mungindi 11/09/2010 14713 41 338365 32 9
Mungindi 21/10/2010 12336 29 209088 12 17
Mungindi 18/11/2010 3619 7 19842 3 4
Mungindi 24/11/2010 6665 21 104464 12 9
Mungindi 14/12/2010 27691 64 599499 44 20
Mungindi 15/02/2011 1405 18 14716 6 12
Mungindi 4/03/2011 374 9 1629 4 5
Mungindi 12/03/2011 426 5 1341 3 2
Mungindi 16/03/2011 709 10 4901 7 3
Mungindi 25/03/2011 1312 33 23784 9 24
Mungindi 26/04/2011 1008 11 6751 5 6
Mungindi 6/05/2011 466 12 3217 5 7
Mungindi 17/05/2011 252 10 1215 9 1
Mungindi 26/05/2011 424 12 2780 6 6
Mungindi 6/06/2011 99 5 405 3 2
Mungindi 10/06/2011 236 10 1436 5 5
Mungindi 21/06/2011 153 3 271 2 1
Mungindi 23/06/2011 1066 20 11476 6 14
Mungindi 12/07/2011 695 45 13957 5 40
Mungindi 25/08/2011 1820 26 21276 18 8
Mungindi 19/09/2011 1311 17 14394 4 13
Mungindi 5/10/2011 1322 21 19617 17 4

Observed Flows in the Barwon–Darling 1990-2017: A Hydrologic Investigation
Page 55
Site Event Start
Date
Peak Flow
(ML/d)
Event
Duration
(days)
Event
Volume (ML)
Rate of Rise
(days)
Rate of Fall
(days)
Mungindi 25/10/2011 1444 12 13862 6 6
Mungindi 5/11/2011 1414 18 16314 6 12
Mungindi 22/11/2011 11130 15 93706 9 6
Mungindi 6/12/2011 17836 35 358293 11 24
Mungindi 9/01/2012 766 12 4952 4 8
Mungindi 20/01/2012 17413 41 267447 20 21
Mungindi 29/02/2012 1629 22 17774 7 15
Mungindi 21/03/2012 193 8 1015 5 3
Mungindi 28/03/2012 194 12 1646 10 2
Mungindi 8/04/2012 265 7 944 3 4
Mungindi 16/04/2012 201 15 1673 6 9
Mungindi 30/04/2012 160 10 918 6 4
Mungindi 9/05/2012 152 11 1048 9 2
Mungindi 19/05/2012 258 10 1382 4 6
Mungindi 28/05/2012 98 6 500 3 3
Mungindi 2/06/2012 134 9 872 4 5
Mungindi 10/06/2012 102 5 276 2 3
Mungindi 16/06/2012 21 4 60 2 2
Mungindi 19/06/2012 130 8 567 6 2
Mungindi 26/06/2012 124 11 681 4 7
Mungindi 6/07/2012 1656 49 25599 21 28
Mungindi 23/08/2012 94 9 612 2 7
Mungindi 31/08/2012 239 17 2149 13 4
Mungindi 16/09/2012 132 5 417 3 2
Mungindi 22/09/2012 1 1 1 1 0
Mungindi 24/09/2012 17 2 27 1 1
Mungindi 25/09/2012 94 6 270 4 2

Observed Flows in the Barwon–Darling 1990-2017: A Hydrologic Investigation
Page 56
Site Event Start
Date
Peak Flow
(ML/d)
Event
Duration
(days)
Event
Volume (ML)
Rate of Rise
(days)
Rate of Fall
(days)
Mungindi 30/09/2012 127 7 361 3 4
Mungindi 6/10/2012 97 5 253 4 1
Mungindi 13/10/2012 98 7 395 2 5
Mungindi 23/10/2012 21 2 30 1 1
Mungindi 24/10/2012 139 12 986 6 6
Mungindi 4/11/2012 72 5 207 2 3
Mungindi 10/11/2012 56 5 156 2 3
Mungindi 14/11/2012 35 5 97 2 3
Mungindi 20/11/2012 81 5 196 4 1
Mungindi 24/11/2012 76 5 218 3 2
Mungindi 9/12/2012 120 4 268 3 1
Mungindi 15/12/2012 453 8 2089 4 4
Mungindi 22/12/2012 821 14 5732 10 4
Mungindi 4/01/2013 449 10 2936 4 6
Mungindi 16/01/2013 154 5 516 2 3
Mungindi 22/01/2013 511 6 1902 3 3
Mungindi 27/01/2013 379 5 1555 3 2
Mungindi 31/01/2013 34255 22 258140 9 13
Mungindi 21/02/2013 14098 107 281354 26 81
Mungindi 7/06/2013 922 27 11764 22 5
Mungindi 3/07/2013 1103 27 20125 10 17
Mungindi 29/07/2013 1431 31 19287 4 27
Mungindi 28/08/2013 613 39 9244 3 36
Mungindi 7/10/2013 113 10 699 5 5
Mungindi 16/10/2013 34 20 491 3 17
Mungindi 29/11/2013 139 6 460 2 4
Mungindi 4/12/2013 161 9 642 4 5
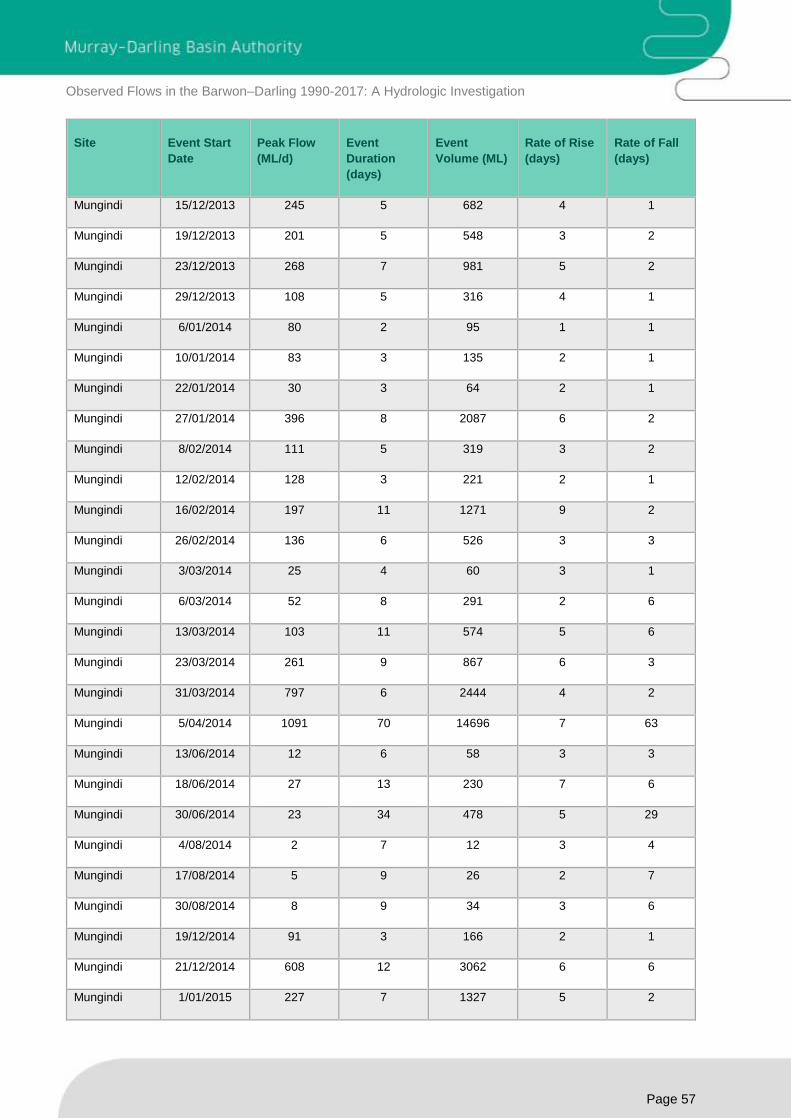
Observed Flows in the Barwon–Darling 1990-2017: A Hydrologic Investigation
Page 57
Site Event Start
Date
Peak Flow
(ML/d)
Event
Duration
(days)
Event
Volume (ML)
Rate of Rise
(days)
Rate of Fall
(days)
Mungindi 15/12/2013 245 5 682 4 1
Mungindi 19/12/2013 201 5 548 3 2
Mungindi 23/12/2013 268 7 981 5 2
Mungindi 29/12/2013 108 5 316 4 1
Mungindi 6/01/2014 80 2 95 1 1
Mungindi 10/01/2014 83 3 135 2 1
Mungindi 22/01/2014 30 3 64 2 1
Mungindi 27/01/2014 396 8 2087 6 2
Mungindi 8/02/2014 111 5 319 3 2
Mungindi 12/02/2014 128 3 221 2 1
Mungindi 16/02/2014 197 11 1271 9 2
Mungindi 26/02/2014 136 6 526 3 3
Mungindi 3/03/2014 25 4 60 3 1
Mungindi 6/03/2014 52 8 291 2 6
Mungindi 13/03/2014 103 11 574 5 6
Mungindi 23/03/2014 261 9 867 6 3
Mungindi 31/03/2014 797 6 2444 4 2
Mungindi 5/04/2014 1091 70 14696 7 63
Mungindi 13/06/2014 12 6 58 3 3
Mungindi 18/06/2014 27 13 230 7 6
Mungindi 30/06/2014 23 34 478 5 29
Mungindi 4/08/2014 2 7 12 3 4
Mungindi 17/08/2014 5 9 26 2 7
Mungindi 30/08/2014 8 9 34 3 6
Mungindi 19/12/2014 91 3 166 2 1
Mungindi 21/12/2014 608 12 3062 6 6
Mungindi 1/01/2015 227 7 1327 5 2
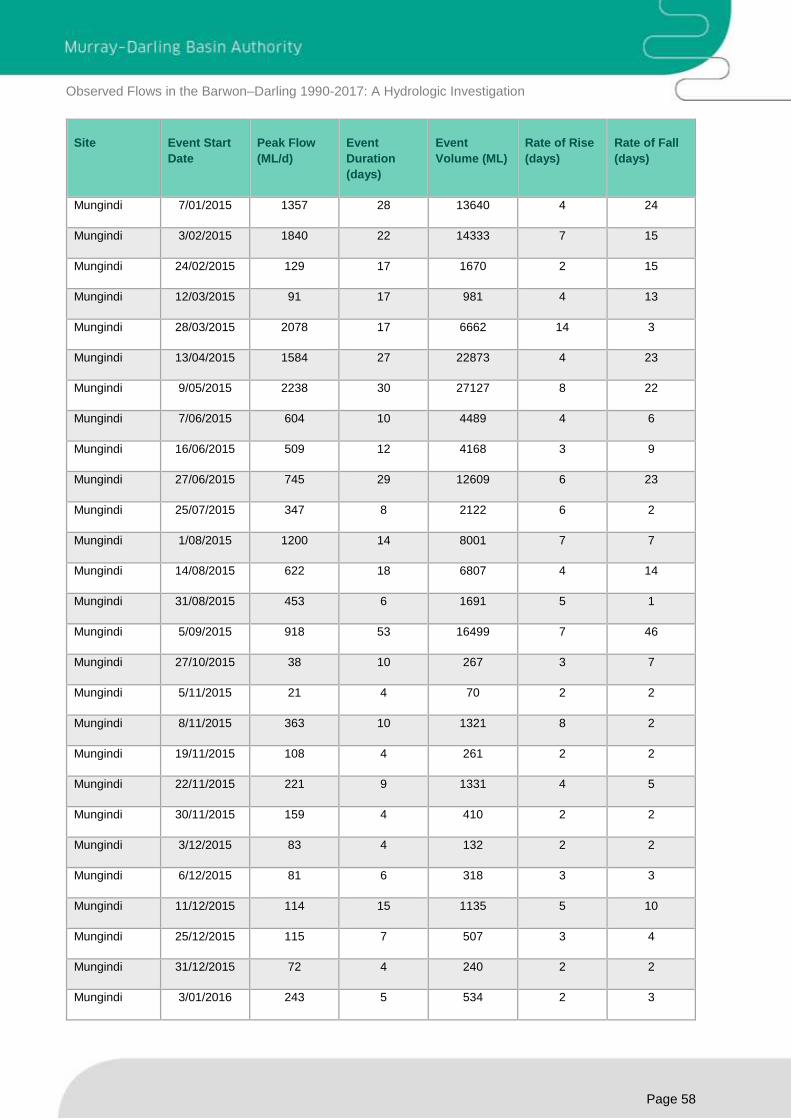
Observed Flows in the Barwon–Darling 1990-2017: A Hydrologic Investigation
Page 58
Site Event Start
Date
Peak Flow
(ML/d)
Event
Duration
(days)
Event
Volume (ML)
Rate of Rise
(days)
Rate of Fall
(days)
Mungindi 7/01/2015 1357 28 13640 4 24
Mungindi 3/02/2015 1840 22 14333 7 15
Mungindi 24/02/2015 129 17 1670 2 15
Mungindi 12/03/2015 91 17 981 4 13
Mungindi 28/03/2015 2078 17 6662 14 3
Mungindi 13/04/2015 1584 27 22873 4 23
Mungindi 9/05/2015 2238 30 27127 8 22
Mungindi 7/06/2015 604 10 4489 4 6
Mungindi 16/06/2015 509 12 4168 3 9
Mungindi 27/06/2015 745 29 12609 6 23
Mungindi 25/07/2015 347 8 2122 6 2
Mungindi 1/08/2015 1200 14 8001 7 7
Mungindi 14/08/2015 622 18 6807 4 14
Mungindi 31/08/2015 453 6 1691 5 1
Mungindi 5/09/2015 918 53 16499 7 46
Mungindi 27/10/2015 38 10 267 3 7
Mungindi 5/11/2015 21 4 70 2 2
Mungindi 8/11/2015 363 10 1321 8 2
Mungindi 19/11/2015 108 4 261 2 2
Mungindi 22/11/2015 221 9 1331 4 5
Mungindi 30/11/2015 159 4 410 2 2
Mungindi 3/12/2015 83 4 132 2 2
Mungindi 6/12/2015 81 6 318 3 3
Mungindi 11/12/2015 114 15 1135 5 10
Mungindi 25/12/2015 115 7 507 3 4
Mungindi 31/12/2015 72 4 240 2 2
Mungindi 3/01/2016 243 5 534 2 3

Observed Flows in the Barwon–Darling 1990-2017: A Hydrologic Investigation
Page 59
Site Event Start
Date
Peak Flow
(ML/d)
Event
Duration
(days)
Event
Volume (ML)
Rate of Rise
(days)
Rate of Fall
(days)
Mungindi 7/01/2016 686 8 3233 5 3
Mungindi 14/01/2016 653 9 3754 3 6
Mungindi 22/01/2016 390 5 1577 3 2
Mungindi 26/01/2016 909 6 3309 4 2
Mungindi 31/01/2016 775 7 3832 4 3
Mungindi 6/02/2016 1039 22 10533 5 17
Mungindi 27/02/2016 60 17 577 3 14
Mungindi 14/03/2016 111 8 461 6 2
Mungindi 21/03/2016 87 9 511 5 4
Mungindi 29/03/2016 105 28 1223 4 24
Mungindi 25/04/2016 29 12 219 9 3
Mungindi 6/05/2016 22 6 86 5 1
Mungindi 11/05/2016 20 13 120 4 9
Mungindi 4/06/2016 29 11 97 2 9
Mungindi 20/06/2016 39 17 171 1 16
Mungindi 6/07/2016 842 12 6529 4 8
Mungindi 17/07/2016 1296 30 21225 9 21
Mungindi 15/08/2016 864 20 10681 4 16
Mungindi 3/09/2016 343 6 1313 4 2
Mungindi 8/09/2016 1797 11 10822 8 3
Mungindi 18/09/2016 8778 42 185528 21 21
Mungindi 29/10/2016 3222 43 55284 6 37
Mungindi 10/12/2016 171 10 805 5 5
Mungindi 19/12/2016 302 17 2406 10 7
Mungindi 4/01/2017 29 4 80 3 1
Mungindi 11/01/2017 664 9 2752 4 5
Mungindi 19/01/2017 129 6 334 4 2
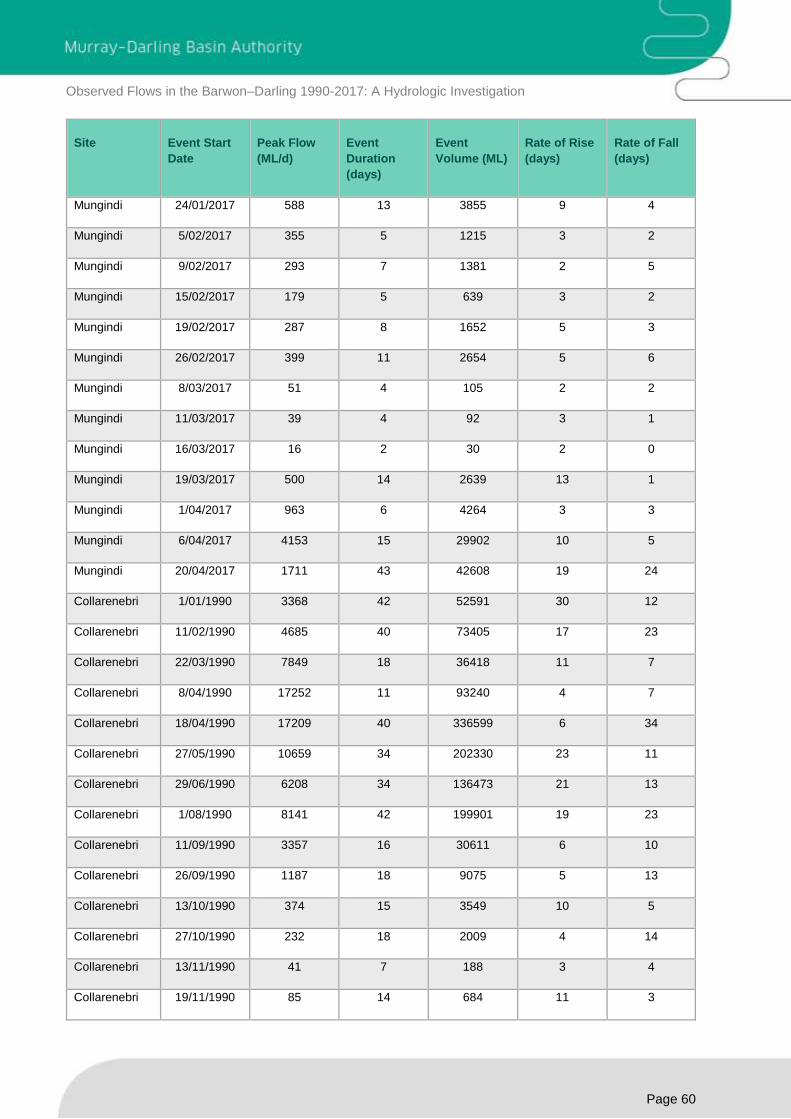
Observed Flows in the Barwon–Darling 1990-2017: A Hydrologic Investigation
Page 60
Site Event Start
Date
Peak Flow
(ML/d)
Event
Duration
(days)
Event
Volume (ML)
Rate of Rise
(days)
Rate of Fall
(days)
Mungindi 24/01/2017 588 13 3855 9 4
Mungindi 5/02/2017 355 5 1215 3 2
Mungindi 9/02/2017 293 7 1381 2 5
Mungindi 15/02/2017 179 5 639 3 2
Mungindi 19/02/2017 287 8 1652 5 3
Mungindi 26/02/2017 399 11 2654 5 6
Mungindi 8/03/2017 51 4 105 2 2
Mungindi 11/03/2017 39 4 92 3 1
Mungindi 16/03/2017 16 2 30 2 0
Mungindi 19/03/2017 500 14 2639 13 1
Mungindi 1/04/2017 963 6 4264 3 3
Mungindi 6/04/2017 4153 15 29902 10 5
Mungindi 20/04/2017 1711 43 42608 19 24
Collarenebri 1/01/1990 3368 42 52591 30 12
Collarenebri 11/02/1990 4685 40 73405 17 23
Collarenebri 22/03/1990 7849 18 36418 11 7
Collarenebri 8/04/1990 17252 11 93240 4 7
Collarenebri 18/04/1990 17209 40 336599 6 34
Collarenebri 27/05/1990 10659 34 202330 23 11
Collarenebri 29/06/1990 6208 34 136473 21 13
Collarenebri 1/08/1990 8141 42 199901 19 23
Collarenebri 11/09/1990 3357 16 30611 6 10
Collarenebri 26/09/1990 1187 18 9075 5 13
Collarenebri 13/10/1990 374 15 3549 10 5
Collarenebri 27/10/1990 232 18 2009 4 14
Collarenebri 13/11/1990 41 7 188 3 4
Collarenebri 19/11/1990 85 14 684 11 3
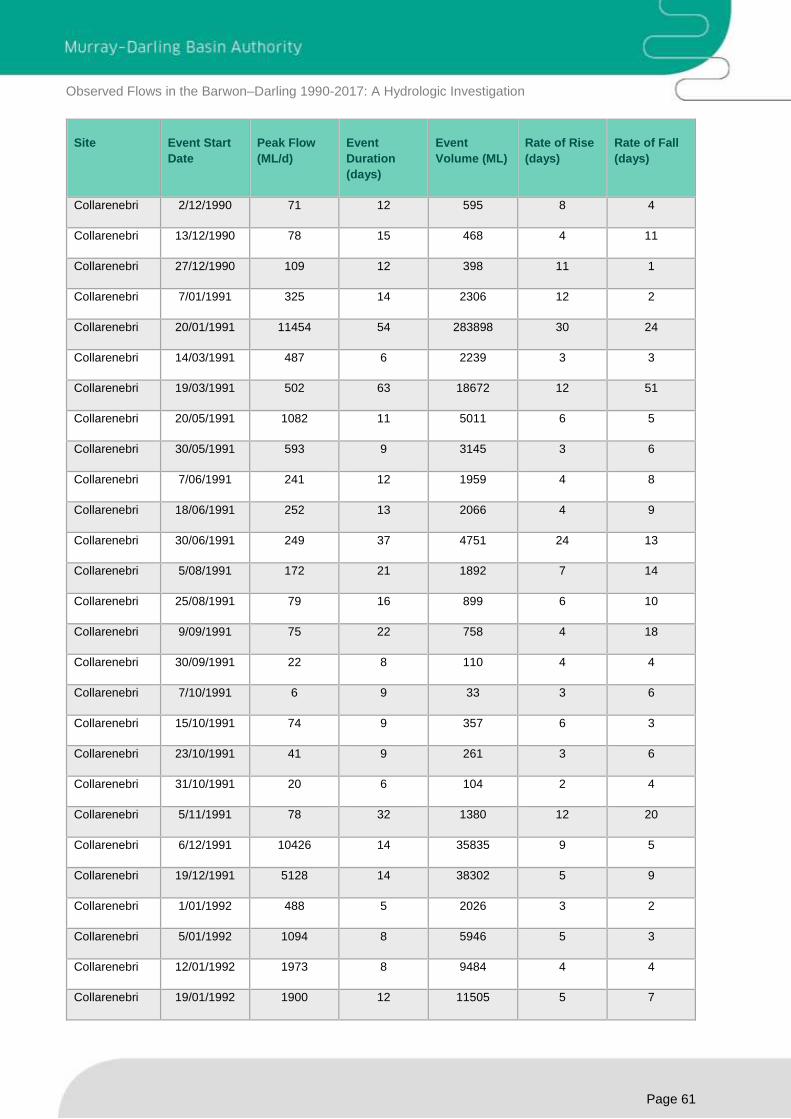
Observed Flows in the Barwon–Darling 1990-2017: A Hydrologic Investigation
Page 61
Site Event Start
Date
Peak Flow
(ML/d)
Event
Duration
(days)
Event
Volume (ML)
Rate of Rise
(days)
Rate of Fall
(days)
Collarenebri 2/12/1990 71 12 595 8 4
Collarenebri 13/12/1990 78 15 468 4 11
Collarenebri 27/12/1990 109 12 398 11 1
Collarenebri 7/01/1991 325 14 2306 12 2
Collarenebri 20/01/1991 11454 54 283898 30 24
Collarenebri 14/03/1991 487 6 2239 3 3
Collarenebri 19/03/1991 502 63 18672 12 51
Collarenebri 20/05/1991 1082 11 5011 6 5
Collarenebri 30/05/1991 593 9 3145 3 6
Collarenebri 7/06/1991 241 12 1959 4 8
Collarenebri 18/06/1991 252 13 2066 4 9
Collarenebri 30/06/1991 249 37 4751 24 13
Collarenebri 5/08/1991 172 21 1892 7 14
Collarenebri 25/08/1991 79 16 899 6 10
Collarenebri 9/09/1991 75 22 758 4 18
Collarenebri 30/09/1991 22 8 110 4 4
Collarenebri 7/10/1991 6 9 33 3 6
Collarenebri 15/10/1991 74 9 357 6 3
Collarenebri 23/10/1991 41 9 261 3 6
Collarenebri 31/10/1991 20 6 104 2 4
Collarenebri 5/11/1991 78 32 1380 12 20
Collarenebri 6/12/1991 10426 14 35835 9 5
Collarenebri 19/12/1991 5128 14 38302 5 9
Collarenebri 1/01/1992 488 5 2026 3 2
Collarenebri 5/01/1992 1094 8 5946 5 3
Collarenebri 12/01/1992 1973 8 9484 4 4
Collarenebri 19/01/1992 1900 12 11505 5 7

Observed Flows in the Barwon–Darling 1990-2017: A Hydrologic Investigation
Page 62
Site Event Start
Date
Peak Flow
(ML/d)
Event
Duration
(days)
Event
Volume (ML)
Rate of Rise
(days)
Rate of Fall
(days)
Collarenebri 30/01/1992 560 9 3883 6 3
Collarenebri 7/02/1992 4032 13 29513 7 6
Collarenebri 19/02/1992 7188 37 99850 13 24
Collarenebri 26/03/1992 273 12 2501 5 7
Collarenebri 6/04/1992 217 19 3031 8 11
Collarenebri 24/04/1992 157 19 2129 11 8
Collarenebri 12/05/1992 136 20 2067 11 9
Collarenebri 31/05/1992 323 19 3349 12 7
Collarenebri 18/06/1992 274 27 3173 4 23
Collarenebri 14/07/1992 170 24 2705 10 14
Collarenebri 6/08/1992 176 16 1948 9 7
Collarenebri 21/08/1992 496 13 2286 4 9
Collarenebri 2/09/1992 127 7 611 4 3
Collarenebri 8/09/1992 1211 22 13056 9 13
Collarenebri 29/09/1992 785 16 5551 3 13
Collarenebri 14/10/1992 271 14 1733 6 8
Collarenebri 27/10/1992 208 11 998 9 2
Collarenebri 6/11/1992 245 11 1131 3 8
Collarenebri 16/11/1992 106 16 876 7 9
Collarenebri 1/12/1992 236 6 854 3 3
Collarenebri 6/12/1992 702 12 4487 3 9
Collarenebri 17/12/1992 1241 13 7549 7 6
Collarenebri 29/12/1992 157 12 1126 5 7
Collarenebri 9/01/1993 65 17 674 7 10
Collarenebri 25/01/1993 1146 30 5255 4 26
Collarenebri 27/02/1993 123 4 307 3 1
Collarenebri 2/03/1993 128 15 579 3 12
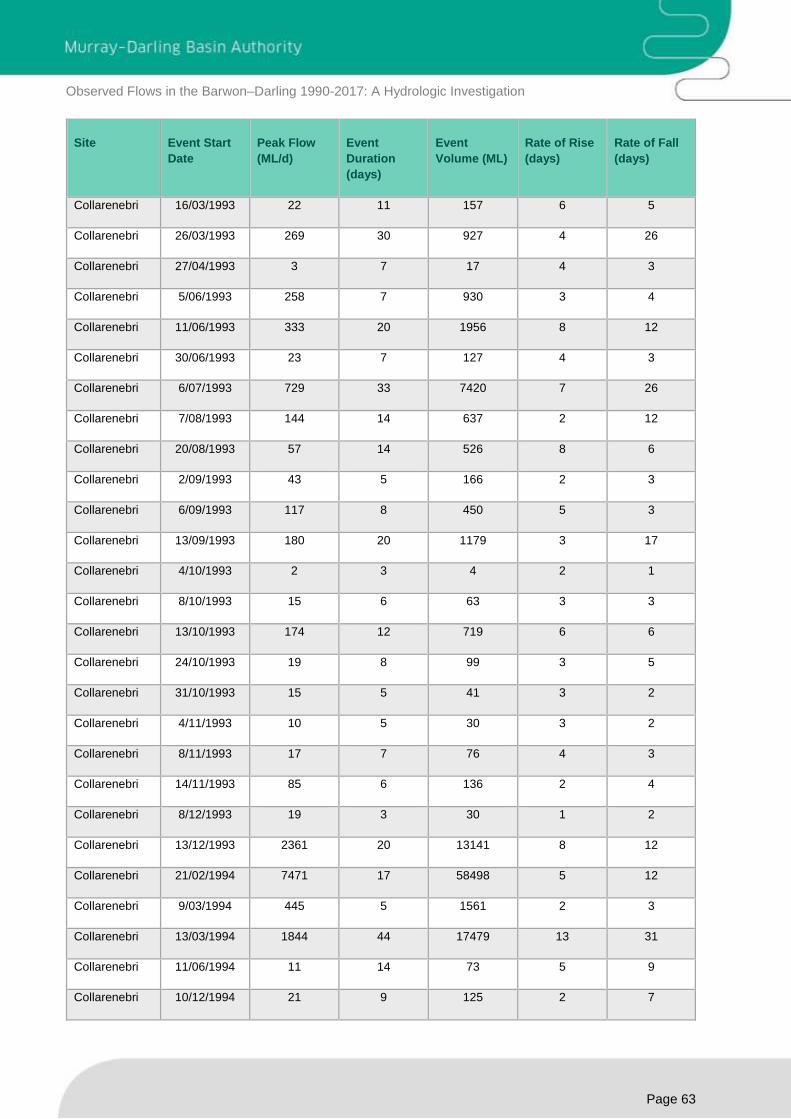
Observed Flows in the Barwon–Darling 1990-2017: A Hydrologic Investigation
Page 63
Site Event Start
Date
Peak Flow
(ML/d)
Event
Duration
(days)
Event
Volume (ML)
Rate of Rise
(days)
Rate of Fall
(days)
Collarenebri 16/03/1993 22 11 157 6 5
Collarenebri 26/03/1993 269 30 927 4 26
Collarenebri 27/04/1993 3 7 17 4 3
Collarenebri 5/06/1993 258 7 930 3 4
Collarenebri 11/06/1993 333 20 1956 8 12
Collarenebri 30/06/1993 23 7 127 4 3
Collarenebri 6/07/1993 729 33 7420 7 26
Collarenebri 7/08/1993 144 14 637 2 12
Collarenebri 20/08/1993 57 14 526 8 6
Collarenebri 2/09/1993 43 5 166 2 3
Collarenebri 6/09/1993 117 8 450 5 3
Collarenebri 13/09/1993 180 20 1179 3 17
Collarenebri 4/10/1993 2 3 4 2 1
Collarenebri 8/10/1993 15 6 63 3 3
Collarenebri 13/10/1993 174 12 719 6 6
Collarenebri 24/10/1993 19 8 99 3 5
Collarenebri 31/10/1993 15 5 41 3 2
Collarenebri 4/11/1993 10 5 30 3 2
Collarenebri 8/11/1993 17 7 76 4 3
Collarenebri 14/11/1993 85 6 136 2 4
Collarenebri 8/12/1993 19 3 30 1 2
Collarenebri 13/12/1993 2361 20 13141 8 12
Collarenebri 21/02/1994 7471 17 58498 5 12
Collarenebri 9/03/1994 445 5 1561 2 3
Collarenebri 13/03/1994 1844 44 17479 13 31
Collarenebri 11/06/1994 11 14 73 5 9
Collarenebri 10/12/1994 21 9 125 2 7
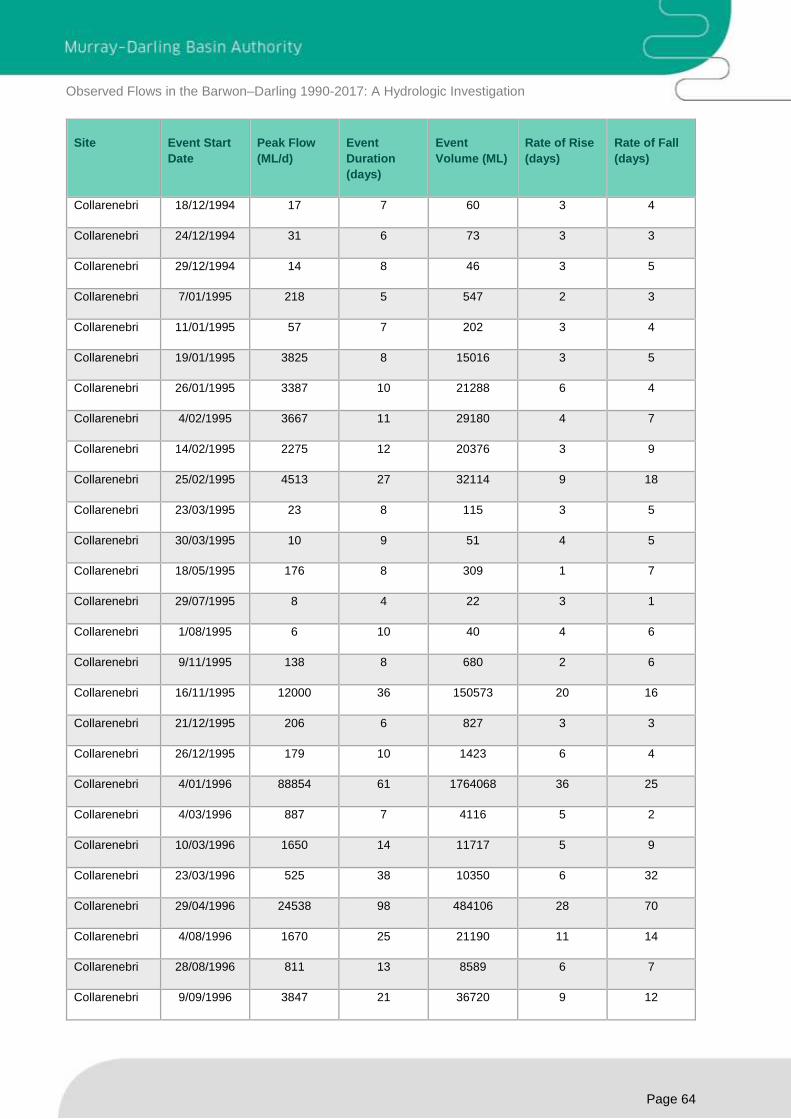
Observed Flows in the Barwon–Darling 1990-2017: A Hydrologic Investigation
Page 64
Site Event Start
Date
Peak Flow
(ML/d)
Event
Duration
(days)
Event
Volume (ML)
Rate of Rise
(days)
Rate of Fall
(days)
Collarenebri 18/12/1994 17 7 60 3 4
Collarenebri 24/12/1994 31 6 73 3 3
Collarenebri 29/12/1994 14 8 46 3 5
Collarenebri 7/01/1995 218 5 547 2 3
Collarenebri 11/01/1995 57 7 202 3 4
Collarenebri 19/01/1995 3825 8 15016 3 5
Collarenebri 26/01/1995 3387 10 21288 6 4
Collarenebri 4/02/1995 3667 11 29180 4 7
Collarenebri 14/02/1995 2275 12 20376 3 9
Collarenebri 25/02/1995 4513 27 32114 9 18
Collarenebri 23/03/1995 23 8 115 3 5
Collarenebri 30/03/1995 10 9 51 4 5
Collarenebri 18/05/1995 176 8 309 1 7
Collarenebri 29/07/1995 8 4 22 3 1
Collarenebri 1/08/1995 6 10 40 4 6
Collarenebri 9/11/1995 138 8 680 2 6
Collarenebri 16/11/1995 12000 36 150573 20 16
Collarenebri 21/12/1995 206 6 827 3 3
Collarenebri 26/12/1995 179 10 1423 6 4
Collarenebri 4/01/1996 88854 61 1764068 36 25
Collarenebri 4/03/1996 887 7 4116 5 2
Collarenebri 10/03/1996 1650 14 11717 5 9
Collarenebri 23/03/1996 525 38 10350 6 32
Collarenebri 29/04/1996 24538 98 484106 28 70
Collarenebri 4/08/1996 1670 25 21190 11 14
Collarenebri 28/08/1996 811 13 8589 6 7
Collarenebri 9/09/1996 3847 21 36720 9 12
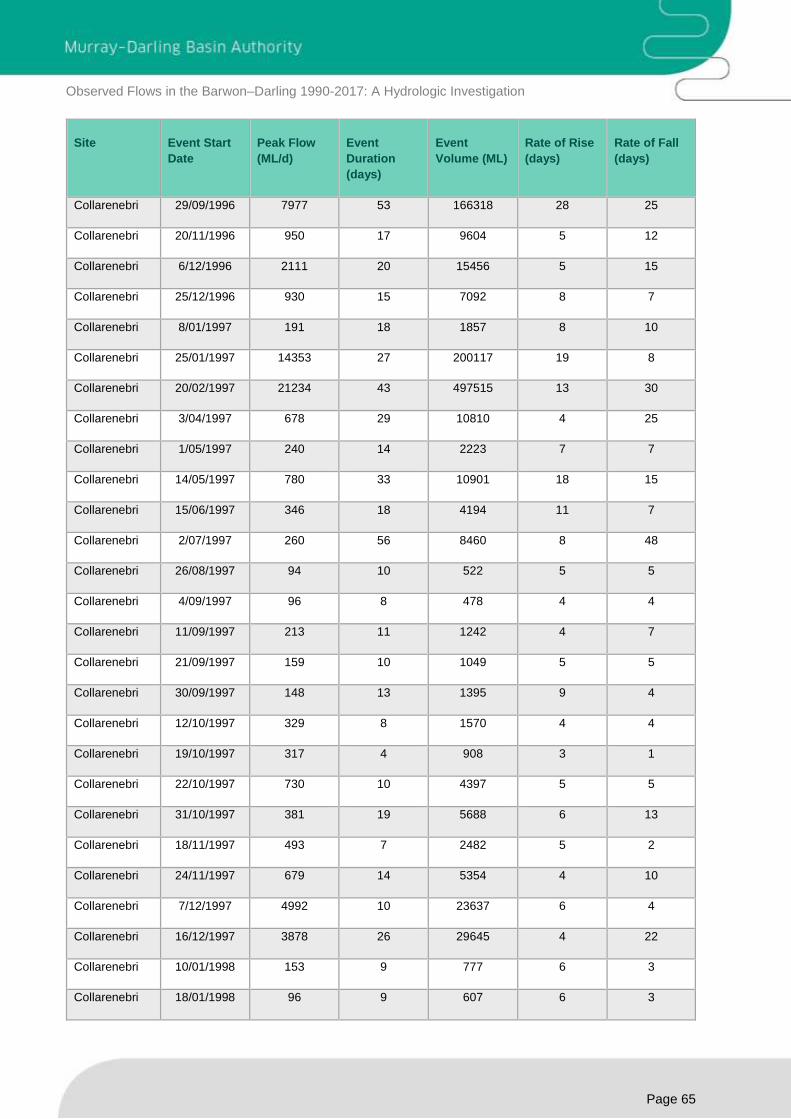
Observed Flows in the Barwon–Darling 1990-2017: A Hydrologic Investigation
Page 65
Site Event Start
Date
Peak Flow
(ML/d)
Event
Duration
(days)
Event
Volume (ML)
Rate of Rise
(days)
Rate of Fall
(days)
Collarenebri 29/09/1996 7977 53 166318 28 25
Collarenebri 20/11/1996 950 17 9604 5 12
Collarenebri 6/12/1996 2111 20 15456 5 15
Collarenebri 25/12/1996 930 15 7092 8 7
Collarenebri 8/01/1997 191 18 1857 8 10
Collarenebri 25/01/1997 14353 27 200117 19 8
Collarenebri 20/02/1997 21234 43 497515 13 30
Collarenebri 3/04/1997 678 29 10810 4 25
Collarenebri 1/05/1997 240 14 2223 7 7
Collarenebri 14/05/1997 780 33 10901 18 15
Collarenebri 15/06/1997 346 18 4194 11 7
Collarenebri 2/07/1997 260 56 8460 8 48
Collarenebri 26/08/1997 94 10 522 5 5
Collarenebri 4/09/1997 96 8 478 4 4
Collarenebri 11/09/1997 213 11 1242 4 7
Collarenebri 21/09/1997 159 10 1049 5 5
Collarenebri 30/09/1997 148 13 1395 9 4
Collarenebri 12/10/1997 329 8 1570 4 4
Collarenebri 19/10/1997 317 4 908 3 1
Collarenebri 22/10/1997 730 10 4397 5 5
Collarenebri 31/10/1997 381 19 5688 6 13
Collarenebri 18/11/1997 493 7 2482 5 2
Collarenebri 24/11/1997 679 14 5354 4 10
Collarenebri 7/12/1997 4992 10 23637 6 4
Collarenebri 16/12/1997 3878 26 29645 4 22
Collarenebri 10/01/1998 153 9 777 6 3
Collarenebri 18/01/1998 96 9 607 6 3

Observed Flows in the Barwon–Darling 1990-2017: A Hydrologic Investigation
Page 66
Site Event Start
Date
Peak Flow
(ML/d)
Event
Duration
(days)
Event
Volume (ML)
Rate of Rise
(days)
Rate of Fall
(days)
Collarenebri 26/01/1998 331 12 2130 7 5
Collarenebri 6/02/1998 818 13 6861 7 6
Collarenebri 18/02/1998 776 10 5587 5 5
Collarenebri 27/02/1998 641 23 6680 4 19
Collarenebri 21/03/1998 173 25 2505 7 18
Collarenebri 14/04/1998 360 25 2956 23 2
Collarenebri 8/05/1998 253 14 2922 3 11
Collarenebri 21/05/1998 307 8 1800 3 5
Collarenebri 28/05/1998 333 12 2682 4 8
Collarenebri 8/06/1998 224 19 2090 4 15
Collarenebri 26/06/1998 526 19 4195 10 9
Collarenebri 14/07/1998 1319 13 8734 10 3
Collarenebri 26/07/1998 37471 38 722163 23 15
Collarenebri 1/09/1998 118660 55 1934573 11 44
Collarenebri 25/10/1998 5599 31 99924 14 17
Collarenebri 24/11/1998 2143 14 19864 5 9
Collarenebri 7/12/1998 645 10 3971 3 7
Collarenebri 16/12/1998 556 8 2581 4 4
Collarenebri 23/12/1998 376 9 2293 4 5
Collarenebri 31/12/1998 695 24 7563 7 17
Collarenebri 23/01/1999 2762 21 21961 13 8
Collarenebri 12/02/1999 3062 14 23110 9 5
Collarenebri 25/02/1999 13654 40 265345 31 9
Collarenebri 5/04/1999 3158 12 21549 2 10
Collarenebri 16/04/1999 2008 46 33741 6 40
Collarenebri 31/05/1999 366 15 4376 11 4
Collarenebri 14/06/1999 790 15 6736 10 5

Observed Flows in the Barwon–Darling 1990-2017: A Hydrologic Investigation
Page 67
Site Event Start
Date
Peak Flow
(ML/d)
Event
Duration
(days)
Event
Volume (ML)
Rate of Rise
(days)
Rate of Fall
(days)
Collarenebri 28/06/1999 634 20 7816 5 15
Collarenebri 17/07/1999 443 29 8816 10 19
Collarenebri 14/08/1999 274 13 2717 8 5
Collarenebri 26/08/1999 302 15 3148 3 12
Collarenebri 9/09/1999 420 13 2997 4 9
Collarenebri 21/09/1999 311 12 2277 5 7
Collarenebri 2/10/1999 925 19 11431 6 13
Collarenebri 20/10/1999 8981 62 179294 43 19
Collarenebri 20/12/1999 460 8 2695 4 4
Collarenebri 27/12/1999 624 13 5949 10 3
Collarenebri 8/01/2000 1245 6 4296 3 3
Collarenebri 13/01/2000 1208 19 9160 5 14
Collarenebri 31/01/2000 287 12 2292 5 7
Collarenebri 11/02/2000 1517 20 16385 14 6
Collarenebri 1/03/2000 13958 22 55739 11 11
Collarenebri 22/03/2000 2524 44 28009 9 35
Collarenebri 4/05/2000 282 28 4082 4 24
Collarenebri 31/05/2000 351 35 6144 21 14
Collarenebri 4/07/2000 266 22 4331 10 12
Collarenebri 25/07/2000 193 30 4200 13 17
Collarenebri 23/08/2000 612 32 7623 17 15
Collarenebri 23/09/2000 205 7 1034 3 4
Collarenebri 29/09/2000 135 5 527 2 3
Collarenebri 3/10/2000 229 19 2527 13 6
Collarenebri 21/10/2000 782 10 4124 5 5
Collarenebri 30/10/2000 828 11 5960 8 3
Collarenebri 9/11/2000 21445 46 490623 22 24

Observed Flows in the Barwon–Darling 1990-2017: A Hydrologic Investigation
Page 68
Site Event Start
Date
Peak Flow
(ML/d)
Event
Duration
(days)
Event
Volume (ML)
Rate of Rise
(days)
Rate of Fall
(days)
Collarenebri 24/12/2000 900 10 5037 4 6
Collarenebri 2/01/2001 395 13 3419 7 6
Collarenebri 14/01/2001 256 8 1263 3 5
Collarenebri 21/01/2001 229 10 1491 4 6
Collarenebri 30/01/2001 33270 43 547457 13 30
Collarenebri 13/03/2001 5366 22 58614 18 4
Collarenebri 3/04/2001 6768 27 95722 13 14
Collarenebri 29/04/2001 1262 41 36121 5 36
Collarenebri 8/06/2001 667 45 17835 18 27
Collarenebri 22/07/2001 3392 31 49822 15 16
Collarenebri 21/08/2001 493 19 5385 5 14
Collarenebri 8/09/2001 481 17 5143 6 11
Collarenebri 24/09/2001 262 16 3477 7 9
Collarenebri 9/10/2001 218 9 1473 5 4
Collarenebri 17/10/2001 289 30 6381 10 20
Collarenebri 15/11/2001 291 18 3883 13 5
Collarenebri 2/12/2001 1746 23 18163 14 9
Collarenebri 24/12/2001 1040 10 5932 5 5
Collarenebri 2/01/2002 381 19 3192 3 16
Collarenebri 20/01/2002 73 7 424 4 3
Collarenebri 26/01/2002 394 10 2344 6 4
Collarenebri 4/02/2002 798 22 10623 7 15
Collarenebri 25/02/2002 875 14 7169 9 5
Collarenebri 10/03/2002 711 11 5190 4 7
Collarenebri 20/03/2002 329 10 2712 4 6
Collarenebri 29/03/2002 310 6 1286 2 4
Collarenebri 3/04/2002 1037 25 11699 11 14

Observed Flows in the Barwon–Darling 1990-2017: A Hydrologic Investigation
Page 69
Site Event Start
Date
Peak Flow
(ML/d)
Event
Duration
(days)
Event
Volume (ML)
Rate of Rise
(days)
Rate of Fall
(days)
Collarenebri 27/04/2002 349 6 1433 3 3
Collarenebri 2/05/2002 250 24 4577 5 19
Collarenebri 25/05/2002 181 34 4172 16 18
Collarenebri 27/06/2002 118 61 4436 5 56
Collarenebri 26/08/2002 40 21 549 11 10
Collarenebri 15/09/2002 175 13 1043 5 8
Collarenebri 27/09/2002 131 6 478 3 3
Collarenebri 2/10/2002 255 18 2555 8 10
Collarenebri 19/10/2002 95 8 558 4 4
Collarenebri 26/10/2002 95 22 729 3 19
Collarenebri 24/11/2002 21 11 165 6 5
Collarenebri 4/12/2002 61 7 216 4 3
Collarenebri 16/12/2002 31 5 65 1 4
Collarenebri 20/12/2002 315 25 2021 7 18
Collarenebri 22/01/2003 24 10 172 3 7
Collarenebri 3/02/2003 34 5 99 4 1
Collarenebri 7/02/2003 138 11 819 6 5
Collarenebri 17/02/2003 381 11 1943 7 4
Collarenebri 27/02/2003 5262 30 68158 14 16
Collarenebri 28/03/2003 1053 13 11503 10 3
Collarenebri 9/04/2003 1190 14 12988 7 7
Collarenebri 22/04/2003 1300 66 23951 9 57
Collarenebri 26/06/2003 305 50 8768 26 24
Collarenebri 14/08/2003 220 10 1704 6 4
Collarenebri 23/08/2003 277 39 2492 2 37
Collarenebri 30/09/2003 40 6 93 4 2
Collarenebri 5/10/2003 76 11 417 4 7
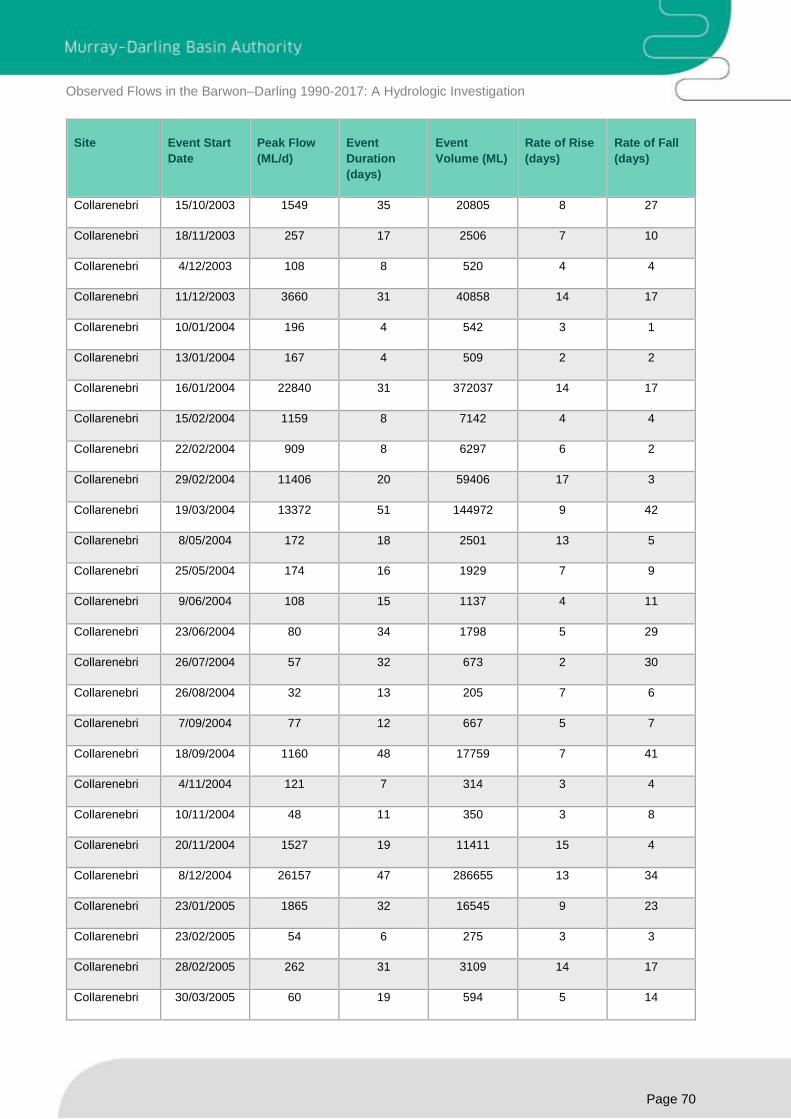
Observed Flows in the Barwon–Darling 1990-2017: A Hydrologic Investigation
Page 70
Site Event Start
Date
Peak Flow
(ML/d)
Event
Duration
(days)
Event
Volume (ML)
Rate of Rise
(days)
Rate of Fall
(days)
Collarenebri 15/10/2003 1549 35 20805 8 27
Collarenebri 18/11/2003 257 17 2506 7 10
Collarenebri 4/12/2003 108 8 520 4 4
Collarenebri 11/12/2003 3660 31 40858 14 17
Collarenebri 10/01/2004 196 4 542 3 1
Collarenebri 13/01/2004 167 4 509 2 2
Collarenebri 16/01/2004 22840 31 372037 14 17
Collarenebri 15/02/2004 1159 8 7142 4 4
Collarenebri 22/02/2004 909 8 6297 6 2
Collarenebri 29/02/2004 11406 20 59406 17 3
Collarenebri 19/03/2004 13372 51 144972 9 42
Collarenebri 8/05/2004 172 18 2501 13 5
Collarenebri 25/05/2004 174 16 1929 7 9
Collarenebri 9/06/2004 108 15 1137 4 11
Collarenebri 23/06/2004 80 34 1798 5 29
Collarenebri 26/07/2004 57 32 673 2 30
Collarenebri 26/08/2004 32 13 205 7 6
Collarenebri 7/09/2004 77 12 667 5 7
Collarenebri 18/09/2004 1160 48 17759 7 41
Collarenebri 4/11/2004 121 7 314 3 4
Collarenebri 10/11/2004 48 11 350 3 8
Collarenebri 20/11/2004 1527 19 11411 15 4
Collarenebri 8/12/2004 26157 47 286655 13 34
Collarenebri 23/01/2005 1865 32 16545 9 23
Collarenebri 23/02/2005 54 6 275 3 3
Collarenebri 28/02/2005 262 31 3109 14 17
Collarenebri 30/03/2005 60 19 594 5 14
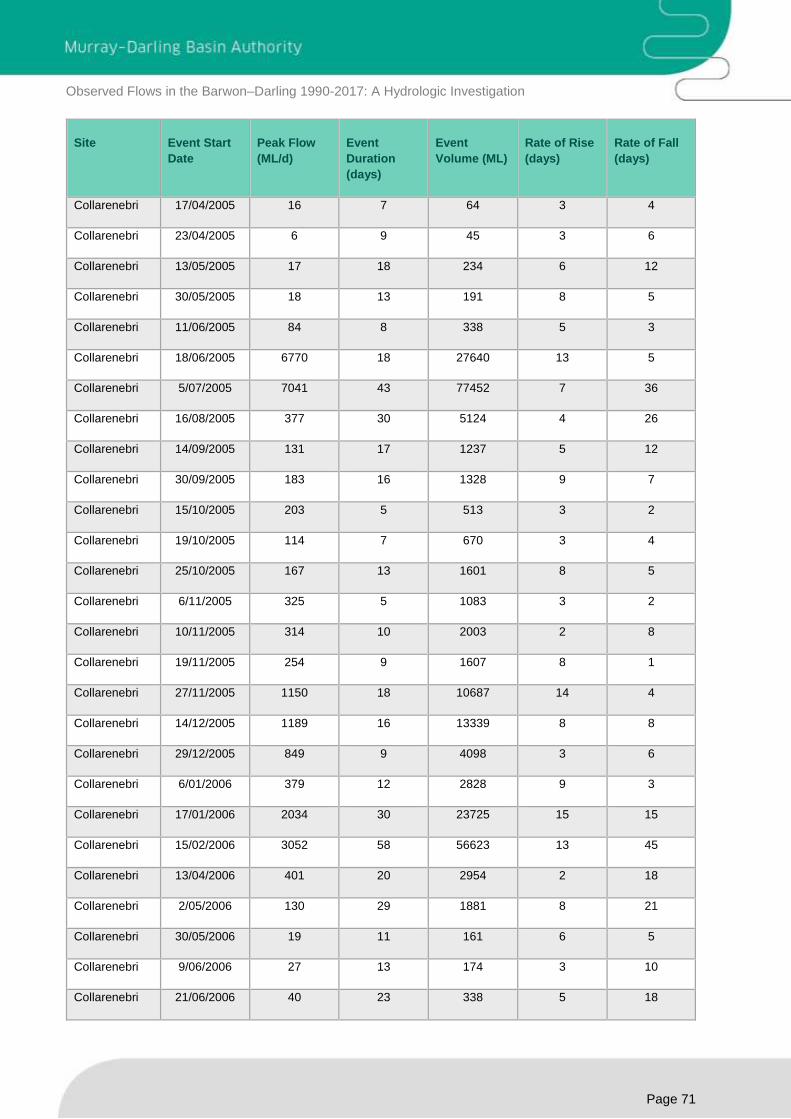
Observed Flows in the Barwon–Darling 1990-2017: A Hydrologic Investigation
Page 71
Site Event Start
Date
Peak Flow
(ML/d)
Event
Duration
(days)
Event
Volume (ML)
Rate of Rise
(days)
Rate of Fall
(days)
Collarenebri 17/04/2005 16 7 64 3 4
Collarenebri 23/04/2005 6 9 45 3 6
Collarenebri 13/05/2005 17 18 234 6 12
Collarenebri 30/05/2005 18 13 191 8 5
Collarenebri 11/06/2005 84 8 338 5 3
Collarenebri 18/06/2005 6770 18 27640 13 5
Collarenebri 5/07/2005 7041 43 77452 7 36
Collarenebri 16/08/2005 377 30 5124 4 26
Collarenebri 14/09/2005 131 17 1237 5 12
Collarenebri 30/09/2005 183 16 1328 9 7
Collarenebri 15/10/2005 203 5 513 3 2
Collarenebri 19/10/2005 114 7 670 3 4
Collarenebri 25/10/2005 167 13 1601 8 5
Collarenebri 6/11/2005 325 5 1083 3 2
Collarenebri 10/11/2005 314 10 2003 2 8
Collarenebri 19/11/2005 254 9 1607 8 1
Collarenebri 27/11/2005 1150 18 10687 14 4
Collarenebri 14/12/2005 1189 16 13339 8 8
Collarenebri 29/12/2005 849 9 4098 3 6
Collarenebri 6/01/2006 379 12 2828 9 3
Collarenebri 17/01/2006 2034 30 23725 15 15
Collarenebri 15/02/2006 3052 58 56623 13 45
Collarenebri 13/04/2006 401 20 2954 2 18
Collarenebri 2/05/2006 130 29 1881 8 21
Collarenebri 30/05/2006 19 11 161 6 5
Collarenebri 9/06/2006 27 13 174 3 10
Collarenebri 21/06/2006 40 23 338 5 18

Observed Flows in the Barwon–Darling 1990-2017: A Hydrologic Investigation
Page 72
Site Event Start
Date
Peak Flow
(ML/d)
Event
Duration
(days)
Event
Volume (ML)
Rate of Rise
(days)
Rate of Fall
(days)
Collarenebri 13/07/2006 69 12 404 4 8
Collarenebri 24/07/2006 116 5 313 2 3
Collarenebri 28/07/2006 85 40 1342 3 37
Collarenebri 12/09/2006 6 7 29 3 4
Collarenebri 22/09/2006 61 9 278 4 5
Collarenebri 30/09/2006 32 7 124 3 4
Collarenebri 6/10/2006 54 15 383 6 9
Collarenebri 20/10/2006 48 15 326 6 9
Collarenebri 3/11/2006 194 8 724 3 5
Collarenebri 10/11/2006 159 10 1067 6 4
Collarenebri 19/11/2006 408 19 2966 3 16
Collarenebri 7/12/2006 197 11 901 9 2
Collarenebri 17/12/2006 575 11 4800 7 4
Collarenebri 27/12/2006 422 11 2718 4 7
Collarenebri 6/01/2007 167 10 953 4 6
Collarenebri 15/01/2007 110 13 928 5 8
Collarenebri 27/01/2007 127 11 847 6 5
Collarenebri 6/02/2007 104 7 567 3 4
Collarenebri 12/02/2007 98 11 731 3 8
Collarenebri 22/02/2007 1633 15 6210 4 11
Collarenebri 8/03/2007 264 5 821 3 2
Collarenebri 12/03/2007 450 9 2290 4 5
Collarenebri 20/03/2007 271 33 3820 4 29
Collarenebri 19/05/2007 3 2 5 1 1
Collarenebri 24/05/2007 32 10 130 4 6
Collarenebri 2/06/2007 115 24 1159 3 21
Collarenebri 25/06/2007 1299 72 23825 22 50
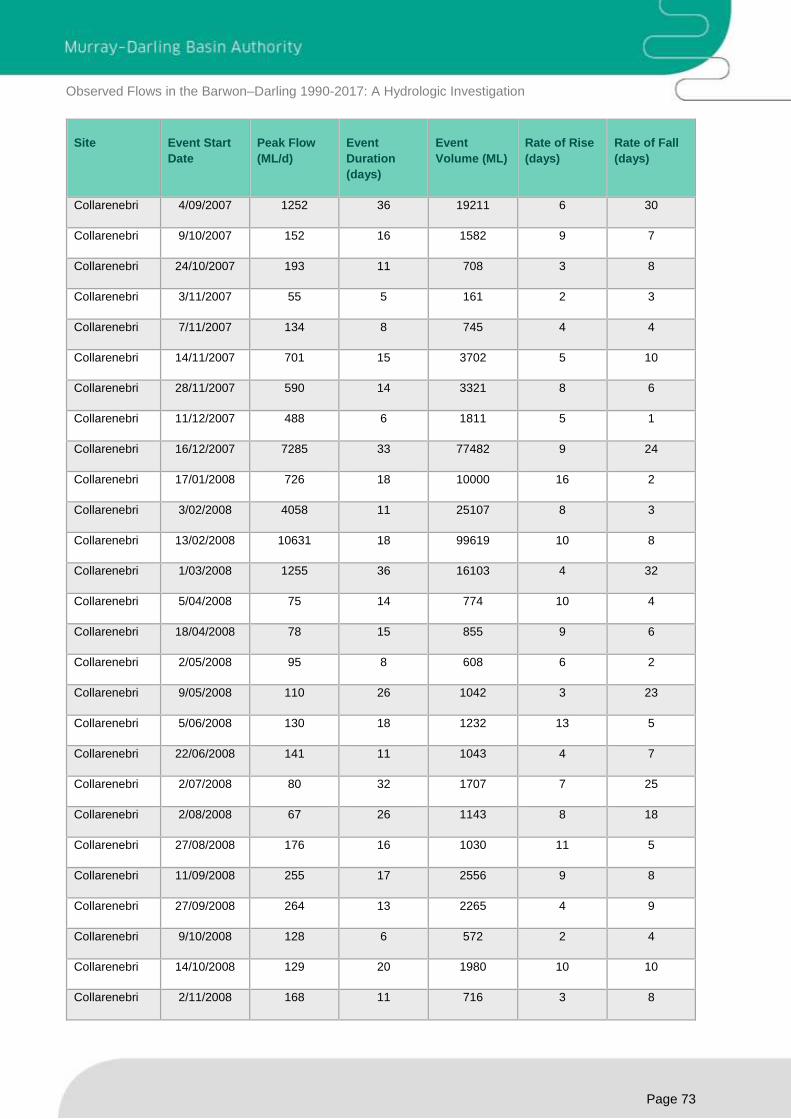
Observed Flows in the Barwon–Darling 1990-2017: A Hydrologic Investigation
Page 73
Site Event Start
Date
Peak Flow
(ML/d)
Event
Duration
(days)
Event
Volume (ML)
Rate of Rise
(days)
Rate of Fall
(days)
Collarenebri 4/09/2007 1252 36 19211 6 30
Collarenebri 9/10/2007 152 16 1582 9 7
Collarenebri 24/10/2007 193 11 708 3 8
Collarenebri 3/11/2007 55 5 161 2 3
Collarenebri 7/11/2007 134 8 745 4 4
Collarenebri 14/11/2007 701 15 3702 5 10
Collarenebri 28/11/2007 590 14 3321 8 6
Collarenebri 11/12/2007 488 6 1811 5 1
Collarenebri 16/12/2007 7285 33 77482 9 24
Collarenebri 17/01/2008 726 18 10000 16 2
Collarenebri 3/02/2008 4058 11 25107 8 3
Collarenebri 13/02/2008 10631 18 99619 10 8
Collarenebri 1/03/2008 1255 36 16103 4 32
Collarenebri 5/04/2008 75 14 774 10 4
Collarenebri 18/04/2008 78 15 855 9 6
Collarenebri 2/05/2008 95 8 608 6 2
Collarenebri 9/05/2008 110 26 1042 3 23
Collarenebri 5/06/2008 130 18 1232 13 5
Collarenebri 22/06/2008 141 11 1043 4 7
Collarenebri 2/07/2008 80 32 1707 7 25
Collarenebri 2/08/2008 67 26 1143 8 18
Collarenebri 27/08/2008 176 16 1030 11 5
Collarenebri 11/09/2008 255 17 2556 9 8
Collarenebri 27/09/2008 264 13 2265 4 9
Collarenebri 9/10/2008 128 6 572 2 4
Collarenebri 14/10/2008 129 20 1980 10 10
Collarenebri 2/11/2008 168 11 716 3 8
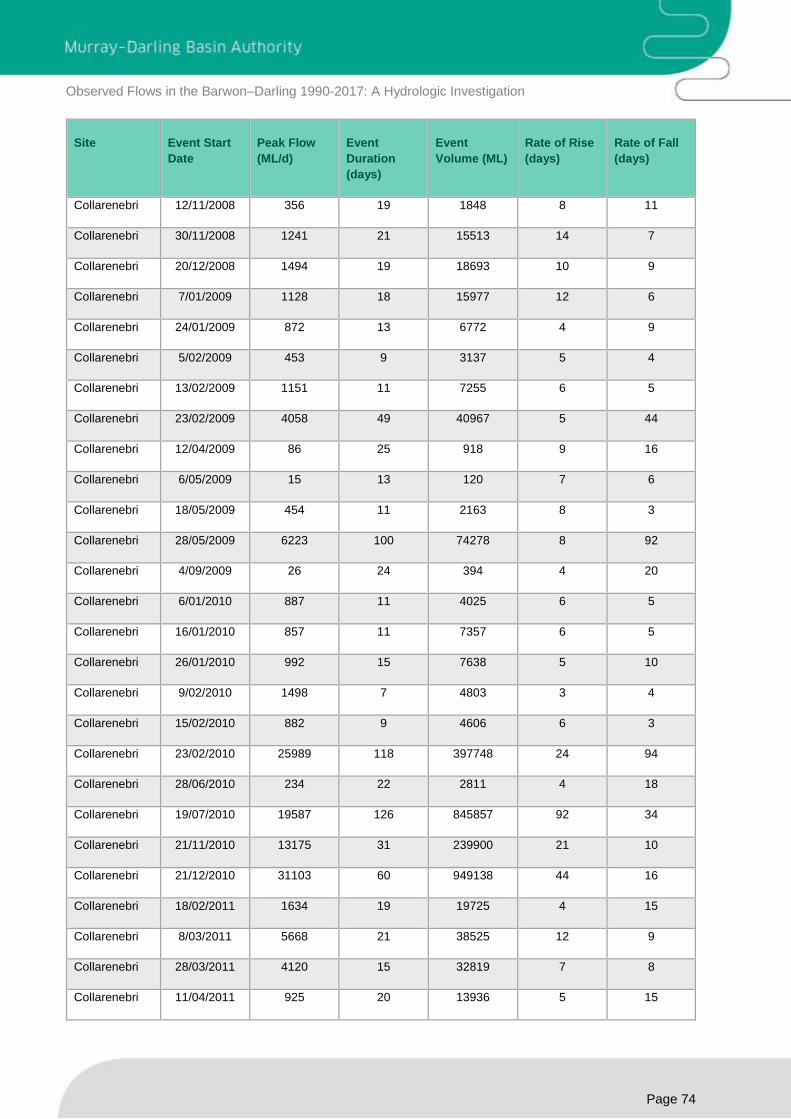
Observed Flows in the Barwon–Darling 1990-2017: A Hydrologic Investigation
Page 74
Site Event Start
Date
Peak Flow
(ML/d)
Event
Duration
(days)
Event
Volume (ML)
Rate of Rise
(days)
Rate of Fall
(days)
Collarenebri 12/11/2008 356 19 1848 8 11
Collarenebri 30/11/2008 1241 21 15513 14 7
Collarenebri 20/12/2008 1494 19 18693 10 9
Collarenebri 7/01/2009 1128 18 15977 12 6
Collarenebri 24/01/2009 872 13 6772 4 9
Collarenebri 5/02/2009 453 9 3137 5 4
Collarenebri 13/02/2009 1151 11 7255 6 5
Collarenebri 23/02/2009 4058 49 40967 5 44
Collarenebri 12/04/2009 86 25 918 9 16
Collarenebri 6/05/2009 15 13 120 7 6
Collarenebri 18/05/2009 454 11 2163 8 3
Collarenebri 28/05/2009 6223 100 74278 8 92
Collarenebri 4/09/2009 26 24 394 4 20
Collarenebri 6/01/2010 887 11 4025 6 5
Collarenebri 16/01/2010 857 11 7357 6 5
Collarenebri 26/01/2010 992 15 7638 5 10
Collarenebri 9/02/2010 1498 7 4803 3 4
Collarenebri 15/02/2010 882 9 4606 6 3
Collarenebri 23/02/2010 25989 118 397748 24 94
Collarenebri 28/06/2010 234 22 2811 4 18
Collarenebri 19/07/2010 19587 126 845857 92 34
Collarenebri 21/11/2010 13175 31 239900 21 10
Collarenebri 21/12/2010 31103 60 949138 44 16
Collarenebri 18/02/2011 1634 19 19725 4 15
Collarenebri 8/03/2011 5668 21 38525 12 9
Collarenebri 28/03/2011 4120 15 32819 7 8
Collarenebri 11/04/2011 925 20 13936 5 15

Observed Flows in the Barwon–Darling 1990-2017: A Hydrologic Investigation
Page 75
Site Event Start
Date
Peak Flow
(ML/d)
Event
Duration
(days)
Event
Volume (ML)
Rate of Rise
(days)
Rate of Fall
(days)
Collarenebri 30/04/2011 1006 11 7545 4 7
Collarenebri 10/05/2011 495 23 5754 5 18
Collarenebri 1/06/2011 295 13 2028 4 9
Collarenebri 13/06/2011 153 14 1399 6 8
Collarenebri 26/06/2011 1164 20 11832 7 13
Collarenebri 15/07/2011 707 44 13110 6 38
Collarenebri 27/08/2011 82 4 247 2 2
Collarenebri 30/08/2011 1557 24 18587 16 8
Collarenebri 22/09/2011 1534 19 19847 9 10
Collarenebri 10/10/2011 1574 20 22473 10 10
Collarenebri 29/10/2011 1565 12 15197 5 7
Collarenebri 9/11/2011 1392 14 14167 6 8
Collarenebri 22/11/2011 61718 20 502123 15 5
Collarenebri 11/12/2011 58192 42 1126350 8 34
Collarenebri 21/01/2012 155025 79 1781152 22 57
Collarenebri 8/04/2012 329 13 3523 7 6
Collarenebri 20/04/2012 331 13 3541 6 7
Collarenebri 2/05/2012 547 32 10171 25 7
Collarenebri 2/06/2012 347 19 4883 5 14
Collarenebri 20/06/2012 4233 82 103675 36 46
Collarenebri 9/09/2012 407 23 4686 7 16
Collarenebri 1/10/2012 366 26 3871 11 15
Collarenebri 26/10/2012 65 5 247 3 2
Collarenebri 30/10/2012 201 30 3823 15 15
Collarenebri 28/11/2012 379 16 3580 14 2
Collarenebri 13/12/2012 959 16 6635 7 9
Collarenebri 28/12/2012 439 12 3564 7 5

Observed Flows in the Barwon–Darling 1990-2017: A Hydrologic Investigation
Page 76
Site Event Start
Date
Peak Flow
(ML/d)
Event
Duration
(days)
Event
Volume (ML)
Rate of Rise
(days)
Rate of Fall
(days)
Collarenebri 8/01/2013 339 14 2667 3 11
Collarenebri 21/01/2013 516 11 2157 8 3
Collarenebri 31/01/2013 34535 28 360381 17 11
Collarenebri 27/02/2013 17591 100 461718 25 75
Collarenebri 6/06/2013 1210 32 18215 27 5
Collarenebri 7/07/2013 1522 26 27913 9 17
Collarenebri 1/08/2013 1965 32 30200 6 26
Collarenebri 1/09/2013 637 32 8807 3 29
Collarenebri 2/10/2013 105 9 702 3 6
Collarenebri 10/10/2013 65 5 243 3 2
Collarenebri 14/10/2013 80 17 842 5 12
Collarenebri 30/10/2013 834 27 9268 10 17
Collarenebri 25/11/2013 102 5 380 3 2
Collarenebri 29/11/2013 106 7 549 3 4
Collarenebri 5/12/2013 139 17 1635 9 8
Collarenebri 21/12/2013 71 5 284 3 2
Collarenebri 25/12/2013 82 6 377 4 2
Collarenebri 30/12/2013 113 18 665 3 15
Collarenebri 23/01/2014 205 11 1475 4 7
Collarenebri 2/02/2014 285 17 2211 5 12
Collarenebri 18/02/2014 207 22 2489 15 7
Collarenebri 11/03/2014 76 11 615 6 5
Collarenebri 21/03/2014 6286 16 31232 10 6
Collarenebri 5/04/2014 3268 54 28761 5 49
Collarenebri 28/05/2014 57 81 2772 6 75
Collarenebri 16/08/2014 30 22 297 2 20
Collarenebri 12/10/2014 916 20 10433 6 14
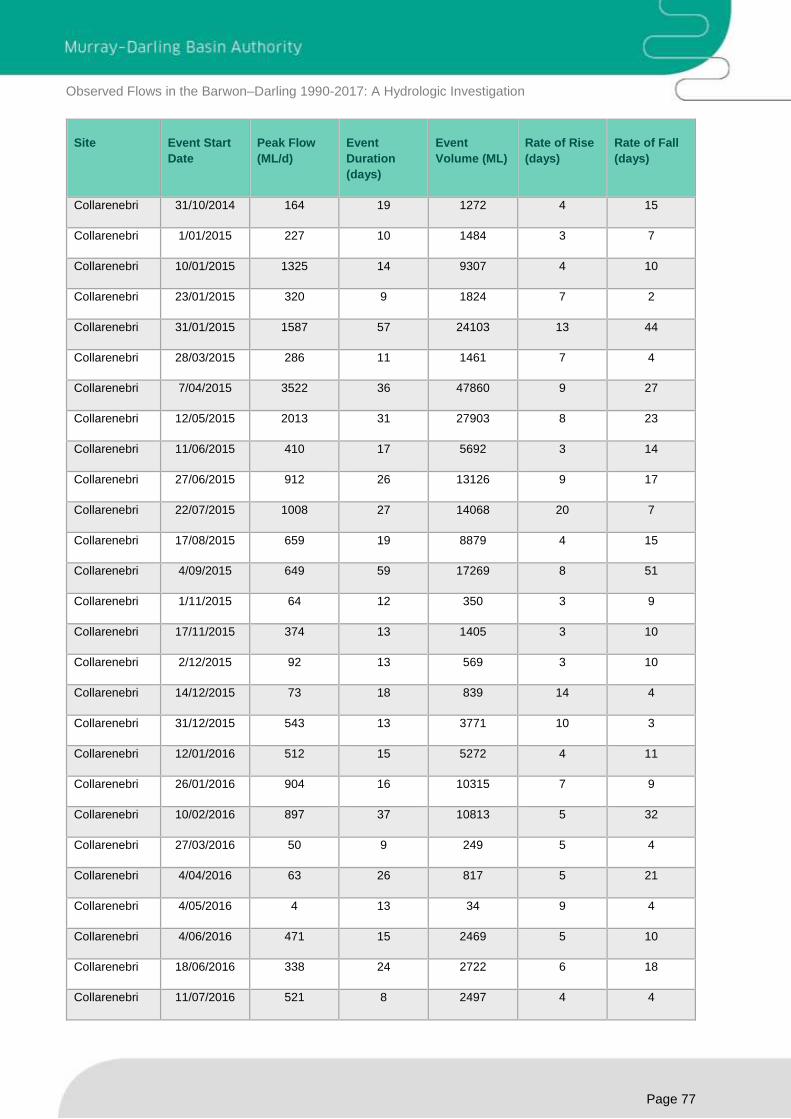
Observed Flows in the Barwon–Darling 1990-2017: A Hydrologic Investigation
Page 77
Site Event Start
Date
Peak Flow
(ML/d)
Event
Duration
(days)
Event
Volume (ML)
Rate of Rise
(days)
Rate of Fall
(days)
Collarenebri 31/10/2014 164 19 1272 4 15
Collarenebri 1/01/2015 227 10 1484 3 7
Collarenebri 10/01/2015 1325 14 9307 4 10
Collarenebri 23/01/2015 320 9 1824 7 2
Collarenebri 31/01/2015 1587 57 24103 13 44
Collarenebri 28/03/2015 286 11 1461 7 4
Collarenebri 7/04/2015 3522 36 47860 9 27
Collarenebri 12/05/2015 2013 31 27903 8 23
Collarenebri 11/06/2015 410 17 5692 3 14
Collarenebri 27/06/2015 912 26 13126 9 17
Collarenebri 22/07/2015 1008 27 14068 20 7
Collarenebri 17/08/2015 659 19 8879 4 15
Collarenebri 4/09/2015 649 59 17269 8 51
Collarenebri 1/11/2015 64 12 350 3 9
Collarenebri 17/11/2015 374 13 1405 3 10
Collarenebri 2/12/2015 92 13 569 3 10
Collarenebri 14/12/2015 73 18 839 14 4
Collarenebri 31/12/2015 543 13 3771 10 3
Collarenebri 12/01/2016 512 15 5272 4 11
Collarenebri 26/01/2016 904 16 10315 7 9
Collarenebri 10/02/2016 897 37 10813 5 32
Collarenebri 27/03/2016 50 9 249 5 4
Collarenebri 4/04/2016 63 26 817 5 21
Collarenebri 4/05/2016 4 13 34 9 4
Collarenebri 4/06/2016 471 15 2469 5 10
Collarenebri 18/06/2016 338 24 2722 6 18
Collarenebri 11/07/2016 521 8 2497 4 4
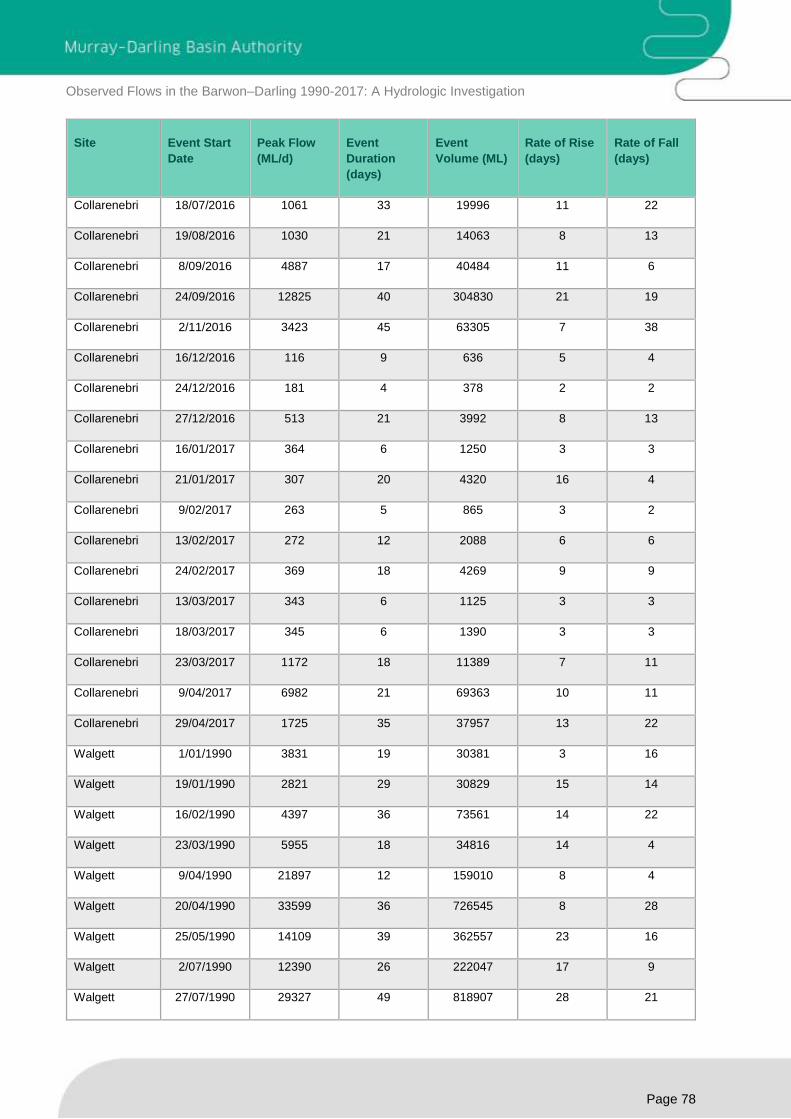
Observed Flows in the Barwon–Darling 1990-2017: A Hydrologic Investigation
Page 78
Site Event Start
Date
Peak Flow
(ML/d)
Event
Duration
(days)
Event
Volume (ML)
Rate of Rise
(days)
Rate of Fall
(days)
Collarenebri 18/07/2016 1061 33 19996 11 22
Collarenebri 19/08/2016 1030 21 14063 8 13
Collarenebri 8/09/2016 4887 17 40484 11 6
Collarenebri 24/09/2016 12825 40 304830 21 19
Collarenebri 2/11/2016 3423 45 63305 7 38
Collarenebri 16/12/2016 116 9 636 5 4
Collarenebri 24/12/2016 181 4 378 2 2
Collarenebri 27/12/2016 513 21 3992 8 13
Collarenebri 16/01/2017 364 6 1250 3 3
Collarenebri 21/01/2017 307 20 4320 16 4
Collarenebri 9/02/2017 263 5 865 3 2
Collarenebri 13/02/2017 272 12 2088 6 6
Collarenebri 24/02/2017 369 18 4269 9 9
Collarenebri 13/03/2017 343 6 1125 3 3
Collarenebri 18/03/2017 345 6 1390 3 3
Collarenebri 23/03/2017 1172 18 11389 7 11
Collarenebri 9/04/2017 6982 21 69363 10 11
Collarenebri 29/04/2017 1725 35 37957 13 22
Walgett 1/01/1990 3831 19 30381 3 16
Walgett 19/01/1990 2821 29 30829 15 14
Walgett 16/02/1990 4397 36 73561 14 22
Walgett 23/03/1990 5955 18 34816 14 4
Walgett 9/04/1990 21897 12 159010 8 4
Walgett 20/04/1990 33599 36 726545 8 28
Walgett 25/05/1990 14109 39 362557 23 16
Walgett 2/07/1990 12390 26 222047 17 9
Walgett 27/07/1990 29327 49 818907 28 21

Observed Flows in the Barwon–Darling 1990-2017: A Hydrologic Investigation
Page 79
Site Event Start
Date
Peak Flow
(ML/d)
Event
Duration
(days)
Event
Volume (ML)
Rate of Rise
(days)
Rate of Fall
(days)
Walgett 13/09/1990 14664 33 276592 7 26
Walgett 15/10/1990 2103 17 27866 7 10
Walgett 31/10/1990 1450 27 20792 5 22
Walgett 26/11/1990 326 10 2472 3 7
Walgett 5/12/1990 266 10 1902 4 6
Walgett 14/12/1990 194 20 2076 7 13
Walgett 2/01/1991 1482 21 13502 13 8
Walgett 22/01/1991 1381 10 9683 7 3
Walgett 31/01/1991 18011 46 443282 19 27
Walgett 17/03/1991 625 8 3919 4 4
Walgett 24/03/1991 613 38 16628 10 28
Walgett 30/04/1991 360 21 6079 6 15
Walgett 20/05/1991 16108 24 174421 18 6
Walgett 12/06/1991 18876 32 226336 13 19
Walgett 13/07/1991 11153 30 141910 14 16
Walgett 11/08/1991 1544 30 19076 4 26
Walgett 9/09/1991 483 41 10609 24 17
Walgett 19/10/1991 292 24 4574 13 11
Walgett 11/11/1991 520 30 10660 19 11
Walgett 10/12/1991 28568 31 356312 12 19
Walgett 9/01/1992 1675 14 16777 9 5
Walgett 22/01/1992 1667 11 11858 6 5
Walgett 1/02/1992 12773 58 250850 28 30
Walgett 29/03/1992 555 70 19488 6 64
Walgett 6/06/1992 312 36 7294 21 15
Walgett 11/07/1992 634 67 15647 49 18
Walgett 15/09/1992 1183 18 12413 6 12
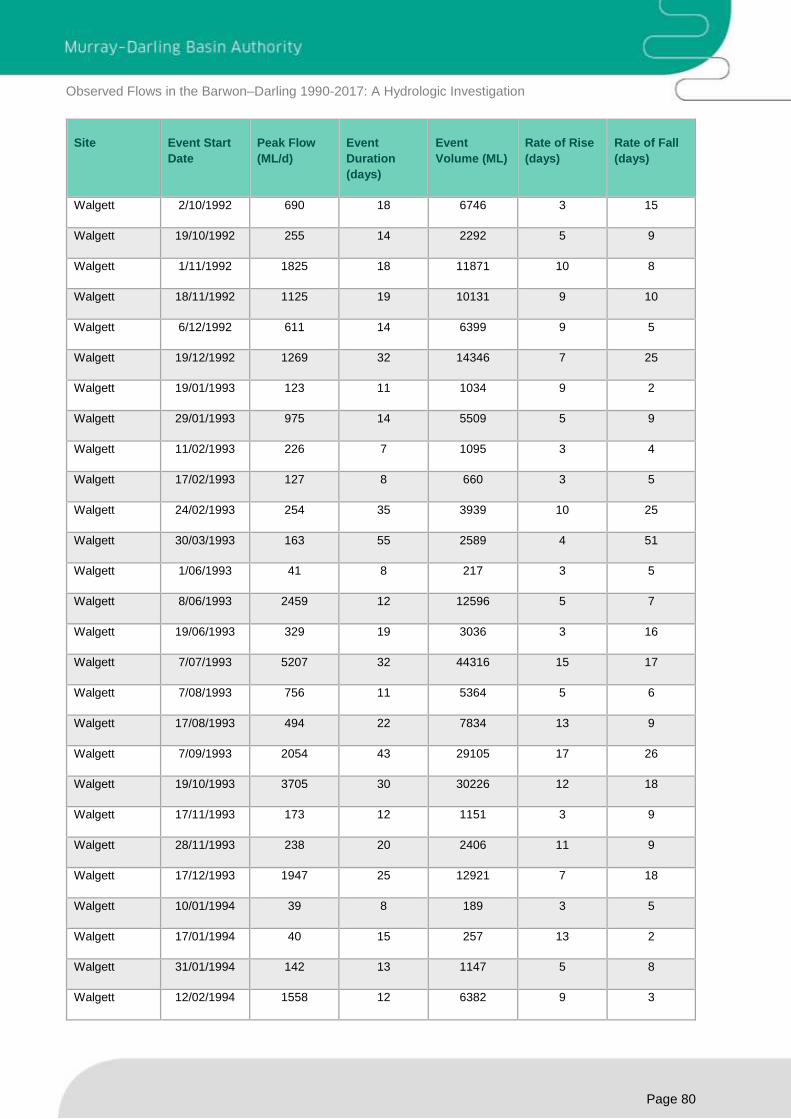
Observed Flows in the Barwon–Darling 1990-2017: A Hydrologic Investigation
Page 80
Site Event Start
Date
Peak Flow
(ML/d)
Event
Duration
(days)
Event
Volume (ML)
Rate of Rise
(days)
Rate of Fall
(days)
Walgett 2/10/1992 690 18 6746 3 15
Walgett 19/10/1992 255 14 2292 5 9
Walgett 1/11/1992 1825 18 11871 10 8
Walgett 18/11/1992 1125 19 10131 9 10
Walgett 6/12/1992 611 14 6399 9 5
Walgett 19/12/1992 1269 32 14346 7 25
Walgett 19/01/1993 123 11 1034 9 2
Walgett 29/01/1993 975 14 5509 5 9
Walgett 11/02/1993 226 7 1095 3 4
Walgett 17/02/1993 127 8 660 3 5
Walgett 24/02/1993 254 35 3939 10 25
Walgett 30/03/1993 163 55 2589 4 51
Walgett 1/06/1993 41 8 217 3 5
Walgett 8/06/1993 2459 12 12596 5 7
Walgett 19/06/1993 329 19 3036 3 16
Walgett 7/07/1993 5207 32 44316 15 17
Walgett 7/08/1993 756 11 5364 5 6
Walgett 17/08/1993 494 22 7834 13 9
Walgett 7/09/1993 2054 43 29105 17 26
Walgett 19/10/1993 3705 30 30226 12 18
Walgett 17/11/1993 173 12 1151 3 9
Walgett 28/11/1993 238 20 2406 11 9
Walgett 17/12/1993 1947 25 12921 7 18
Walgett 10/01/1994 39 8 189 3 5
Walgett 17/01/1994 40 15 257 13 2
Walgett 31/01/1994 142 13 1147 5 8
Walgett 12/02/1994 1558 12 6382 9 3

Observed Flows in the Barwon–Darling 1990-2017: A Hydrologic Investigation
Page 81
Site Event Start
Date
Peak Flow
(ML/d)
Event
Duration
(days)
Event
Volume (ML)
Rate of Rise
(days)
Rate of Fall
(days)
Walgett 23/02/1994 7231 21 67717 7 14
Walgett 15/03/1994 1598 10 12255 4 6
Walgett 24/03/1994 1616 28 13109 5 23
Walgett 20/04/1994 100 18 714 3 15
Walgett 19/06/1994 133 34 2228 5 29
Walgett 6/01/1995 18 4 40 2 2
Walgett 19/01/1995 19236 42 289603 14 28
Walgett 1/03/1995 4309 49 31454 8 41
Walgett 16/05/1995 911 11 4429 5 6
Walgett 26/05/1995 303 45 2410 3 42
Walgett 13/07/1995 2 3 4 2 1
Walgett 20/11/1995 13821 35 160434 20 15
Walgett 24/12/1995 172 7 1010 4 3
Walgett 30/12/1995 134083 70 2636935 44 26
Walgett 8/03/1996 1204 19 13008 10 9
Walgett 26/03/1996 460 36 9002 5 31
Walgett 30/04/1996 34910 105 625962 32 73
Walgett 12/08/1996 1347 20 16357 6 14
Walgett 31/08/1996 4087 34 68610 13 21
Walgett 3/10/1996 7899 53 179934 27 26
Walgett 24/11/1996 816 14 7844 5 9
Walgett 7/12/1996 8109 54 133309 11 43
Walgett 29/01/1997 29402 27 437545 18 9
Walgett 24/02/1997 35967 85 860073 15 70
Walgett 19/05/1997 639 106 25990 21 85
Walgett 1/09/1997 276 14 2159 9 5
Walgett 14/09/1997 281 23 4357 14 9
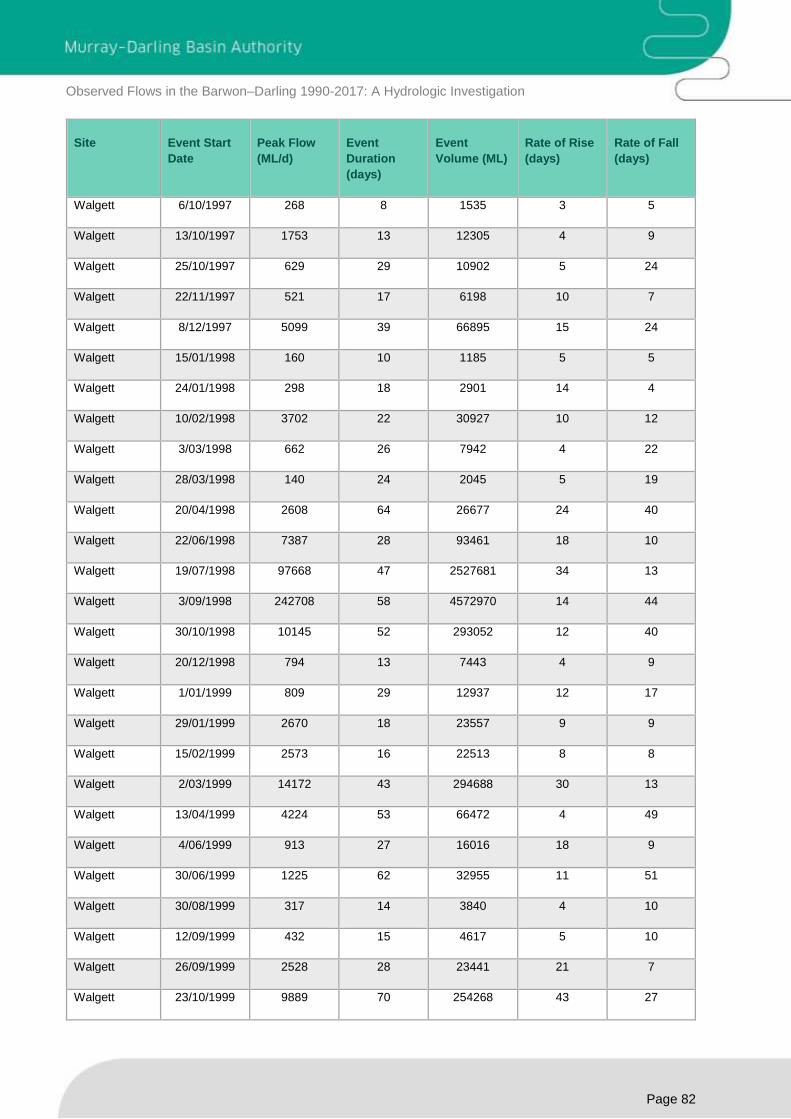
Observed Flows in the Barwon–Darling 1990-2017: A Hydrologic Investigation
Page 82
Site Event Start
Date
Peak Flow
(ML/d)
Event
Duration
(days)
Event
Volume (ML)
Rate of Rise
(days)
Rate of Fall
(days)
Walgett 6/10/1997 268 8 1535 3 5
Walgett 13/10/1997 1753 13 12305 4 9
Walgett 25/10/1997 629 29 10902 5 24
Walgett 22/11/1997 521 17 6198 10 7
Walgett 8/12/1997 5099 39 66895 15 24
Walgett 15/01/1998 160 10 1185 5 5
Walgett 24/01/1998 298 18 2901 14 4
Walgett 10/02/1998 3702 22 30927 10 12
Walgett 3/03/1998 662 26 7942 4 22
Walgett 28/03/1998 140 24 2045 5 19
Walgett 20/04/1998 2608 64 26677 24 40
Walgett 22/06/1998 7387 28 93461 18 10
Walgett 19/07/1998 97668 47 2527681 34 13
Walgett 3/09/1998 242708 58 4572970 14 44
Walgett 30/10/1998 10145 52 293052 12 40
Walgett 20/12/1998 794 13 7443 4 9
Walgett 1/01/1999 809 29 12937 12 17
Walgett 29/01/1999 2670 18 23557 9 9
Walgett 15/02/1999 2573 16 22513 8 8
Walgett 2/03/1999 14172 43 294688 30 13
Walgett 13/04/1999 4224 53 66472 4 49
Walgett 4/06/1999 913 27 16016 18 9
Walgett 30/06/1999 1225 62 32955 11 51
Walgett 30/08/1999 317 14 3840 4 10
Walgett 12/09/1999 432 15 4617 5 10
Walgett 26/09/1999 2528 28 23441 21 7
Walgett 23/10/1999 9889 70 254268 43 27
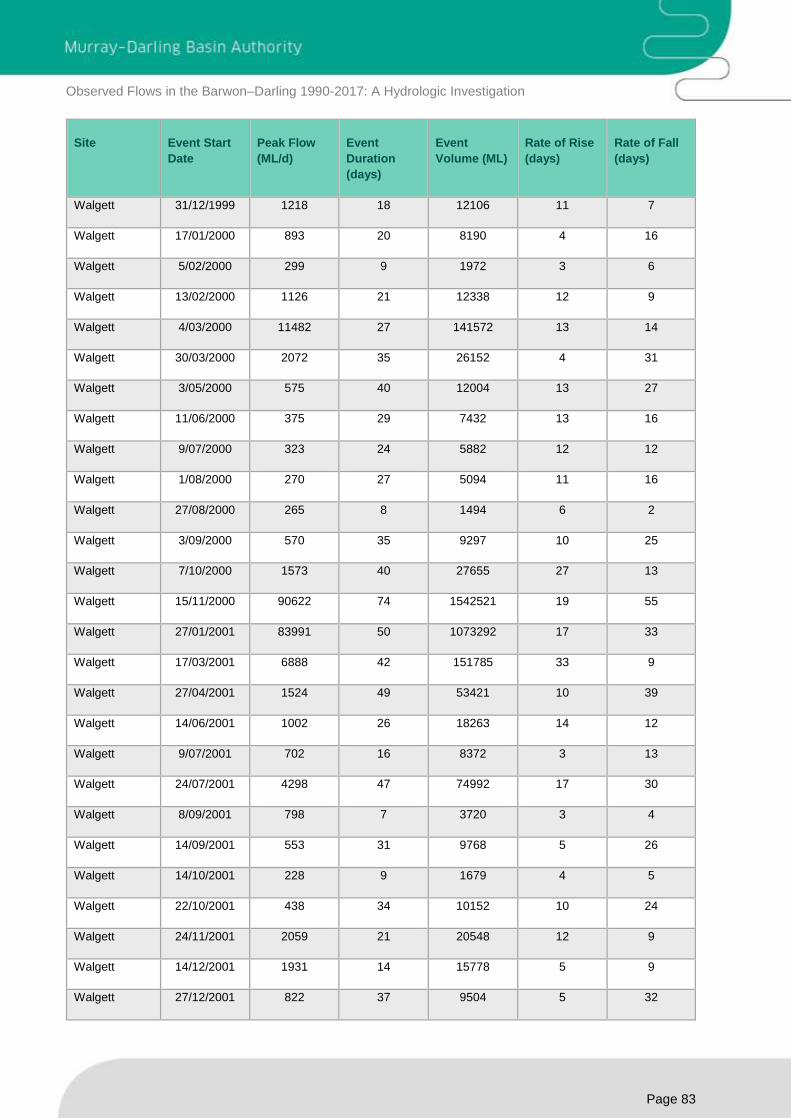
Observed Flows in the Barwon–Darling 1990-2017: A Hydrologic Investigation
Page 83
Site Event Start
Date
Peak Flow
(ML/d)
Event
Duration
(days)
Event
Volume (ML)
Rate of Rise
(days)
Rate of Fall
(days)
Walgett 31/12/1999 1218 18 12106 11 7
Walgett 17/01/2000 893 20 8190 4 16
Walgett 5/02/2000 299 9 1972 3 6
Walgett 13/02/2000 1126 21 12338 12 9
Walgett 4/03/2000 11482 27 141572 13 14
Walgett 30/03/2000 2072 35 26152 4 31
Walgett 3/05/2000 575 40 12004 13 27
Walgett 11/06/2000 375 29 7432 13 16
Walgett 9/07/2000 323 24 5882 12 12
Walgett 1/08/2000 270 27 5094 11 16
Walgett 27/08/2000 265 8 1494 6 2
Walgett 3/09/2000 570 35 9297 10 25
Walgett 7/10/2000 1573 40 27655 27 13
Walgett 15/11/2000 90622 74 1542521 19 55
Walgett 27/01/2001 83991 50 1073292 17 33
Walgett 17/03/2001 6888 42 151785 33 9
Walgett 27/04/2001 1524 49 53421 10 39
Walgett 14/06/2001 1002 26 18263 14 12
Walgett 9/07/2001 702 16 8372 3 13
Walgett 24/07/2001 4298 47 74992 17 30
Walgett 8/09/2001 798 7 3720 3 4
Walgett 14/09/2001 553 31 9768 5 26
Walgett 14/10/2001 228 9 1679 4 5
Walgett 22/10/2001 438 34 10152 10 24
Walgett 24/11/2001 2059 21 20548 12 9
Walgett 14/12/2001 1931 14 15778 5 9
Walgett 27/12/2001 822 37 9504 5 32
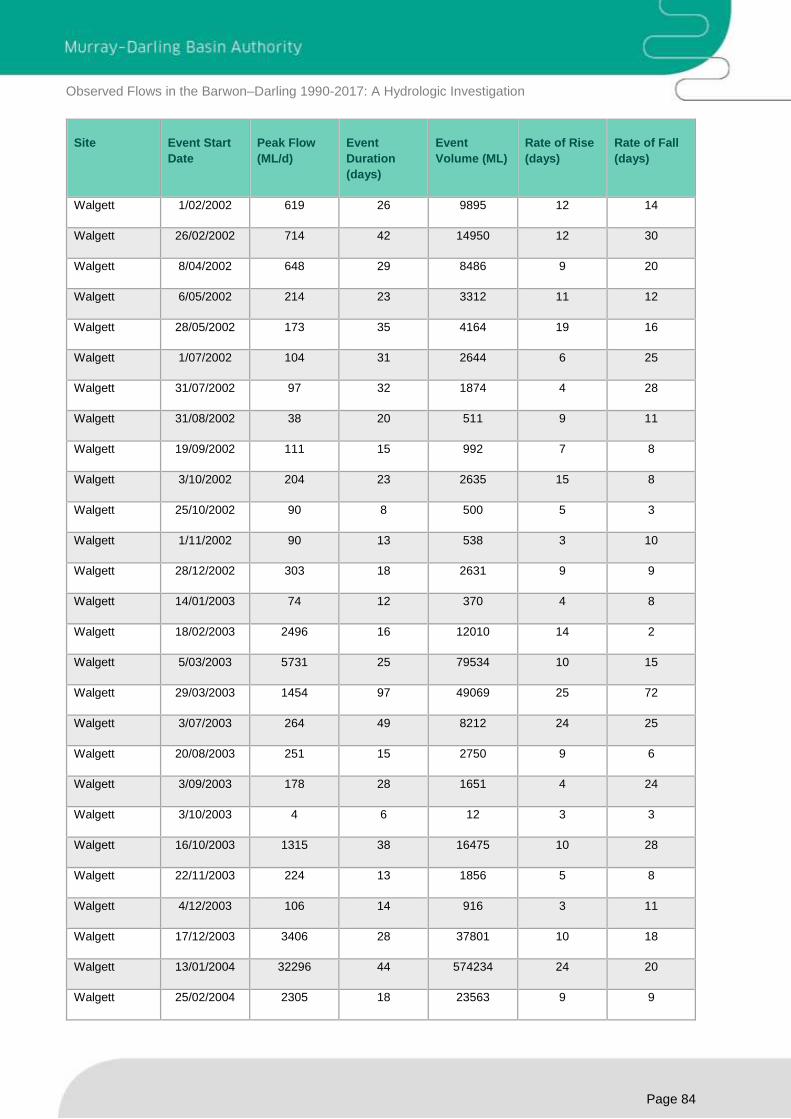
Observed Flows in the Barwon–Darling 1990-2017: A Hydrologic Investigation
Page 84
Site Event Start
Date
Peak Flow
(ML/d)
Event
Duration
(days)
Event
Volume (ML)
Rate of Rise
(days)
Rate of Fall
(days)
Walgett 1/02/2002 619 26 9895 12 14
Walgett 26/02/2002 714 42 14950 12 30
Walgett 8/04/2002 648 29 8486 9 20
Walgett 6/05/2002 214 23 3312 11 12
Walgett 28/05/2002 173 35 4164 19 16
Walgett 1/07/2002 104 31 2644 6 25
Walgett 31/07/2002 97 32 1874 4 28
Walgett 31/08/2002 38 20 511 9 11
Walgett 19/09/2002 111 15 992 7 8
Walgett 3/10/2002 204 23 2635 15 8
Walgett 25/10/2002 90 8 500 5 3
Walgett 1/11/2002 90 13 538 3 10
Walgett 28/12/2002 303 18 2631 9 9
Walgett 14/01/2003 74 12 370 4 8
Walgett 18/02/2003 2496 16 12010 14 2
Walgett 5/03/2003 5731 25 79534 10 15
Walgett 29/03/2003 1454 97 49069 25 72
Walgett 3/07/2003 264 49 8212 24 25
Walgett 20/08/2003 251 15 2750 9 6
Walgett 3/09/2003 178 28 1651 4 24
Walgett 3/10/2003 4 6 12 3 3
Walgett 16/10/2003 1315 38 16475 10 28
Walgett 22/11/2003 224 13 1856 5 8
Walgett 4/12/2003 106 14 916 3 11
Walgett 17/12/2003 3406 28 37801 10 18
Walgett 13/01/2004 32296 44 574234 24 20
Walgett 25/02/2004 2305 18 23563 9 9
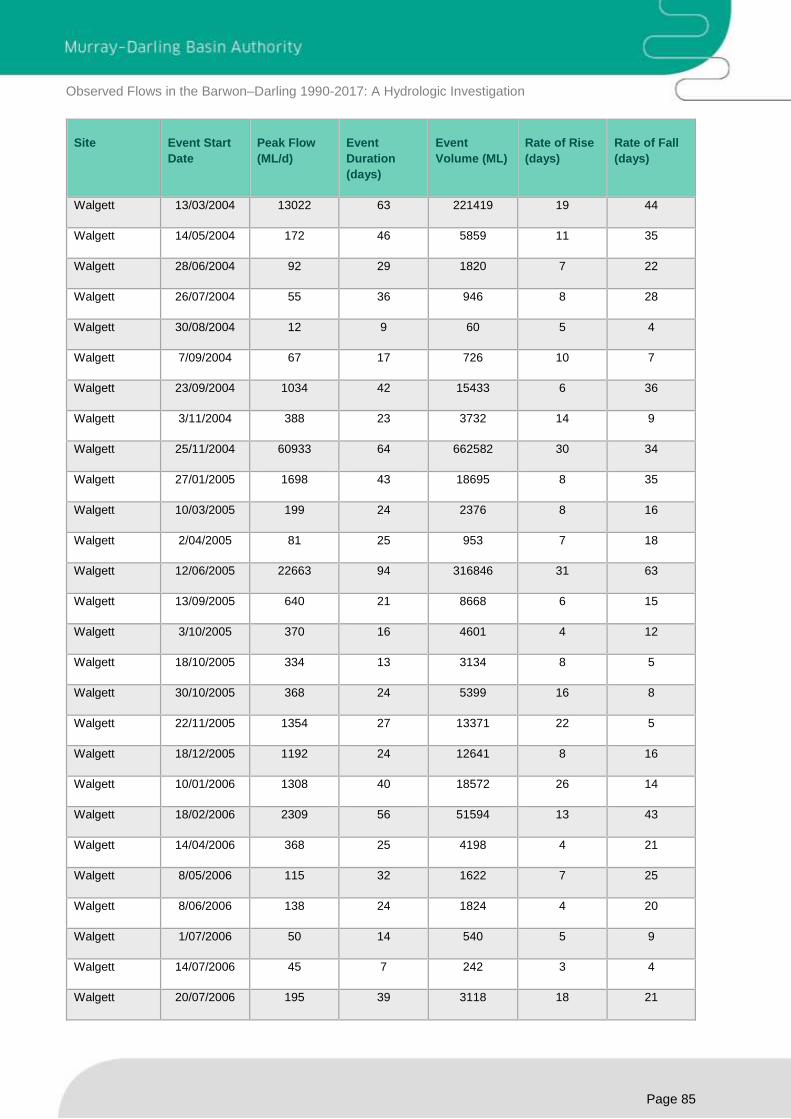
Observed Flows in the Barwon–Darling 1990-2017: A Hydrologic Investigation
Page 85
Site Event Start
Date
Peak Flow
(ML/d)
Event
Duration
(days)
Event
Volume (ML)
Rate of Rise
(days)
Rate of Fall
(days)
Walgett 13/03/2004 13022 63 221419 19 44
Walgett 14/05/2004 172 46 5859 11 35
Walgett 28/06/2004 92 29 1820 7 22
Walgett 26/07/2004 55 36 946 8 28
Walgett 30/08/2004 12 9 60 5 4
Walgett 7/09/2004 67 17 726 10 7
Walgett 23/09/2004 1034 42 15433 6 36
Walgett 3/11/2004 388 23 3732 14 9
Walgett 25/11/2004 60933 64 662582 30 34
Walgett 27/01/2005 1698 43 18695 8 35
Walgett 10/03/2005 199 24 2376 8 16
Walgett 2/04/2005 81 25 953 7 18
Walgett 12/06/2005 22663 94 316846 31 63
Walgett 13/09/2005 640 21 8668 6 15
Walgett 3/10/2005 370 16 4601 4 12
Walgett 18/10/2005 334 13 3134 8 5
Walgett 30/10/2005 368 24 5399 16 8
Walgett 22/11/2005 1354 27 13371 22 5
Walgett 18/12/2005 1192 24 12641 8 16
Walgett 10/01/2006 1308 40 18572 26 14
Walgett 18/02/2006 2309 56 51594 13 43
Walgett 14/04/2006 368 25 4198 4 21
Walgett 8/05/2006 115 32 1622 7 25
Walgett 8/06/2006 138 24 1824 4 20
Walgett 1/07/2006 50 14 540 5 9
Walgett 14/07/2006 45 7 242 3 4
Walgett 20/07/2006 195 39 3118 18 21

Observed Flows in the Barwon–Darling 1990-2017: A Hydrologic Investigation
Page 86
Site Event Start
Date
Peak Flow
(ML/d)
Event
Duration
(days)
Event
Volume (ML)
Rate of Rise
(days)
Rate of Fall
(days)
Walgett 27/08/2006 24 19 182 6 13
Walgett 4/11/2006 13 5 40 3 2
Walgett 8/11/2006 115 10 619 4 6
Walgett 17/11/2006 263 25 2639 10 15
Walgett 18/12/2006 452 25 6496 9 16
Walgett 11/01/2007 109 12 753 4 8
Walgett 22/01/2007 58 12 444 6 6
Walgett 2/02/2007 65 10 436 6 4
Walgett 11/02/2007 190 14 1091 3 11
Walgett 24/02/2007 1031 18 5823 5 13
Walgett 13/03/2007 384 43 6829 8 35
Walgett 2/05/2007 1 2 2 1 1
Walgett 19/05/2007 1 2 3 2 0
Walgett 30/05/2007 3 4 11 1 3
Walgett 5/06/2007 10 5 38 2 3
Walgett 9/06/2007 609 24 3512 16 8
Walgett 2/07/2007 182 14 1913 7 7
Walgett 15/07/2007 1108 48 21170 6 42
Walgett 31/08/2007 1527 9 6781 4 5
Walgett 8/09/2007 1507 37 23975 6 31
Walgett 14/10/2007 98 15 1046 9 6
Walgett 28/10/2007 105 17 650 4 13
Walgett 13/11/2007 404 20 2776 10 10
Walgett 2/12/2007 400 14 3028 8 6
Walgett 15/12/2007 10664 35 116576 16 19
Walgett 18/01/2008 9266 79 157662 40 39
Walgett 5/04/2008 102 20 1301 5 15
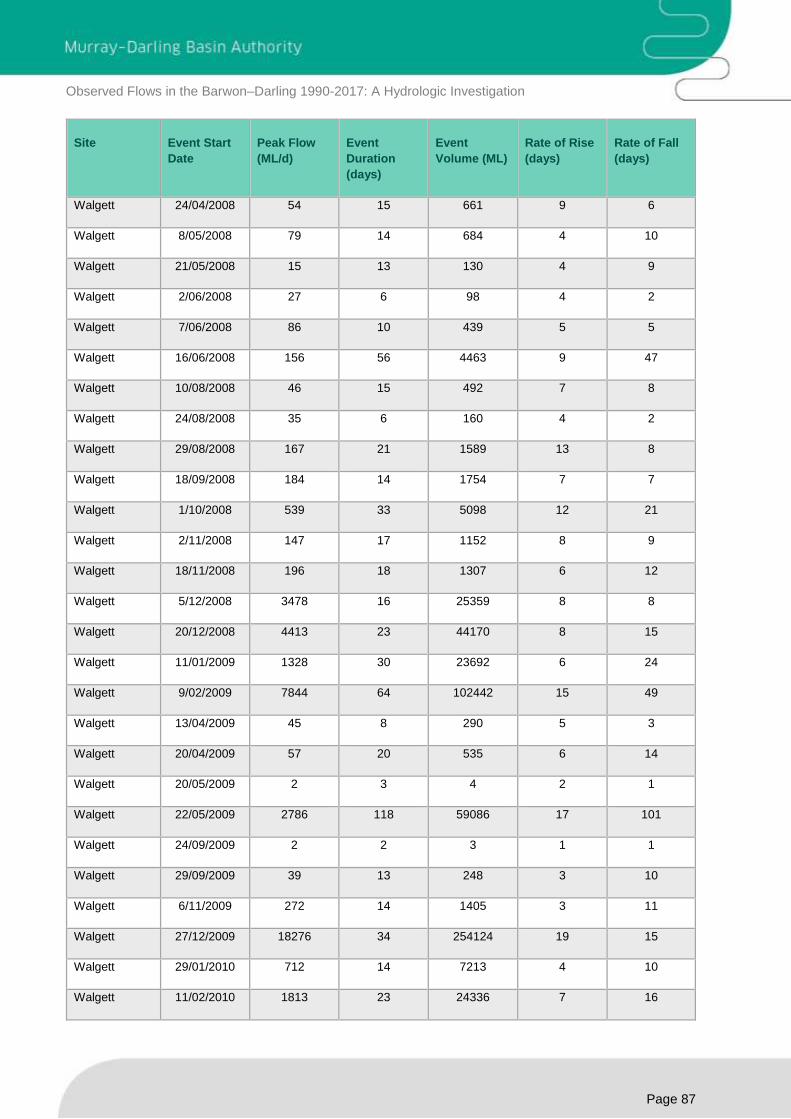
Observed Flows in the Barwon–Darling 1990-2017: A Hydrologic Investigation
Page 87
Site Event Start
Date
Peak Flow
(ML/d)
Event
Duration
(days)
Event
Volume (ML)
Rate of Rise
(days)
Rate of Fall
(days)
Walgett 24/04/2008 54 15 661 9 6
Walgett 8/05/2008 79 14 684 4 10
Walgett 21/05/2008 15 13 130 4 9
Walgett 2/06/2008 27 6 98 4 2
Walgett 7/06/2008 86 10 439 5 5
Walgett 16/06/2008 156 56 4463 9 47
Walgett 10/08/2008 46 15 492 7 8
Walgett 24/08/2008 35 6 160 4 2
Walgett 29/08/2008 167 21 1589 13 8
Walgett 18/09/2008 184 14 1754 7 7
Walgett 1/10/2008 539 33 5098 12 21
Walgett 2/11/2008 147 17 1152 8 9
Walgett 18/11/2008 196 18 1307 6 12
Walgett 5/12/2008 3478 16 25359 8 8
Walgett 20/12/2008 4413 23 44170 8 15
Walgett 11/01/2009 1328 30 23692 6 24
Walgett 9/02/2009 7844 64 102442 15 49
Walgett 13/04/2009 45 8 290 5 3
Walgett 20/04/2009 57 20 535 6 14
Walgett 20/05/2009 2 3 4 2 1
Walgett 22/05/2009 2786 118 59086 17 101
Walgett 24/09/2009 2 2 3 1 1
Walgett 29/09/2009 39 13 248 3 10
Walgett 6/11/2009 272 14 1405 3 11
Walgett 27/12/2009 18276 34 254124 19 15
Walgett 29/01/2010 712 14 7213 4 10
Walgett 11/02/2010 1813 23 24336 7 16

Observed Flows in the Barwon–Darling 1990-2017: A Hydrologic Investigation
Page 88
Site Event Start
Date
Peak Flow
(ML/d)
Event
Duration
(days)
Event
Volume (ML)
Rate of Rise
(days)
Rate of Fall
(days)
Walgett 5/03/2010 32321 120 477490 19 101
Walgett 2/07/2010 198 25 2718 5 20
Walgett 26/07/2010 25818 102 889456 90 12
Walgett 4/11/2010 21226 22 347085 9 13
Walgett 25/11/2010 46572 51 1427518 28 23
Walgett 14/01/2011 40263 57 1021390 25 32
Walgett 11/03/2011 4666 21 38172 12 9
Walgett 31/03/2011 3785 33 46185 7 26
Walgett 2/05/2011 886 27 13530 6 21
Walgett 28/05/2011 388 21 5575 12 9
Walgett 17/06/2011 1446 33 18546 19 14
Walgett 19/07/2011 942 25 15146 5 20
Walgett 12/08/2011 713 23 9633 5 18
Walgett 3/09/2011 1752 35 41212 21 14
Walgett 7/10/2011 3367 13 31756 8 5
Walgett 19/10/2011 3822 14 39622 6 8
Walgett 1/11/2011 2009 25 35950 10 15
Walgett 25/11/2011 99817 58 2848219 27 31
Walgett 21/01/2012 240966 96 3454603 25 71
Walgett 25/04/2012 890 18 11191 11 7
Walgett 12/05/2012 1061 22 14983 7 15
Walgett 2/06/2012 1101 13 9085 10 3
Walgett 14/06/2012 1491 30 22735 4 26
Walgett 13/07/2012 12401 87 263145 12 75
Walgett 7/10/2012 317 28 5147 9 19
Walgett 3/11/2012 147 34 3401 16 18
Walgett 6/12/2012 39 9 222 3 6
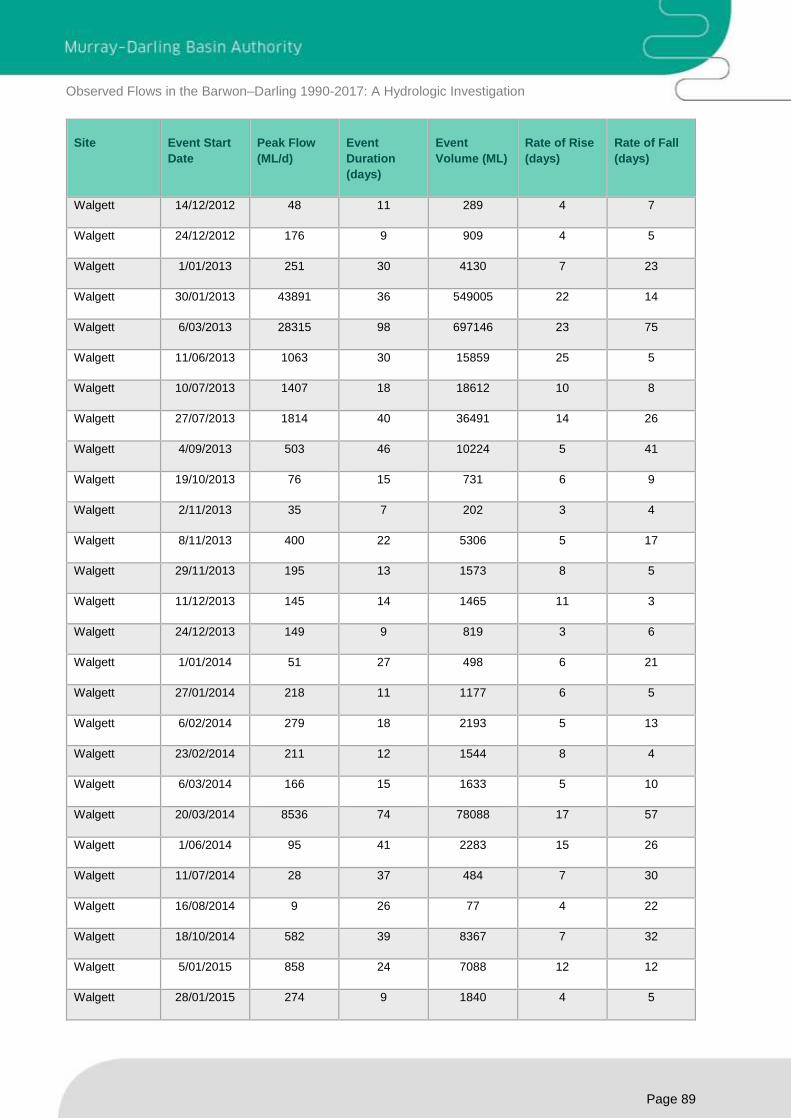
Observed Flows in the Barwon–Darling 1990-2017: A Hydrologic Investigation
Page 89
Site Event Start
Date
Peak Flow
(ML/d)
Event
Duration
(days)
Event
Volume (ML)
Rate of Rise
(days)
Rate of Fall
(days)
Walgett 14/12/2012 48 11 289 4 7
Walgett 24/12/2012 176 9 909 4 5
Walgett 1/01/2013 251 30 4130 7 23
Walgett 30/01/2013 43891 36 549005 22 14
Walgett 6/03/2013 28315 98 697146 23 75
Walgett 11/06/2013 1063 30 15859 25 5
Walgett 10/07/2013 1407 18 18612 10 8
Walgett 27/07/2013 1814 40 36491 14 26
Walgett 4/09/2013 503 46 10224 5 41
Walgett 19/10/2013 76 15 731 6 9
Walgett 2/11/2013 35 7 202 3 4
Walgett 8/11/2013 400 22 5306 5 17
Walgett 29/11/2013 195 13 1573 8 5
Walgett 11/12/2013 145 14 1465 11 3
Walgett 24/12/2013 149 9 819 3 6
Walgett 1/01/2014 51 27 498 6 21
Walgett 27/01/2014 218 11 1177 6 5
Walgett 6/02/2014 279 18 2193 5 13
Walgett 23/02/2014 211 12 1544 8 4
Walgett 6/03/2014 166 15 1633 5 10
Walgett 20/03/2014 8536 74 78088 17 57
Walgett 1/06/2014 95 41 2283 15 26
Walgett 11/07/2014 28 37 484 7 30
Walgett 16/08/2014 9 26 77 4 22
Walgett 18/10/2014 582 39 8367 7 32
Walgett 5/01/2015 858 24 7088 12 12
Walgett 28/01/2015 274 9 1840 4 5
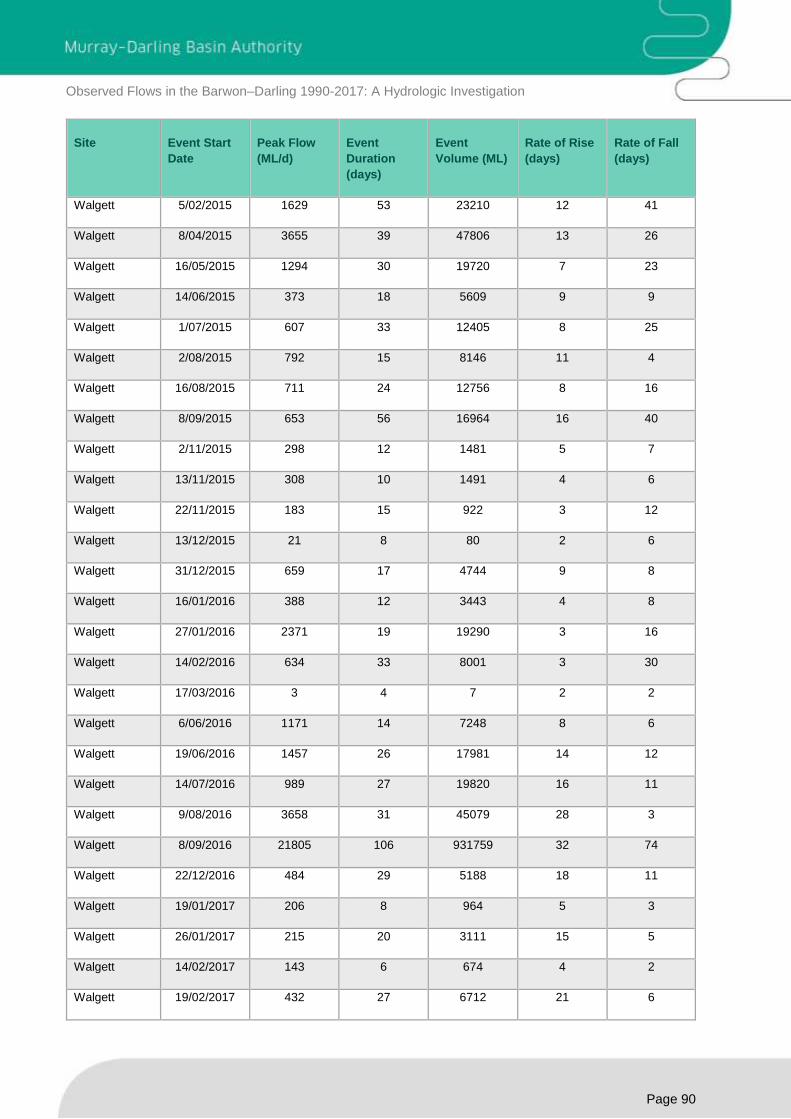
Observed Flows in the Barwon–Darling 1990-2017: A Hydrologic Investigation
Page 90
Site Event Start
Date
Peak Flow
(ML/d)
Event
Duration
(days)
Event
Volume (ML)
Rate of Rise
(days)
Rate of Fall
(days)
Walgett 5/02/2015 1629 53 23210 12 41
Walgett 8/04/2015 3655 39 47806 13 26
Walgett 16/05/2015 1294 30 19720 7 23
Walgett 14/06/2015 373 18 5609 9 9
Walgett 1/07/2015 607 33 12405 8 25
Walgett 2/08/2015 792 15 8146 11 4
Walgett 16/08/2015 711 24 12756 8 16
Walgett 8/09/2015 653 56 16964 16 40
Walgett 2/11/2015 298 12 1481 5 7
Walgett 13/11/2015 308 10 1491 4 6
Walgett 22/11/2015 183 15 922 3 12
Walgett 13/12/2015 21 8 80 2 6
Walgett 31/12/2015 659 17 4744 9 8
Walgett 16/01/2016 388 12 3443 4 8
Walgett 27/01/2016 2371 19 19290 3 16
Walgett 14/02/2016 634 33 8001 3 30
Walgett 17/03/2016 3 4 7 2 2
Walgett 6/06/2016 1171 14 7248 8 6
Walgett 19/06/2016 1457 26 17981 14 12
Walgett 14/07/2016 989 27 19820 16 11
Walgett 9/08/2016 3658 31 45079 28 3
Walgett 8/09/2016 21805 106 931759 32 74
Walgett 22/12/2016 484 29 5188 18 11
Walgett 19/01/2017 206 8 964 5 3
Walgett 26/01/2017 215 20 3111 15 5
Walgett 14/02/2017 143 6 674 4 2
Walgett 19/02/2017 432 27 6712 21 6

Observed Flows in the Barwon–Darling 1990-2017: A Hydrologic Investigation
Page 91
Site Event Start
Date
Peak Flow
(ML/d)
Event
Duration
(days)
Event
Volume (ML)
Rate of Rise
(days)
Rate of Fall
(days)
Walgett 17/03/2017 678 13 4751 8 5
Walgett 29/03/2017 756 11 5154 5 6
Walgett 8/04/2017 7439 25 72397 14 11
Walgett 2/05/2017 1717 59 50543 14 45
Brewarrina 1/01/1990 5914 26 48215 6 20
Brewarrina 26/01/1990 2000 27 26668 13 14
Brewarrina 21/02/1990 3610 39 69144 16 23
Brewarrina 31/03/1990 31334 99 1737206 39 60
Brewarrina 7/07/1990 36231 195 2236677 59 136
Brewarrina 17/01/1991 12614 109 389317 42 67
Brewarrina 5/05/1991 10809 45 148437 38 7
Brewarrina 18/06/1991 12791 30 194811 12 18
Brewarrina 17/07/1991 9786 73 186830 14 59
Brewarrina 27/09/1991 512 30 8849 12 18
Brewarrina 26/10/1991 570 46 12847 43 3
Brewarrina 10/12/1991 16619 36 255530 20 16
Brewarrina 14/01/1992 1118 25 21503 19 6
Brewarrina 7/02/1992 10299 99 268435 27 72
Brewarrina 15/05/1992 281 30 5166 18 12
Brewarrina 13/06/1992 376 39 9218 17 22
Brewarrina 21/07/1992 171 11 1337 8 3
Brewarrina 31/07/1992 507 49 12770 37 12
Brewarrina 17/09/1992 759 22 9952 11 11
Brewarrina 8/10/1992 517 31 9345 7 24
Brewarrina 7/11/1992 1216 22 13090 13 9
Brewarrina 28/11/1992 1019 20 11726 6 14
Brewarrina 17/12/1992 1334 8 5298 3 5

Observed Flows in the Barwon–Darling 1990-2017: A Hydrologic Investigation
Page 92
Site Event Start
Date
Peak Flow
(ML/d)
Event
Duration
(days)
Event
Volume (ML)
Rate of Rise
(days)
Rate of Fall
(days)
Brewarrina 24/12/1992 920 11 6864 8 3
Brewarrina 3/01/1993 637 28 6747 7 21
Brewarrina 30/01/1993 642 34 8746 11 23
Brewarrina 4/03/1993 171 24 3618 7 17
Brewarrina 27/03/1993 171 64 4802 4 60
Brewarrina 29/05/1993 125 15 714 5 10
Brewarrina 12/06/1993 1360 35 12987 7 28
Brewarrina 16/07/1993 3001 30 32047 10 20
Brewarrina 14/08/1993 590 17 8512 7 10
Brewarrina 30/08/1993 555 11 5454 4 7
Brewarrina 9/09/1993 2172 45 58565 27 18
Brewarrina 23/10/1993 4449 43 72510 13 30
Brewarrina 4/12/1993 908 20 10728 8 12
Brewarrina 23/12/1993 1071 51 9362 6 45
Brewarrina 11/02/1994 4539 37 49324 23 14
Brewarrina 19/03/1994 1138 100 22834 15 85
Brewarrina 26/06/1994 68 26 1181 16 10
Brewarrina 21/07/1994 68 60 1588 5 55
Brewarrina 18/09/1994 38 55 1096 9 46
Brewarrina 11/11/1994 22060 116 469141 87 29
Brewarrina 6/03/1995 3041 29 29496 7 22
Brewarrina 3/04/1995 35 10 213 4 6
Brewarrina 12/04/1995 145 11 428 4 7
Brewarrina 22/04/1995 30 18 241 12 6
Brewarrina 9/05/1995 16 5 65 3 2
Brewarrina 13/05/1995 337 6 551 5 1
Brewarrina 18/05/1995 965 29 13232 8 21
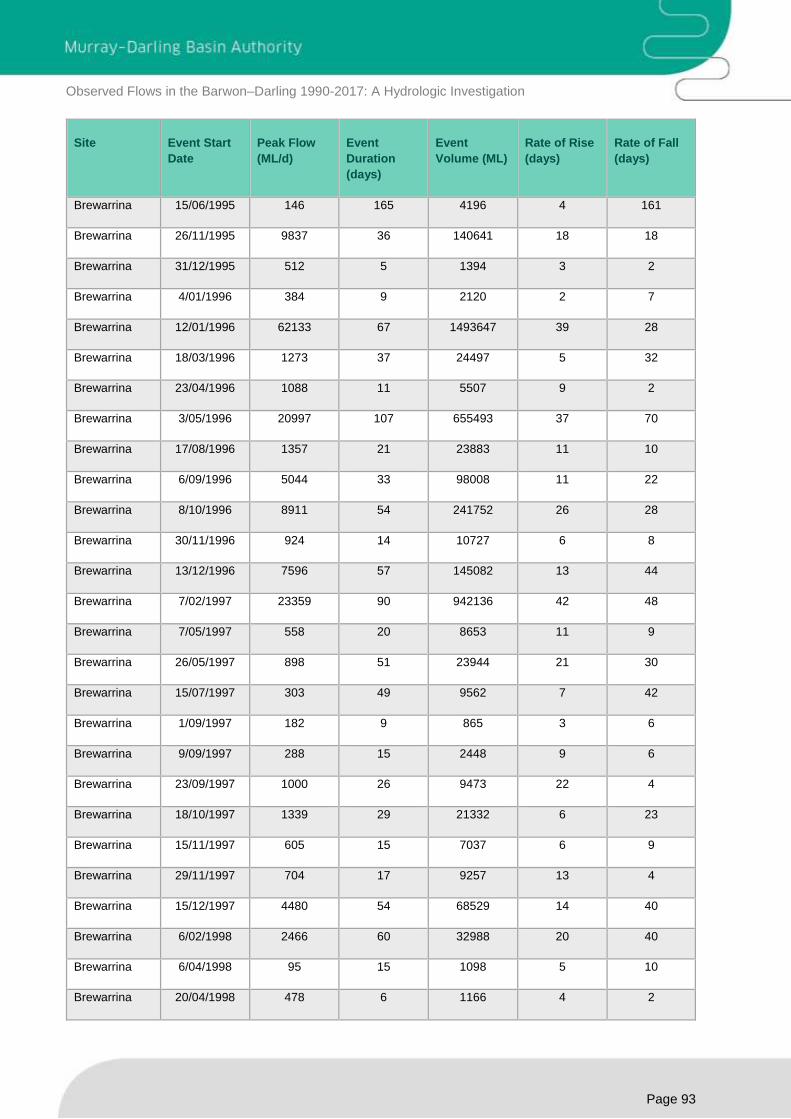
Observed Flows in the Barwon–Darling 1990-2017: A Hydrologic Investigation
Page 93
Site Event Start
Date
Peak Flow
(ML/d)
Event
Duration
(days)
Event
Volume (ML)
Rate of Rise
(days)
Rate of Fall
(days)
Brewarrina 15/06/1995 146 165 4196 4 161
Brewarrina 26/11/1995 9837 36 140641 18 18
Brewarrina 31/12/1995 512 5 1394 3 2
Brewarrina 4/01/1996 384 9 2120 2 7
Brewarrina 12/01/1996 62133 67 1493647 39 28
Brewarrina 18/03/1996 1273 37 24497 5 32
Brewarrina 23/04/1996 1088 11 5507 9 2
Brewarrina 3/05/1996 20997 107 655493 37 70
Brewarrina 17/08/1996 1357 21 23883 11 10
Brewarrina 6/09/1996 5044 33 98008 11 22
Brewarrina 8/10/1996 8911 54 241752 26 28
Brewarrina 30/11/1996 924 14 10727 6 8
Brewarrina 13/12/1996 7596 57 145082 13 44
Brewarrina 7/02/1997 23359 90 942136 42 48
Brewarrina 7/05/1997 558 20 8653 11 9
Brewarrina 26/05/1997 898 51 23944 21 30
Brewarrina 15/07/1997 303 49 9562 7 42
Brewarrina 1/09/1997 182 9 865 3 6
Brewarrina 9/09/1997 288 15 2448 9 6
Brewarrina 23/09/1997 1000 26 9473 22 4
Brewarrina 18/10/1997 1339 29 21332 6 23
Brewarrina 15/11/1997 605 15 7037 6 9
Brewarrina 29/11/1997 704 17 9257 13 4
Brewarrina 15/12/1997 4480 54 68529 14 40
Brewarrina 6/02/1998 2466 60 32988 20 40
Brewarrina 6/04/1998 95 15 1098 5 10
Brewarrina 20/04/1998 478 6 1166 4 2
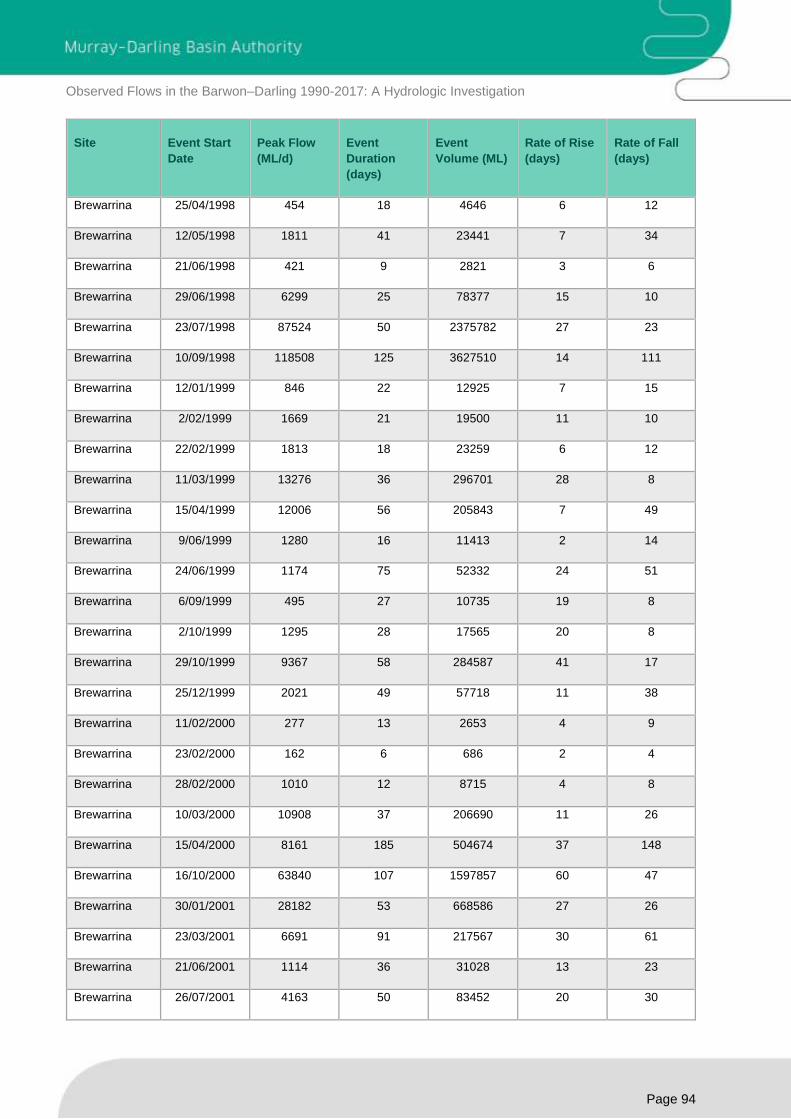
Observed Flows in the Barwon–Darling 1990-2017: A Hydrologic Investigation
Page 94
Site Event Start
Date
Peak Flow
(ML/d)
Event
Duration
(days)
Event
Volume (ML)
Rate of Rise
(days)
Rate of Fall
(days)
Brewarrina 25/04/1998 454 18 4646 6 12
Brewarrina 12/05/1998 1811 41 23441 7 34
Brewarrina 21/06/1998 421 9 2821 3 6
Brewarrina 29/06/1998 6299 25 78377 15 10
Brewarrina 23/07/1998 87524 50 2375782 27 23
Brewarrina 10/09/1998 118508 125 3627510 14 111
Brewarrina 12/01/1999 846 22 12925 7 15
Brewarrina 2/02/1999 1669 21 19500 11 10
Brewarrina 22/02/1999 1813 18 23259 6 12
Brewarrina 11/03/1999 13276 36 296701 28 8
Brewarrina 15/04/1999 12006 56 205843 7 49
Brewarrina 9/06/1999 1280 16 11413 2 14
Brewarrina 24/06/1999 1174 75 52332 24 51
Brewarrina 6/09/1999 495 27 10735 19 8
Brewarrina 2/10/1999 1295 28 17565 20 8
Brewarrina 29/10/1999 9367 58 284587 41 17
Brewarrina 25/12/1999 2021 49 57718 11 38
Brewarrina 11/02/2000 277 13 2653 4 9
Brewarrina 23/02/2000 162 6 686 2 4
Brewarrina 28/02/2000 1010 12 8715 4 8
Brewarrina 10/03/2000 10908 37 206690 11 26
Brewarrina 15/04/2000 8161 185 504674 37 148
Brewarrina 16/10/2000 63840 107 1597857 60 47
Brewarrina 30/01/2001 28182 53 668586 27 26
Brewarrina 23/03/2001 6691 91 217567 30 61
Brewarrina 21/06/2001 1114 36 31028 13 23
Brewarrina 26/07/2001 4163 50 83452 20 30
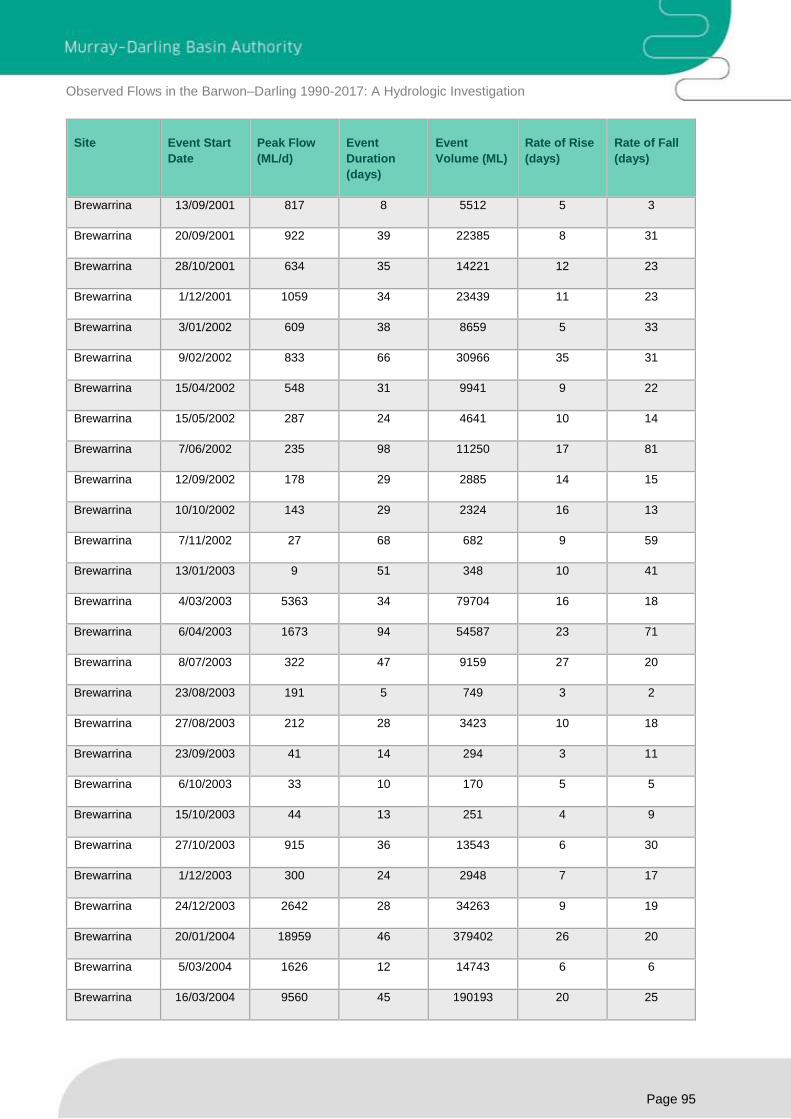
Observed Flows in the Barwon–Darling 1990-2017: A Hydrologic Investigation
Page 95
Site Event Start
Date
Peak Flow
(ML/d)
Event
Duration
(days)
Event
Volume (ML)
Rate of Rise
(days)
Rate of Fall
(days)
Brewarrina 13/09/2001 817 8 5512 5 3
Brewarrina 20/09/2001 922 39 22385 8 31
Brewarrina 28/10/2001 634 35 14221 12 23
Brewarrina 1/12/2001 1059 34 23439 11 23
Brewarrina 3/01/2002 609 38 8659 5 33
Brewarrina 9/02/2002 833 66 30966 35 31
Brewarrina 15/04/2002 548 31 9941 9 22
Brewarrina 15/05/2002 287 24 4641 10 14
Brewarrina 7/06/2002 235 98 11250 17 81
Brewarrina 12/09/2002 178 29 2885 14 15
Brewarrina 10/10/2002 143 29 2324 16 13
Brewarrina 7/11/2002 27 68 682 9 59
Brewarrina 13/01/2003 9 51 348 10 41
Brewarrina 4/03/2003 5363 34 79704 16 18
Brewarrina 6/04/2003 1673 94 54587 23 71
Brewarrina 8/07/2003 322 47 9159 27 20
Brewarrina 23/08/2003 191 5 749 3 2
Brewarrina 27/08/2003 212 28 3423 10 18
Brewarrina 23/09/2003 41 14 294 3 11
Brewarrina 6/10/2003 33 10 170 5 5
Brewarrina 15/10/2003 44 13 251 4 9
Brewarrina 27/10/2003 915 36 13543 6 30
Brewarrina 1/12/2003 300 24 2948 7 17
Brewarrina 24/12/2003 2642 28 34263 9 19
Brewarrina 20/01/2004 18959 46 379402 26 20
Brewarrina 5/03/2004 1626 12 14743 6 6
Brewarrina 16/03/2004 9560 45 190193 20 25

Observed Flows in the Barwon–Darling 1990-2017: A Hydrologic Investigation
Page 96
Site Event Start
Date
Peak Flow
(ML/d)
Event
Duration
(days)
Event
Volume (ML)
Rate of Rise
(days)
Rate of Fall
(days)
Brewarrina 29/04/2004 737 26 8785 2 24
Brewarrina 24/05/2004 258 84 9007 4 80
Brewarrina 15/08/2004 45 41 613 2 39
Brewarrina 24/09/2004 738 58 13040 13 45
Brewarrina 20/11/2004 276 15 2103 6 9
Brewarrina 4/12/2004 24917 62 417362 31 31
Brewarrina 3/02/2005 1046 49 16692 6 43
Brewarrina 23/03/2005 201 24 1888 6 18
Brewarrina 15/04/2005 37 58 758 6 52
Brewarrina 11/06/2005 12970 102 241438 39 63
Brewarrina 20/09/2005 565 38 14284 7 31
Brewarrina 27/10/2005 306 14 3019 6 8
Brewarrina 9/11/2005 538 29 8302 18 11
Brewarrina 7/12/2005 921 21 12116 13 8
Brewarrina 27/12/2005 861 29 13021 5 24
Brewarrina 24/01/2006 831 33 14173 19 14
Brewarrina 25/02/2006 1191 85 42702 10 75
Brewarrina 20/05/2006 173 31 3652 23 8
Brewarrina 19/06/2006 222 24 3017 3 21
Brewarrina 12/07/2006 151 21 1617 5 16
Brewarrina 1/08/2006 155 44 3045 16 28
Brewarrina 5/01/2007 225 28 2783 5 23
Brewarrina 1/02/2007 18 33 332 2 31
Brewarrina 5/03/2007 431 18 2794 6 12
Brewarrina 22/03/2007 279 37 5754 9 28
Brewarrina 27/04/2007 52 22 405 3 19
Brewarrina 18/05/2007 138 29 568 2 27

Observed Flows in the Barwon–Darling 1990-2017: A Hydrologic Investigation
Page 97
Site Event Start
Date
Peak Flow
(ML/d)
Event
Duration
(days)
Event
Volume (ML)
Rate of Rise
(days)
Rate of Fall
(days)
Brewarrina 15/06/2007 557 27 4196 18 9
Brewarrina 11/07/2007 314 11 2396 6 5
Brewarrina 21/07/2007 1001 47 21282 8 39
Brewarrina 5/09/2007 864 9 4929 5 4
Brewarrina 13/09/2007 1281 42 23332 9 33
Brewarrina 24/10/2007 138 23 1186 2 21
Brewarrina 15/11/2007 207 13 522 11 2
Brewarrina 27/11/2007 631 16 3102 5 11
Brewarrina 12/12/2007 22248 37 321586 26 11
Brewarrina 17/01/2008 2040 16 19378 3 13
Brewarrina 1/02/2008 8220 50 166413 28 22
Brewarrina 21/03/2008 1343 59 10295 3 56
Brewarrina 18/05/2008 60 32 1175 5 27
Brewarrina 18/06/2008 110 63 3777 16 47
Brewarrina 19/08/2008 21 4 61 2 2
Brewarrina 22/08/2008 48 17 458 10 7
Brewarrina 7/09/2008 94 22 1336 12 10
Brewarrina 28/09/2008 277 16 2014 9 7
Brewarrina 13/10/2008 290 19 3094 7 12
Brewarrina 31/10/2008 79 14 928 4 10
Brewarrina 13/11/2008 191 16 1261 7 9
Brewarrina 28/11/2008 105 15 906 7 8
Brewarrina 12/12/2008 2001 14 14661 5 9
Brewarrina 25/12/2008 2753 51 50348 7 44
Brewarrina 13/02/2009 679 3 1404 2 1
Brewarrina 15/02/2009 9347 56 137947 11 45
Brewarrina 11/04/2009 100 14 652 3 11

Observed Flows in the Barwon–Darling 1990-2017: A Hydrologic Investigation
Page 98
Site Event Start
Date
Peak Flow
(ML/d)
Event
Duration
(days)
Event
Volume (ML)
Rate of Rise
(days)
Rate of Fall
(days)
Brewarrina 24/04/2009 125 25 1838 7 18
Brewarrina 18/05/2009 288 10 748 3 7
Brewarrina 27/05/2009 3588 100 70524 15 85
Brewarrina 3/09/2009 102 113 1572 2 111
Brewarrina 24/12/2009 27504 43 676139 26 17
Brewarrina 4/02/2010 1371 13 11003 3 10
Brewarrina 16/02/2010 2485 23 42491 11 12
Brewarrina 10/03/2010 19523 114 397489 24 90
Brewarrina 1/07/2010 19 6 88 3 3
Brewarrina 6/07/2010 184 23 2024 9 14
Brewarrina 28/07/2010 17389 126 1230333 97 29
Brewarrina 30/11/2010 59767 108 2911597 29 79
Brewarrina 17/03/2011 4704 19 51993 9 10
Brewarrina 4/04/2011 3882 65 72781 7 58
Brewarrina 7/06/2011 570 29 12858 13 16
Brewarrina 5/07/2011 1086 45 31497 6 39
Brewarrina 18/08/2011 740 18 10226 6 12
Brewarrina 4/09/2011 3704 88 143142 55 33
Brewarrina 30/11/2011 56076 59 1716800 33 26
Brewarrina 27/01/2012 110429 140 2697366 29 111
Brewarrina 14/06/2012 1986 24 39940 11 13
Brewarrina 7/07/2012 11507 103 429421 30 73
Brewarrina 17/10/2012 647 65 30232 36 29
Brewarrina 20/12/2012 412 23 6704 9 14
Brewarrina 11/01/2013 238 27 4649 13 14
Brewarrina 6/02/2013 19160 34 313642 25 9
Brewarrina 11/03/2013 13973 101 410852 25 76

Observed Flows in the Barwon–Darling 1990-2017: A Hydrologic Investigation
Page 99
Site Event Start
Date
Peak Flow
(ML/d)
Event
Duration
(days)
Event
Volume (ML)
Rate of Rise
(days)
Rate of Fall
(days)
Brewarrina 19/06/2013 922 30 17422 24 6
Brewarrina 18/07/2013 1282 56 46076 31 25
Brewarrina 11/09/2013 467 34 8139 7 27
Brewarrina 14/10/2013 90 17 909 7 10
Brewarrina 30/10/2013 48 19 471 7 12
Brewarrina 17/11/2013 334 24 4834 7 17
Brewarrina 10/12/2013 164 15 1598 6 9
Brewarrina 24/12/2013 99 12 860 7 5
Brewarrina 4/01/2014 158 15 1034 7 8
Brewarrina 18/01/2014 119 24 1660 9 15
Brewarrina 10/02/2014 104 7 549 4 3
Brewarrina 16/02/2014 327 13 2143 5 8
Brewarrina 28/02/2014 129 5 467 2 3
Brewarrina 4/03/2014 311 29 4903 7 22
Brewarrina 1/04/2014 89 4 278 3 1
Brewarrina 4/04/2014 3792 61 42677 6 55
Brewarrina 3/06/2014 119 72 4325 15 57
Brewarrina 13/08/2014 108 36 1737 5 31
Brewarrina 17/09/2014 48 15 544 6 9
Brewarrina 1/10/2014 28 28 468 5 23
Brewarrina 28/10/2014 362 26 3331 7 19
Brewarrina 22/11/2014 20 42 464 3 39
Brewarrina 27/01/2015 249 12 1348 5 7
Brewarrina 7/02/2015 103 7 481 3 4
Brewarrina 13/02/2015 1036 66 16237 11 55
Brewarrina 19/04/2015 2240 34 35175 7 27
Brewarrina 22/05/2015 941 28 17325 8 20
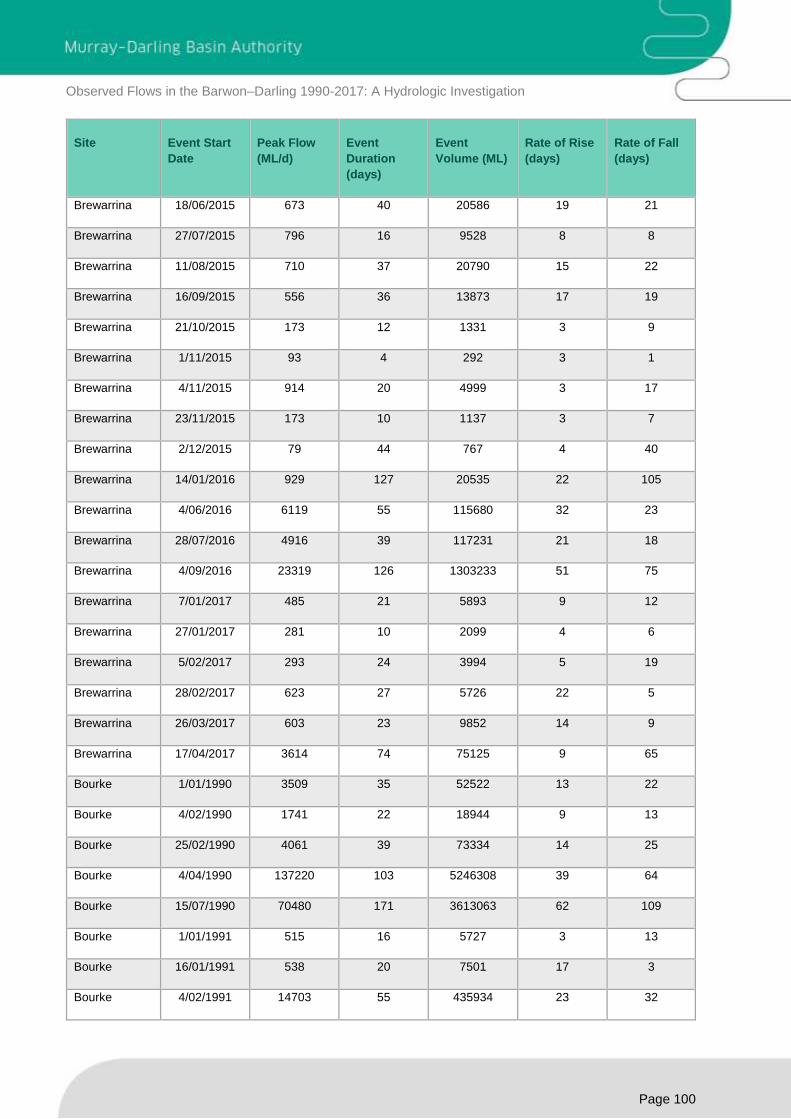
Observed Flows in the Barwon–Darling 1990-2017: A Hydrologic Investigation
Page 100
Site Event Start
Date
Peak Flow
(ML/d)
Event
Duration
(days)
Event
Volume (ML)
Rate of Rise
(days)
Rate of Fall
(days)
Brewarrina 18/06/2015 673 40 20586 19 21
Brewarrina 27/07/2015 796 16 9528 8 8
Brewarrina 11/08/2015 710 37 20790 15 22
Brewarrina 16/09/2015 556 36 13873 17 19
Brewarrina 21/10/2015 173 12 1331 3 9
Brewarrina 1/11/2015 93 4 292 3 1
Brewarrina 4/11/2015 914 20 4999 3 17
Brewarrina 23/11/2015 173 10 1137 3 7
Brewarrina 2/12/2015 79 44 767 4 40
Brewarrina 14/01/2016 929 127 20535 22 105
Brewarrina 4/06/2016 6119 55 115680 32 23
Brewarrina 28/07/2016 4916 39 117231 21 18
Brewarrina 4/09/2016 23319 126 1303233 51 75
Brewarrina 7/01/2017 485 21 5893 9 12
Brewarrina 27/01/2017 281 10 2099 4 6
Brewarrina 5/02/2017 293 24 3994 5 19
Brewarrina 28/02/2017 623 27 5726 22 5
Brewarrina 26/03/2017 603 23 9852 14 9
Brewarrina 17/04/2017 3614 74 75125 9 65
Bourke 1/01/1990 3509 35 52522 13 22
Bourke 4/02/1990 1741 22 18944 9 13
Bourke 25/02/1990 4061 39 73334 14 25
Bourke 4/04/1990 137220 103 5246308 39 64
Bourke 15/07/1990 70480 171 3613063 62 109
Bourke 1/01/1991 515 16 5727 3 13
Bourke 16/01/1991 538 20 7501 17 3
Bourke 4/02/1991 14703 55 435934 23 32

Observed Flows in the Barwon–Darling 1990-2017: A Hydrologic Investigation
Page 101
Site Event Start
Date
Peak Flow
(ML/d)
Event
Duration
(days)
Event
Volume (ML)
Rate of Rise
(days)
Rate of Fall
(days)
Bourke 30/03/1991 846 45 31211 16 29
Bourke 13/05/1991 690 18 10654 10 8
Bourke 30/05/1991 11402 23 145267 16 7
Bourke 21/06/1991 14711 30 228550 13 17
Bourke 20/07/1991 9900 50 180970 14 36
Bourke 7/09/1991 600 53 19839 7 46
Bourke 29/10/1991 18109 83 290551 66 17
Bourke 19/01/1992 527 11 4381 7 4
Bourke 29/01/1992 1149 14 7392 12 2
Bourke 11/02/1992 17479 132 429249 28 104
Bourke 21/06/1992 494 37 11541 12 25
Bourke 27/07/1992 345 29 7003 18 11
Bourke 24/08/1992 486 32 9366 18 14
Bourke 24/09/1992 845 17 8393 9 8
Bourke 10/10/1992 470 38 8170 6 32
Bourke 16/11/1992 796 12 5946 8 4
Bourke 27/11/1992 726 11 5619 2 9
Bourke 7/12/1992 793 12 5711 3 9
Bourke 18/12/1992 3481 15 23454 6 9
Bourke 1/01/1993 2608 40 45038 19 21
Bourke 9/02/1993 496 9 3015 6 3
Bourke 17/02/1993 906 24 9193 7 17
Bourke 12/03/1993 167 16 1624 5 11
Bourke 27/03/1993 179 5 432 3 2
Bourke 31/03/1993 248 10 1209 4 6
Bourke 9/04/1993 74 16 443 6 10
Bourke 24/04/1993 15 11 118 6 5
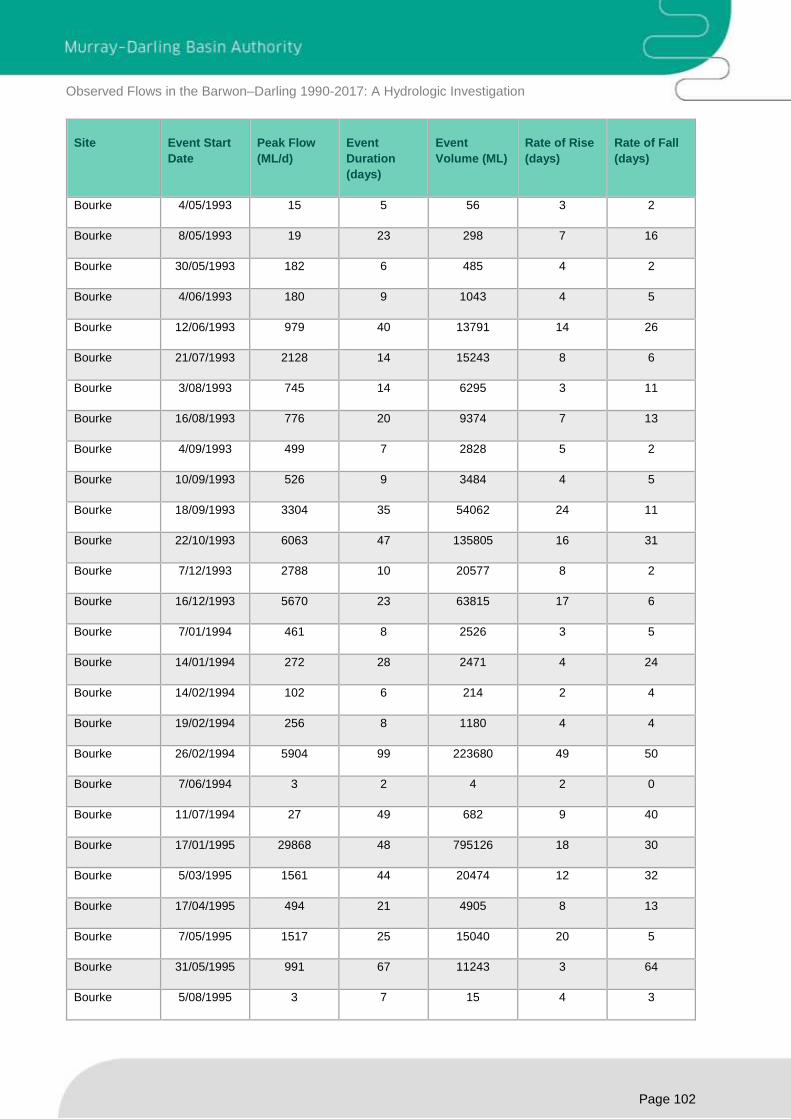
Observed Flows in the Barwon–Darling 1990-2017: A Hydrologic Investigation
Page 102
Site Event Start
Date
Peak Flow
(ML/d)
Event
Duration
(days)
Event
Volume (ML)
Rate of Rise
(days)
Rate of Fall
(days)
Bourke 4/05/1993 15 5 56 3 2
Bourke 8/05/1993 19 23 298 7 16
Bourke 30/05/1993 182 6 485 4 2
Bourke 4/06/1993 180 9 1043 4 5
Bourke 12/06/1993 979 40 13791 14 26
Bourke 21/07/1993 2128 14 15243 8 6
Bourke 3/08/1993 745 14 6295 3 11
Bourke 16/08/1993 776 20 9374 7 13
Bourke 4/09/1993 499 7 2828 5 2
Bourke 10/09/1993 526 9 3484 4 5
Bourke 18/09/1993 3304 35 54062 24 11
Bourke 22/10/1993 6063 47 135805 16 31
Bourke 7/12/1993 2788 10 20577 8 2
Bourke 16/12/1993 5670 23 63815 17 6
Bourke 7/01/1994 461 8 2526 3 5
Bourke 14/01/1994 272 28 2471 4 24
Bourke 14/02/1994 102 6 214 2 4
Bourke 19/02/1994 256 8 1180 4 4
Bourke 26/02/1994 5904 99 223680 49 50
Bourke 7/06/1994 3 2 4 2 0
Bourke 11/07/1994 27 49 682 9 40
Bourke 17/01/1995 29868 48 795126 18 30
Bourke 5/03/1995 1561 44 20474 12 32
Bourke 17/04/1995 494 21 4905 8 13
Bourke 7/05/1995 1517 25 15040 20 5
Bourke 31/05/1995 991 67 11243 3 64
Bourke 5/08/1995 3 7 15 4 3
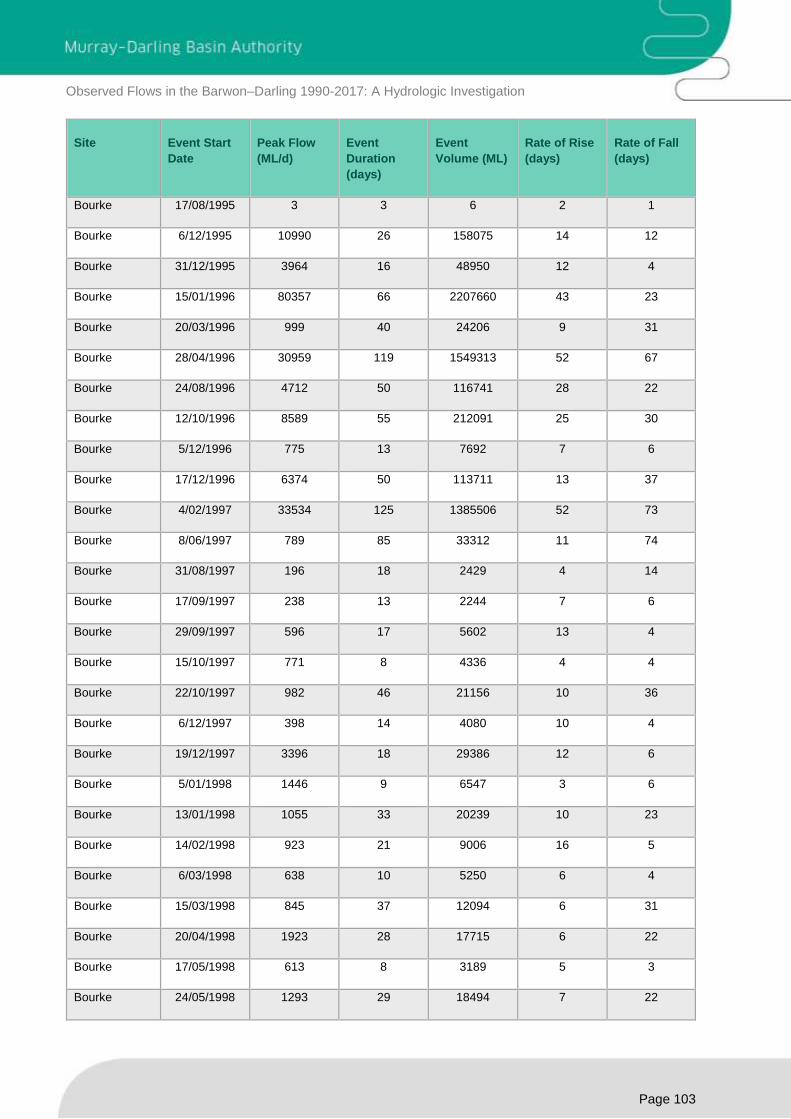
Observed Flows in the Barwon–Darling 1990-2017: A Hydrologic Investigation
Page 103
Site Event Start
Date
Peak Flow
(ML/d)
Event
Duration
(days)
Event
Volume (ML)
Rate of Rise
(days)
Rate of Fall
(days)
Bourke 17/08/1995 3 3 6 2 1
Bourke 6/12/1995 10990 26 158075 14 12
Bourke 31/12/1995 3964 16 48950 12 4
Bourke 15/01/1996 80357 66 2207660 43 23
Bourke 20/03/1996 999 40 24206 9 31
Bourke 28/04/1996 30959 119 1549313 52 67
Bourke 24/08/1996 4712 50 116741 28 22
Bourke 12/10/1996 8589 55 212091 25 30
Bourke 5/12/1996 775 13 7692 7 6
Bourke 17/12/1996 6374 50 113711 13 37
Bourke 4/02/1997 33534 125 1385506 52 73
Bourke 8/06/1997 789 85 33312 11 74
Bourke 31/08/1997 196 18 2429 4 14
Bourke 17/09/1997 238 13 2244 7 6
Bourke 29/09/1997 596 17 5602 13 4
Bourke 15/10/1997 771 8 4336 4 4
Bourke 22/10/1997 982 46 21156 10 36
Bourke 6/12/1997 398 14 4080 10 4
Bourke 19/12/1997 3396 18 29386 12 6
Bourke 5/01/1998 1446 9 6547 3 6
Bourke 13/01/1998 1055 33 20239 10 23
Bourke 14/02/1998 923 21 9006 16 5
Bourke 6/03/1998 638 10 5250 6 4
Bourke 15/03/1998 845 37 12094 6 31
Bourke 20/04/1998 1923 28 17715 6 22
Bourke 17/05/1998 613 8 3189 5 3
Bourke 24/05/1998 1293 29 18494 7 22

Observed Flows in the Barwon–Darling 1990-2017: A Hydrologic Investigation
Page 104
Site Event Start
Date
Peak Flow
(ML/d)
Event
Duration
(days)
Event
Volume (ML)
Rate of Rise
(days)
Rate of Fall
(days)
Bourke 21/06/1998 5326 30 67407 25 5
Bourke 20/07/1998 126799 59 3529654 40 19
Bourke 16/09/1998 231248 58 5719688 15 43
Bourke 14/11/1998 14800 13 159995 1 12
Bourke 26/11/1998 10950 51 199457 3 48
Bourke 15/01/1999 1012 25 15870 17 8
Bourke 8/02/1999 1639 17 20841 15 2
Bourke 24/02/1999 4088 19 43589 7 12
Bourke 14/03/1999 21714 90 768188 29 61
Bourke 11/06/1999 1467 18 19868 6 12
Bourke 28/06/1999 1312 58 48287 23 35
Bourke 24/08/1999 638 32 17306 4 28
Bourke 24/09/1999 608 22 11019 6 16
Bourke 15/10/1999 1014 19 13440 12 7
Bourke 2/11/1999 11333 51 313042 39 12
Bourke 22/12/1999 3565 25 70447 10 15
Bourke 15/01/2000 1535 7 8417 2 5
Bourke 21/01/2000 1430 38 28371 9 29
Bourke 27/02/2000 1627 13 10382 11 2
Bourke 10/03/2000 23732 33 435262 14 19
Bourke 11/04/2000 10181 145 584422 45 100
Bourke 2/09/2000 2252 49 77804 5 44
Bourke 20/10/2000 76217 104 2237890 64 40
Bourke 31/01/2001 37806 58 871166 34 24
Bourke 29/03/2001 6322 62 167848 27 35
Bourke 29/05/2001 1294 68 62581 12 56
Bourke 4/08/2001 3069 45 64011 13 32

Observed Flows in the Barwon–Darling 1990-2017: A Hydrologic Investigation
Page 105
Site Event Start
Date
Peak Flow
(ML/d)
Event
Duration
(days)
Event
Volume (ML)
Rate of Rise
(days)
Rate of Fall
(days)
Bourke 17/09/2001 788 46 24599 14 32
Bourke 1/11/2001 507 38 13173 11 27
Bourke 8/12/2001 749 66 24383 13 53
Bourke 11/02/2002 524 24 6488 16 8
Bourke 6/03/2002 1114 45 25844 14 31
Bourke 19/04/2002 664 31 10517 9 22
Bourke 19/05/2002 244 26 4188 11 15
Bourke 13/06/2002 205 97 9131 18 79
Bourke 17/09/2002 109 29 1620 15 14
Bourke 15/10/2002 68 31 989 16 15
Bourke 15/03/2003 4934 27 69208 8 19
Bourke 10/04/2003 1452 63 51279 29 34
Bourke 11/06/2003 346 43 8735 7 36
Bourke 23/07/2003 186 28 3985 22 6
Bourke 19/08/2003 167 13 1561 6 7
Bourke 31/08/2003 206 57 3883 10 47
Bourke 3/11/2003 621 37 8593 6 31
Bourke 9/12/2003 64 12 565 4 8
Bourke 20/12/2003 2621 31 33339 15 16
Bourke 19/01/2004 21586 51 441702 30 21
Bourke 9/03/2004 10485 52 238764 31 21
Bourke 29/04/2004 1722 32 19781 4 28
Bourke 30/05/2004 414 57 11636 11 46
Bourke 25/07/2004 136 35 2818 3 32
Bourke 28/08/2004 52 34 990 4 30
Bourke 30/09/2004 597 52 10563 13 39
Bourke 20/11/2004 823 9 2557 4 5

Observed Flows in the Barwon–Darling 1990-2017: A Hydrologic Investigation
Page 106
Site Event Start
Date
Peak Flow
(ML/d)
Event
Duration
(days)
Event
Volume (ML)
Rate of Rise
(days)
Rate of Fall
(days)
Bourke 28/11/2004 187 9 1276 6 3
Bourke 6/12/2004 192 5 734 2 3
Bourke 10/12/2004 25558 60 436615 31 29
Bourke 7/02/2005 963 51 16341 6 45
Bourke 29/03/2005 68 34 1044 9 25
Bourke 1/05/2005 21 32 553 14 18
Bourke 1/06/2005 42 23 505 14 9
Bourke 23/06/2005 252 11 927 7 4
Bourke 3/07/2005 12740 85 224928 20 65
Bourke 25/09/2005 493 53 15142 7 46
Bourke 16/11/2005 346 28 5097 15 13
Bourke 13/12/2005 805 16 7369 12 4
Bourke 28/12/2005 1292 35 18219 3 32
Bourke 31/01/2006 652 30 9495 17 13
Bourke 1/03/2006 909 90 36372 11 79
Bourke 29/05/2006 112 28 2406 11 17
Bourke 25/06/2006 129 20 2087 7 13
Bourke 14/07/2006 110 17 1407 3 14
Bourke 30/07/2006 107 50 3157 23 27
Bourke 5/04/2007 114 23 1310 4 19
Bourke 27/04/2007 37 12 223 2 10
Bourke 12/05/2007 1593 56 14484 13 43
Bourke 6/07/2007 310 14 2512 6 8
Bourke 19/07/2007 799 56 19138 17 39
Bourke 12/09/2007 1094 43 22259 17 26
Bourke 24/10/2007 318 15 1211 3 12
Bourke 7/11/2007 111 15 685 5 10

Observed Flows in the Barwon–Darling 1990-2017: A Hydrologic Investigation
Page 107
Site Event Start
Date
Peak Flow
(ML/d)
Event
Duration
(days)
Event
Volume (ML)
Rate of Rise
(days)
Rate of Fall
(days)
Bourke 25/11/2007 765 10 4557 4 6
Bourke 4/12/2007 2052 9 12560 5 4
Bourke 12/12/2007 26300 53 574142 31 22
Bourke 2/02/2008 10317 52 286083 31 21
Bourke 24/03/2008 1416 57 14830 4 53
Bourke 19/05/2008 41 22 662 18 4
Bourke 9/06/2008 101 19 623 3 16
Bourke 27/06/2008 87 66 2967 15 51
Bourke 31/08/2008 18 20 238 2 18
Bourke 24/09/2008 35 12 287 8 4
Bourke 5/10/2008 483 5 922 3 2
Bourke 9/10/2008 236 13 1965 4 9
Bourke 21/10/2008 175 28 2273 6 22
Bourke 17/11/2008 29 7 149 4 3
Bourke 23/11/2008 56 14 406 5 9
Bourke 6/12/2008 14 6 45 3 3
Bourke 13/12/2008 1154 18 10303 10 8
Bourke 30/12/2008 1598 46 42626 5 41
Bourke 13/02/2009 13093 9 53405 3 6
Bourke 21/02/2009 9390 55 140926 9 46
Bourke 16/04/2009 510 19 4225 4 15
Bourke 4/05/2009 303 20 2141 18 2
Bourke 23/05/2009 368 14 3563 4 10
Bourke 5/06/2009 2398 119 69514 10 109
Bourke 27/12/2009 45075 50 1302267 28 22
Bourke 14/02/2010 3397 8 18644 4 4
Bourke 21/02/2010 33817 142 1100301 50 92

Observed Flows in the Barwon–Darling 1990-2017: A Hydrologic Investigation
Page 108
Site Event Start
Date
Peak Flow
(ML/d)
Event
Duration
(days)
Event
Volume (ML)
Rate of Rise
(days)
Rate of Fall
(days)
Bourke 12/07/2010 292 23 4965 12 11
Bourke 3/08/2010 22854 123 1570813 96 27
Bourke 3/12/2010 78569 58 2967450 40 18
Bourke 29/01/2011 88007 53 2864081 23 30
Bourke 22/03/2011 6654 14 69969 8 6
Bourke 4/04/2011 8454 31 197752 12 19
Bourke 4/05/2011 7072 57 161697 16 41
Bourke 29/06/2011 1371 72 76934 15 57
Bourke 8/09/2011 2917 87 136194 54 33
Bourke 3/12/2011 74837 64 2686306 40 24
Bourke 4/02/2012 257306 119 5638106 31 88
Bourke 1/06/2012 15588 145 638677 69 76
Bourke 23/10/2012 813 65 36076 39 26
Bourke 26/12/2012 418 23 6677 8 15
Bourke 17/01/2013 242 27 4067 7 20
Bourke 12/02/2013 24014 32 403050 24 8
Bourke 15/03/2013 23646 101 703953 26 75
Bourke 23/06/2013 1116 85 69356 35 50
Bourke 15/09/2013 520 71 14124 8 63
Bourke 24/11/2013 183 42 3497 14 28
Bourke 4/01/2014 28 18 327 8 10
Bourke 29/01/2014 416 41 3420 32 9
Bourke 10/03/2014 419 14 4042 6 8
Bourke 23/03/2014 770 16 6711 7 9
Bourke 7/04/2014 2821 13 19484 7 6
Bourke 19/04/2014 2686 59 37435 7 52
Bourke 16/06/2014 528 58 8413 15 43

Observed Flows in the Barwon–Darling 1990-2017: A Hydrologic Investigation
Page 109
Site Event Start
Date
Peak Flow
(ML/d)
Event
Duration
(days)
Event
Volume (ML)
Rate of Rise
(days)
Rate of Fall
(days)
Bourke 12/08/2014 197 44 3638 21 23
Bourke 24/09/2014 50 20 534 2 18
Bourke 10/11/2014 156 25 1488 4 21
Bourke 4/12/2014 17 8 93 3 5
Bourke 26/01/2015 342 11 1957 4 7
Bourke 5/02/2015 2886 64 39337 19 45
Bourke 26/04/2015 1878 44 33858 3 41
Bourke 8/06/2015 595 8 3865 3 5
Bourke 15/06/2015 1363 48 30311 17 31
Bourke 1/08/2015 729 16 8725 7 9
Bourke 16/08/2015 646 38 18436 14 24
Bourke 22/09/2015 445 44 12428 4 40
Bourke 4/11/2015 946 13 6742 6 7
Bourke 16/11/2015 458 36 4259 4 32
Bourke 30/01/2016 648 15 5288 9 6
Bourke 13/02/2016 716 13 6932 7 6
Bourke 25/02/2016 1354 48 14915 4 44
Bourke 18/06/2016 8522 42 179627 21 21
Bourke 29/07/2016 8148 42 237690 24 18
Bourke 8/09/2016 39098 130 2000430 53 77
Bourke 15/01/2017 466 19 6185 7 12
Bourke 2/02/2017 287 35 6202 5 30
Bourke 8/03/2017 1218 22 8700 18 4
Bourke 29/03/2017 628 22 10383 16 6
Bourke 19/04/2017 4732 27 49424 11 16
Bourke 15/05/2017 1074 19 12352 14 5
Wilcannia 1/01/1990 3426 47 68384 22 25
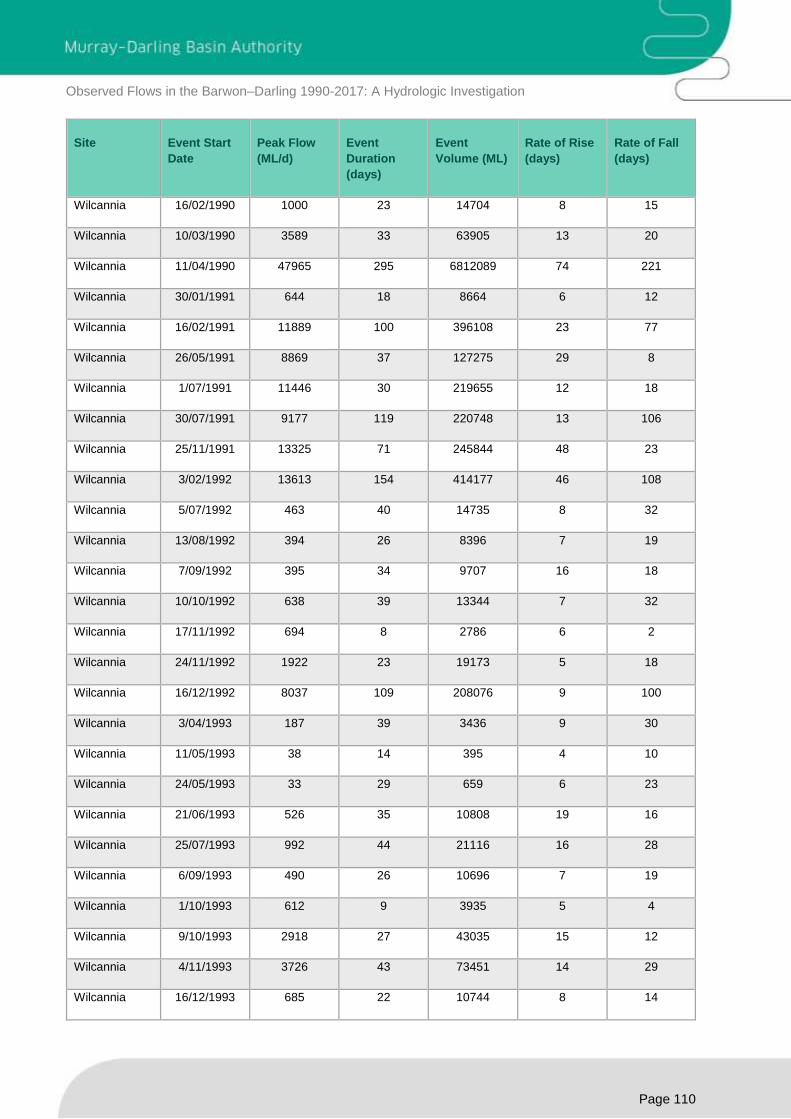
Observed Flows in the Barwon–Darling 1990-2017: A Hydrologic Investigation
Page 110
Site Event Start
Date
Peak Flow
(ML/d)
Event
Duration
(days)
Event
Volume (ML)
Rate of Rise
(days)
Rate of Fall
(days)
Wilcannia 16/02/1990 1000 23 14704 8 15
Wilcannia 10/03/1990 3589 33 63905 13 20
Wilcannia 11/04/1990 47965 295 6812089 74 221
Wilcannia 30/01/1991 644 18 8664 6 12
Wilcannia 16/02/1991 11889 100 396108 23 77
Wilcannia 26/05/1991 8869 37 127275 29 8
Wilcannia 1/07/1991 11446 30 219655 12 18
Wilcannia 30/07/1991 9177 119 220748 13 106
Wilcannia 25/11/1991 13325 71 245844 48 23
Wilcannia 3/02/1992 13613 154 414177 46 108
Wilcannia 5/07/1992 463 40 14735 8 32
Wilcannia 13/08/1992 394 26 8396 7 19
Wilcannia 7/09/1992 395 34 9707 16 18
Wilcannia 10/10/1992 638 39 13344 7 32
Wilcannia 17/11/1992 694 8 2786 6 2
Wilcannia 24/11/1992 1922 23 19173 5 18
Wilcannia 16/12/1992 8037 109 208076 9 100
Wilcannia 3/04/1993 187 39 3436 9 30
Wilcannia 11/05/1993 38 14 395 4 10
Wilcannia 24/05/1993 33 29 659 6 23
Wilcannia 21/06/1993 526 35 10808 19 16
Wilcannia 25/07/1993 992 44 21116 16 28
Wilcannia 6/09/1993 490 26 10696 7 19
Wilcannia 1/10/1993 612 9 3935 5 4
Wilcannia 9/10/1993 2918 27 43035 15 12
Wilcannia 4/11/1993 3726 43 73451 14 29
Wilcannia 16/12/1993 685 22 10744 8 14

Observed Flows in the Barwon–Darling 1990-2017: A Hydrologic Investigation
Page 111
Site Event Start
Date
Peak Flow
(ML/d)
Event
Duration
(days)
Event
Volume (ML)
Rate of Rise
(days)
Rate of Fall
(days)
Wilcannia 6/01/1994 1609 40 17096 7 33
Wilcannia 14/02/1994 33 5 136 3 2
Wilcannia 18/02/1994 1989 15 13148 7 8
Wilcannia 4/03/1994 5708 159 221048 50 109
Wilcannia 9/08/1994 21 75 622 16 59
Wilcannia 20/01/1995 32 9 92 2 7
Wilcannia 28/01/1995 24544 51 726739 27 24
Wilcannia 19/03/1995 1038 45 23907 9 36
Wilcannia 2/05/1995 419 26 6250 10 16
Wilcannia 27/05/1995 1330 121 28212 11 110
Wilcannia 24/09/1995 7 27 118 3 24
Wilcannia 20/10/1995 2 14 17 5 9
Wilcannia 4/11/1995 2 13 17 3 10
Wilcannia 19/12/1995 8462 25 125745 9 16
Wilcannia 12/01/1996 2609 15 31747 9 6
Wilcannia 26/01/1996 30960 100 1480440 60 40
Wilcannia 4/05/1996 25716 125 1458489 61 64
Wilcannia 5/09/1996 3672 48 103470 29 19
Wilcannia 22/10/1996 7709 69 201069 23 46
Wilcannia 29/12/1996 4029 45 71715 11 34
Wilcannia 11/02/1997 25535 131 1240705 62 69
Wilcannia 21/06/1997 810 80 37300 11 69
Wilcannia 8/09/1997 352 29 6411 7 22
Wilcannia 6/10/1997 301 12 2400 3 9
Wilcannia 17/10/1997 288 12 2767 7 5
Wilcannia 28/10/1997 350 18 5040 6 12
Wilcannia 14/11/1997 424 35 8118 11 24

Observed Flows in the Barwon–Darling 1990-2017: A Hydrologic Investigation
Page 112
Site Event Start
Date
Peak Flow
(ML/d)
Event
Duration
(days)
Event
Volume (ML)
Rate of Rise
(days)
Rate of Fall
(days)
Wilcannia 18/12/1997 2082 27 18166 23 4
Wilcannia 13/01/1998 2722 50 32816 5 45
Wilcannia 3/03/1998 268 27 5056 12 15
Wilcannia 29/03/1998 234 30 4902 7 23
Wilcannia 27/04/1998 761 34 13404 10 24
Wilcannia 30/05/1998 502 22 8027 16 6
Wilcannia 20/06/1998 43449 234 4267894 124 110
Wilcannia 8/02/1999 2121 45 54548 36 9
Wilcannia 24/03/1999 16939 90 684519 31 59
Wilcannia 21/06/1999 1574 98 92260 9 89
Wilcannia 26/09/1999 625 36 15856 19 17
Wilcannia 31/10/1999 10800 111 386420 49 62
Wilcannia 18/02/2000 6476 23 62519 10 13
Wilcannia 11/03/2000 20469 43 519132 25 18
Wilcannia 22/04/2000 13456 197 1102152 23 174
Wilcannia 4/11/2000 30336 106 1518044 79 27
Wilcannia 17/02/2001 25855 53 735161 34 19
Wilcannia 10/04/2001 5704 132 234521 25 107
Wilcannia 19/08/2001 1155 91 63938 11 80
Wilcannia 17/11/2001 401 38 11334 11 27
Wilcannia 24/12/2001 478 75 18145 9 66
Wilcannia 8/03/2002 670 59 21806 26 33
Wilcannia 5/05/2002 381 35 7830 8 27
Wilcannia 8/06/2002 141 27 3096 9 18
Wilcannia 4/07/2002 112 97 4690 16 81
Wilcannia 22/12/2002 5 16 62 6 10
Wilcannia 6/01/2003 5 18 72 11 7

Observed Flows in the Barwon–Darling 1990-2017: A Hydrologic Investigation
Page 113
Site Event Start
Date
Peak Flow
(ML/d)
Event
Duration
(days)
Event
Volume (ML)
Rate of Rise
(days)
Rate of Fall
(days)
Wilcannia 4/04/2003 3102 28 41675 3 25
Wilcannia 1/05/2003 1191 57 40119 6 51
Wilcannia 26/06/2003 378 46 8620 7 39
Wilcannia 10/08/2003 183 16 1966 6 10
Wilcannia 25/08/2003 191 30 3924 12 18
Wilcannia 23/09/2003 70 29 1134 10 19
Wilcannia 15/01/2004 1843 17 21438 3 14
Wilcannia 31/01/2004 15723 55 352535 28 27
Wilcannia 25/03/2004 9030 45 196191 22 23
Wilcannia 8/05/2004 1137 127 32760 7 120
Wilcannia 1/10/2004 7 5 22 3 2
Wilcannia 9/11/2004 103 18 932 3 15
Wilcannia 2/01/2005 17880 50 336767 17 33
Wilcannia 20/02/2005 569 99 11543 10 89
Wilcannia 29/05/2005 6 24 67 15 9
Wilcannia 21/06/2005 6 8 35 5 3
Wilcannia 28/06/2005 10 8 47 3 5
Wilcannia 5/07/2005 6 8 40 5 3
Wilcannia 12/07/2005 9468 90 180600 20 70
Wilcannia 9/10/2005 252 73 6564 10 63
Wilcannia 9/01/2006 621 49 9989 11 38
Wilcannia 7/03/2006 77 13 645 4 9
Wilcannia 19/03/2006 536 83 19218 13 70
Wilcannia 9/06/2006 29 21 275 3 18
Wilcannia 29/06/2006 9 11 64 3 8
Wilcannia 9/07/2006 346 76 4172 18 58
Wilcannia 21/08/2007 452 8 2845 4 4
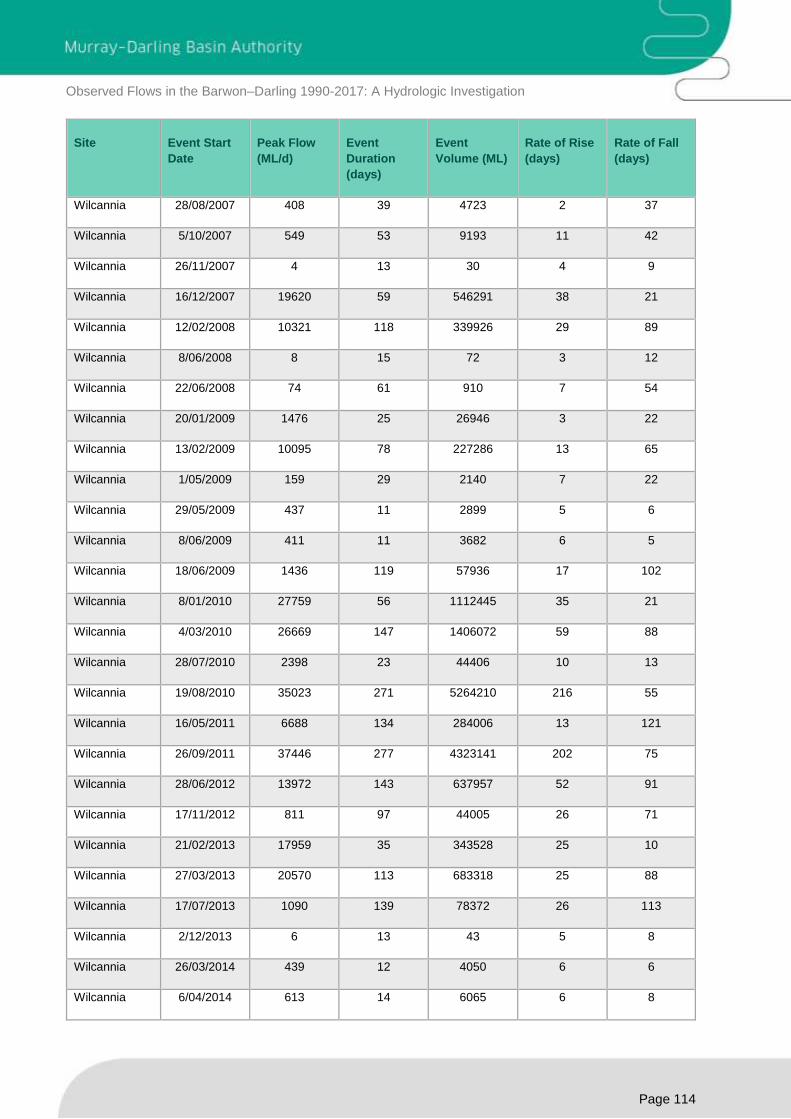
Observed Flows in the Barwon–Darling 1990-2017: A Hydrologic Investigation
Page 114
Site Event Start
Date
Peak Flow
(ML/d)
Event
Duration
(days)
Event
Volume (ML)
Rate of Rise
(days)
Rate of Fall
(days)
Wilcannia 28/08/2007 408 39 4723 2 37
Wilcannia 5/10/2007 549 53 9193 11 42
Wilcannia 26/11/2007 4 13 30 4 9
Wilcannia 16/12/2007 19620 59 546291 38 21
Wilcannia 12/02/2008 10321 118 339926 29 89
Wilcannia 8/06/2008 8 15 72 3 12
Wilcannia 22/06/2008 74 61 910 7 54
Wilcannia 20/01/2009 1476 25 26946 3 22
Wilcannia 13/02/2009 10095 78 227286 13 65
Wilcannia 1/05/2009 159 29 2140 7 22
Wilcannia 29/05/2009 437 11 2899 5 6
Wilcannia 8/06/2009 411 11 3682 6 5
Wilcannia 18/06/2009 1436 119 57936 17 102
Wilcannia 8/01/2010 27759 56 1112445 35 21
Wilcannia 4/03/2010 26669 147 1406072 59 88
Wilcannia 28/07/2010 2398 23 44406 10 13
Wilcannia 19/08/2010 35023 271 5264210 216 55
Wilcannia 16/05/2011 6688 134 284006 13 121
Wilcannia 26/09/2011 37446 277 4323141 202 75
Wilcannia 28/06/2012 13972 143 637957 52 91
Wilcannia 17/11/2012 811 97 44005 26 71
Wilcannia 21/02/2013 17959 35 343528 25 10
Wilcannia 27/03/2013 20570 113 683318 25 88
Wilcannia 17/07/2013 1090 139 78372 26 113
Wilcannia 2/12/2013 6 13 43 5 8
Wilcannia 26/03/2014 439 12 4050 6 6
Wilcannia 6/04/2014 613 14 6065 6 8
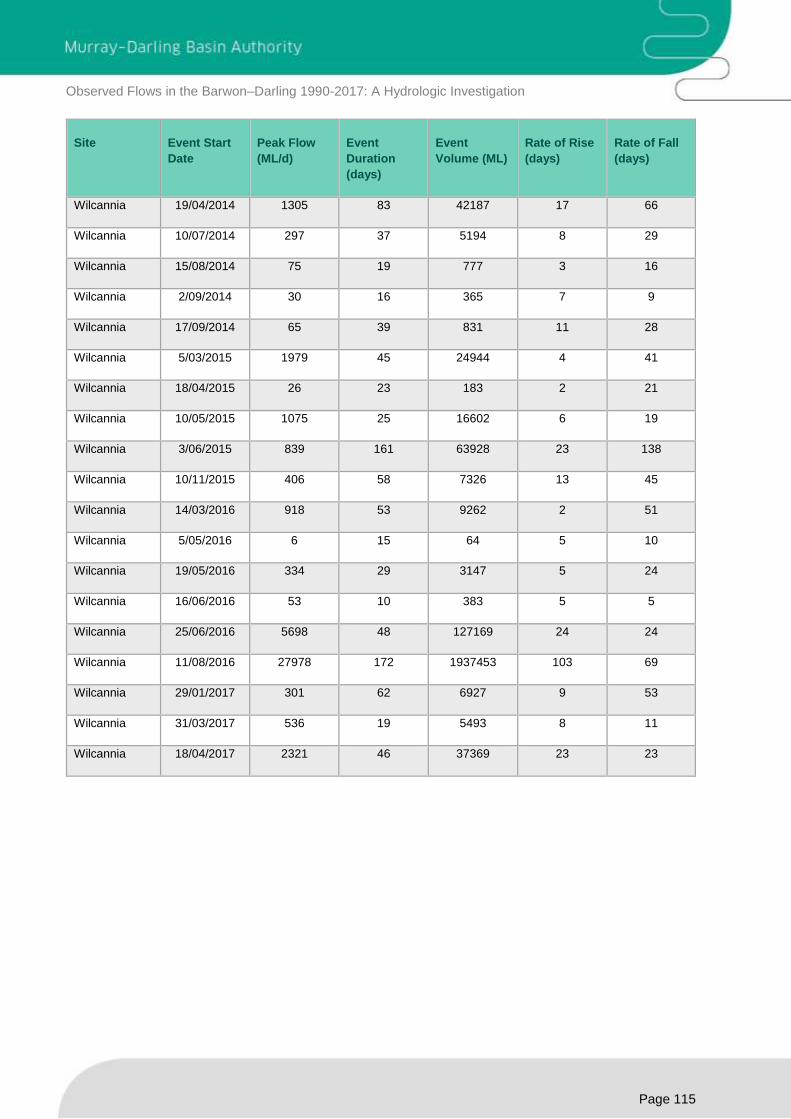
Observed Flows in the Barwon–Darling 1990-2017: A Hydrologic Investigation
Page 115
Site Event Start
Date
Peak Flow
(ML/d)
Event
Duration
(days)
Event
Volume (ML)
Rate of Rise
(days)
Rate of Fall
(days)
Wilcannia 19/04/2014 1305 83 42187 17 66
Wilcannia 10/07/2014 297 37 5194 8 29
Wilcannia 15/08/2014 75 19 777 3 16
Wilcannia 2/09/2014 30 16 365 7 9
Wilcannia 17/09/2014 65 39 831 11 28
Wilcannia 5/03/2015 1979 45 24944 4 41
Wilcannia 18/04/2015 26 23 183 2 21
Wilcannia 10/05/2015 1075 25 16602 6 19
Wilcannia 3/06/2015 839 161 63928 23 138
Wilcannia 10/11/2015 406 58 7326 13 45
Wilcannia 14/03/2016 918 53 9262 2 51
Wilcannia 5/05/2016 6 15 64 5 10
Wilcannia 19/05/2016 334 29 3147 5 24
Wilcannia 16/06/2016 53 10 383 5 5
Wilcannia 25/06/2016 5698 48 127169 24 24
Wilcannia 11/08/2016 27978 172 1937453 103 69
Wilcannia 29/01/2017 301 62 6927 9 53
Wilcannia 31/03/2017 536 19 5493 8 11
Wilcannia 18/04/2017 2321 46 37369 23 23
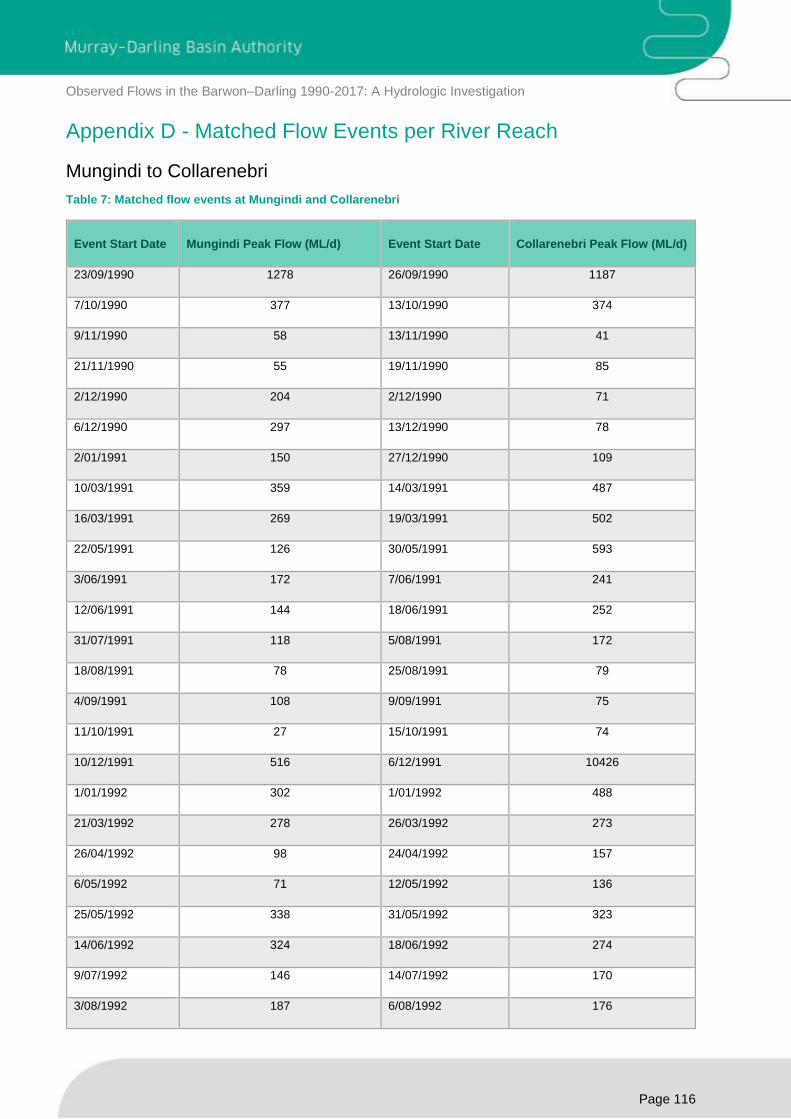
Observed Flows in the Barwon–Darling 1990-2017: A Hydrologic Investigation
Page 116
Appendix D - Matched Flow Events per River Reach
Mungindi to Collarenebri
Table 7: Matched flow events at Mungindi and Collarenebri
Event Start Date Mungindi Peak Flow (ML/d) Event Start Date Collarenebri Peak Flow (ML/d)
23/09/1990 1278 26/09/1990 1187
7/10/1990 377 13/10/1990 374
9/11/1990 58 13/11/1990 41
21/11/1990 55 19/11/1990 85
2/12/1990 204 2/12/1990 71
6/12/1990 297 13/12/1990 78
2/01/1991 150 27/12/1990 109
10/03/1991 359 14/03/1991 487
16/03/1991 269 19/03/1991 502
22/05/1991 126 30/05/1991 593
3/06/1991 172 7/06/1991 241
12/06/1991 144 18/06/1991 252
31/07/1991 118 5/08/1991 172
18/08/1991 78 25/08/1991 79
4/09/1991 108 9/09/1991 75
11/10/1991 27 15/10/1991 74
10/12/1991 516 6/12/1991 10426
1/01/1992 302 1/01/1992 488
21/03/1992 278 26/03/1992 273
26/04/1992 98 24/04/1992 157
6/05/1992 71 12/05/1992 136
25/05/1992 338 31/05/1992 323
14/06/1992 324 18/06/1992 274
9/07/1992 146 14/07/1992 170
3/08/1992 187 6/08/1992 176
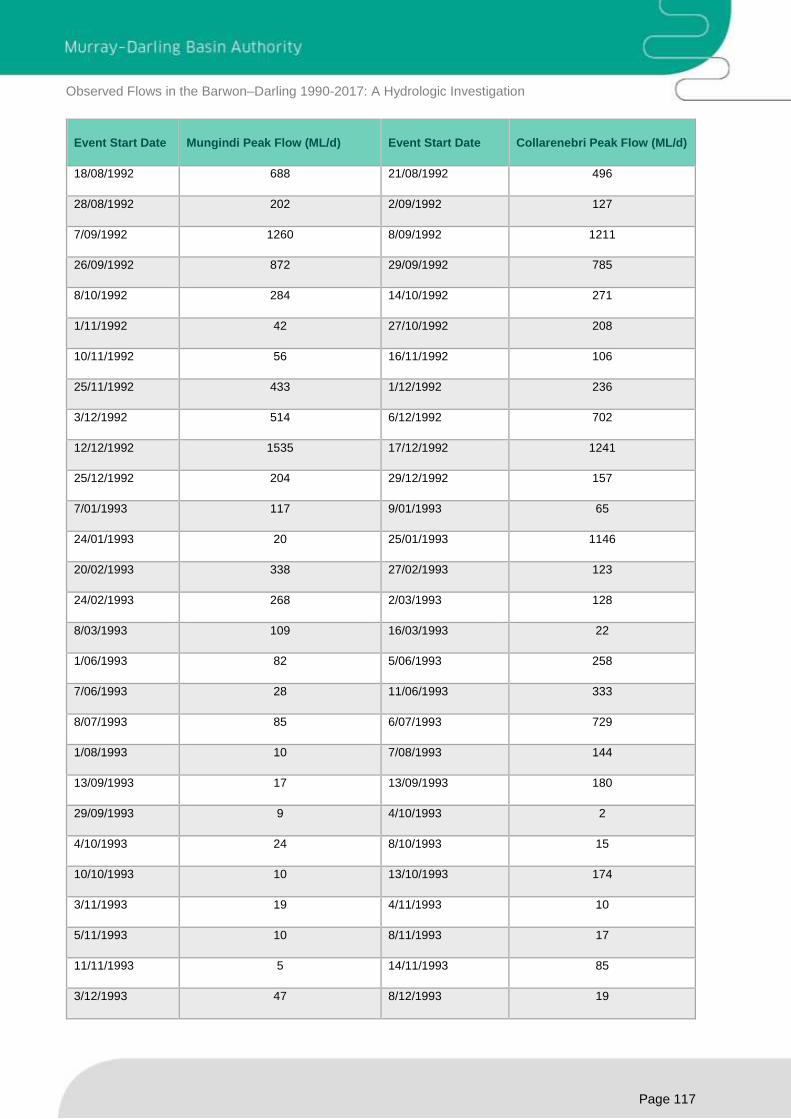
Observed Flows in the Barwon–Darling 1990-2017: A Hydrologic Investigation
Page 117
Event Start Date Mungindi Peak Flow (ML/d) Event Start Date Collarenebri Peak Flow (ML/d)
18/08/1992 688 21/08/1992 496
28/08/1992 202 2/09/1992 127
7/09/1992 1260 8/09/1992 1211
26/09/1992 872 29/09/1992 785
8/10/1992 284 14/10/1992 271
1/11/1992 42 27/10/1992 208
10/11/1992 56 16/11/1992 106
25/11/1992 433 1/12/1992 236
3/12/1992 514 6/12/1992 702
12/12/1992 1535 17/12/1992 1241
25/12/1992 204 29/12/1992 157
7/01/1993 117 9/01/1993 65
24/01/1993 20 25/01/1993 1146
20/02/1993 338 27/02/1993 123
24/02/1993 268 2/03/1993 128
8/03/1993 109 16/03/1993 22
1/06/1993 82 5/06/1993 258
7/06/1993 28 11/06/1993 333
8/07/1993 85 6/07/1993 729
1/08/1993 10 7/08/1993 144
13/09/1993 17 13/09/1993 180
29/09/1993 9 4/10/1993 2
4/10/1993 24 8/10/1993 15
10/10/1993 10 13/10/1993 174
3/11/1993 19 4/11/1993 10
5/11/1993 10 8/11/1993 17
11/11/1993 5 14/11/1993 85
3/12/1993 47 8/12/1993 19
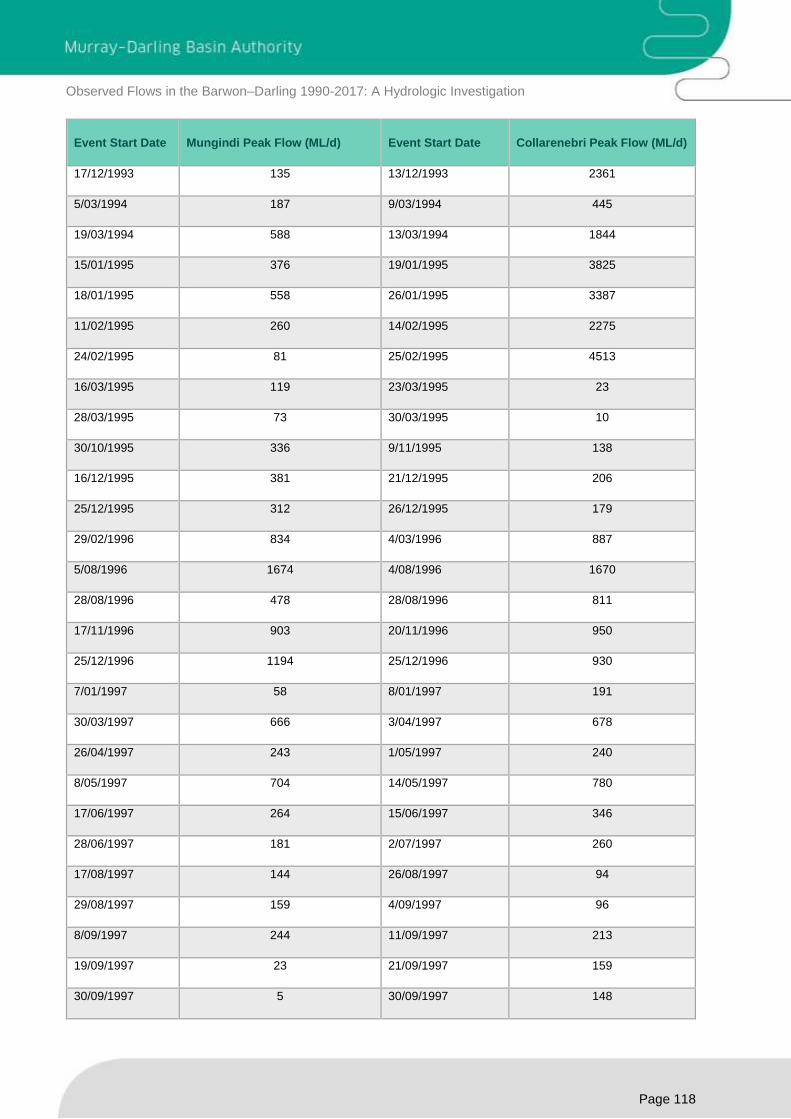
Observed Flows in the Barwon–Darling 1990-2017: A Hydrologic Investigation
Page 118
Event Start Date Mungindi Peak Flow (ML/d) Event Start Date Collarenebri Peak Flow (ML/d)
17/12/1993 135 13/12/1993 2361
5/03/1994 187 9/03/1994 445
19/03/1994 588 13/03/1994 1844
15/01/1995 376 19/01/1995 3825
18/01/1995 558 26/01/1995 3387
11/02/1995 260 14/02/1995 2275
24/02/1995 81 25/02/1995 4513
16/03/1995 119 23/03/1995 23
28/03/1995 73 30/03/1995 10
30/10/1995 336 9/11/1995 138
16/12/1995 381 21/12/1995 206
25/12/1995 312 26/12/1995 179
29/02/1996 834 4/03/1996 887
5/08/1996 1674 4/08/1996 1670
28/08/1996 478 28/08/1996 811
17/11/1996 903 20/11/1996 950
25/12/1996 1194 25/12/1996 930
7/01/1997 58 8/01/1997 191
30/03/1997 666 3/04/1997 678
26/04/1997 243 1/05/1997 240
8/05/1997 704 14/05/1997 780
17/06/1997 264 15/06/1997 346
28/06/1997 181 2/07/1997 260
17/08/1997 144 26/08/1997 94
29/08/1997 159 4/09/1997 96
8/09/1997 244 11/09/1997 213
19/09/1997 23 21/09/1997 159
30/09/1997 5 30/09/1997 148

Observed Flows in the Barwon–Darling 1990-2017: A Hydrologic Investigation
Page 119
Event Start Date Mungindi Peak Flow (ML/d) Event Start Date Collarenebri Peak Flow (ML/d)
10/10/1997 123 12/10/1997 329
14/10/1997 883 19/10/1997 317
28/10/1997 241 31/10/1997 381
14/11/1997 375 18/11/1997 493
21/11/1997 904 24/11/1997 679
2/12/1997 161 7/12/1997 4992
15/12/1997 632 16/12/1997 3878
11/01/1998 97 10/01/1998 153
17/01/1998 180 18/01/1998 96
27/01/1998 100 26/01/1998 331
8/02/1998 114 6/02/1998 818
19/02/1998 832 18/02/1998 776
26/02/1998 129 27/02/1998 641
13/03/1998 163 21/03/1998 173
7/04/1998 320 8/05/1998 253
16/05/1998 540 21/05/1998 307
23/05/1998 139 28/05/1998 333
3/06/1998 242 8/06/1998 224
19/06/1998 117 26/06/1998 526
18/07/1998 1181 14/07/1998 1319
21/11/1998 1374 24/11/1998 2143
3/12/1998 482 7/12/1998 645
11/12/1998 332 16/12/1998 556
26/12/1998 593 31/12/1998 695
25/01/1999 357 23/01/1999 2762
13/02/1999 929 12/02/1999 3062
14/04/1999 1601 5/04/1999 3158
14/04/1999 1601 16/04/1999 2008
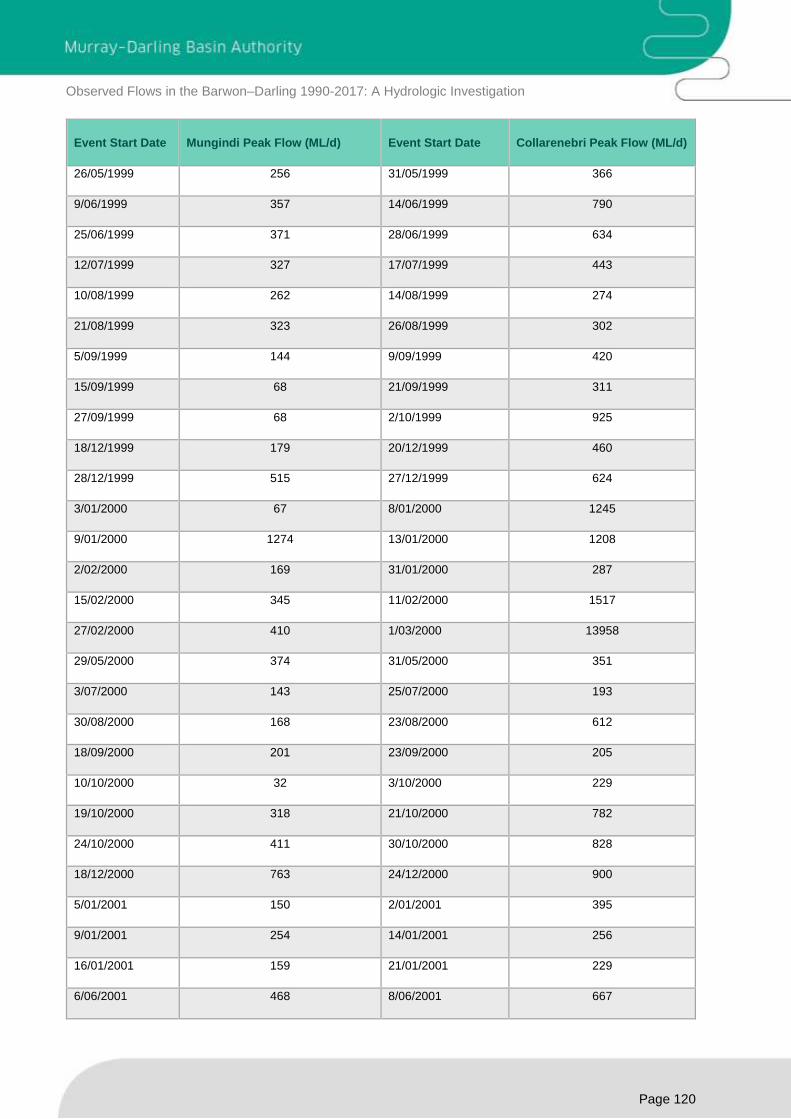
Observed Flows in the Barwon–Darling 1990-2017: A Hydrologic Investigation
Page 120
Event Start Date Mungindi Peak Flow (ML/d) Event Start Date Collarenebri Peak Flow (ML/d)
26/05/1999 256 31/05/1999 366
9/06/1999 357 14/06/1999 790
25/06/1999 371 28/06/1999 634
12/07/1999 327 17/07/1999 443
10/08/1999 262 14/08/1999 274
21/08/1999 323 26/08/1999 302
5/09/1999 144 9/09/1999 420
15/09/1999 68 21/09/1999 311
27/09/1999 68 2/10/1999 925
18/12/1999 179 20/12/1999 460
28/12/1999 515 27/12/1999 624
3/01/2000 67 8/01/2000 1245
9/01/2000 1274 13/01/2000 1208
2/02/2000 169 31/01/2000 287
15/02/2000 345 11/02/2000 1517
27/02/2000 410 1/03/2000 13958
29/05/2000 374 31/05/2000 351
3/07/2000 143 25/07/2000 193
30/08/2000 168 23/08/2000 612
18/09/2000 201 23/09/2000 205
10/10/2000 32 3/10/2000 229
19/10/2000 318 21/10/2000 782
24/10/2000 411 30/10/2000 828
18/12/2000 763 24/12/2000 900
5/01/2001 150 2/01/2001 395
9/01/2001 254 14/01/2001 256
16/01/2001 159 21/01/2001 229
6/06/2001 468 8/06/2001 667

Observed Flows in the Barwon–Darling 1990-2017: A Hydrologic Investigation
Page 121
Event Start Date Mungindi Peak Flow (ML/d) Event Start Date Collarenebri Peak Flow (ML/d)
24/07/2001 831 22/07/2001 3392
17/08/2001 345 21/08/2001 493
6/09/2001 307 8/09/2001 481
19/09/2001 272 24/09/2001 262
24/11/2001 168 15/11/2001 291
6/12/2001 1261 2/12/2001 1746
22/12/2001 139 24/12/2001 1040
27/12/2001 241 2/01/2002 381
31/01/2002 337 4/02/2002 798
26/02/2002 352 25/02/2002 875
10/03/2002 230 10/03/2002 711
14/03/2002 141 20/03/2002 329
29/03/2002 1867 3/04/2002 1037
15/04/2002 257 27/04/2002 349
1/06/2002 106 25/05/2002 181
29/08/2002 62 26/08/2002 40
17/09/2002 98 15/09/2002 175
22/09/2002 91 27/09/2002 131
1/10/2002 125 2/10/2002 255
14/10/2002 57 19/10/2002 95
19/10/2002 156 19/10/2002 95
19/11/2002 97 24/11/2002 21
2/12/2002 70 4/12/2002 61
6/12/2002 76 16/12/2002 31
12/12/2002 232 20/12/2002 315
18/01/2003 43 22/01/2003 24
27/01/2003 236 3/02/2003 34
9/02/2003 157 7/02/2003 138

Observed Flows in the Barwon–Darling 1990-2017: A Hydrologic Investigation
Page 122
Event Start Date Mungindi Peak Flow (ML/d) Event Start Date Collarenebri Peak Flow (ML/d)
20/02/2003 212 17/02/2003 381
2/03/2003 1653 27/02/2003 5262
28/03/2003 656 28/03/2003 1053
5/04/2003 694 9/04/2003 1190
24/04/2003 1053 22/04/2003 1300
18/06/2003 219 26/06/2003 305
10/08/2003 218 14/08/2003 220
28/09/2003 75 5/10/2003 76
7/10/2003 1614 15/10/2003 1549
13/11/2003 241 18/11/2003 257
28/11/2003 125 4/12/2003 108
11/02/2004 1431 15/02/2004 1159
11/03/2004 799 29/02/2004 11406
4/05/2004 160 8/05/2004 172
21/05/2004 117 25/05/2004 174
26/07/2004 16 26/07/2004 57
18/08/2004 41 7/09/2004 77
12/09/2004 1302 18/09/2004 1160
29/10/2004 48 10/11/2004 48
12/11/2004 1361 20/11/2004 1527
24/01/2005 1192 23/01/2005 1865
17/02/2005 61 23/02/2005 54
1/03/2005 120 28/02/2005 262
27/03/2005 18 30/03/2005 60
12/06/2005 19 11/06/2005 84
28/06/2005 1010 5/07/2005 7041
1/08/2005 265 16/08/2005 377
11/09/2005 65 14/09/2005 131

Observed Flows in the Barwon–Darling 1990-2017: A Hydrologic Investigation
Page 123
Event Start Date Mungindi Peak Flow (ML/d) Event Start Date Collarenebri Peak Flow (ML/d)
20/09/2005 237 30/09/2005 183
15/10/2005 81 19/10/2005 114
22/10/2005 90 25/10/2005 167
14/11/2005 118 19/11/2005 254
23/11/2005 1275 27/11/2005 1150
14/12/2005 936 14/12/2005 1189
25/12/2005 1070 29/12/2005 849
6/01/2006 121 6/01/2006 379
25/01/2006 1588 17/01/2006 2034
16/02/2006 1725 15/02/2006 3052
25/04/2006 131 2/05/2006 130
11/06/2006 14 21/06/2006 40
25/07/2006 65 28/07/2006 85
10/09/2006 30 12/09/2006 6
22/09/2006 145 22/09/2006 61
28/09/2006 137 30/09/2006 32
4/10/2006 128 6/10/2006 54
16/10/2006 139 20/10/2006 48
27/10/2006 48 3/11/2006 194
7/11/2006 139 10/11/2006 159
11/11/2006 581 19/11/2006 408
5/12/2006 219 7/12/2006 197
11/12/2006 655 17/12/2006 575
23/12/2006 454 27/12/2006 422
31/12/2006 201 6/01/2007 167
15/01/2007 161 15/01/2007 110
26/01/2007 150 27/01/2007 127
4/02/2007 19 6/02/2007 104

Observed Flows in the Barwon–Darling 1990-2017: A Hydrologic Investigation
Page 124
Event Start Date Mungindi Peak Flow (ML/d) Event Start Date Collarenebri Peak Flow (ML/d)
7/02/2007 78 12/02/2007 98
20/02/2007 101 22/02/2007 1633
14/03/2007 342 20/03/2007 271
6/06/2007 49 2/06/2007 115
3/07/2007 1363 25/06/2007 1299
31/08/2007 1338 4/09/2007 1252
15/10/2007 56 24/10/2007 193
25/10/2007 68 3/11/2007 55
1/11/2007 175 7/11/2007 134
8/11/2007 858 14/11/2007 701
29/11/2007 169 28/11/2007 590
9/12/2007 132 11/12/2007 488
11/01/2008 1066 17/01/2008 726
26/02/2008 1055 1/03/2008 1255
6/04/2008 113 5/04/2008 75
19/04/2008 30 18/04/2008 78
26/04/2008 48 2/05/2008 95
12/06/2008 84 5/06/2008 130
25/06/2008 53 2/07/2008 80
24/07/2008 54 2/08/2008 67
5/09/2008 38 27/08/2008 176
10/09/2008 202 11/09/2008 255
22/09/2008 230 27/09/2008 264
30/10/2008 36 2/11/2008 168
1/12/2008 1464 30/11/2008 1241
17/12/2008 1379 20/12/2008 1494
8/01/2009 1210 7/01/2009 1128
1/02/2009 83 5/02/2009 453

Observed Flows in the Barwon–Darling 1990-2017: A Hydrologic Investigation
Page 125
Event Start Date Mungindi Peak Flow (ML/d) Event Start Date Collarenebri Peak Flow (ML/d)
11/04/2009 48 12/04/2009 86
20/05/2009 57 18/05/2009 454
2/06/2009 1390 28/05/2009 6223
1/09/2009 54 4/09/2009 26
30/12/2009 285 6/01/2010 887
4/01/2010 1399 16/01/2010 857
22/01/2010 1351 26/01/2010 992
6/02/2010 231 9/02/2010 1498
15/02/2010 86 15/02/2010 882
21/06/2010 345 28/06/2010 234
15/02/2011 1405 18/02/2011 1634
12/03/2011 426 8/03/2011 5668
25/03/2011 1312 28/03/2011 4120
26/04/2011 1008 30/04/2011 1006
6/05/2011 466 10/05/2011 495
26/05/2011 424 1/06/2011 295
10/06/2011 236 13/06/2011 153
23/06/2011 1066 26/06/2011 1164
12/07/2011 695 15/07/2011 707
25/08/2011 1820 30/08/2011 1557
19/09/2011 1311 22/09/2011 1534
5/10/2011 1322 10/10/2011 1574
25/10/2011 1444 29/10/2011 1565
5/11/2011 1414 9/11/2011 1392
8/04/2012 265 8/04/2012 329
16/04/2012 201 20/04/2012 331
19/05/2012 258 2/05/2012 547
28/05/2012 98 2/06/2012 347

Observed Flows in the Barwon–Darling 1990-2017: A Hydrologic Investigation
Page 126
Event Start Date Mungindi Peak Flow (ML/d) Event Start Date Collarenebri Peak Flow (ML/d)
6/07/2012 1656 20/06/2012 4233
31/08/2012 239 9/09/2012 407
30/09/2012 127 1/10/2012 366
24/10/2012 139 26/10/2012 65
10/11/2012 56 30/10/2012 201
24/11/2012 76 28/11/2012 379
15/12/2012 453 13/12/2012 959
22/12/2012 821 28/12/2012 439
4/01/2013 449 8/01/2013 339
22/01/2013 511 21/01/2013 516
7/06/2013 922 6/06/2013 1210
3/07/2013 1103 7/07/2013 1522
29/07/2013 1431 1/08/2013 1965
28/08/2013 613 1/09/2013 637
7/10/2013 113 10/10/2013 65
29/11/2013 139 29/11/2013 106
4/12/2013 161 5/12/2013 139
15/12/2013 245 21/12/2013 71
23/12/2013 268 30/12/2013 113
22/01/2014 30 23/01/2014 205
27/01/2014 396 2/02/2014 285
26/02/2014 136 18/02/2014 207
23/03/2014 261 21/03/2014 6286
31/03/2014 797 5/04/2014 3268
13/06/2014 12 28/05/2014 57
21/12/2014 608 1/01/2015 227
7/01/2015 1357 10/01/2015 1325
3/02/2015 1840 31/01/2015 1587

Observed Flows in the Barwon–Darling 1990-2017: A Hydrologic Investigation
Page 127
Event Start Date Mungindi Peak Flow (ML/d) Event Start Date Collarenebri Peak Flow (ML/d)
7/06/2015 604 11/06/2015 410
27/06/2015 745 27/06/2015 912
1/08/2015 1200 22/07/2015 1008
14/08/2015 622 17/08/2015 659
5/09/2015 918 4/09/2015 649
27/10/2015 38 1/11/2015 64
8/11/2015 363 17/11/2015 374
30/11/2015 159 2/12/2015 92
3/01/2016 243 31/12/2015 543
7/01/2016 686 12/01/2016 512
14/01/2016 653 18/01/2016 375
26/01/2016 909 26/01/2016 904
6/02/2016 1039 10/02/2016 897
21/03/2016 87 27/03/2016 50
29/03/2016 105 4/04/2016 63
4/06/2016 29 4/06/2016 471
20/06/2016 39 18/06/2016 338
6/07/2016 842 11/07/2016 521
17/07/2016 1296 18/07/2016 1061
15/08/2016 864 19/08/2016 1030
8/09/2016 1797 8/09/2016 4887
10/12/2016 171 16/12/2016 116
19/12/2016 302 27/12/2016 513
11/01/2017 664 16/01/2017 364
24/01/2017 588 21/01/2017 307
9/02/2017 293 13/02/2017 272
19/02/2017 287 24/02/2017 369
8/03/2017 51 13/03/2017 343
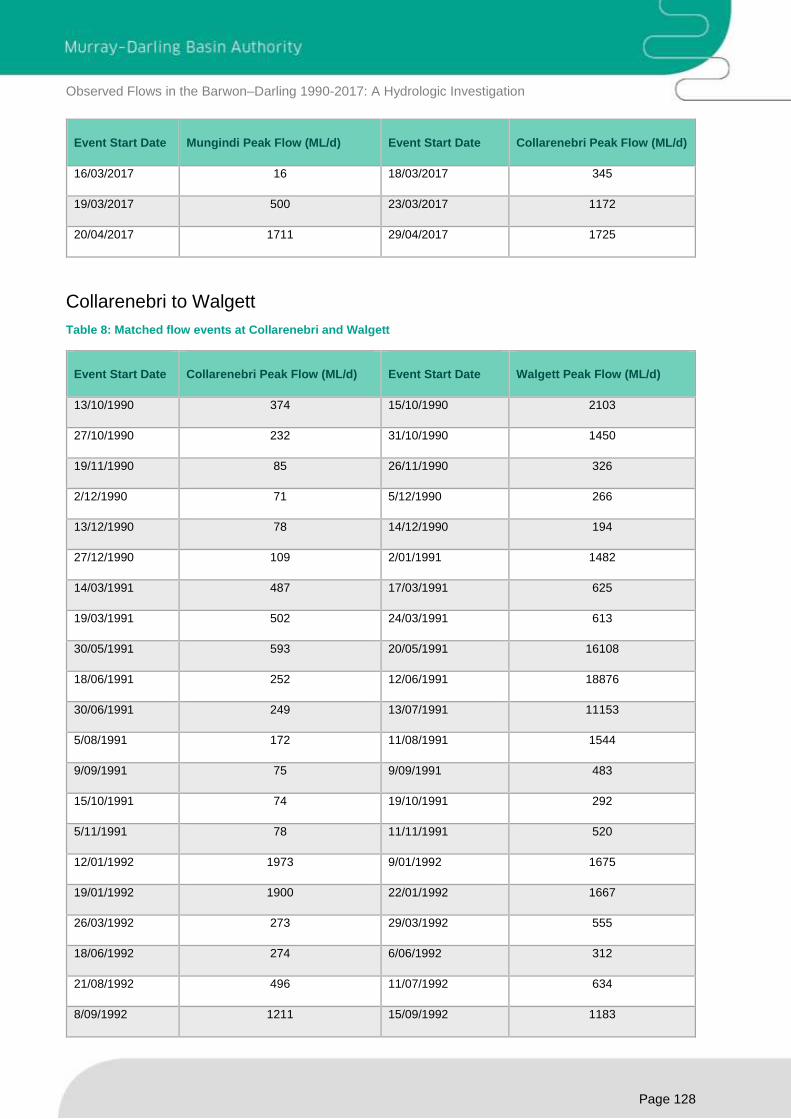
Observed Flows in the Barwon–Darling 1990-2017: A Hydrologic Investigation
Page 128
Event Start Date Mungindi Peak Flow (ML/d) Event Start Date Collarenebri Peak Flow (ML/d)
16/03/2017 16 18/03/2017 345
19/03/2017 500 23/03/2017 1172
20/04/2017 1711 29/04/2017 1725
Collarenebri to Walgett
Table 8: Matched flow events at Collarenebri and Walgett
Event Start Date Collarenebri Peak Flow (ML/d) Event Start Date Walgett Peak Flow (ML/d)
13/10/1990 374 15/10/1990 2103
27/10/1990 232 31/10/1990 1450
19/11/1990 85 26/11/1990 326
2/12/1990 71 5/12/1990 266
13/12/1990 78 14/12/1990 194
27/12/1990 109 2/01/1991 1482
14/03/1991 487 17/03/1991 625
19/03/1991 502 24/03/1991 613
30/05/1991 593 20/05/1991 16108
18/06/1991 252 12/06/1991 18876
30/06/1991 249 13/07/1991 11153
5/08/1991 172 11/08/1991 1544
9/09/1991 75 9/09/1991 483
15/10/1991 74 19/10/1991 292
5/11/1991 78 11/11/1991 520
12/01/1992 1973 9/01/1992 1675
19/01/1992 1900 22/01/1992 1667
26/03/1992 273 29/03/1992 555
18/06/1992 274 6/06/1992 312
21/08/1992 496 11/07/1992 634
8/09/1992 1211 15/09/1992 1183

Observed Flows in the Barwon–Darling 1990-2017: A Hydrologic Investigation
Page 129
Event Start Date Collarenebri Peak Flow (ML/d) Event Start Date Walgett Peak Flow (ML/d)
29/09/1992 785 2/10/1992 690
14/10/1992 271 19/10/1992 255
27/10/1992 208 1/11/1992 1825
6/11/1992 245 18/11/1992 1125
6/12/1992 702 6/12/1992 611
17/12/1992 1241 19/12/1992 1269
9/01/1993 65 19/01/1993 123
25/01/1993 1146 29/01/1993 975
27/02/1993 123 24/02/1993 254
26/03/1993 269 30/03/1993 163
5/06/1993 258 8/06/1993 2459
11/06/1993 333 19/06/1993 329
6/07/1993 729 7/07/1993 5207
7/08/1993 144 7/08/1993 756
20/08/1993 57 17/08/1993 494
13/09/1993 180 7/09/1993 2054
13/10/1993 174 19/10/1993 3705
14/11/1993 85 17/11/1993 173
8/12/1993 19 28/11/1993 238
13/03/1994 1092 15/03/1994 1598
13/03/1994 1844 24/03/1994 1616
11/06/1994 11 19/06/1994 133
24/12/1994 31 6/01/1995 18
18/05/1995 176 16/05/1995 911
21/12/1995 206 24/12/1995 172
10/03/1996 1650 8/03/1996 1204
23/03/1996 525 26/03/1996 460
4/08/1996 1670 12/08/1996 1347
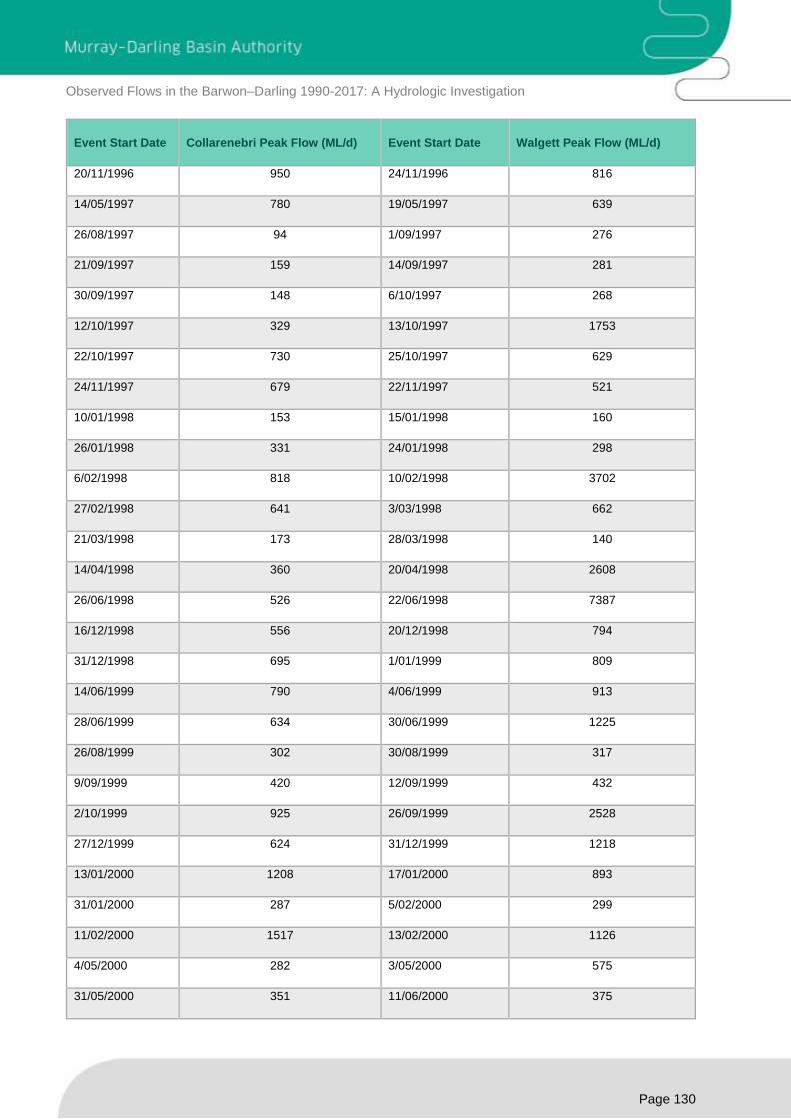
Observed Flows in the Barwon–Darling 1990-2017: A Hydrologic Investigation
Page 130
Event Start Date Collarenebri Peak Flow (ML/d) Event Start Date Walgett Peak Flow (ML/d)
20/11/1996 950 24/11/1996 816
14/05/1997 780 19/05/1997 639
26/08/1997 94 1/09/1997 276
21/09/1997 159 14/09/1997 281
30/09/1997 148 6/10/1997 268
12/10/1997 329 13/10/1997 1753
22/10/1997 730 25/10/1997 629
24/11/1997 679 22/11/1997 521
10/01/1998 153 15/01/1998 160
26/01/1998 331 24/01/1998 298
6/02/1998 818 10/02/1998 3702
27/02/1998 641 3/03/1998 662
21/03/1998 173 28/03/1998 140
14/04/1998 360 20/04/1998 2608
26/06/1998 526 22/06/1998 7387
16/12/1998 556 20/12/1998 794
31/12/1998 695 1/01/1999 809
14/06/1999 790 4/06/1999 913
28/06/1999 634 30/06/1999 1225
26/08/1999 302 30/08/1999 317
9/09/1999 420 12/09/1999 432
2/10/1999 925 26/09/1999 2528
27/12/1999 624 31/12/1999 1218
13/01/2000 1208 17/01/2000 893
31/01/2000 287 5/02/2000 299
11/02/2000 1517 13/02/2000 1126
4/05/2000 282 3/05/2000 575
31/05/2000 351 11/06/2000 375

Observed Flows in the Barwon–Darling 1990-2017: A Hydrologic Investigation
Page 131
Event Start Date Collarenebri Peak Flow (ML/d) Event Start Date Walgett Peak Flow (ML/d)
4/07/2000 266 9/07/2000 323
25/07/2000 193 1/08/2000 270
23/08/2000 612 3/09/2000 570
21/10/2000 782 7/10/2000 1573
29/04/2001 1262 27/04/2001 1524
8/06/2001 667 14/06/2001 1002
21/08/2001 493 26/08/2001 545
8/09/2001 481 14/09/2001 553
9/10/2001 218 14/10/2001 228
17/10/2001 289 22/10/2001 438
15/11/2001 291 24/11/2001 2059
2/12/2001 1746 14/12/2001 1931
24/12/2001 1040 27/12/2001 822
4/02/2002 798 1/02/2002 619
25/02/2002 875 26/02/2002 714
3/04/2002 1037 8/04/2002 648
2/05/2002 250 6/05/2002 214
25/05/2002 181 28/05/2002 173
27/06/2002 118 1/07/2002 104
26/08/2002 40 31/08/2002 38
15/09/2002 175 19/09/2002 111
2/10/2002 255 3/10/2002 204
19/10/2002 95 25/10/2002 90
20/12/2002 315 28/12/2002 303
17/02/2003 381 18/02/2003 2496
9/04/2003 1190 29/03/2003 1454
26/06/2003 305 3/07/2003 264
23/08/2003 277 20/08/2003 251

Observed Flows in the Barwon–Darling 1990-2017: A Hydrologic Investigation
Page 132
Event Start Date Collarenebri Peak Flow (ML/d) Event Start Date Walgett Peak Flow (ML/d)
30/09/2003 40 3/10/2003 4
15/10/2003 1549 16/10/2003 1315
18/11/2003 257 22/11/2003 224
4/12/2003 108 4/12/2003 106
22/02/2004 909 25/02/2004 2305
8/05/2004 172 14/05/2004 172
23/06/2004 80 28/06/2004 92
26/07/2004 57 26/07/2004 55
26/08/2004 32 30/08/2004 12
7/09/2004 77 7/09/2004 67
18/09/2004 1160 23/09/2004 1034
5/11/2004 121 3/11/2004 388
23/01/2005 1865 27/01/2005 1698
28/02/2005 262 10/03/2005 199
30/03/2005 60 2/04/2005 81
16/08/2005 377 20/08/2005 461
30/09/2005 183 3/10/2005 370
19/10/2005 114 18/10/2005 334
10/11/2005 314 30/10/2005 368
27/11/2005 1150 22/11/2005 1354
14/12/2005 1189 18/12/2005 1192
13/04/2006 401 14/04/2006 368
2/05/2006 130 8/05/2006 115
30/05/2006 19 8/06/2006 138
21/06/2006 40 1/07/2006 50
13/07/2006 69 14/07/2006 45
28/07/2006 85 20/07/2006 195
20/10/2006 48 4/11/2006 13

Observed Flows in the Barwon–Darling 1990-2017: A Hydrologic Investigation
Page 133
Event Start Date Collarenebri Peak Flow (ML/d) Event Start Date Walgett Peak Flow (ML/d)
3/11/2006 194 8/11/2006 115
19/11/2006 408 17/11/2006 263
17/12/2006 575 18/12/2006 452
6/01/2007 167 11/01/2007 109
15/01/2007 110 22/01/2007 58
27/01/2007 127 2/02/2007 65
6/02/2007 104 11/02/2007 190
22/02/2007 1633 24/02/2007 1031
12/03/2007 450 13/03/2007 384
19/05/2007 3 19/05/2007 1
24/05/2007 32 30/05/2007 3
2/06/2007 115 5/06/2007 10
25/06/2007 1299 15/07/2007 1108
4/09/2007 1252 8/09/2007 1507
9/10/2007 152 14/10/2007 98
24/10/2007 193 28/10/2007 105
14/11/2007 701 13/11/2007 404
28/11/2007 590 2/12/2007 400
18/04/2008 78 24/04/2008 54
2/05/2008 95 8/05/2008 79
5/06/2008 130 16/06/2008 156
2/08/2008 67 10/08/2008 46
27/08/2008 176 29/08/2008 167
11/09/2008 255 18/09/2008 184
9/10/2008 128 1/10/2008 539
2/11/2008 168 2/11/2008 147
12/11/2008 356 18/11/2008 196
30/11/2008 1241 5/12/2008 3478
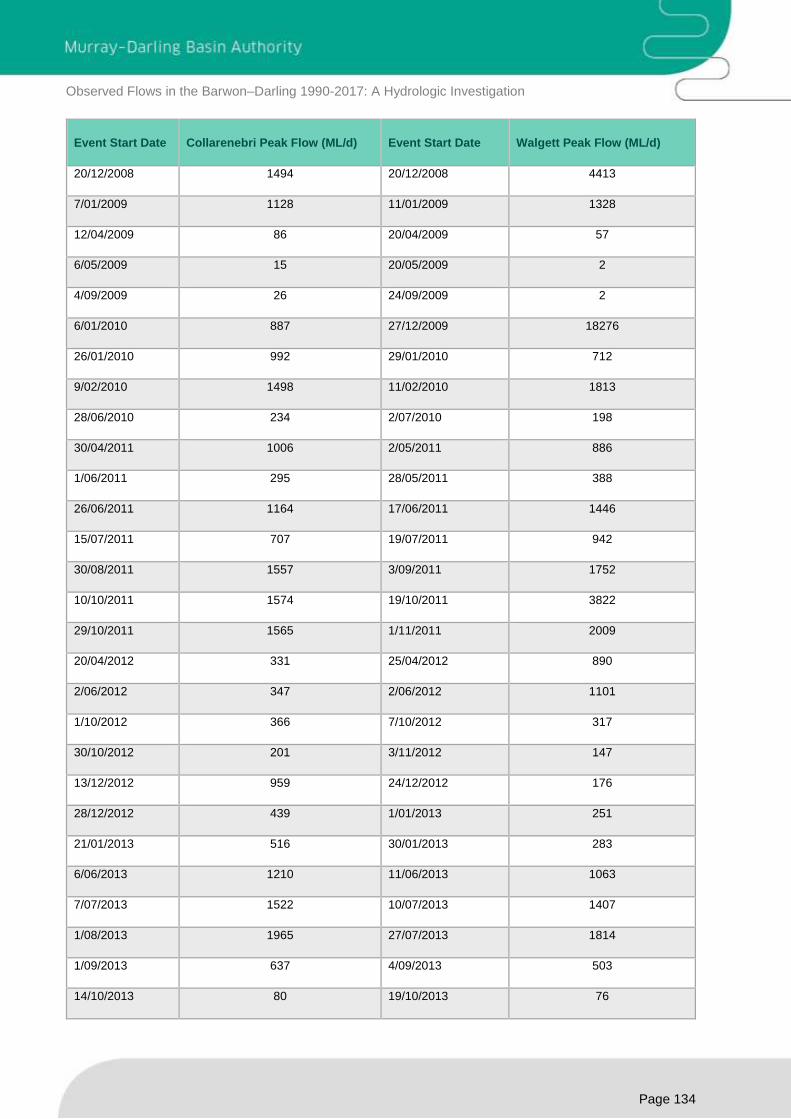
Observed Flows in the Barwon–Darling 1990-2017: A Hydrologic Investigation
Page 134
Event Start Date Collarenebri Peak Flow (ML/d) Event Start Date Walgett Peak Flow (ML/d)
20/12/2008 1494 20/12/2008 4413
7/01/2009 1128 11/01/2009 1328
12/04/2009 86 20/04/2009 57
6/05/2009 15 20/05/2009 2
4/09/2009 26 24/09/2009 2
6/01/2010 887 27/12/2009 18276
26/01/2010 992 29/01/2010 712
9/02/2010 1498 11/02/2010 1813
28/06/2010 234 2/07/2010 198
30/04/2011 1006 2/05/2011 886
1/06/2011 295 28/05/2011 388
26/06/2011 1164 17/06/2011 1446
15/07/2011 707 19/07/2011 942
30/08/2011 1557 3/09/2011 1752
10/10/2011 1574 19/10/2011 3822
29/10/2011 1565 1/11/2011 2009
20/04/2012 331 25/04/2012 890
2/06/2012 347 2/06/2012 1101
1/10/2012 366 7/10/2012 317
30/10/2012 201 3/11/2012 147
13/12/2012 959 24/12/2012 176
28/12/2012 439 1/01/2013 251
21/01/2013 516 30/01/2013 283
6/06/2013 1210 11/06/2013 1063
7/07/2013 1522 10/07/2013 1407
1/08/2013 1965 27/07/2013 1814
1/09/2013 637 4/09/2013 503
14/10/2013 80 19/10/2013 76
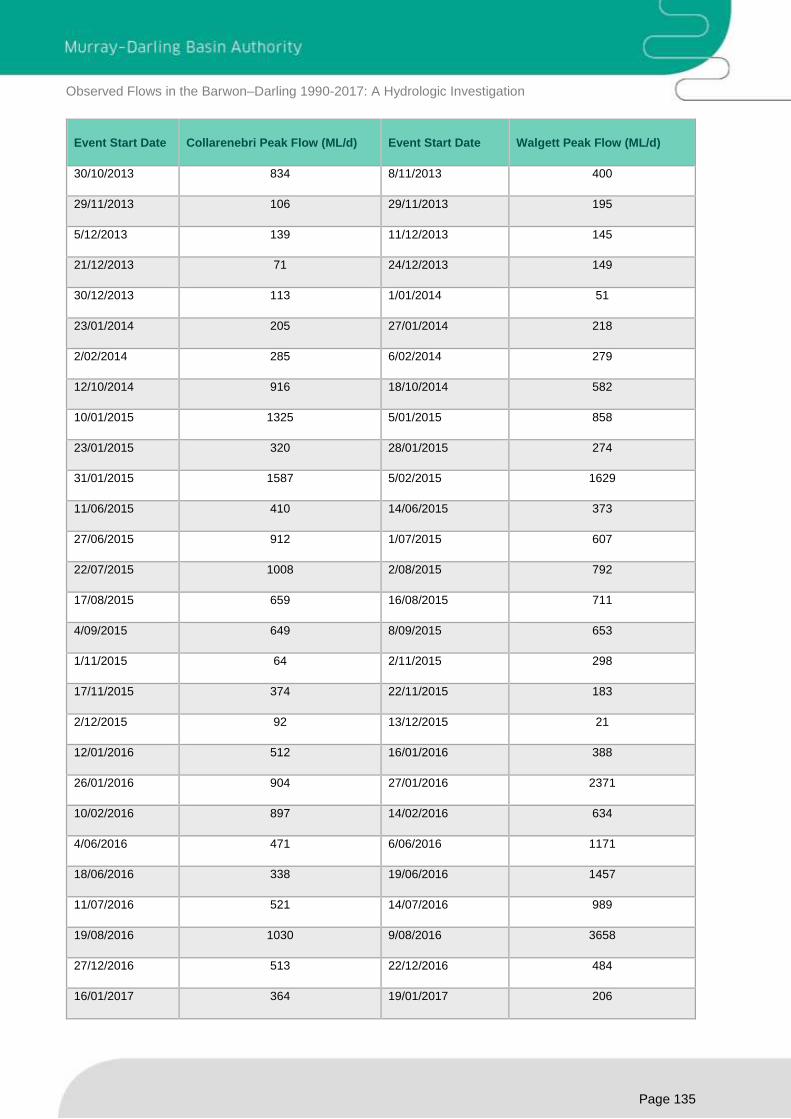
Observed Flows in the Barwon–Darling 1990-2017: A Hydrologic Investigation
Page 135
Event Start Date Collarenebri Peak Flow (ML/d) Event Start Date Walgett Peak Flow (ML/d)
30/10/2013 834 8/11/2013 400
29/11/2013 106 29/11/2013 195
5/12/2013 139 11/12/2013 145
21/12/2013 71 24/12/2013 149
30/12/2013 113 1/01/2014 51
23/01/2014 205 27/01/2014 218
2/02/2014 285 6/02/2014 279
12/10/2014 916 18/10/2014 582
10/01/2015 1325 5/01/2015 858
23/01/2015 320 28/01/2015 274
31/01/2015 1587 5/02/2015 1629
11/06/2015 410 14/06/2015 373
27/06/2015 912 1/07/2015 607
22/07/2015 1008 2/08/2015 792
17/08/2015 659 16/08/2015 711
4/09/2015 649 8/09/2015 653
1/11/2015 64 2/11/2015 298
17/11/2015 374 22/11/2015 183
2/12/2015 92 13/12/2015 21
12/01/2016 512 16/01/2016 388
26/01/2016 904 27/01/2016 2371
10/02/2016 897 14/02/2016 634
4/06/2016 471 6/06/2016 1171
18/06/2016 338 19/06/2016 1457
11/07/2016 521 14/07/2016 989
19/08/2016 1030 9/08/2016 3658
27/12/2016 513 22/12/2016 484
16/01/2017 364 19/01/2017 206
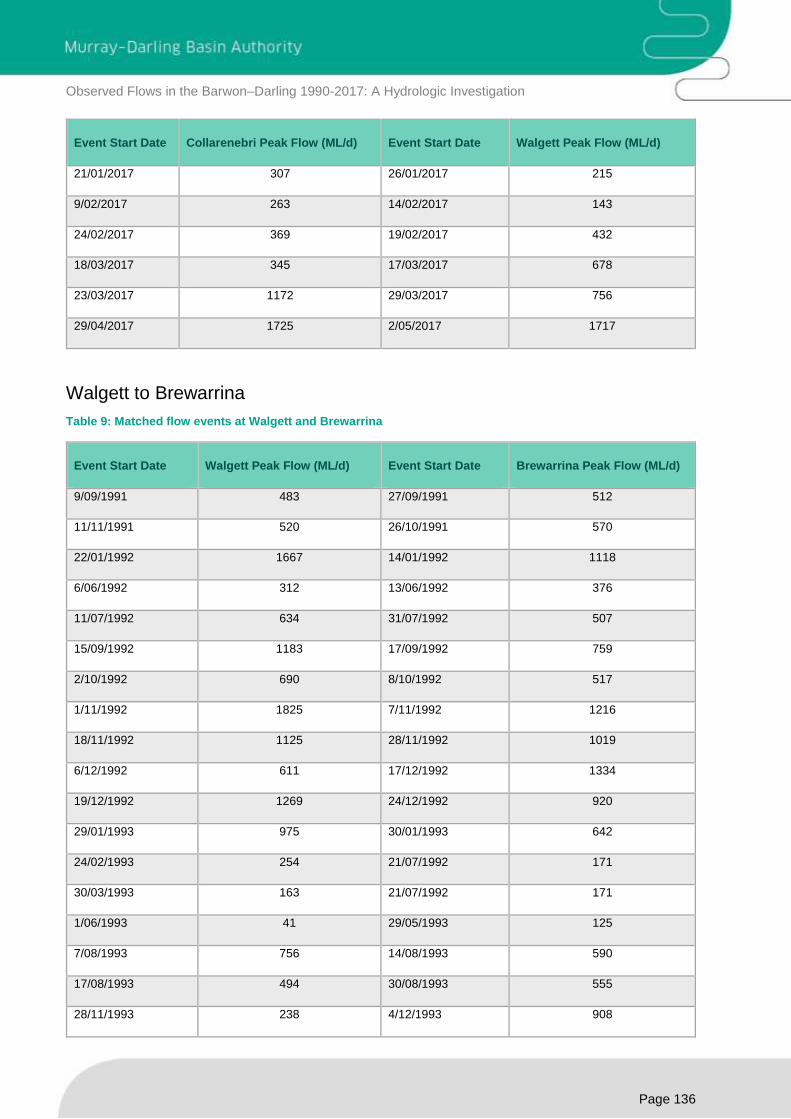
Observed Flows in the Barwon–Darling 1990-2017: A Hydrologic Investigation
Page 136
Event Start Date Collarenebri Peak Flow (ML/d) Event Start Date Walgett Peak Flow (ML/d)
21/01/2017 307 26/01/2017 215
9/02/2017 263 14/02/2017 143
24/02/2017 369 19/02/2017 432
18/03/2017 345 17/03/2017 678
23/03/2017 1172 29/03/2017 756
29/04/2017 1725 2/05/2017 1717
Walgett to Brewarrina
Table 9: Matched flow events at Walgett and Brewarrina
Event Start Date Walgett Peak Flow (ML/d) Event Start Date Brewarrina Peak Flow (ML/d)
9/09/1991 483 27/09/1991 512
11/11/1991 520 26/10/1991 570
22/01/1992 1667 14/01/1992 1118
6/06/1992 312 13/06/1992 376
11/07/1992 634 31/07/1992 507
15/09/1992 1183 17/09/1992 759
2/10/1992 690 8/10/1992 517
1/11/1992 1825 7/11/1992 1216
18/11/1992 1125 28/11/1992 1019
6/12/1992 611 17/12/1992 1334
19/12/1992 1269 24/12/1992 920
29/01/1993 975 30/01/1993 642
24/02/1993 254 21/07/1992 171
30/03/1993 163 21/07/1992 171
1/06/1993 41 29/05/1993 125
7/08/1993 756 14/08/1993 590
17/08/1993 494 30/08/1993 555
28/11/1993 238 4/12/1993 908
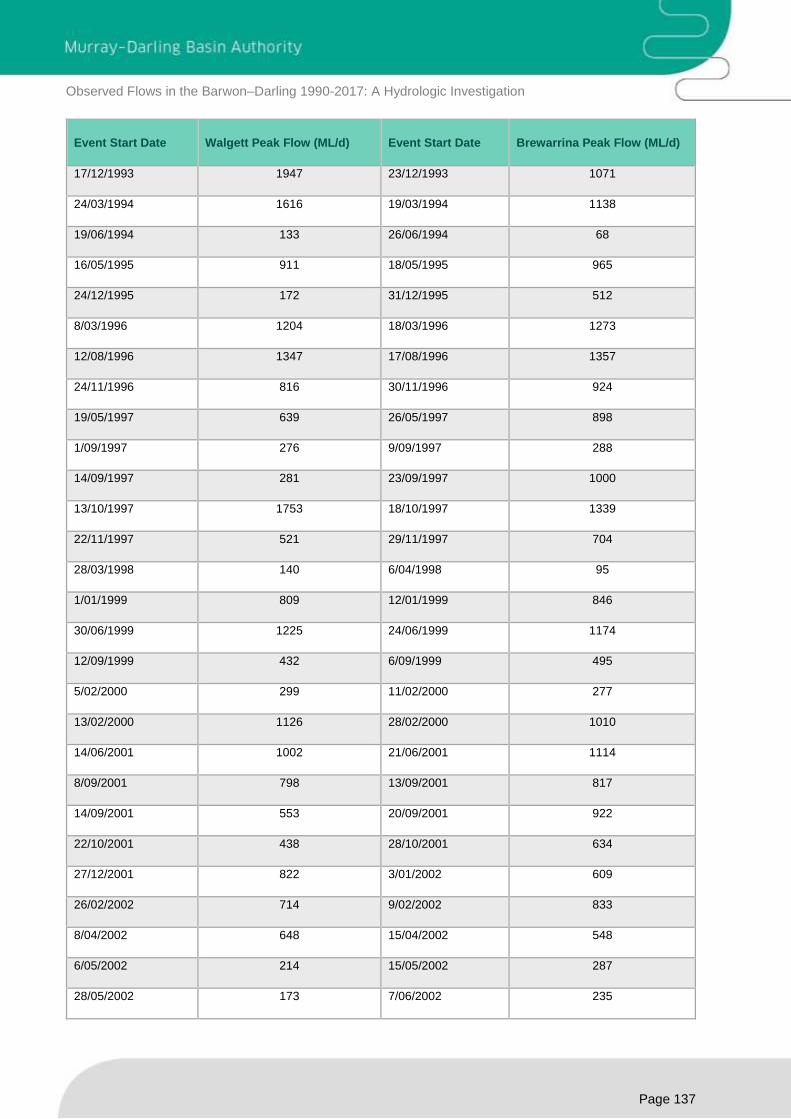
Observed Flows in the Barwon–Darling 1990-2017: A Hydrologic Investigation
Page 137
Event Start Date Walgett Peak Flow (ML/d) Event Start Date Brewarrina Peak Flow (ML/d)
17/12/1993 1947 23/12/1993 1071
24/03/1994 1616 19/03/1994 1138
19/06/1994 133 26/06/1994 68
16/05/1995 911 18/05/1995 965
24/12/1995 172 31/12/1995 512
8/03/1996 1204 18/03/1996 1273
12/08/1996 1347 17/08/1996 1357
24/11/1996 816 30/11/1996 924
19/05/1997 639 26/05/1997 898
1/09/1997 276 9/09/1997 288
14/09/1997 281 23/09/1997 1000
13/10/1997 1753 18/10/1997 1339
22/11/1997 521 29/11/1997 704
28/03/1998 140 6/04/1998 95
1/01/1999 809 12/01/1999 846
30/06/1999 1225 24/06/1999 1174
12/09/1999 432 6/09/1999 495
5/02/2000 299 11/02/2000 277
13/02/2000 1126 28/02/2000 1010
14/06/2001 1002 21/06/2001 1114
8/09/2001 798 13/09/2001 817
14/09/2001 553 20/09/2001 922
22/10/2001 438 28/10/2001 634
27/12/2001 822 3/01/2002 609
26/02/2002 714 9/02/2002 833
8/04/2002 648 15/04/2002 548
6/05/2002 214 15/05/2002 287
28/05/2002 173 7/06/2002 235
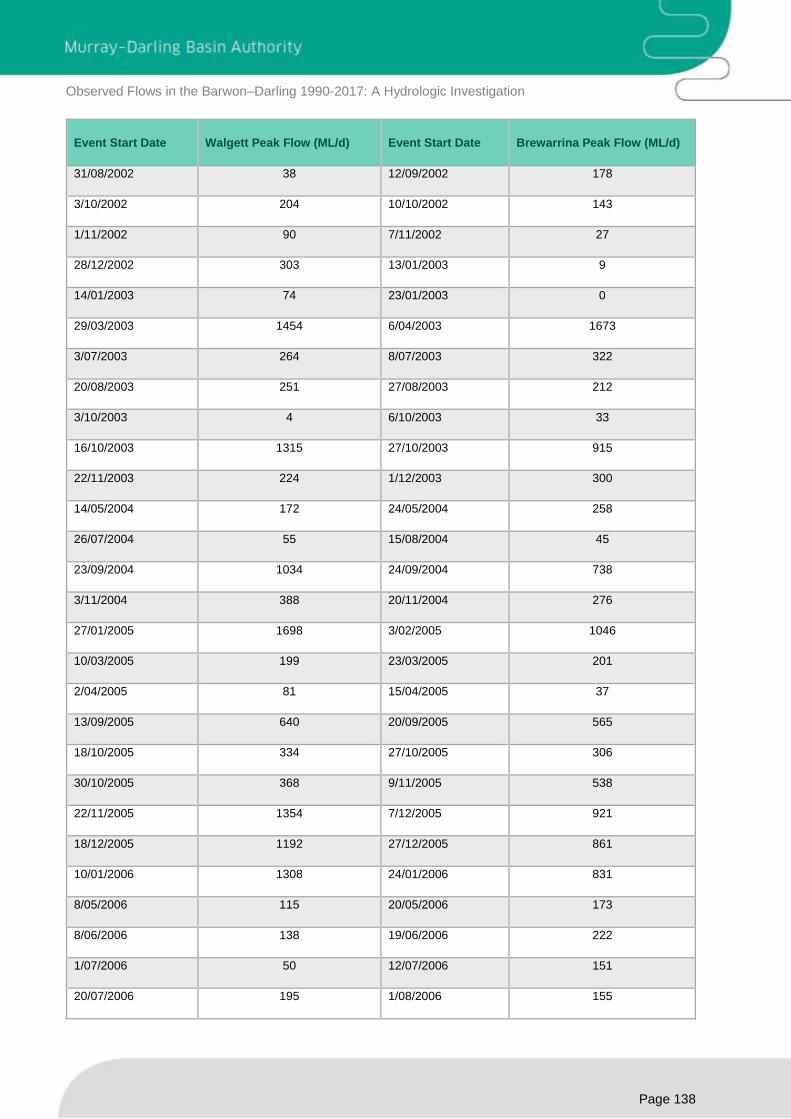
Observed Flows in the Barwon–Darling 1990-2017: A Hydrologic Investigation
Page 138
Event Start Date Walgett Peak Flow (ML/d) Event Start Date Brewarrina Peak Flow (ML/d)
31/08/2002 38 12/09/2002 178
3/10/2002 204 10/10/2002 143
1/11/2002 90 7/11/2002 27
28/12/2002 303 13/01/2003 9
14/01/2003 74 23/01/2003 0
29/03/2003 1454 6/04/2003 1673
3/07/2003 264 8/07/2003 322
20/08/2003 251 27/08/2003 212
3/10/2003 4 6/10/2003 33
16/10/2003 1315 27/10/2003 915
22/11/2003 224 1/12/2003 300
14/05/2004 172 24/05/2004 258
26/07/2004 55 15/08/2004 45
23/09/2004 1034 24/09/2004 738
3/11/2004 388 20/11/2004 276
27/01/2005 1698 3/02/2005 1046
10/03/2005 199 23/03/2005 201
2/04/2005 81 15/04/2005 37
13/09/2005 640 20/09/2005 565
18/10/2005 334 27/10/2005 306
30/10/2005 368 9/11/2005 538
22/11/2005 1354 7/12/2005 921
18/12/2005 1192 27/12/2005 861
10/01/2006 1308 24/01/2006 831
8/05/2006 115 20/05/2006 173
8/06/2006 138 19/06/2006 222
1/07/2006 50 12/07/2006 151
20/07/2006 195 1/08/2006 155
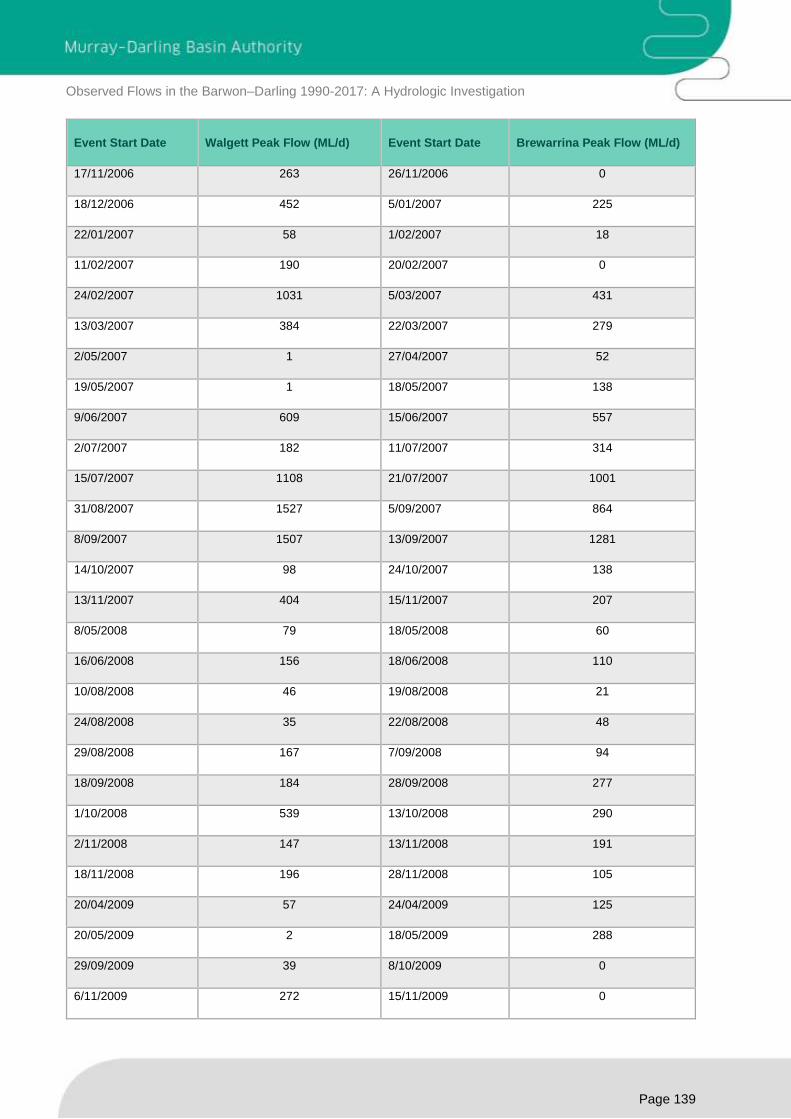
Observed Flows in the Barwon–Darling 1990-2017: A Hydrologic Investigation
Page 139
Event Start Date Walgett Peak Flow (ML/d) Event Start Date Brewarrina Peak Flow (ML/d)
17/11/2006 263 26/11/2006 0
18/12/2006 452 5/01/2007 225
22/01/2007 58 1/02/2007 18
11/02/2007 190 20/02/2007 0
24/02/2007 1031 5/03/2007 431
13/03/2007 384 22/03/2007 279
2/05/2007 1 27/04/2007 52
19/05/2007 1 18/05/2007 138
9/06/2007 609 15/06/2007 557
2/07/2007 182 11/07/2007 314
15/07/2007 1108 21/07/2007 1001
31/08/2007 1527 5/09/2007 864
8/09/2007 1507 13/09/2007 1281
14/10/2007 98 24/10/2007 138
13/11/2007 404 15/11/2007 207
8/05/2008 79 18/05/2008 60
16/06/2008 156 18/06/2008 110
10/08/2008 46 19/08/2008 21
24/08/2008 35 22/08/2008 48
29/08/2008 167 7/09/2008 94
18/09/2008 184 28/09/2008 277
1/10/2008 539 13/10/2008 290
2/11/2008 147 13/11/2008 191
18/11/2008 196 28/11/2008 105
20/04/2009 57 24/04/2009 125
20/05/2009 2 18/05/2009 288
29/09/2009 39 8/10/2009 0
6/11/2009 272 15/11/2009 0
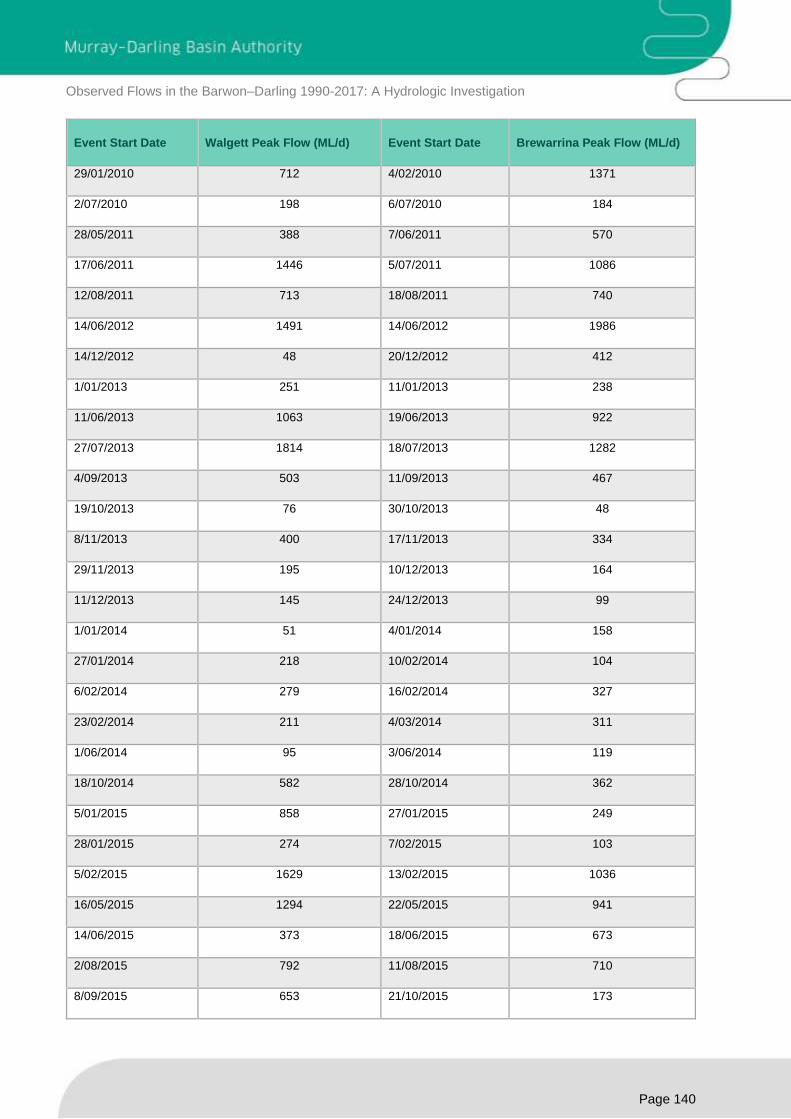
Observed Flows in the Barwon–Darling 1990-2017: A Hydrologic Investigation
Page 140
Event Start Date Walgett Peak Flow (ML/d) Event Start Date Brewarrina Peak Flow (ML/d)
29/01/2010 712 4/02/2010 1371
2/07/2010 198 6/07/2010 184
28/05/2011 388 7/06/2011 570
17/06/2011 1446 5/07/2011 1086
12/08/2011 713 18/08/2011 740
14/06/2012 1491 14/06/2012 1986
14/12/2012 48 20/12/2012 412
1/01/2013 251 11/01/2013 238
11/06/2013 1063 19/06/2013 922
27/07/2013 1814 18/07/2013 1282
4/09/2013 503 11/09/2013 467
19/10/2013 76 30/10/2013 48
8/11/2013 400 17/11/2013 334
29/11/2013 195 10/12/2013 164
11/12/2013 145 24/12/2013 99
1/01/2014 51 4/01/2014 158
27/01/2014 218 10/02/2014 104
6/02/2014 279 16/02/2014 327
23/02/2014 211 4/03/2014 311
1/06/2014 95 3/06/2014 119
18/10/2014 582 28/10/2014 362
5/01/2015 858 27/01/2015 249
28/01/2015 274 7/02/2015 103
5/02/2015 1629 13/02/2015 1036
16/05/2015 1294 22/05/2015 941
14/06/2015 373 18/06/2015 673
2/08/2015 792 11/08/2015 710
8/09/2015 653 21/10/2015 173
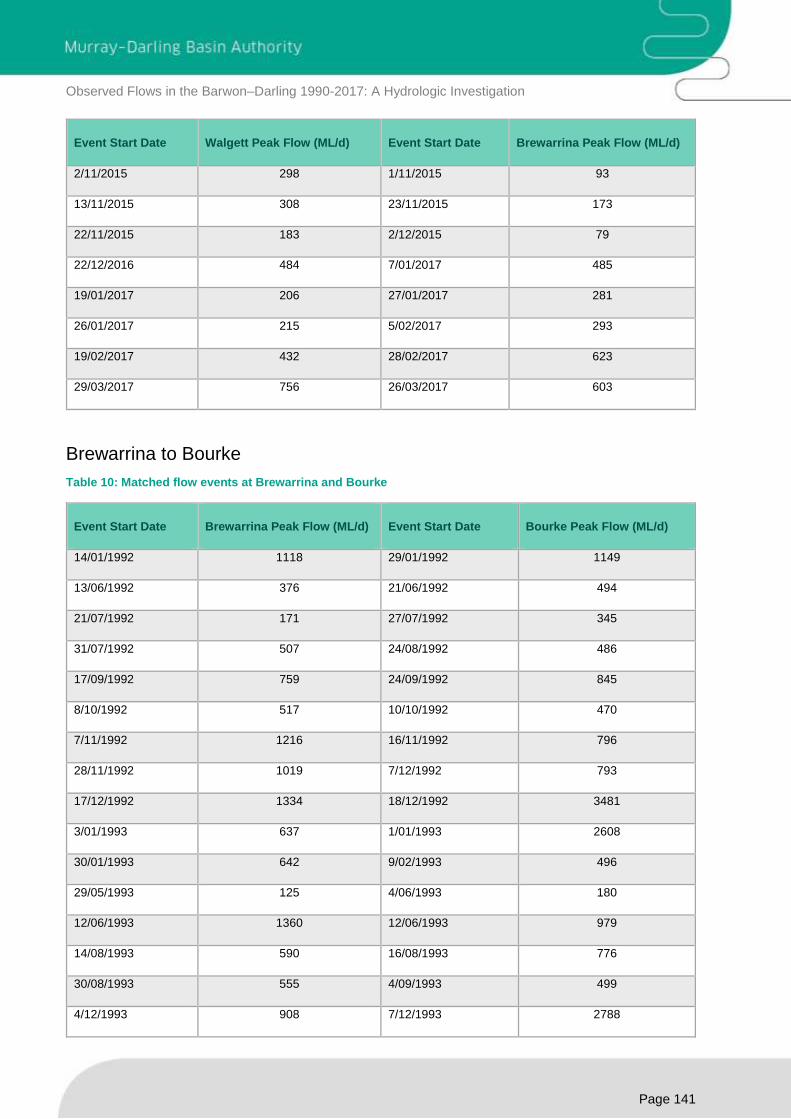
Observed Flows in the Barwon–Darling 1990-2017: A Hydrologic Investigation
Page 141
Event Start Date Walgett Peak Flow (ML/d) Event Start Date Brewarrina Peak Flow (ML/d)
2/11/2015 298 1/11/2015 93
13/11/2015 308 23/11/2015 173
22/11/2015 183 2/12/2015 79
22/12/2016 484 7/01/2017 485
19/01/2017 206 27/01/2017 281
26/01/2017 215 5/02/2017 293
19/02/2017 432 28/02/2017 623
29/03/2017 756 26/03/2017 603
Brewarrina to Bourke
Table 10: Matched flow events at Brewarrina and Bourke
Event Start Date Brewarrina Peak Flow (ML/d) Event Start Date Bourke Peak Flow (ML/d)
14/01/1992 1118 29/01/1992 1149
13/06/1992 376 21/06/1992 494
21/07/1992 171 27/07/1992 345
31/07/1992 507 24/08/1992 486
17/09/1992 759 24/09/1992 845
8/10/1992 517 10/10/1992 470
7/11/1992 1216 16/11/1992 796
28/11/1992 1019 7/12/1992 793
17/12/1992 1334 18/12/1992 3481
3/01/1993 637 1/01/1993 2608
30/01/1993 642 9/02/1993 496
29/05/1993 125 4/06/1993 180
12/06/1993 1360 12/06/1993 979
14/08/1993 590 16/08/1993 776
30/08/1993 555 4/09/1993 499
4/12/1993 908 7/12/1993 2788
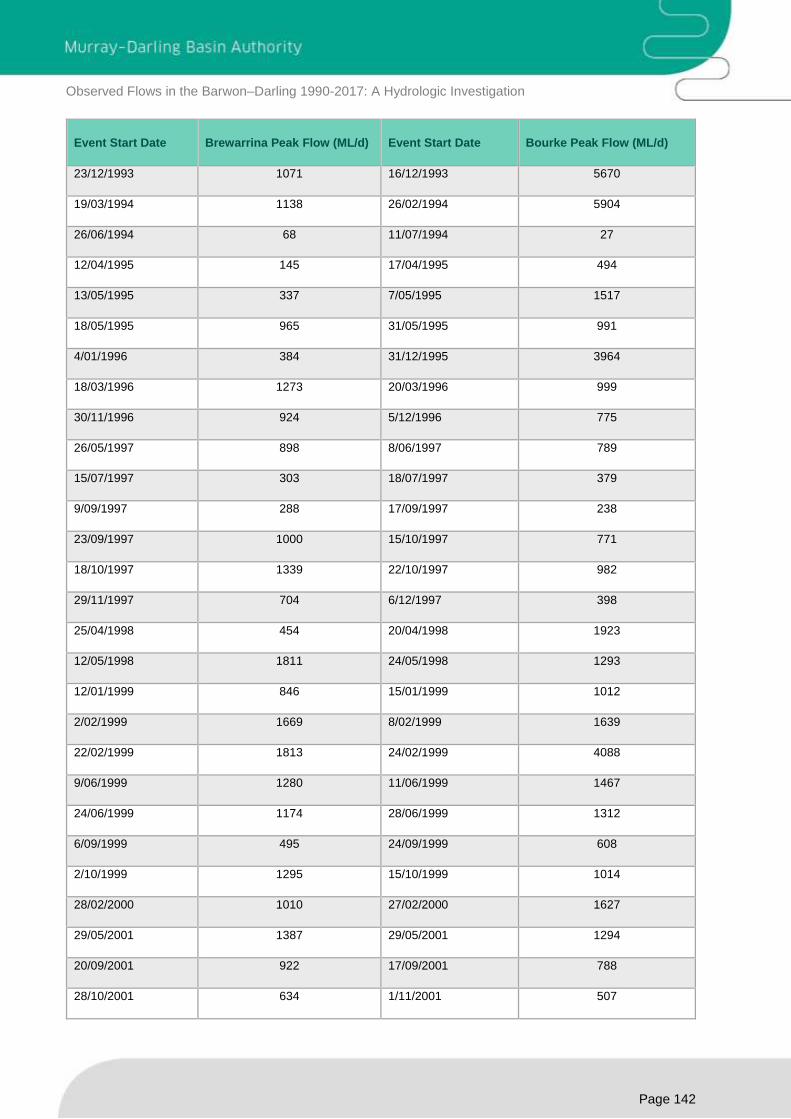
Observed Flows in the Barwon–Darling 1990-2017: A Hydrologic Investigation
Page 142
Event Start Date Brewarrina Peak Flow (ML/d) Event Start Date Bourke Peak Flow (ML/d)
23/12/1993 1071 16/12/1993 5670
19/03/1994 1138 26/02/1994 5904
26/06/1994 68 11/07/1994 27
12/04/1995 145 17/04/1995 494
13/05/1995 337 7/05/1995 1517
18/05/1995 965 31/05/1995 991
4/01/1996 384 31/12/1995 3964
18/03/1996 1273 20/03/1996 999
30/11/1996 924 5/12/1996 775
26/05/1997 898 8/06/1997 789
15/07/1997 303 18/07/1997 379
9/09/1997 288 17/09/1997 238
23/09/1997 1000 15/10/1997 771
18/10/1997 1339 22/10/1997 982
29/11/1997 704 6/12/1997 398
25/04/1998 454 20/04/1998 1923
12/05/1998 1811 24/05/1998 1293
12/01/1999 846 15/01/1999 1012
2/02/1999 1669 8/02/1999 1639
22/02/1999 1813 24/02/1999 4088
9/06/1999 1280 11/06/1999 1467
24/06/1999 1174 28/06/1999 1312
6/09/1999 495 24/09/1999 608
2/10/1999 1295 15/10/1999 1014
28/02/2000 1010 27/02/2000 1627
29/05/2001 1387 29/05/2001 1294
20/09/2001 922 17/09/2001 788
28/10/2001 634 1/11/2001 507

Observed Flows in the Barwon–Darling 1990-2017: A Hydrologic Investigation
Page 143
Event Start Date Brewarrina Peak Flow (ML/d) Event Start Date Bourke Peak Flow (ML/d)
1/12/2001 1059 8/12/2001 749
9/02/2002 833 6/03/2002 1114
15/04/2002 548 19/04/2002 664
15/05/2002 287 19/05/2002 244
7/06/2002 235 13/06/2002 205
12/09/2002 178 17/09/2002 109
10/10/2002 143 15/10/2002 68
6/04/2003 1673 10/04/2003 1452
22/06/2003 189 11/06/2003 346
8/07/2003 322 23/07/2003 186
23/08/2003 191 19/08/2003 167
27/08/2003 212 31/08/2003 206
27/10/2003 915 3/11/2003 621
1/12/2003 300 9/12/2003 64
29/04/2004 737 29/04/2004 1722
24/05/2004 258 30/05/2004 414
27/08/2003 212 31/08/2003 206
27/10/2003 915 3/11/2003 621
1/12/2003 300 9/12/2003 64
29/04/2004 737 29/04/2004 1722
24/05/2004 258 30/05/2004 414
15/08/2004 45 28/08/2004 52
24/09/2004 738 30/09/2004 597
20/11/2004 276 28/11/2004 187
3/02/2005 1046 7/02/2005 963
23/03/2005 201 29/03/2005 68
22/06/2005 80 23/06/2005 252
20/09/2005 565 25/09/2005 493

Observed Flows in the Barwon–Darling 1990-2017: A Hydrologic Investigation
Page 144
Event Start Date Brewarrina Peak Flow (ML/d) Event Start Date Bourke Peak Flow (ML/d)
9/11/2005 538 16/11/2005 346
7/12/2005 921 13/12/2005 805
27/12/2005 861 28/12/2005 1292
24/01/2006 831 31/01/2006 652
25/02/2006 1191 1/03/2006 909
20/05/2006 173 29/05/2006 112
19/06/2006 222 25/06/2006 129
12/07/2006 151 14/07/2006 110
1/08/2006 155 30/07/2006 107
22/03/2007 279 5/04/2007 114
27/04/2007 52 27/04/2007 37
18/05/2007 138 12/05/2007 1593
15/06/2007 557 6/07/2007 310
21/07/2007 1001 19/07/2007 799
13/09/2007 1281 12/09/2007 1094
24/10/2007 138 24/10/2007 318
15/11/2007 207 25/11/2007 765
27/11/2007 631 4/12/2007 2052
21/03/2008 1343 24/03/2008 1416
18/06/2008 110 27/06/2008 87
28/09/2008 277 5/10/2008 483
13/10/2008 290 21/10/2008 175
13/11/2008 191 23/11/2008 56
13/02/2009 679 13/02/2009 13093
11/04/2009 100 16/04/2009 510
24/04/2009 125 4/05/2009 86
18/05/2009 288 4/05/2009 303
4/02/2010 1371 14/02/2010 3397

Observed Flows in the Barwon–Darling 1990-2017: A Hydrologic Investigation
Page 145
Event Start Date Brewarrina Peak Flow (ML/d) Event Start Date Bourke Peak Flow (ML/d)
6/07/2010 184 12/07/2010 292
7/06/2011 570 29/06/2011 1371
18/08/2011 740 23/08/2011 1011
17/10/2012 647 23/10/2012 813
20/12/2012 412 26/12/2012 418
11/01/2013 238 17/01/2013 242
19/06/2013 922 23/06/2013 1116
18/07/2013 1282 23/06/2013 1116
11/09/2013 467 15/09/2013 520
17/11/2013 334 24/11/2013 183
24/12/2013 99 4/01/2014 28
4/01/2014 158 4/01/2014 28
16/02/2014 327 29/01/2014 416
4/03/2014 311 10/03/2014 419
3/06/2014 119 16/06/2014 528
13/08/2014 108 12/08/2014 197
28/10/2014 362 10/11/2014 156
27/01/2015 249 26/01/2015 342
13/02/2015 1036 5/02/2015 2886
27/07/2015 796 1/08/2015 729
11/08/2015 710 16/08/2015 646
4/11/2015 914 4/11/2015 946
23/11/2015 173 16/11/2015 458
14/01/2016 929 30/01/2016 648
27/01/2017 281 2/02/2017 287
28/02/2017 623 8/03/2017 1218
26/03/2017 603 29/03/2017 628
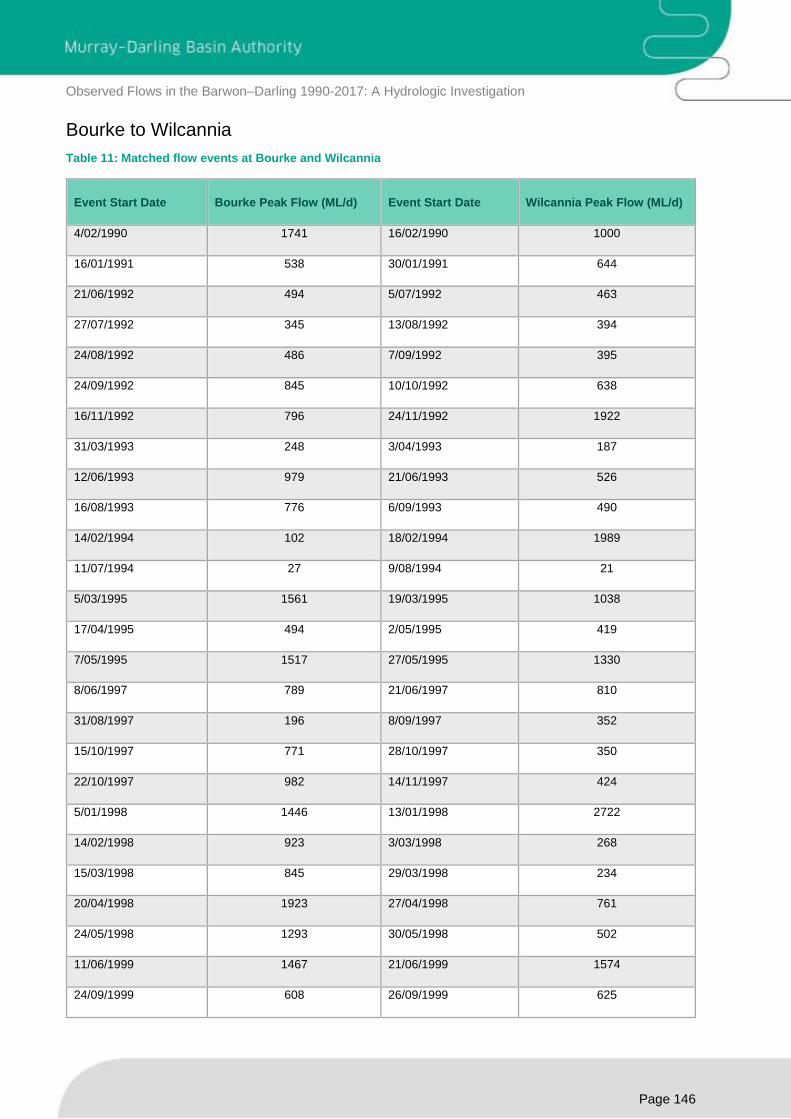
Observed Flows in the Barwon–Darling 1990-2017: A Hydrologic Investigation
Page 146
Bourke to Wilcannia
Table 11: Matched flow events at Bourke and Wilcannia
Event Start Date Bourke Peak Flow (ML/d) Event Start Date Wilcannia Peak Flow (ML/d)
4/02/1990 1741 16/02/1990 1000
16/01/1991 538 30/01/1991 644
21/06/1992 494 5/07/1992 463
27/07/1992 345 13/08/1992 394
24/08/1992 486 7/09/1992 395
24/09/1992 845 10/10/1992 638
16/11/1992 796 24/11/1992 1922
31/03/1993 248 3/04/1993 187
12/06/1993 979 21/06/1993 526
16/08/1993 776 6/09/1993 490
14/02/1994 102 18/02/1994 1989
11/07/1994 27 9/08/1994 21
5/03/1995 1561 19/03/1995 1038
17/04/1995 494 2/05/1995 419
7/05/1995 1517 27/05/1995 1330
8/06/1997 789 21/06/1997 810
31/08/1997 196 8/09/1997 352
15/10/1997 771 28/10/1997 350
22/10/1997 982 14/11/1997 424
5/01/1998 1446 13/01/1998 2722
14/02/1998 923 3/03/1998 268
15/03/1998 845 29/03/1998 234
20/04/1998 1923 27/04/1998 761
24/05/1998 1293 30/05/1998 502
11/06/1999 1467 21/06/1999 1574
24/09/1999 608 26/09/1999 625

Observed Flows in the Barwon–Darling 1990-2017: A Hydrologic Investigation
Page 147
Event Start Date Bourke Peak Flow (ML/d) Event Start Date Wilcannia Peak Flow (ML/d)
21/01/2000 1430 18/02/2000 3014
1/11/2001 507 17/11/2001 401
8/12/2001 749 24/12/2001 478
6/03/2002 1114 8/03/2002 670
19/04/2002 664 5/05/2002 381
19/05/2002 244 8/06/2002 141
13/06/2002 205 4/07/2002 112
10/04/2003 1452 1/05/2003 1191
11/06/2003 346 26/06/2003 378
19/08/2003 167 25/08/2003 191
31/08/2003 206 23/09/2003 70
29/04/2004 1722 8/05/2004 1137
28/08/2004 52 1/10/2004 7
30/09/2004 597 9/11/2004 103
7/02/2005 963 20/02/2005 569
1/05/2005 21 29/05/2005 6
1/06/2005 42 28/06/2005 10
23/06/2005 252 5/07/2005 6
25/09/2005 493 9/10/2005 252
28/12/2005 1292 9/01/2006 621
31/01/2006 652 7/03/2006 77
1/03/2006 909 19/03/2006 536
29/05/2006 112 29/06/2006 9
25/06/2006 129 9/07/2006 346
19/07/2007 799 21/08/2007 452
12/09/2007 1094 5/10/2007 549
7/11/2007 111 26/11/2007 4
9/06/2008 101 22/06/2008 74
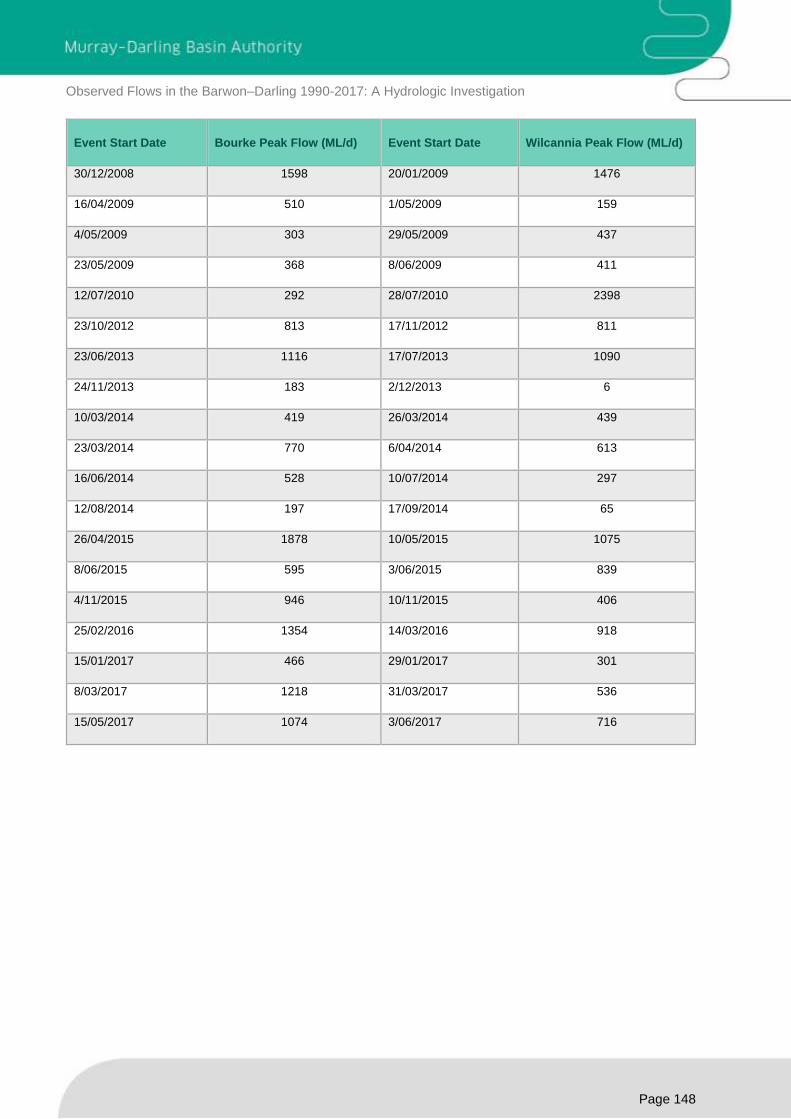
Observed Flows in the Barwon–Darling 1990-2017: A Hydrologic Investigation
Page 148
Event Start Date Bourke Peak Flow (ML/d) Event Start Date Wilcannia Peak Flow (ML/d)
30/12/2008 1598 20/01/2009 1476
16/04/2009 510 1/05/2009 159
4/05/2009 303 29/05/2009 437
23/05/2009 368 8/06/2009 411
12/07/2010 292 28/07/2010 2398
23/10/2012 813 17/11/2012 811
23/06/2013 1116 17/07/2013 1090
24/11/2013 183 2/12/2013 6
10/03/2014 419 26/03/2014 439
23/03/2014 770 6/04/2014 613
16/06/2014 528 10/07/2014 297
12/08/2014 197 17/09/2014 65
26/04/2015 1878 10/05/2015 1075
8/06/2015 595 3/06/2015 839
4/11/2015 946 10/11/2015 406
25/02/2016 1354 14/03/2016 918
15/01/2017 466 29/01/2017 301
8/03/2017 1218 31/03/2017 536
15/05/2017 1074 3/06/2017 716
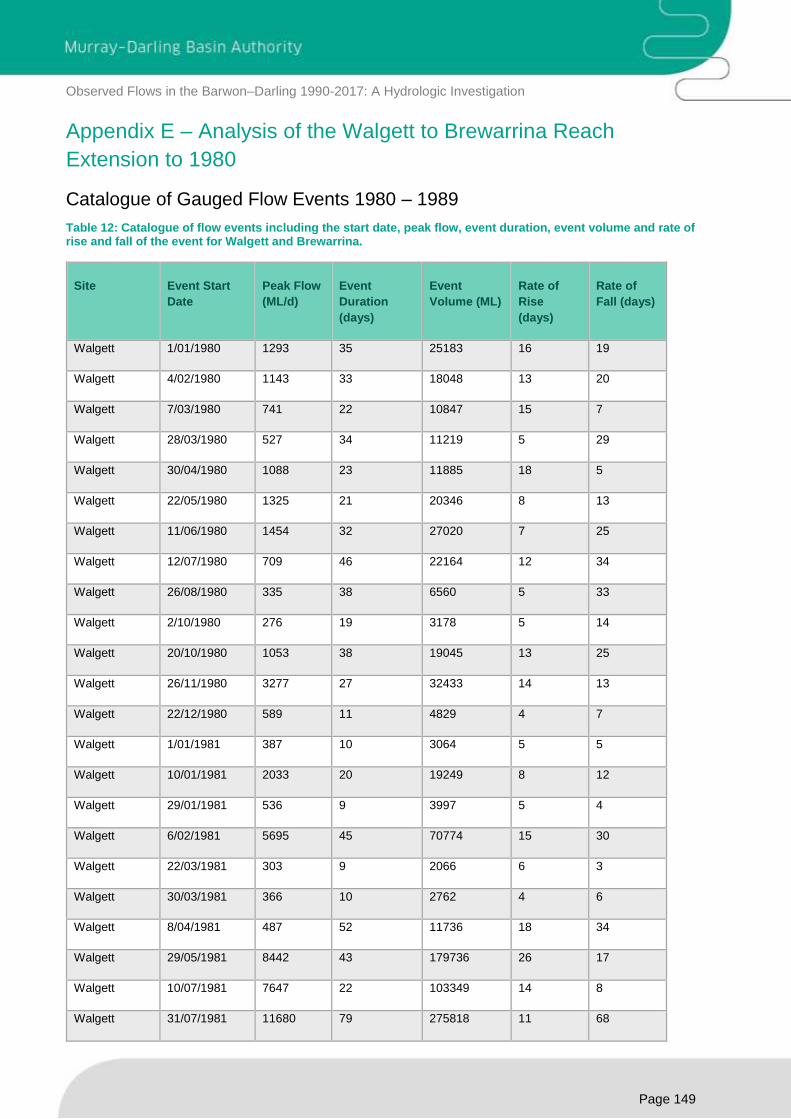
Observed Flows in the Barwon–Darling 1990-2017: A Hydrologic Investigation
Page 149
Appendix E – Analysis of the Walgett to Brewarrina Reach
Extension to 1980
Catalogue of Gauged Flow Events 1980 – 1989
Table 12: Catalogue of flow events including the start date, peak flow, event duration, event volume and rate of rise and fall of the event for Walgett and Brewarrina.
Site Event Start
Date
Peak Flow
(ML/d)
Event
Duration
(days)
Event
Volume (ML)
Rate of
Rise
(days)
Rate of
Fall (days)
Walgett 1/01/1980 1293 35 25183 16 19
Walgett 4/02/1980 1143 33 18048 13 20
Walgett 7/03/1980 741 22 10847 15 7
Walgett 28/03/1980 527 34 11219 5 29
Walgett 30/04/1980 1088 23 11885 18 5
Walgett 22/05/1980 1325 21 20346 8 13
Walgett 11/06/1980 1454 32 27020 7 25
Walgett 12/07/1980 709 46 22164 12 34
Walgett 26/08/1980 335 38 6560 5 33
Walgett 2/10/1980 276 19 3178 5 14
Walgett 20/10/1980 1053 38 19045 13 25
Walgett 26/11/1980 3277 27 32433 14 13
Walgett 22/12/1980 589 11 4829 4 7
Walgett 1/01/1981 387 10 3064 5 5
Walgett 10/01/1981 2033 20 19249 8 12
Walgett 29/01/1981 536 9 3997 5 4
Walgett 6/02/1981 5695 45 70774 15 30
Walgett 22/03/1981 303 9 2066 6 3
Walgett 30/03/1981 366 10 2762 4 6
Walgett 8/04/1981 487 52 11736 18 34
Walgett 29/05/1981 8442 43 179736 26 17
Walgett 10/07/1981 7647 22 103349 14 8
Walgett 31/07/1981 11680 79 275818 11 68
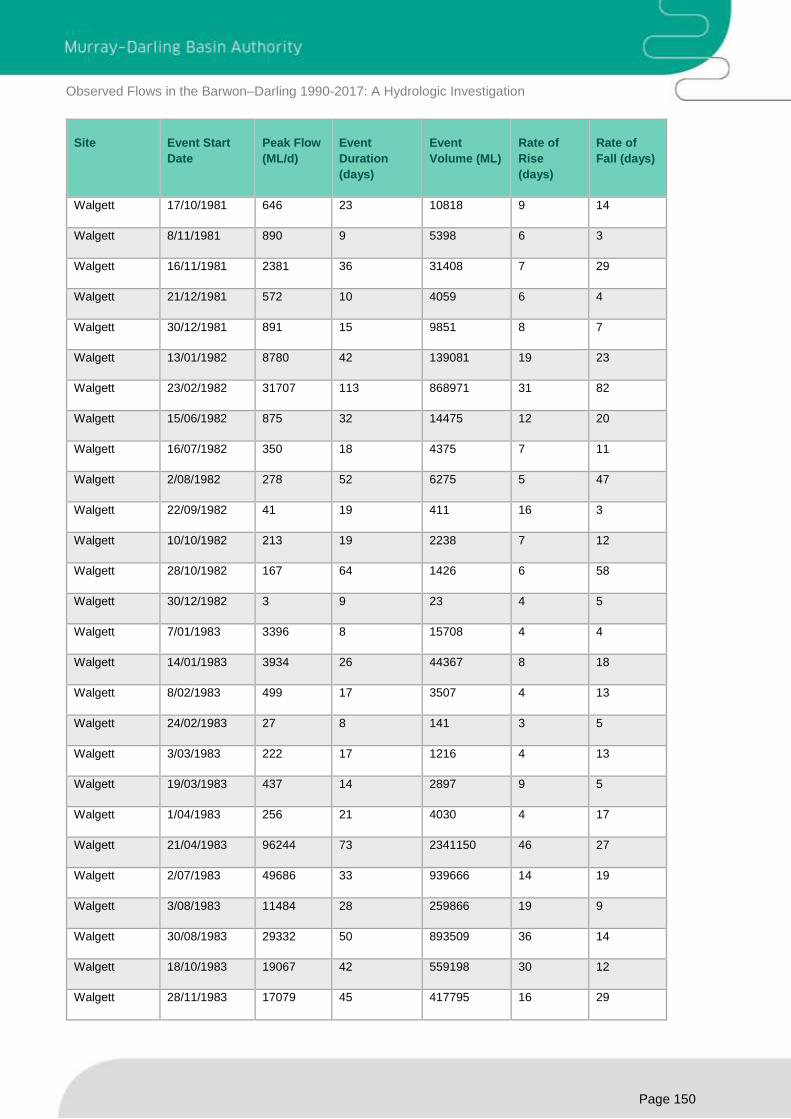
Observed Flows in the Barwon–Darling 1990-2017: A Hydrologic Investigation
Page 150
Site Event Start
Date
Peak Flow
(ML/d)
Event
Duration
(days)
Event
Volume (ML)
Rate of
Rise
(days)
Rate of
Fall (days)
Walgett 17/10/1981 646 23 10818 9 14
Walgett 8/11/1981 890 9 5398 6 3
Walgett 16/11/1981 2381 36 31408 7 29
Walgett 21/12/1981 572 10 4059 6 4
Walgett 30/12/1981 891 15 9851 8 7
Walgett 13/01/1982 8780 42 139081 19 23
Walgett 23/02/1982 31707 113 868971 31 82
Walgett 15/06/1982 875 32 14475 12 20
Walgett 16/07/1982 350 18 4375 7 11
Walgett 2/08/1982 278 52 6275 5 47
Walgett 22/09/1982 41 19 411 16 3
Walgett 10/10/1982 213 19 2238 7 12
Walgett 28/10/1982 167 64 1426 6 58
Walgett 30/12/1982 3 9 23 4 5
Walgett 7/01/1983 3396 8 15708 4 4
Walgett 14/01/1983 3934 26 44367 8 18
Walgett 8/02/1983 499 17 3507 4 13
Walgett 24/02/1983 27 8 141 3 5
Walgett 3/03/1983 222 17 1216 4 13
Walgett 19/03/1983 437 14 2897 9 5
Walgett 1/04/1983 256 21 4030 4 17
Walgett 21/04/1983 96244 73 2341150 46 27
Walgett 2/07/1983 49686 33 939666 14 19
Walgett 3/08/1983 11484 28 259866 19 9
Walgett 30/08/1983 29332 50 893509 36 14
Walgett 18/10/1983 19067 42 559198 30 12
Walgett 28/11/1983 17079 45 417795 16 29

Observed Flows in the Barwon–Darling 1990-2017: A Hydrologic Investigation
Page 151
Site Event Start
Date
Peak Flow
(ML/d)
Event
Duration
(days)
Event
Volume (ML)
Rate of
Rise
(days)
Rate of
Fall (days)
Walgett 11/01/1984 49507 88 1885287 39 49
Walgett 7/04/1984 13550 80 521933 8 72
Walgett 25/06/1984 4044 10 28716 8 2
Walgett 26/07/1984 139782 54 2971820 27 27
Walgett 17/09/1984 13932 43 330557 16 27
Walgett 29/10/1984 1802 15 19328 10 5
Walgett 12/11/1984 14969 40 222469 18 22
Walgett 21/12/1984 4884 26 54585 10 16
Walgett 15/01/1985 782 22 10430 5 17
Walgett 5/02/1985 1395 80 55600 46 34
Walgett 25/04/1985 333 18 4519 8 10
Walgett 12/05/1985 319 23 5509 5 18
Walgett 3/06/1985 344 28 6132 22 6
Walgett 30/06/1985 3862 48 60622 28 20
Walgett 16/08/1985 3324 10 18027 4 6
Walgett 25/08/1985 7698 52 162453 12 40
Walgett 15/10/1985 1607 18 17244 11 7
Walgett 1/11/1985 4675 23 52802 7 16
Walgett 23/11/1985 15090 51 235267 34 17
Walgett 12/01/1986 1026 15 9707 10 5
Walgett 26/01/1986 1080 28 20573 7 21
Walgett 22/02/1986 990 28 15200 7 21
Walgett 21/03/1986 455 40 10639 16 24
Walgett 29/04/1986 355 58 11614 22 36
Walgett 25/06/1986 2465 38 15913 34 4
Walgett 1/08/1986 5149 14 42339 8 6
Walgett 14/08/1986 2714 30 45833 6 24

Observed Flows in the Barwon–Darling 1990-2017: A Hydrologic Investigation
Page 152
Site Event Start
Date
Peak Flow
(ML/d)
Event
Duration
(days)
Event
Volume (ML)
Rate of
Rise
(days)
Rate of
Fall (days)
Walgett 12/09/1986 849 14 9155 4 10
Walgett 25/09/1986 1565 10 10863 4 6
Walgett 4/10/1986 4149 45 55487 8 37
Walgett 17/11/1986 2000 28 21946 13 15
Walgett 14/12/1986 905 17 8415 6 11
Walgett 30/12/1986 4481 20 29987 15 5
Walgett 18/01/1987 2035 22 25766 7 15
Walgett 8/02/1987 3242 35 38505 7 28
Walgett 14/03/1987 1130 51 23960 9 42
Walgett 3/05/1987 599 14 4876 10 4
Walgett 16/05/1987 473 29 8535 4 25
Walgett 13/06/1987 269 22 4089 14 8
Walgett 4/07/1987 245 35 7318 19 16
Walgett 7/08/1987 5913 33 69562 25 8
Walgett 8/09/1987 3462 8 22180 5 3
Walgett 15/09/1987 3011 24 37920 4 20
Walgett 8/10/1987 370 10 1882 2 8
Walgett 17/10/1987 400 14 2807 9 5
Walgett 30/10/1987 852 14 7055 4 10
Walgett 12/11/1987 521 26 9782 8 18
Walgett 7/12/1987 631 11 3890 4 7
Walgett 17/12/1987 1938 18 11331 5 13
Walgett 3/01/1988 327 20 2686 5 15
Walgett 22/01/1988 5547 27 71006 20 7
Walgett 17/02/1988 8232 44 169768 22 22
Walgett 31/03/1988 161457 73 3045100 26 47
Walgett 11/06/1988 5723 24 94556 6 18

Observed Flows in the Barwon–Darling 1990-2017: A Hydrologic Investigation
Page 153
Site Event Start
Date
Peak Flow
(ML/d)
Event
Duration
(days)
Event
Volume (ML)
Rate of
Rise
(days)
Rate of
Fall (days)
Walgett 4/07/1988 16155 59 454836 28 31
Walgett 31/08/1988 15171 78 448809 31 47
Walgett 16/11/1988 709 16 7907 8 8
Walgett 1/12/1988 428 18 5158 5 13
Walgett 18/12/1988 618 15 5513 5 10
Walgett 1/01/1989 1721 8 8463 4 4
Walgett 8/01/1989 1263 16 9082 5 11
Walgett 23/01/1989 271 7 1436 4 3
Walgett 29/01/1989 290 18 3683 3 15
Walgett 15/02/1989 287 11 2354 6 5
Walgett 25/02/1989 275 11 1911 5 6
Walgett 7/03/1989 206 10 1523 6 4
Walgett 16/03/1989 26286 56 458443 45 11
Walgett 10/05/1989 24476 30 409333 20 10
Walgett 8/06/1989 34223 41 622974 16 25
Walgett 18/07/1989 21017 75 453015 32 43
Walgett 30/09/1989 506 17 4980 5 12
Walgett 16/10/1989 276 18 3401 13 5
Walgett 2/11/1989 1064 25 14323 20 5
Walgett 26/11/1989 3513 23 38749 11 12
Walgett 18/12/1989 1346 14 19351 5 9
Brewarrina 1/01/1980 1214 43 34941 22 21
Brewarrina 12/02/1980 1139 31 24217 11 20
Brewarrina 13/03/1980 819 48 31117 11 37
Brewarrina 29/04/1980 2570 49 54777 37 12
Brewarrina 16/06/1980 1783 65 58990 6 59
Brewarrina 19/08/1980 536 48 13010 6 42

Observed Flows in the Barwon–Darling 1990-2017: A Hydrologic Investigation
Page 154
Site Event Start
Date
Peak Flow
(ML/d)
Event
Duration
(days)
Event
Volume (ML)
Rate of
Rise
(days)
Rate of
Fall (days)
Brewarrina 5/10/1980 206 19 3049 10 9
Brewarrina 23/10/1980 967 39 20747 16 23
Brewarrina 30/11/1980 2814 39 37541 15 24
Brewarrina 7/01/1981 1900 29 21236 16 13
Brewarrina 4/02/1981 4520 52 80932 20 32
Brewarrina 27/03/1981 1050 53 27407 14 39
Brewarrina 18/05/1981 370 7 1300 5 2
Brewarrina 24/05/1981 1493 9 4397 8 1
Brewarrina 1/06/1981 8062 44 185883 26 18
Brewarrina 14/07/1981 7630 20 105903 13 7
Brewarrina 2/08/1981 12128 71 323552 12 59
Brewarrina 11/10/1981 2282 77 59236 47 30
Brewarrina 26/12/1981 9041 65 155065 37 28
Brewarrina 28/02/1982 20180 115 669854 43 72
Brewarrina 22/06/1982 815 43 18773 10 33
Brewarrina 3/08/1982 366 67 11680 11 56
Brewarrina 8/10/1982 202 89 6739 18 71
Brewarrina 4/01/1983 3323 40 54063 20 20
Brewarrina 12/02/1983 283 10 1779 8 2
Brewarrina 21/02/1983 612 16 2800 4 12
Brewarrina 8/03/1983 206 21 2414 15 6
Brewarrina 28/03/1983 206 31 5131 17 14
Brewarrina 27/04/1983 61705 75 1723070 49 26
Brewarrina 10/07/1983 30313 55 952242 14 41
Brewarrina 2/09/1983 19988 53 758451 40 13
Brewarrina 24/10/1983 14206 41 446977 32 9
Brewarrina 3/12/1983 12558 42 343914 18 24

Observed Flows in the Barwon–Darling 1990-2017: A Hydrologic Investigation
Page 155
Site Event Start
Date
Peak Flow
(ML/d)
Event
Duration
(days)
Event
Volume (ML)
Rate of
Rise
(days)
Rate of
Fall (days)
Brewarrina 13/01/1984 28257 85 1410875 48 37
Brewarrina 6/04/1984 12409 84 521952 11 73
Brewarrina 28/06/1984 3610 23 64098 11 12
Brewarrina 20/07/1984 65938 72 1909838 42 30
Brewarrina 29/09/1984 12998 39 257420 2 37
Brewarrina 6/11/1984 11007 51 219623 28 23
Brewarrina 26/12/1984 3989 36 59073 10 26
Brewarrina 30/01/1985 735 27 14976 22 5
Brewarrina 25/02/1985 1430 50 46980 30 20
Brewarrina 15/04/1985 3322 127 88497 107 20
Brewarrina 19/08/1985 2387 12 19938 5 7
Brewarrina 30/08/1985 6267 51 153001 11 40
Brewarrina 19/10/1985 1727 18 21876 13 5
Brewarrina 5/11/1985 4008 25 55050 7 18
Brewarrina 29/11/1985 10234 51 197499 32 19
Brewarrina 18/01/1986 670 12 6137 8 4
Brewarrina 29/01/1986 825 29 16782 8 21
Brewarrina 26/02/1986 664 16 7620 8 8
Brewarrina 13/03/1986 517 14 5522 6 8
Brewarrina 26/03/1986 441 35 11202 12 23
Brewarrina 29/04/1986 446 54 15783 30 24
Brewarrina 21/06/1986 3737 60 54476 52 8
Brewarrina 19/08/1986 6281 99 251243 55 44
Brewarrina 25/11/1986 2077 44 46042 10 34
Brewarrina 7/01/1987 2998 17 25680 10 7
Brewarrina 23/01/1987 1665 13 17164 7 6
Brewarrina 4/02/1987 2429 44 49801 16 28
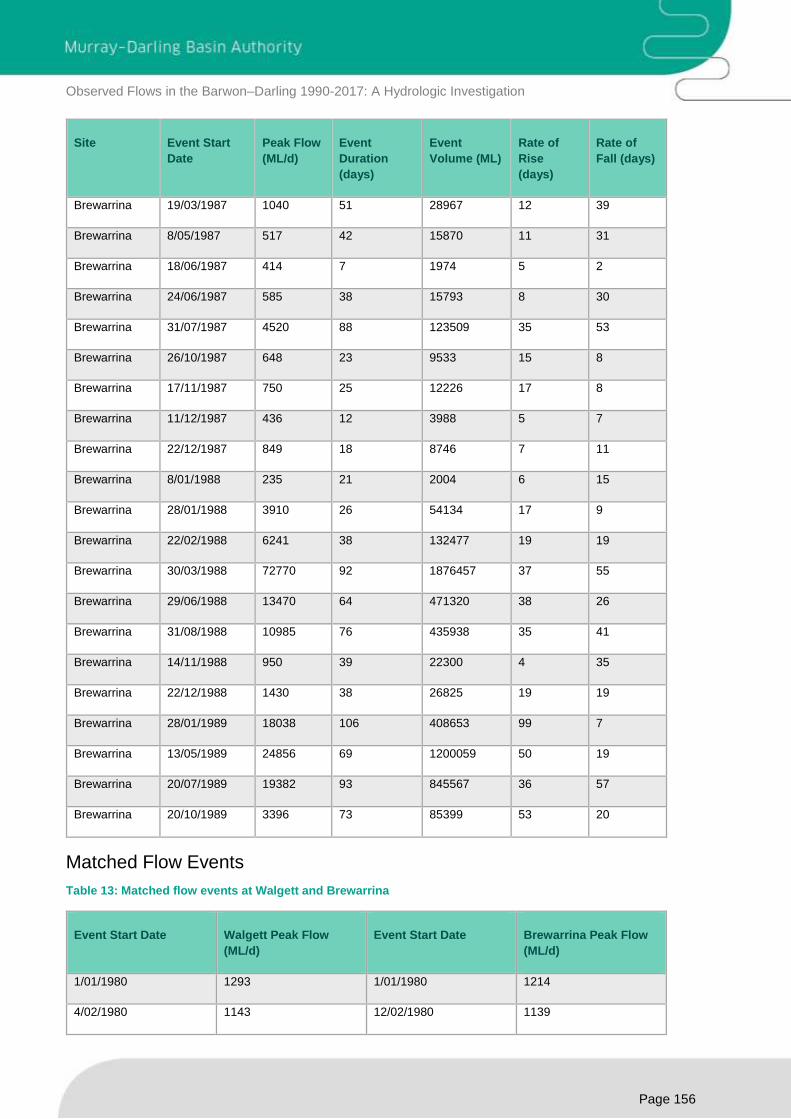
Observed Flows in the Barwon–Darling 1990-2017: A Hydrologic Investigation
Page 156
Site Event Start
Date
Peak Flow
(ML/d)
Event
Duration
(days)
Event
Volume (ML)
Rate of
Rise
(days)
Rate of
Fall (days)
Brewarrina 19/03/1987 1040 51 28967 12 39
Brewarrina 8/05/1987 517 42 15870 11 31
Brewarrina 18/06/1987 414 7 1974 5 2
Brewarrina 24/06/1987 585 38 15793 8 30
Brewarrina 31/07/1987 4520 88 123509 35 53
Brewarrina 26/10/1987 648 23 9533 15 8
Brewarrina 17/11/1987 750 25 12226 17 8
Brewarrina 11/12/1987 436 12 3988 5 7
Brewarrina 22/12/1987 849 18 8746 7 11
Brewarrina 8/01/1988 235 21 2004 6 15
Brewarrina 28/01/1988 3910 26 54134 17 9
Brewarrina 22/02/1988 6241 38 132477 19 19
Brewarrina 30/03/1988 72770 92 1876457 37 55
Brewarrina 29/06/1988 13470 64 471320 38 26
Brewarrina 31/08/1988 10985 76 435938 35 41
Brewarrina 14/11/1988 950 39 22300 4 35
Brewarrina 22/12/1988 1430 38 26825 19 19
Brewarrina 28/01/1989 18038 106 408653 99 7
Brewarrina 13/05/1989 24856 69 1200059 50 19
Brewarrina 20/07/1989 19382 93 845567 36 57
Brewarrina 20/10/1989 3396 73 85399 53 20
Matched Flow Events
Table 13: Matched flow events at Walgett and Brewarrina
Event Start Date Walgett Peak Flow
(ML/d)
Event Start Date Brewarrina Peak Flow
(ML/d)
1/01/1980 1293 1/01/1980 1214
4/02/1980 1143 12/02/1980 1139
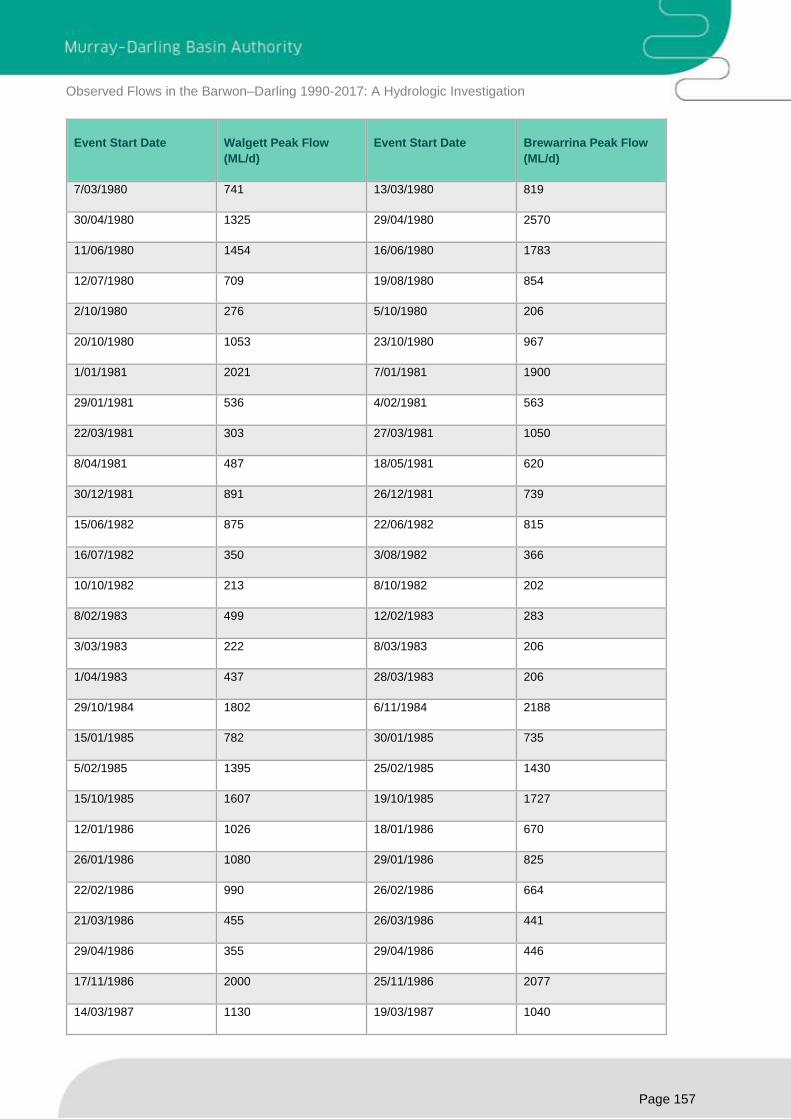
Observed Flows in the Barwon–Darling 1990-2017: A Hydrologic Investigation
Page 157
Event Start Date Walgett Peak Flow
(ML/d)
Event Start Date Brewarrina Peak Flow
(ML/d)
7/03/1980 741 13/03/1980 819
30/04/1980 1325 29/04/1980 2570
11/06/1980 1454 16/06/1980 1783
12/07/1980 709 19/08/1980 854
2/10/1980 276 5/10/1980 206
20/10/1980 1053 23/10/1980 967
1/01/1981 2021 7/01/1981 1900
29/01/1981 536 4/02/1981 563
22/03/1981 303 27/03/1981 1050
8/04/1981 487 18/05/1981 620
30/12/1981 891 26/12/1981 739
15/06/1982 875 22/06/1982 815
16/07/1982 350 3/08/1982 366
10/10/1982 213 8/10/1982 202
8/02/1983 499 12/02/1983 283
3/03/1983 222 8/03/1983 206
1/04/1983 437 28/03/1983 206
29/10/1984 1802 6/11/1984 2188
15/01/1985 782 30/01/1985 735
5/02/1985 1395 25/02/1985 1430
15/10/1985 1607 19/10/1985 1727
12/01/1986 1026 18/01/1986 670
26/01/1986 1080 29/01/1986 825
22/02/1986 990 26/02/1986 664
21/03/1986 455 26/03/1986 441
29/04/1986 355 29/04/1986 446
17/11/1986 2000 25/11/1986 2077
14/03/1987 1130 19/03/1987 1040
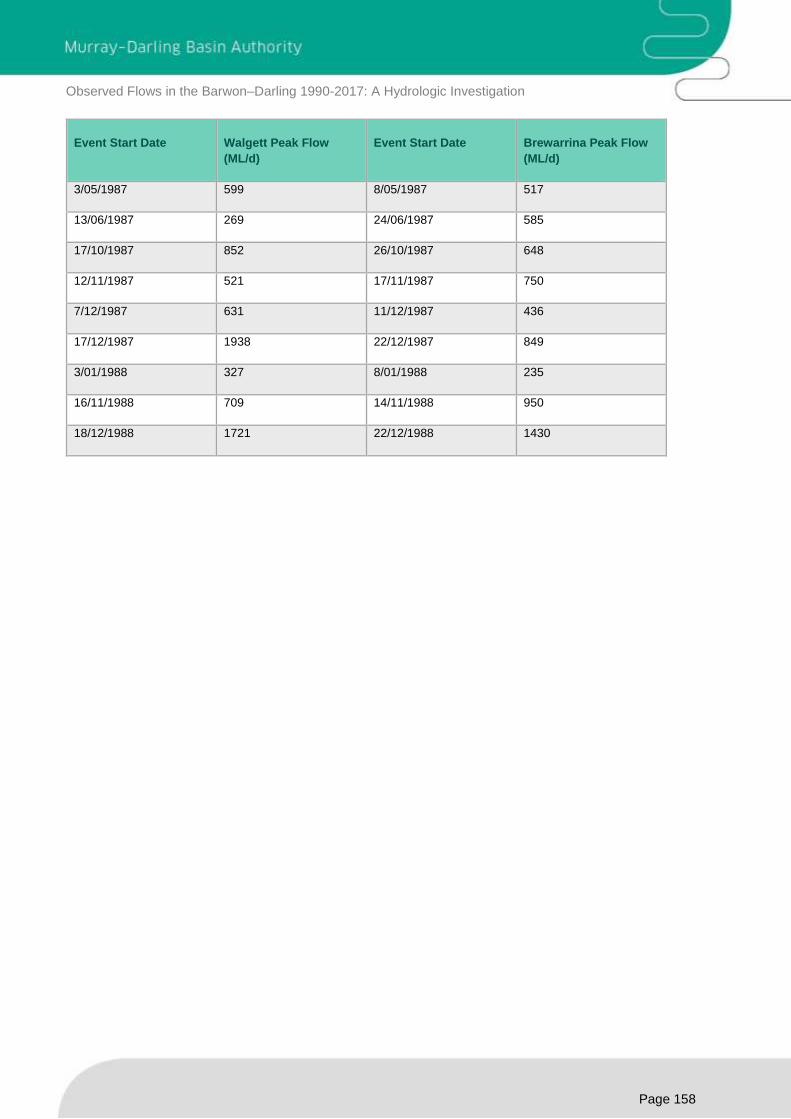
Observed Flows in the Barwon–Darling 1990-2017: A Hydrologic Investigation
Page 158
Event Start Date Walgett Peak Flow
(ML/d)
Event Start Date Brewarrina Peak Flow
(ML/d)
3/05/1987 599 8/05/1987 517
13/06/1987 269 24/06/1987 585
17/10/1987 852 26/10/1987 648
12/11/1987 521 17/11/1987 750
7/12/1987 631 11/12/1987 436
17/12/1987 1938 22/12/1987 849
3/01/1988 327 8/01/1988 235
16/11/1988 709 14/11/1988 950
18/12/1988 1721 22/12/1988 1430