Embed Size (px)
Citation preview

LETTERSPUBLISHED ONLINE: 4 AUGUST 2013 | DOI: 10.1038/NCLIMATE1963
Observed changes in the albedo of the Arcticsea-ice zone for the period 1982–2009Aku Riihelä*, Terhikki Manninen and Vesa Laine
The surface albedo of the Arctic sea-ice zone is a crucialcomponent in the energy budget of the Arctic region1,2. Thetreatment of sea-ice albedo has been identified as an importantsource of variability in the future sea-ice mass loss forecastsin coupled climate models3. There is a clear need to establishdata sets of Arctic sea-ice albedo to study the changes basedon observational data and to aid future modelling efforts. Herewe present an analysis of observed changes in the mean albedoof the Arctic sea-ice zone using a data set consisting of 28years of homogenized satellite data4. Along with the albedoreduction resulting from the well-known loss of late-summersea-ice cover5,6, we show that the mean albedo of the remainingArctic sea-ice zone is decreasing. The change per decade in themean August sea-ice zone albedo is−0.029±0.011. All albedotrends, except for the sea-ice zone in May, are significantwith a 99% confidence interval. Variations in mean sea-icealbedo can be explained using sea-ice concentration, surface airtemperature and elapsed time from onset of melt as drivers.
Our goal is to present and analyse the evolution of the black-skyalbedo of the Arctic sea-ice zone during the past three decades,as observed by the Satellite Application Facility on ClimateMonitoring (CM SAF) clouds, albedo and radiation—advancedvery high resolution radiometer (AVHRR) 1st release—surfacealbedo (CLARA-A1-SAL) data set. Here, we define albedo as thetotal solar flux reflectivity of Earth’s surface when all atmosphericabsorption and scattering effects have been corrected for (thatis, broadband shortwave directional–hemispherical reflectance).We focus on the melting season of the sea-ice (May–August),which contains the most interesting albedo dynamics and offerssufficient solar illumination at high enough solar elevation anglesto permit robust surface albedo retrievals. We examine the albedoevolution through the monthly mean products of CLARA-A1-SAL;Fig. 1 shows the August monthly mean albedo of the Arctic fromfour years in the data set. In August, worsening illuminationconditions combined with high cloud fractions often create an areaaround the North Pole where albedo is not retrievable with theCLARA-A1-SAL algorithm.
Our focus is on large-scale changes and trends in the meansurface albedo of the Arctic Ocean and its sea-ice. To extract thisinformation, we carry out two masking operations. First, we maskall land areas (as in Fig. 1), averaging the remaining grid cells.The result is the mean open-water–sea-ice composite albedo ofthe Arctic (henceforth composite albedo), containing the effectsof variations in the ice-covered area. The area that we define asthe Arctic Ocean is the area shown in Fig. 1. To extract solely thealbedo of the sea-ice zone, we further mask all grid cells outside theice concentration threshold (15%) and average the remaining cells.The result of this second operation is the mean sea-ice zone albedoof the Arctic. The temporal evolution of these two quantities maythen be studied separately, as shown in Fig. 2. To ensure that annual
Finnish Meteorological Institute, P.O. Box 503, FI-00101 Helsinki, Finland. *e-mail: [email protected]
variations in data availability for August will not affect the albedotrends, we implemented a spatiotemporal gap-filling of the Augustdata7. An example of gap-filling results is shown in SupplementaryFig. S1.We analyse both the original and gap-filled data set.
We find that the monthly means of both the composite andsea-ice zone albedo show a significant (at 99% confidence level)negative linear trend throughout the time series (Fig. 2), withthe exception of May sea-ice zone albedo. The trend slopes andcorrelation coefficients are listed in Table 1. The lack of a significantnegative trend in theMay sea-ice zone albedo is not surprising. Fieldstudy results indicate that the sea-ice and its snow cover recovereach winter so that the sea-ice zone in May consists mainly of coldsnow on top of thickened ice, having a stable albedo of 0.7–0.8(ref. 8). However, years of severe ice loss precondition the sea-iceto a lower extent the following spring, leading to the observednegative trend in the compositeMay albedo in Fig. 2a (which is onlyland-masked, low ice concentrations are present).
The presence of negative trends in both the composite andsea-ice zone albedo is also supported by other evidence. A recentstudy9 showed that melt onset occurs, on average, two to three daysearlier per decade over the central Arctic Ocean. The effects of thisearlier melt are combined with the documented disappearance ofold multiyear ice10 and the related thinning of the Arctic sea-icecover as a whole11. Thus, open water leads will appear sooner, thesnow cover on top of younger, thinner ice will be wetter and meltponding will start earlier and be more intensive. All this leads to acontinuous decrease in both the composite albedo and the albedo ofthe ice cover, as is readily seen in the June and July data of Fig. 2.
During August, the snow and ice melt have reached their peakand Arctic Ocean albedo is at a minimum. The observed negativealbedo trend is strongest during August; gap-filled data have slightlylarger negative trends relative to the original data. The compositealbedo trend is quite robust, but the trend strength of sea-ice albedo(of August and also in general) is much weaker. This is explainedby the fact that the slope of the negative trend is slight and thatannual variation in the intensity and phase of August precipitationover the Arctic can have a significant impact on the sea-ice albedo,increasing variance in the time series. This makes it harder toidentify a dominant trend in the data. In an attempt to better resolvethe underlying trend in the sea-ice albedo, we carried out a waveletdenoising of the August time series. The denoised data show amuchmore robust linear trend (Table 1). The second-degree polynomialfits are also shown for comparison. Supplementary Fig. S2 showsthe wavelet-denoised data and fits. Although a rapid decline inlate-summer sea-ice albedo is in line with recent Coupled ModelIntercomparison Project Phase 5 climatemodel projections12, otherrecent studies have proposed possible Arctic climate feedbackmechanisms that could act to stabilize albedo13.
Based on our data set, are there indications that the declineof the late-summer sea-ice zone albedo could be accelerating? A
NATURE CLIMATE CHANGE | ADVANCE ONLINE PUBLICATION | www.nature.com/natureclimatechange 1
© 2013 Macmillan Publishers Limited. All rights reserved.

LETTERS NATURE CLIMATE CHANGE DOI: 10.1038/NCLIMATE1963
100
90
80
70
60
50
40
30
20
10
0
Surface albedo (%)
a b
c d
Figure 1 | Examples of land-masked CLARA-A1-SAL August monthly mean albedo products. a–d, The mean land-masked surface albedo of the Arcticfrom 1985 (a), 1997 (b), 1999 (c) and 2008 (d). Years were selected to illustrate some of the maxima (1985 and 1997) and minima (1999 and 2008) ofArctic sea-ice albedo in the data set. Grey colour indicates grid cells with less than 30 valid retrievals during the month.
1980 1985 1990 1995Year
2000 2005 2010
0.4
0.5
0.6
0.7
0.8
Surf
ace
broa
dban
d bl
ack-
sky
albe
do
1980 1985 1990 1995Year
2000 2005 2010
Surf
ace
broa
dban
d bl
ack-
sky
albe
do
0.3
0.2
0.4
0.5
0.6
0.7
May June July August
August gap-filled
a
b
Figure 2 | The evolution of the averaged composite and sea-ice zonealbedo through the dataset coverage. a, The evolution of the monthlymean open-water–sea-ice composite albedo of the Arctic. b, The evolutionof the monthly mean sea-ice albedo of the Arctic. Thin lines indicatebest-fit linear trends.
previous study14 analysed Arctic sea-ice albedo from the ArcticPolar Pathfinder data set15 covering 1982–1998 and found onlyweak or non-existent trends. To compare results, we also calculatedthe August albedo trend for this period from the CLARA-A1-SALdata set. The trend (− 0.01 units per decade) agreed with theresults of the previous study14 within the error limits, being alsosubstantially weaker than the August albedo trend of the fulldata set. Although an acceleration in late-summer albedo decreasefrom the mid-1990s over the sea-ice zone would be consistentwith dominantly positive near-surface temperature anomalies inclimate simulations and reanalysis data sets16, there is considerableyear-to-year variability in the August mean sea-ice zone albedo,which prevents us fromdrawing conclusions on this question.
In other studies, observed sea-ice retreat seems to have followeda linear trend6 at least to the 2000s, although some studiesalso suggest that the ice-cover decline is accelerating5,17. Thereis also considerable disagreement among the Coupled ModelIntercomparison Project Phase 3 climate models on the timespanrequired for predominantly ice-free late-summer conditions inthe Arctic3, with some studies suggesting a possibility of a futureslowing of ice loss18. We find that the decline of late-summer ArcticOcean composite and sea-ice albedo seem to be equally rapid upto 2009. The albedo of the Arctic Ocean is not only affected bythe retreating ice cover, but also by changes in the mean surfaceconditions of the ice-covered area itself.
But which factors contribute most to the changes in Arcticsea-ice zone albedo? For the areally averaged albedo of the sea-icezone, changes in ice concentration are a strong driver because ofthe large contrast between the albedos of ice and open water19.Melting and freezing events in the near-surface snow and ice layersare another main source of albedo changes, and another study19also identifies the timing of melt onset as an important control onthe cumulative solar energy absorbed by the ice and open water,implying that changes in the timing of melt onset should also causealbedo changes in the sea-ice zone.
Following this theory, we should be able to explain mostof our observed changes through the following variables: iceconcentration, surface air temperature (SAT) and time since
2 NATURE CLIMATE CHANGE | ADVANCE ONLINE PUBLICATION | www.nature.com/natureclimatechange
© 2013 Macmillan Publishers Limited. All rights reserved.

NATURE CLIMATE CHANGE DOI: 10.1038/NCLIMATE1963 LETTERS
Table 1 |Observed trends in monthly mean albedos through least-squares fitting.
Month Linear trend slope (units per decade) R2
May, composite −0.019±0.006 0.62May, sea-ice −0.007±0.005 0.21June, composite −0.027±0.009 0.61June, sea-ice −0.019±0.010 0.35July, composite −0.029±0.008 0.66July, sea-ice −0.020±0.009 0.44August, composite −0.030±0.008 0.70August, sea-ice −0.029±0.011 0.50August gap-filled, composite −0.035±0.009 0.70August gap-filled, sea-ice −0.032±0.012 0.54August gap-filled and denoised, sea-ice −0.032±0.006 0.82
Month Second degree polynomial (x= year) R2
August gap-filled, sea-ice −0.0002x2+0.0015x+0.461 0.61
August gap-filled and denoised, sea-ice −0.0002x2+0.0020x+0.458 0.95
Slope uncertainties have been calculated at the 95% confidence interval.
1980 1985 1990 1995
Year
2000 2005 2010
1980 1985 1990 1995
Year
2000 2005 2010
1980 1985 1990 1995
Year
2000 2005 2010
1980 1985 1990 1995
Year
2000 2005 2010
0.4
0.5
0.6
0.4
0.5
0.6
0.5
0.6
0.7
0.5
0.6
0.7May
June
July
August
a
b
c
d
RMSE = 0.016254
RMSE = 0.016531
RMSE = 0.015036
RMSE = 0.0154
Sea-
ice
mon
thly
mea
n su
rfac
e al
bedo
Sea-
ice
mon
thly
mea
n su
rfac
e al
bedo
Sea-
ice
mon
thly
mea
n su
rfac
e al
bedo
Sea-
ice
mon
thly
mea
n su
rfac
e al
bedo
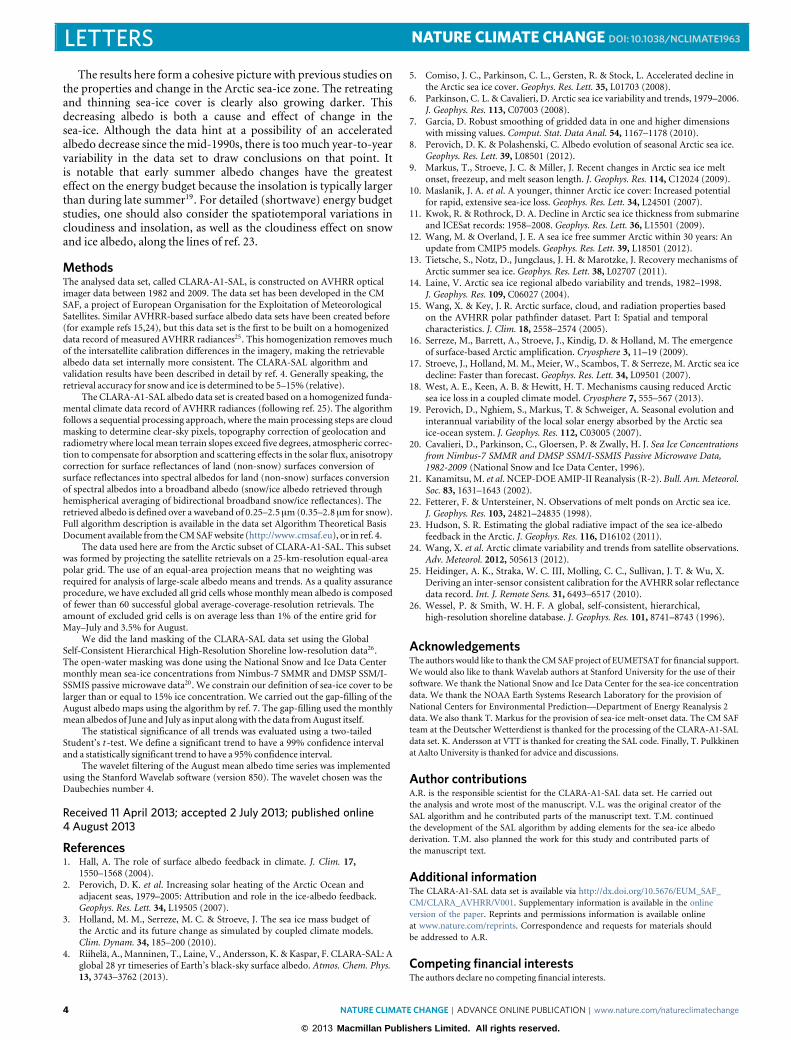
Figure 3 |Monthly sea-ice albedo over the Arctic, 1982–2009.a–d, CLARA-A1-SAL sea-ice only albedo averaged over the Arctic Ocean(solid blue line) and the parameterized sea-ice albedo from equation (1)using ice concentration, SAT and time difference from onset of melt seasonas drivers (dashed red line) for May (a), June (b), July (c) and August (d).
melt onset. We also expect all these variables to be linearlyrelated with surface albedo. We extracted ice concentration datafrom the National Aeronautics and Space Administration Teampassive microwave sea-ice concentrations product, produced at
the National Snow and Ice Data Center20, SAT data from theNational Centers for Environmental Prediction—Department ofEnergy Atmospheric Model Intercomparison Project ReanalysisR-221 and melt onset dates from the data set by a previous study9.The products were spatially averaged over the ice-covered ArcticOcean to conform with the CLARA-A1-SAL averages for sea-ice.To correctly handle melt onset, SAT data were converted to degreesCelsius. We then carried out a linear regression against the CLARA-A1-SAL (non-gap-filled) average sea-ice zone albedo, attempting toconstrain the coefficients to physical limits. The resulting best-fitparameterization for themeanArctic sea-ice zone albedo (αSI) is
αSI= 0.6387×C−0.0065×SAT65−90N
−0.0011× (DOY−MOD)+0.0676 (1)
where C is the average sea-ice concentration over the Arctic,SAT65−90N is the average SAT of all regions north of 65◦N, DOY isthe average day of year of each monthly mean (15th day of month),and MOD is the average day on which onset of melt occurred overthe Arctic. The constant term was forced as 0.0676 to ensure thatthe parameterization agrees well with open water albedo when C iszero (at a sun zenith angle of 60◦).
The parameterized albedo is shown against CLARA-A1-SALin Fig. 3. The achieved fit is quite good, with root-mean-squareerror (RMSE) of 0.015 or 0.016 for each month. Notably, itturned out that using the average SAT of all areas north of 65◦latitude produces somewhat better parameterization results forAugust than using the average SAT of the sea-ice zone (RMSEof 0.0154 versus 0.0186). The parameterization of equation (1)reproduces a realistic estimate of approximately 0.71 for sea-icealbedo when ice concentration is equal to one (when the other twoterms reduce to zero, that is, at melting point temperatures at theonset of the melt season). It needs to be kept in mind that thescope of the parameterization is limited; it considers only averagedvariables over the entire Arctic sea-ice zone, its temporal validity islimited to the melting season and, being empirical in nature, haslimits on the validity range of SAT. Passive microwave-based iceconcentrations are generally biased low during the melt season22,also contributing to the uncertainty of the parameterization.Still, the parameterization seems capable of explaining observedchanges in ice albedo data in accordance with previous studiesand physical constraints, reinforcing the plausibility of the trendsseen in CLARA-A1-SAL.
NATURE CLIMATE CHANGE | ADVANCE ONLINE PUBLICATION | www.nature.com/natureclimatechange 3
© 2013 Macmillan Publishers Limited. All rights reserved.
LETTERS NATURE CLIMATE CHANGE DOI: 10.1038/NCLIMATE1963
The results here form a cohesive picture with previous studies onthe properties and change in the Arctic sea-ice zone. The retreatingand thinning sea-ice cover is clearly also growing darker. Thisdecreasing albedo is both a cause and effect of change in thesea-ice. Although the data hint at a possibility of an acceleratedalbedo decrease since themid-1990s, there is toomuch year-to-yearvariability in the data set to draw conclusions on that point. Itis notable that early summer albedo changes have the greatesteffect on the energy budget because the insolation is typically largerthan during late summer19. For detailed (shortwave) energy budgetstudies, one should also consider the spatiotemporal variations incloudiness and insolation, as well as the cloudiness effect on snowand ice albedo, along the lines of ref. 23.
MethodsThe analysed data set, called CLARA-A1-SAL, is constructed on AVHRR opticalimager data between 1982 and 2009. The data set has been developed in the CMSAF, a project of European Organisation for the Exploitation of MeteorologicalSatellites. Similar AVHRR-based surface albedo data sets have been created before(for example refs 15,24), but this data set is the first to be built on a homogenizeddata record of measured AVHRR radiances25. This homogenization removes muchof the intersatellite calibration differences in the imagery, making the retrievablealbedo data set internally more consistent. The CLARA-SAL algorithm andvalidation results have been described in detail by ref. 4. Generally speaking, theretrieval accuracy for snow and ice is determined to be 5–15% (relative).
The CLARA-A1-SAL albedo data set is created based on a homogenized funda-mental climate data record of AVHRR radiances (following ref. 25). The algorithmfollows a sequential processing approach, where themain processing steps are cloudmasking to determine clear-sky pixels, topography correction of geolocation andradiometry where localmean terrain slopes exceed five degrees, atmospheric correc-tion to compensate for absorption and scattering effects in the solar flux, anisotropycorrection for surface reflectances of land (non-snow) surfaces conversion ofsurface reflectances into spectral albedos for land (non-snow) surfaces conversionof spectral albedos into a broadband albedo (snow/ice albedo retrieved throughhemispherical averaging of bidirectional broadband snow/ice reflectances). Theretrieved albedo is defined over a waveband of 0.25–2.5 µm(0.35–2.8 µm for snow).Full algorithm description is available in the data set Algorithm Theoretical BasisDocument available from theCMSAFwebsite (http://www.cmsaf.eu), or in ref. 4.
The data used here are from the Arctic subset of CLARA-A1-SAL. This subsetwas formed by projecting the satellite retrievals on a 25-km-resolution equal-areapolar grid. The use of an equal-area projection means that no weighting wasrequired for analysis of large-scale albedo means and trends. As a quality assuranceprocedure, we have excluded all grid cells whose monthly mean albedo is composedof fewer than 60 successful global average-coverage-resolution retrievals. Theamount of excluded grid cells is on average less than 1% of the entire grid forMay–July and 3.5% for August.
We did the land masking of the CLARA-SAL data set using the GlobalSelf-Consistent Hierarchical High-Resolution Shoreline low-resolution data26.The open-water masking was done using the National Snow and Ice Data Centermonthly mean sea-ice concentrations from Nimbus-7 SMMR and DMSP SSM/I-SSMIS passive microwave data20. We constrain our definition of sea-ice cover to belarger than or equal to 15% ice concentration. We carried out the gap-filling of theAugust albedo maps using the algorithm by ref. 7. The gap-filling used the monthlymean albedos of June and July as input alongwith the data fromAugust itself.
The statistical significance of all trends was evaluated using a two-tailedStudent’s t -test. We define a significant trend to have a 99% confidence intervaland a statistically significant trend to have a 95% confidence interval.
The wavelet filtering of the August mean albedo time series was implementedusing the Stanford Wavelab software (version 850). The wavelet chosen was theDaubechies number 4.
Received 11 April 2013; accepted 2 July 2013; published online4 August 2013
References1. Hall, A. The role of surface albedo feedback in climate. J. Clim. 17,
1550–1568 (2004).2. Perovich, D. K. et al. Increasing solar heating of the Arctic Ocean and
adjacent seas, 1979–2005: Attribution and role in the ice-albedo feedback.Geophys. Res. Lett. 34, L19505 (2007).
3. Holland, M. M., Serreze, M. C. & Stroeve, J. The sea ice mass budget ofthe Arctic and its future change as simulated by coupled climate models.Clim. Dynam. 34, 185–200 (2010).
4. Riihelä, A., Manninen, T., Laine, V., Andersson, K. & Kaspar, F. CLARA-SAL: Aglobal 28 yr timeseries of Earth’s black-sky surface albedo. Atmos. Chem. Phys.13, 3743–3762 (2013).
5. Comiso, J. C., Parkinson, C. L., Gersten, R. & Stock, L. Accelerated decline inthe Arctic sea ice cover. Geophys. Res. Lett. 35, L01703 (2008).
6. Parkinson, C. L. & Cavalieri, D. Arctic sea ice variability and trends, 1979–2006.J. Geophys. Res. 113, C07003 (2008).
7. Garcia, D. Robust smoothing of gridded data in one and higher dimensionswith missing values. Comput. Stat. Data Anal. 54, 1167–1178 (2010).
8. Perovich, D. K. & Polashenski, C. Albedo evolution of seasonal Arctic sea ice.Geophys. Res. Lett. 39, L08501 (2012).
9. Markus, T., Stroeve, J. C. & Miller, J. Recent changes in Arctic sea ice meltonset, freezeup, and melt season length. J. Geophys. Res. 114, C12024 (2009).
10. Maslanik, J. A. et al. A younger, thinner Arctic ice cover: Increased potentialfor rapid, extensive sea-ice loss. Geophys. Res. Lett. 34, L24501 (2007).
11. Kwok, R. & Rothrock, D. A. Decline in Arctic sea ice thickness from submarineand ICESat records: 1958–2008. Geophys. Res. Lett. 36, L15501 (2009).
12. Wang, M. & Overland, J. E. A sea ice free summer Arctic within 30 years: Anupdate from CMIP5 models. Geophys. Res. Lett. 39, L18501 (2012).
13. Tietsche, S., Notz, D., Jungclaus, J. H. & Marotzke, J. Recovery mechanisms ofArctic summer sea ice. Geophys. Res. Lett. 38, L02707 (2011).
14. Laine, V. Arctic sea ice regional albedo variability and trends, 1982–1998.J. Geophys. Res. 109, C06027 (2004).
15. Wang, X. & Key, J. R. Arctic surface, cloud, and radiation properties basedon the AVHRR polar pathfinder dataset. Part I: Spatial and temporalcharacteristics. J. Clim. 18, 2558–2574 (2005).
16. Serreze, M., Barrett, A., Stroeve, J., Kindig, D. & Holland, M. The emergenceof surface-based Arctic amplification. Cryosphere 3, 11–19 (2009).
17. Stroeve, J., Holland, M. M., Meier, W., Scambos, T. & Serreze, M. Arctic sea icedecline: Faster than forecast. Geophys. Res. Lett. 34, L09501 (2007).
18. West, A. E., Keen, A. B. & Hewitt, H. T. Mechanisms causing reduced Arcticsea ice loss in a coupled climate model. Cryosphere 7, 555–567 (2013).
19. Perovich, D., Nghiem, S., Markus, T. & Schweiger, A. Seasonal evolution andinterannual variability of the local solar energy absorbed by the Arctic seaice-ocean system. J. Geophys. Res. 112, C03005 (2007).
20. Cavalieri, D., Parkinson, C., Gloersen, P. & Zwally, H. J. Sea Ice Concentrationsfrom Nimbus-7 SMMR and DMSP SSM/I-SSMIS Passive Microwave Data,1982-2009 (National Snow and Ice Data Center, 1996).
21. Kanamitsu, M. et al. NCEP-DOE AMIP-II Reanalysis (R-2). Bull. Am.Meteorol.Soc. 83, 1631–1643 (2002).
22. Fetterer, F. & Untersteiner, N. Observations of melt ponds on Arctic sea ice.J. Geophys. Res. 103, 24821–24835 (1998).
23. Hudson, S. R. Estimating the global radiative impact of the sea ice-albedofeedback in the Arctic. J. Geophys. Res. 116, D16102 (2011).
24. Wang, X. et al. Arctic climate variability and trends from satellite observations.Adv. Meteorol. 2012, 505613 (2012).
25. Heidinger, A. K., Straka, W. C. III, Molling, C. C., Sullivan, J. T. & Wu, X.Deriving an inter-sensor consistent calibration for the AVHRR solar reflectancedata record. Int. J. Remote Sens. 31, 6493–6517 (2010).
26. Wessel, P. & Smith, W. H. F. A global, self-consistent, hierarchical,high-resolution shoreline database. J. Geophys. Res. 101, 8741–8743 (1996).
AcknowledgementsThe authors would like to thank the CM SAF project of EUMETSAT for financial support.We would also like to thank Wavelab authors at Stanford University for the use of theirsoftware. We thank the National Snow and Ice Data Center for the sea-ice concentrationdata. We thank the NOAA Earth Systems Research Laboratory for the provision ofNational Centers for Environmental Prediction—Department of Energy Reanalysis 2data. We also thank T. Markus for the provision of sea-ice melt-onset data. The CM SAFteam at the Deutscher Wetterdienst is thanked for the processing of the CLARA-A1-SALdata set. K. Andersson at VTT is thanked for creating the SAL code. Finally, T. Pulkkinenat Aalto University is thanked for advice and discussions.
Author contributionsA.R. is the responsible scientist for the CLARA-A1-SAL data set. He carried outthe analysis and wrote most of the manuscript. V.L. was the original creator of theSAL algorithm and he contributed parts of the manuscript text. T.M. continuedthe development of the SAL algorithm by adding elements for the sea-ice albedoderivation. T.M. also planned the work for this study and contributed parts ofthe manuscript text.
Additional informationThe CLARA-A1-SAL data set is available via http://dx.doi.org/10.5676/EUM_SAF_CM/CLARA_AVHRR/V001. Supplementary information is available in the onlineversion of the paper. Reprints and permissions information is available onlineat www.nature.com/reprints. Correspondence and requests for materials shouldbe addressed to A.R.
Competing financial interestsThe authors declare no competing financial interests.
4 NATURE CLIMATE CHANGE | ADVANCE ONLINE PUBLICATION | www.nature.com/natureclimatechange
© 2013 Macmillan Publishers Limited. All rights reserved.