Embed Size (px)
Citation preview
CLIMATE RESEARCHClim Res
Vol. 46: 171–183, 2011doi: 10.3354/cr00985
Published online March 8
1. INTRODUCTION
Averaging over 4000 m above sea level (a.s.l.) andan area of approximately 2.5 × 10⁶ km2, the TibetanPlateau (TP) has the largest area of semi-permanentsnow and ice in the mid-latitudes, and is regarded asthe Asian water tower (Yeh & Gao 1979, Immerzeel etal. 2010). Changes in both snow cover duration andsnow pack (including depth and water content) are ofgreat importance, in particular due to their influenceon water resources on the plateau and downstream.Snow and glacial melt are also important hydrologicalprocesses in the TP, and changes in temperature and
precipitation are expected to seriously affect the meltcharacteristics (Immerzeel et al. 2010). Water originat-ing from the plateau accounts for nearly half of thetotal surface water resources in China, supportingnearly 40% of the world’s population (Xu et al. 2008).Yanai & Li (1994) revealed the mechanism of heatingand the structure of the boundary layer in the TP, andfound that the sensible heat flux at the surface is themajor source of heating in the TP in summer. Thegreatest temperature increase in the TP is found inwinter (0.40°C decade–1), which is the main componentof the increase in annual mean temperature (You et al.2010a). Snow cover in the TP influences surface mois-
© Inter-Research 2011 · www.int-res.com*Corresponding author. Email: [email protected]
Observed changes in snow depth and number ofsnow days in the eastern and central Tibetan Plateau
Qinglong You1, 2, 3, 4, Shichang Kang1, 5,*, Guoyu Ren2, Klaus Fraedrich3,Nick Pepin6, Yuping Yan2, Lijuan Ma2
1Laboratory of Tibetan Environment Changes and Land Surface Processes, Institute of Tibetan Plateau Research, Chinese Academy of Sciences (CAS), Beijing 100085, China
2Laboratory for Climate Studies, National Climate Center, China Meteorological Administration (CMA), Beijing 100081, China3Meteorological Institute, KlimaCampus, University of Hamburg, Hamburg 21044, Germany
4Graduate University of Chinese Academy of Sciences, Beijing 100049, China5State Key Laboratory of Cryospheric Science, CAS, Lanzhou 730000, China
6Department of Geography, University of Portsmouth, Portsmouth PO1 3HE, UK
ABSTRACT: The Tibetan Plateau (TP) has the largest area of snow in the mid-latitude regions, and isstrongly affected by the climate change. We examine the temporal variability of winter snow depthand number of days of snow cover at 69 Chinese Meteorological Administration stations above2000 m a.s.l. in the eastern and central TP during 1961–2005. Snow depth is positively correlated withthe number of snow days (R = 0.89, p < 0.0001). Regional mean winter (DJF) depth and days of snowcover increase at rates of 0.32 mm decade–1 and 0.40 d decade–1 from 1961 to 1990, but at rates of–1.80 mm decade–1 and –1.59 d decade–1 (i.e. decrease) between 1991 and 2005. The long term trendsare weakly positive, but unrepresentative of shorter time periods. Thus snow depth and cover changedepends on the timescale examined and cannot be attributed solely to increased greenhouse gasforcing. The decreasing snow depth in recent years will influence hydrological processes and waterresources on the plateau and downstream. Both snow depth and duration have positive correlationswith the winter Arctic Oscillation/North Atlantic Oscillation (AO/NAO) index and Niño-3 region(5° N–5° S, 150°–90° W) sea surface temperature (SST). During high AO/NAO index years, both adeeper India–Burma trough and an intensified cyclonic circulation near Lake Baikal bring moresnowfall to the TP, consistent with a higher water vapor flux. The opposite is true in low AO/NAOyears. Thus secular changes of snow depth and duration in the TP are not independent of changes inthe macro-scale atmospheric circulation.
KEY WORDS: Snow depth · Snow days · Tibetan Plateau · Arctic Oscillation · North Atlantic Oscillation
Resale or republication not permitted without written consent of the publisher

Clim Res 46: 171–183, 2011
ture and energy fluxes, and therefore weather over alarge area. For example, it has been suggested as apotential predictor of East Asian summer monsoonrainfall (Zhang et al. 2004).
Despite such importance, there are limited surfacesnow cover and depth data at high elevations on theTP which makes knowledge patchy about cryospherictrends. Surface observations should be supplementedby remotely-sensed data, and are dependent on theperiod studied; consequently, different data sourceshave given different results (Kang et al. 2010). Previ-ous studies using surface data from 60 stations sug-gested that snow cover increased during 1957–1992,which is inconsistent with the reduced extent of snowcover in other extra-tropical areas in the late 1980s,but coincides with recent increases in Antarctic andGreenland snow accumulation (Li 1996, Chen & Wu2000). Based on Scanning Multichannel MicrowaveRadiometer (SMMR) NOAA snow-extent charts, meansnow depth and the number of snow-cover days haveboth increased in western China between 1951 and1997 (Qin et al. 2006). However, the snow-cover frac-tion from the Moderate Resolution Imaging Spectro-radiometer (MODIS) in the TP during 2000–2006 showsa slight decreasing trend (Pu & Xu 2009).
The Arctic Oscillation/North Atlantic Oscillation(AO/NAO) is one of the dominant patterns of NorthernHemisphere climate variability, and most prevalent inwinter and in the mid and high latitudes (Hurrell 1995,Thompson & Wallace 1998). The oscillation has impor-tant effects on the weather and climate of the NorthAtlantic region and surrounding continents,especially Europe. The NAO is a measure ofthe strength and position of the storm tracksand depressions across the North Atlantic andinto Europe, and of the strength of the prevail-ing westerly winds associated with the stormtrack (Hurrell 1995). The NAO is usually re-garded as the regional manifestation of theglobal scale AO in the Atlantic sector. Thus theNAO is part of the AO (Wallace 2000). Recentstudies have shown that winter season AO andsnow cover are significantly correlated(Bamzai 2003), and that the winter AO/NAOindex influences Eurasian winter snow-coverextent (Saito & Cohen 2003). The NAO is a fac-tor in the weakening of the Indian monsoon(Chang et al. 2001). Furthermore, the role ofwinter NAO in March cooling trends over sub-tropical Eurasia continent has been demon-strated by Yu & Zhou (2004), who also foundthat positive winter NAO triggers coolingsignals—occurring between the surface andthe tropopause—in northern Africa. In the TP,there also exists significant correlation between
the AO and snow depth at an inter-decadal time scale(Lü et al. 2008). In addition, El Niño/Southern Oscilla-tion (ENSO) interacts with Asian monsoon rainfall andEurasian snowpack. But there has been little investiga-tion of AO and ENSO influence on long-term snowtrends in the TP.
The TP has undergone pronounced warming, andthe environmental consequences of warming are al-ready evident (Zhang 2007). Therefore, more attentionshould be paid to the cryospheric changes, which mayresult from global warming. In this study, we investi-gate changes in snow depth and snow cover duration,based on recent datasets from the China Meteorologi-cal Administration. As well as examining broad trendsover differing periods, we examine the role of theAO/NAO and ENSO in influencing both snow depthand snow cover duration in the TP.
2. DATASET AND METHOD
Monthly mean snow depth and days of snow cover at69 stations (Fig. 1) are provided by the National Cli-mate Center, part of the China Meteorological Admin-istration. A ‘snow day’ is characterized by an accumu-lated snow depth over 1 cm. Since coverage in thewestern TP is extremely patchy, we confine our analy-sis to the eastern and central TP and between the years1961 and 2005. We concentrate on winter (DJF) varia-tion of snow depth and duration because of highermean values in this season. Stations were selected
172
Fig. 1. Distribution of observational data (white dots) in the eastern and central Tibetan Plateau
You et al.: Snow days and depth on the Tibetan Plateau
according to procedures described in our recentpapers (You et al. 2008a,b, 2010a,b). The NAO indexwas available from www.cru.uea.ac.uk/cru/climon/data/nao, updated from works by Hurrell (1995). AOindex (AOI) is defined as the difference in the normal-ized monthly zonal-mean sea level pressure (SLP)between 35° and 65° N (Li & Wang 2003), derived fromhttp://web.lasg.ac.cn/staff/ljp/data-NAM-SAM-NAO/NAM-AO.htm. The Niño-3 region (5° N–5° S,150°–90° W) was selected as the ENSO index, which isthe eastern tropical Pacific sea surface temperature(SST) from NOAA Climate Prediction Center (CPC)(www.cpc.ncep.noaa.gov/data/indices/).
To quantify changes in large scale atmospheric cir-culation, monthly mean geopotential height and zonaland meridional wind at 500 hPa were obtained fromthe National Centers for Environmental Prediction/National Center for Atmospheric Research (NCEP/NCAR) reanalysis (Kalnay et al. 1996). Water vaporflux was also calculated from the NCEP/NCAR re-analysis data, which is defined as follows:
where Q is water vapour flux, t is time period,p is pressure, λ is longitude, φ is latitude, q isspecific humidity, u is latitudinal wind speedand v is meridional wind speed, respectively.Ps is surface pressure, and Pt is pressure at300 hPa.
The Mann-Kendall test for trends and Sen’sslope estimates are used to detect and esti-mate trends in annual and seasonal reanalysiswind speeds (Sen 1968), with significancedefined as p < 0.05.
3. RESULTS: SNOW DEPTH ANDDURATION CLIMATOLOGY
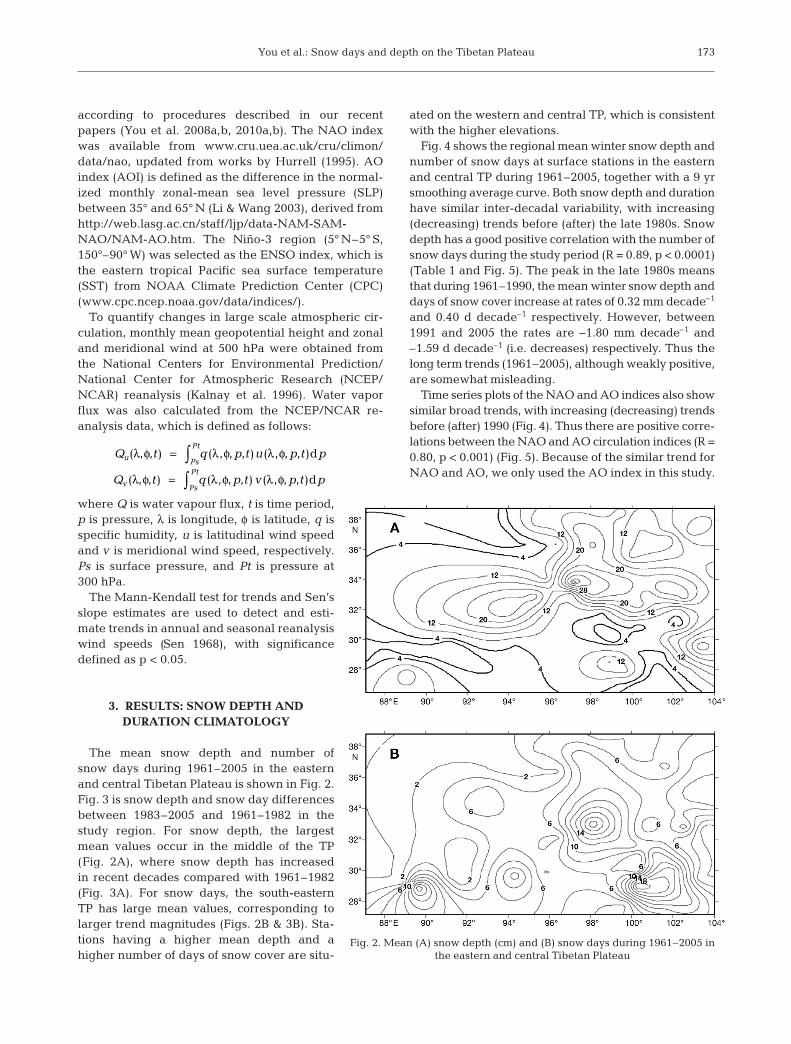
The mean snow depth and number ofsnow days during 1961–2005 in the easternand central Tibetan Plateau is shown in Fig. 2.Fig. 3 is snow depth and snow day differencesbetween 1983–2005 and 1961–1982 in thestudy region. For snow depth, the largestmean values occur in the middle of the TP(Fig. 2A), where snow depth has increasedin recent decades compared with 1961–1982(Fig. 3A). For snow days, the south-easternTP has large mean values, corresponding tolarger trend magnitudes (Figs. 2B & 3B). Sta-tions having a higher mean depth and ahigher number of days of snow cover are situ-
ated on the western and central TP, which is consistentwith the higher elevations.
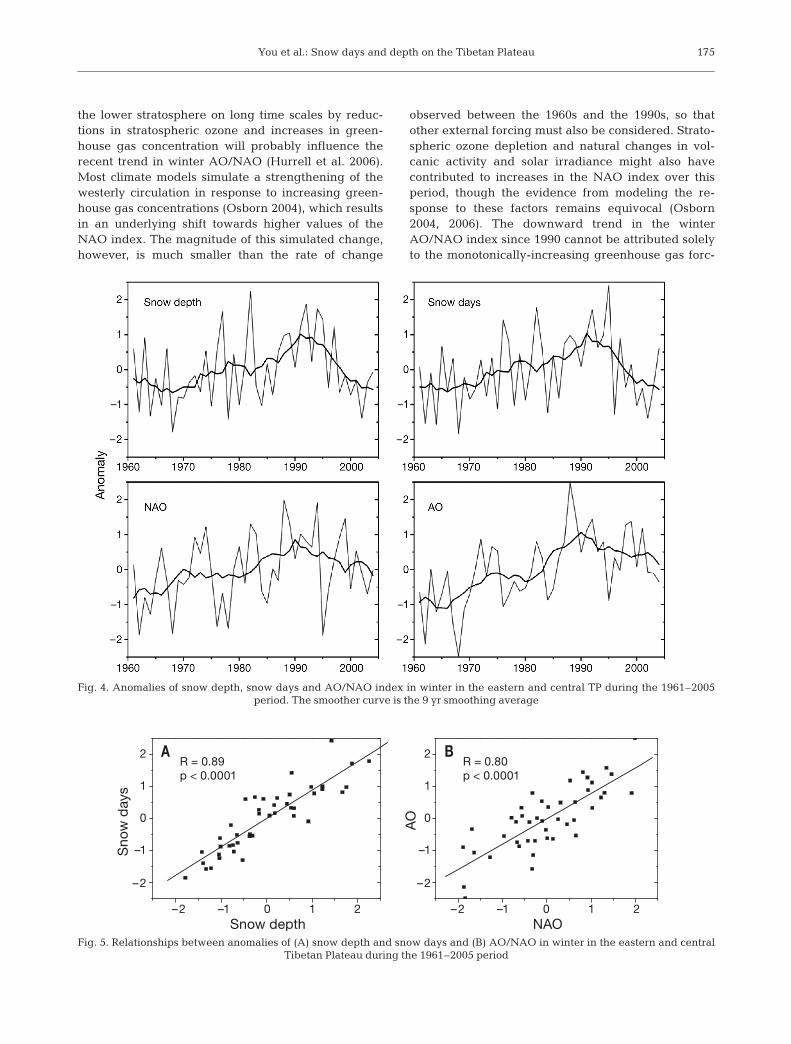
Fig. 4 shows the regional mean winter snow depth andnumber of snow days at surface stations in the easternand central TP during 1961–2005, together with a 9 yrsmoothing average curve. Both snow depth and durationhave similar inter-decadal variability, with increasing(decreasing) trends before (after) the late 1980s. Snowdepth has a good positive correlation with the number ofsnow days during the study period (R = 0.89, p < 0.0001)(Table 1 and Fig. 5). The peak in the late 1980s meansthat during 1961–1990, the mean winter snow depth anddays of snow cover increase at rates of 0.32 mm decade–1
and 0.40 d decade–1 respectively. However, between1991 and 2005 the rates are –1.80 mm decade–1 and–1.59 d decade–1 (i.e. decreases) respectively. Thus thelong term trends (1961–2005), although weakly positive,are somewhat misleading.
Time series plots of the NAO and AO indices also showsimilar broad trends, with increasing (decreasing) trendsbefore (after) 1990 (Fig. 4). Thus there are positive corre-lations between the NAO and AO circulation indices (R =0.80, p < 0.001) (Fig. 5). Because of the similar trend forNAO and AO, we only used the AO index in this study.
Q t q p t v p t pv Ps
Pt( , , ) ( , , , ) ( , , , )λ φ λ φ λ φ= ∫ d
Q t q p t u p t pu Ps
Pt( , , ) ( , , , ) ( , , , )λ φ λ φ λ φ= ∫ d
173
Fig. 2. Mean (A) snow depth (cm) and (B) snow days during 1961–2005 in the eastern and central Tibetan Plateau

Clim Res 46: 171–183, 2011
4. RELATIONSHIP BETWEEN SNOW DEPTH ANDTHE AO/ENSO
4.1. Snow depth–AO relationship
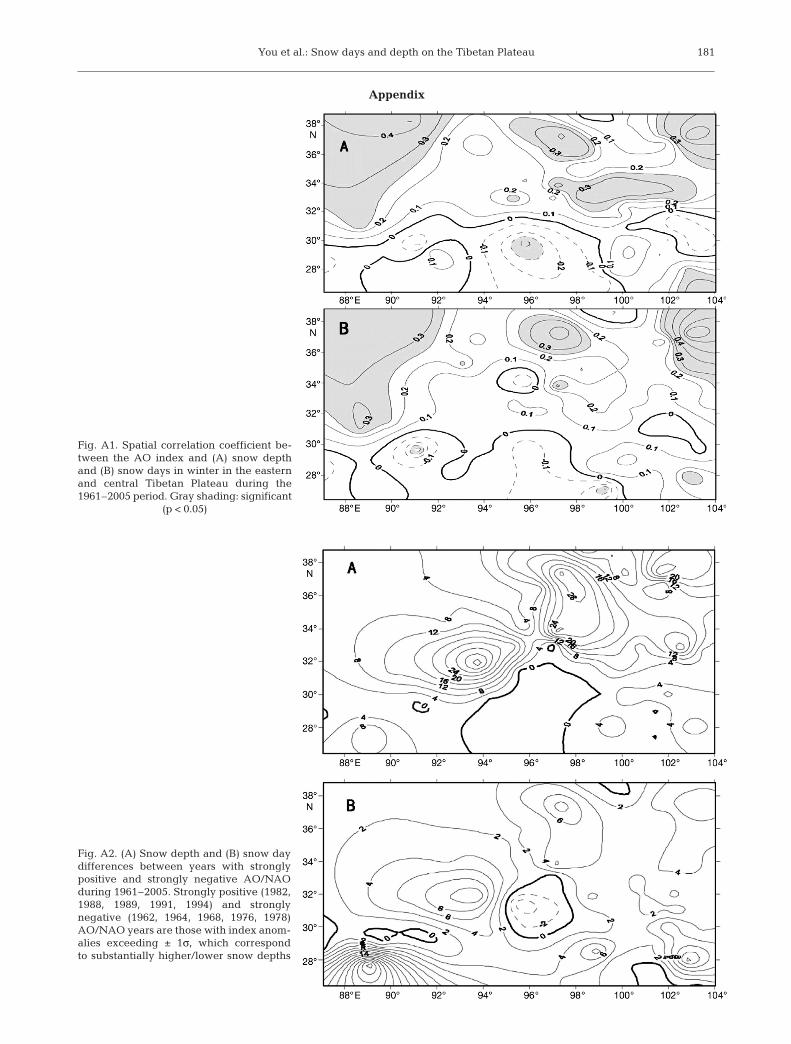
Fig. 6 shows the relationship between the AO andsnow depth/snow days in winter in the eastern andcentral TP during 1961–2005. Taking the TP as awhole, snow depth has a good positive correlation withthe AO index during the study period (R = 0.40, p =0.007), and a similar positive correlation is also foundwith snow days. Table 1 provides further evidencethat AO anomalies are correlated with snow depthand duration on the regional scale (R > 0.3, p < 0.05).Fig. A1 in the Appendix shows the spatial correlationcoefficients between the AO index and snow depthand snow days. In most regions of the TP, both snowdepth and snow days have positive correlation with theAO index, and the larger correlation coefficients occurin the northern TP, although there also exists negativecorrelation in the southern TP. Fig. A2 shows thedifferences in snow depth and snow days between
strongly positive and strongly negative AO/NAO years during 1961–2005, and it is clearthat snow depth and snow days are higher(lower) in the TP when the AO/NAO index ispositive(negative).
To investigate the association between AO/NAO and snow depth and duration, Fig. 7 showsthe mean differences (positive minus negativeyears) of (A) geopotential height, (B) wind field(m s–1), and (C) zonal winds at 500hPa in circu-lation between high and low AO years, basedon composite maps for strongly positive (1982,1988, 1989, 1991, 1994) minus strongly negative(1962, 1964, 1968, 1976, 1978) AO/NAO years.To be defined as strongly positive/negative,index anomalies had to exceed ±1σ. The se-lected region covers the domain 0° to 70° N and0° to 160° E. The largest differences in geo-potential height are approximately 50 to 60 geo-potential metres (gpm). As a result, enhancedanticyclonic circulation is centered over theAlps (45° N and 10° E) and cyclonic circulationover the Urals (focused near 55° N and 60° E).This generates an anomalous north-westerlyflow over eastern Europe which carries rela-tively warm maritime air over the cold Eurasianwintertime land mass. When this enhanced flowreaches the higher terrain of central Asia andwestern China it bifurcates, with the northernaxis flowing north-east towards Russia, and thesouthern axis entering India. A surface counter-flow develops over northern China, whichdecreases the zonal wind at 500 hPa. This in
turn deepens the cyclonic circulation and brings moresouth-easterly winds with increased water vapor intothe northern TP. The southern axis strengthens theIndia-Burma trough, and an increased south-westerlyflow on the rising limb of the trough in southern andeastern China weakens the northwesterly winter mon-soon, limiting its southward extension. Thus incursionsof colder air into southern China tend to decreasewhen the westerlies are strong (Thompson & Wallace2001). Overall, when the AO/NAO index is in its highphase, the atmospheric circulation pattern is beneficialto transportation of water vapor to the TP, and this willincrease snow cover and duration. Differences in meanwater vapor flux between strongly positive and nega-tive AO/NAO years (Fig. 8) support this idea.
At present, there are different possible mechanismsfor the variation of AO/NAO, which could be classifiedinto 3 types: atmospheric processes, ocean influences,and sea ice and land snow cover, although there is noconsensus on the mechanisms (Hurrell et al. 2001, Hur-rell et al. 2006, Hurrell & Deser 2010). The externalforcing of the strength of the atmospheric circulation in
174
Fig. 3. (A) Snow depth and (B) snow day differences between theperiods 1983–2005 and 1961–1982 in the eastern and central Tibetan
Plateau
You et al.: Snow days and depth on the Tibetan Plateau
the lower stratosphere on long time scales by reduc-tions in stratospheric ozone and increases in green-house gas concentration will probably influence therecent trend in winter AO/NAO (Hurrell et al. 2006).Most climate models simulate a strengthening of thewesterly circulation in response to increasing green-house gas concentrations (Osborn 2004), which resultsin an underlying shift towards higher values of theNAO index. The magnitude of this simulated change,however, is much smaller than the rate of change
observed between the 1960s and the 1990s, so thatother external forcing must also be considered. Strato-spheric ozone depletion and natural changes in vol-canic activity and solar irradiance might also havecontributed to increases in the NAO index over thisperiod, though the evidence from modeling the re-sponse to these factors remains equivocal (Osborn2004, 2006). The downward trend in the winterAO/NAO index since 1990 cannot be attributed solelyto the monotonically-increasing greenhouse gas forc-
175
Fig. 4. Anomalies of snow depth, snow days and AO/NAO index in winter in the eastern and central TP during the 1961–2005 period. The smoother curve is the 9 yr smoothing average
–2
–1
0
1
2
–2
–1
0
1
2
Sno
w d
ays
R = 0.89p < 0.0001
R = 0.80p < 0.0001
Snow depth–2 –1 0 1 2–2 –1 0 1 2
AO
NAO
A B
Fig. 5. Relationships between anomalies of (A) snow depth and snow days and (B) AO/NAO in winter in the eastern and central Tibetan Plateau during the 1961–2005 period

Clim Res 46: 171–183, 2011
ing (Visbec et al. 2000). Interactions between oceansand atmosphere, by the changes in surface sea temper-ature, are also important for understanding the varia-tion of the AO/NAO (Hurrel et al. 2006). Some studieshave suggested that snow cover producing largechanges in sensible and latent heat flux partiallymodulates the winter AO/NAO (Saito & Cohen 2003).
4.2. Snow depth–ENSO relationship
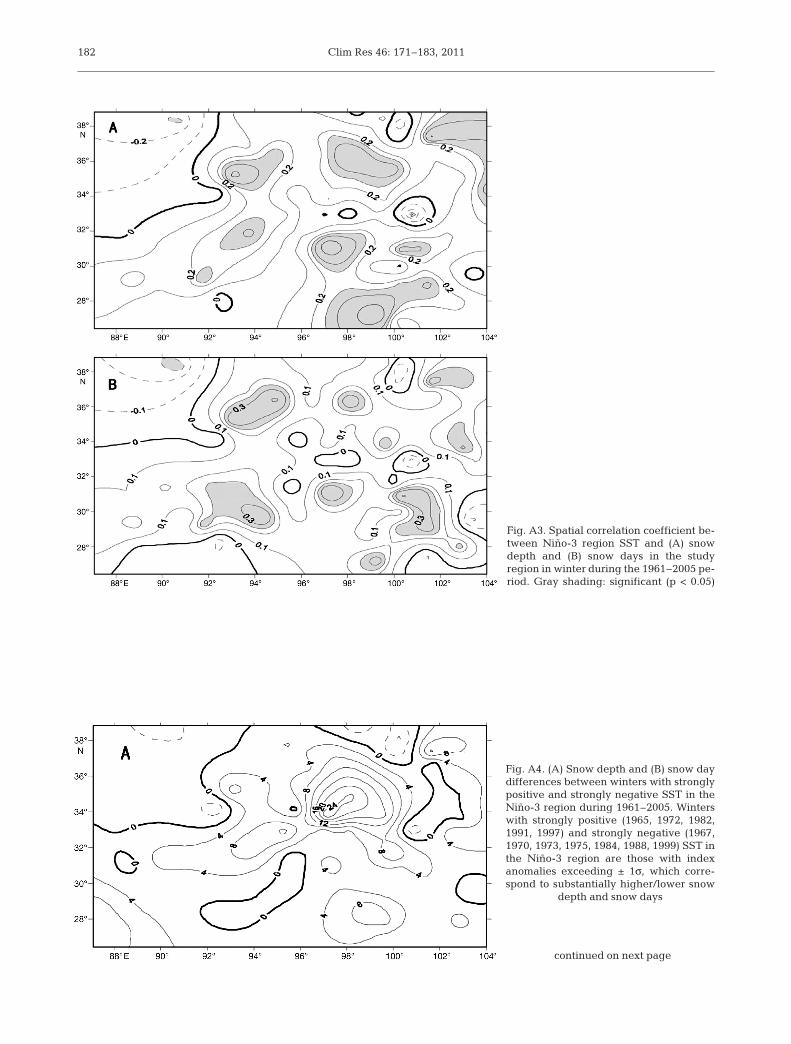
Fig. 9 shows the change of winter SST in the Niño-3region during 1961–2005, when SST varied greatly.We select strongly positive and strongly negativeNiño-3 region SST years during 1961–2005, which arethose with index anomalies exceeding ±1σ. Compos-ites of strongly positive (1965, 1972, 1982, 1991, 1997)and strongly negative (1967, 1970, 1973, 1975, 1984,1988, 1999) Niño-3 region SST years are analyzed. Fig.A3 shows the spatial correlation coefficient betweensnow depth and snow days in the study region andNiño-3 region SST in winter during 1961–2005. Bothsnow depth and snow days have positive correlationswith the Niño-3 region SST, meaning that higher(lower) Niño-3 region SST will result in more (less)snow depth and snow days in the TP.
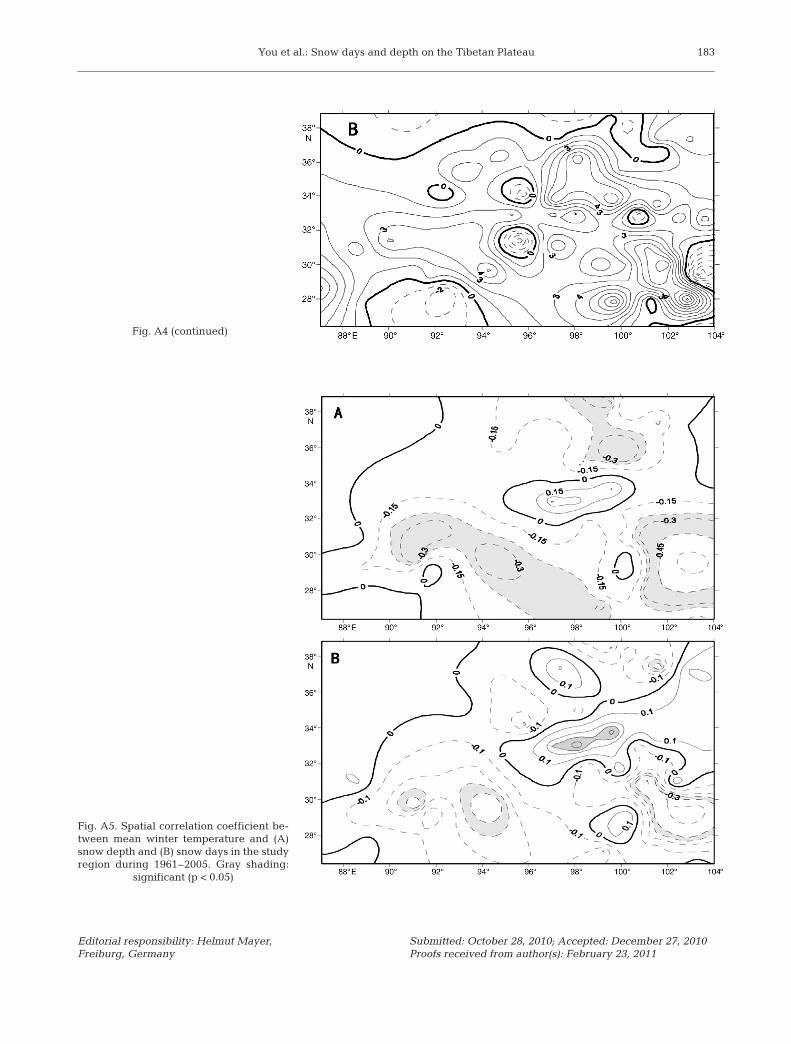
The differences of snow depth and snow days in theTP between winter with strongly positive and stronglynegative SST in the Niño-3 region during 1961–2005are shown in Fig. A4. Groisman et al. (1994) used asimilar approach to check the relationship betweensnow cover and ENSO in the Northern Hemisphere. Itis clear that strongly positive and strongly negativewinter Niño-3 region SST years correspond to a sub-stantially higher (lower) snow depth and number ofsnow days. This is confirmed by the correlation coeffi-cients between snow depth/cover and Niño-3 regionSST (Fig. A3). Yin et al. (2000) showed that the concur-rent ENSO events had a certain influence on tempera-ture in the TP. Snow cover tended to be higher (lower)than normal, and temperature tended to be lower(higher) than normal during the El Niño (La Niña)events. Note that the relationship between snow coverand temperature is more complex in the context ofglobal warming (Fig. A5).
To check the relationship between ENSO and snowdepth and duration, we show the mean difference(positive minus negative years) of geopotential height,wind field (m s–1) and zonal winds at 500hPa betweenhigh and low Niño-3 region SST years (Fig. 10), basedon composite maps for strongly positive minus stronglynegative winter Niño-3 region SST years. The differ-ences in geopotential height show negative values inthe extreme northeast of China, and positive values inmost other parts. This generates an anomalous north-westerly flow in northern China, preventing cold win-ter air masses from reaching the TP, and also produceswarmer and wetter flows from the ocean to the TP.
There is no consensus on the relationship betweenENSO and snow cover in the TP. Groisman et al. (1994)found that El Niño events are generally accompaniedby increased spring snow cover over northern hemi-sphere extratropical land areas during the first half ofthe hydrological year, while they are associated with a
176
Table 1. Correlation coefficients between the AO/NAO index,snow depth or snow days during 1961–2005 in the eastern
and central TP
Snow Snow NAO AO depth days index index
Snow depth 1Snow days 0.89 1NAO index 0.39 0.34 1AO index 0.40 0.36 0.80 1
Fig. 6. Relationship to AO anomaly for (A) snow depth and (B) snow days in winter in the eastern and central Tibetan Plateau during the 1961–2005 period

You et al.: Snow days and depth on the Tibetan Plateau
global retreat of snow cover extent in the second halfof the hydrological year (spring and summer). Shaman& Tziperman (2005) show TP snow and ENSO to berelated by Rossby wave activity, as winter SST anom-alies associated with ENSO produce stationary Rossbywaves, which modify winter storm activity and thusTP snowfall. Yuan et al. (2009) found that winter TP
snow cover is not related to the influences of ENSO,but has a significant positive correlation with theIndian Ocean Dipole (IOD). In the positive IOD years,negative geopotential height in the north of India isdeveloped, which supports more warm and humidsouthwesterlies from Bay of Bengal into TP where itenhances the snow cover.
177
Fig. 7. (A) Mean geopotential height, (B) wind field (m s–1) and (C) zonal wind (m s–1) differences between strongly positive andstrongly negative AO/NAO years during 1961–2005. Strongly positive and strongly negative AO/NAO years are the same as
for Fig. A2

Clim Res 46: 171–183, 2011
5. DISCUSSION AND CONCLUSIONS
We have examined observed winter snow depth andduration and their trends based on 69 surface stationswith elevations above 2000 m a.s.l. in the eastern andcentral TP during 1961–2005. On a regional scale, bothwinter snow depth and the number of snow days showgeneral increasing (decreasing) trends before (after)the late 1980s. The increasing trends until the late1980s were reported by previous researchers (Li 1996,Chen & Wu 2000, Qin et al. 2006), and appear to be incontradiction with the pronounced warming observedin the region (Zhang 2007, You et al. 2010a). Howeversnow cover and duration are not solely dependent ontemperature. Precipitation in the snow season isequally important. Previous studies (Li 1996, Chen &Wu 2000, Qin et al. 2006) show that >50% of the totalsnow cover variance can be explained by the linearvariations of snowfall and snow season temperature.Since 1980 there has been rapid warming, at a rate of
0.38° decade–1 in the TP (You et al.2008a). Consistent with this warmingtrend, the winter snow depth andduration have decreased since the1980s. This decreasing trend is likelyto continue in the future because of theprojected warming for the TP (IPCC2007) which may affect availability ofwater resources in the TP and its adja-cent regions.
The AO/NAO is the main mode ofclimate variability in the northernhemisphere in winter. The AO/NAOindex has significant positive correla-tions with winter snow depth and snowduration in the TP, which can beexplained by the vertical Rossby wavepropagation (Lü et al. 2008). When the
troposphere and stratosphere are actively coupled, thedownward propagation of Rossby waves (associatedwith the positive AO phase) modulates the tropo-spheric winter circulation causing abnormal snowdepth growth in the TP (Lü et al. 2008). Large atmo-spheric circulations have influenced the variation ofsnow cover in the TP. For example, Zhang et al. (2004)showed that after the mid-1970s, increased snow depthin the TP was concurrent with a deeper India-Burmatrough and an intensified subtropical westerly jet withenhanced ascending motion and more moisture supplyto the TP, which intensified the southerly moisture flowfrom the Bay of Bengal with additional humidity origi-nating from over the Indian Ocean (Zhang et al. 2004).
The winter SST in the Niño-3 region has positive cor-relation with snow depth and snow days in the easternand central TP, that is, higher (lower) Niño-3 regionSST leads to higher (lower) snow depth and snow days.But there is no consensus on the relationships. It is welldocumented that there was a climate shift in the north-ern hemisphere in the mid-1970s (Zhang et al. 2004,Duan &Wu 2008, Lü et al. 2008, You et al. 2010c). Thevariation in snow depth and snow days may be part ofthis shift and, if so, the shift would have affected the TPsnow cover, thus affecting temperature, precipitation,water vapor flux and so on. If interactions are 2-way,there are feedback processes which would encouragepersistence or breakdown. That is, more attentionshould be directed to the interaction between snowdepth and snow cover and AO/NAO as well as ENSO.It was not possible to investigate the respective influ-ences of AO/NAO and ENSO on winter snow depthand snow cover in the TP using observational data. Toinvestigate such feedback processes on hemisphericscale, numerical climate model experiments may be amore appropriate method to uncover the dynamics ofthis than a purely observational one.
178
45° N
40°
35°
30°
25°70°E 75° 80° 85° 90° 95° 100° 102° 104°
Fig. 8. Differences between mean water vapor fluxes in strongly positive and strongly negative AO/NAO years during 1961–2005
Fig. 9. Average winter SST in Niño-3 region, 1961–2005

You et al.: Snow days and depth on the Tibetan Plateau
Acknowledgements. This study is supported by the GlobalChange Research Program of China (2010CB951401), NationalNatural Science Foundation of China (40830743), ChineseAcademy of Sciences (KZCX2-YW-145), and European Com-mission (FP7-ENV-2007-1 Grant no. 212921). The authors thankthe National Climate Center, China Meteorological Administra-tion, for providing the snow depth and snow day data for thisstudy. Qinglong You is supported by the Alexander von Hum-boldt Foundation and the SSSTC project (EG76-032010). Weare very grateful to the three reviewers for their constructivecomments and thoughtful suggestions.
LITERATURE CITED
Bamzai AS (2003) Relationship between snow cover variabilityand Arctic oscillation index on a hierarchy of time scales. IntJ Climatol 23:131–142
Chang CP, Harr P, Ju JH (2001) Possible roles of Atlantic circu-lations on the weakening Indian monsoon rainfall–ENSOrelationship. J Clim 14:2376–2380
Chen LT, Wu RG (2000) Interannual and decadal variations ofsnow cover over Qinghai-Xizang Plateau and their relation-ships to summer monsoon rainfall in China. Adv Atmos Sci
179
Fig. 10. (A) mean geopotential height, (B) wind field (m s–1), and (C) 500 hPa zonal wind (m s–1) differences between winters withstrongly positive and strongly negative SST in the Niño-3 region during 1961–2005. Winters with strongly positive and strongly
negative SST in the Niño-3 region years are the same as for Fig. A4
Clim Res 46: 171–183, 2011
17:18–30Duan AM, Wu GX (2008) Weakening trend in the atmospheric
heat source over the Tibetan plateau during recent decades.I. Observations. J Clim 21:3149–3164
Groisman PY, Karl TR, Knight RW, Stenchikov GL (1994)Changes in snow cover, temperature and radiative heat bal-ance over the northern hemisphere. J Clim 7:1633–1656
Hurrell JW (1995) Decadal trends in the North Atlantic Oscilla-tion—regional temperatures and precipitation. Science269:676–679
Hurrell JW, Kushnir Y, Visbeck M (2001) Climate—the northAtlantic oscillation. Science 291:603–605
Hurrell JW, Visbeck M, Busalacchi A, Clarke RA and others(2006) Atlantic climate variability and predictability: A CLI-VAR perspective. J Clim 19:5100–5121
Hurrell JW, Deser C (2010) North Atlantic climate variability:the role of the North Atlantic Oscillation. J Mar Syst 78:28–41
Immerzeel WW, van Beek LPH, Bierkens MFP (2010) Climatechange will affect the Asian water towers. Science 328:1382–1385
IPCC (2007), Summary for policymakers. Climate change 2007:the physical science basis. Contribution of Working Group Ito the Fourth Assessment Report of the IntergovernmentalPanel on Climate Change. Cambridge University Press,Cambridge
Kalnay E, Kanamitsu M, Kistler R, Collins W and others (1996)The NCEP/NCAR 40-year reanalysis project. Bull AmMeteorol Soc 77:437–471
Kang S, Xu YW, You QL, Fluegel WA, Pepin N, Yao TD (2010)Review of climate and cryospheric change in the TibetanPlateau. Environ Res Lett 5:015101 doi: 10.1029/2002GL016341
Li PJ (1996) Response of Tibetan snow cover to global warming.Acta Geogr Sin 51:260–265 (in Chinese)
Li J, Wang J (2003) A modified zonal index and its physicalsense. Geophys Res Lett 30:1632. doi:10.1029/2003GL017441
Lü JM, Ju JH, Kim SJ, Ren JZ, Zhu YX (2008) Arctic Oscillationand the autumn/winter snow depth over the TibetanPlateau. J Geophys Res 113:D14117 doi:1029/2007JD009567
Osborn TJ (2004) Simulating the winter North Atlantic Oscilla-tion: the roles of internal variability and greenhouse gasforcing. Clim Dyn 22:605–623
Osborn TJ (2006) Recent variations in the winter North AtlanticOscillation. Weather 61:353–355
Pu ZX, Xu L (2009) MODIS/Terra observed snow cover over theTibet Plateau: distribution, variation and possible connec-tion with the East Asian Summer Monsoon (EASM). TheorAppl Climatol 97:265–278
Qin DH, Liu SY, Li PJ (2006) Snow cover distribution, variabil-ity, and response to climate change in western China. J Clim19:1820–1833
Saito K, Cohen J (2003) The potential role of snow cover in forc-ing interannual variability of the major Northern Hemi-sphere mode. Geophys Res Lett 30:1302 doi:10.1029/2002GL016341
Sen PK (1968) Estimates of regression coefficient based onKendall’s tau. J Am Stat Assoc 63:1379–1389
Shaman J, Tziperman E (2005) The effect of ENSO on Tibetanplateau snow depth: a stationary wave teleconnectionmechanism and implications for the south Asian monsoons.
J Clim 18:2067–2079Thompson DWJ, Wallace JM (1998) The Arctic Oscillation sig-
nature in the wintertime geopotential height and tempera-ture fields. Geophys Res Lett 25:1297–1300
Thompson DWJ, Wallace JM (2001) Regional climate impacts ofthe Northern Hemisphere annular mode. Science 293:85–89
Visbeck MH, Hurrell JW, Lorenzo P, Cullen HM (2001) TheNorth Atlantic Oscillation: past, present, and future. ProcNat Acad Sci 98:12876–12877
Wallace JM (2000) North Atlantic Oscillation/annular mode:two paradigms—one phenomenon. QJR Meteorol Soc 126:791–805
Xu XD, Lu CG, Shi XH, Gao ST (2008) World water tower: anatmospheric perspective. Geophys Res Lett 35:L20815 doi:10.1029/2008GL035867
Yanai M, Li CF (1994) Mechanism of heating and the boundarylayer over the Tibetan Plateau. Mon Weather Rev 122:305–323
Yeh TC, Gao YX (1979) Meteorology of the Qinghai-Xizang(Tibet) Plateau (in Chinese). Science Press, Beijing
Yin ZY, Lin ZY, Zhao XY (2000) Temperature anomalies in cen-tral and eastern Tibetan Plateau in relation to general circ-ulation patterns during 1951–1993. Int J Climatol 20:1431–1449
You QL, Kang SC, Aguilar E, Yan YP (2008a), Changes in dailyclimate extremes in the eastern and central Tibetan Plateauduring 1961–2005. J Geophys Res 113:D07101, doi:10.1029/2007JD009389
You QL, Kang SC, Pepin N, Yan YP (2008b) Relationshipbetween trends in temperature extremes and elevation inthe eastern and central Tibetan Plateau, 1961–2005. Geo-phys Res Lett 35 L04704 doi:10.1029/2007GL032669
You QL, Kang SC, Pepin N, Fluegel WA, Sanchez-Lorenzo A,Yan YP, Zhang YJ (2010a) Climate warming and associatedchanges in atmospheric circulation in the eastern and cen-tral Tibetan Plateau from a homogenized dataset. GlobalPlanet Change 72:11–24
You QL, Kang SC, Pepin N, Fluegel WA, Yan YP, Behrawan H,Huang J (2010b) Relationship between temperature trendmagnitude, elevation and mean temperature in the TibetanPlateau from homogenized surface stations and reanalysisdata. Global Planet Change 71:124–133
You QL, Kang SC, Fluegel WA, Pepin N, Yan YP, Huang J(2010c) Decreasing wind speed and weakening latitudinalsurface pressure gradients in the Tibetan Plateau. Clim Res42:57–64
Yu RC, Zhou TJ (2004) Impacts of winter-NAO on March cool-ing trends over subtropical Eurasia continent in the recenthalf century. Geophys Res Lett 31:L12204 doi:10.1029/2004GL019814
Yuan CX, Tozuka T, Miyasaka T, Yamagata T (2009) Respectiveinfluences of IOD and ENSO on the Tibetan snow cover inearly winter. Clim Dyn 33:509–520
Zhang YS, Li T, Wang B (2004) Decadal change of the springsnow depth over the Tibetan Plateau: the associated circula-tion and influence on the East Asian summer monsoon.J Clim 17:2780–2793
Zhang TJ (2007) Perspectives on environmental study ofresponse to climatic and land cover/land use change overthe Qinghai-Tibetan plateau: an introduction. Arct AntarctAlp Res 39:631–634
180
You et al.: Snow days and depth on the Tibetan Plateau 181
Fig. A1. Spatial correlation coefficient be-tween the AO index and (A) snow depthand (B) snow days in winter in the easternand central Tibetan Plateau during the1961–2005 period. Gray shading: significant
(p < 0.05)
Appendix
Fig. A2. (A) Snow depth and (B) snow daydifferences between years with stronglypositive and strongly negative AO/NAOduring 1961–2005. Strongly positive (1982,1988, 1989, 1991, 1994) and stronglynegative (1962, 1964, 1968, 1976, 1978)AO/NAO years are those with index anom-alies exceeding ± 1σ, which correspondto substantially higher/lower snow depths
Clim Res 46: 171–183, 2011182
Fig. A3. Spatial correlation coefficient be-tween Niño-3 region SST and (A) snowdepth and (B) snow days in the studyregion in winter during the 1961–2005 pe-riod. Gray shading: significant (p < 0.05)
Fig. A4. (A) Snow depth and (B) snow daydifferences between winters with stronglypositive and strongly negative SST in theNiño-3 region during 1961–2005. Winterswith strongly positive (1965, 1972, 1982,1991, 1997) and strongly negative (1967,1970, 1973, 1975, 1984, 1988, 1999) SST inthe Niño-3 region are those with indexanomalies exceeding ± 1σ, which corre-spond to substantially higher/lower snow
depth and snow days
continued on next page
You et al.: Snow days and depth on the Tibetan Plateau 183
Fig. A5. Spatial correlation coefficient be-tween mean winter temperature and (A)snow depth and (B) snow days in the studyregion during 1961–2005. Gray shading:
significant (p < 0.05)
Fig. A4 (continued)
Editorial responsibility: Helmut Mayer, Freiburg, Germany
Submitted: October 28, 2010; Accepted: December 27, 2010Proofs received from author(s): February 23, 2011