Embed Size (px)
Citation preview
HYDRAULICS BRANCH
J. Fluid Mech. (1970), vol. 41, part 4, pp. 727-736 OFFICIAL FILE COPY
Printed in Great Britain
,:. Observations of unsteady flow arising after vortex breakdown
By JOHN J. CASSIDY University of Missouri, Columbia, Missouri
AND HENRY T. FALVEY U.S. Bureau of Reclamation, Denver, Colorado
(Received 11 July 1969)
In rotating flow moving axially through a straight tube, a helical vortex will be generated if the angular momentum flux is sufficiently large relative to the flux of linear momentum. This paper describes an experimental study of the occur-rence, frequency and peak-to-peak amplitude of the wall pressure generated by this vortex. The experimental results are displayed in dimensionless form in terms of a Reynolds number, a momentum parameter and tube geometry.
Introduction
In recent years considerable attention has been focused on the transformation in flow pattern which can occur in a swirling flow. A swirling flow is defined as one undergoing simultaneous axial and vortex motions. The vortex is said to be `broken down' when reverse flow occurs along the axis. Squire (1960) studied this occurrence analytically and deduced that breakdown would occur when the local swirl angle (tan-' v/w) exceeds 52.5°. In the swirl ratio w and v are the local axial and transverse velocity components. Harvey (1962) obtained experi-mental results agreeing with Squire's analysis. Benjamin (1962, 1967) deduced that the breakdown was in actuality a transformation to a conjugate flow pattern capable of sustaining an axisymmetric standing wave. Fraenkel (1967) and Scheer (1968) have enlarged upon Benjamin's analysis.
As long as the Reynolds number is very low the flow appears to remain steady after the transition. However, as the Reynolds number is increased, the alternate flow pattern takes the form of a helical vortex precessing about the tube centre-line. This unsteady state of flow has been witnessed in the breakdown of the vortex formed by flow over a delta-wing airplane and since much earlier times in the flow through turbine draft tubes. Batchelor (1967) refers to this pheno-menon as `bursting' of the vortex.
Chanaud (1965) studied both the steady and unsteady aspects of conjugate rotating flows experimentally and outlined, on a graph of swirl ratio versus Reynolds number, regions in which the particular patterns of flow would occur.
In this study observations and measurements were made on the unsteady vortex flow developing at high axial Reynolds numbers in straight tubes.
Al ~Ow
Motor driven~ cone valve —_ ~
Orifice for discharge measurement From
blower ~ Flow ~--
Swirl
ft. ID+-- —
728 J. J. Cassidy and H. T. Falvey
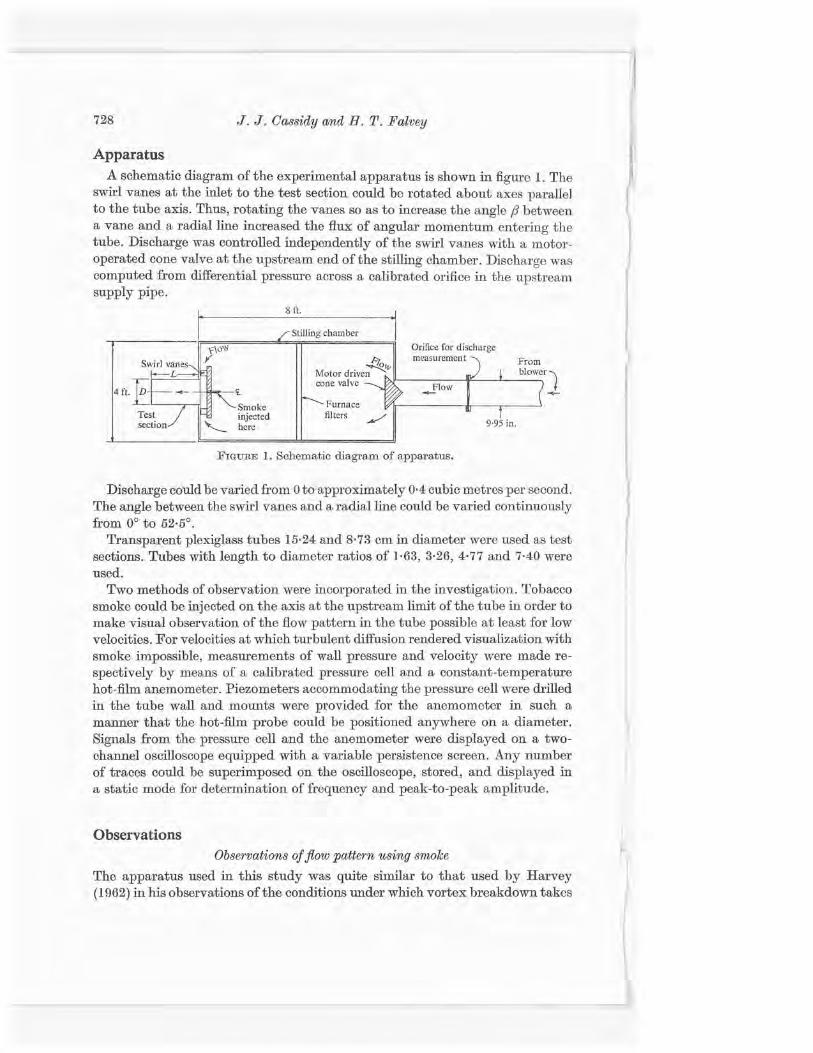
Apparatus A schematic diagram of the experimental apparatus is shown in figure 1. The
swirl vanes at the inlet to the test section could be rotated about axes parallel to the tube axis. Thus, rotating the vanes so as to increase the angle Q between a vane and a radial line increased the flux of angular momentum entering the tube. Discharge was controlled independently of the swirl vanes with a motor-operated cone valve at the upstream end of the stilling chamber. Discharge was computed from differential pressure across a calibrated orifice in the upstream supply pipe.
8 ft.
Stilling chamber
"'- Smoke Furnace Test injected filters section ~ here in.
FIGURE 1. Schematic diagram of apparatus.
Discharge could be varied from 0 to approximately 0.4 cubic metres per second. The angle between the swirl vanes and a radial line could be varied continuously from 0° to 52.5°.
Transparent plexiglass tubes 15.24 and 8.73 cm in diameter were used as test sections. Tubes with length to diameter ratios of 1.63, 3.26, 4.77 and 7.40 were used.
Two methods of observation were incorporated in the investigation. Tobacco smoke could be injected on the axis at the upstream limit of the tube in order to make visual observation of the flow pattern in the tube possible at least for low velocities. For velocities at which turbulent diffusion rendered visualization with smoke impossible, measurements of wall pressure and velocity were made re-spectively by means of a calibrated pressure cell and a constant-temperature hot-film anemometer. Piezometers accommodating the pressure cell were drilled in the tube wall and mounts were provided for the anemometer in such a manner that the hot-film probe could be positioned anywhere on a diameter. Signals from the pressure cell and the anemometer were displayed on a two-channel oscilloscope equipped with a variable persistence screen. Any number of traces could be superimposed on the oscilloscope, stored, and displayed in a static mode for determination of frequency and peak-to-peak amplitude.
Observations Observations of flow pattern using smoke
The apparatus used in this study was quite similar to that used by Harvey (1962) in his observations of the conditions under which vortex breakdown takes
Unsteady flow arising after vortex breakdown 729
place. Hence, the manner of visual observation utilized was also quite similar in the two studies.
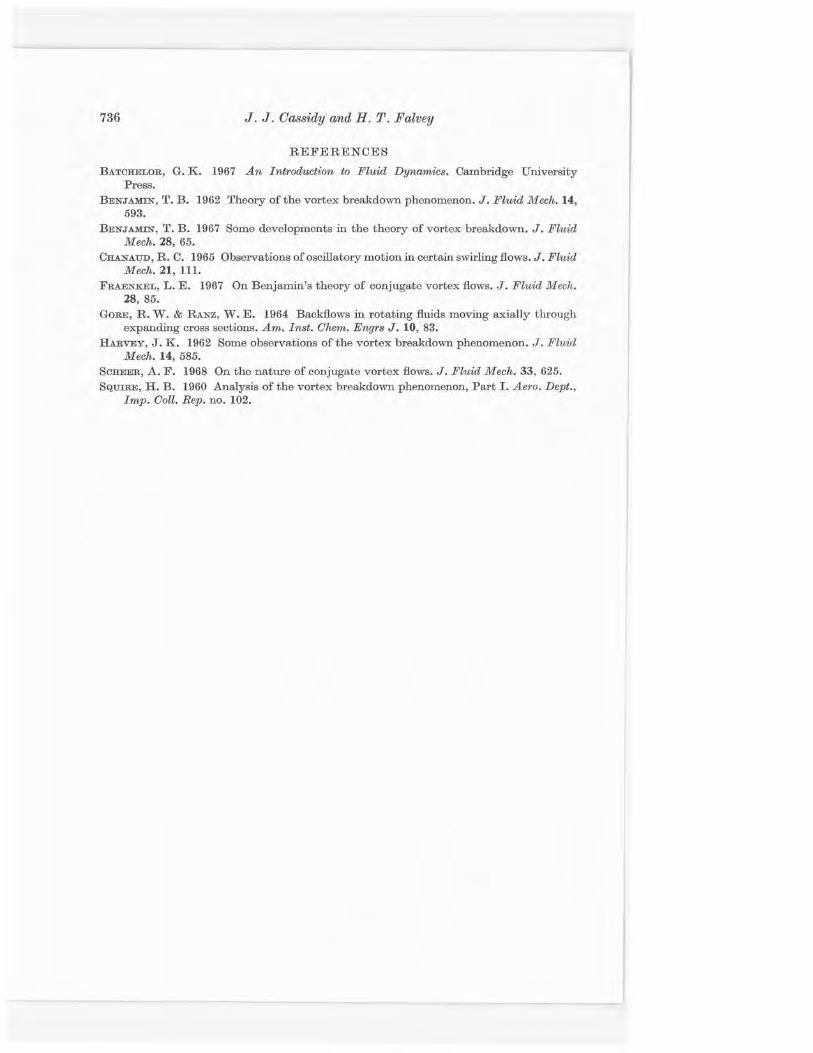
A flow rate through the tube was established and smoke was introduced on the tube centreline at the upstream limit. As the swirl vanes were adjusted to produce a greater flux of angular momentum, the flow pattern was seen to change drastically. With only a low angular-momentum flux, steady swirling flow was observed as shown in figure 2, plate 1. Eventually as the angular momentum flux was increased, the discharge being held constant, a flow reversal was ob-served to occur in the jet downstream from the tube exit. Further increase in the angular momentum flux forced the reversed-flow beginning upstream into the tube just as was observed by Harvey (1962).
Figure 3, plate 1, shows the point of breakdown at approximately the up-stream quarter point of the tube. Upstream of the point of breakdown flow is steady and swirling. Downstream from the breakdown the flow is seen to have developed an unsteady helical vortex. The helical vortex precesses about the tube centreline in the same direction as the rotation imparted by the swirl vanes.
Further increase of the angular momentum flux moved the breakdown point to the upstream limit of the tube and produced a precessing helical vortex throughout the tube as is shown in figure 4, plate 1.
Straight tubes of constant diameter all produced similar flow patterns. Flow downstream from the breakdown point always produced a precessing helical vortex. In no case could the flow be forced to remain steady downstream from the breakdown point without decreasing the tube diameter at the downstream end.
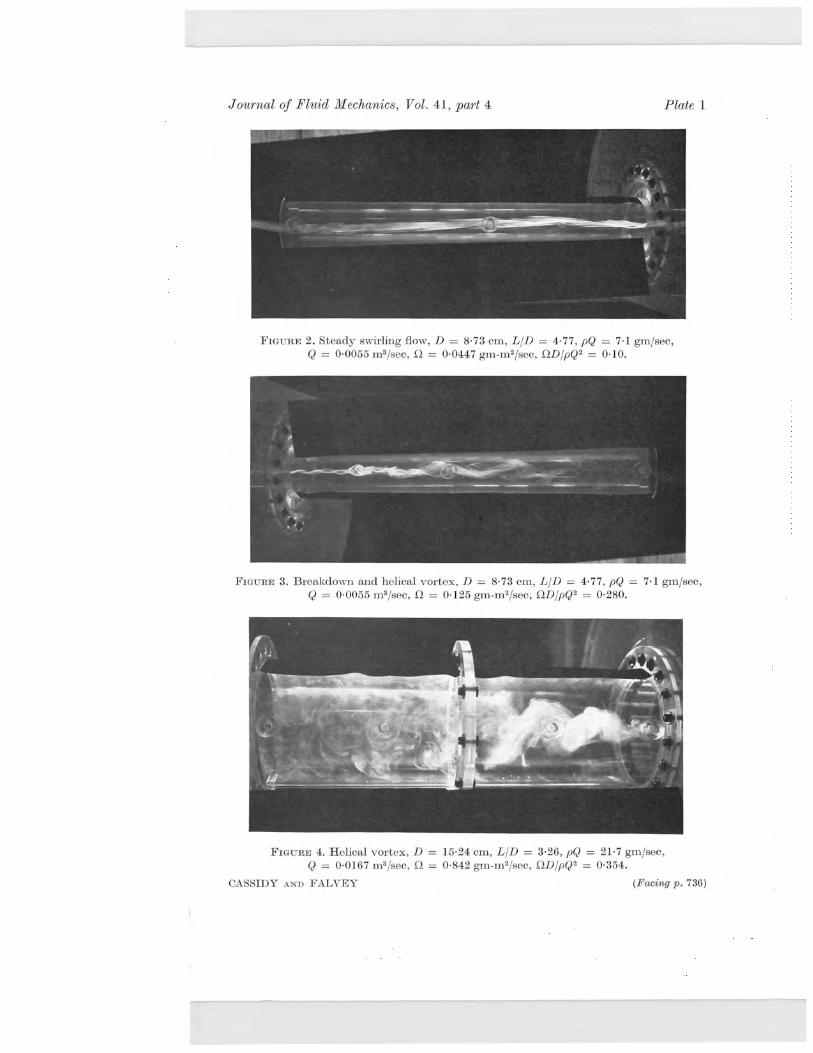
Flow in a jet (tube length L = 0) was also observed. Breakdown was first observed downstream from the opening. Increasing the angular momentum flux in the jet served to move the breakdown point upstream producing the precessing helical vortex shown in figure 5, plate 2.
At all these low velocities the breakdown was quite sensitive to any disturbance and would move upstream rapidly if any type of probe were placed in the flow. This sensitivity has also been noted by previous investigators.
Observations of unsteady pressure and velocity
At velocities above approximately 6 feet per second turbulent diffusion made visualization of the flow pattern impossible. Observations of breakdown at axial Reynolds numbers WD/v greater than 10,000 (W is the average axial velocity, D is the tube diameter and v is the fluid viscosity) were made by positioning a cylindrical, constant-temperature, hot-film probe at the tube axis. A flow rate was established and the signal from the anemometer was observed as the angular momentum flux was gradually increased. With increase of the angular momentum flux the centreline-velocity decreased, reached a minimum, and then increased (the hot-film probe was not directionally sensitive). The breakdown, or reversal in flow, was assumed to have taken place at the swirl-gate setting which produced the minimum centreline-velocity.
Once unsteady flow occurred measurements of mean velocity or pressure within the tube could no longer be made because of the time-wise directional
730 J. J. Cassidy and H. T. Falvey
change in local velocities produced by the'precessing helical vortex. The fre-quency and peak-to-peak values of the wall pressure near the tube exit were observed by displaying the amplified pressure-cell signal on the oscilloscope. In order to verify that the unsteady pressure was indeed produced by a pre-cessing helical vortex such as was observed with smoke at lower axial Reynolds numbers, the hot-film probe was positioned inside the tube near the piezometer at which the pressure was being observed. Signals from the hot-film anemometer and the pressure cell were displayed simultaneously on the oscilloscope. Figure 6, plate 2, shows the simultaneous traces obtained for one unsteady condition. The velocity and pressure are seen to have the same frequency. A slight phase difference existed because pressure and velocity were not measured at exactly the same point.
The sensitivity of the flow pattern to disturbances observed at low velocities did not seem to exist at the high velocities at which velocity and pressure measurements were made. Positioning the j inch diameter hot-film probe en-tirely across the diameter of the tube did not cause a measurable difference in either the frequency or magnitude of the unsteady wall pressure. However, the frequency of the unsteady pressure was substantially increased when the exit was partially blocked with a flat plate.
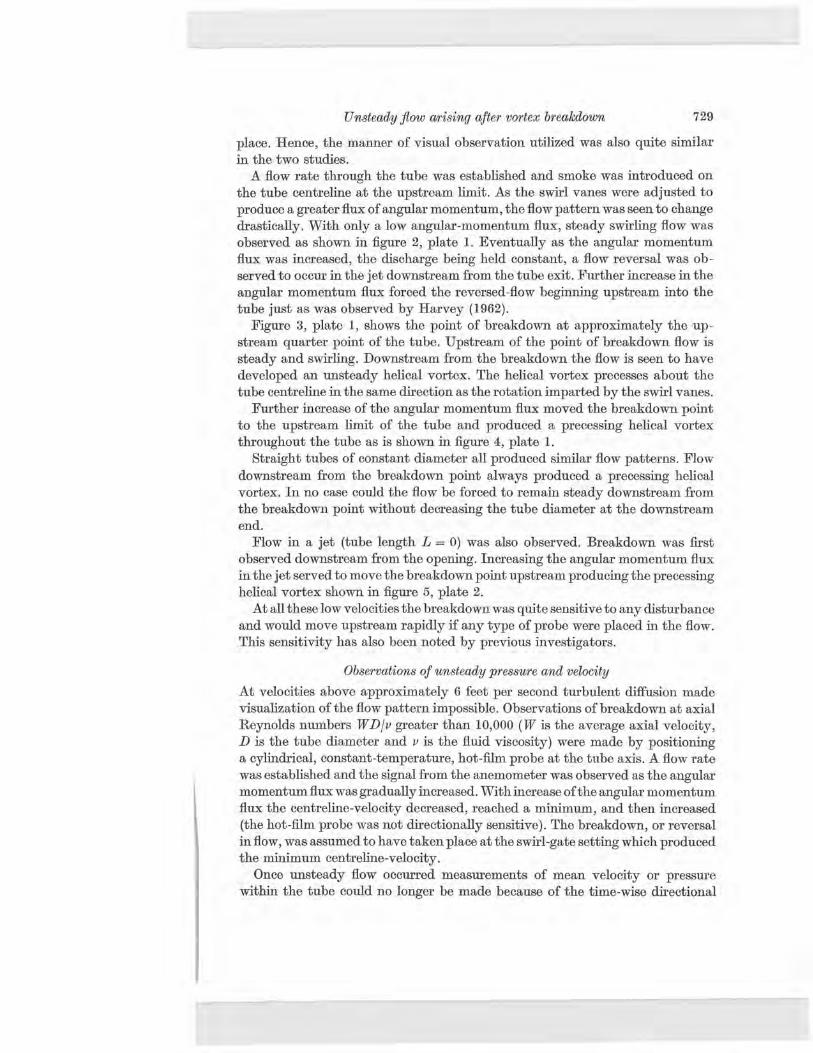
Analysis of the results Unsteady pressures
Vortex breakdown was correlated with flow variables in terms of the local swirl angle by Squire (1960) and Harvey (1962). Because the unsteady aspects of flow were of primary interest in this study the local swirl angle of the flow could not be used. Once the helical vortex existed throughout the tube, no quantitative measurements could be made within. Thus, it was necessary to develop a gross parameter descriptive of the relative rotational and axial characteristics of the flow for use in correlating the experimental results.
L I
r-
FIGURE 7. Co-ordinate system and control volume.
The desired parameters were formulated through consideration of the mo-mentum equation (for a fluid of zero viscosity) for an axis oriented parallel to the mean flow (see figure 7).
8v 8v 1 v 8v 8v uv _ 8p rPat +rP(uOr+ r eB +rw 8z + r) 8B' (1)
Unsteady flow arising after vortex breakdown 731
Integration of (1) over an arbitrary control volume, incorporation of the continuity equation, and use of Gauss's theorem yields
fV dJ rpvdV+f prvl urn+vr~© +win I ds+~ puvdV = —~-dV. (2) VS \ 1 V
Choosing the control volume V as the tube of length L and diameter D shown in figure 7
rmakes it possible to modify (2) to r
r d J rpvdV— J prvwds+
J prvwds+
J pr
rv dV = — f" J PdV. (3) v sl sz v v WO
The second integral in (3) is the flux of angular momentum into the tube. Since this integral was an independent variable in this study, it was given the symbol Q and used as a reference quantity. Forming dimensionless quantities from all variables transforms/(3) to
r r l (pQ~
2\ (fD Q3)df rvdV—l+l ~2 I {
J a7wvds+~
VuvdV} _ —(_~O
1D3) f V aedV
,
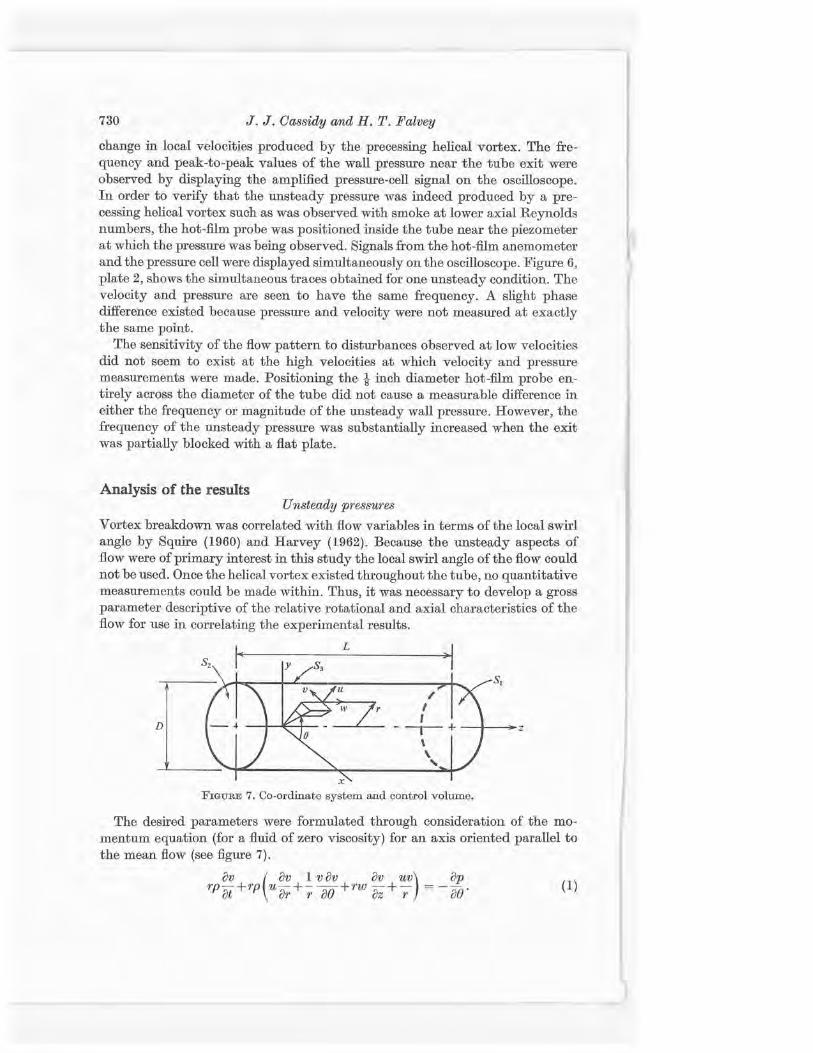
where JQ is the volume rate of \ flow/ and f is frequency. 1J1 The dimensionless parameters fD3/Q, PO D3/Q, QD/pQ2, along with the relative
tube length LID, were then utilized to correlate the experimental data on fre-quency and pressure. Figure 8, a plot of fD3/Q versus the average-velocity Reynolds number, shows that frequency of the flow is indeed essentially inde-pendent of viscosity for large Reynolds numbers but tends to become constant for a particular value of QD/pQ2.
1.6
1.4
1.2
C~ m Q
1.0
0.8
0.6
1.00
0.92
Q 0.77 q al
x x 0.69
0 58
0 0.2 0.4 0.6 0.8 1.0 1.2 1.4 1.6 1.8
R x 10-5
FIGURE 8. Frequency parameter as a function of Reynolds number for straight tubes.
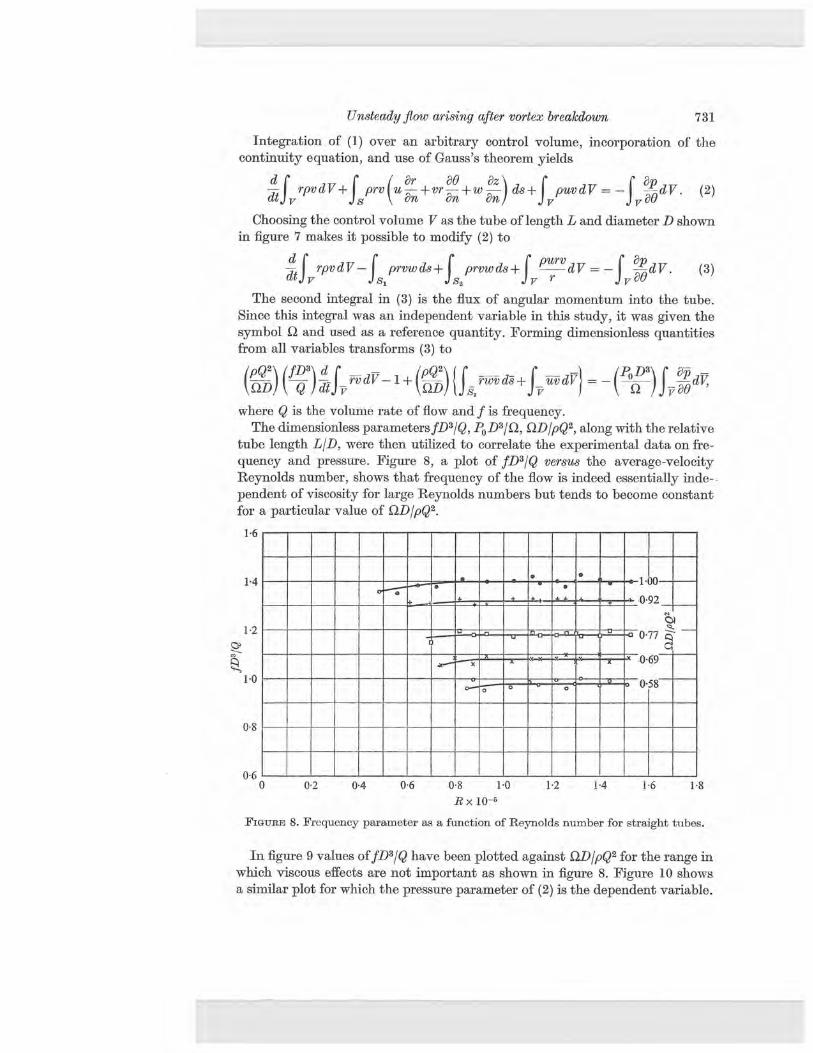
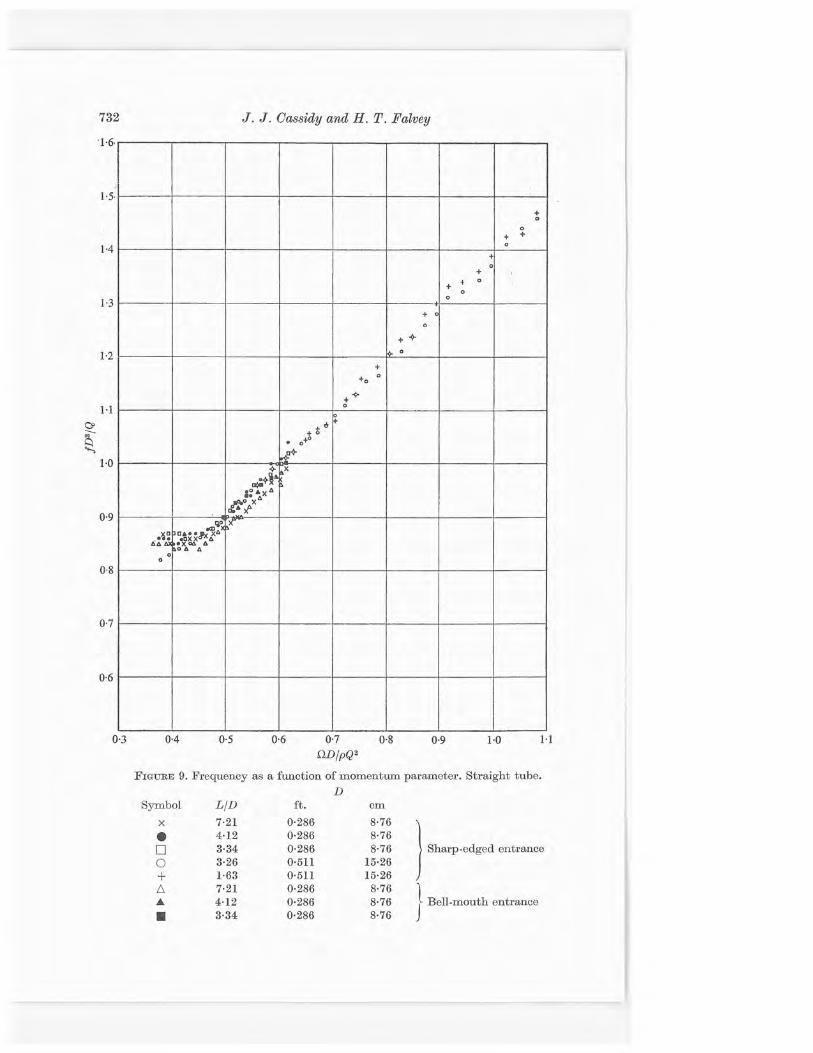
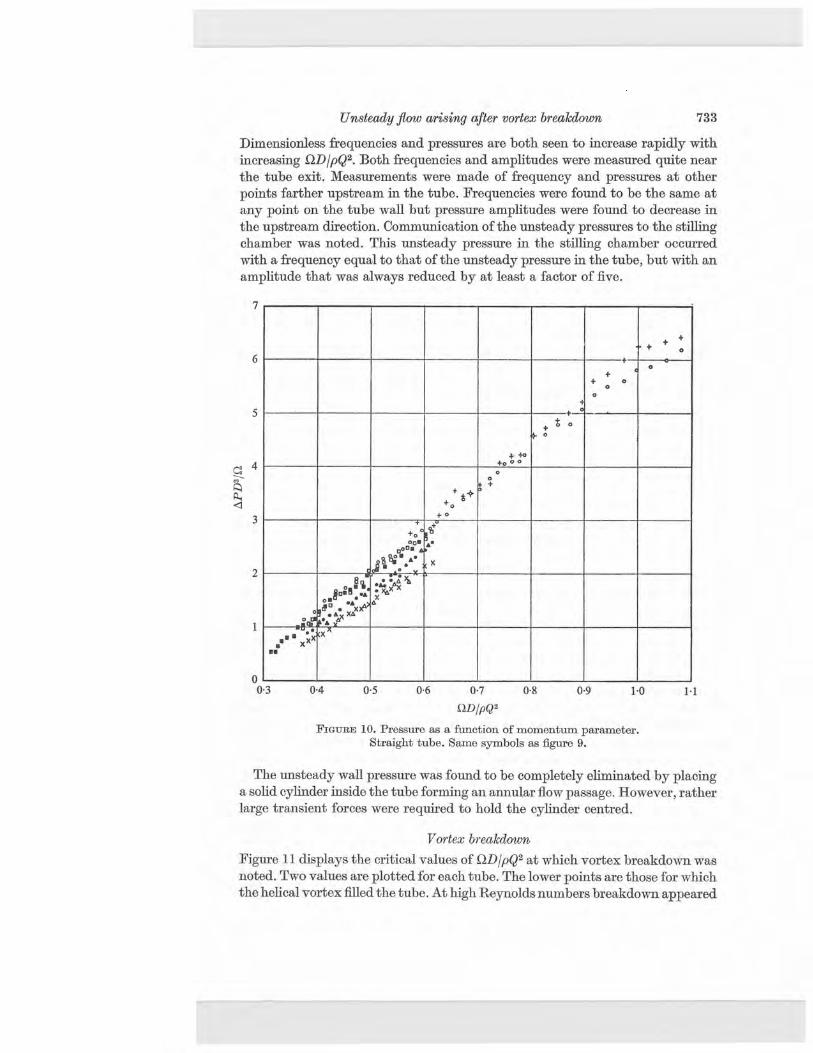
In figure 9 values of fD31Q have been plotted against QD/pQ2 for the range in which viscous effects are not important as shown in figure 8. Figure 10 shows a similar plot for which the pressure parameter of (2) is the dependent variable.
1.6-
1.5
1.4
1.3
1.2
0.9
0.8
0.7
0.6
732 J. J. Cassidy and H. T. Falvey
° 0
+ + 0
+ ° i ° 0
0
0
0
+, °
0
+ t d
o
+°
qq~ x
io AxA
° x ~s XA qo
.: :ox xNo A AA 0
0
-Y& AA
o
0.3 0.4 0.5 0.6 0.7 0.8 0.9 1.0 1.1
QD/pQ2
FIGURE 9. Frequency as a function of momentum parameter. Straight tube. D
Symbol LID ft. cm
x 7.21 0.286 8.76 ® 4.12 0.286 8.76 ❑ 3.34 0.286 8.76 Q 3.26 0.511 15.26 + 1.63 0.511 15.26 0 7.21 0.286 8.76 s 4.12 0.286 8.76 ■ 3.34 0.286 8.76
Sharp-edged entrance
J
Bell-mouth entrance
Unsteady flow arising after vortex breakdown 733
Dimensionless frequencies and pressures are both seen to increase rapidly with increasing QDIpQ2. Both frequencies and amplitudes were measured quite near the tube exit. Measurements were made of frequency and pressures at other points farther upstream in the tube. Frequencies were found to be the same at any point on the tube wall but pressure amplitudes were found to decrease in the upstream direction. Communication of the unsteady pressures to the stilling chamber was noted. This unsteady pressure in the stilling chamber occurred with a frequency equal to that of the unsteady pressure in the tube, but with an amplitude that was always reduced by at least a factor of five.
0 +
+ 0 0
0
+ t 0
0
+ +0
+~¢
0
+, +o
+0 .: ■ A.
.yy
x
8
8o:e' q ~4 O 'L
• &X~x
~ ■ .: a d x)P o
o . A.X .'
■■ ■ XX r x
■
X
0.4 0.5 0.6 0.7 0.8 0.9 1.0 1.1
d2D/pQ2
FIGURE 10. Pressure as a function of momentum parameter. Straight tube. Same symbols as figure 9.
The unsteady wall pressure was found to be completely eliminated by placing a solid cylinder inside the tube forming an annular flow passage. However, rather large transient forces were required to hold the cylinder centred.
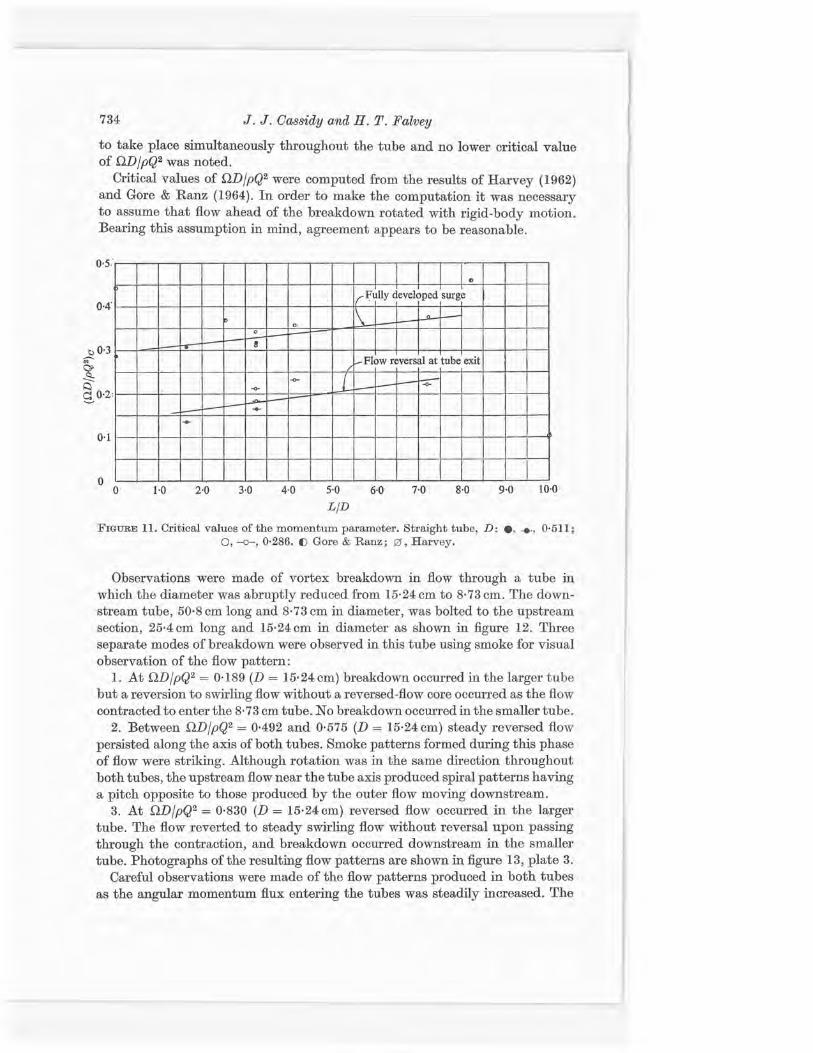
Vortex breakdown
Figure 11 displays the critical values of QDIpQ2 at which vortex breakdown was noted. Two values are plotted for each tube. The lower points are those for which the helical vortex filled the tube. At high Reynolds numbers breakdown appeared
4
Q
4
0 0.3
734 J. J. Cassidy and H. T. Falvey
to take place simultaneously throughout the tube and no lower critical value of QDIpQ2 was noted.
Critical values of QD/pQ2 were computed from the results of Harvey (1962) and Gore & Ranz (1964). In order to make the computation it was necessary to assume that flow ahead of the breakdown rotated with rigid-body motion. Bearing this assumption in mind, agreement appears to be reasonable.
0.5•
0.4' Fully
U 0.3 f I I I I I I I I I I l_ Flow reversal at tube exit I I I I
Q b.
a 0.2
0.1
1.0 2.0 3.0 4.0 5.0 6.0 7.0 8.0 9.0 10.0 LID
FIGURE 11. Critical values of the momentum parameter. Straight tube, D: •, -e-, 0.511; O, -o-, 0.286. C Gore & Ranz ; 0, Harvey.
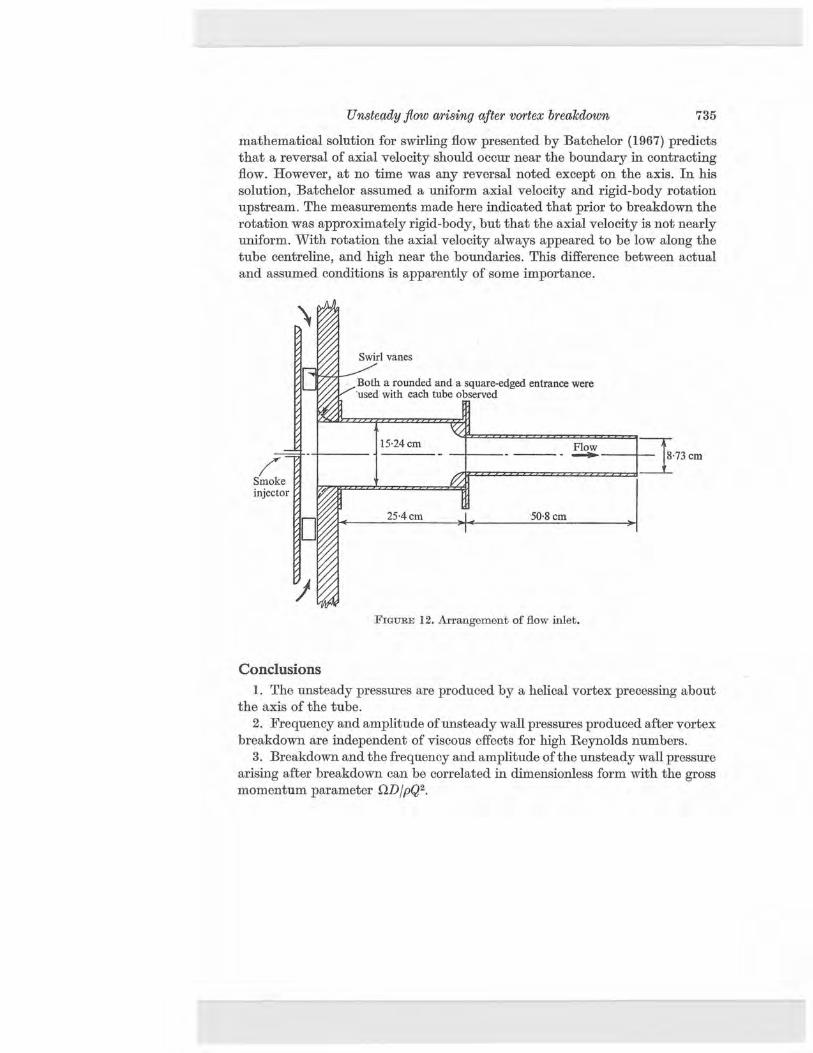
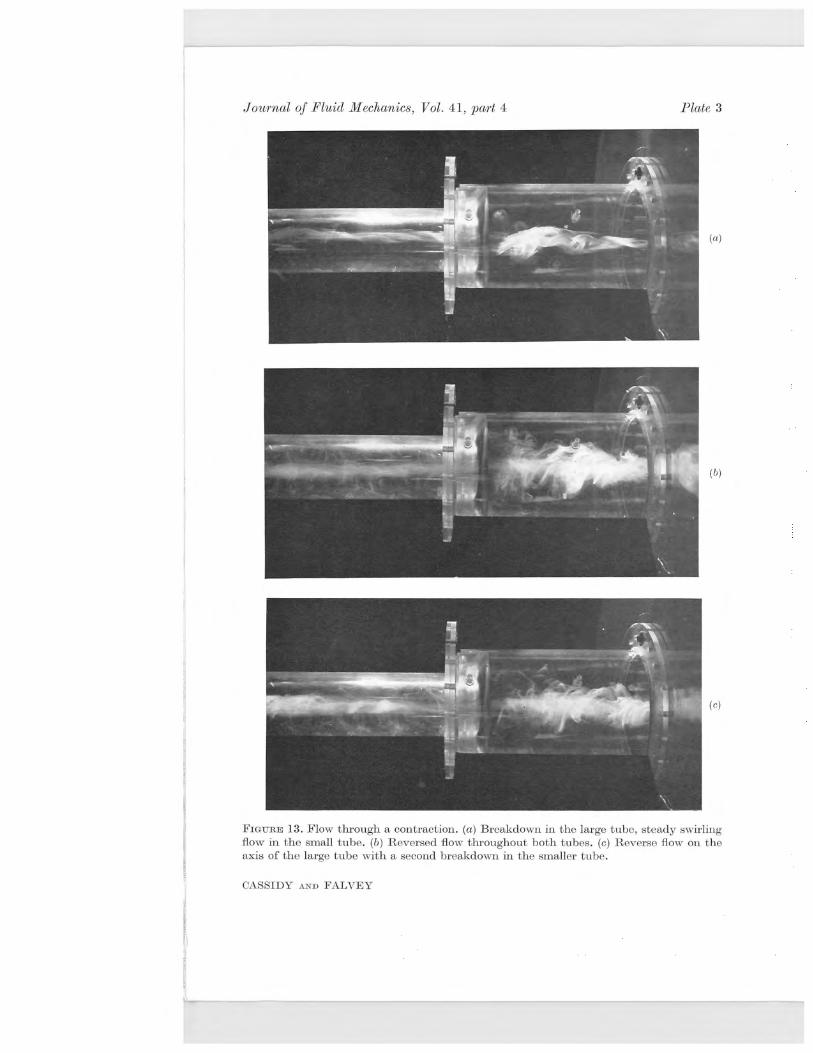
Observations were made of vortex breakdown in flow through a tube in which the diameter was abruptly reduced from 15.24 cm to 8.73 cm. The down-stream tube, 50.8 cm long and 8.73 cm in diameter, was bolted to the upstream section, 25.4 cm long and 15.24 cm in diameter as shown in figure 12. Three separate modes of breakdown were observed in this tube using smoke for visual observation of the flow pattern:
1. At QDIpQ2 = 0.189 (D = 15.24 cm) breakdown occurred in the larger tube but a reversion to swirling flow without a reversed-flow core occurred as the flow contracted to enter the 8.73 cm tube. No breakdown occurred in the smaller tube.
2. Between QDIpQ2 = 0.492 and 0.575 (D = 15.24 cm) steady reversed flow persisted along the axis of both tubes. Smoke patterns formed during this phase of flow were striking. Although rotation was in the same direction throughout both tubes, the upstream flow near the tube axis produced spiral patterns having a pitch opposite to those produced by the outer flow moving downstream.
3. At QDIpQ2 = 0.830 (D = 15.24 cm) reversed flow occurred in the larger tube. The flow reverted to steady swirling flow without reversal upon passing through the contraction, and breakdown occurred downstream in the smaller tube. Photographs of the resulting flow patterns are shown in figure 13, plate 3.
Careful observations were made of the flow patterns produced in both tubes as the angular momentum flux entering the tubes was steadily increased. The
Unsteady flow arising after vortex breakdown 735
mathematical solution for swirling flow presented by Batchelor (1967) predicts that a reversal of axial velocity should occur near the boundary in contracting flow. However, at no time was any reversal noted except on the axis. In his solution, Batchelor assumed a uniform axial velocity and rigid-body rotation upstream. The measurements made here indicated that prior to breakdown the rotation was approximately rigid-body, but that the axial velocity is not nearly uniform. With rotation the axial velocity always appeared to be low along the tube centreline, and high near the boundaries. This difference between actual and assumed conditions is apparently of some importance.
Swirl vanes
Both a rounded and a square-edged entrance were used with each tube observed
15.24 cm Flow —~ 8.73 cm
Smoke injector
25.4 cm . I _ 50.8 cm
Fiaux,E 12. Arrangement of flow inlet.
Conclusions 1. The unsteady pressures are produced by a helical vortex precessing about
the axis of the tube. 2. Frequency and amplitude of unsteady wall pressures produced after vortex
breakdown are independent of viscous effects for high Reynolds numbers. 3. Breakdown and the frequency and amplitude of the unsteady wall pressure
arising after breakdown can be correlated in dimensionless form with the gross momentum parameter QDIpQ2.
736 J. J. Cassidy and H. T. Falvey
REFERENCES
BATCHELOR, G. K. 1967 An Introduction to Fluid Dynamics. Cambridge University Press.
BENJAMIN, T. B. 1962 Theory of the vortex breakdown phenomenon. J. Fluid Mech. 14, 593.
BENJAIN, T. B. 1967 Some developments in the theory of vortex breakdown. J. Fluid Mech. 28, 65.
CHANAUD, R. C. 1965 Observations of oscillatory motion in certain swirling flows. J. Fluid Mech. 21, 111.
FRAENgEL, L. E. 1967 On Benjamin's theory of conjugate vortex flows. J. Fluid Mech. 28, 85.
GORE, R. W. & RANZ, W. E. 1964 Backflows in rotating fluids moving axially through expanding cross sections. Am. Inst. Chem. Engrs J. 10, 83.
HAR.vEY, J. K. 1962 Some observations of the vortex breakdown phenomenon. J. Fluid Mech. 14, 585.
SCHEER, A. F. 1968 On the nature of conjugate vortex flows. J. Fluid Mech. 33, 625. SQuiRE, H. B. 1960 Analysis of the vortex breakdown phenomenon, Part I. Aero. Dept.,
Imp. Coll. Rep. no. 102.
Journal of Fluid Mechanics, Vol. 41, part 4 Plate 1
FIGURE 2. Steady swirling flow, D = 8.73 cm, LID = 4.77, pQ = 7.1 gm/sec, Q = 0.0055 ms/sec, Q = 0.0447 gm-m2/sec, S2D/pQ2 = 0.10.
FIGURE 3. Breakdown and helical vortex, D = 8.73 cm, LID = 4.77, pQ = 7.1 gm/sec, Q = 0.0055 ms/sec, Q = 0.125 gm-m2/sec, QD/pQ2 = 0.280.
FIGURE 4. Helical vortex, D = 15.24 cm, LID = 3.26, pQ = 21.7 gm/sec, Q = 0.0167 ma/sec, Q = 0.842 gm-m2/sec, QD/pQ2 = 0.354.
CASSIDY nrrn FALVEY (Facing p. 736)
Journal of Fluid Mechanics, Vol. 41, part 4 Plate 2
FIGURE 5. Flow in a swirling jet, LID = 0, pQ = 21.7 gm/sec, Q = 0.0167 ms/sec, S2 = 0.714 gm-mz/sec, QD/pQ2 = 0.300.
FIGURE 6. Oscilloscope traces of velocity (upper trace) and pressure.
CASSIDY AND FALVEY
(a)
(U)
(c)
Journal of Fluid Mechanics, Vol. 41, part 4 Plate 3
FlGURE 13. Flow through a contraction. (a) Breakdown in the large tube, steady swirling flow in the small tube. (b) Reversed flow throughout both tubes. (c) Reverse flow on the axis of the large tube with a second breakdown in the smaller tube.
CASSIDY AND FALVEY
c