Embed Size (px)
Citation preview
OBSERVATIONS OF THE SEA OTTER
Enhydra lutris
POPULATION.
Between Point Buchon and Rattlesnake Creek
San Luis Obispo, California
January through December 1995
By
Suzanne V. BenechMarch, 1996
ACKNOWLEDGEMENTS
I would like to thank the following people for their valuable contributionstoward the successful completion of this survey.
Project Coordinator: Mr. Jim Kelly
Diving Support:
Support Vessel:
Special Activity Observations:
Report Review:
Mr. Chris EhrlerMr. Gary McCumber
Mr. Ben StephensMr. Jay Carroll
Mr. Ben StephensMr. A.J. FieldMs Jane Rueger
Mr. Ben StephensMr. Jum Kelly
TABLE OF CONTENTS
List of Tables ................................................................................................. ii
List of Figures .................................................................................................... iii
Abstract ..... ....................................................................................................... v
Introduction ............................................................................. I ......................... 1
Objectives .......................................................................................................... 1
M ethods ........................................................................................................... 2
ResultsPopulation Size .................................................................................... 8Population Distribution and Composition ................................................ 11Feeding Observations ........ z .... .......... ........................ 18Subtidal and Intertidal Surveys .............................. 20Tagged Sea Otter Observations ................................ 27General Behavior .......... ............................ 27
DiscussionPopulation Size ..................................................................................... 31Population Distribution and Composition ............................................ 35Feeding Observations ......... * .................................................................. 41Subtidal and Intertidal Surveys ............................. 46Tagged Sea Otter Observations ............................. 55General Behavior ..................................................................................... 56
Summ ary ......................................................................................................... 59
References ....................................................................................................... 60
Appendix I ........................................................................................................ 61
i
LIST OF TABLES
1. Average Monthly Sea Otter Counts and Composition in vicinity of Diablo CanyonPow er Plant 1995 ....................... . ............. . ...................................................... ..... 10
2. Sea otter Counts in Vicinity of Diablo Canyon Power plant 1995 ................... 12
3. Summary of Sea Otter Feeding Observations Within Zonesin Vicinity of Diablo Canyon Power Plant 1995 ................................................................. 22
4. Specific Sea Otter Food Items Observed in Vicinity of Diablo CanyonPower Plant 1995 ......................... .......................... 23
5. Subtidal and Intertidal Surveys of Urchins and Abalones in Vicinity of Diablo CanyonP ow er Plant 1995 .............................................................................................................. 25
6. Selected Behavioral Observations Recorded in Vicinity of Diablo Canyon
Power Plant 1995 .......................................................................................... 28
7. Sea Otter Haul Out Observations in Vicinity of Diablo Canyon Power Plant 1995 ............... 30
ii
LIST OF FIGURES
1. Sea otter Study area in the Vicinity of the Diablo Canyon Power Plant .............................. 32. Sea Otter Study Area Zones and Subtidal Survey Locations in the Vicinity of the Diablo Canyon
P ow er P lant ........................................................................................................................ 43. Sea Otter Study Zones Subdivisions in the Vicinity of the Diablo Canyon
P ow er P lant ......................................................................................................................... 54. Average Monthly Sea Otter Counts in the Vicinity of the Diablo Canyon
Pow er Plant 1995 ......................................................................................................... 95. Primary Sea Otter Raft Locations in the Vicinity of the Diablo Canyon
Power Plant 1995 ................................................... 166. Sea Otter feeding Summary in Vicinity of Diablo Canyon Power Plant 1995 ............ 197. Sea Otter Newborn and Mating Observations in Vicinity of Diablo Canyon
Pow er Plant 1995 ..... 21....................................................................................................... 218. Food Items Observed in Sea Otter Diets in Vicinity of Diablo Canyon
P ow er P lant 1995 ................................................................................................................ 249. Sea Otter Mean Population Size in Vicinity of Diablo Canyon
Pow er Plant 1973-1995 .................................................................................................. 3210. Summary of Sea Otter Percent Occupancy in Vicinity of Diablo Canyon
Power Plant 1973-1995 .................. ............................ 3711. Sea Otter Diet Summary 1973-1995 (Percent Sea Urchins) in Vicinity of Diablo Canyon
Pow er P lant .................................. ............... ................................................. 4212. Sea Otter Diet Summary 1973-1995 (Percent Abalone) in Vicinity of Diablo Canyon
P ow er P lant ..................................................................................................................... 4313. Sea Otter Diet Summary 1973-1995 (Percent Crabs)in Vicinity of Diablo Canyon
P ow er P lant ...................................................................................................................... 4514. Sea Otter Diet Summary 1973-1995 (Percent Small Mollusks) in Vicinity of Diablo
C anyon Pow er Plant ....................................................................................................... 4715. Sea Otter and Sea Urchin Densities in the Pecho Rock Subtidal Study Area
1974-1995................................................ ........................................................................ 4916. Red Abalone Densities 1979-1995 in the Pecho Rock Subtidal Study 'Area....................... 5217. Sea Urchin and Abalone Density Comparisons Between Pecho Rock
and D iablo Cove 1995 .................................................................................................... 5418. A Summary of The Documented Sea Otter Haul Out Sites in the Vicinity of
the D iablo Canyon Pow er Plant ...................................................................................... 57
111
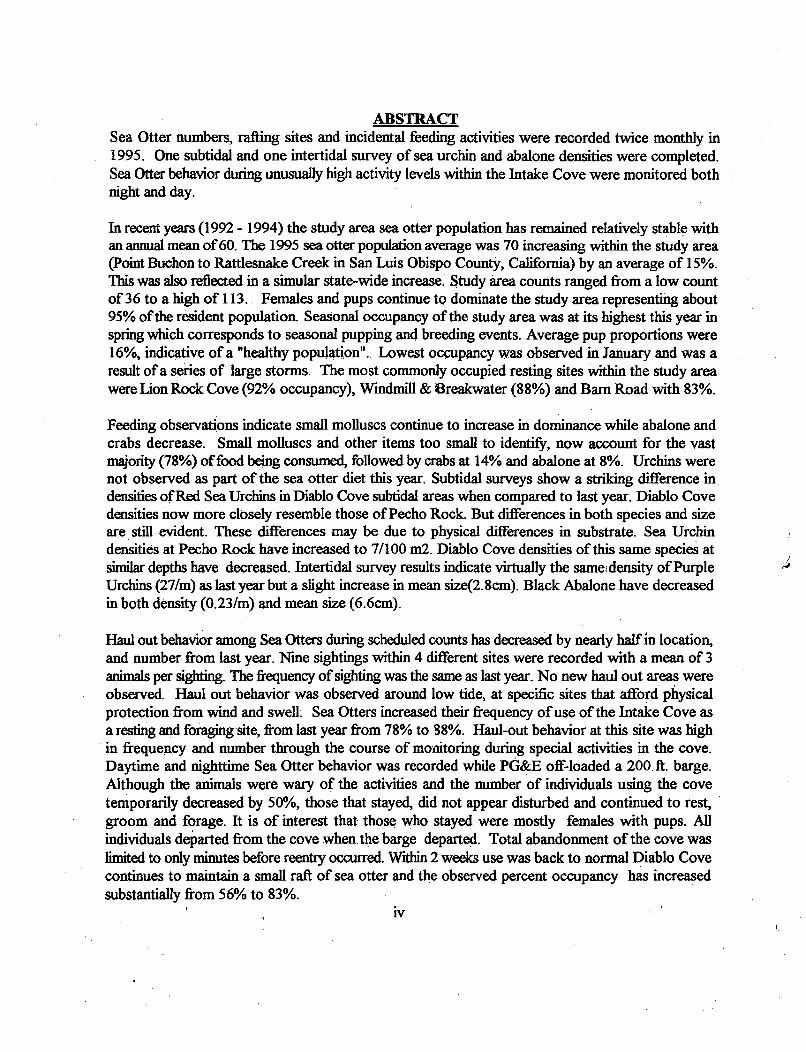
ABSTRACTSea Otter numbers, rafting sites and incidental feeding activities were recorded twice monthly in1995. One subtidal and one intertidal survey of sea urchin and abalone densities were completed.Sea Otter behavior during unusually high activity levels within the Intake Cove were monitored bothnight and day.
In recent years (1992 - 1994) the study area sea otter population has remained relatively stable withan annual mean of 60. The 1995 sea otter population average was 70 increasing within the study area(Point Buchon to Rattlesnake Creek in San Luis Obispo County, California) by an average of 15%.This was also reflected in a simular state-wide increase. Study area counts ranged from a low countof 36 to a high of 113. Females and pups continue to dominate the study area representing about95% of the resident population. Seasonal occupancy of the study area was at its highest this year inspring which corresponds to seasonal pupping and breeding events. Average pup proportions were16%, indicative of a "healthy population". Lowest occupancy was observed in January and was aresult of a series of large storms. The most commonly occupied resting sites within the study areawere Lion Rock Cove (92% occupancy), Windmill & Breakwater (88%) and Barn Road with 83%.
Feeding observations indicate small molluscs continue to increase in dominance while abalone andcrabs decrease. Small molluscs and other items too small to identify, now account for the vastmajority (78%) of food being consumed, followed by crabs at 14% and abalone at 8%. Urchins werenot observed as part of the sea otter diet this year. Subtidal surveys show a striking difference indensities of Red Sea Urchins in Diablo Cove subtidal areas when compared to last year. Diablo Covedensities now more closely resemble those of Pecho Rock. But differences in both species and sizeare still evident. These differences may be due to physical differences in substrate. Sea Urchindensities at Pecho Rock have increased to 7/100 m2. Diablo Cove densities of this same species atsimilar depths have decreased. Intertidal survey results indicate virtually the samel density of PurpleUrchins (27/m) as last year but a slight increase in mean size(2.Scm). Black Abalone have decreasedin both density (0.23/m) and mean size (6.6cm).
Haul out behavior among Sea Otters during scheduled counts has decreased by nearly half in location,and number from last year. Nine sightings within 4 different sites were recorded with a mean of 3animals per sighting. The frequency of sighting was the same as last year. No new haul out areas wereobserved. Haul out behavior was observed around low tide, at specific sites that afford physicalprotection from wind and swell. Sea Otters increased their frequency of use of the Intake Cove asa resting and foraging'site, from last year from 78% to 88%. Haul-out behavior at this site was highin frequency and number through the course of monitoring during special activities in the cove.Daytime and nighttime Sea Otter behavior was recorded while PG&E off-loaded a 200 ft. barge.Although the animals were wary of the activities and the number of individuals using the covetemporarily decreased by 50%, those that stayed, did not appear disturbed and continued to rest,groom and forage. It is of interest that those who stayed were mostly females with pups. Allindividuals departed from the cove when the barge departed. Total abandonment of the cove waslimited to only minutes before reentry occurred. Within 2 weeks use was back to normal Diablo Covecontinues to maintain a small raft of sea otter and the observed percent occupancy has increasedsubstantially from 56% to 83%.
iv
INTRODUCTION
Sea otter (Enhydra lutris) activities along the Buchon Headland in San Luis Obispo County,
California have been monitored since 1973 when a large group of males (-50 individuals) first began
their re-establishment of resting sites along this portion of their historic range.
The 1995 sea otter report represents the twenty-third annual summary of sea otter behavior and
population dynamics within the vicinity of Pacific Gas and Electric Company's (PG&E) Diablo
Canyon Power Plant (DCPP). This year's survey represents the 10th year of sea otter observations
conducted during fiull power operations of both generating units. These observations in conjunction
with other environmental studies funded by PG&E continue to contribute to the understanding of sea
otter population dynamics and the interrelationships of this species with both littoral and sublittoral
community structure within the DCPP vicinity.
Objectives:
The 1995 observations of sea otter activities within the vicinity of the power plant include:
1. Recording sea otter counts
2. Recording sea otter distributions
3. Observing sea otter feeding habits
4. Surveying sea urchin and abalone densities
5. Recording tagged sea otter locations and behavior
6. Observing sea otter night and disturbance behavior
1
Methods:
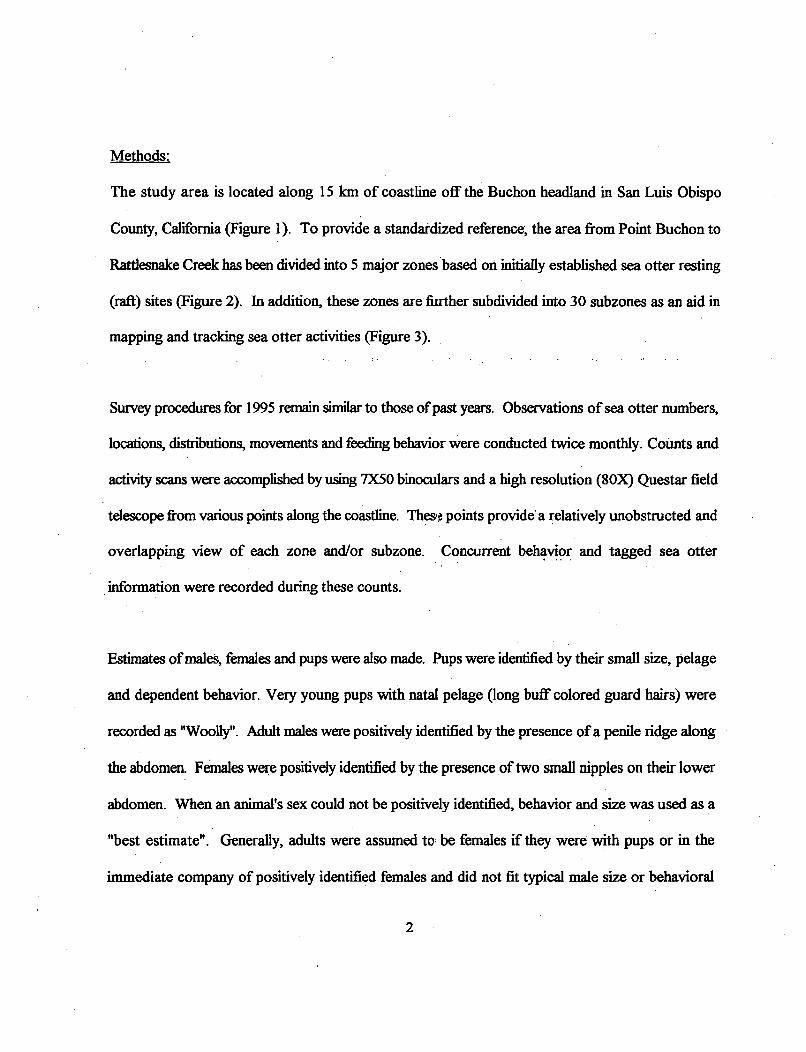
The study area is located along 15 km of coastline off the Buchon headland in San Luis Obispo
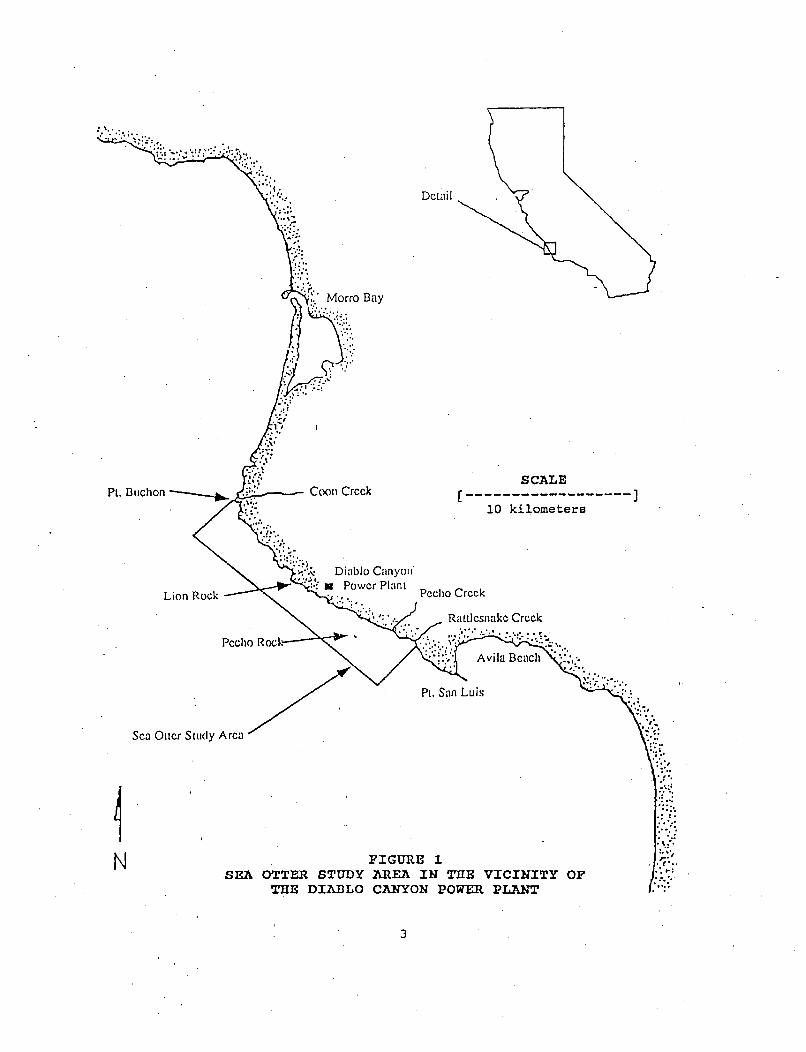
County, California (Figure 1). To provide a standardized reference, the area from Point Buchon to
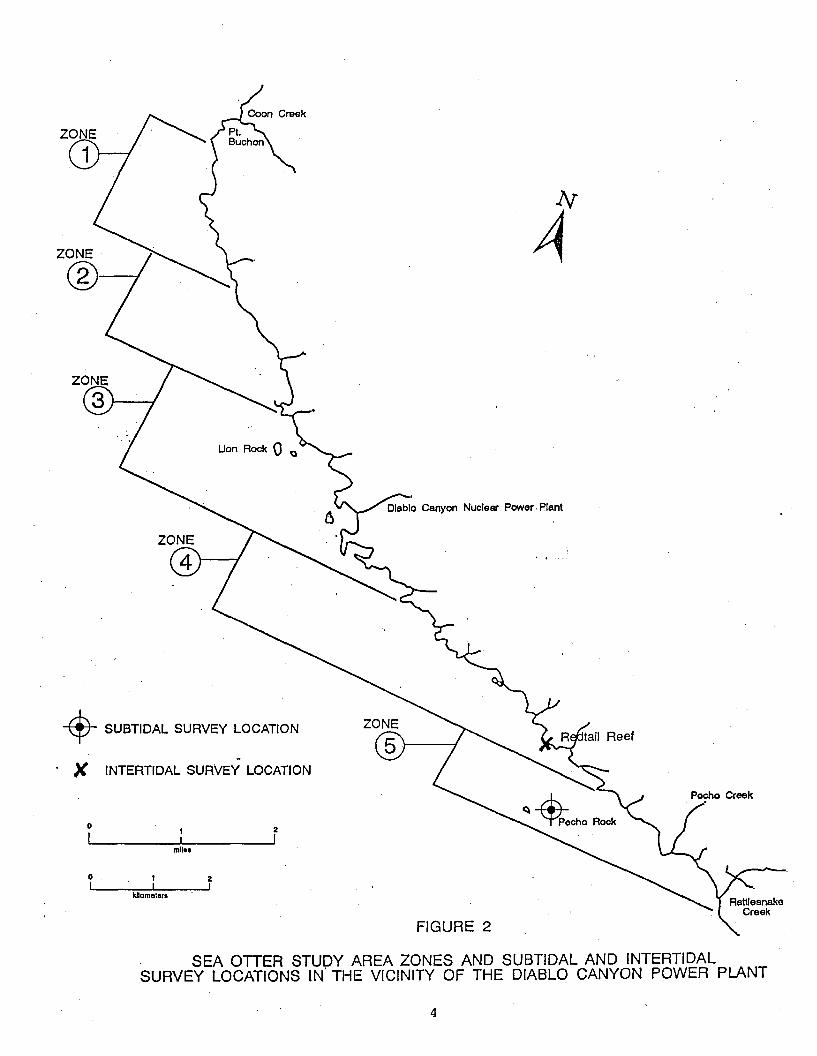
Rattlesnake Creek has been divided into 5 major zones based on initially established sea otter resting
(raft) sites (Figure 2). In addition, these zones are further subdivided into 30 subzones as an aid in
mapping and tracking sea otter activities (Figure 3).
Survey procedures for 1995 remain similar to those of past years. Observations of sea otter numbers,
locations, distributions, movements and feeding behavior were conducted twice monthly. Counts and
activity scans were accomplished by using 7X50 binoculars and a high resolution (80X) Questar field
telescope from various points along the coastline. Thew points provide'a relatively unobstructed and
overlapping view of each zone and/or subzone. Concurrent behavior and tagged sea otter
information were recorded during these counts.
Estimates of males, females and pups were also made. Pups were identified by their small size, pelage
and dependent behavior. Very young pups with natal pelage (long buff colored guard hairs) were
recorded as 'Woolly". Adult males were positively identified by the presence of a penile ridge along
the abdomen. Females were positively identified by the presence of two small nipples on their lower
abdomen. When an animal's sex could not be positively identified, behavior and size was used as a
"best estimate". Generally, adults were assumed tot be females if they were with pups or in the
immediate company of positively identified females and did not fit typical male size or behavioral
2
Detail
Morro Bay
Pt. Buchon •
Lion Rock
Pecho R(
Sea Ottcr Study Area
4.N
C(SCALE
on, Creek -- ]
10 kilometers
Diablo Canyon.
w Power PlantPecho Creek
• .': ..J _Rattlesnake Creek
Pt. San Luis
SEA CFIGURE 1
)TTER STUDY AREA IN THE VICINITY OFTHIE DIABLO CANYON POWER PLANT
3
Creek
-N
Canyon Nuclear Power, Plant
± SUBTIDAL SURVEY LOCATIONReef
. INTERTIDAL SURVEY LOCATION
Pecho Creek
0I 1! 2I0 2
mlles
0. SIkilometers
FIGURE 2
SEA OTTER STUDY AREA ZONES AND SUBTIDAL AND INTERTIDALSURVEY LOCATIONS IN THE VICINITY OF THE DIABLO CANYON POWER PLANT
4
Coon Creek
/
4/Windmill Point
Cove
Nuclear Power Plant
Mettower
Finger Reef
Siillwater Cove
Well
Creek
0! I 2 FIGURE 3i I !
miles0 1.2
aSEA OTTER STUDY ZONE SUBDIVISIONSkilometers
IN THE VICINITY OF THE DIABLO CANYONPOWER PLANT Rattlesnake
Creek
5
characteristics.
One subtidal survey (using SCUBA) and one intertidal survey were conducted in the Pecho Rock
area. This is a continuation of the sea urchin and abalone density documentation initiated in 1974 to
assess the effects of sea otter foraging on two commercially important food items. In 1974, this site
was chosen because there were no otters observed either resting or foraging in the area at that time.
Thus, this site provides sea urchin and abalone density information both pre and post sea otter
habitation. Two additional subtidal stations were surveyed in Diablo Cove using the same sampling
techniques.
Sampling methods remain the same as in previous years. These include the use of a "stratified
random" sampling technique. The subtidal survey at Pecho Rock included Ten circular,(30 square
meter) transects placed on hard substrate within a 0.5 square kilomet6r area. The intertidal survey
included 5 circular (30 square meter) transects located near Red Tail Reef.
Subtidal sites range from 9 to 13 meters water depth. The starting location of each site within the
general vicinity of Pecho Rock was dependent on first contact with appropriate substrate and
specified water depth after reaching the bottom. Appropriate substrate is defined as simply "rocky
bottom". The bottom type was also described as either high or low relief. Low relief is defined as less
than 1 meter in height off bottom and high relief is substrate projecting 1 meter or more off the
surrounding sea floor. This substrate is suitable for sea urchin and abalone recruitment and growth.
The factors used in water depth choice were related to the fact that sea otters feed at those depths,
6
abalone and sea urchins historically occurred in large numbers at those depths and survey diving was
logistically simple and safe.
Two subtidal stations were surveyed using the same methods in Diablo Cove. These were located
along the North side, in 7-9 meter depths in an area know as "North Channel". These stations were
surveyed because, there has been widely different Sea Urchin and Abalone abundance estimates
between Pecho Rock and Diablo Cove sites. Since data prior to 1994 were generated using different
sampling techniques, depths and observers, it is important to determine if these results were different
due to an artifact of sampling or real.
The yearly intertidal survey is directed toward assessing the availability of sea urchin recruitment
stock in an effort to understand observed changes in the subtidal populations. Rocky intertidal habitat
near Benchmark Olsen, South of Redtail Reef (figure 2), was selected for survey because of it's
proximity to the subtidal survey area off Pecho Rock. Appropriate habitat was selected by tidal
height (0 to+lm MLLW) and the presence of rock substrate. Population size class was estimated by
measuring either all or the first 100 sea urchins and abalone encountered (whichever came first)
within these stations. Sea urchin test diameter and abalone maximum shell length were measured to
the nearest millimeter. Both subtidal and intertidal Sea Urchins (Strongylocentrotus franciscanus &
S. Purpuratus) and Abalone .(Laliotis rufescens & H. cracherodi) counts remain restricted to
macroscopic animals for practical purposes. This includes abalone of greater than 1rcm in shell length
and urchins of greater than 1cm test diameter.
7
During May, 1995 PG&E made a barge delivery to the plant site via Intake Cove. Special anchoring
arrangements and dock removal took place in order to secure and off-load the 200 Ft. barge. Since
Intake Cove is frequently used by relatively large numbers of Sea Otters in the Spring and the
associated activities with barge delivery was considered a significant increase in disturbance, Sea
Otter numbers and behavior were monitored. Four night observation periods were conducted which
collected hourly activity scans. One of these four hourly night scans was conducted prior to
mobilization for barge delivery, two during barge operations and one after demobilization. In
addition, 14 mid-morning observations were conducted during barge delivery off-loading and
departure. These daily activity scans were conducted once at midmorning to best replicate the time
and technique used during standard biweekly counts. Continuous observations were also made
during periods of most intensive human activity, including barge arrival, and departure (Appendix I).
RESULTS
Population size:
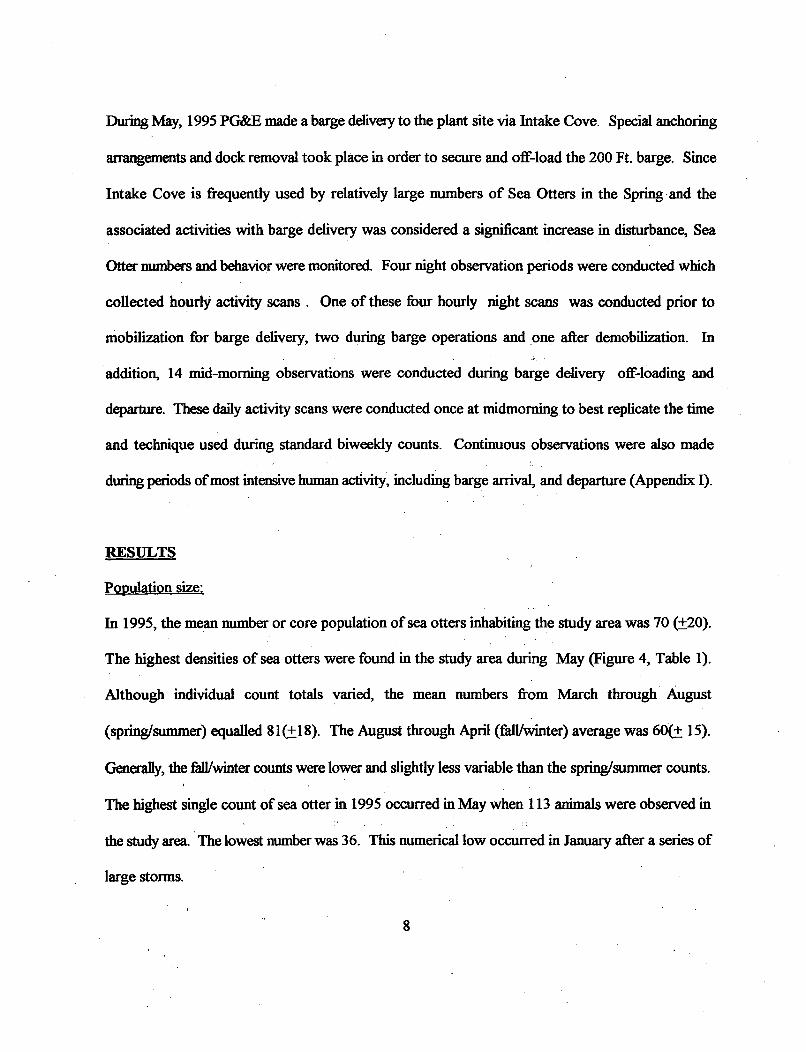
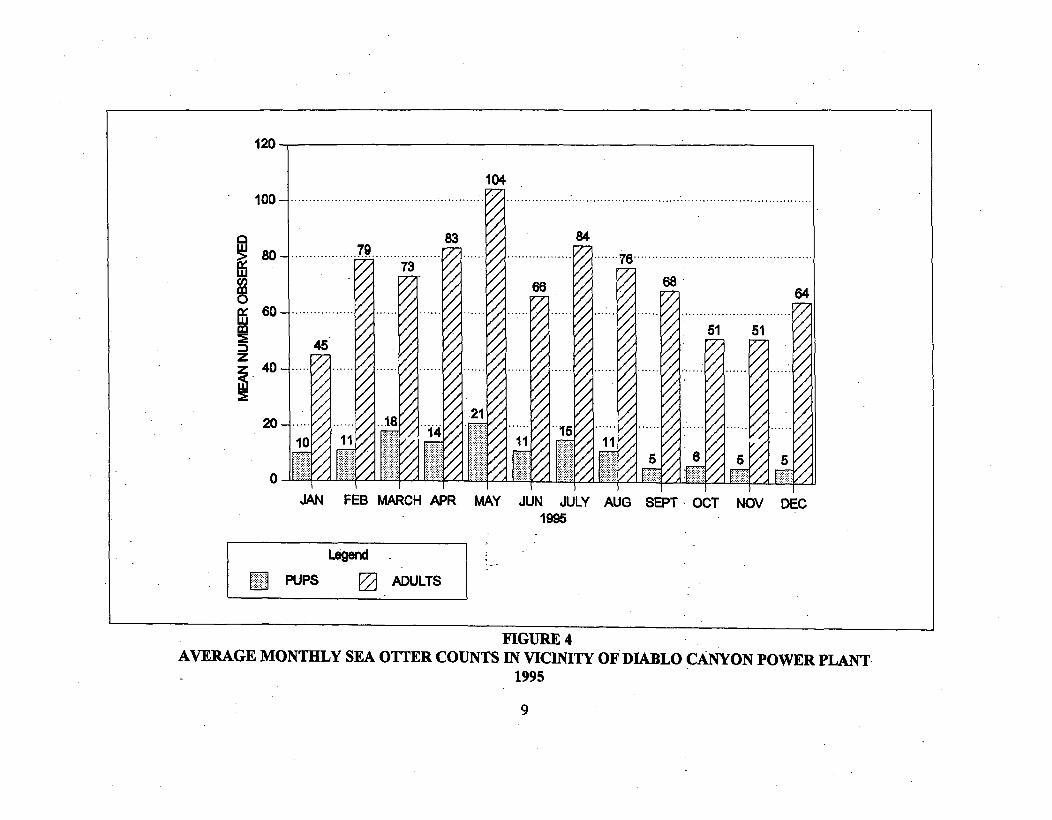
In 1995, the mean number or core population of sea otters inhabiting the study area was 70 (±20).
The highest densities of sea otters were found in the study area during May (Figure 4, Table 1).
Although individual count totals varied, the mean numbers from March through August
(spring/summer) equalled 81(+18). The August through April (fall/winter) average was 60(. 15).
Generally, the fall/winter counts were lower and slightly less variable than the spring/summer counts.
The highest single count of sea otter in 1995 occurred in May when 113 animals were observed in
the study area. The lowest number was 36. This numerical low occurred in January after a series of
large storms.
8
120
1041 0 0 .ý ...................... I................... •.......... .
80-
0
60-
z S40--I
73
45
1810 11
Effii
83 ..................Arl
84
68
....7 6 .. .................... ...I
51 51
KZ
64
20-
0
21
11 11,..........
F•:•:!!:!:!:!|fifl•f•ifTfi.... .......
5 8 5 5
P7 K I I K-JAN FEB MARCH APR MAY JUN JULY AUG
1995SEPT OCT NOV DEC
i ~Legend -I
M PUPS i[2 ADULTS
FIGURE 4AVERAGE MONTHLY SEA OTTER COUNTS IN VICINITY OF DIABLO CANYON POWER PLANT
1995
9
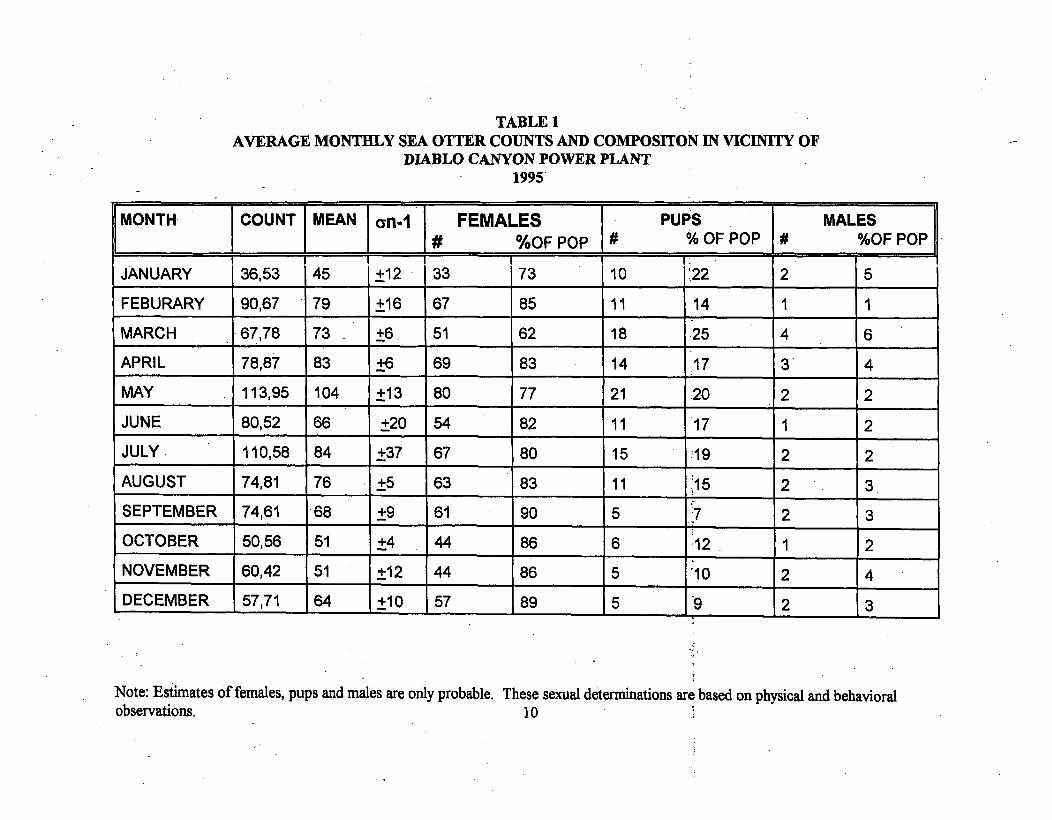
TABLE 1AVERAGE MONTHLY SEA OTTER COUNTS AND COMPOSITON IN VICINITY OF
DIABLO CANYON POWER PLANT1995
MONTH COUNT MEAN an-1 FEMALES PUPS MALES# %OFPOP # %OFPOP # %OFPOP
JANUARY 36,53 45 +12 33 73 10 ý22 2 5
FEBURARY 90,67 79 +16 67 85 11 14 1 1
MARCH _67,78 73 +6_ 51 62 18 25 4 6
APRIL 78,87 83 +6 69 83 14 17 3' 4
MAY 113,95 104 +13 80 77 21 20 2 2
JUNE 80,52 66 +20 54 82 11 17 1 2
JULY- 110,58 84 +37 67 80 15 19 2 2
AUGUST 74,81 76 +5 63 83 11 15 2 3
SEPTEMBER 74,61 68 +9 61 90 5 :7 2 3
OCTOBER 50,56 51 +4 44 86 6 12 1 2
NOVEMBER 60,42 51 +12 44 86 5 10 2 4
DECEMBER 57,71 64 +10 57 89 5 19 2 3
Note: Estimates of females, pups and males are only probable. These sexual determinations are based on physical and behavioralobservations. 10
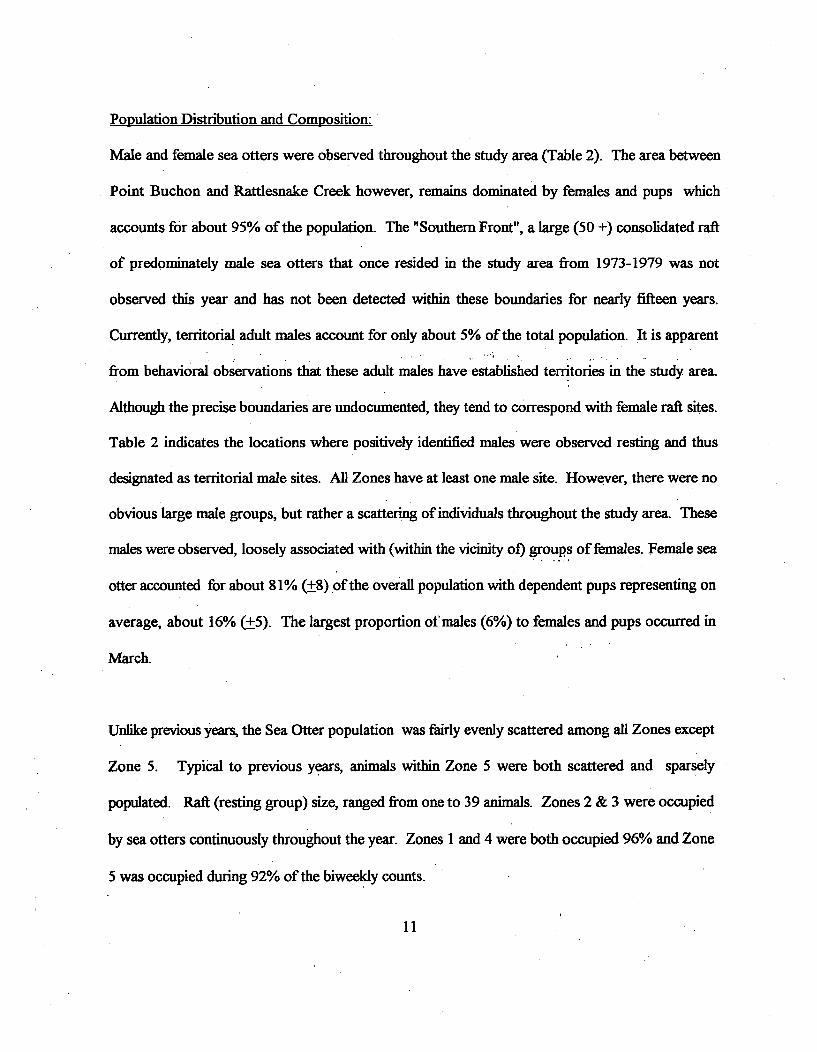
Population Distribution and Composition:
Male and female sea otters were observed throughout the study area (Table 2). The area between
Point Buchon and Rattlesnake Creek however, remains dominated by females and pups which
accounts for about 95% of the population. The "Southern Front", a large (50 +) consolidated raft
of predominately male sea otters that once resided in the study area from 1973-1979 was not
observed this year and has not been detected within these boundaries for nearly fifteen years.
Currently, territorial adult males account for only about 5% of the total population. It is apparent
from behavioral observations that these adult males have established territories in the study area.
Although the precise boundaries are undocumented, they tend to correspond with female raft sites.
Table 2 indicates the locations where positively identified males were observed resting and thus
designated as territorial male sites. All Zones have at least one male site. However, there were no
obvious large male groups, but rather a scattering of individuals throughout the study area. These
males were observed, loosely associated with (within the vicinity of) groups of females. Female sea
otter accounted for about 81% (±8) of the overall population with dependent pups representing on
average, about 16% (+5). The largest proportion of males (6%) to females and pups occurred in
March.
Unlike previous years, the Sea Otter population was fairly evenly scattered among all Zones except
Zone 5. Typical to previous years, animals within Zone 5 were both scattered and sparsely
populated. Raft (resting group) size, ranged from one to 39 animals. Zones 2 & 3 were occupied
by sea otters continuously throughout the year. Zones 1 and 4 were both occupied 96% and Zone
5 was occupied during 92% of the biweekly counts.
11
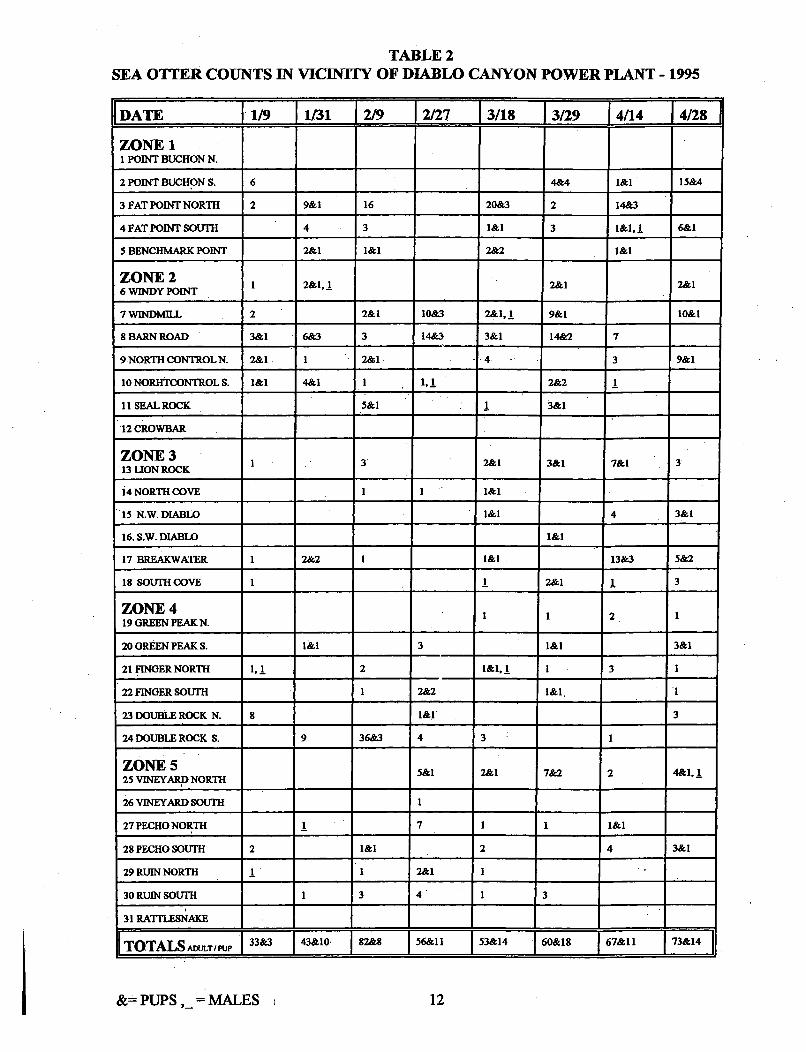
TABLE 2
SEA OTTER COUNTS IN VICINITY OF DIABLO CANYON POWER PLANT - 1995
DATE 1-1/9 11/31 2/9 12/27 13/18 3/29 [4/14 14/28
ZONE 11 POINT BUCHON N.
2 POINT BUCHON S. 6 4&4 M&l 15&4
3 FAT POINT NORTH 2 9&1 16 20&3 2 14&3
4 FAT POINT SOUTH 4 3 1&1 3 1&1, 1 6&1
5 BENCHMARK POINT 2&1 1&1 2&2 1&1
ZONE 2ZOE21 2&1, 1 2&1 2&16 WINDY POINT 1
7 WINDMILL 2 2&1 10&3 2&l,1 9&1 10&M
8 BARN ROAD 3&1 6&3 3 14&3 3&1 14&2 7
9 NORTH CONTROL N. 2&1 1 2&1 .. 4 3 9&1
10 NORHTCONTROL S. 1&1 4&1 1 1,1 2&2 1
11 SEAL ROCK 5&1 1 3&1
12 CROWBAR
ZONE 3ZONE 3K1 3 2&1 3&1 7&1 3•13 LION ROCK
14 NORTH COVE 1 1 &1
15 N.W. DIABLO 1&1 4 3&1
16. S.W. DIABLO l&1
17 BREAKWATER 1 2&2 1 1&1 13&3 5&2
18 SOUTH COVE 1 1 2&1 1 3
ZONE 4 1 119 GREEN PEAK N.
20 GREEN PEAK S. 1&1 3 1&1 3&1
21 FINGER NORTH 1,1 2 1&1, 1 1 3 1
22 FINGER SOUTH 1 2&2 1&1 1
23 DOUBLE ROCK N. 8 1&1 3
24 DOUBLE ROCK S. 9 36&3 4 3
ZONE 525 VINEYARD NORTH 5&1 2&1 7&2 4&, 1
26 VINEYARD SOUTH 1
27 PECHO NORTH 1 7 1 1l&
28 PECHO SOUTH 2 1&1 2 4 3&1
29 RUIN NORTH 1 1 2&1 1
3O RUIN SOUTH 1 3 4 1
31 RATrTSNAKE
S33&3 43&10. 82&8 56&11 53&14 60&18 67&11 73&14
&=PUPS _= MALES 12
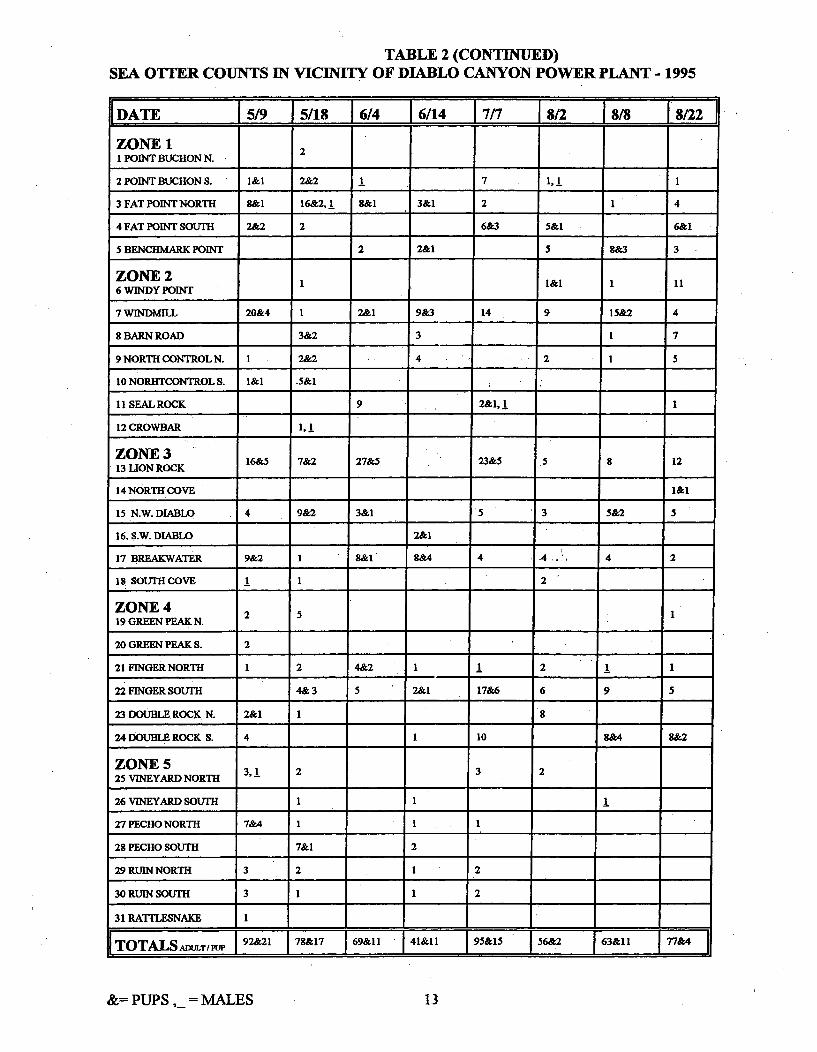
TABLE 2 (CONTINUED)SEA OTTER COUNTS IN VICINITY OF DIABLO CANYON POWER PLANT - 1995
DATE 15/9 I5/18 6/4 16/14 7/7 18/2 18/8 1 822
ZONE 11 POINT BUCHON N. 2
2 POINT BUCHON S. 1&1 2&2 1 7 1,1 1
3 FAT POINT NORTH 8&1 16&2,1 8&1 3&1 2 1 4
4 FAT POINT SOUTH 2&2 2 6&3 5&1 6&1
5 BENCHMARK POINT 2 2&1 5 8&3 3
ZONE 26 WINDY POINT 1 l&l 1 11
7 WINDMILL 20&4 1 2&1 9&3 14 9 15&2 4
8 BARN ROAD 3&2 3 1 7
9 NORTH CONTROL N. 1 2&2 4 2 1 5
1ONORHTCONTROLS. 1&1 .5&1
11 SEAL ROCK 9 2&1, 1
12 CROWBAR I 1
ZONE 31ON O 16&5 7&2 27&5 23&5 5 8 1213 LION ROCK
14 NORTH COVE l&l
15 N.W. DIABLO 4 9&2 3&1 5 3 5&2 5
16. S.W. DIABLO 2&1
17 BREAKWATER 9&2 1 8&1 8&4 4 4 14 2
18 SOUTH COVE 1 1 2
ZONE 419 GREEN PEAK N.
20 GREEN PEAK S. 2
21 FINGER NORTH 1 2 4&2 1 1 2 1 1
22 FINGER SOUTH 4& 3 5 2&1 17&6 6 9 5
23 DOUBLE ROCK N. 2&1 1 8
24 DOUBLE ROCK S. 4 1 10 8&4 S&2
ZONE 525 VINEYARD NORTH 3,1 2 2
26 VINEYARD SOUTH I I
27 PECHO NORTH 7&4 1 1
28 PECHO SOUTH 7&1 2
29 RUIN NORTH 3 2 1 2
30 RUIN SOUTH 3 1 1 2
31 RATLESNAKE 1
STOTALS nuX'r/mpu 7 92&21 9 78&17 69&11 41&11 95&15 56&2 63&11 77&4
&= PUPS,_ = MALES 1.3
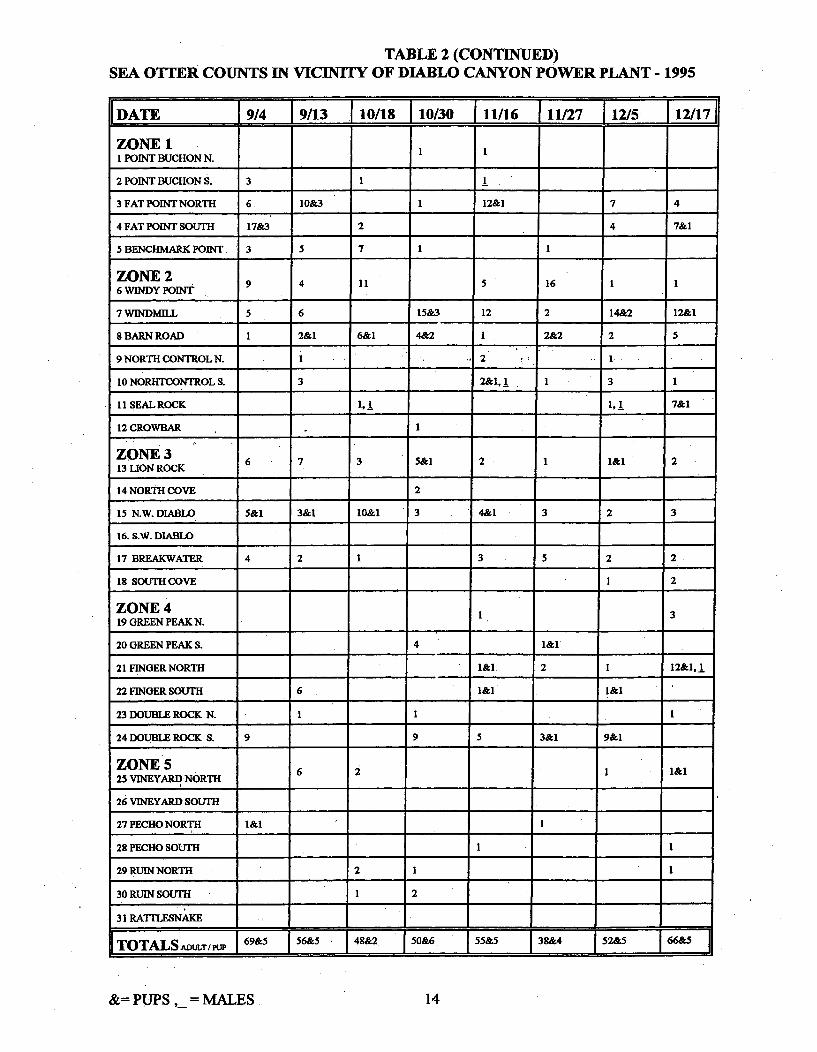
TABLE 2 (CONTINUED)SEA OTTER COUNTS IN VICINITY OF DIABLO CANYON POWER PLANT - 1995
DATE 19/4 9/13 10/18 110/30 1 11/16 111/27 112/5 112/17
ZONE 1 11 POINT BUCHON N.
2 POINT BUCHON S. 3 11
3 FAT POINT NORTH 6 10&3 1 12&1 7 4
4 FAT POINT SOUTH 17&3 2 4 7&1
5 BENCHMARK POINT 3 5 7 1 1
ZONE 2 4 11 5 16 1 16 WINDY POINT
7 WINDMILL 5 6 15&3 12 2 14&2 12&1
8 BARN ROAD 1 2&1 6&1 4&2 1 2&2 2 5
9 NORTH CONTROL N. 1 : 2 1
10 NORHTCONTROL S. 3 2&1, 1 1 3 1
I ISEAL ROCK l 1 1,. 7&1
12 CROWBAR 1
ZONE 3ZONEO3K6 7 3 5&1 2 1 1&1 213' LION ROCK
14 NORTH COVE 2
15 N.W. DIABLO 5&1 3&M 10&1 3 4&1 3 2 3
16. S.W. DIABLO
17 BREAKWATER 4 2 1 3 5 2 2
18 SOUTH COVE 1 2
ZONE4 1 319 GREEN PEAK N.
20 GREEN PEAK S. 4 1&1
21 FINGER NORTH 1&l 2 1 12&1, 1
22 FINGER SOUTH 6 1&1 1&1
23 DOUBLE ROCK N. 1 1
24 DOUBLE ROCK S. 9 9 5 3&1 9&1
ZONE 525 VINEYARD NORTH 6 2 1
26 VINEYARD SOUTH
27 PECHO NORTH l&l 1
28 PECHO SOUTH 1
29 RUIN NORTH 2 1 1
30 RUIN SOUTH 1 2
31 RATTLESNAKE
_______________ 69I5& 48&2 [50&6. 55&5 J38&4TOASqo~iu 52& 69566&6 .___ ____ _
&= PUPS,_ = MALES4 14
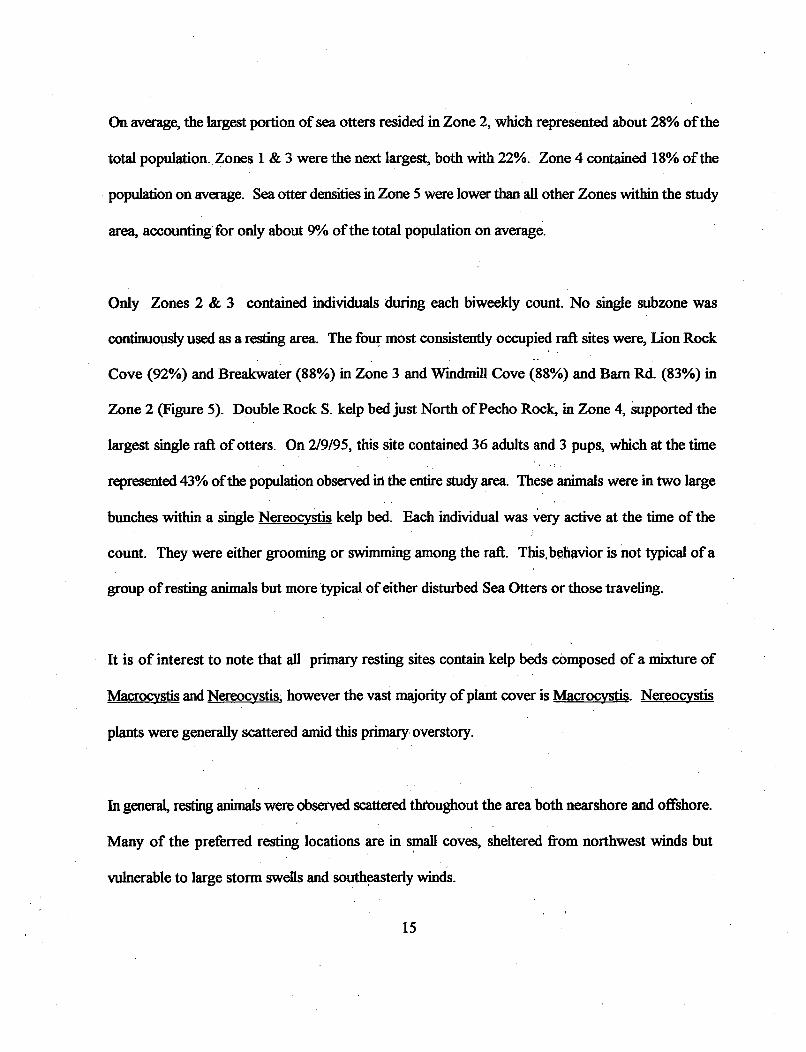
On average, the largest portion of sea otters resided in Zone 2, which represented about 28% of the
total population. Zones 1 & 3 were the next largest, both with 22%. Zone 4 contained 18% of the
population on average. Sea otter densities in Zone 5 were lower than all other Zones within the study
area, accounting for only about 9% of the total population on average.
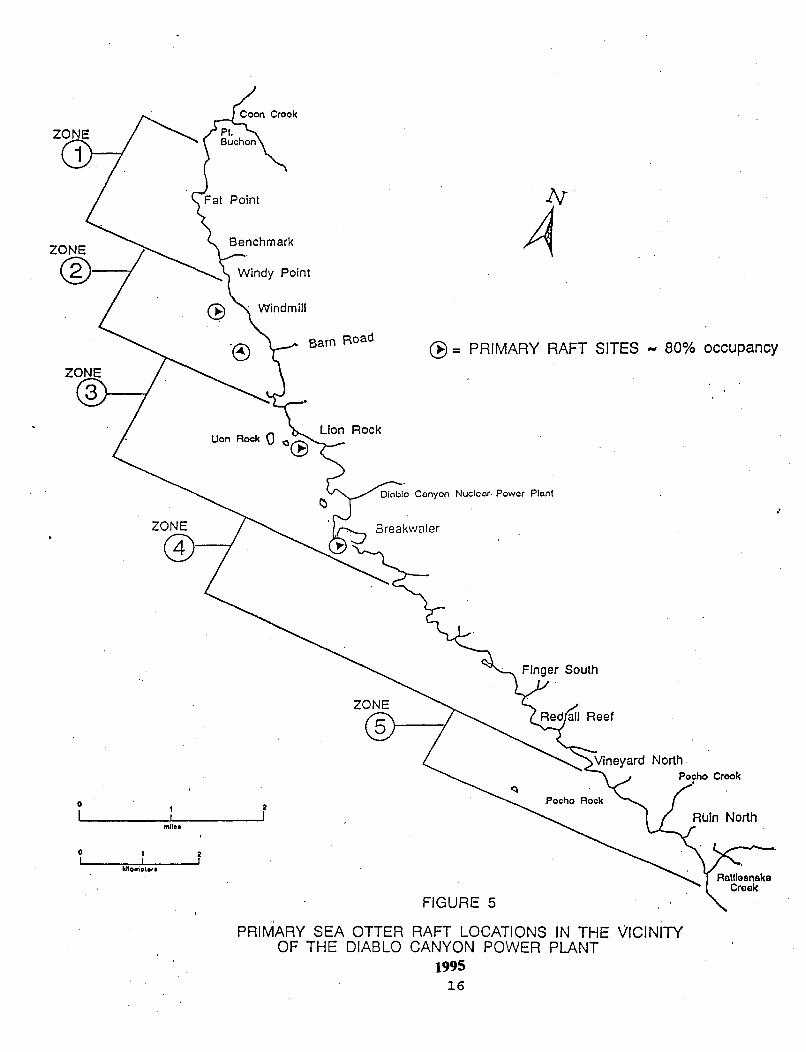
Only Zones 2 & 3 contained individuals during each biweekly count. No single subzone was
continuously used as a resting area. The four most consistently occupied raft sites were, Lion Rock
Cove (92%) and Breakwater (88%) in Zone 3 and Windmill Cove (88%) and Barn Rd. (83%) in
Zone 2 (Figure 5). Double Rock S. kelp bed just North of Pecho Rock, in Zone 4, supported the
largest single raft of otters. On 2/9/95, this site contained 36 adults and 3 pups, which at the time
represented 43% of the population observed in the entire study area. These animals were in two large
bunches within a single Nereocystis kelp bed. Each individual was very active at the time of the
count. They were either grooming or swimming among the raft. This behavior is not typical of a
group of resting animals but more typical of either disturbed Sea Otters or those traveling.
It is of interest to note that all primary resting sites contain kelp beds composed of a mixture of
Macrocystis and Nereocystis, however the vast majority of plant cover is Macrocystis. Nereocystis
plants were generally scattered amid this primary overstory.
In general, resting animals were observed scattered throughout the area both nearshore and offshore.
Many of the preferred resting locations are in small coves, sheltered from northwest winds but
vulnerable to large storm swells and southeasterly winds.
15
Crook
2v
A1Windmill
Barn Road (ý) = PRIMARY RAFT SITES - 80% occupancy
Lion Rock
Conyon Nucloir Power Plont
Finger South
Reef
NorthPocho Crook
01 II 2
m1l68
0 I2
kiomialers
FIGURE 5
PRIMARY SEA OTTEROF THE rDIABLO
RAFT LOCATIONS IN THE VICINITYCANYON POWER. PLANT
199516
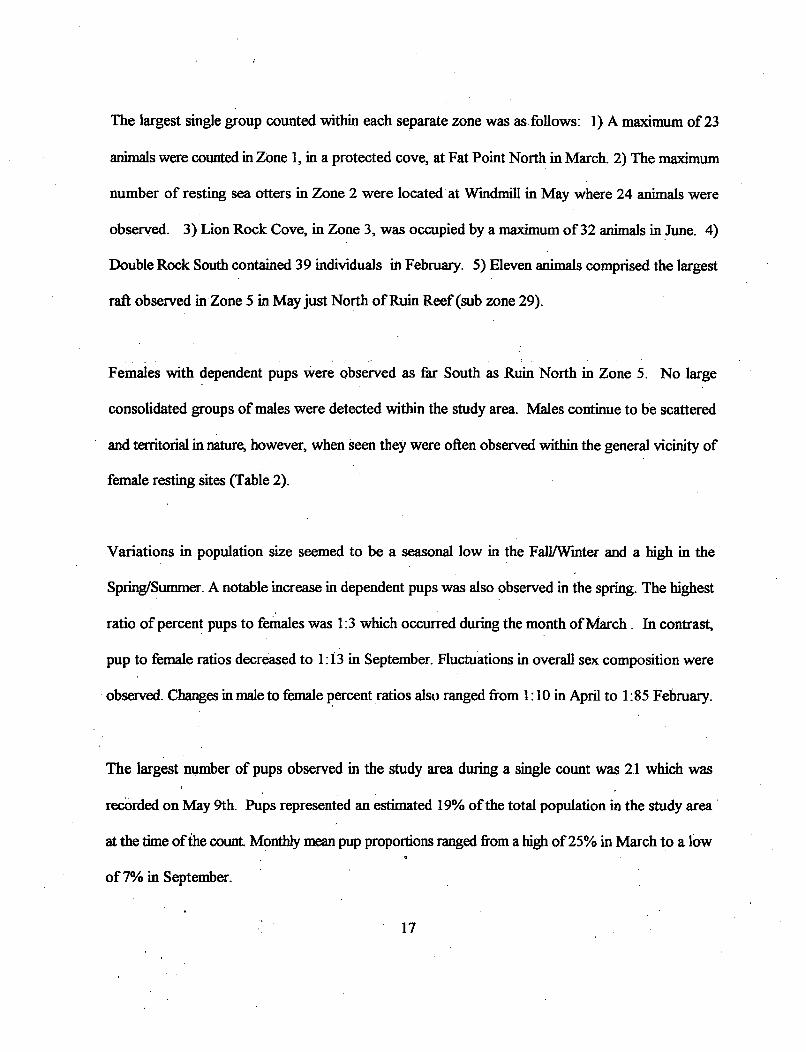
The largest single group counted within each separate zone was as follows: 1) A maximum of 23
animals were counted in Zone 1, in a protected cove, at Fat Point North in March. 2) The maximum
number of resting sea otters in Zone 2 were located at Windmill in May where 24 animals were
observed. 3) Lion Rock Cove, in Zone 3, was occupied by a maximum of 32 animals in June. 4)
Double Rock South contained 39 individuals in February. 5) Eleven animals comprised the largest
raft observed in Zone 5 in May just North of Ruin Reef (sub zone 29).
Females with dependent pups were observed as far South as Ruin North in Zone 5. No large
consolidated groups of males were detected within the study area. Males continue to be scattered
and territorial in nature, however, when seen they were often observed within the general vicinity of
female resting sites (Table 2).
Variations in population size seemed to be a seasonal low in the Fall/Winter and a high in the
Spring/Summer. A notable increase in dependent pups was also observed in the spring. The highest
ratio of percent pups to females was 1:3 which occurred during the month of March. In contrast,
pup to female ratios decreased to 1: 13 in September. Fluctuations in overall sex composition were
observed. Changes in male to female percent ratios also ranged from 1: 10 in April to 1:85 February.
The largest number of pups observed in the study area during a single count was 21 which was
recorded on May 9th. Pups represented an estimated 19% of the total population in the study area'
at the time of ihe count. Monthly mean pup proportions ranged from a high of 25% in March to a low
of 7% in September.
17
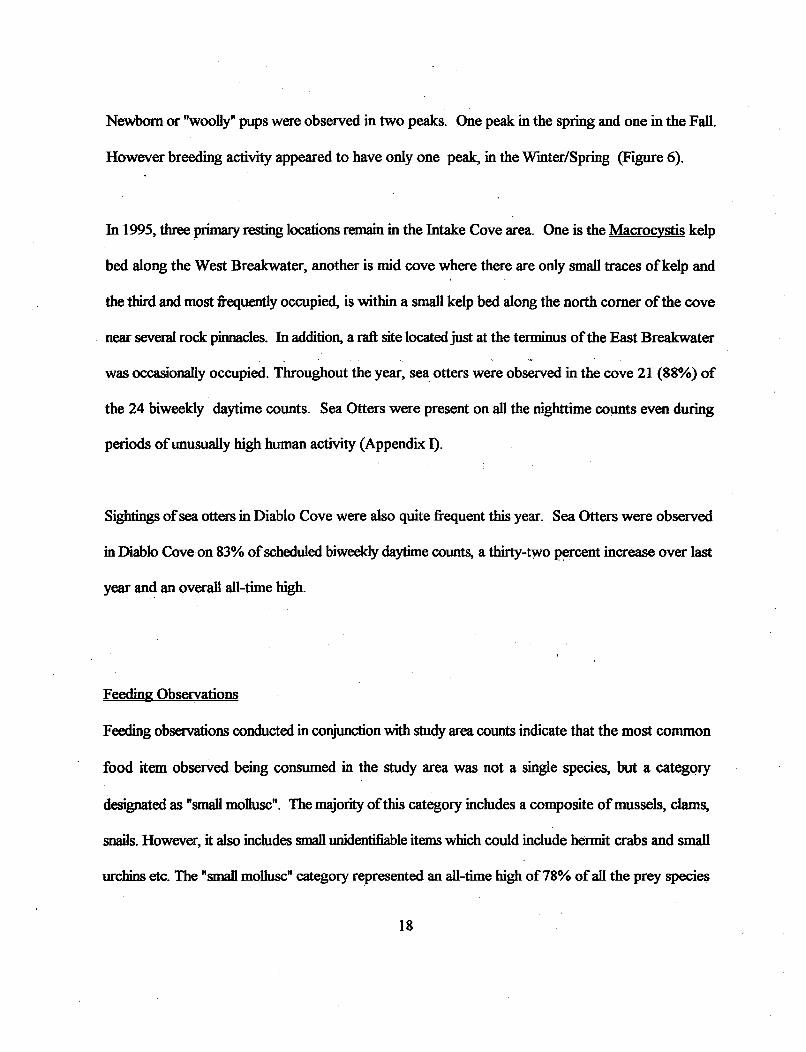
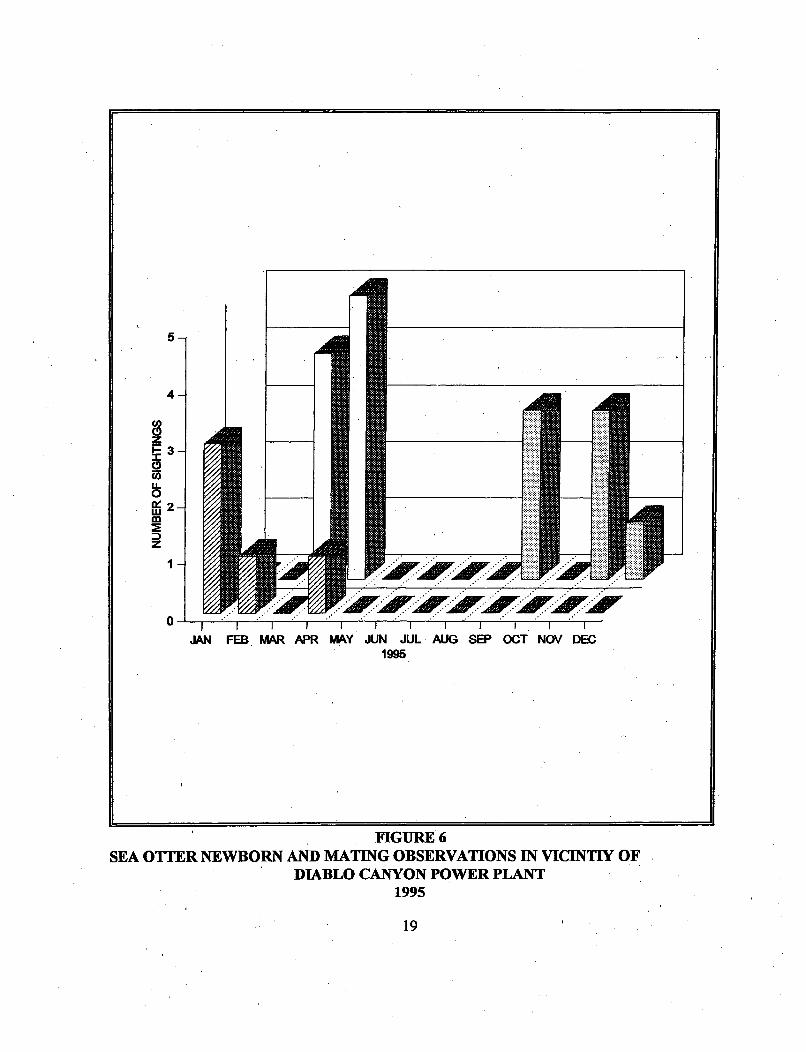
Newborn or "woolly" pups were observed in two peaks. One peak in the spring and one in the Fall.
However breeding activity appeared to have only one peak, in the Winter/Spring (Figure 6).
In 1995, three primary resting locations remain in the Intake Cove area. One is the Macrocystis kelp
bed along the West Breakwater, another is mid cove where there are only small traces of kelp and
the third and most frequently occupied, is within a small kelp bed along the north comer of the cove
near several rock pinnacles. In addition, a raft site located just at the terminus of the East Breakwater
was occasionally occupied. Throughout the year, sea otters were observed in the cove 21 (88%) of
the 24 biweekly daytime counts. Sea Otters were present on all the nighttime counts even during
periods of unusually high human activity (Appendix I).
Sightings of sea otters in Diablo Cove were also quite frequent this year. Sea Otters were observed
in Diablo Cove on 83% of scheduled biweekly daytime counts, a thirty-two percent increase over last
year and an overall all-time high.
Feeding Observations
Feeding observations conducted in conjunction with study area counts indicate that the most common
food item observed being consumed in the study area was not a single species, but a category
designated as "small mollusc". The majority of this category includes a composite of mussels, clams,
snails. However, it also includes small unidentifiable items which could include hermit crabs and small
urchins etc. The "small mollusc" category represented an all-time high of 78% of all the prey species
18
3-
LLu
I.
In ... ... ....
,.- .. , . .- A .- . . .
JAN FEB. MAR APR MAY JUN JUL AUG SEP OCT NOV DEC1995,
FIGURE 6SEA OTTER NEWBORN AND MATING OBSERVATIONS IN VICINTIY OF
DIABLO CANYON POWER PLANT1995
19
observed being consumed by sea otters incidental to scheduled counts.
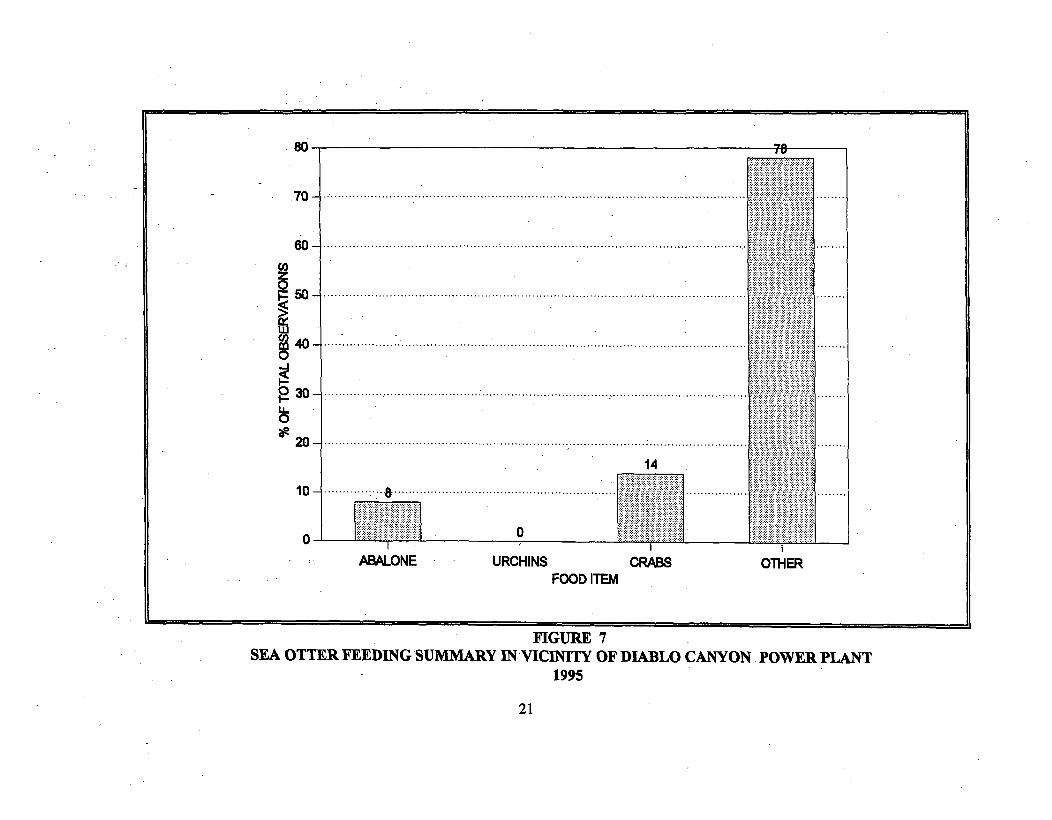
Abalones were at an all-time low as an observed food source. (Haliotis rufescens and H. cracherodiio
accounted for only 8% of the total observed food items that could be specifically identified. Crabs,
which generally included a variety of Cancer and Pugettia species also decreased and comprised only
14% of the observed diet. No Red Sea Urchins, (Strongylocentrotus fi-anciscanus) or Purple Sea
Urchins, (S. purpuratus) were identified being consumed during the year (Figure 7).
Zone 2 accounted for about 42% of the total feeding observations, followed by Zone 3 with 20%,
Zone 1 with 14% and Zone 5 with 8% (Tables 3 & 4).
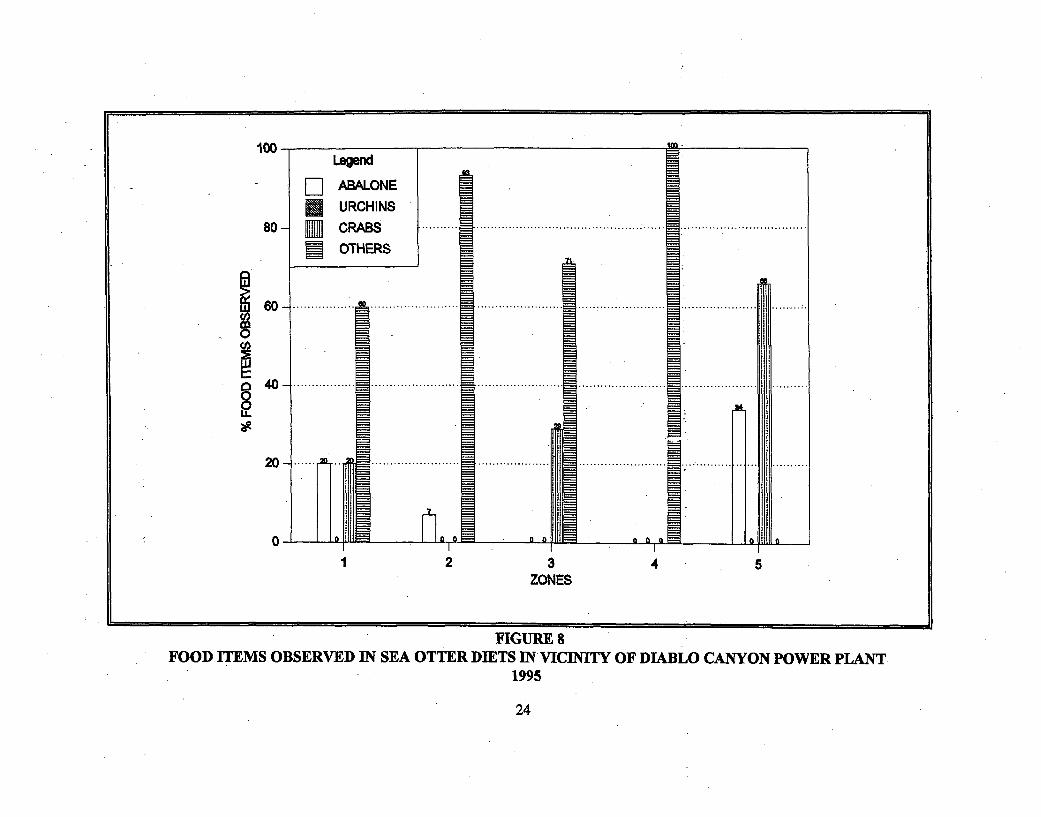
There are notable differences among forage species within the 5 major Zones of the study area
(Figure 8). Each Zone is different from the other but Zones 4 and 5 displayed. the greatest differences
in observed food item dominance. All of the food items observed in Zone 4 were small molluscs or
too small to identify; while Zone 5 was exsclusively abalones and crabs. Zone 1 displayed the
greatest variety of food sources. Sea Urchins were not positively identified as being consumed in any
zone. The majority of all observed feeding activity remains in the shallow subtidal and low intertidal
zones (<10 meters water depth).
Subtidal and Intertidal Surveys:
Twenty-one live sea urchins were observed in nine often stations located near'Pecho Rock in Zone
5 (Table 5). All were Purple Sea Urchins (S purpuratus). Densities of 7/100m2 were observed for
20
80
o
0
It-0
ABALONE URCHINS CRABS OTHERFOOD ITEM
FIGURE 7SEA OTTER FEEDING SUMMARY IN VICINITY OF DIABLO CANYON POWER PLANT
1995
21
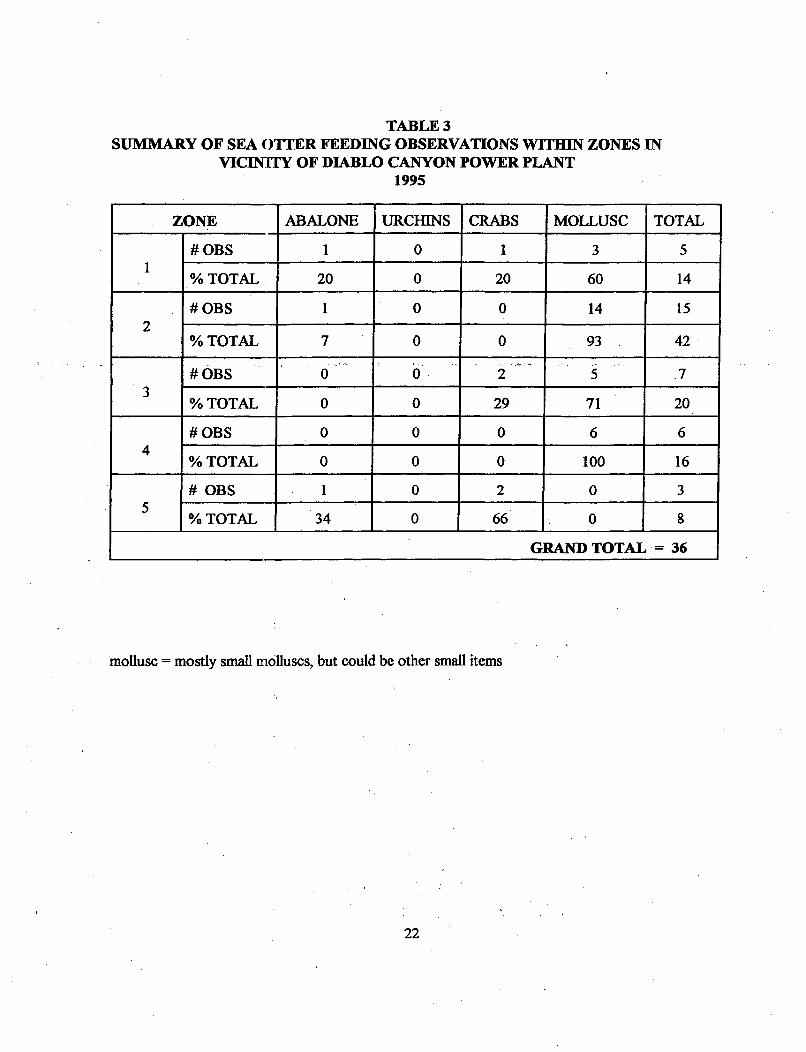
TABLE 3SUMMARY OF SEA OTTER FEEDING OBSERVATIONS WITHIN ZONES IN
VICINITY OF DIABLO CANYON POWER PLANT1995
ZONE ABALONE URCHINS CRABS MOLLUSC TOTAL
#OBS 1 0 1 3 5
% TOTAL 20 0 20 60 14
# OBS 1 0 0 14 152
% TOTAL 7 0 0 93 42
#0BS 0 0 2 5 .73
% TOTAL 0 0 29 71 20
# OBS 0 0 0 6 64
% TOTAL 0 0 0 100 16
# OBS 1 0 2 0 35
% TOTAL 34 0 66 0 8
GRAND TOTAL = 36
mollusc = mostly small molluscs, but could be other small items
22
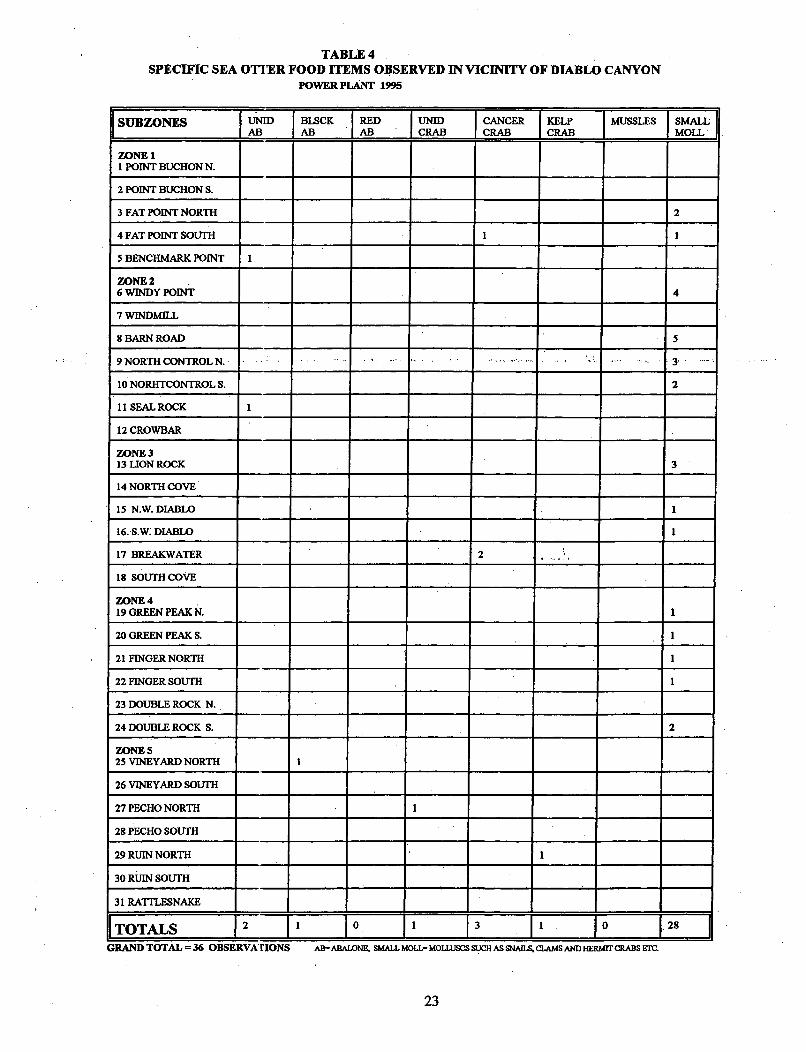
TABLE 4SPECIFIC SEA OTITER FOOD ITEMS OBSERVED IN VICINITY OF DIABLO CANYON
POWER PLANT 1995
SUBZONES UNTD BLSCK RED UNID CANCER KELP MUSSLES SMALL_lAB JAB AB CRAB CRAB CRAB MOLL
ZONE II POINT BUCHON N.
2 POINT BUCHON S.
3 FAT POINT NORTH 2
4 FAT POINT SOUTH 1
5 BENCHMARK POINT I
ZONE 26 WINDY POINT 4
7 WINDMILL
8 BARN ROAD 5
9 NORTH CONTROL N. 3. " ..
10 NORHTCONTROL S. 2
11 SEAL ROCK 1
12 CROWBAR
ZONE 313 LION ROCK 3
14 NORTH COVE
15 N.W. DIABLO 1
16. S.W. DIABLO 1
17 BREAKWATER 12
18 SOUTH COVE
ZONE 419 GREEN PEAK N. 1
20 GREEN PEAK S. 1
21 FINGER NORTH 1
22 FINGER SOUTH 1
23 DOUBLE ROCK N.
24 DOUBLE ROCK S. 2
ZONE 525 VINEYARD NORTH 1
26 VINEYARD SOUTH
27 PECHO NORTH
28 PECHO SOUTH
29 RUIN NORTH
30 RUIN SOUTH
31 RATTLESNAKE
TOTALS 12 1 1 0 11 3 =1 O 0 2
GRAND TOTAL = 36 OBSERVATIONS AB= ABALONF SMALL MOLL= MO.J.SCS SUCH AS SNAILS CLAMS AND HERMITrCR.BS E.
23
6 0 . ................. ........................ . ....... . .. . . . . ................... . . . . . . .... . . . . .
4 0 . ................ ....... .............. ........................ ........................ ........... ...
2 0 • .-.. . .. . . . . . . . . . . . . . .. . . . . . .. . . . . . . . . . . . . ................ . . . .
60a
1 2 3 4 5ZONES
FIGURE 8FOOD ITEMS OBSERVED IN SEA OTTER DIETS IN VICINITY OF DIABLO CANYON POWER PLANT
1995
24
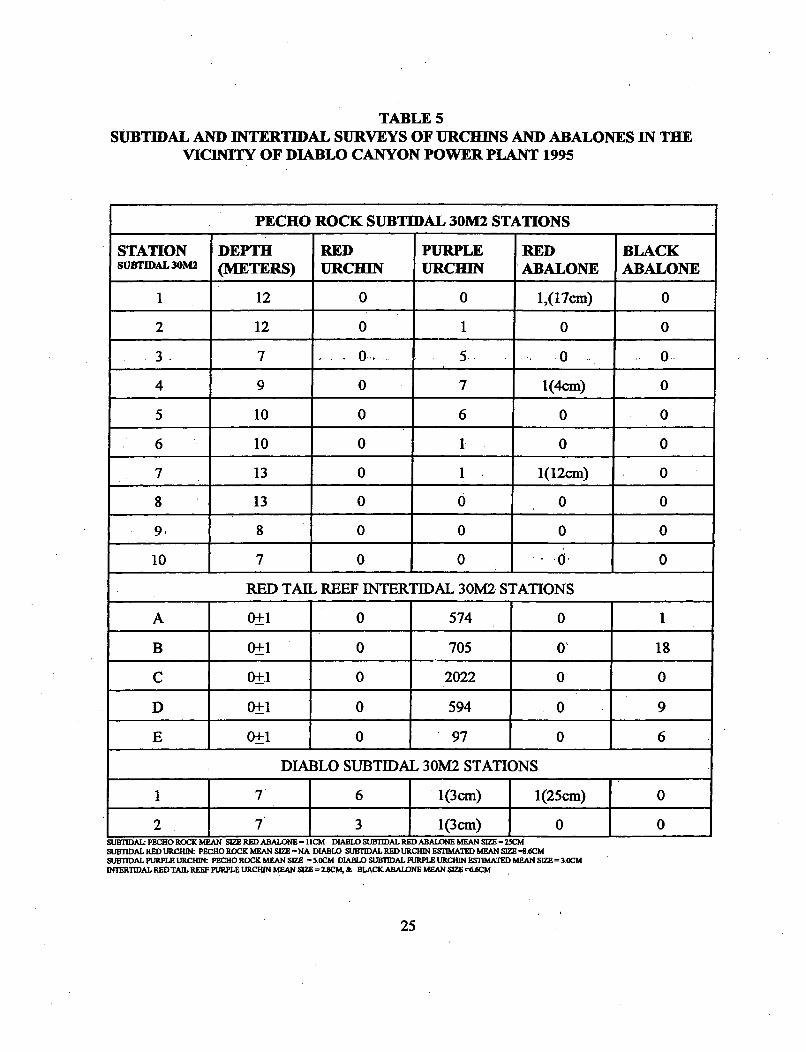
TABLE 5SUBTIDAL AND INTERTIDAL SURVEYS OF URCHINS AND ABALONES IN THE
VICINITY OF DIABLO CANYON POWER PLANT 1995
PECHO ROCK SUBTIDAL 30M2 STATIONS
STATION DEPTH RED PURPLE RED BLACKSUTMAL3OM2 (METERS) URCHIN URCHIN ABALONE ABALONE
1 12 0 0 1,(17cm) 0
2 12 0 1 0 0
S3- ý7 . 0. 5. .0 0.
4 9 0 7 1(4cm) 0
5 10 0 6 0 0
6 10 0 1 0 0
7 13 0 1 1(12cm) 0
8 13 0 0 0 0
9, 8 0 0 0 0
10 7 0 0 0. 0
RED TAIL REEF INTERTIDAL 30M2 STATIONS
A 0+1 0 574 0 1
B 0+1 0 705 0 18
C 0+1l 0 2022 0 0
D 0+1 0 594 0 9
E 0+1 0 97 0 6
DIABLO SUBTIDAL 30M2 STATIONS
1 T 6 1(3cm) 1(25cm) 0
2 7 3 1(3cm) o oSUrIDAL: PECHO ROCK MEAN SIEREDABAWONE =IICM DIABLO SUBIAL RED ABALONE MEAN SIZE -25CMSUJTIDAL RED URCHIN: PECHO ROCK MEAN SIZE -NA DIABLO SUBTIDAL RED URCHIN ESTIMATED MEAN SIZE =8.6CMSUBTIDAL PURPLE URCHIN: PECHO ROCK MEAN SIZE = 5.0CM DIABLO SUBIIDAL PURPLE URCHIN ESTIMATED MEAN SIE = 3.0CMINTERTIDAL REDTAIL REEF PURPLE URCHIN MEAN SIZE -2.8CM, & BLACK ABALONE MEAN SIM =6.6CM
25
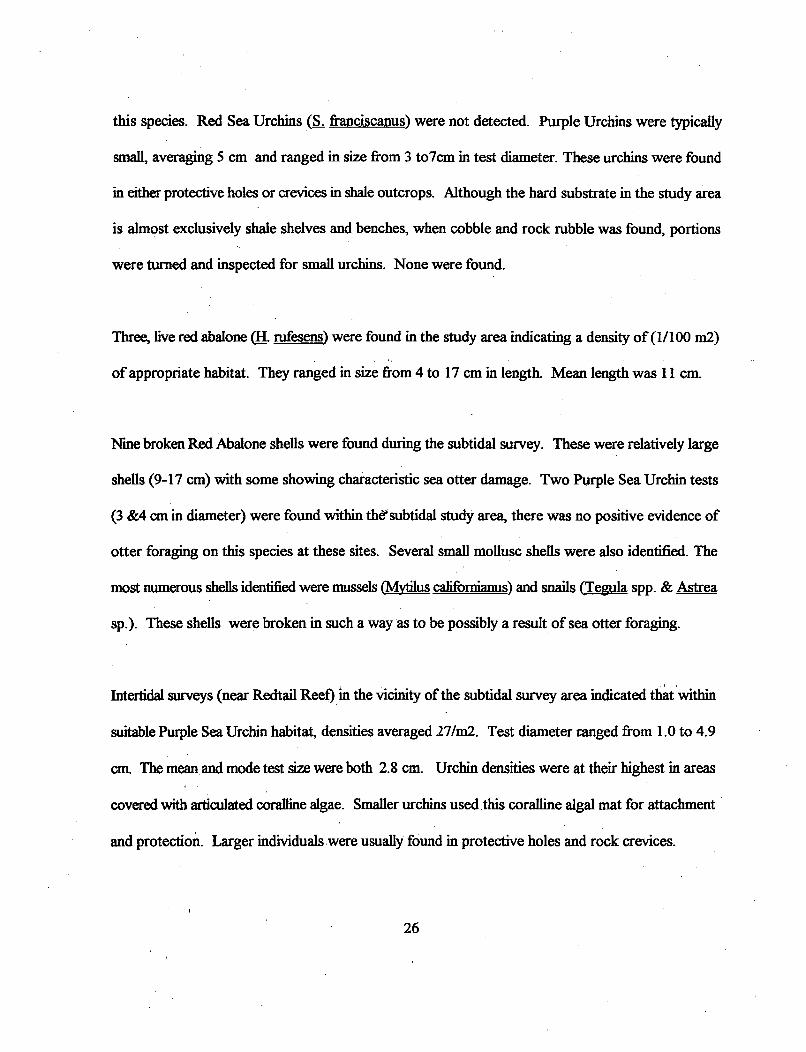
this species. Red Sea Urchins (a. franciscanus) were not detected. Purple Urchins were typically
small, averaging 5 cm and ranged in size from 3 to7cm in test diameter. These urchins were found
in either protective holes or crevices in shale outcrops. Although the hard substrate in the study area
is almost exclusively shale shelves and benches, when cobble and rock rubble was found, portions
were turned and inspected for small urchins. None were found.
Three, live red abalone (H_ rufesens) were found in the study area indicating a density of (1/100 m2)
of appropriate habitat. They ranged in size from 4 to 17 cm in length. Mean length was 11 cm.
Nine broken Red Abalone shells were found during the subtidal survey. These were relatively large
shells (9-17 cm) with some showing characteristic sea otter damage. Two Purple Sea Urchin tests
(3 &4 cm in diameter) were found within thd'subtidal study area, there was no positive evidence of
otter foraging on this species at these sites. Several small mollusc shells were also identified. The
most numerous shells identified were mussels (_ytiu califomianus) and snails (Tegul spp. & Astrea
sp.). These shells were broken in such a way as to be possibly a result of sea otter foraging.
Intertidal surveys (near Redtail Reef) in the vicinity of the subtidal survey area indicated that within
suitable Purple Sea Urchin habitat, densities averaged 27/m2. Test diameter ranged from 1.0 to 4.9
cm. The mean and mode test size were both 2.8 cm. Urchin densities were at their highest in areas
covered with articulated coralline algae. Smaller urchins usedthis coralline algal mat for attachment
and protection. Larger individuals were usually found in protective holes and rock crevices.
26
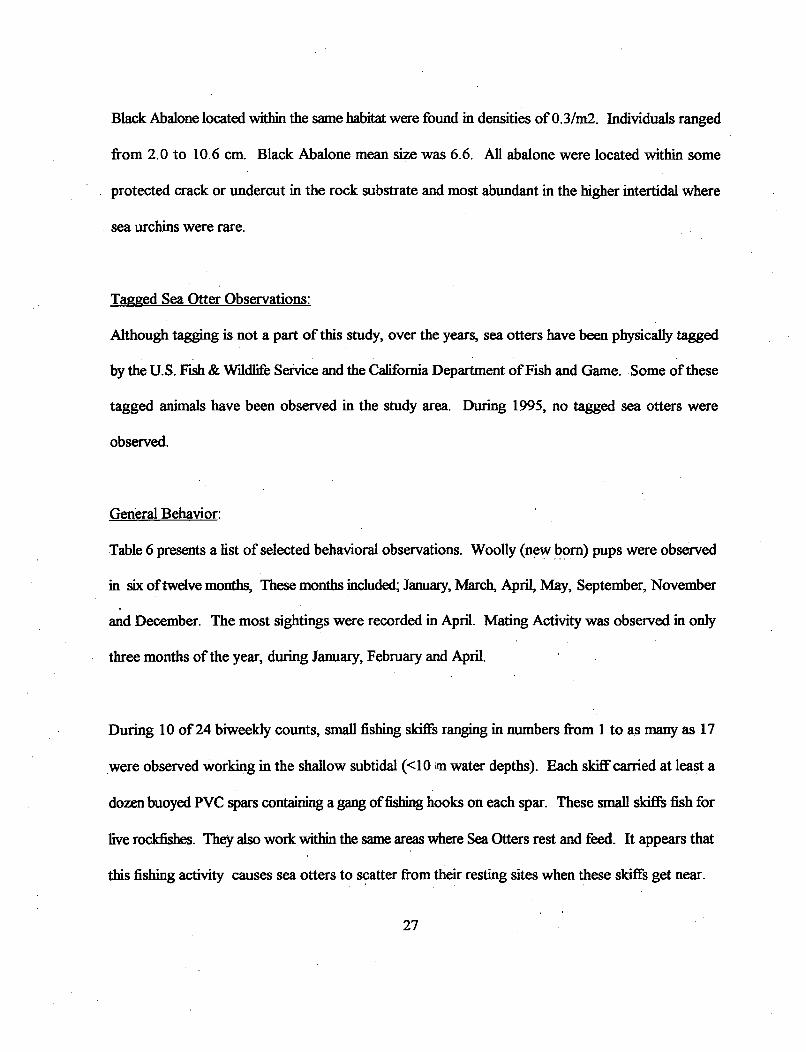
Black Abalone located within the same habitat were found in densities of 0.3/m2. Individuals ranged
from 2.0 to 10.6 cm. Black Abalone mean size was 6.6, All abalone were located within some
protected crack or undercut in the rock substrate and most abundant in the higher intertidal where
sea urchins were rare.
Tagged Sea Otter Observations:
Although tagging is not a part of this study, over the years, sea otters have been physically tagged
by the U.S. Fish & Wildlife Service and the California Department of Fish and Game. Some of these
tagged animals have been observed in the study area. During 1995, no tagged sea otters were
observed.
General Behavior:
Table 6 presents a list of selected behavioral observations. Woolly (new born) pups were observed
in six of twelve months, These months included; January, March, April, May, September, November
and December. The most sightings were recorded in April. Mating Activity was observed in only
three months of the year, during January, February and April.
During 10 of 24 biweekly counts, small fishing skiffs ranging in numbers from 1 to as many as 17
were observed working in the shallow subtidal (<10 m water depths). Each skiff carried at least a
dozen buoyed PVC spars containing a gang of fishing hooks on each spar. These small skiffs fish for
live rockfishes. They also work within the same areas where Sea Otters rest and feed. It appears that
this fishing activity causes sea otters to scatter from their resting sites when these skiffs get near.
27
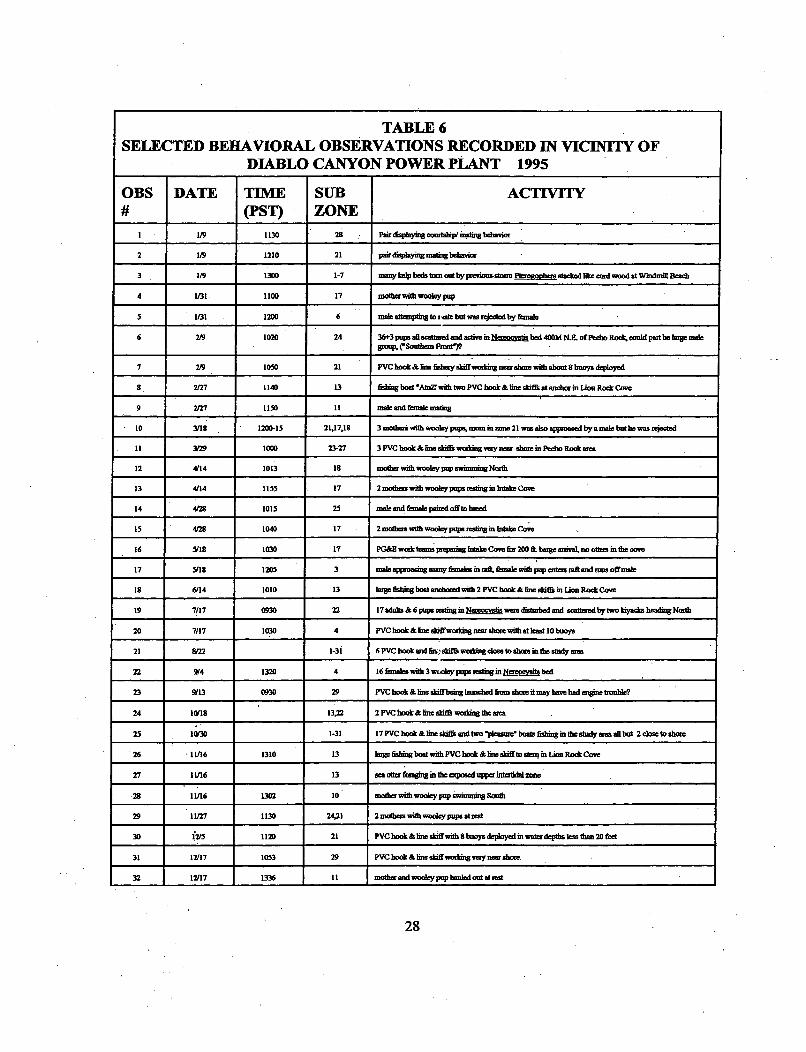
TABLE 6SELECTED BEHAVIORAL OBSERVATIONS RECORDED IN VICINITY OF
DIABLO CANYON POWER PLANT 1995
OBS DATE TIME SUB ACTIVITY# (PST) ZONE
I I 1130 28 Panphlymcgos imrtsp mpting behaviar
2 1/9 1210 21 pair di&lynmgmating behav
3 1I9 1300 1-7 many kalp beds ton out by previoonstoam Pte r stacked like cord wood at Windmill Beach
4 1/31 1100 17 mothe with wooley pup
5 i/31 .1200 6 madeattmnpting to rae but was rejected byfmnale
6 2/9 1020 24 36+3 pup all scattered and active in beromms bed 400M N.E. of Pecho Rock could part be lage maleWout (loSdhermn Fr-dt9
7 219 1050 21 PVC hook &boan fishery skiffmwilin neaw shore with about8 buoys deployed
S. 2127 1140 13 fising boat -AWo with two PVC hook & lie siffs at anchor•in Lao Rock Cove
9 2/=7 1150 11 male and G- leoaming
10 3218 1200-15 21,17,18 3 mothers with woot-y puops morm in zone 21 was also oppoaced by a male but he was rejected
I 3/29 1000 23-27 3 PVC hook & linem skfi wcrking vynear shore in Pedro Rockl e
12 4/14 1013 18 mothr with wooley pup wimming North
13 4/14 1155 17 2 monrti with wooley pps reing in hIlake Cove
14 4V28 1015 25 male and femle paired offto)breed
is 4/28 1040 17 2 mother with wooly pups railing in Intake Cove
16 5/18 1030 17 PG&E week teams aeparing Intake Cove fa 200 ft bage anival, no Ottes i nthe oe
17 5(18 1205 3 amle aptaacog miny feolm in ra. iette with pup mms raft and runs offmale
18 6/14 1010 13 large filng boat andched with 2 PVC hook & lme nthd& in Lioa RogoCove
19 7/17 0930 22 17 adull & 6 pupa tesling in N ocystis were d and scattered by two kiyader heading North
20 7/17 1030 4 PVC hook & line kiffwatkin near shore with atleast 10 buoys
21 8/22 1-31 6 PVC book and lImi skiffs working close to sha•be bthe stndy •m
22 9/4 1320 4 16 fekals with 3 w ley pups resting•in 1ec bed
23 9/13 0930 29 PVC hook & line s•kffbeing launched fiom shaore it may have had engine trouble?
24 1/18 13,22 2 PVC hook & line skifi working the ame
25 Ir30 1-31 17 PVC hook &line skiffa and two 'pleasure boets fsingin the stady am Al but 2 close to shoae
26 .11/16 1310 13 large fishng boat with PVC hook & line skiffta, st" sin Lm Rock Cove
27 11016 13 sea otter foraging in the epiposed upp ner zmte
28 11/16 1302 10 motha with wooley pup swi ing South
29 11/27 1130 24,21 2 moths wih wooley pups at ret
30 13/5 1120 21 PVC hook & line daffwitl 8 kuoys depklyed in wate depth. les than 20 fde
31 12/17 1053 29 PVC hook &fin• kiffworknverrynearshore
32 12117 1336 I1 motha and woac pup haled out at rest
28
During May 1995, PG&E delivered three large electric transformers to the Diablo Canyon Power
Plant site via barge. This 200 ft. barge was off-loaded within the Intake Cove. This operation
represented a significant increase and change in activity within the cove. The Intake Cove has
historically been and presently is used by sea otters as a place in which to rest, groom and feed.
Typically, use is highest during the spring when strong winds commonly occur. Spring is also when
dependent pups are highest in number. Mothers with small pups find protection from strong wind
and sea conditions within the Intake Cove. Human activity is on-going at this site and the Sea Otters
have become accustom to "normal" daily activity. Observations made just prior to any increase of
activity within the cove indicated nighttime use reached a level of 22 and 10 pups and mid-morning
use was 11 and,5 pups (Appendix 1). During barge operations both daytime and nighttime use of the
cove dropped by about 50%. During specific activities such as barge departure the cove was
temporarily abandoned. Abandonment was could be measured in minutes however. The Sea Otters
that chose to remain within the cove did not appear to be disturbed by the increase in activity. Within
two weeks of resumption of "normal" activities Sea Otter numbers were once again back to normal
for the season. It is of interest to note that many of the individuals that chose to stay in the cove were
mothers with pups.
Sea otter haul out behavior was observed on nine sepanrte occasions at four different sites concurrent
with the 24 counts conducted in 1995 (Table 7). This represents an estimated 38% frequency of
occurrence in the study area. This behavior was observed at four different sites in Zones 2&4 in
January and then from April through June and then again in December. The numbers of animals at
29
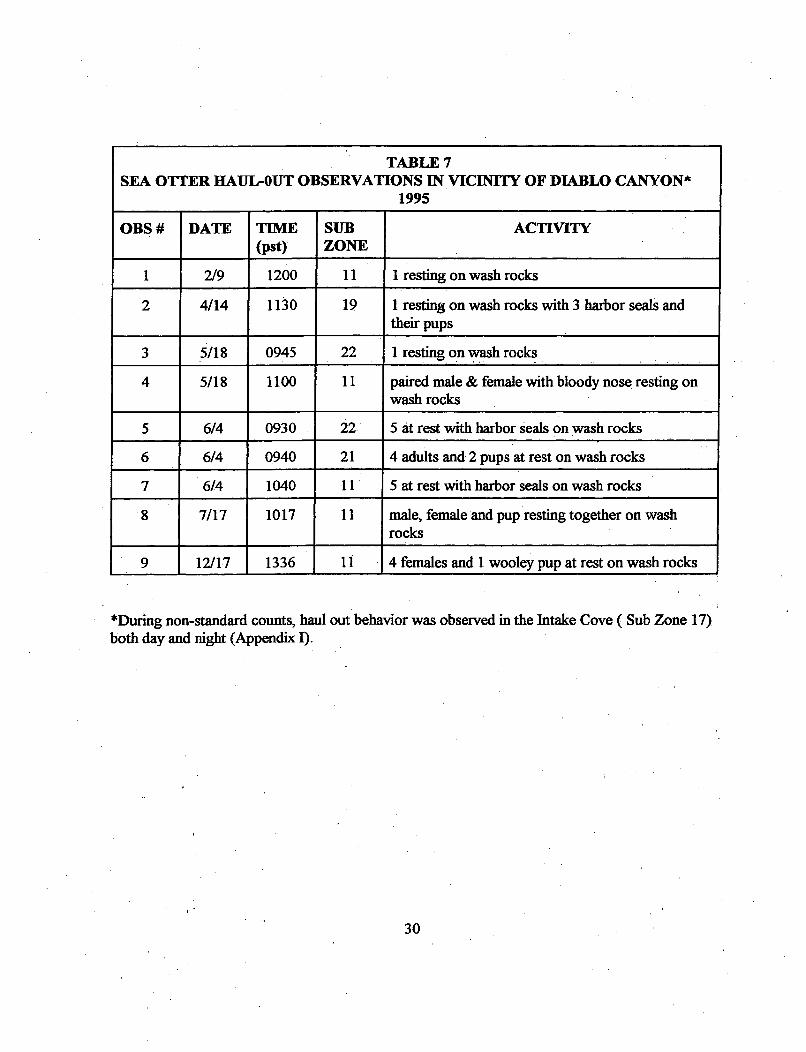
TABLE 7SEA OTTER HAUL-0UT OBSERVATIONS IN VICINITY OF DLABLO CANYON*
1995
OBS # DATE TIME SUB ACTIVITY(pst) ZONE
1 2/9 1200 11 1 resting on wash rocks
2 4/14 1130 19 1 resting on wash rocks with 3 harbor seals andtheir pups
3 5/18 0945 22 1 resting on wash rocks
4 5/18 1100 11 paired male & female with bloody nose resting onwash rocks
5 6/4 0930 22 5 at rest with harbor seals on wash rocks
6 6/4 0940 21 4 adults and 2 pups at rest on wash rocks
7 6/4 1040 11 5 at rest with harbor seals on wash rocks
8 7/17 1017 11 male, female and pup resting together on washrocks
9 12/1-7 1336 11 4 fenales and 1 wooley pup at rest on wash rocks
*During non-standard counts, haul out behavior was observed in the Intake Cove ( Sub Zone 17)both day and night (Appendix 1).
30
each site ranged from 1-5 and included males, females and pups. The most consistently used haul out
site this year was Seal Rock in Zone 2 (Sub Zone 11).
Sea otters hauled out on low relief wash rocks that were exposed at low tide. In addition, the haul
out rocks are generally located in moderately to highly protected sites that are also used by harbor
seals. While the sea otters were hauled out, resting and occasional grooming were the primary
activities. Animals were hauled out individually or in small groups. The most popular haul out site
was Seal Rock. This site is north of Diablo Canyon Power Plant, near Lion Rock Cove, and
historically, is one of the most preferred intertidal resting areas within the entire study area. Seal
Rock is not only a large protected wash rock, with limited human disturbance, it is also located in an
area of high sea otter density which may account for its' popularity.
DISCUSSION
Population Size:
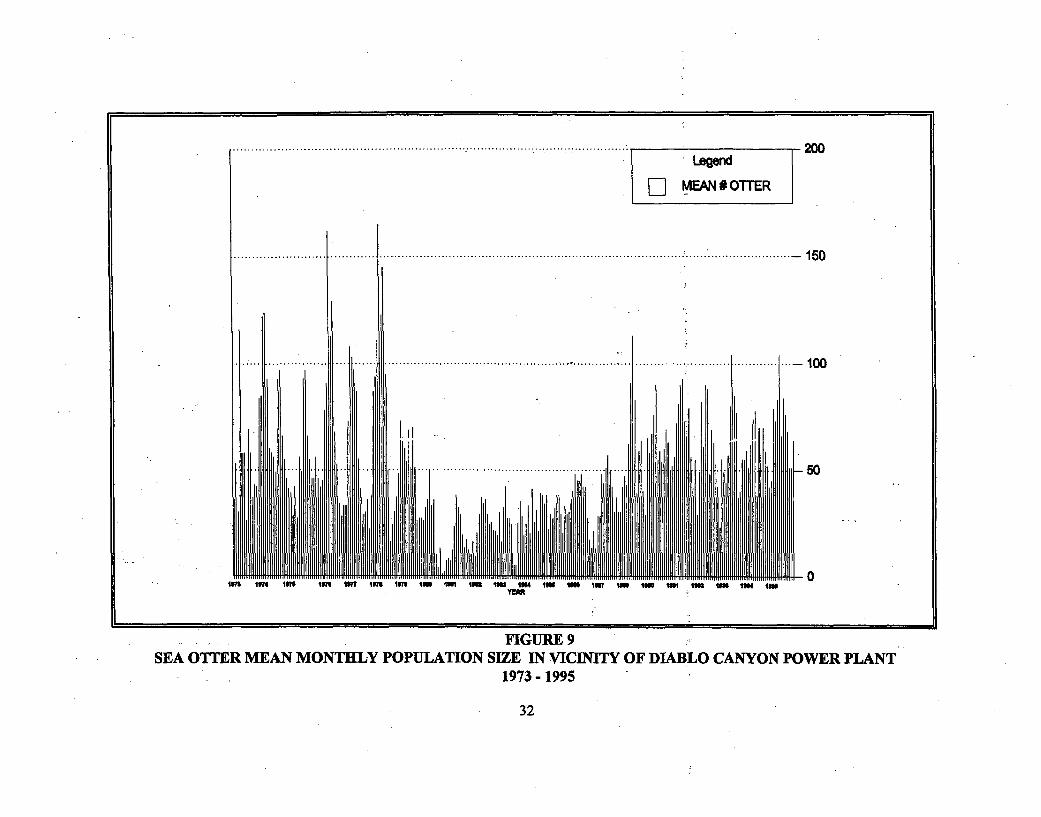
Mean population size increased by 15% to 70 in contrast to recent years where "mean" size remained
a stable 60 animals. When sea otters first occupied the study area (1973-1979) there was a basic
"core" (mean) population of about 62 predominantly male animals with seasonal spikes of near double
the numbers in the winter and spring (Figure 9). After the departure of the male "front", in the spring
of 1979, the "core" population dropped drastically to about 20 animals and then gradually increased
in number. During a nine year period from 1980-1988 the study area population was predominantly
31
Legend
F]MEAN #OTTER
......................... .. ... .. .... ............................................................................... :..............................• 1 5 0
. ............... ...... ....... ......... ............................... ............... ... .......................... ........... . ... - 1 0 0
Ilm IMiff t I• Ntio t mr ISMfl t I m 18o ISMl Ifl 4104 i(ll 11 IM IS lIM ISM 1Il W ISM "
....... FIGURE 9SEA OTTER MEAN MONTHLY POPULATION SIZE IN VICINITY OF DIABLO CANYON POWER PLANT
-1973-1995
32
female with an average or "core" population of only 30 animals. From 1989 to present the resident
or core population has basically stabilized to an average of about 60 animals the majority of which
are female. This year a subtle but detectable increase in core population occurred. State-wide Sea
Otter census detected a simular increase.
The 1995 data indicate the high count was later in the spring (May) than last year, as was also the
seasonal fall low count. The lowest numbers of adult animals in the study area (36) occurred in
January. The 1995 six month average (Spring/Summer) count of 81 was greater and more stable
than last year's six month comparable count of 65. The Fall/Winter mean count of 60 was also, higher
than last year's mean of 55. Both the winter lows and summer highs are becoming less divergent,
supporting the suggestion that the core population Within the study area is reaching some sort of
stability. When compared to the last five years, 1995 monthly population averages indicate that the
overall mean population has increased by about 12%. This increase in population size is also reflected
in the California Sea Otter Population as a whole. A 1995 range-wide census indicated at least an
18% increase in population (Personal Communication Bryan Hatfield, U.S.Dept. Interior).
Any reduction in population size appears to be driven by low sea otter counts during the winter
months when storms batter the coastline. It is possible that many animals temporally depart the
exposed Buchon Headland in favor of more protected areas to the North and South of the study area.
Temporary increases in population size may be in part due to seasonal movements relative to changes
in weather or human activity. It is obvious from the records of sea otters tagged at San Simeon, and
33
Avila Beach, that movement occurs in and out of the Diablo Canyon study area by animals from these
and other sites. Sightings of tagged animals from these areas within the sea otters' present range
suggest that movement of adult animals throughout the range will continue to contribute to periodic
changes in sea otter population size within the study area that are not related to actual increases in
the population as a whole.
Reasons for sea otter long distance movements (in and out of the study area) can be socially and
individually motivated. One example of social motivation to move long distance would be territorial
males running off competing males. These competing males could be those who moved into the area
to challenge an established male or local young males too matue to be tolerated within the female raft.
Examples of individual motivation include; an animal seeking a safer resting site, or better forage
areas. Whatever the reason, sea otters continue to transit in and out of the study area.
Seasonal population "spikes" are also due to a periodic increases in pup production. Although sea
otters are capable of pupping throughout the year, (Riedman et al. 1994) seasonal " pupping peaks"
are the general rule in the study area. Pup to female ratios increase by an'order of magnitude in the
spring and fall. This year, a spring (March) pup population "spike" was apparent. A smaller,
fall/winter, "spike" (Figure 4) in pup production typical of recent years was also present. The
observation of newborn pups in late fall and early winter, indicates pups are also produced at this
time. These pupping peaks also imply an apparent six month gestation period, It appears that If a
female either looses her pup or is not successfully bred she has a second chance in the same year. This
reproductive strategy may be reflected in the second smaller, fal/winter pupping peak that is normally
34
observed each year. An autocorrelation of sea otter population count data determined the existence
of a repeating seasonal pattern (Benech, 1994). Count data were analyzed as a ratio of adults to
dependant pups. The autocorrelations showed significant, repeatable annual patterns. The results
indicate a spring peak in pup numbers relative to adults with a additional but more variable second
peak in the late fall. This analysis also suggests a six month gestation period. This length gestation
period is also indicated when one notes the presents of newborn pups relative to mating activity
(Figure 6). Although like pupping, mating activity occurs throughout the year, there are peaks in the
spring and fall. This also corresponds to increases in male to female ratios at these times. It is of
interest to note that unlike previous years, mating behavior in 1995 was not observed during the fall.
Population Distribution and Composition:
Since 1980, females with dependent pups have been observed throughout the study area. Most of
the populations occurs within zones 1-3. Historically highly occupied, resting locations (Lion Rock,
Windmill, and Barn Road) contain large kelp beds of M The Sea Otter usually wraps itself
in kelp fronds to anchor itself in place. The animal is thus safe to rest without concern of drifting into
dangerous locations. This is probably more important to young, inexperienced animals than for
seasoned adults. The presence of animals in any one resting or raft location this year appear more
variable than in the past. This is probably the combined result of changes in food availability,
atypically harsh weather conditions and human disturbance. As the Near-shore Skiff fishing industry
increases along the coastline, the more frequent the disturbance of Sea Otter resting sites. During
35
a single fall count 17 commercial fishing skiffs were sighted in the study area. During this same time,
Sea Otters were widely scattered. Lion Rock Cove once a resting site to large numbers of animals.
is now less densely occupied. This may be a direct result of the frequent use of this cove as an
anchoring site for a "mother ship" from which nearshore fishing skiffs are deployed.
The use of the immediate Diablo Cove and Intake Cove areas by sea otters is of primary concern to
PG&E when compared to the relative overall distribution of animals in the study area. Intake Cove
is protected by two large breakwaters and since 1978 has traditionally provided the best calm water
conditions for local Sea Otters. Intake Cove, despite continuous human activity, including boat traffic
and kelp cutting, remains frequently occupied by resting otters. A reasonable explanation for this is
that this area provides the best protection from the physical effects of wind and swell anywhere within
the entire study area. Although people work in the vicinity, the Sea Otters are not purposely harassed
and have become relatively accustom to routine power plant activities. Daytime surveys in
conjunction with night surveys show that sea otters use of this area remains relatively constant during
daylight hours and after dark.
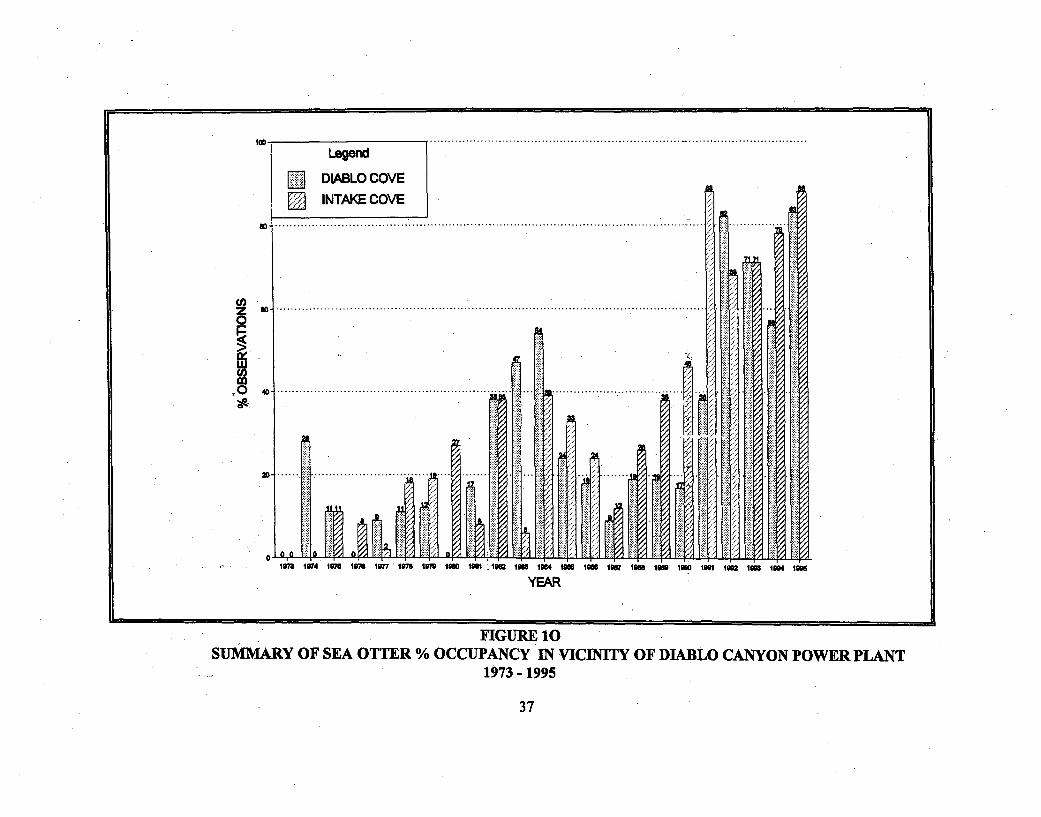
The Intake Cove has traditionally been widely used by Sea Otters as a place in which to rest and feed
(Figure 10). It was first occupied by a "territorial" male from 1975 - 1980. In April of 1980, a small
number (2-3) of females also adopted the area as a resting site. The frequency of occupation varied
widely from 1981 to 1984. This may have been a result of one or more factors including:
1) large waves partially destroying the west breakwater, (The lack of wave protection from the partial
destruction of the breakwater would render it less desirable as a rest area.)
36
..................................................................... .....1W
Legend
[] DIABLO COVE
INTAKE COVE
G0-
U)z0
FIW 4 ...................................................................................................... ...............
40- .......................... .................... ..
............................... ... .......
................... .
j.•,* j- B i•.,.•.rJ i I I I
1973 174 197 1978 197Io 1978 197m 1980 1= 1 190 19 8I
N11094
smAI= IM 1i07 IM81998 1=I0 1991 1902 180 1904 1ý96
FIGURE 10SUMMARY OF SEA OTTER % OCCUPANCY IN VICINITY OF DIABLO CANYON POWER PLANT
1973 - 1995
37
2) the subsequent human activity required to repair it; (The increase in large equipment and
continuous daytime, in the water reconstruction activity, would be perceived as a threat by sea
otters.)
3) this area was a transitional zone between large, predominantly male and female resting areas from
1977-198 1; (transition zones are characteristically sparsely populated).
Although use ofthe Intake Cove was gradually on the increase in the early 1980's, 1984 through 1987
marked an abrupt decrease and continuous low daytime use of the cove. This may have been in large
part due to the increase in human activity in and arou.nd the cove as a result of plant" start-up" of
units one and two and the subsequent removal of favorite kelp beds in the cove in 1985, 86 & 87
respectively. Although human activities continued, Sea Otter use of Intake Cove steadily increased
from 1987 to 1991. By 1992, the percent occupancy dropped by about 25% and the number of users
dropped to nearly 1/2. Last year sea otter occupancy data indicated a slight increase. This year
frequency of use equalled the 1991 all time high of 86%. The cove was used both day and night by
males, females and pups. Night observations indicate that at least during the spring, the cove is
always occupied (Appendix 1). The maximum recorded number of animals using the cove at any one
time this year during normal mid-morning counts was 16. Night-time use was greater (22 adults &
10 pups). Use of the Cove was at its' highest during the spring months. This can best be explained
by the fact that in the spring months, strong winds are typical. Mothers with small dependant pupsI
can find some of the best protection from this weather pattern within the Intake Cove.
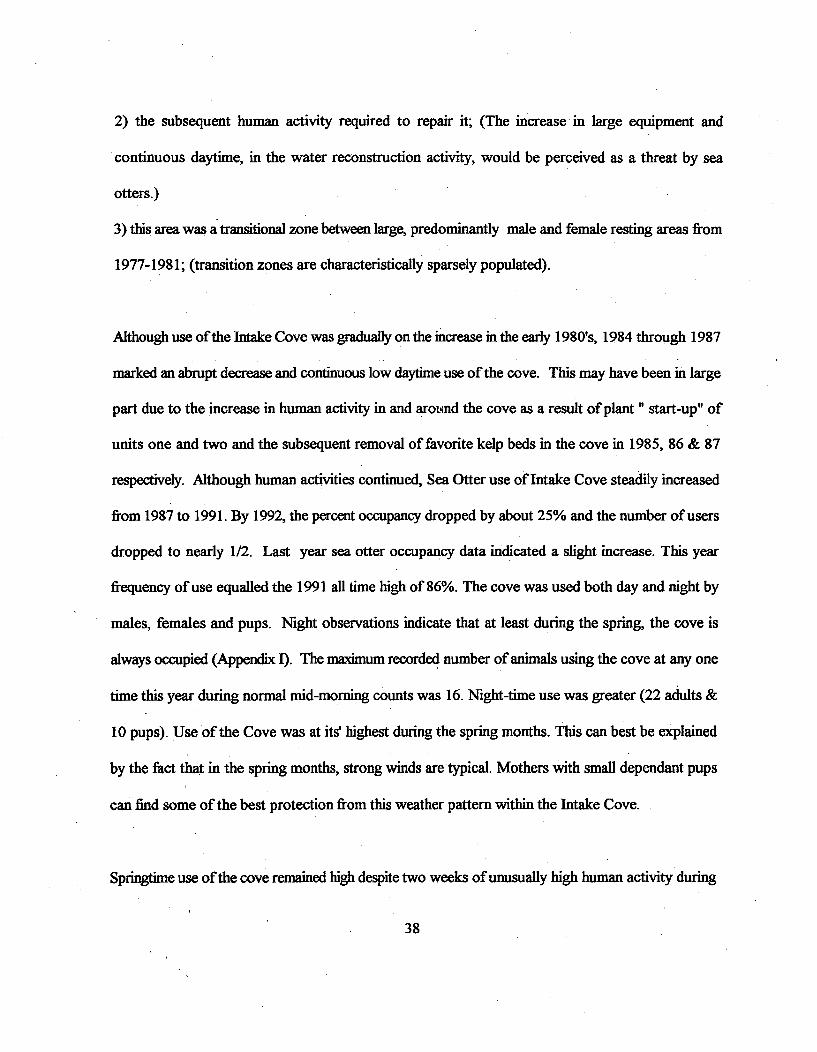
Springtime use of the cove remained high despite two weeks of unusually high human activity during
38
a barge delivery in the cove. The frequency of use was only changed on a very short temporal scale
(minutes to hours) and specifically related to unusual on-going activities. Numerical use of the cove
was changed on a somewhat longer temporal scale (days) where the number of individuals was
reduced by half the normal springtime numbers. Within two weeks of termination of this unusually
intense activity, numbers of animals using the cove returned to normal (Appendix I).
It is expected that similar changes in Sea Otter frequency and numbers of use of a specific resting site
would result from disturbance by the "skiff fishing fleet". Specifically, most would leave the area
while the skiff was present and then return shortly after the perceived threat was gone. However it
is also expected, many animals would leave for longer periods until either the perceived threat was
gone ( as observed in the Intake Cove in May - June 1995) or the activity was no longer seen as a
threat. If the threat goes away the recovery time is of a much shorter temporal scale (days). It may
take months or even years to adjust to the activity and no longer perceived it as threatening.
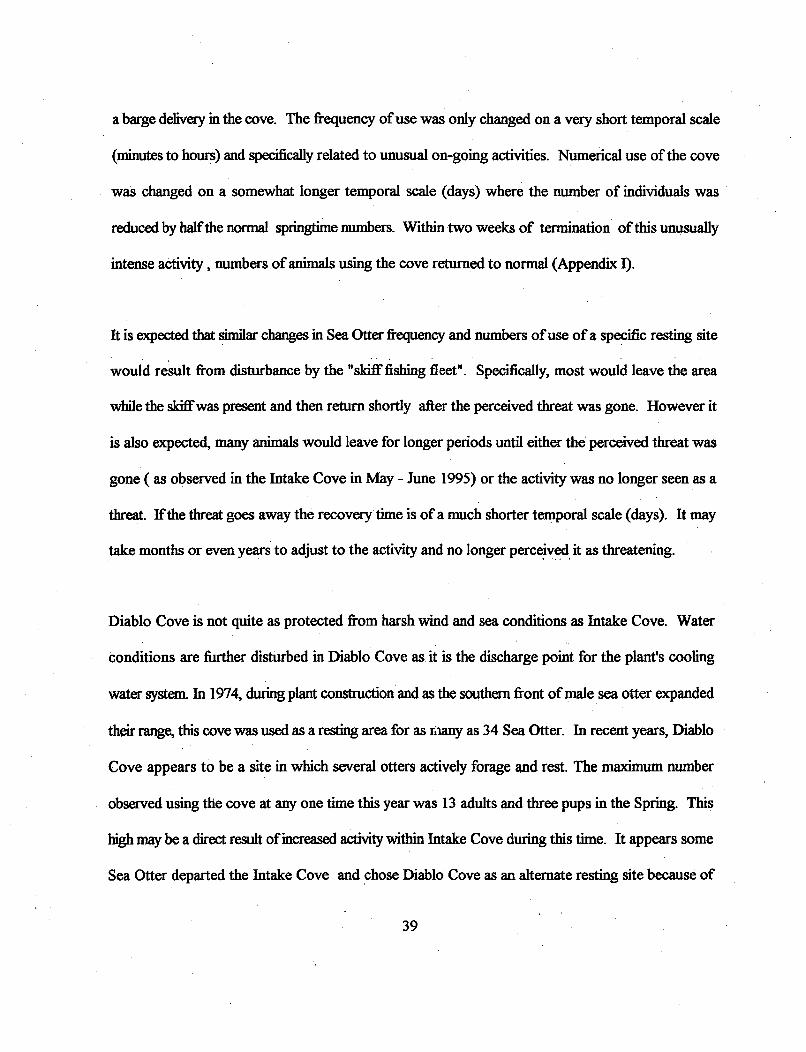
Diablo Cove is not quite as protected from harsh wind and sea conditions as Intake Cove. Water
conditions are further disturbed in Diablo Cove as it is the discharge point for the plant's cooling
water system. In 1974, during plant construction and as the southern front of male sea otter expanded
their range, this cove was used as a resting area for as raany as 34 Sea Otter. In recent years, Diablo
Cove appears to be a site in which several otters actively forage and rest. The maximum number
observed using the cove at any one time this year was 13 adults and three pups in the Spring. This
high may be a direct result of increased activity within Intake Cove during this time. It appears some
Sea Otter departed the Intake Cove and chose Diablo Cove as an alternate resting site because of
39
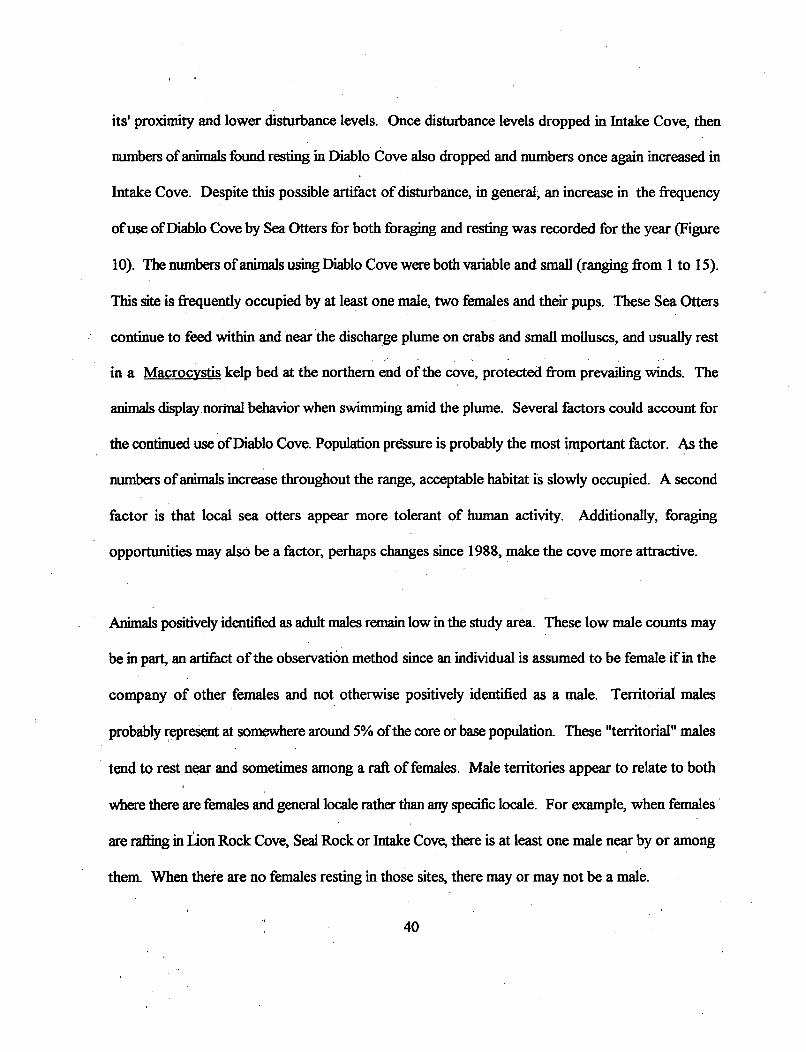
its' proximity and lower disturbance levels. Once disturbance levels dropped in Intake Cove, then
numbers of animals found resting in Diablo Cove also dropped and numbers once again increased in
Intake Cove. Despite this possible artifact of disturbance, in general, an increase in the frequency
of use of Diablo Cove by Sea Otters for both foraging and resting was recorded for the year (Figure
10). The numbers of animals using Diablo Cove were both variable and small (ranging from 1 to 15).
This site is frequently occupied by at least one male, two females and their pups. These Sea Otters
continue to feed within and near the discharge plume on crabs and small molluscs, and usually rest
in a Macrocystis kelp bed at the northern end of the cove, protected from prevailing winds. The
animals display normal behavior when swimming amid the plume. Several factors could account for
the continued use of Diablo Cove. Population pressure is probably the most important factor. As the
numbers of animals increase throughout the range, acceptable habitat is slowly occupied. A second
factor is that local sea otters appear more tolerant of human activity. Additionally, foraging
opportunities may also be a factor, perhaps changes since 1988, make the cove more attractive.
Animals positively identified as adult males remain low in the study area. These low male counts may
be in part, an artifact of the observation method since an individual is assumed to be female if in the
company of other females and not otherwise positively identified as a male. Territorial males
probably represent at somewhere around 5% of the core or base population. These "territorial" males
tend to rest near and sometimes among a raft of females. Male territories appear to relate to both
where there are females and general locale rather than any specific locale. For example, when females
are rafting in Lion Rock Cove, Seal Rock or Intake Cove, there is at least one male near by or among
them. When there are no females resting in those sites, there may or may not be a male.
40
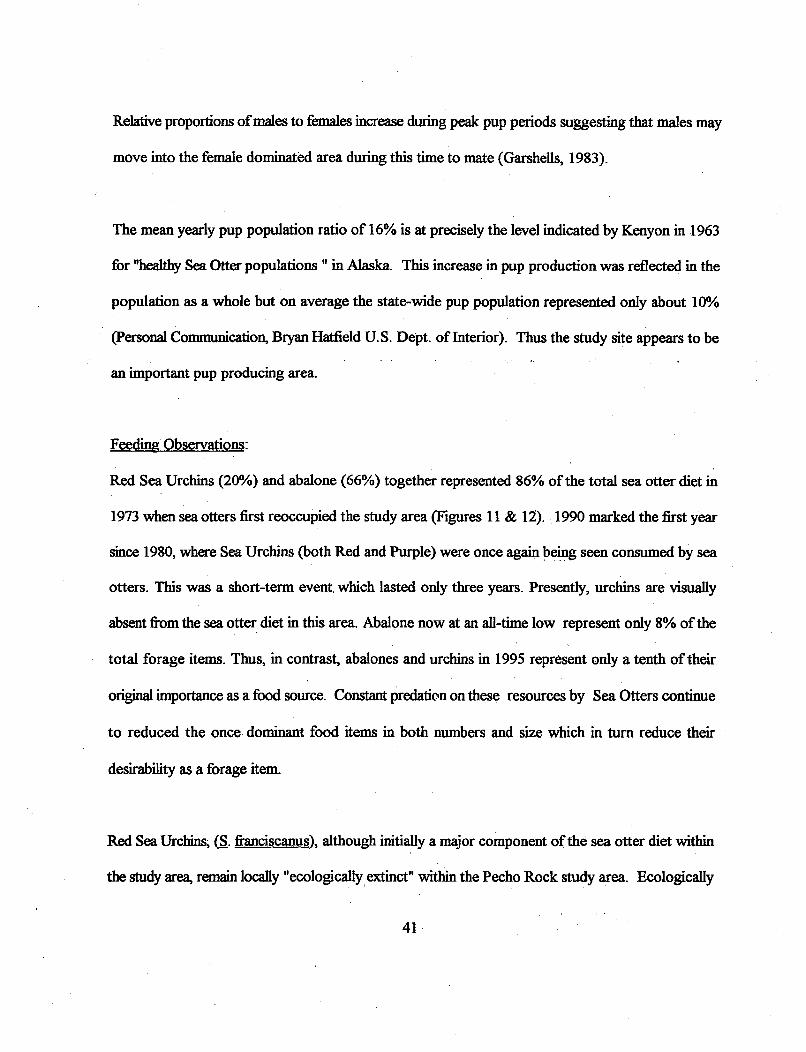
Relative proportions of males to females increase during peak pup periods suggesting that males may
move into the female dominated area during this time to mate (Garshells, 1983).
The mean yearly pup population ratio of 16% is at precisely the level indicated by Kenyon in 1963
for "healthy Sea Otter populations " in Alaska. This increase in pup production was reflected in the
population as a whole but on average the state-wide pup population represented only about 10%
(Personal Communication, Bryan Hatfield U.S. Dept. of Interior). Thus the study site appears to be
an important pup producing area.
Feeding Observations:
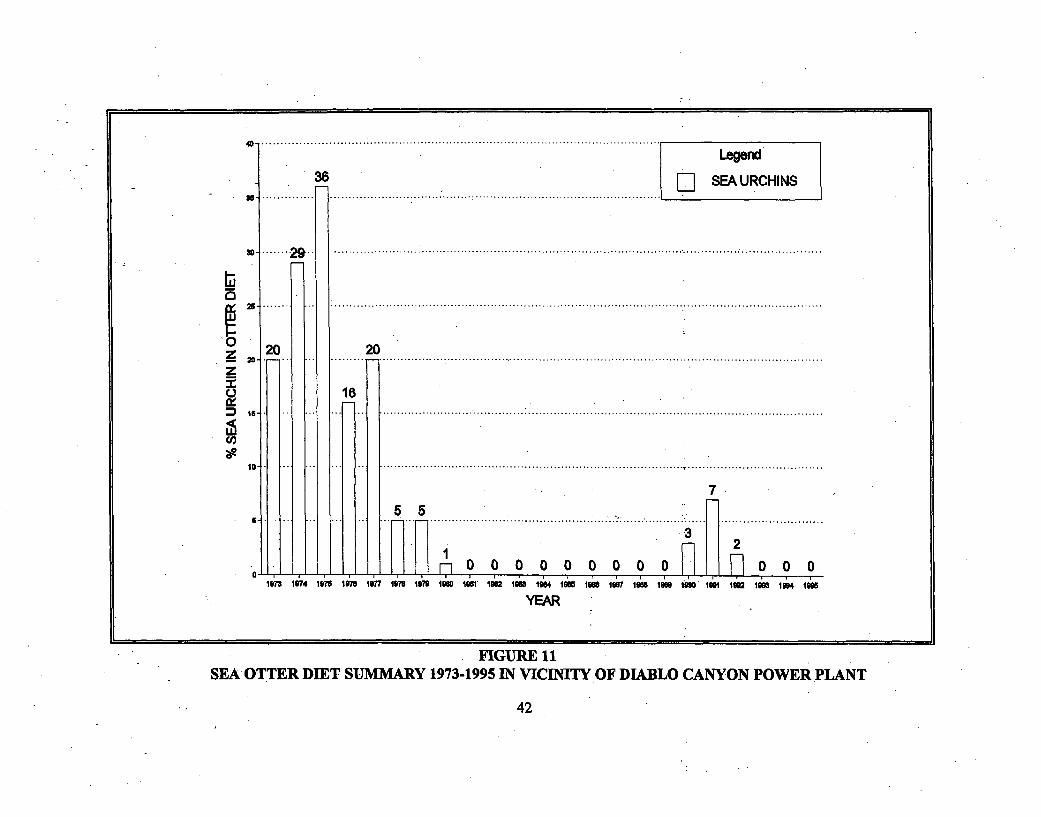
Red Sea Urchins (20%) and abalone (66%) together represented 86% of the total sea otter diet in
1973 when sea otters first reoccupied the study area (Figures 11 & 12). 1990 marked the first year
since 1980, where Sea Urchins (both Red and Purple) were once again being seen consumed by sea
otters. This was a short-term event, which lasted only three years. Presently, urchins are visually
absent from the sea otter diet in this area. Abalone now at an all-time low represent only 8% of the
total forage items. Thus, in contrast, abalones and urchins in 1995 represent only a tenth of their
original importance as a food source. Constant predation on these resources by Sea Otters continue
to reduced the once dominant food items in both numbers and size which in turn reduce their
desirability as a forage item.
Red Sea Urchins, (S. franciscanus), although initially a major component of the sea otter diet within
the study area, remain locally "ecologically extinct" within the Pecho Rock study area. Ecologically
41
4 0. . . . . . . . . . . . . . . . . . . . . ,*. . . - . .* - * . . .*. . .*. . . .*. . I .............
36 F.-I..............SEA URCHINSNJ ...............
0z 2z
l.,
......... 29-
20 20.
16I.
10-
5-
7
ý3
00 0 0 0 0 0 0 0 ol~ 0 0oL• - . . - . . - . . - . . - .
17 1974 16 107 1077 1M 8 1070 100 181 106 109 184 1ý0 18 187 106 106 0 1ND 0 10 100 190I 104 1I'm
YEAR
FIGURE 11SEA OTTER DIET SUMMARY 1973-1995 IN VICINITY OF DIABLO CANYON POWER PLANT
42
IDI86 Legend
ABALONES
5755 54
44
42
0 36 36Z , 33
OD ........................"2......................... X%:. . .. . .. .. ... . .. .. ... ., -,o.. .... ............. .. -...1 ....... .. ... .. ..... ... ........i29' ... .
14
M73 1974 197M 1976 1977 1978 1979 I1M 0 161 1M 6 198 1984 IM 19 1950 1? 8 1989 190 191 i 1= 1904 198
YEAR
FIGURE 12SEA OTTER DIET SUMMARY 1973 - 1995 IN VICINITY OF DIABLO CANYON POWER PLANT
43
extinct, by definition is " the reduction of a species to such low abundance that, although it is still
present in the community, it no longer interacts significantly with other species" (Estes et al., 1989).
Figure 11 indicates virtually no urchins were observed being consumed from 1980 to 1990. Then
3% of the observed food items were urchins in 1990, 7% in 1991, 2% in 1992. Once again urchins
have been absent in diet observations for three years. It is important to note that the urchins that were
observed being eaten were almost exclusively Purple Urchins (S. pupuratus). Only one of three
separate sightings were Red Urchins in 1991. The urchin observed being eaten in 1992, was so small
it could not be identified to species. The adult Purple Urchin is commonly only half the size of a full
grown Red Urchin and thus, with only 1/8 the volume of edible parts, thus less desirable. Other
studies indicate that sea urchins 2.5 cm or less in size are not targeted as a food source (Estes et al
1988) strengthening the above argument. It is probable that the Red Sea Urchin will continue to be
rare or absent from the sea otter diet within the study area because the Purple Urchin appears to out
compete it in recruitment.
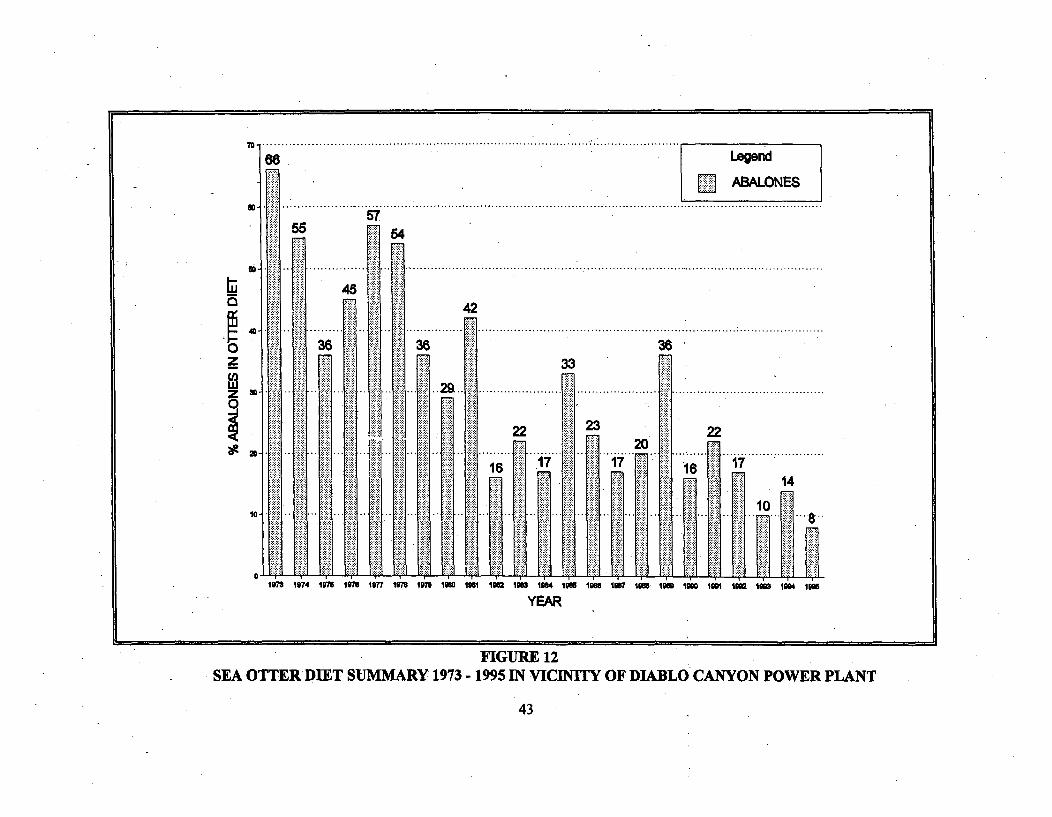
Abalone consumption has declined from a high of 66% (% of total diet) in 1973 when sea otters first
reoccupied the area to an all-time low of 8% this year (Figure 12). This 'general decline was never
steady but one typified by occasional peaks. These peaks may reflect otter movements through the
study area with concurrent changes in foraging area. Subtidal surveys indicate that both the number
and mean size of this food source has decreased, thus reducing its' desirability and availability.
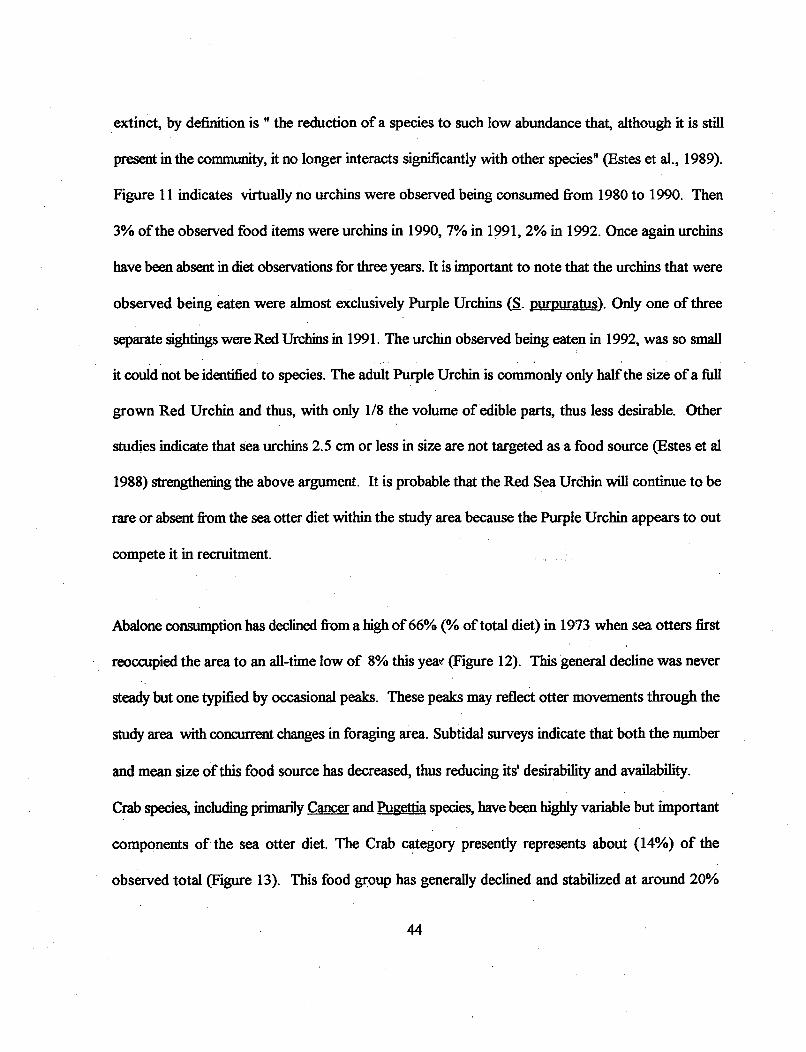
Crab species, including primarily Cancer and P species, have been highly variable but important
components of the sea otter diet. The Crab category presently represents about (14%) of the
observed total (Figure 13). This food group has generally declined and stabilized at around 20%
44
_7.... .... .... ............................................ iii...•.. ..-. ............. ... 2 9 .. .. ....ii .................................... 2 ..2 g ........
>43 43
o i~ i•ii 26
0iiii 40iii, .iii, ...................................7 .. ............ ili..... .. .. .. ..... .... ..i. ... .. ...........i~ l "" ...............1 ... ... ....... ,
* 15116 -iii ii 15 14~i-•32 1
1015
1S"8 t174 175I)7 S t)1 1B77 1978 11)78 1980 t191 1988 198 1884 18886 1988 1867 1988, 198 1860 18le1 1680 t1868 1804 19106
YEAR
FIGURE 13
SEA OTTER DIET SUMMARY 1973 - 1995,IN VICINITY OF DIABLO CANYON POWER PLANT
45
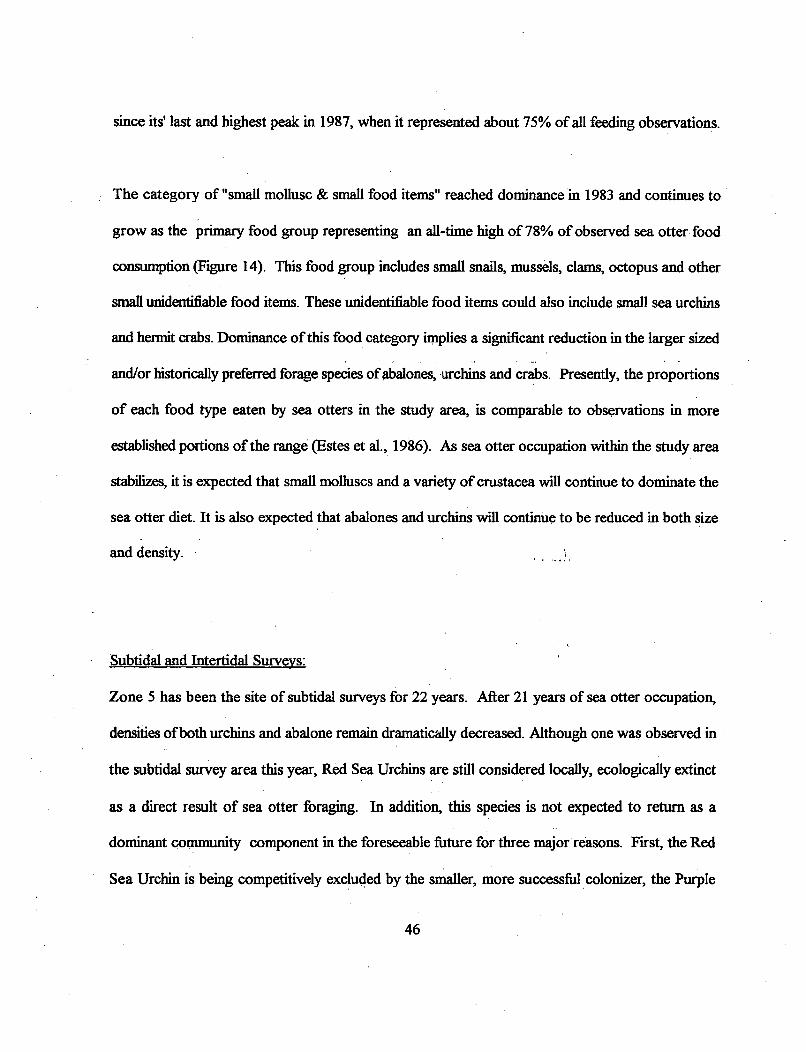
since its' last and highest peak in 1987, when it represented about 75% of all feeding observations.
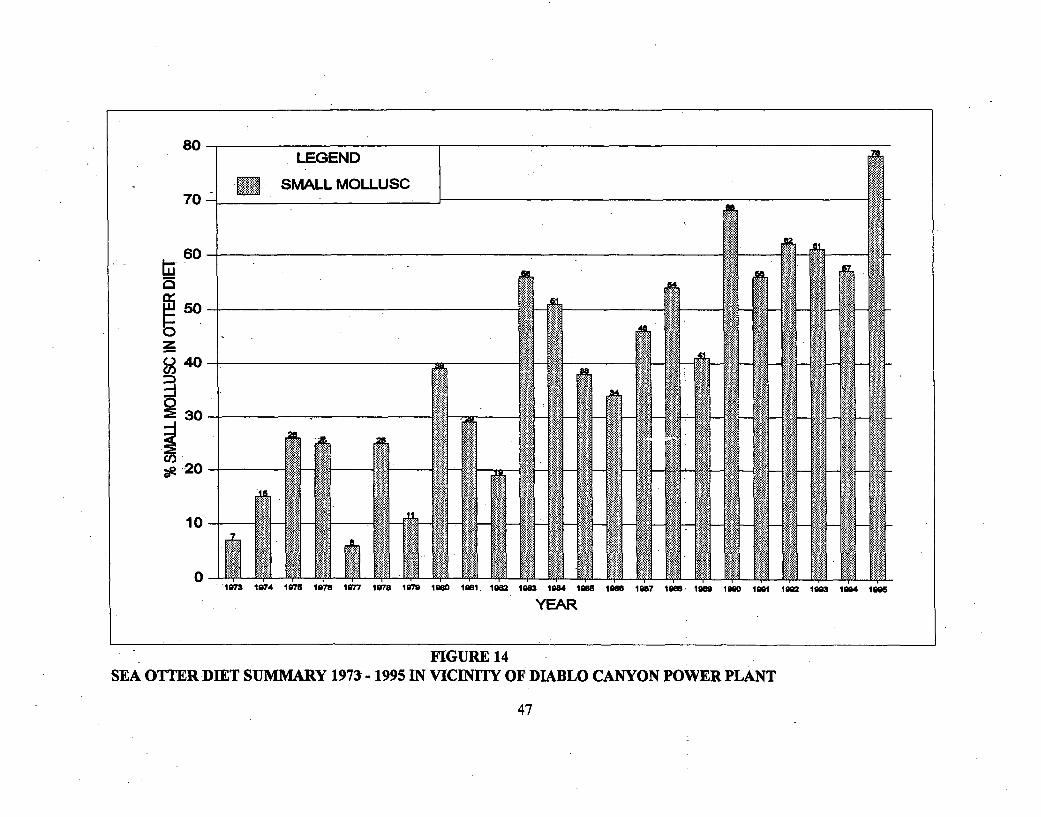
The category of "small mollusc & small food items" reached dominance in 1983 and continues to
grow as the primary food group representing an all-time high of 78% of observed sea otter food
consumption (Figure 14). This food group includes small snails, mussels, clams, octopus and other
small unidentifiable food items. These unidentifiable food items could also include small sea urchins
and hermit crabs. Dominance of this food category implies a significant reduction in the larger sized
and/or historically preferred forage species of abalones, -urchins and crabs. Presently, the proportions
of each food type eaten by sea otters in the study area, is comparable to observations in more
established portions of the range (Estes et al., 1986). As sea otter occupation within the study area
stabilizes, it is expected that small molluscs and a variety of crustacea will continue to dominate the
sea otter diet. It is also expected that abalones and urchins will continue to be reduced in both size
and density.
Subtidal and Intertidal Surveys:
Zone 5 has been the site of subtidal surveys for 22 years. After 21 years of sea otter occupation,
densities of both urchins and abalone remain dramatically decreased. Although one was observed in
the subtidal survey area this year, Red Sea Urchins are still considered locally, ecologically extinct
as a direct result of sea otter foraging. In addition, this species is not expected to return as a
dominant community component in the foreseeable future for three major reasons. First, the Red
Sea Urchin is being competitively excluded by the smaller, more successful colonizer, the Purple
46
80LEGEND
S 70 -] SMALL MOLLUSC
RA
S0
60-50-
40 -1
30-
20-
10-
0in9 1074 175 in 1077 Ion 1979
5.'.
<.4:5'*5
5~534'::
1980 1081
'~~4
'ASn,
3>4:*~ ""34' ...C'
SC 5:35
3-
'<s:,' <.5
*~< C):,:,
ions io& ions
..1'<3. 1
'3
""'3
C".. ~.3<:
3' 34:<3
.4:" .4,
"'.5''C
'~3) ~.S
ions iou ion
44*
'4:4
Ct'
3:.5:
"A
'3
354:' 5".'
.4'C.$
'4:.,
CS'
54:*YC
"4:.
~A34
3-.4-4
'4:''3-
5'
55 <3-C
4 5~4
«5<' 4'.
4:.
C.
53": ~ 5.
.3>.4,:,...
<3." 4..'
5...
iowslg82 lg88
lg87 I• -
Ion iM o 101 o i on lsg3 Is4 I eo
YEAR
FIGURE 14SEA OTTER DIET SUMMARY 1973 - 1995 IN VICINITY OF DIABLO CANYON POWER PLANT
47
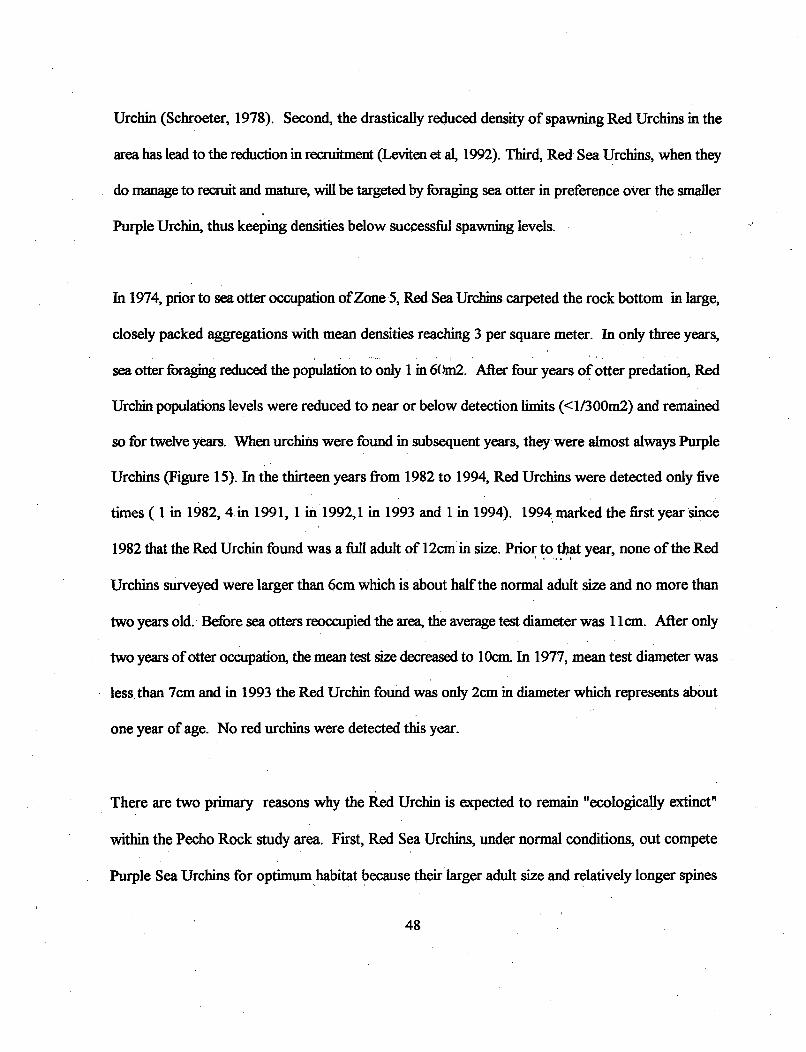
Urchin (Schroeter, 1978). Second, the drastically reduced density of spawning Red Urchins in the
area has lead to the reduction in recruitment (Leviten et al, 1992). Third, Red Sea Urchins, when they
do manage to recruit and mature, will be targeted by foraging sea otter in preference over the smaller
Purple Urchin, thus keeping densities below successful spawning levels.
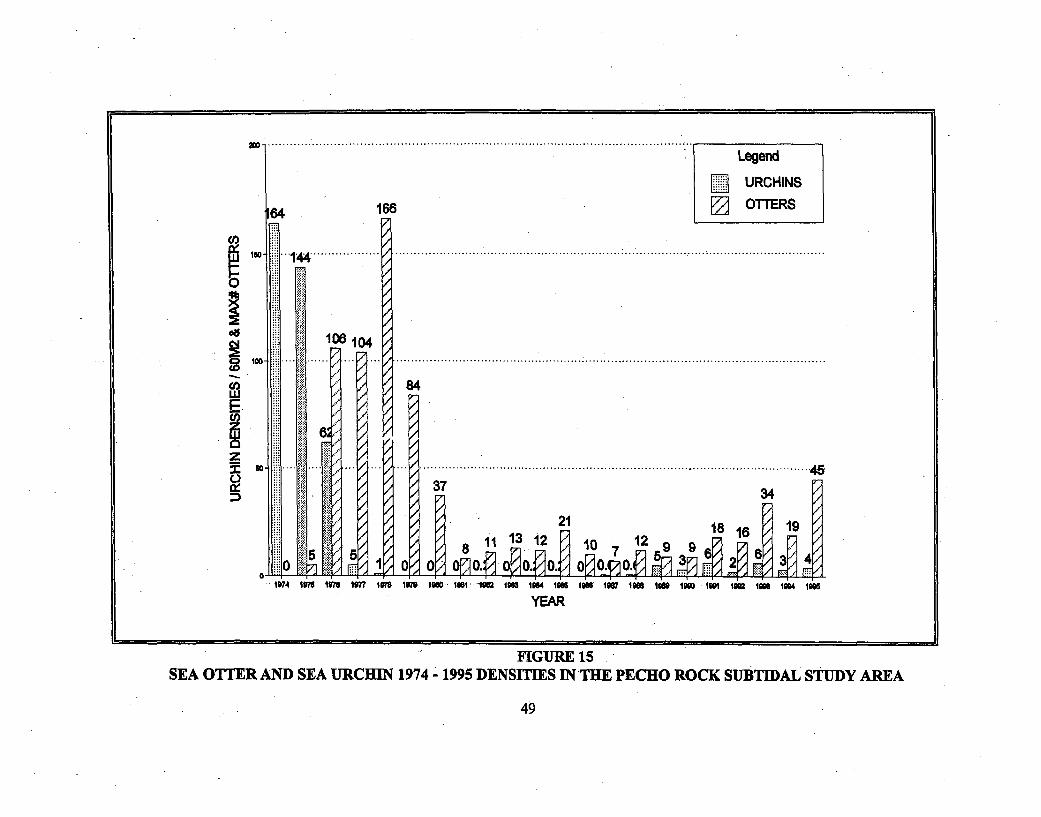
In 1974, prior to sea otter occupation of Zone 5, Red Sea Urchins carpeted the rock bottom in large,
closely packed aggregations with mean densities reaching 3 per square meter. In only three years,
sea otter foraging reduced the population to only 1 in 60nm2. After four years of otter predation, Red
Urchin populations levels were reduced to near or below detection limits (<1/300m2) and remained
so for twelve years. When urchins were found in subsequent years, they were almost always Purple
Urchins (Figure 15). In the thirteen years from 1982 to 1994, Red Urchins were detected only five
times ( 1 in 1982, 4 in 1991, 1 in 1992,1 in 1993 and 1 in 1994). 1994 marked the first year since
1982 that the Red Urchin found was a full adult of 12cm in size. Prior to that year, none of the Red
Urchins surveyed were larger than 6cm which is about half the normal adult size and no more than
two years old. Before sea otters reoccupied the area, the average test diameter was 11 cm. After only
two years of otter occupation, the mean test size decreased to 10cm. In 1977, mean test diameter was
less than 7cm and in 1993 the Red Urchin found was only 2cm in diameter which represents about
one year of age. No red urchins were detected this year.
There are two primary reasons why the Red Urchin is expected to remain "ecologically extinct"
within the Pecho Rock study area. First, Red Sea Urchins, under normal conditions, out compete
Purple Sea Urchins for optimum habitat because their larger adult size and relatively longer spines
48
.® .i ...... ... . ... ... ..................................... ................. : ..... .-. ........................ ................................
0
1 0 .. . ..4.. . ..
GD- i . .• . . ! . . . . . ........................................................................................................... 4e
t1~ 37D 34
21-18 16 19¶97 •ilii 00 8 1113 12 10 12 6°o 0ý01- o o"." oo oo. o ox --
1 97 9 1 974 1 9" 7 ¶W7 8 I W r 00 00 0.. 0 101t 19162 1068 1064 INI5 ' 16 " 106 1 IW8 1990 1I0t 1994 1I06
FIGURE 15SEA OTTER AND SEA URCHIN 1974 - 1995 DENSITIESJIN THE PECHO ROCK SUBTIDAL STUDY AREA
49
(Schroeter 1978). The Red Sea Urchin's larger size which made them the more successful competitor
for optimum habitat against Purple Urchins, also made them a move preferable target for otter
predation. Second, once the Sea Otters removed the large urchins which dominated the subtidal, the
habitat was now available to the smaller Purple Urchin which presently are found in reproductively
adequate densities in the intertidal zone.
Intertidal surveys conducted in the Pecho Rock study area in 1990, 1993, 1994 and again this year,
indicate diminishing but still abundant, local "seed" populations of Purple Urchins. In 1990 a mean
density of was 75/m2 was recorded, in 1993 densities dropped to 57/m2. 1994, mean densities were
reduced to only 27/m2, almost a 2/3rd reduction in density was observed. This year densities were
virtually identical to those of last year, thus diminished in number when compared to the past, these
aggregations are still dense enough to maintain fertilization success and settlement. A population
dependent on external fertilization, such as sea urchins require very high densities for sperm to
successfully fertilize eggs (Levitan 1992).
In contrast, Red Sea Urchin "seed" populations within the subtidal study area are not locally apparent
within the Pecho Rock area. Studies indicate that the drastically reduced local densities like those
observed in the Red Urchin Population in the study area, can lead to local extinction. Subtidal
surveys in the study area suggests that the few Red Urchins occasionally observed were probably
recruited from areas outside the subtidal boundaries of the study site.
Subtidal Purple Urchin densities (21/300m2) have increased from last year's 15/300m2, but lower
50
than the 1993 high of 28/300m2. In addition the mean diameter has varied from 5.0cm to 3.7 to 5.3
respectively. These differences are all within expected variability and appear to be relatively stable.
Subtidal Red Abalone (Haliotus rufescens) densities declined rapidly once Sea Otters established
themselves in the study area. "Pre-sea otter" abalone densities recorded by California Department
of Fish & Game from 1970 - 1973 in an area South of the Power Plant, in a similar habitat of the
present subtidal survey area recorded mean densities of 32/300m2. After five years of sea otter
occupation in that same area, densities were reduced by 85% to a mean of 5/300m2 (PG&E 1981).
This was thought to be a "stabilized" density of abalone in otter occupied locales.
In 1979, when Abalone counts were begun in the present subtidal study area, Sea Otters had
occupied the area for almost 5 years (Figure 16). Similar to Fish & Game data, from 1979 to 1984
densities averaged about 5/300m2 and were assumed stabilized. From 1985 to 1994 abalone densities
plunged still further to less than 1/300m2, a greater than 97% decrease over "pre- sea otter" densities.
Intertidal Black Abalone densities near Pecho Rock were first measured at 4/10m2 in 1990, then
6/10m2 in 1993 by 1994 densities were reduced to 3/10m2. Densities continued to decline to 2/10m2
in 1995. Mean size has varied from 6.5cm to 7.3cm back to 6.6cm. This shift to smaller sizes once
again indicates predation directed toward the largest awimals, similar to what was observed with the
intertidal sea urchins.
Data collected at Diablo Cove indicated Red Urchin Densities dramatically lower than last year but
51
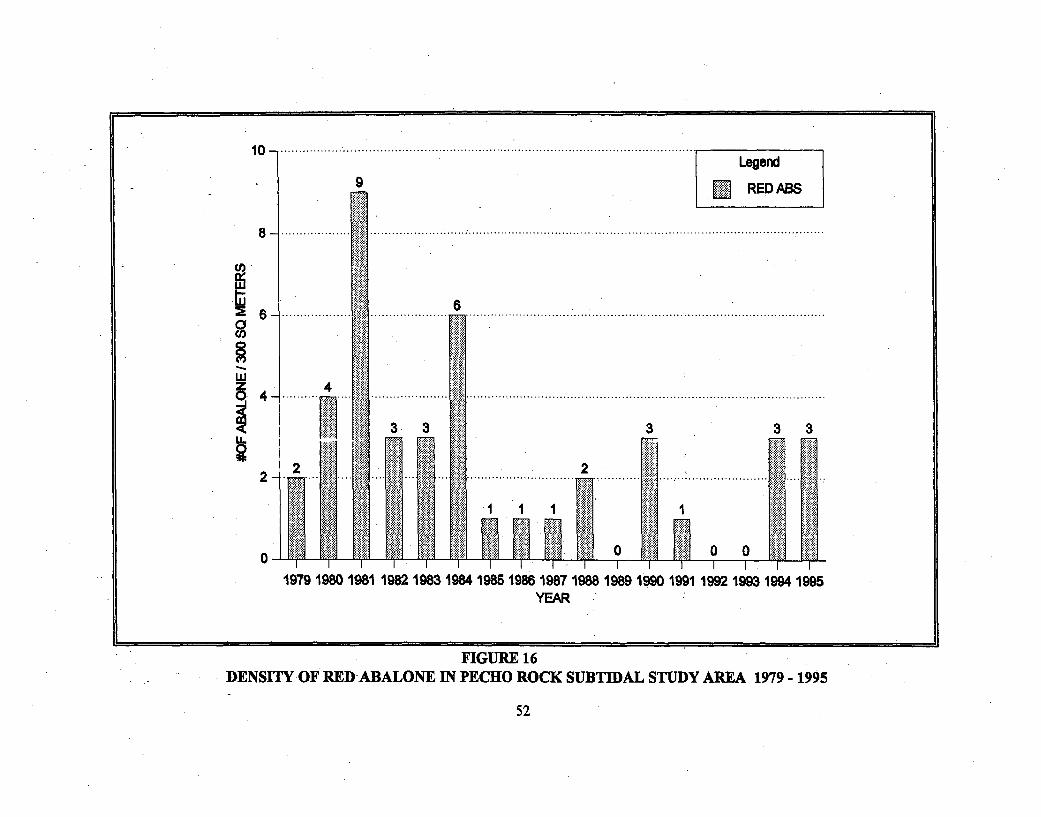
1 0 ............................................................................. .....................................Legend
- 9 RED ABS
8 . ................... ....................................................................................................................... ......
U,,S 6 . ................... 6 ....................... ......................................................... ..................
4 -. .......... .... .. ..................... . ... .................................. .......................................................... ......
3* 3 3 3 3
0 ........ ++, - ... . . ....................... ...... .... ... .. ............+ +. .
. .....r....
0 0 00
1979 1980 1981 1982 1983 1984 1985 1986 1987 1988 1989 1990 1991 1992 1993 1994 1995YEAR
FIGURE 16DENSITY OF RED-ABALONE IN PECHO ROCK SUBTIDAL STUDY AREA 1979 - 1995
52
were not considered ecologically extinct like those of the Pecho Rock study area. After conducting
a survey at two sites in Diablo Cove using same technique at a similar depth, and comparing the
results with the two highest stations' densities for each species counted within the Pecho Rock study
area, the results indicated greater similarities to Pecho Rock than the same site sampled last year
(Figure 17).
Two Diablo Cove Stations (Table 5) located in "North Channel" were chosen for compatibility in
depth and high relief rocky substrate to Pecho Rock stations. In addition, this area was selected
because it represented the "best case" example of high red sea urchin densities in Diablo Cove.
Historically, this area contained very high densities of Red Sea Urchins, typical to the historic high
densities of the Pecho Rock area (Personal Observation 1974). Although the two specific 30m2
stations were randomly selected, the general area was "stratified" to represent historically optimal Red
Sea Urchin habitat. This being the case, the results were then compared, tO. the "best case examples"
(two highest stations of similar depth) within the Pecho Rock study area (#s 4&5). Results of this
comparison indicate, Red Abalone densities were virtually identical, Purple Urchin densities were
within the same order of magnitude but, Red Urchin densities remain different. This difference may
be one of substrate protection or this site has not had as much feeding pressure on this food source.
The item of interest this year is not the differences among Pecho Rock and Diablo Cove sites but the
striking difference within the Diablo Cove area when compared to last year. Red Urchin densities of
42/30m2 recorded in 1994 in "North Channel" were comparable to 1976 Pecho Rock conditions*
after only one year of sea otter predation. The order of magnitude reduction in density to 5/30m2
53
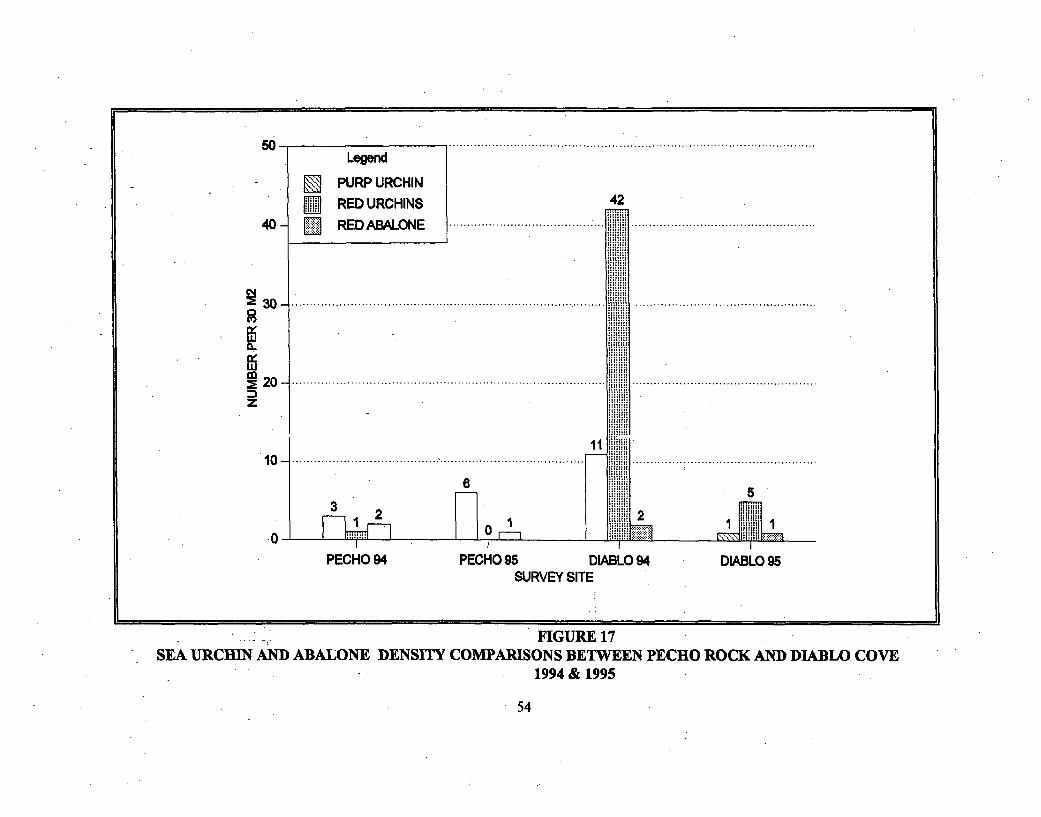
50
23 0 . ...................................................................................... .... . . . . . . . . . . . . . . . . . . . . . . .
1 0 - .................................................................... ...................................................6
"0 -
PECHO 94 PECHO 95 DIABLO 94 DIABLO 95SURVEY SITE
FIGURE 17SEA URCHIN AND ABALONE DENSITY COMPARISONS BETWEEN PECHO ROCK AND DIABLO COVE
1994 & 1995
54
now resembles densities detected in the Pecho Rock area after two years of Sea Otter predation
(Figure 15). The most plausible explanation for this extreme difference in Red Sea Urchin densities
appears to be predation. The fact that Sea Otters now regularly inhabit this area strengthens this
argument although no urchins have been observed being consumed here during the course of this
years standard mid-day counts. But why such a wide difference between Red Urchins and only a little
difference among Purple Urchin densities? This may be a result of their smaller size which makes
them less attractive as a food source when compared to the larger Red Sea Urchin.
Similarly the comparable numbers of Red Abalone at both sites can be explained by crevasse size.
Crevasse size at both sites may be too small to be helpflul to the large Red Urchin with its' long spines
and high profile, but large enough for successful abalone attachment which has a long low profile.
Tagged Sea Otter Observations:
A total of 33 different tagged sea otters have been observed since 1988. Several months after U.S.
Fish & Wildlife Service began their translocation program to San Nicolas Island located 256 km
southeast of the study area, returning sea otters were observed. All animals taken to San Nicolas
Island were tagged with color coded hind flipper tags. Thirteen individuals returning from San
Nicolas Island have been positively identified in the study area since 1988. An additional 15 animals
were also spotted with tags, and although not positivwly confirmed, are probably animals returning
from San Nicolas Island. The remaining five were from mainland sites North and South of the Study
area. Tag observations in the study area generally confirm that at least some males and femalesmove
relatively large distances within their present range. However, most individuals prefer to remain in
familiar area of a radius of 15 to 20km.
55
No tagged animals were detected within the study area this year. This is more likely a result of tag
loss over time than due to lack of Sea Otter movement.
General Behavior:
Haulout behavior, remains common in the study area, but had decreased in the numbers of animals
and in the location where it was observed. Sea otters continue to haul out individually and in groups.
This behavior is demonstrated by males, females and pups of all sizes. It is directly related to physical
events such as tidal height and swell condition and may also be related to water temperature and wind
velocity. This behavior appeared to be more seasonally dependent than in years previous with
increased sighting in the spring. Since this resting activity tends to save energy, it may be important
and most useful during peak pupping periods and in areas of higher energy demand (e.g. colder water
or sever weather) or lower forage density.
Most of the haul out sites remain on nearshore wash rocks covered with the alga Endocladia. There
are exceptions. Sites also include bare rock, and sandy shoreline. No new sites were observed this
year (Figure 18). There is a total of 20 documented sites in the study area. The abundance of
protected wash rocks, remote beaches and little or no human harassment, give the sea otters the
combined conditions necessary for a safe haul out.
In order to be consistent, only data collected during normal counts are included on Figure 18. It is
56
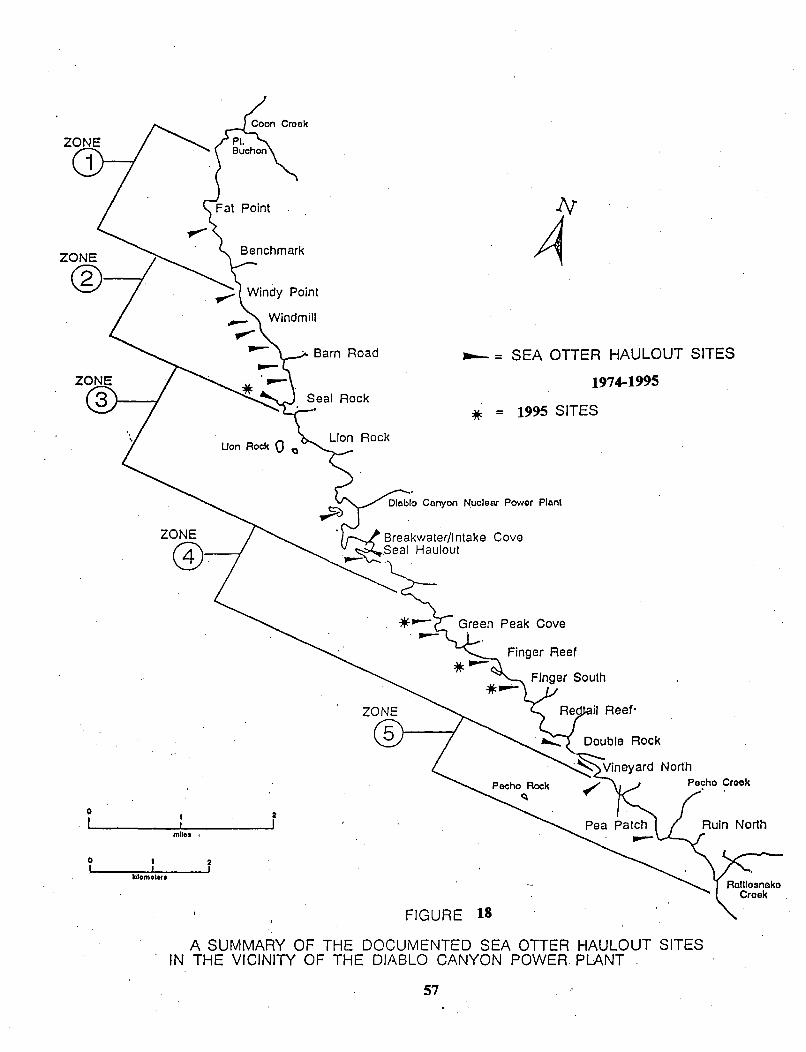
Crook
ZONE
0
ZONE®ý.
_IV
ABarn Road * = SEA OTTER HAULOUT SITES
1974-1995
*= 1995 SITES
Lion Rock
Canyon Nuclear Power Plant
Cove
Finger Reef
Pecho Creek
0 2
miles ,
0 2kmIkilometers
FIGURE 18
A SUMMARY OF THE DOCUMENTED SEA OTTER HAULOUT SITESIN THE VICINITY OF THE DIABLO CANYON POWER PLANT
57
important to mention that additional haul out behavior was observed within the Intake Cove during
night-time and early morning observations. Haul out behavior appears to be numerically higher at
night (Appendix I).
Daytime use of the Intake Cove by resting sea otter has increased in both frequency and number.
Most animals are unalarmed, yet aware of typical boat and kelp cutting activities. Routine human
activities around and within the cove are easily tolerated. However, unusual or direct confrontations
with the sea otters still illicit an avoidance response where some animals will exit the cove if they feel
threatened by unusual human activity. This avoidance behavior is short-term and individuals have
been observed returning to rest within minutes of cessation of unusual activities within the cove.
This avoidance response does not appear to effect long-term use of this area.
The increasingly popular near-shore skiff fishery activities appears to have, scattered resting groups
of Sea Otter. This is indicated by their dispersal and activity when these skiffs are present.
58
SUMMARY
1995 Sea Otter Survey
-The mean population has increased from a three year annual mean of 60 to an annual mean of 70.
--Fluctuation in population size displayed a seasonal "storm" dip in the winter and a "pup spike"in the spring.
--The majority of the population is composed of females and pups which account for 95% of thetotal. On average, pups accounted 16% of the overall population. This number is said to be indicativeof a healthy population.
-The use of Diablo Cove and Intake Cove has increased in frequency of occupation since last year.
-The category of "small mollusc" which also includes very small food items remains the dominantfood source and has reached an all-time high. Abalone has reached an all-time low.
-Red Sea Urchins are still considered "ecologically extinct" within the Pecho Rock subtidal surveyarea. Purple Urchins remain dominant, and have increased in both density and size.
-Density differences in subtidal Red Sea Urchins between Diablo Cove and Pecho Rock is probablydue to predation levels by Sea Otters.
--No tagged sea otters were observed in the study ar%.,a. This is probably due to loss of ageing tagsrather than lack of sea otter movements.
-- Sea otter haul out behavior decreased in number of sites and animals within sites. Observationfrequency remains relatively stable. There are 20 known haul out sites within the study area but onlyfour were observed being used this year. Night observations indicated that haul out activity increases.
- Sea otter disturbance by atypical human activity scatters and displaces individuals but appears toshort term in duration.
59
REFERENCES
Benech, S.V., 1979. Sea otter Activities Within the Vicinity of the Diablo Canyon Power Plant1973 to 1978, Cal-Neva. Wildlife, 1979: 33-44.
Benech, S.V., 1993. observations of the Sea Otter Enhydra lutris Population between PointBuchon and Rattlesnake Creek, San Luis Obispo, California January through December 1993.Unpublished Report. 67pp.
Estes, James et al. 1986. Activity-Time Budgets of Sea Otters in California. J. Wildl. Manage.50(4):1986 p626-636.
Estes, James et al. 1989. Extinctions in Kelp Forest Communities, Conservation Biology,Vol.3,#3 Sept. 1989, p252-264.
Garshells, David L., 1983. Ecology of Sea Otters in Prince William Sound, AK PhD Thesis.
Hatfield, Brian, 1995. Personal Communication, U.S.Dept. of Interior, National BiologicalService, Piedras Blancas Research Stn. San Simeon, CA.
Kenyon, K.W., 1969. The Sea Otter of the Eastern Pacific Ocean, U.S. Bur. Sportfish. &WildL No. Amer. Fauna (68).
Levitan, Don R., Mary A. Sewell,& Fu-Shiang Chia, 1992. How Distribution and AbundanceInfluence Fertilization Success in the Sea Urchin Strongylocentrotus franciscanus. Ecology,71(1), 1992, pp 248-254.
PG&E, 1981. Environmental Investigations at Diablo Canyon 1979-1980Unpublished Report, Chapter XII p.35.
Rails, Katherine, B.B. Hatfield, & D.B. Siniff, 1995. Foraging patterns of California Sea Otteras indicated by telemetry, Can. J. Zool. 73: 523 - 531 (1995).
Riedman, M.L. et al. 1994. Breeding Patterns in California SeaOtters. J.Wildl.Manage. 58(3), 1994. p3 9 1-3 9 8 .
Schroeter, Stephen C., 1978. Experimental Studies of Competition as a Factor Affecting theDistribution and Abundance of Purple Sea Urchins, Strongvlocentrotus purpuratus(Stimpson), PhD. Dissertation, Univ. Ca. Santa Barbara 1978, p85-92.
Vanblaricom, G. R1, and J.A. Estes; Editors 1988. Ecological Studies, VoL 6. The CommunityEcology of Sea Otters. Springer-Verlag, N.Y. 247pp.
60
APPENDIX I
NIGHT OBSERVATIONS
ACTIVITY SCANS DURING BARGE DELIVERY OPERATIONS
61
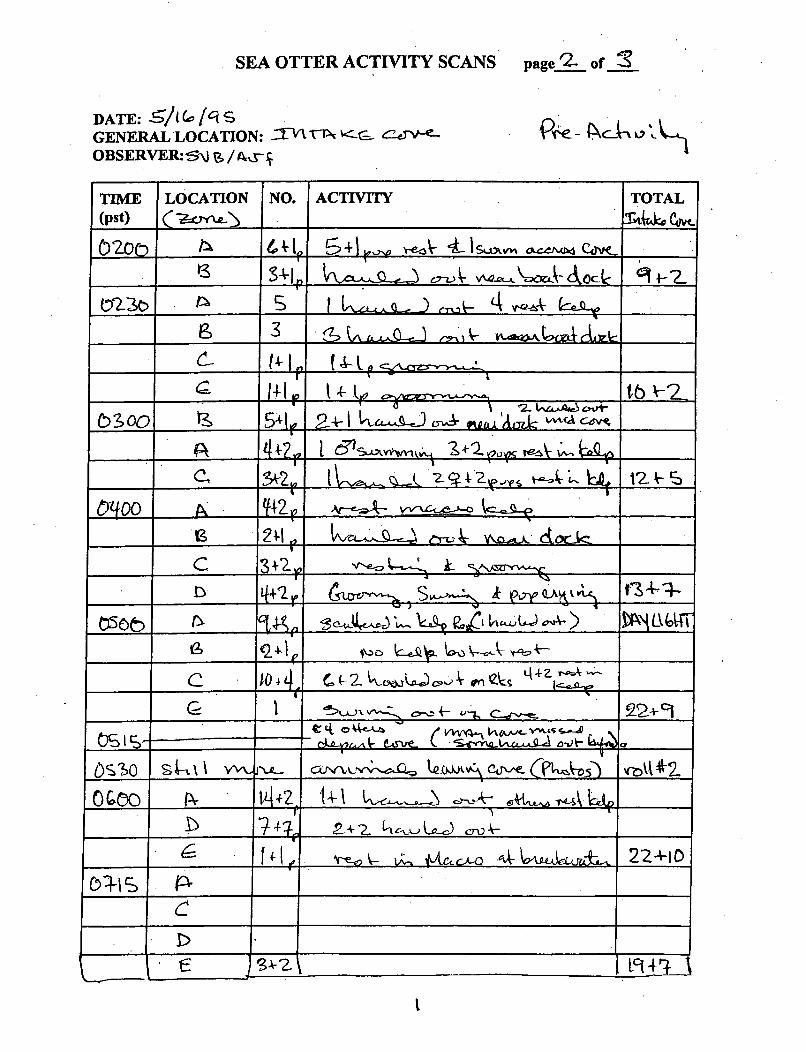
SEA OTTER ACTIVITY SCANS
DATE:GENERAL LOCATION: 7VTk •-_..--OBSERVER: 5-nJ / ,y- ý
page'2- of
TIME LOCATION NO. ACTIVITY TOTAL(pst) • . __ ¶.
b.oo 21+- 1 a ____ "^4
r ,,-24-1
UNi
iS
_ _ C 1044,1 kA zT.-
____!ý ______s- rot 4 S uK _
r- 4 22+0-g
E tq4• I
I
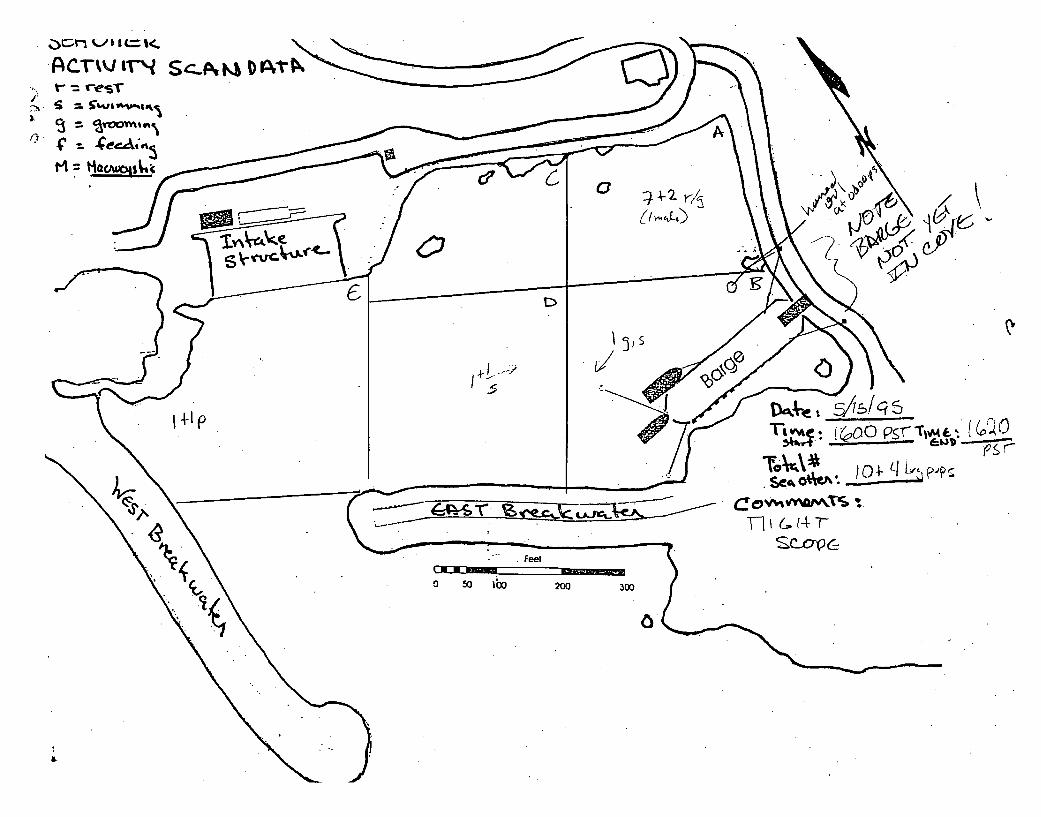
SS
CeS
M4ta~~la jA-2 rX~
(h~4-)
~f~Kb
C,
or /1Jq5
ostit*__
T jO __
Feet
0 50 IOU 200 300
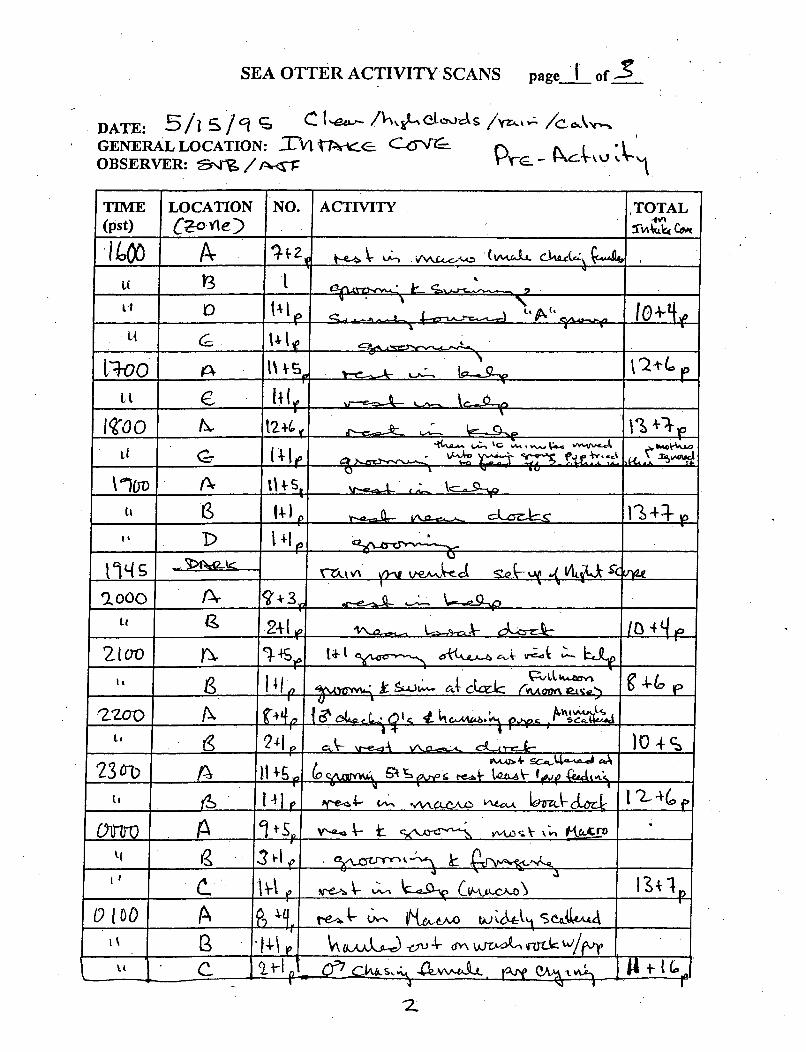
SEA OTTER ACTIVITY SCANS page 1 of-1;
DATE: 5/i/•l 9 /yrw...
GENERAL LOCATION: TVI VN -C'_. C-6-_C--OBSERVER: Si,,r"%, /f-.--r
TIME LOCATION NO. ACTIVITY TOTAL(pst) ( .4 _T__ CM
[ +oto A[V o
ti
LI 4 I I-ot
2.000 _ _ _ -3 ___
~~,,krLU....Jc,,..,-A ,,)
"ZO~ ¢__ _ l•-4r ,,
,lo: _ _ _, . ,.,,
ýA±~ d-\W-lM
xl 1.c 'L:'l 2C-f~ 'W Lpf . %gLý }' I i2z
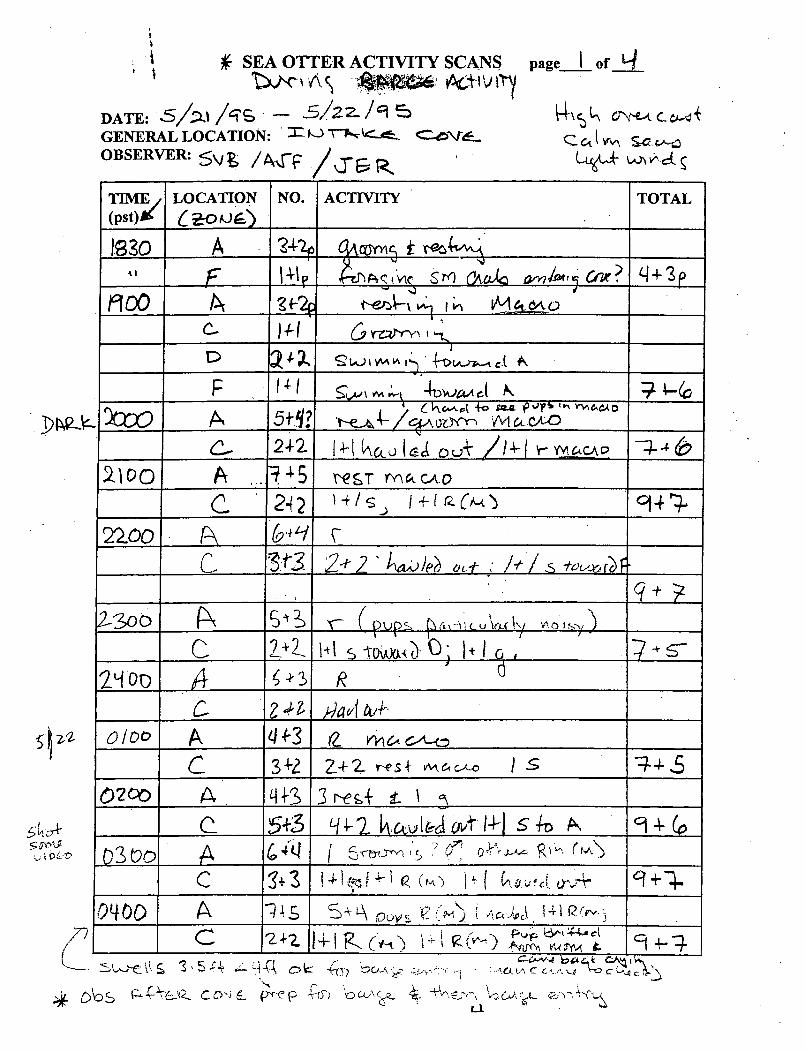
t SEA OTTER ACTIVITY SCANS
DATE: 5/.2t/"" - 5iZ/GENERAL LOCATION: ' - -- 4.
OBSERVER:: /•"f\ lR.
page- of L4
LuC-ý - c-Y u'c4
TIME LOCATION NO. ACTIVITY TOTAL(pst)w/ 6a-•9•
tIso A 24-2p g,__5_ __T r__
__ s42 g/• "a C ? qI-43 p
1900 ttk I,' Lnr4- 6-
22)o + I -,+ 9 4 4-
Aa) 2 -l, vcot s 4a..0/e *
3o ____-__ '4- Z f4 ,., _o\ s ='4 .
~2-oo _
C 2-42-2h
.A q -3 (z !' -I
Cq 2 k L'".c- A ., 1-d fsK(-,.P,
______I _•I ,,, K )9 +Vt- - _4,7~)/
rC~ ~ *(Y) ~C'~A *LPv -4C'. l t C 4
.1 El.
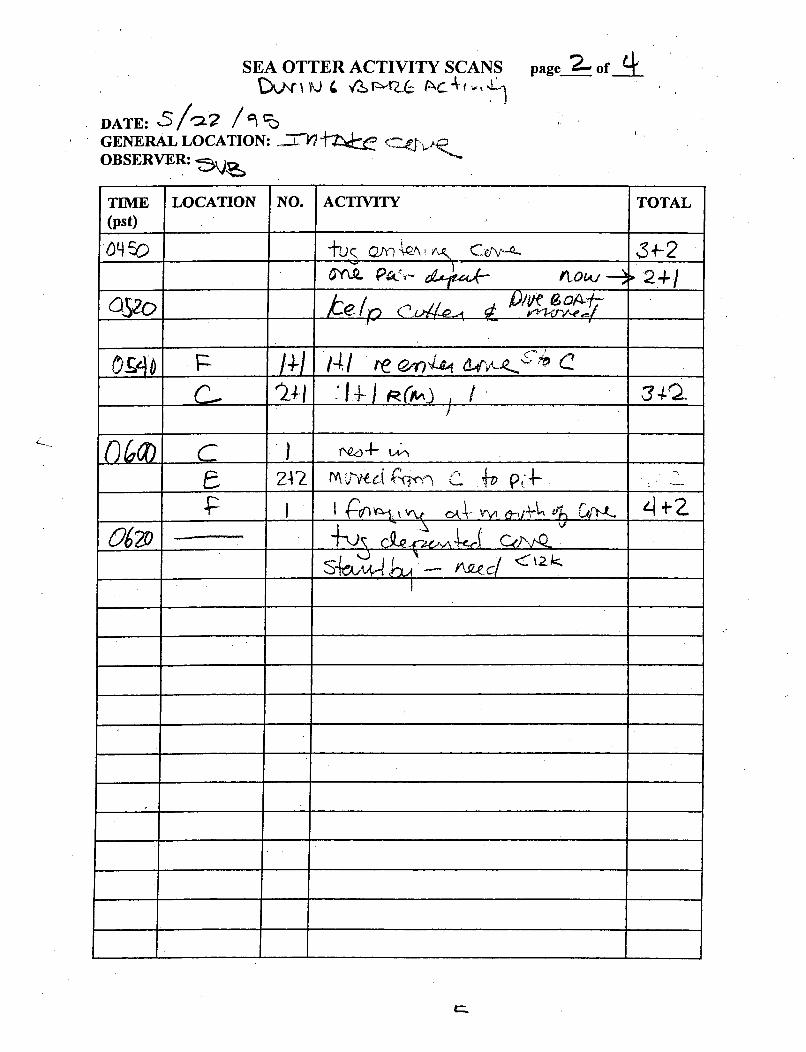
SEA OTTER ACTIVITY SCANS
DATE: 5l'l2 / •GENERAL LOCATION: =k"'7 tZ, \.OBSERVER:
page___ of__
TIME LOCATION NO. ACTIVITY TOTAL(pst)
+-u r,••- 'Qo• ct." 32÷
6Th _ -K.Tv.• k '• • .- -____
0420v24
________ J±L i4/ ~
___•§-I IfI(M /,2 • ut--2.
f l Q ~ I __ ____ ____ ____ ___
4- 4- 4- +
*1- 1*
.1- 4 4- +
4. 9~1~ 1~
I 4 4-
4 4 4 4
I 4- t I
.4 4. I
4- 1 I
___ _____ __ f_______________ ___
c:.
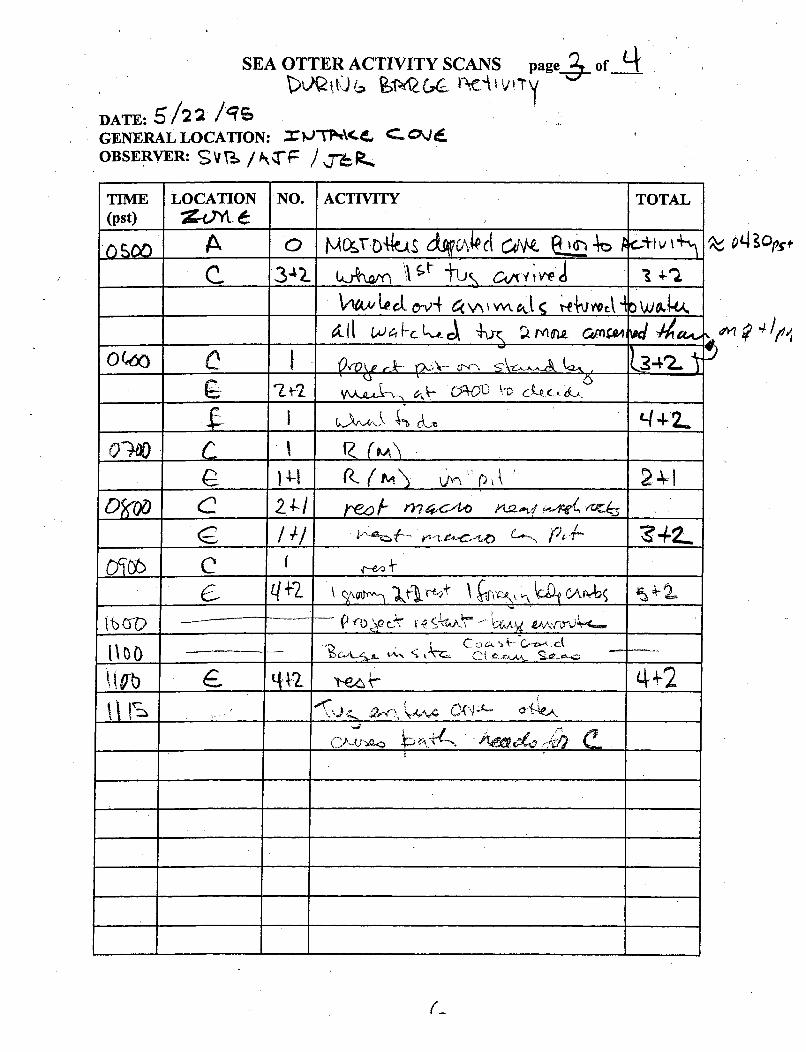
SEA OTTER ACTIVITY SCANS page- of 4
DATE: 5/22 /9GENERAL LOCATION: IaJTN\(. - C4J.OBSERVER: kV - TF P,
TIME LOCATION NO. ACTIVITY TOTAL(pst) Z~4 ~ _______
0m c. - _
___e (dr dýd cA___ ~ ~ 24- __ -I .J 1 c.~
O4ýio __ _ _ _ _ __ _ _ _
____ Iru,\P
Q~C t,0_qt? 4___+- ~1' P~~2I
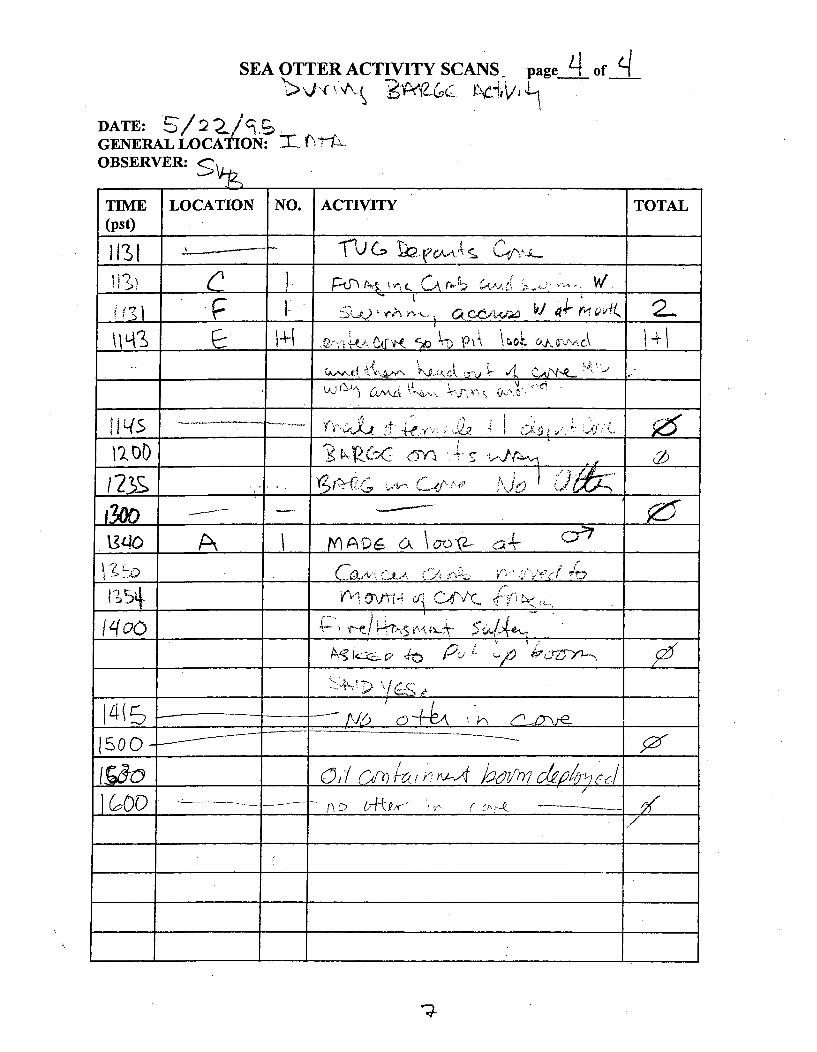
SEA OTTER ACTIVITY SCANS. page- of LI
DATE:GENERAL LOCATION: E (>f1OBSERVER:
TIME LOCATION NO. ACTIVITY TOTAL(pst)
t F_ ___ _ iI -'4 ,4 2
i 23&
_ _ _, _ _ _ _ _ __ _ _- r, , 4. .. ,.. •: ,,-,. .-
s o o
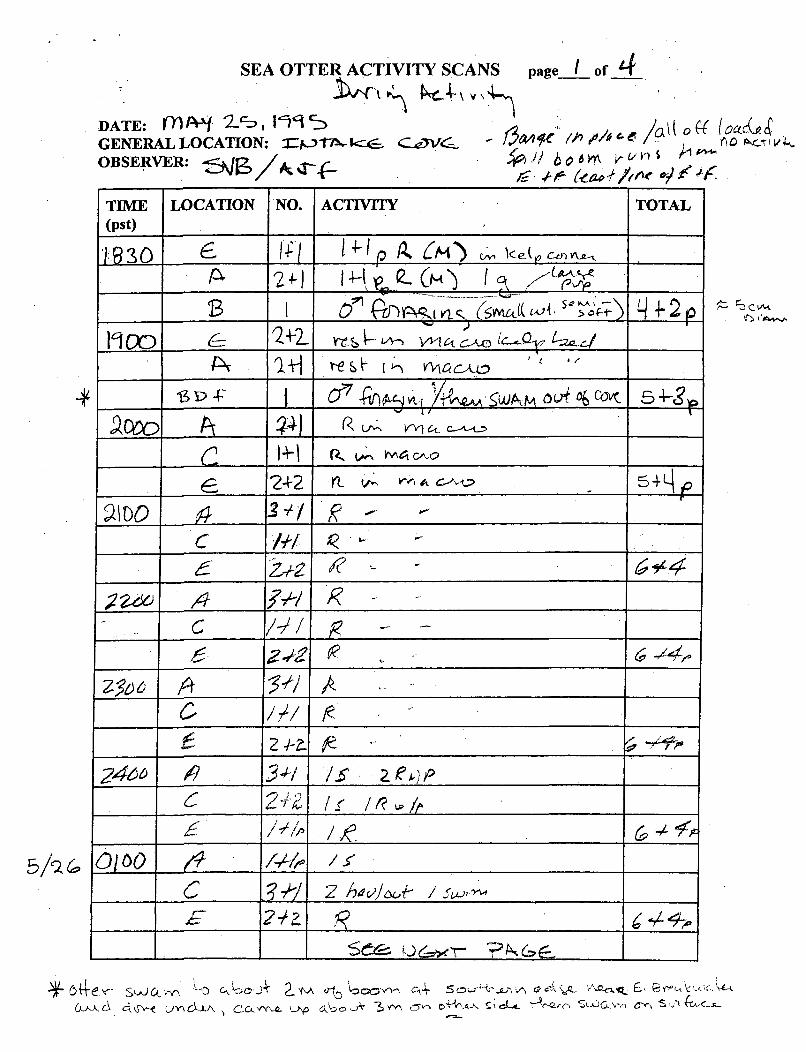
SEA OTTER ACTIVITY SCANS page I of 4
DATE: '•/-N Z•o7, itY5 ou Octc(sGENERAL LOCATION: 7-- . 'CVC4- ,4t.'i" /,%d/ora .
OBSERVER: 40,} b6'f m"' 0 l"
TIME LOCATION NO. ACTIVITY TOTAL
(pst)
14-_ A.__ __m lc_ Cn K AA-,__
13 I , (S({ eA, %-.2
1900Y#ES [ LL
"V ! 1 CA -242 P- v- P,,
6 i _ i_. _._ _ _ _ _ _ _ _
6l O <[: /& 6,4
___ C .•-P 2~4 i4,•./J., 1 _
__ -_ _ 2,+2 .,8, ____
(LKo~~J\i1 a '('A
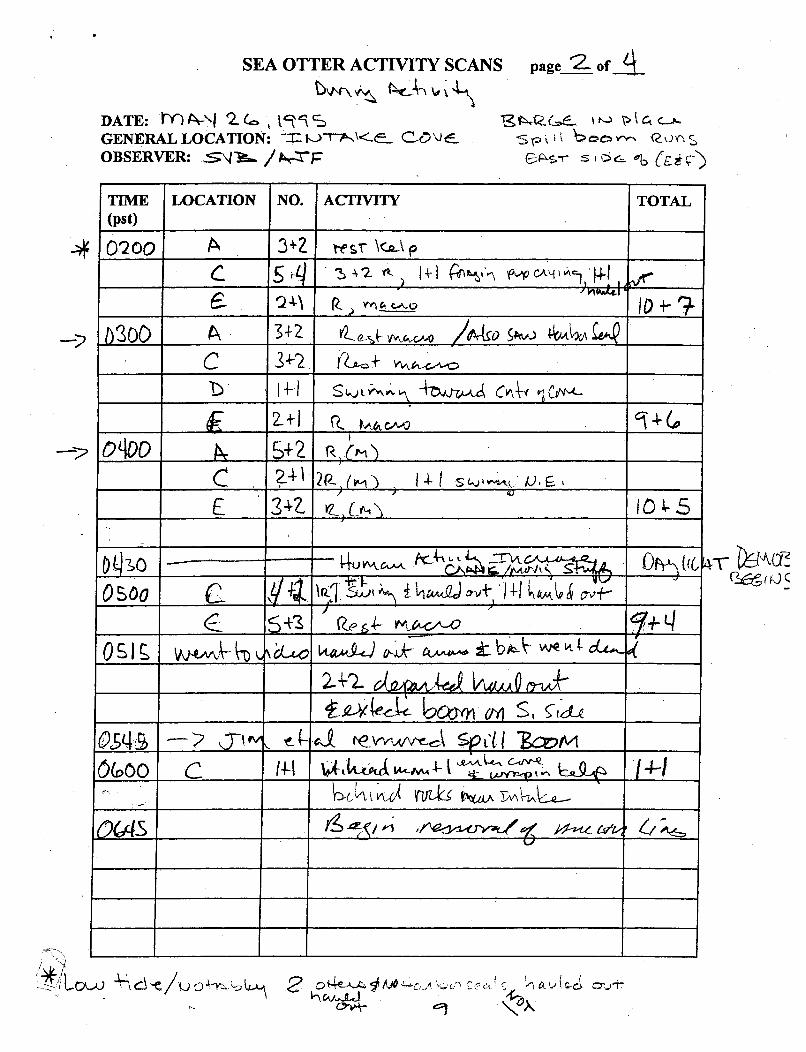
SEA OTTER ACTIVITY SCANS
DATE: FYch-\f ., -GENERAL LOCATION: -Z - CJ.OBSERVER: Sx4. /A•-•
page- ofA
I NJ k> C
06 r-r-
-:2
TIME LOCATION NO. JACTIVITY TOTAL(Pst) _ _ _ _ _ _ __
0200 A3-Q pptA9 _
C Hi '~~~~1 - ' v w 1iI
___ _ ___ __QA~ ~3+244
___ +__ _ _ _ _ _ _ _ _ _ _ _ D~~
b30b& 4___1_ 3+. r~4~v __
c-2- (1Mb 4 -f-~ _ _
_ _4AJ _ _ _ _ _ _ _ _ _ _ _ bk&v4e
Z4 el&)
NOW~ & 14- V,~''
0(4-S~ v~i _ _
(ld-i
" 1ý
Lowh~LJ
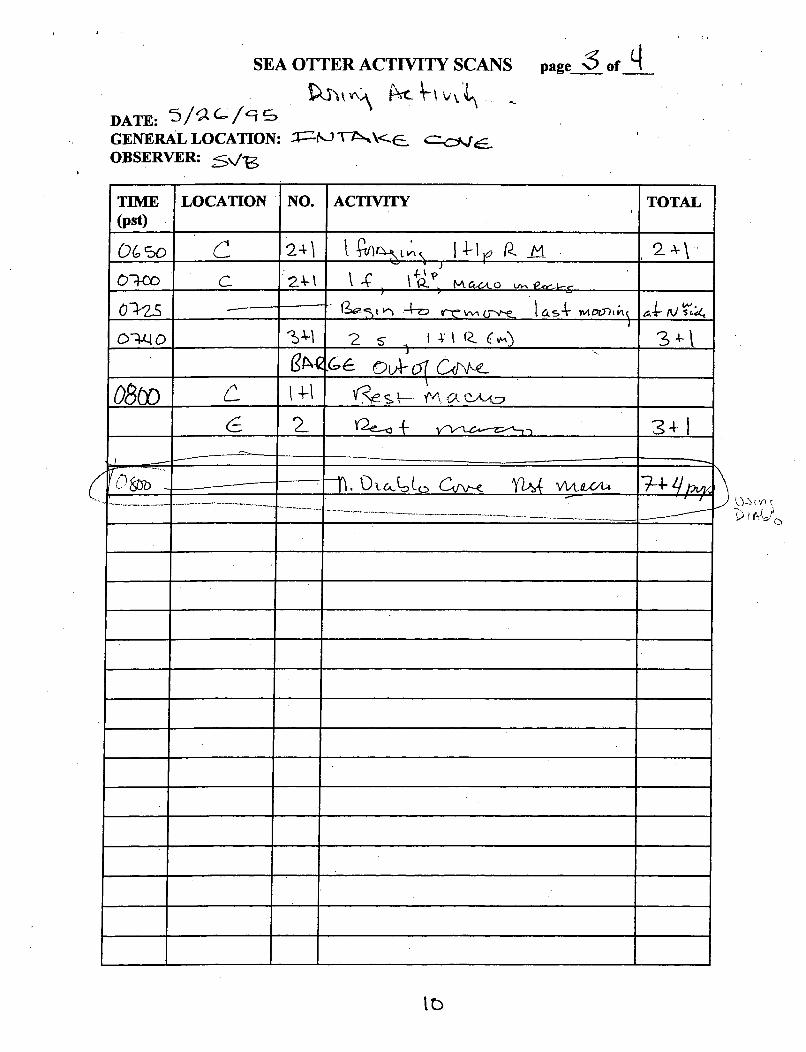
SEA OTTER ACTIVITY SCANS
DATE: 5/,/'i:: -
GENERAL LOCATION: T--. .. .OBSERVER:
page ",•of q
TIME LOCATION NO. ACTIVITY TOTAL(pst)
0_______ 1 Q,-',,, I4~y - (1. P.s .,
o--6-l " 1 2_ (A46- 1 L- ,-.,__4--1
08W __ _ W __ _ _ _ _ _ _ _ _
j .~
~m~J
4. 4. t
4 4. 4 4
1 4 4. 4
4 9 4- 4.
____________ ____________________ ________ ________________________________________________________________ I______________ID
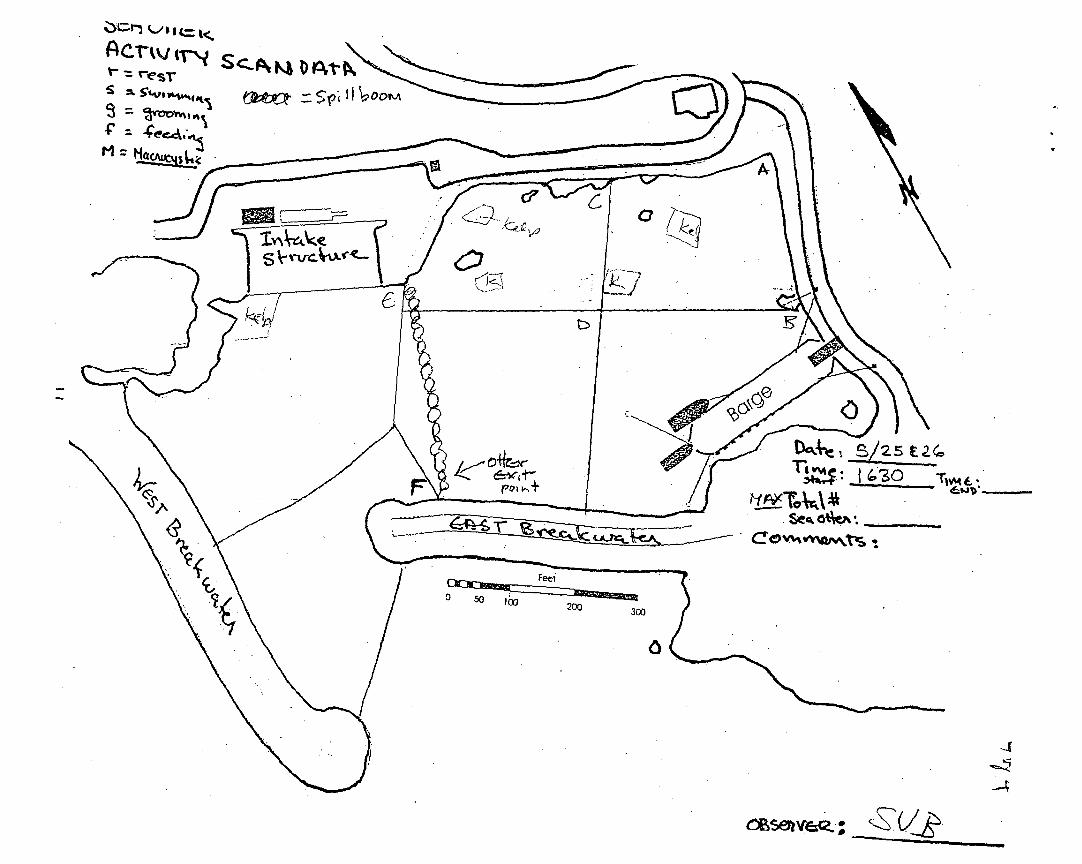
oc-- 11 ý-/ # I 4= l<Ar-rtv jrN
I ~ eý/ 5st
seeT 1
4
Vr
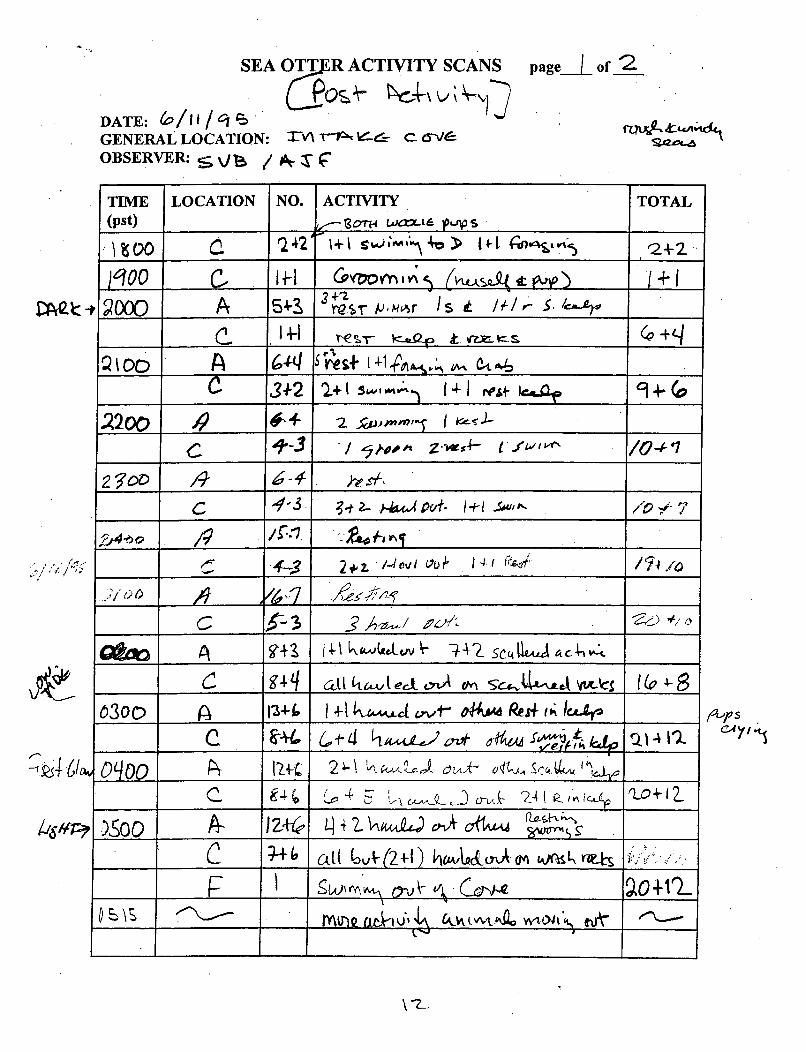
SEA OTR ACTIVITY SCANS
DATE: (0/11/ rDGENERAL LOCATION: tV'• t I-- c-V'OBSERVER: S \j / jot T
page_L of
UL & i'.h
TIME LOCATION NO. ACTWIVTY TOTAL
(pst) ,4-__607__ __ _ _ _. _S_
)900 0_ .. 9.vov+ 1 ; c) 1- 1+d
t~2OOO A 5 13 +-z p~ -s S __ _
___. lHi- Y'Cv- k•~O • 'z.= C +4/
p. 3+2 2+ts -,..,j,,,• (-J I ,• ____
A2c,6 2es Prnrr /s t./
C. q- / •,^ z-' 4,- (f4''"~ /04"1
•34-2 21+ /.s o i I (v-
2200 o9 of-__
___ _ ___ __ _ _ __ 2*zio ICL' 14.1 c
63001 + k44Tht.,avvt- ON2AA 4 R 0%b~ C Ig֥ I l . ,.I o4--tSIo.
c2- 21) 14~~ I '__ _
p 1 Aav6&1 j1 cmOft rcL
r~u(J~u'J wu>ýKk go+___
lqy,P ,
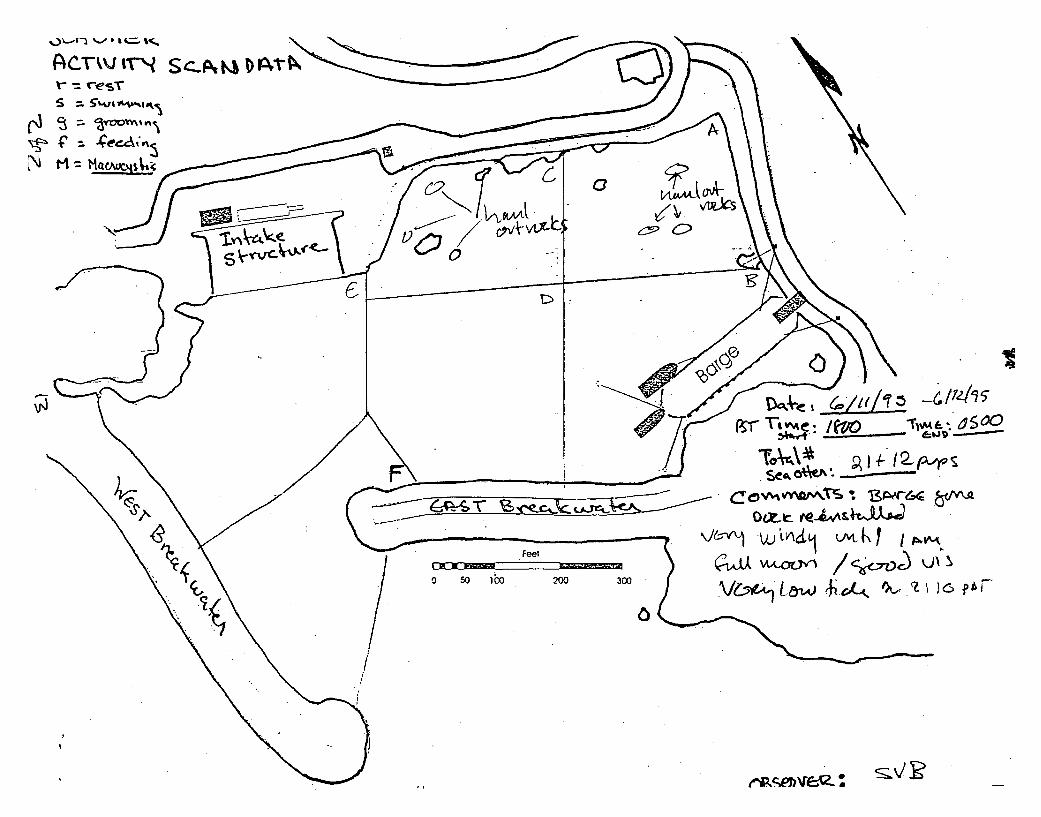
ScA
V64- L' .&W o _• .o__
•o•\•. • I- •, .
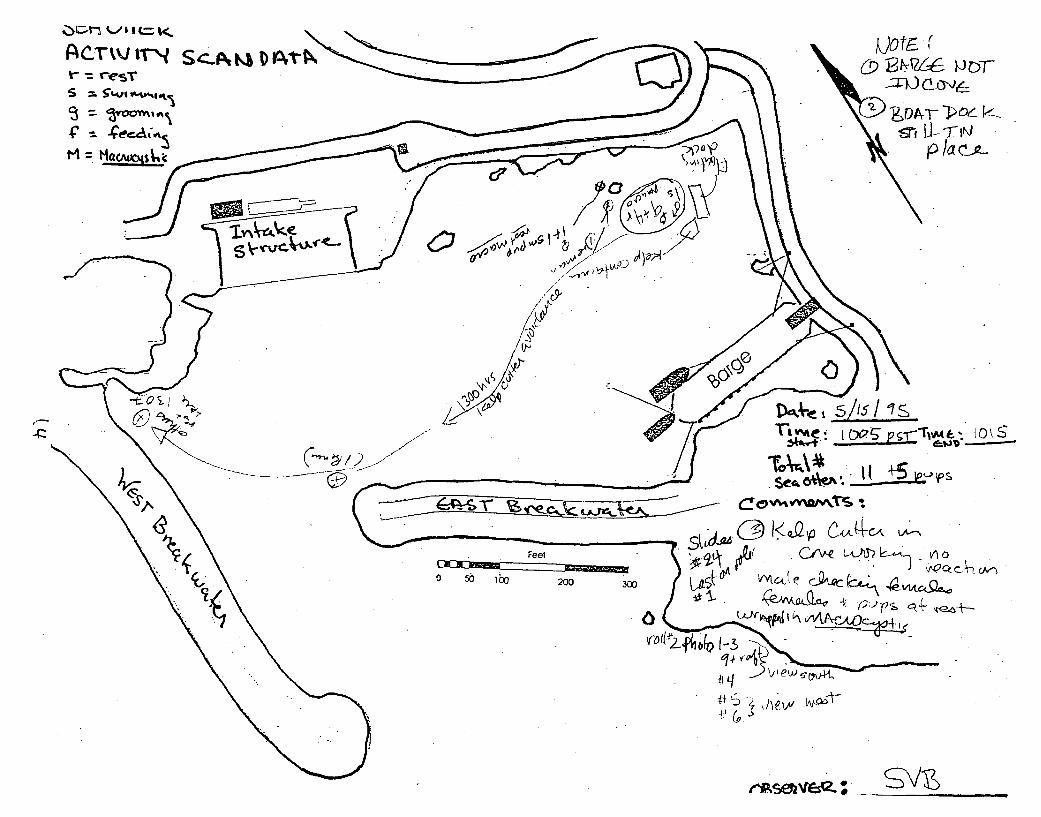
Acrtr.tv', Sc-A
£
4ecA~zo P - -P© 8•_•7-• IN)
7- .•.. 5/! 5I,..1"•M,- o .
- ~-7
, lc-- 2-A--
Feet
0 50 12o 2003
C e Loa)I0
IN
0
Vl4,:( f ;,4 l
fq 9 7 w
iilV1
a ____
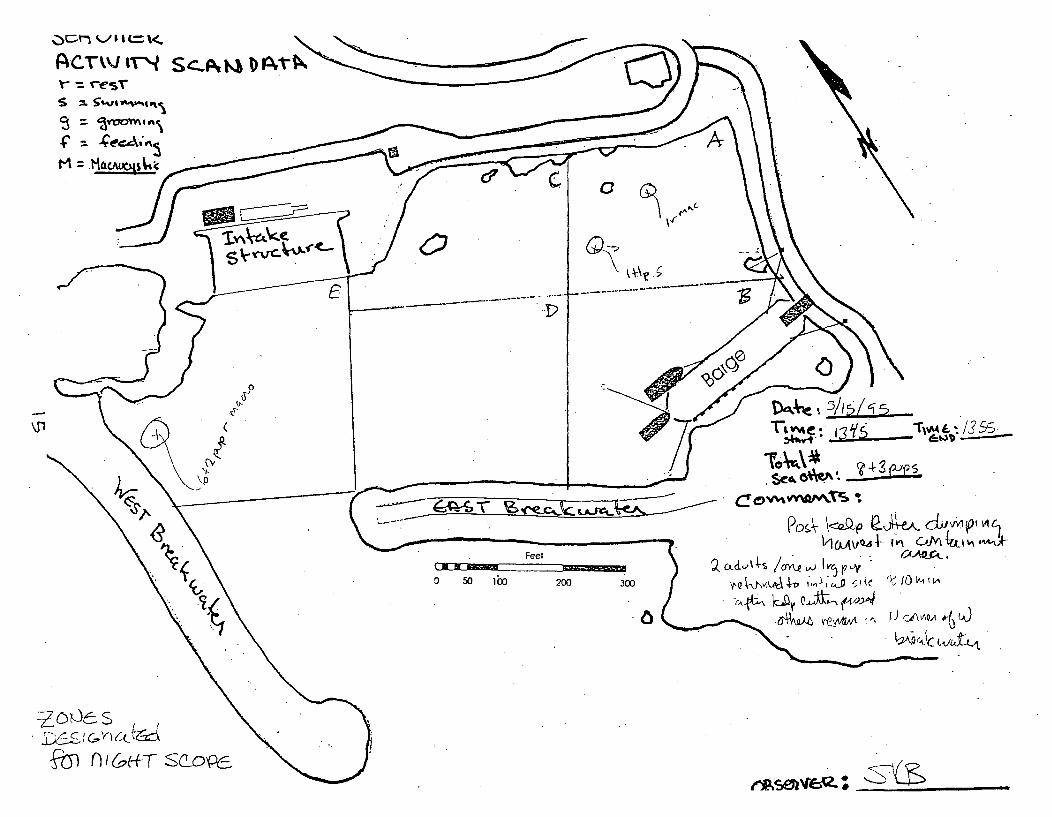
Z,ýC3-1 -/I I C = X.
ACeVI" sN
0
(
C, -/c Ivc 6,,"
6VA• ; Z.J• Qi:> • {,yP•
• . .. . .- ~. ;,• [. _L .
Feet
0 50 10c0 200 300l
6C(AVLt4ý
-Eb-) fl'&efVSIOQE ~pc~
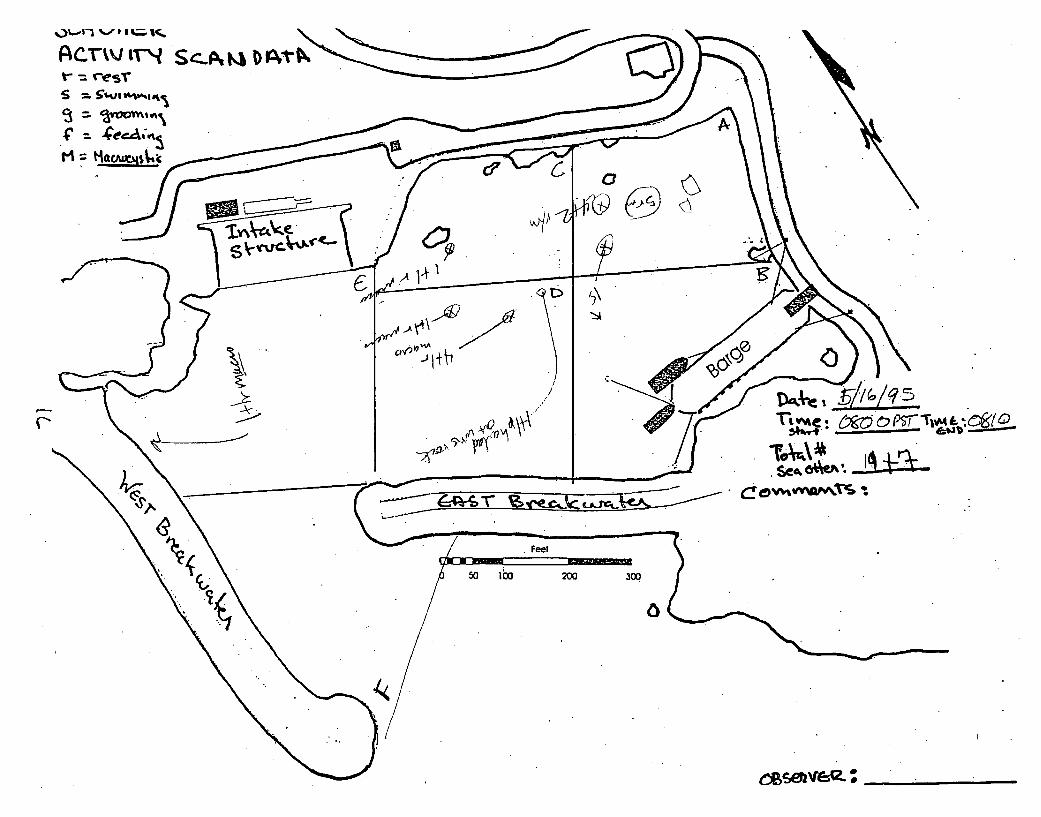
S IAkV IT4q
M ____Ask
1>
&OA
See,
50 1003 200 300
c~S0~V6'~
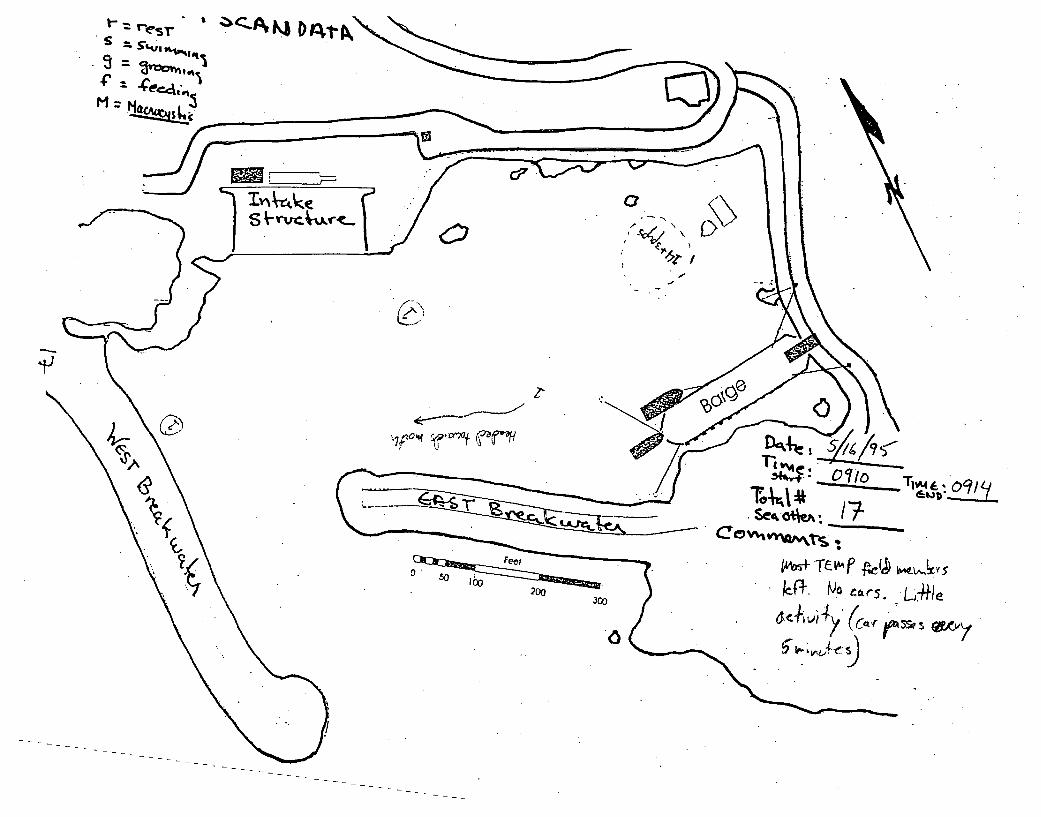
'S = -c
M:4~.q
"Ir'q -A
<~/\ &4 ~~t
(
~o~'0t ~
Feles
200300
T 1dm1 L4~
see 05e.A 4 *( A3e5.J
N.+ f V.0
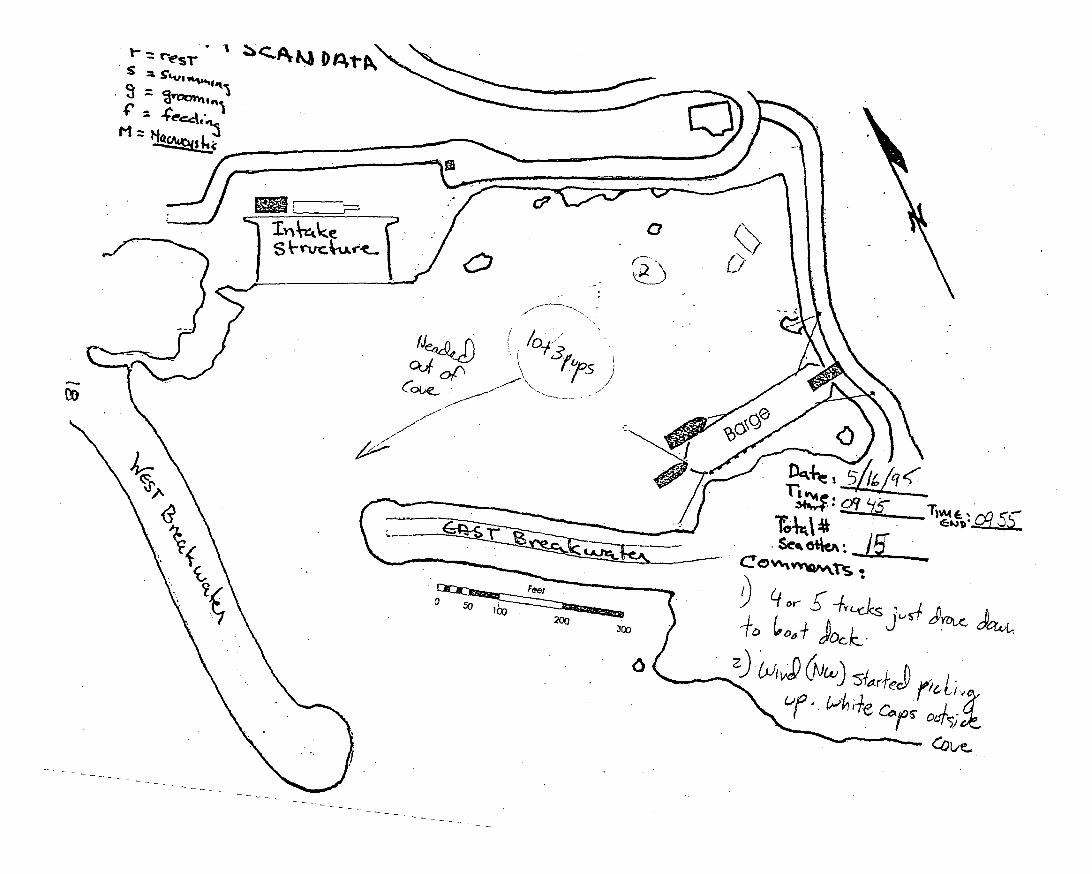
_ = s,S "e. ,
~zp~ D41-&
a
/0
See, 0~4V
•°5 ,•20
530
6
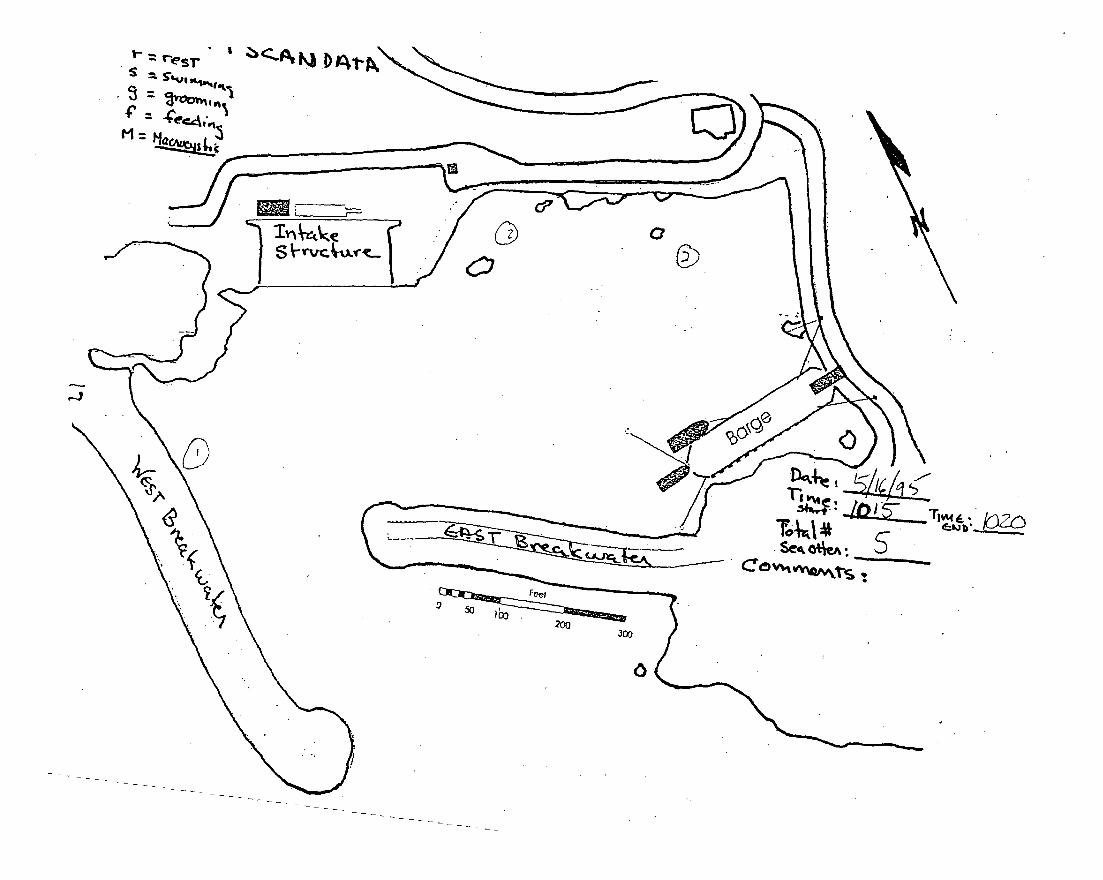
U
S
9C: 4 "'stl::
A
0
Torl t --U I -
Feet
20o
0
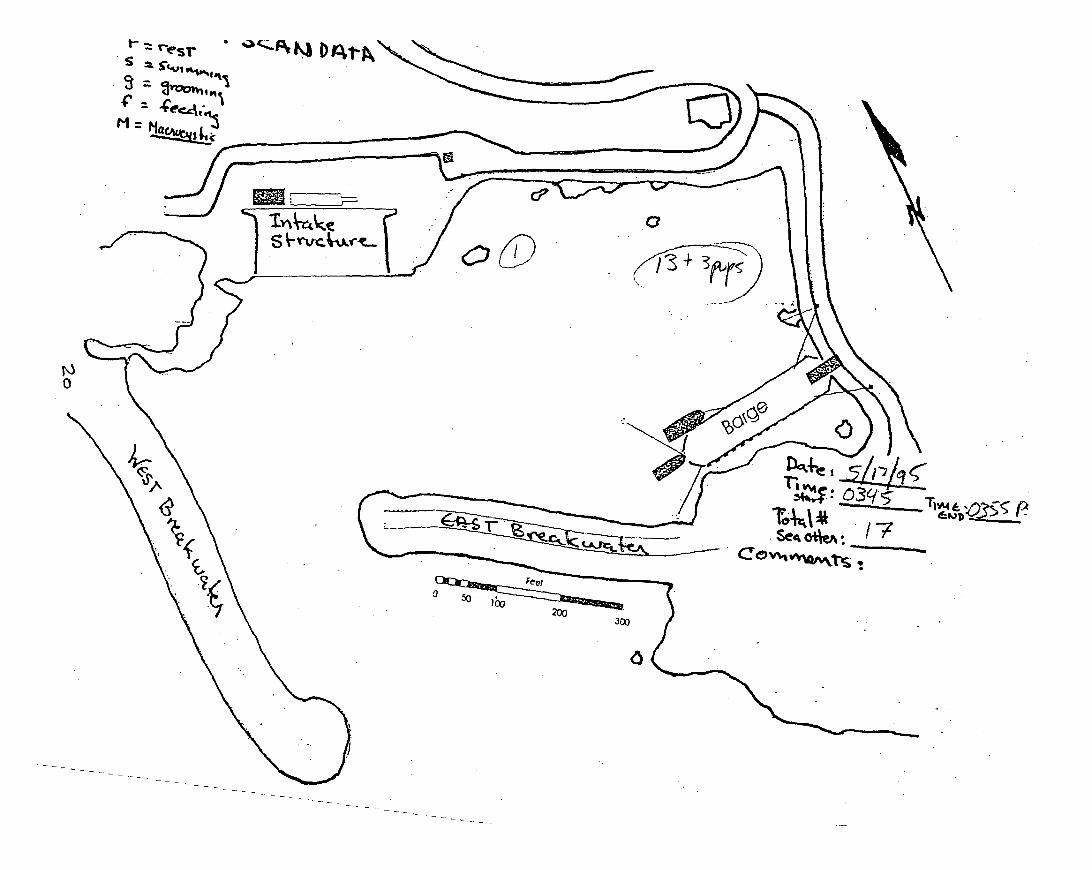
` =vS s-S-= IVL%~ t
C
0
SC4~Oikv /7Z55P-
600S20
300
0
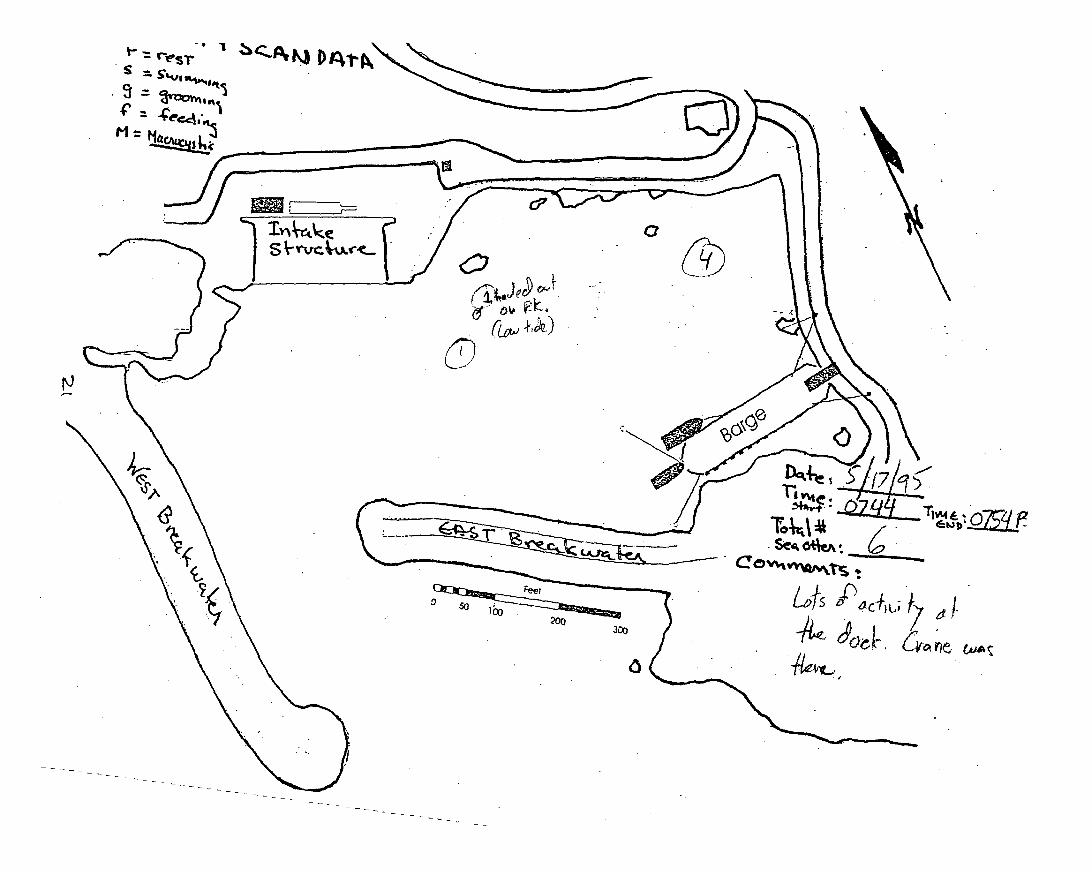
I 'l ,A
M4Alm
C
(j~ojt c
(to
nY
0]ýFeet
30
QCO44 *Iv _
LOSeoA
AJw-l~ 1
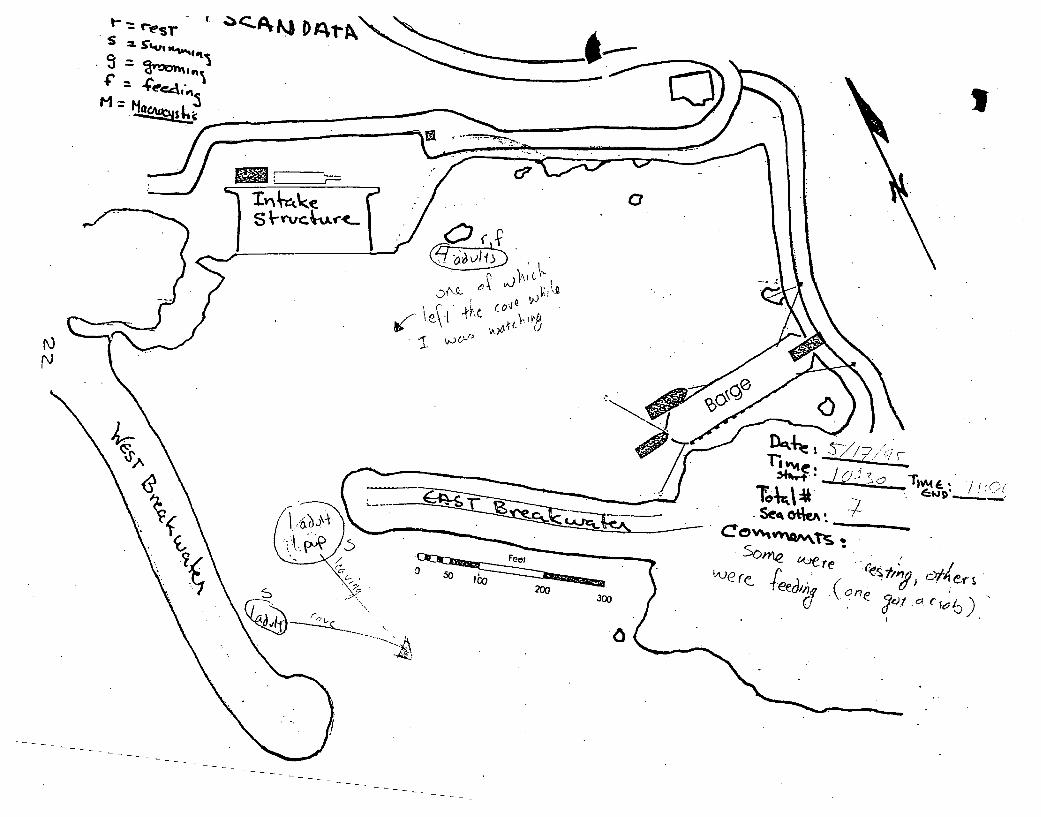
S MJCe -~ereLAuer~fe, ~*
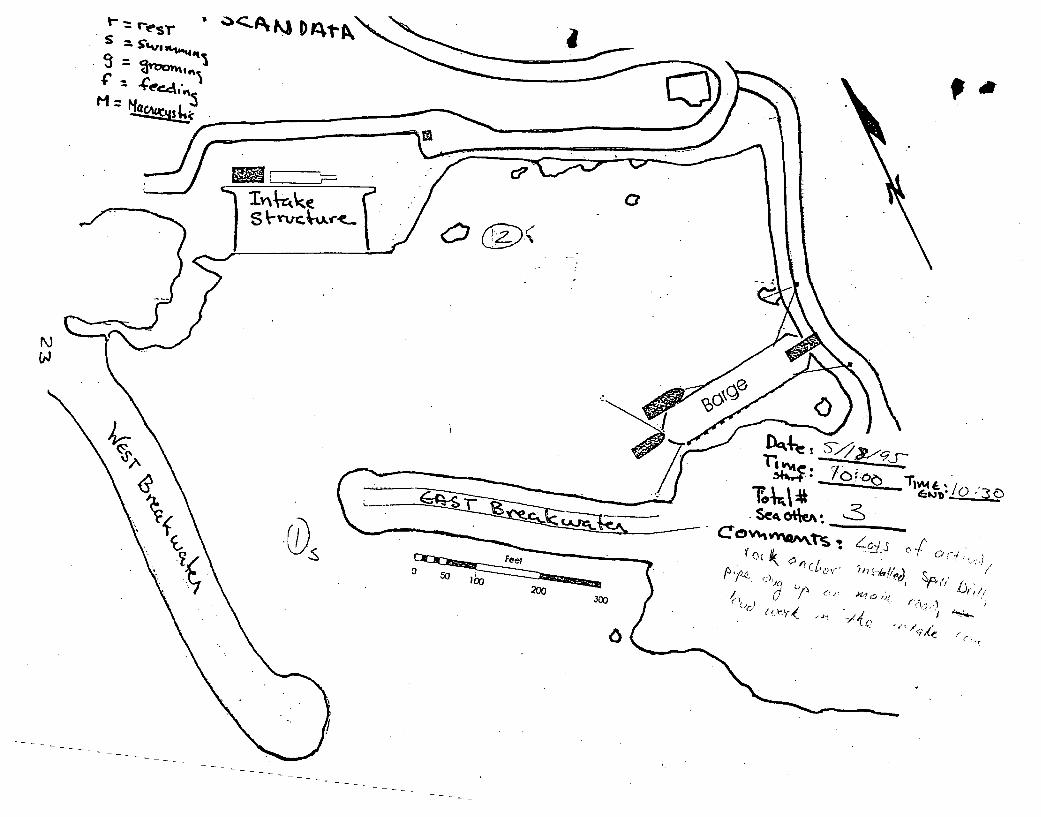
t- ` ,AK -t c4'
0
c,J
-oDssee, ot*
SeQo*v. S
lbto
0
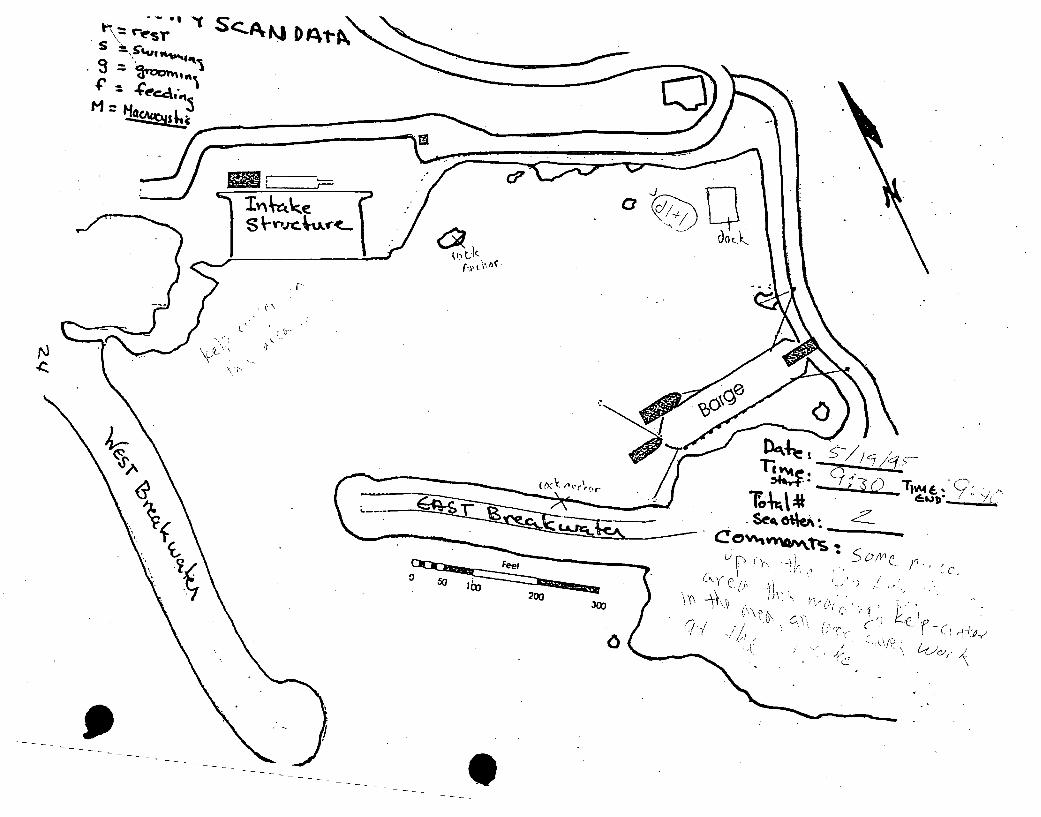
\7.r- 1
-I
0(1/
F b'
N•
ToArA'kSC4 OMMeA c
4:20,-,,
200300
a-- Y
L-r
69'.44-,--
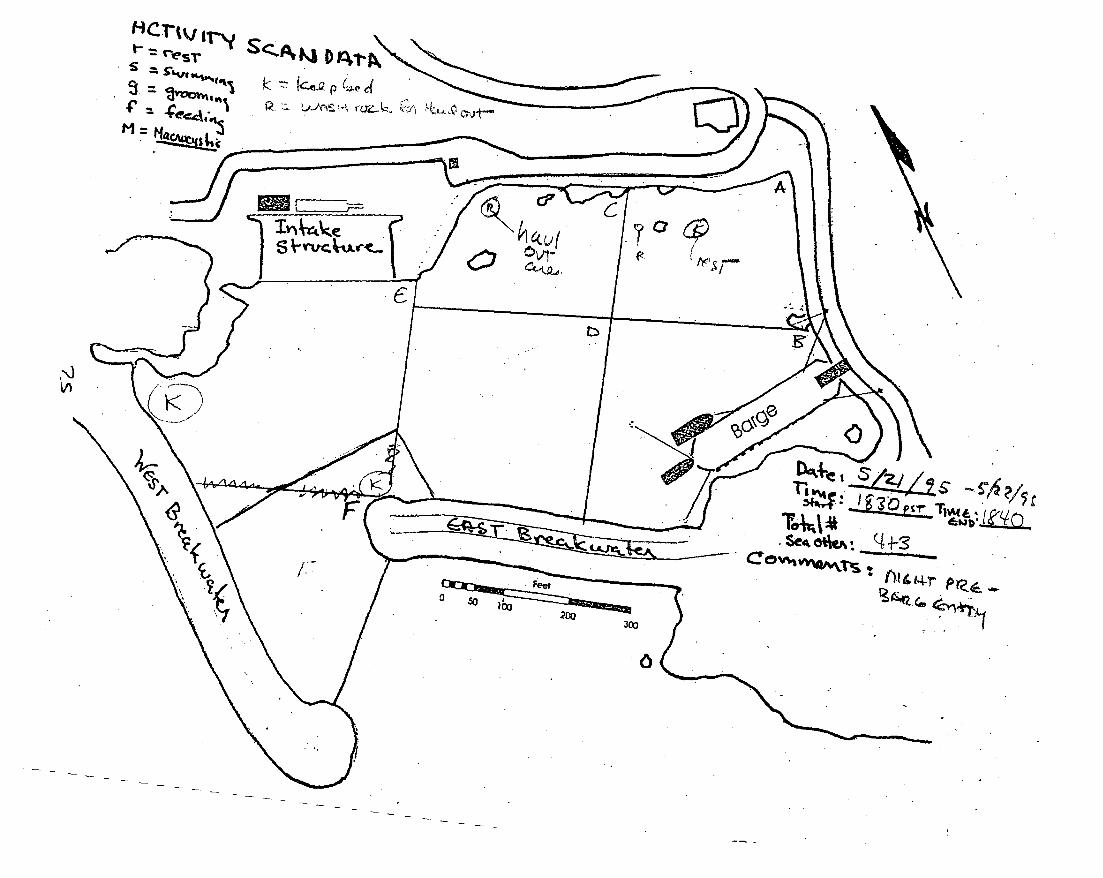
=f-)crtv
T '*'1
M~
-S<AtKiD ;. 'N
(CII-0 p (10 e( , .t.Aýýns ýA f a , 1 "0z ýcy'. crut-
,'3
r, - -- ý--i ý
TOM&
re
?1ýr
L Feet
30
0
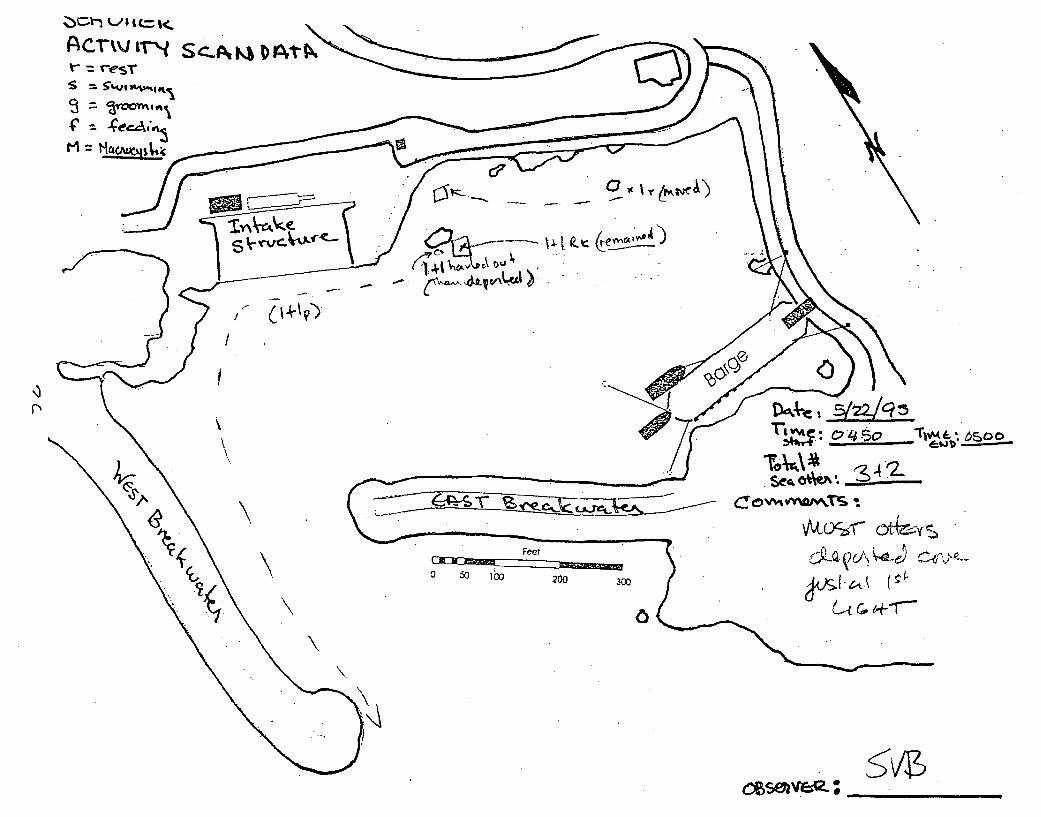
-:)C;r-I ',/ I i (= j<
Acrvtr4 Sc.-At"DATN
S SW~4%I.t.~
=4' J~ec4v~
~9c ~~4')
6- - I1:- "
II
TON 7 ~ r&l\c.___________ 6*S 4
\Feet
0 50 loo 200 300l
CovlvJot-J4
0
ý5vzcese~v~
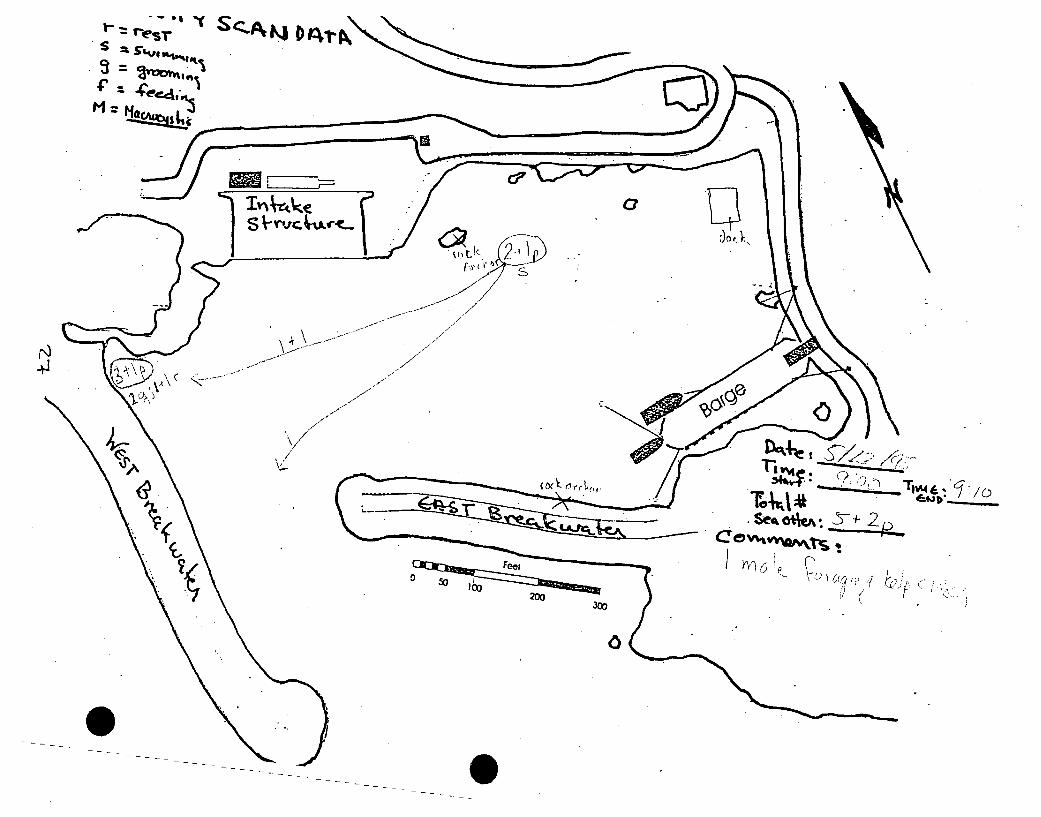
SC
resr Alms x
a
-//
<~/
)9/1V
/x
'9/
\ /'I
,KK-' 'kSee, tkA - 2*JT..
*oeas
Feet
200300
0

S~r
a
0~li- Pic"
(~b
I IV
(Zv%
!0ýFee' **50 so ic
30D
43
0
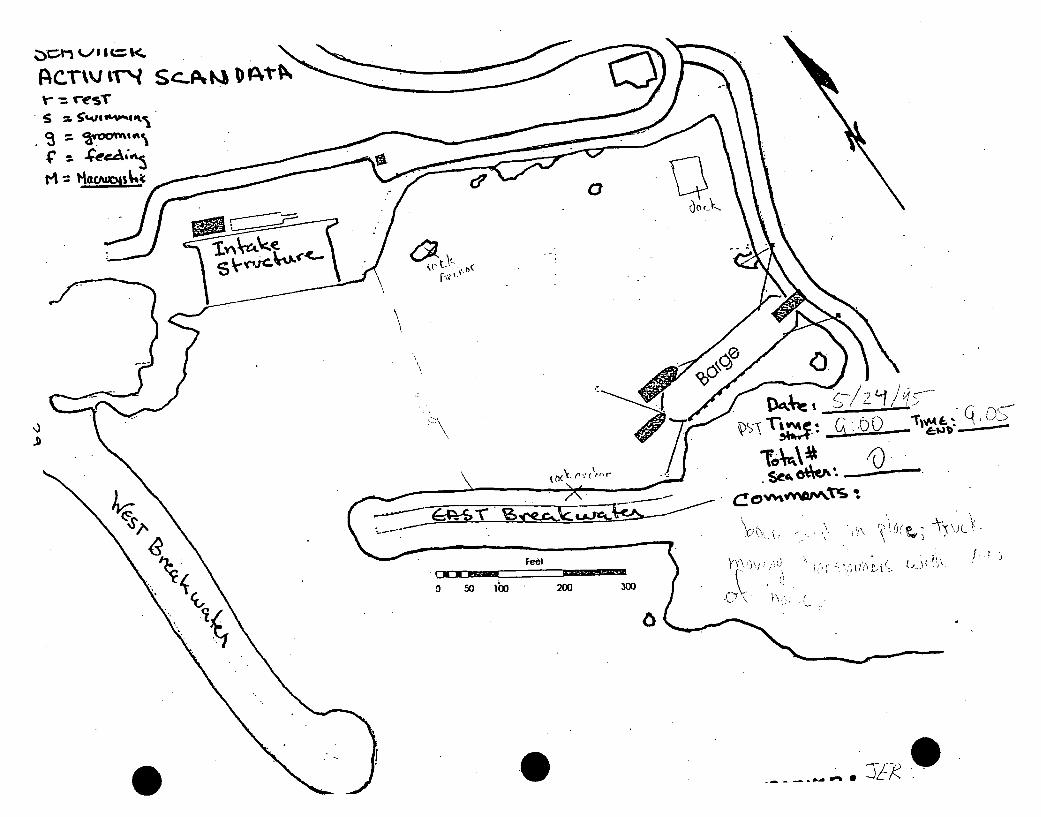
14CThvI" sZ%4
CA 2. OT"
0
OFk
\
N
TtvArM ISee,4~tA
Feel
C) 50 100) 200 300
I,.
0
IZ
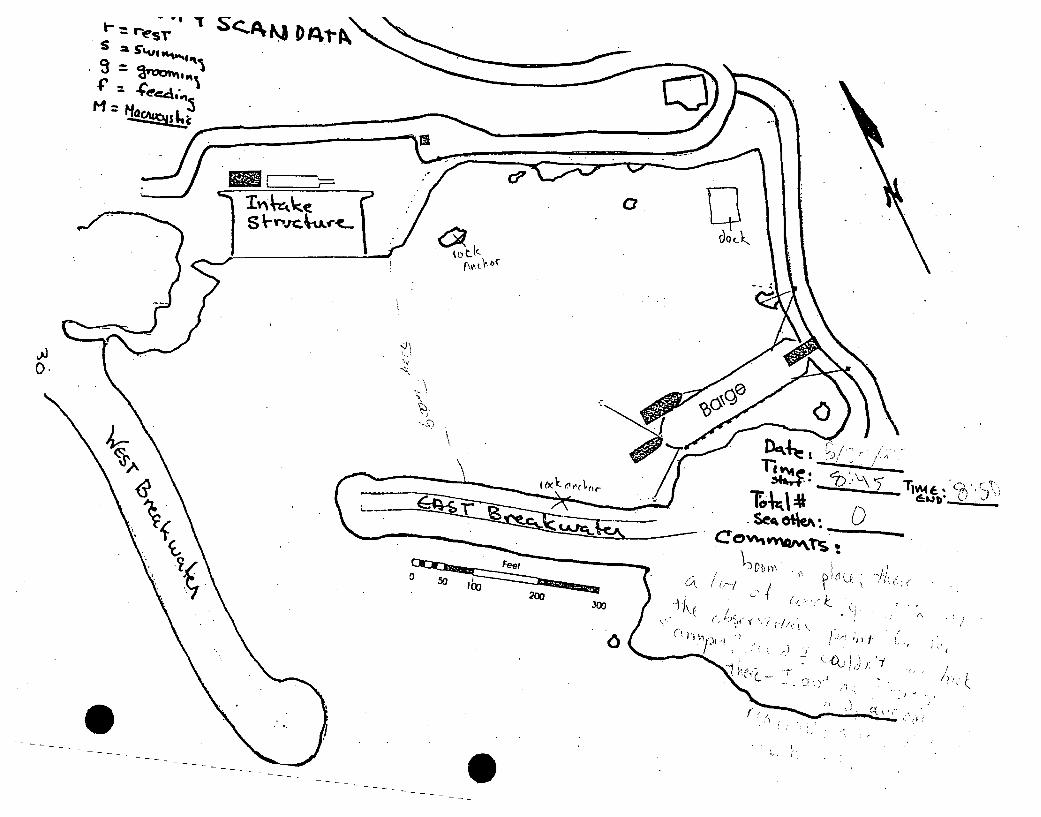
-.4 , T N*S esri~
0
ol,ý
r., a,,.ý, bc
0*.\
%.
see,c0av%%4lf-Ts ..
0 50 l
20o300
V) tw"N K/:(.L.
S.,s y'~, -,ý' I ý,
/\
a'1
j (Q~.;g7
0 If,,.-,
0
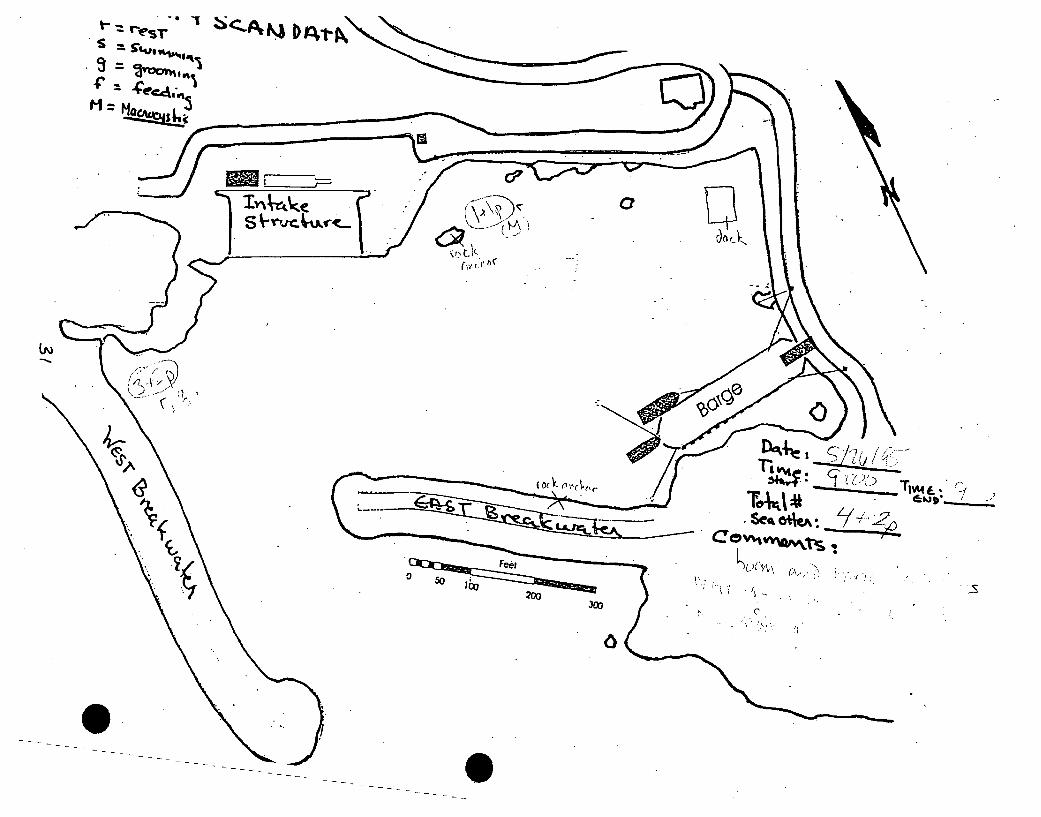
ý -1 1 %reST
I rt 5SW;
0
(.y,
Fei~t
20o300
K"I'
C
a
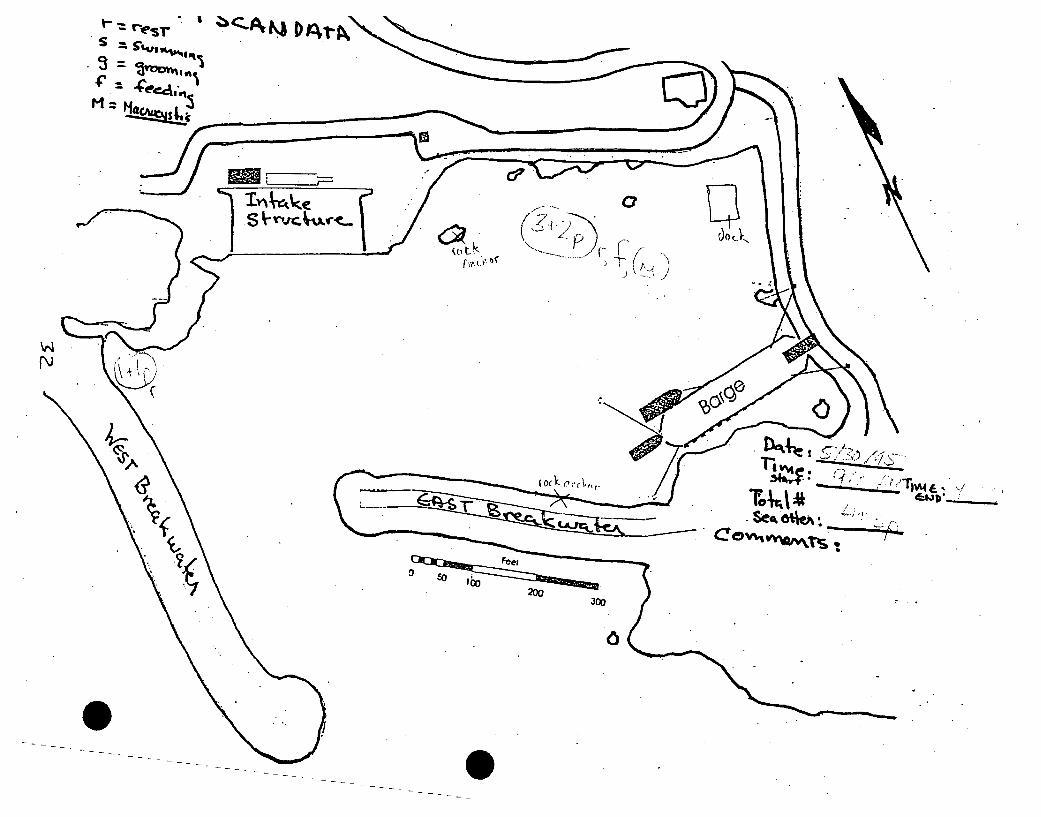
'r '= rvs
s
f14___
DIrk
02
f2-.--- ~---~---, F- £
) ~ .)
"4F\j
SCC4 64ACA
" 20030D
0
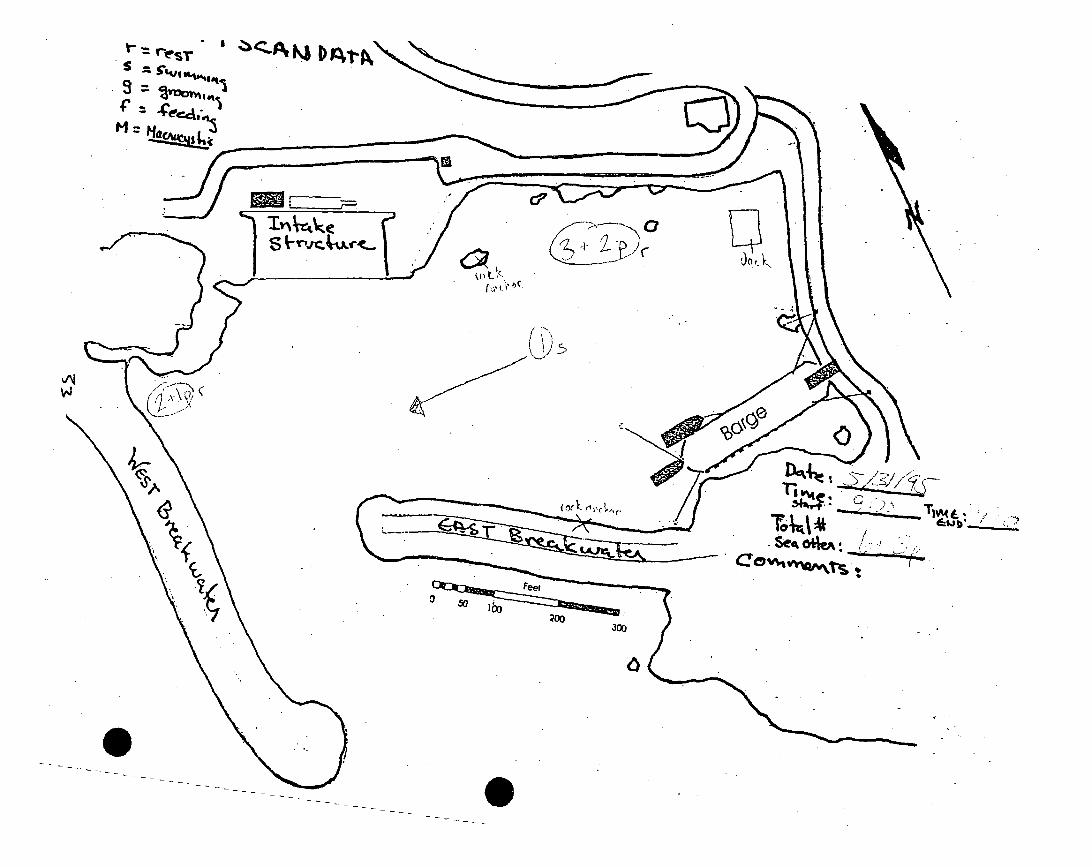
'r =rs * AK) I~4i-~~,
-~ a
r,-t t * C
Cs'sw
ToQ*4V
20530
0

resr '
0
0S'
C,
See, o*teA
Fees
30o
10
00