Embed Size (px)
Citation preview

Journal of Atmospheric and Solar-Terrestrial Physics – Preprint_____________________________________________________________________________________________
1
Simultaneous Observations of Mesospheric Gravity Wavesand Sprites Generated by a Midwestern Thunderstorm
Sentman, D.D.1, E.M. Wescott1, R.H. Picard2, J.R. Winick2, H.C. Stenbaek-Nielsen1,E.M. Dewan2, D.R. Moudry1, F.T. São Sabbas1, M.J. Heavner3, and J.Morrill4
1. University of Alaska, Geophysical Institute, Fairbanks, AK 99775, USA2. Air Force Research Laboratory, Space Vehicles Directorate, Hanscom AFB, MA, USA3. Los Alamos National Laboratory, NIS-1, Los Alamos, NM, USA4. Naval Research Laboratory, E.O. Hulburt Center for Space Research, Washington, D.C. USA
Abstract
The present report investigates using simultaneous observations of coincident gravity wavesand sprites to establish an upper limit on sprite-associated thermal energy deposition in themesosphere. The University of Alaska operated a variety of optical imagers and photometers attwo ground sites in support of the NASA Sprites99 balloon campaign. One site was atop a U.S.Forest Service lookout tower on Bear Mt. in the Black Hills, in western South Dakota. On thenight of 18 August 1999 we obtained from this site simultaneous images of sprites and OHairglow modulated by gravity waves emanating from a very active sprite producing thunderstormover Nebraska, to the southeast of Bear Mt. Using 25 second exposures with a bare CCD cameraequipped with a red filter, we were able to coincidentally record both short duration (<10 ms)but bright (> 3 MR) N2 1PG red emissions from sprites and much weaker (~1 kR), but persistent,OH Meinel nightglow emissions. A time lapse movie created from images revealed short period,complete 360o concentric wave structures emanating radially outward from a central excitationregion directly above the storm. During the initial stages of the storm outwardly expandingwaves possessed a period of 10τ ≈ min and wavelength 50λ ≈ km. Over a 1 hr interval thewaves gradually changed to longer period 11τ ≈ min and shorter wavelength 40λ ≈ km. Overthe full 2 hr observation time, about two dozen bright sprites generated by the underlyingthunderstorm were recorded near the center of the outwardly radiating gravity wave pattern. Nodistinctive OH brightness signatures uniquely associated with the sprites were detected at thelevel of 2% of the ambient background brightness, establishing an associated upper limit ofapproximately T∆ < 0.5 K for a neutral temperature perturbation over the volume of the sprites.The corresponding total thermal energy deposited by the sprite is bounded by thesemeasurements to be less than ~1 GJ. This value is well above the total energy deposited into themedium by the sprite, estimated by several independent methods to be on the order of ~1-10 MJ.

Journal of Atmospheric and Solar-Terrestrial Physics – Preprint_____________________________________________________________________________________________
2
1. Introduction
Sprites are transient (several to 10’s of ms) optical emissions generated within themesosphere (50-90 km) by large lightning discharges [e.g., Sentman and Wescott, 1993; Lyons,1994; Fukunishi et al., 1996; cf. Sentman, 1998]. Several mechanisms have been proposed forsprite production [see review by Rowland, 1998], all based on impact excitation of ambientmolecular species by electrons accelerated in transient mesospheric electric fields following alightning discharge in the underlying thunderstorm. The most generally accepted mechanism isthe quasi-electrostatic mechanism of Pasko et al. [1997a]. Imaging and photometricmeasurements reveal a continuous range of sprite brightnesses, from a few tens of kR for smallevents to several MR for the brightest forms [Moudry et al., 2001]. Studies of sprite occurrenceover thunderstorms in the central U.S. show that sprites tend to occur predominantly over thetrailing stratoform regions of large mesoscale convective systems (MCSs) of size greater than~20,000 km2 [Lyons, 1996], although studies in other regions of the world show them also tooccur over smaller storms [Fukunishi et al., 1999; Su et al., 2002].
Spectroscopic studies have shown the optical emissions of sprites are predominantly from thered 3 3
2N B ( ') A ( '')g uv v+Π → Σ 1PG (First Positive) bands of neutral molecular nitrogen [Mendeet al, 1995; Hampton et al., 1996; Heavner et al., 2000]. Weak ion signatures have beenreported in both red + 2 2
2N (A X )g+Π → Σ Meinel emissions [Bucsela et al., 1998; Morrill et al.,
1998] and blue + 2 22N (B X )u g
+ +Σ → Σ 1NG (First Negative) emissions [Armstrong et al., 1998;Suszcynsky et al., 1998; Takahashi et al., 1998; Armstrong et al., 2000]. Electron impactexcitation and ionization of O2 are also believed to occur [Pasko et al., 1997a], but collisionalquenching suppresses optical emissions from these species. The characteristic electron energyof a few eV leading to the N2 1PG emissions also leads to excitation of rotational and vibrationalstates of the ambient species, within both the observed transition states of N2 [Cartwright, 1978;Green et al., 1996] and a larger group of quenched states of both N2 and O2 [Morrill et al., 2002;Bucsela et al., 2002]. Thus, while the N2 1PG emissions constitute the bulk of the opticalenergy observed, they are likely to represent only a small fraction of the total energy deposited inthe mesosphere at the location of a sprite.
Establishing the total energy deposited by sprites in the middle and upper atmosphere isimportant within the context of the overall energy budget of this region, including inputs fromother external sources, such as by solar EUV or auroral particle precipitation from above, or bygravity waves from below. Stenbaek-Nielsen et al. [2000] have presented observationssuggesting local composition effects in sprite tendril formation, but the relative importance oflarge scale composition or dynamical effects induced in the embedding medium dependssignificantly on the total amount of energy available compared to other sources. In situ diagnosisof the energy deposition associated with the electrical perturbation of sprites is hampered by thedifficulty of placing instruments within the discharge region at the time of the events. One isthus led to consider signatures of secondary effects produced in the medium by the electricalperturbation that produces sprites, such as the ambient airglow layers in the upper atmosphere.
Sprites typically extend to altitudes of 85-90 km [Sentman et al., 1995], and thus penetrateinto the airglow regions maintained in the mesosphere by a balance of various chemical andtransport processes. The visible volume of large sprites often exceeds 104 km3 for large events[Sentman and Wescott., 1993]. Their duration is short (few ms), so thermal energy deposited inthe neutral atmosphere within a sprite would be expected to produce an impulsive pressure pulse

Journal of Atmospheric and Solar-Terrestrial Physics – Preprint_____________________________________________________________________________________________
3
that propagates laterally outward as an acoustic wave or gravity wave. Pasko et al. [1998] haveestimated the neutral heating perturbation within streamer structures to be ∆T/T~0.2-2 % ataltitudes at altitudes of 50-60 km. High resolution imaging of sprite structures have revealedthem to be composed of multiple thin streamers [Gerkin et al., 2000], so the “filling factor,” orthe fractional volume occupied by streamers within the body of a sprite, is very small, estimatedto be ~10-4-10-3. The associated neutral temperature perturbation averaged over the full body ofthe sprite is then (0.3-3 K) x (10-4-10-3) ~ 3 x 10⁻⁵ – 3 x 10⁻² K. For a sprite volume of 1012 m3
and neutral density of 2 x 10²⁰ /cm3 at 85 km, this corresponds to a total energy range ~ 0.1 - 10MJ. Other work based on scaling of observed optical emission line ratios has suggested that thetotal energy deposited in the mesosphere by sprites could be as large as ~1 GJ [Heavner et al.,2000].
Given the large range of uncertainty in the energy deposition, spanning some 4 orders ofmagnitude, it was deemed worthwhile to search for a possible temperature perturbation signatureby way of correlated effects on the nightglow emissions [Sentman et al., 1999], both as a way tonarrow the range of uncertainty and to clarify the nature of possible secondary effects on airglowprocesses. Positive detection of sprite-correlated nightglow pulses would provide a method forindirectly determining the underlying thermal energy deposition associated with the sprites, aswell as other related processes, while a negative result would permit establishing an upper limiton the energy deposition.
Rowland et al. [1996] and Pasko et al. [1997a,b] have considered the converse problem, thatof the manner in which effects of gravity waves on the background might play a role indetermining the ignition location or structure of sprites. Siefring et al., [1998] have presentedexamples of apparent close association between sprites and short period gravity wave structuresobserved during one of the EXL98 aircraft flights, suggesting a possible linkage between thetwo.
In Section 2 the linkage between gravity waves and OH emissions is reviewed. Section 3describes the experiment that yielded the observations, which are presented in Section 4. Section5 describes the analysis of the observations, their interpretation in terms OH Meinel emissions,and the corresponding energy limits on sprite deposition derived from these observations. Ashort discussion on related issues is given in Section 6. Results and some additional commentsabout the observations conclude the paper in Section 7.
2. OH Chemistry and Wave Dynamics Background
Of particular interest to this study is the OH nightglow layer located at ~85 km, first reportedby Meinel [1950]. The production of vibrationally excited hydroxyl OH(v) in the nighttimemesosphere is due to a set of coupled chemiluminescent reactions whose basic processes involveozone destruction by atomic hydrogen [Bates and Nicolet,1950]. The set of reactions needed toexplain observations has subsequently been expanded to include other odd oxygen and oddhydrogen species [Makhlouf et al., 1995],

Journal of Atmospheric and Solar-Terrestrial Physics – Preprint_____________________________________________________________________________________________
4
10 470/3 2 1
112 2 2
34 2.32 3 3
32 1.62 2 4
112 5 5 5
5 5
H O OH ( 9) O 1.4 10O HO OH( 6) O 3 10
O O O 6 10 (300 / )H O HO 5.7 10 (300 / )OH( ) O H O ( ) 10 , ( 0) 3.9
( 1) 10.5, ( 1) 25
Tv k ev k
M M k TM M k T
v k a v a va v a v
− −
−
−
−
−
+ → ≤ + = ×+ → ≤ + = ×
+ + → + = ×+ + → + = ×
+ → + = × = == = > =
(1)
where T is the ambient neutral temperature in K, and k1...k5 are rate coefficients in cm3/s for two-body reactions, and cm6/s for three-body reactions involving a third species M, either N2 or O2.For the first two reactions the total rate coefficient for production of all vibrational states v islisted. Near the mesopause the neutral temperature is T ~ 170K. The vibrationally excited statescan be quenched by collision with major species or chemically by the OH(v) + O reaction above,but the major loss over most of the region of interest is by radiation,
,OH( ) OH( ) , ,v v vv v v h Aν −∆→ − ∆ + (1’)
where ,v v vA −∆ is the Einstein coefficient for spontaneous emission, v = 1,…,9, and 0 v v< ∆ ≤ .
The observed radiance ,v v vI −∆ from the vibrational level v to level v v− ∆ transition is then the
integral of the volume emission rate ,v v vA −∆ [OH(v)] along the line-of-sight, where [OH(v)] is the
density of species OH in vibrational state v. The nighttime airglow, or nightglow, generated bythese reactions produces brightest emissions (hundreds of kR) from the 2OH (X , =2)vΠ ∆ first-overtone Meinel sequences at wavelengths 1.4 - 2.2 µm, with the total intensity of all emissionsequences exceeding several MR (Chamberlain, 1961).
Gravity waves produced by convective core motions of vigorous thunderstorms propagateinto the high atmosphere and constitute a major source of mechanical energy and momentuminto this region from below [Swenson and Liu, 1998]. Among other effects, these thunderstorm-generated gravity waves can modulate the optical emissions in the nightglow layer [Krassovsky,1972] that are detectable from the ground [e.g. Taylor and Hapgood, 1988; Taylor et al., 1991;Turnbull and Lowe, 1991] and from orbiting imaging platforms [Dewan et al.,1998; Picard etal., 1998]. The emission intensity of the OH nightglow is sensitively dependent on small wave-induced temperature fluctuations [Makhlouf et al., 1995] and readily responds to thunderstorm-generated gravity wave temperature fluctuations to produce brightness variations such asreported by Taylor et al. [1995].
The effect of a gravity wave on the OH nightglow emissions is determined by computing thelinear response of the coupled set of equations (1) and (1’) to a small temperature perturbation
T∆ . Because the rate coefficients in the reactions above possess different temperaturedependencies, the steady-state emissivity is also temperature dependent. The differentialresponse of the OH Meinel emission intensities IOH to small temperature perturbations was firststudied by Krassovsky [1971] and may be expressed in terms of the differential temperatureperturbation as

Journal of Atmospheric and Solar-Terrestrial Physics – Preprint_____________________________________________________________________________________________
5
OH
OH
dI dTI T
η≈ , (2)
where η is a factor that depends on wave parameters including frequency and phase speed. Formesosphere conditions and the set of reactions in (1) and (1’) above, the factor η ranges from
10η = for phc =40 m/s to 5η = for phc = 140 m/s [Makhlouf et al., 1995]. Hence, a smalltemperature change produces a correlated OH optical emissivity response amplified by a factorof 5-10. To scale optical emission variations to the underlying temperature effects requiresknowledge of the amplitude and phase of the η parameter, which can be determined from themeasurable parameters of the wave modulating the OH emission. In the present study we searched for transient, in-situ heating effects at the mesopauseproduced by sprites through their effects on the modulation of the nocturnal OH airglowemissions, similar to the effects produced by gravity wave modulation of the OH emissions.While making the measurements of sprites above a very vigorous thunderstorm we unexpectedlycaptured a well defined example of an outwardly expanding, gravity wave driven concentricripple pattern in OH emissions driven by the thunderstorm, similar to effects first reported byTaylor and Hapgood [1988], and further described by Dewan et al. [1998]. The dispersionrelation extracted from these narrow band waves provided a key parameter for characterizing theperturbation response of OH needed to evaluate the sprite heating parameters.
3. Experiment
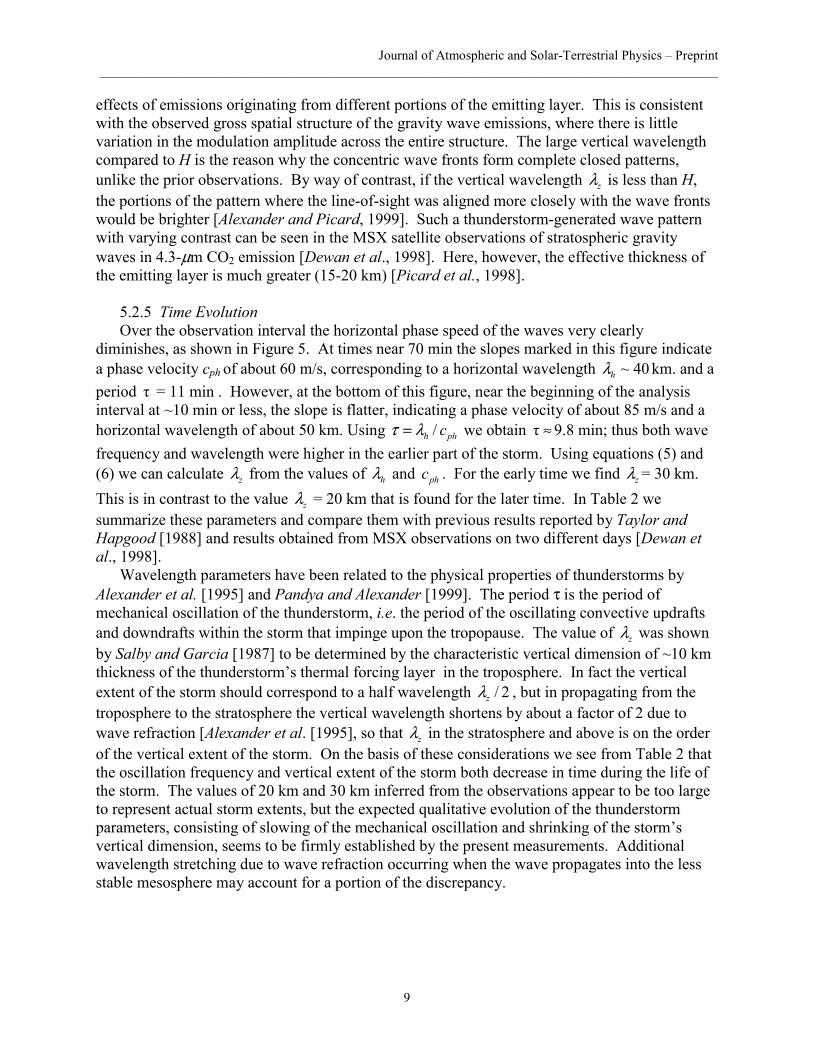
Observations were performed during August, 1999 as part of the NASA Sprites99 campaign[Bering et al., 1999; Bering et al., 2002] at a U.S. Forest Service fire observation tower on BearMt. (latitude 43.88N, longitude 103.75W, altitude 2150 m), located in the Black Hills near thecity of Custer, South Dakota. The observing camera was a Photometrics SenSys Model 400 768x 512 pixel x 12 bit unintensified CCD system equipped with a Kinoptic 5.7mm f/1.8 TEGEAwide angle lens. The CCD-lens combination provided a 60oH x 40oV degree field of view. Weused a Schott RG-715 715-nm red filter to pass a selected band of wavelengths in the NIR regionof the spectrum. When combined with the camera response, the camera-filter combination (NIRCCD) possessed an overall optical pass band of 715-920 nm FWHM. Figure 1 shows therespective response functions of the camera-filter system.
The OH nightglow emissions we observed are not the brightest among the several types ofnocturnal skyglow. As noted above, the brightest emissions occur in the short-wave infrared(SWIR) 2(X , =2)vΠ ∆ first-overtone Meinel sequences 1.4-2.2 µm. However, the OHintensities are significant (several tens kR) in the shorter wavelength 700-900 nm near-infrared(NIR) 2OH(X , =3,4,5)vΠ ∆ Meinel sequences [Yee et al., 1991] and are the emissions reportedhere. The CCD cooling requirements for detection of the NIR emissions are much less stringentthan for SWIR, and make it possible to use standard CCD technology operating near the upperlimits of the camera wavelength sensitivity. Thus, one may use bare (unintensified) CCDtechnology for sufficiently long exposure times (tens of seconds) [e.g., Taylor and Hill, 1991;Taylor et al., 1991a] with a relatively modest (T~ 0 C) amount of cooling and is the method weused for the present observations.

Journal of Atmospheric and Solar-Terrestrial Physics – Preprint_____________________________________________________________________________________________
6
Table 1 lists the principal OH Meinel bands and their locations within the overall instrumentpass band 700-900 nm. The pass band included the 3 3
2N (B A )g u+Π → Σ 2v∆ = (740-780 nm)
and 1v∆ = (850-900 nm) sequences, so the system was also sensitive to the sprite 1PGemissions. Hence, we were able to image both OH nightglow emissions and spritessimultaneously.
The operational mode used in the present experiment involved performing 25 sec exposuresfollowed by a 5 sec period to transfer the digital images from the camera to hard disk, yieldingan effective image frame rate of 1/30 fps. The camera was connected via an interface card to adesktop computer. Image acquisition and readout were controlled with a custom script runningwithin the main Photometrics camera control program. The computer system timer, updatedcontinuously over the Internet to maintain 100 ms accuracy absolute, was used to synchronizeimage acquisition. The resultant set of images was processed off line for histogram equalizationusing an average histogram for the entire sequence as a reference, and combined into a digitalvideo clip for further analysis and presentation. A separate intensified CCD (ICCD) televisionsystem was also operated during the campaign to obtain detailed, intensity calibrated images ofmany of the brighter sprites that registered in the NIR images.
4. Observations
On the night of 18 August 1999 over a two hr interval we obtained very clear images of bothgravity wave modulated nightglow emissions and sprites associated with a very intensethunderstorm over Nebraska. The thunderstorm is shown in GOES infrared imagery withoverlaid lightning strike information in Figure 2. Over the 3 hr period 0400-0700 UT, the centerof storm convection and lightning activity moved approximately 200 km from south-centralNebraska to eastern Nebraska/Iowa at an average speed of about 60-70 km/hr (17-19 m/s). Thisstorm track was roughly orthogonal to the observing line of sight, which approximatelypreserved the distance to the storm during the observing interval. Observing conditions wereclose to ideal, with a clear sky above the observing site permitting visual access to nightglow andsprite activity in the mesosphere above the thunderstorm.
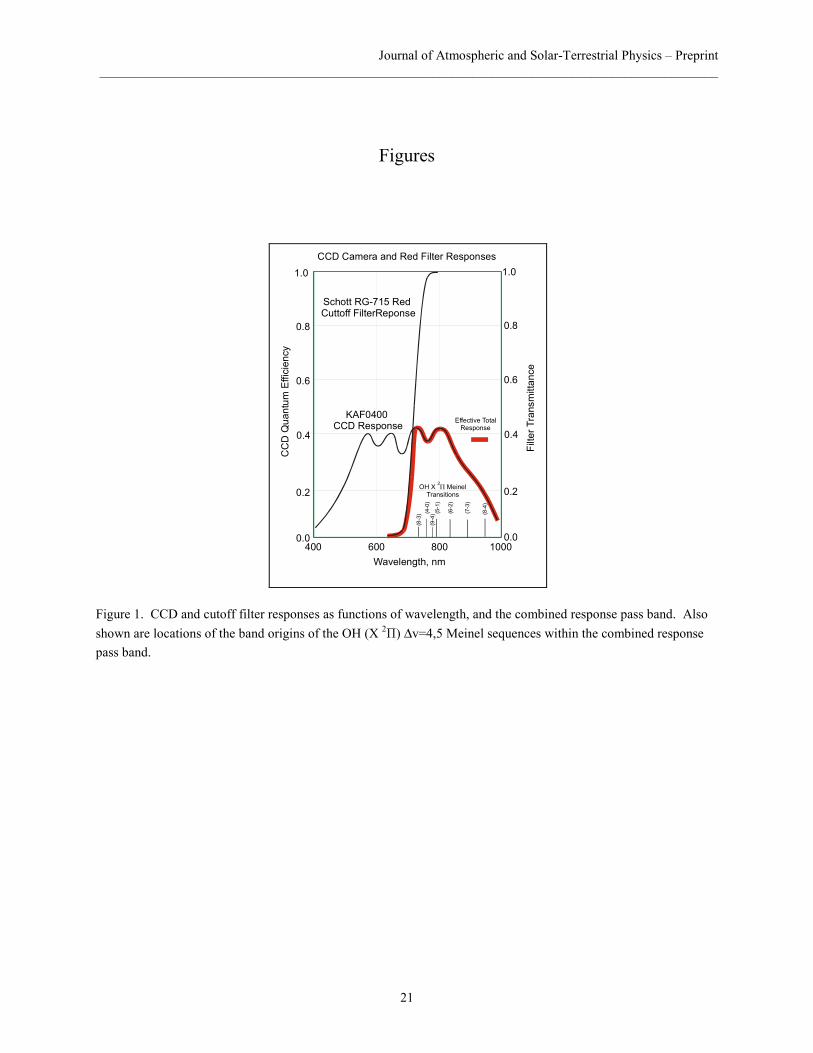
Figure 3 shows one of the NIR CCD images obtained during the observation interval. In theforeground near the bottom of the large image are seen the lights of the city of Custer, SD, and tothe left the display lights of the Crazy Horse Monument. Left lower center there is a large sprite,shown in high resolution as a cutout from the ICCD TV camera. The stars are clearly visible atthe top of the figure. The hazy elliptical features in the lower central portion of the figurelabeled as “Concentric Expanding Gravity Wave Ripples” are the gravity wave signatures weseek. When the 30 sec images are viewed as a video sequence, these elliptical features exhibit adistinctive outward propagation pattern originating from a well defined center. Unlike priorobservations of such concentric wave structures [Taylor and Hapgood, 1988; Dewan et al.,1998], the concentric wave patterns here are unusual in that they form complete 360o closedrings. The reason for this surprising difference will become clear in Section 5.2.4.
The gravity wave structure shown in Figure 3 may be mapped onto a flat surface todetermine the relationship of the various features in the figure to the underlying thunderstorm.We projected each pixel in the image onto the 85 km tangent plane assuming the analysis strip(see Section 5.2.1 below) lies in the tangent plane. Figure 4 shows the resultant map from Figure3 laid over the corresponding GOES weather map of the Nebraska storm. This projection clearlyassociates the gravity wave modulation structures with the underlying thunderstorm.

Journal of Atmospheric and Solar-Terrestrial Physics – Preprint_____________________________________________________________________________________________
7
5. Analysis
5.1. Identification of OH Meinel Emissions
The video sequence shows circular waves radiating outward from a region centered over thethunderstorm in eastern Nebraska. We interpret these propagating waves as being mesosphericnightglow emissions modulated by gravity waves generated by the underlying thunderstorm.There are several nightglow layers in the mesosphere that are candidate sources for the observedemissions. Only two fall within our pass band. The 700-900 nm 2OH(X , =3,4,5 )vΠ ∆ Meinelsequences indicated in Figure 1 emit from a thin layer centered at an altitude of ~85 km. The O2
Atmospheric Bands 1 32O ( X )(0 0,1)g gb + −Σ → Σ − fall within our pass band, but the atmosphere is
optically thick for the (0, 0) component of these emissions at 761.9 nm and it is therefore notobserved at the ground. The brightness of the (0,1) emissions at 859.8 nm is typically ~300 R[Slanger et al., 2000], and therefore substantially weaker than the intensities I ~ 1 kR detectedhere (see Section 5.4.1 below) . The remaining two nightglow sources, the InfraredAtmospheric Bands O2
1 3( X , 1) (~ 1.5 m)g ga v hν µ−∆ → Σ ∆ = + and the neutral sodium Na
(2P o1/ 2,3/ 2 → 1S1/ 2 ) + hν (589 nm) D-line emissions, fall outside the instrument pass band. We
conclude that the observed emissions are most likely to be predominantly from the OH Meinelbands.
5.2 Characterization of Gravity Wave Parameters
5.2.1 Analysis MethodTo determine the phase speed and wavelength of the outwardly expanding ripples, we
established a horizontal analysis strip across the center of the ripple pattern in the image,indicated by a set of horizontal dashed lines passing through the center of the circular ripplepatterns in Figure 3. For each column the intensity was summed across 4 rows of the strip toproduce a horizontal emission profile. By assuming the emissions originate at an altitude of 85km corresponding to the OH layer, this could be converted to the corresponding horizontalemission profile as a function of transverse distance in km. One such profile was computed foreach 30 second image during the observing interval.
Figure 5 shows the results of stacking horizontal emission profiles from successive imagesinto a color-coded position-time plot, where the horizontal scale is the distance in km from theleft edge of the image at the position of the dashed lines in Figure 3. Time runs vertically frombottom to top beginning at 0400 UT. The outward propagation of the waves from the centralregion of the figure with increasing time is clearly discernible in this plot. The short upwardstreaks in the plot are stars as they pass through the (fixed) analysis strip. Sprites intersecting theanalysis strip produce signatures of short horizontal strips of width equal the width of the sprite.However, not every sprite that was captured in the images intersected the analysis strip, so thenumber of sprite signatures seen here undercounts the actual number observed of approximatelytwenty.

Journal of Atmospheric and Solar-Terrestrial Physics – Preprint_____________________________________________________________________________________________
8
5.2.3 Wave Period and Horizontal WavelengthThe wave period and horizontal wavelength may be read directly from Figure 5, and are
approximately τ ≈ 8-11 min and hλ ≈ 40 km, respectively, at 1 hr into the plot. Thecorresponding phase speed is 60-70 m/s. This period and wavelength differ from the periods of5-13 min and wavelengths of 14-25 km previously reported by Taylor and Hill [1991], but thephase speed is comparable. In Section 5.2.5 below we analyze the time evolution of thepropagation parameters that is evident in Figure 5 between the beginning and the end of theanalysis interval.
5.2.4 Vertical WavelengthThe horizontal component cph of phase velocity cp is measured to be cph ≈ 60 m/s and
horizontal wavelength λh ≈ 40 km. These results assume emission is from an altitude of 85 km.The resulting period τ is 670 sec, or 11 min.
From this information and the dispersion relation for gravity waves, one can infer other char-acteristics of the waves including the vertical wavelength λz. Gravity waves originating in thelower atmosphere propagate upward with a group velocity cg which is orthogonal to the phasevelocity cp, or the wave vector k = (kh, kz) = (2π/λh, 2π/λz), where kh and kz are the horizontal andvertical wave numbers, and λh and λz are the corresponding wavelengths. Hence, cg is directedalong the phase fronts, and the angle of elevation ϕ of the group velocity is given by
tan h
z
kk
ϕ = − (3)
Short-period waves for which cph << cs, the speed of sound, satisfy the dispersion relation
2 22
2 21 cotz
h
N kk
ϕω
− = = , (4)
where N is the Brunt-Vaisala frequency and ω = 2π/τ is the gravity wave frequency, from whichit follows that
1/ 22
2
τtan 1τB
ϕ−
= −
. (5)
Assuming a Brunt period τB = 2π/N ≈ 5 min and using (3), expression (5) yields
tan 0.51z
h
λϕλ
= = , (6)
with the result that ϕ = 27o and zλ = 20 km.Assuming the emissions originate in the OH Meinel bands, the vertical thickness H of the
emission layer is roughly 8 km [cf. Makhlouf et al., 1995]. Hence, the phase of the wavechanges very little in the z direction across the layer ( / 2)zH λ< , and one would expect to havelittle “observational filtering” of the wave modulation by destructive interference or cancellation
Journal of Atmospheric and Solar-Terrestrial Physics – Preprint_____________________________________________________________________________________________
9
effects of emissions originating from different portions of the emitting layer. This is consistentwith the observed gross spatial structure of the gravity wave emissions, where there is littlevariation in the modulation amplitude across the entire structure. The large vertical wavelengthcompared to H is the reason why the concentric wave fronts form complete closed patterns,unlike the prior observations. By way of contrast, if the vertical wavelength zλ is less than H,the portions of the pattern where the line-of-sight was aligned more closely with the wave frontswould be brighter [Alexander and Picard, 1999]. Such a thunderstorm-generated wave patternwith varying contrast can be seen in the MSX satellite observations of stratospheric gravitywaves in 4.3-µm CO2 emission [Dewan et al., 1998]. Here, however, the effective thickness ofthe emitting layer is much greater (15-20 km) [Picard et al., 1998].
5.2.5 Time EvolutionOver the observation interval the horizontal phase speed of the waves very clearly
diminishes, as shown in Figure 5. At times near 70 min the slopes marked in this figure indicatea phase velocity cph of about 60 m/s, corresponding to a horizontal wavelength ~ 40hλ km. and aperiod τ = 11 min . However, at the bottom of this figure, near the beginning of the analysisinterval at ~10 min or less, the slope is flatter, indicating a phase velocity of about 85 m/s and ahorizontal wavelength of about 50 km. Using /h phcτ λ= we obtain τ ≈ 9.8 min; thus both wavefrequency and wavelength were higher in the earlier part of the storm. Using equations (5) and(6) we can calculate zλ from the values of hλ and phc . For the early time we find zλ = 30 km.This is in contrast to the value zλ = 20 km that is found for the later time. In Table 2 wesummarize these parameters and compare them with previous results reported by Taylor andHapgood [1988] and results obtained from MSX observations on two different days [Dewan etal., 1998].
Wavelength parameters have been related to the physical properties of thunderstorms byAlexander et al. [1995] and Pandya and Alexander [1999]. The period τ is the period ofmechanical oscillation of the thunderstorm, i.e. the period of the oscillating convective updraftsand downdrafts within the storm that impinge upon the tropopause. The value of zλ was shownby Salby and Garcia [1987] to be determined by the characteristic vertical dimension of ~10 kmthickness of the thunderstorm’s thermal forcing layer in the troposphere. In fact the verticalextent of the storm should correspond to a half wavelength / 2zλ , but in propagating from thetroposphere to the stratosphere the vertical wavelength shortens by about a factor of 2 due towave refraction [Alexander et al. [1995], so that zλ in the stratosphere and above is on the orderof the vertical extent of the storm. On the basis of these considerations we see from Table 2 thatthe oscillation frequency and vertical extent of the storm both decrease in time during the life ofthe storm. The values of 20 km and 30 km inferred from the observations appear to be too largeto represent actual storm extents, but the expected qualitative evolution of the thunderstormparameters, consisting of slowing of the mechanical oscillation and shrinking of the storm’svertical dimension, seems to be firmly established by the present measurements. Additionalwavelength stretching due to wave refraction occurring when the wave propagates into the lessstable mesosphere may account for a portion of the discrepancy.

Journal of Atmospheric and Solar-Terrestrial Physics – Preprint_____________________________________________________________________________________________
10
5.3 Other Wave Characteristics
From the wave propagation elevation angle ϕ, the ground range between the source and theregion where the wave pattern is observed in the nightglow may be determined. If we assumerectilinear propagation without refraction from wind shears, for a thunderstorm source altitude of15 km near the tropopause and an OH emission altitude of 85 km the ground range is 70 km/0.51≈ 140 km. As can be seen in Figure 3 this corresponds roughly to the radius of the observedwave pattern, so the characteristic horizontal scale size of the gravity wave effects is on the orderof a few times the height of the nightglow layer above the thunderstorm source.
The transit time from the source to the altitude where the effects are observed may beestimated to be approximately 70 km/cgz, where cgz is the vertical component of the groupvelocity of the gravity wave, given by cgz ≡ ∂ω/∂kz = (λz /τ) cos2φ, where ω =2π/τ is the wavefrequency [Dewan et al., 1998]. Substituting the current values of the wave parameters, wecalculate the vertical transit time from the thunderstorm to the mesopause OH layer to beapproximately 40-50 min. Hence, in comparing thunderstorm characteristics and gravity waveparameters, the candidate storms which can act as sources should be determined by looking atGOES images 40-50 min before the wave observation.
Over the observation interval the underlying thunderstorm moved at a speed ofapproximately 15-20 m/s, roughly 0.2-0.3 the horizontal phase speed of the gravity waves. Theregion of the nightglow layer lying directly above the thunderstorm source moves with thethunderstorm, which from Figure 3 is seen to be predominantly from right to left as observedfrom Bear Mt. looking southeastward. This movement of the thunderstorm gravity source isreflected in the nightglow modulations, which can be seen in Figure 5 as a right-to-left drift inthe brightest portion of the emissions as time progresses from bottom to top.
5.4. OH Brightness Perturbations and Associated Temperature Perturbations
5.4.1 Gravity WavesAbsolute intensity calibrations were not available for the Photometrics camera, but the
intensities of the OH emissions may be estimated from the brightness of the spritessimultaneously recorded with the broad band, calibrated high speed imager operated during theSprites99 campaign [Stenbaek-Nielsen et al., 2000]. Sprites typically persist for a few (~3-10ms) and strongly saturate the 3 MR limit of the ICCD. The large sprites observed during thisstorm are estimated to possess brightness ~10 MR. The images obtained with the PhotometricsNIR CCD register the apparent nightglow brightness to be approximately one half that of thesprites. By taking into account the sprite duration (~5 ms is a typical value) and the imageintegration time (25 sec), the brightness of the gravity wave modulated OH emissions isestimated to be (1/2)(5 ms/25 sec)(10 MR) ~ 1 kR. This brightness is comparable to the OHbrightness of 1-2 kR over a similar wavelength pass band reported by Yee et al. [1991] forobservations made during the ALOHA-90 campaign. We shall henceforth use 1 kR for the meanbrightness of the OH nightglow in our observations, recognizing that this is an approximatefigure.
The optical modulation amplitude of the outwardly expanding waves was measured to beapproximately 30% peak to peak compared to the background mean emission intensity. FromEquation (2) and using values of the phase speed given in Table 2, we estimate 7η ≈ . The

Journal of Atmospheric and Solar-Terrestrial Physics – Preprint_____________________________________________________________________________________________
11
resultant temperature perturbation associated with the concentrically expanding waves is ~4% ofthe ambient, or ~7K.
5.4.2 Inferred Upper Limit for Energy Deposited by Sprites in the OH LayerThe expected emission signature of a localized transient temperature perturbation in the
nightglow layer that significantly alters the OH emissivity is a pulse that spreads radiallyoutward from the source at the acoustic speed. We examined the observations carefully for theoccurrence of small, radially expanding ripples originating from the point where spritespenetrated the OH nightglow layer. In Figure 5 they would be expected to appear as upward-slanting “wings” originating from each sprite that fell within the analysis strip. No spritesignatures of this type were detected in the OH emissions at the level of 2% of the background atthat location. Using an assumed OH brightness of ~1 kR this negative result permits us toestablish an observational upper limit of ~20 R for the brightness perturbation in the OH pro-duced by a large sprite at altitudes ~85 km. From equation (2) et seq. and using values of thewave period and phase speed given in Table 2, we estimate 7η ≈ . The corresponding brightnessperturbation / 2%I I∆ < translates to an upper limit for the corresponding neutral temperatureperturbation /T T∆ < 0.003, or T∆ < 0.5 K at the altitude of the mesopause.
The upper limit T∆ < 0.5 K for the temperature perturbation may be converted to an upperlimit for the thermal energy deposited into the local medium by the sprite. If we assume thatmost of the energy associated with electron impact excitation is ultimately transferred intothermal energy by collisions with neutrals, then the total energy associated with this process maybe estimated as n BE N k V T∆ ≈ ∆ , where Nn is the number density of neutrals, 231.38 10Bk −= ×J/K is Boltzmann’s constant, and V is the effective volume of the portion of the spriteintersecting the OH layer. This volume is estimated using the vertical thickness ~7 km of theOH emission layer and a horizontal cross section of 108 m2 of the sprite where it penetrates theOH layer, yielding V~7 x 10¹¹ m3. With neutral density Nn=2 x 10²⁰/m3 at an altitude of 85 kmand ∆T<0.5 K, we arrive at an upper limit ∆E<1 GJ for the associated total thermal energydeposited in the OH layer. As will be shown in the next section, this upper limit is very muchgreater than the characteristic energies deposited by sprites in this region.
5.4.3 Estimate of Total Energy Deposited by Sprites Into the MesosphereTo estimate the total energy deposited by the large sprites observed in association with the
thunderstorm studied here we use the method presented by Heavner et al. [2000], withparameters adapted to the present problem. The method derives from estimates of total opticalenergy and electron temperature, and scales the problem to include contributions fromunobserved infrared emissions, quenching, and inelastic collision effects from N2. The opticalenergy in the present case may be estimated from the total brightness and cross section of thesprite, and the duration of the optical emissions. The brightness B(R) in Rayleighs is given by[Chamberlain, 1961, Appendix II] 6(R) 10 ( )
pathB F r dr−= ⋅ ∫ , where the integral is taken along
the line of sight through the source, and where F(r) is the column emissivity. For a brightness of10 MR, cross section of (10 km)2, and duration 3 ms we obtain a total number of photons 3 x10²² emitted by the sprite in the imager pass band. Assuming an average photon wavelength~800 nm ~ 1.5 eV for the observed photons, the total optical energy emitted is 4.5 x 10²² eV ~7.5 kJ. Using the most recent estimates for the average electron energy ~2 eV [Morrill et al.,2002] and N2 vibrational distributions [Bucsela et al., 2002], this results in an estimated upper

Journal of Atmospheric and Solar-Terrestrial Physics – Preprint_____________________________________________________________________________________________
12
limit of ~3.3 MJ for the total energy. It should be noted that this method of determining totalenergy based on optical brightness is very sensitively dependent on electron temperature when itis much less than 2 eV and should be used with caution in this regime.
The estimate of ~3.3 MJ for the total energy compares favorably with the total energy of ~2MJ independently estimated by Armstrong et al. [2001] based on a comprehensive modelcalculation for sprites of similar size and brightness. It is also of the same order of magnitude asthe total electrostatic energy available in the transient electric field following a large lightningdischarge. This latter may be estimated from W = 2
0 / 2E Vε , where 0ε = 8.86 x 10⁻¹² F/m is thepermittivity of free space, E is the amplitude of the transient electric field, and V is the volumeof the sprite. Using E ~ 300 V/m at 75 km [Pasko et al., 1997a] and assuming a volume V = 1012
m3 we obtain W~800 kJ. The range of values 800 kJ - 3.3 MJ reflects differences in modelassumptions, as well as uncertainties in the brightness/size distributions of sprites, but areconsistent enough at the level of order of magnitude to suggest a characteristic energy of ~1 MJfor large, bright sprites. The uncertainty factor associated with this value remains substantialowing to the wide variety of assumptions used in the estimates, so the estimate is probably nobetter than order of magnitude. However, even taking into account model uncertainties this issignificantly below previous upper limit estimates of ~1 GJ total energy in sprites (e.g., Heavneret al., 2000; Sentman et al., 2002), so characteristic energy estimates should be reviseddownward to the current order of magnitude estimate of ~1-10 MJ.
6. Discussion
The characteristic total energy ~1-10 MJ of a sprite estimated above is clearly much smallerthan the estimated upper limit ~1 GJ needed to produce a detectable response in the OHbrightness using the reactions (1) and (1’). If we further assume that local dissipation of spriteenergy takes place near the ~75 km altitude region of brightest optical emissions, then only somefraction of the total energy will be deposited in the higher OH layer at ~85 km, thus furtherwidening this difference. The size of the discrepancy between the required and available energyappears to effectively rule out electrical effects associated with sprites playing a significant rolein OH airglow processes by means of localized thermal heating alone.
One may speculate that other mechanisms could produce a signature. Here, we haveassumed the source mechanism for impulsive sprite production of acoustic waves is localizedJoule heating within the sprite volume. The expected effect was the launching of transient pulsesor wave packets from the sprite source where it penetrated the OH airglow layer, and theexpected signature was modulation of the temperature and the ambient OH emissions by thewave packets. Joule heating of the neutrals by quasi-electrostatic fields or induced currents inthe sprite volume is the most likely mechanism for inducing localized bulk changes to themedium. However, other consequential effects might include perturbation to the airglowchemistry of nocturnal bands besides OH that lie within the mesopause vicinity of sprites, suchas sodium or the oxygen bands, although these would be difficult to study from the ground.
Other signatures might include local spatial/temporal effects from the medium itself. Wehave focused here on the gravity wave signature, but one might also consider the infrasoundbranch of the acoustic dispersion relation and search for modulations in the optical emissions atinfrasound frequencies (~0.1-1 Hz) using ground based microbarograph measurements or HFmeasurements of the lower ionosphere.

Journal of Atmospheric and Solar-Terrestrial Physics – Preprint_____________________________________________________________________________________________
13
7. Conclusions
7.1. Principal Results
We have performed a simplified analysis on the OH gravity wave structures observedsimultaneously with sprites to determine the basic wavelength and period parameters of thegravity waves, and to extract the corresponding temperature perturbations implied by theseparameters. The absence of signatures in OH that could be associated with sprites was used toestimate an upper limit on the energy perturbation associated with the sprite. Separatecalculation of the energy in a sprite based on optical emission intensities showed that the energydeposited by a sprite in the mesosphere is well below that required to produce a detectableperturbation in the OH emissions. Our principle results are:
1. Sprites and circular, outwardly expanding patterns of optical emissions were simultaneouslyobserved in NIR 720-920 nm over an intense Nebraska thunderstorm on the night of 18August 1999. The expanding circular emission patterns are interpreted as modulation of thenightglow 2OH(X , =3,4,5)vΠ ∆ Meinel sequences at altitudes of ~85 km by gravity wavespropagating upward from the underlying thunderstorm.
2. The horizontal wavelength and period of the gravity waves underwent an evolution duringthe 2 hr observing interval. During the early stages of the storm the horizontal wavelengthwas measured to be 50 km and the period was 9.8 min, corresponding to a phase speed of 85m/s. The vertical wavelength was determined to be 30 km. Approximately 1 hr later theseparameters had evolved to 40 km wavelength, 11 min period, a markedly slower phase speedof 60 m/s and a smaller vertical wavelength of 20 km. The large vertical wavelengthcompared to the 7-km thickness of the OH emission layer results in an unusual completeconcentric wave pattern being observed, free of observational filtering effects. The verticalwavelength of the gravity waves is several times the estimated vertical dimension of theconvective pump of the underlying thunderstorm source, but the qualitative temporal changeof wave parameters is in accord with present understanding of thunderstorm dynamics.
3. The average brightness of the OH layer was estimated from comparison with simultaneouslyobserved sprites to be approximately 1 kR. The peak-to-peak modulation intensity of thegravity wave modulated OH emissions was approximately 30% of the mean during the mostintense portion of the event. This level of modulation corresponds to an underlying neutralpressure/temperature perturbation of approximately 4% about the mean. For a mesopausetemperature of ~170K the associated temperature perturbation is ~7K.
4. Sprites observed coincident with the gravity wave effects produced no discernibleperturbations or distinctive signatures in the OH emissions at the 2% brightness level. Thiscorresponds to an upper limit in the brightness perturbation of ~20 R, and an upper limit forsprite heating of T∆ < 0.5 K at the altitude of the mesopause. The corresponding totalthermal energy deposition is E∆ < 1 GJ if uniform emission brightness is assumed within thevolume of a sprite. This upper limit on the energy lies well above the total estimated energyof ~1-10 MJ deposited in the mesosphere by a sprite. The wide difference between the ~1-10MJ characteristic total energy of bright sprites and the ~1 GJ energy required to produce adetectable optical response in OH emissions indicates that sprites do not produce asignificant effect on mesospheric OH processes by means of thermal heating.

Journal of Atmospheric and Solar-Terrestrial Physics – Preprint_____________________________________________________________________________________________
14
7.2. Further Comments on Gravity Wave ObservationsWhile the principal motivation for undertaking the present work was to use possible gravity
wave signatures in airglow as a tool to extract the energy deposition of sprites in the mesosphere,the image data set provides a valuable resource in its own right for studying the gravity wavesassociated with the storm of 18 August 1999. Additional analyses that are possible with this datainclude estimating the power in the waves and comparing it with what is available in the storm,considering the efficiency of the coupling to the atmosphere. This requires taking into accountthe wave-generation mechanisms. The three principal mechanisms by which storms cangenerate waves are [M.J. Alexander, private communication]:
(a) The “moving mountain”: Shear flow over a dome of air associated with a movingconvective cell, that is a “moving mountain” figuratively, can launch “mountain” waves upward.
(b) Transient pumping: This is the mechanical forcing effect on the atmosphere from thebody force associated with the moving expanding air in the cell. There are two limits. If theforcing is impulsive, then it contains all frequencies and will tend to generate a broad spectrumof waves. According to the dispersion relation, the waves will be segregated in direction by theirfrequency, with short-period waves propagating more nearly vertically and longer period wavespropagating in a more horizontal direction. On the other hand, there is evidence that quasi-sinusoidal oscillations of the convective air column occur in thunderstorms. Such oscillationswould give rise to periodic forcing and generate quasi-sinusoidal waves. These waves would belaunched at an angle determined by the period of the forcing and the wave dispersion relation.We have tacitly assumed this situation above in Section 5.2, as well as in Dewan et al. [1998].
(c) Transient heat source: This is the driving term in the thermal equation from the heatrelease in the storm. It tends to generate waves of given vertical wavelength λz rather than givenfrequency or period. The heated air column generates waves whose half-wavelength λz/2 isequal to the overall length of the column, as discussed in Section 5.2.5.
These mechanisms all operate simultaneously with varying relative contributions to the totalenergy input into the wave field and are all seen in the numerical simulations of convective wavegeneration [Alexander et al., 1995; Pandya and Alexander, 1999]. For the present set ofobservations of concentrically expanding waves emanating from a point above a thunderstorm,the original explanation offered by Taylor and Hapgood [1988] appears to hold. In that report,the occurrence of concentric circular waves in the OH airglow assumed that the thunderstormwas a quasi-monochromatic source of gravity waves, and evidence for this was cited in the workof Anderson [1960]. Most recently, Piani et al. [2001] performed three-dimensional simulationsof gravity waves generated by a large connective thunderstorm and obtained results in strikingagreement with observations of Taylor and Hapgood [1988], Dewan et al. [1998], and thepresent work. Thus, the cause of the observed concentric patterns appears to be well understood.
Finally, the duration of excitation at the center of the outwardly expanding gravity waveripples may be interpreted as being caused by periodic or quasi-periodic ringing at thetropopause due to pumping by the buoyant air column in the convective cell below. Theresultant pressure pulse is transmitted through the stratosphere and mesosphere at the pumpfrequency. The combination of spatially concentric localization of the gravity wave signaturesand their quasi-monochromatic temporal oscillations would seem to suggest a compact source atthe tropopause with a characteristic pump period reflecting the convective column dynamics.The long duration of the gravity wave signatures suggests that the source must have been at leastnarrow band/quasi-periodic.

Journal of Atmospheric and Solar-Terrestrial Physics – Preprint_____________________________________________________________________________________________
15
AcknowledgmentsThis research was partially supported by NASA Grants NAG5-5019 and NAG5-0131 to the
University of Alaska. RHP, JRW, and EMD are grateful for the support of Kent Miller of theAir Force Office of Scientific Research, and RHP acknowledges useful discussions with JoanAlexander. MJH acknowledges support from NIS-1 at Los Alamos, and JM from 6.1 funds atthe Naval Research Laboratory. We thank R.A. Armstrong for discussions on the energyproblem of sprites, and V.P. Pasko for useful suggestions. Special thanks are extended to theU.S. Forest Service in Custer, SD for permitting us to use the lookout tower at Bear Mountainduring the Sprites99 Campaign. The observations described here were originally presented at the1999 Fall Meeting of the American Geophysical Union [Sentman et al., 2000]. The video clipexhibiting the gravity waves and sprites discussed herein is available on request [email protected].

Journal of Atmospheric and Solar-Terrestrial Physics – Preprint_____________________________________________________________________________________________
16
References
Alexander, M.J., and R.H. Picard, Evaluating the importance of convectively generated wavesobserved by the MSX satellite to middle atmosphere dynamics, EOS Trans. Am. Geophys.Union, 80, F207, 1999.
Alexander, M.J., J.R. Holton, D.R. Durran, The gravity wave response above deep convection ina squall line simulation, J. Atmos. Science, 52, 2212-2226, 1995.
Anderson, C.E., Cumulus Dynamics, Pergamon Press, New York, 1960.Armstrong, R.A., J.A. Shorter, M.J. Taylor, D.M. Suszcynsky, W.A. Lyons and L.S. Jeong,
Photometric measurements in the Sprites’95 and ’96 campaigns of nitrogen second positive(399.8 nm) and first negative (4278 nm) emissions, J. Atmos. Solar-Terr. Phys., 60, 787-799,1998.
Armstrong, R.A., D.M. Suszcynsky, W.A. Lyons and T.E. Nelson, Multi-color photometricmeasurements of ionization and energies in sprites, Geophys. Res. Lett. 27, 653-656, 2000.
Armstrong, R.A., D M Suszcynsky, W.A. Lyons, and E.A. Williams, Optical signatues, energydeposition, ionization and chemical dynamics in lightning-induced transient electrodynamicmiddle and upper atmospheric events (sprites), (Abstract), Nat. Union Radio Sci.,Boulder,CO, January, 2001.
Bates, D.R. and M. Nicolet, The photochemistry of atmospheric water vapor, J. Geophs. Res.,55, 301, 1950.
Bering, E A, Benbrook, J R, Garrett, J A, Paredes, A, Wescott, E M, Sentman, D D, Stenbaek-Nielsen, H C, and Lyons, W A, “The 1999 Sprites Balloon Campaign,” Eos Trans. AGU, 82 ,Fall Meet. Suppl., Abstract A42E-01, 1999.
Bering, E.A., J.R. Benbrook, J.A. Garrett, A.M. Paredes, E.M. Wescott, D.R. Moudry, D.D.Sentman, H.C. Stenbaek-Nielsen, and W.A. Lyons, The electrodynamics of sprites, Geophys.Res. Lett., 10.1029/2001GL013267, 13 March 2002.
Bucsela, E., J. Morrill, C. Siefring, M. Heavner, D. Moudry, D. Sentman, E. Wescott, D.Osborne, and W. Benesch, Estimating electron energies in sprites from 1NG/2PG intensityratios, EOS Trans. Am Geophys. Union, 81, Fall Meeting Suppl., Abstract A42-D04, 1998.
Bucsela, E., J. Morrill, M. Heavner, C. Siefring, S. Berg, D. Hampton, D. Moudry, E. Wescottand D. Sentman, N2(B3Πg) and N2
+(A2Πu) vibrational distributions observed in sprites, J.Atmos. Solar-Terr. Phys. (this issue), 2002.
Cartwright, D.C., Vibrational populations of the excited states of N2 under auroral conditions, J.Geophys. Res., 83, 517-531, 1978.
Chamberlain, J.W., Physics of the Aurora and Airglow, Academic Press, New York, 1961.Dewan, E.M., R.H. Picard, R.R. O'Neil, R. R., H.A. Gardiner, J. Gibson, J.D. Mill, E. Richards,
M. Kendra, and W.O. Gallery, MSX satellite observations of thunderstorm-generated gravitywaves in midwave infrared images of the upper stratosphere, Geophys. Res. Lett. 25, 939-942, 1998.
Fukunishi, H., Y. Takahashi, M. Fujito, Y. Watanabe and K. Sakanoi, Fast imaging of elves andsprites using a framing/streak camera and a multi-anode array photometer, EOS Trans. Am.Geophys. Union, 77, F60, 1996.
Fukunishi, H., Y. Takahashi, A. Uchida, M. Sera, K. Adachi, and R. Miyasato, Occurrences ofsprites and elves above the Sea of Japan near Hokuriku in Winter, EOS Trans. Am. Geophys.Union, Fall Meeting, San Francisco, 1999.

Journal of Atmospheric and Solar-Terrestrial Physics – Preprint_____________________________________________________________________________________________
17
Gerken, E.A., U.S. Inan and C. Barrington-Leigh, Telescopic imaging of sprites, Geophys. Res.Lett., 27(17), 2637-2640, 2000.
Green, B.D., M.E. Fraser, W.T. Rawlins, L. Jeong, W.A.M. Blumberg, S.B. Mende, G.R.Swenson, D.L. Hampton, E.M. Wescott and D.D. Sentman, Molecular excitation in sprites,Geophys. Res. Lett., 23, 2161-2164, 1996.
Hampton, D.L., M.J. Heavner, E.M Wescott and D.D. Sentman, Optical spectral characteristicsof sprites, Geophys. Res. Lett., 23, 89-92, 1996
Heavner, M.J., D.D. Sentman, D.R. Moudry, E.M. Wescott, C.L. Siefring, J.S. Morrill, and E.J.Bucsela, “Sprites, Blue Jets, and Elves: Optical Evidence of Energy Transport Across theStratopause,” in Atmospheric Science Across the Stratopause (D. Siskind, editor), AmericanGeophysical Union, Washington D.C., 2000.
Krassovsky, V.I., Infrasonic variations of OH emission in the upper atmosphere, Ann. Geophys.,28, 739, 1972.
Lyons, W.A., Characteristics of luminous structures in the stratosphere above thunderstorms asimaged by low-light video, Geophys. Res. Lett., 21, 875-878, 1994.
Lyons, W.A., Sprite observations above the U.S. High Plains in relation to their parentthunderstorm systems, J. Geophys. Res., 101, 29,641-29,652, 1996.
Makhlouf, U.B., R.H. Picard, and J.R. Winick, Photochemical-dynamical modeling of themeasured response of airglow to gravity waves, J. Geophys. Res., 100, 11,289-11,311, 1995.
Meinel, A.B., OH emission bands in the spectrum of the night sky, Astrophys. J., 111, 555, 1950.Mende, S.B., R.L. Rairden, and G.R. Swenson, Sprite spectra: N2 1PG band identification.,
Geophys. Res. Lett., 20, 2633-2536, 1995.Morrill, J.S., E.J. Bucsela, V.P. Pasko, S.L. Berg, M.J. Heavner, D.R. Moudry, W.M. Benesch,
E.M. Wescott, and D.D. Sentman, Time resolved N2 triplet state vibrational populations andemissions associated with red sprites,” J. Atmos. Solar-Terr. Phys., 60, 811-830, 1998.
Morrill, J., E. Bucsela, C. Siefring, M. Heavner, S. Berg, D. Moudry, S. Slinker, R. Fernsler, E.Wescott, D. Sentman and D. Osborne, Electron energy and electric field estimates in spritesderived from ionized and neutral N2 emissions, Geophys. Res. Lett., 20(10), pp 100-1 to 100-4, 2002.
Moudry, D., H. Stenbaek-Nielsen, D. Sentman, and E. Wescott, On sprite initiation, J. Atmos.Solar-Terr. Phys., (this issue), 2001.
Pandya, R., and M.J. Alexander, Linear stratospheric gravity waves above convective thermalforcing, J. Atmos. Science, 56, 2434-2446,1999.
Pasko, V.P., U.S. Inan, T.F. Bell, and Y.N. Taranenko, Sprites produced by quasi-electrostaticheating and ionization in the lower ionosphere, J. Geophys. Res., 102, 4529, 1997a.
Pasko, V.P., U.S. Inan, and T.F. Bell, Sprites as evidence of vertical gravity wave structuresabove mesoscale thunderstorms, Geophys. Res. Lett., 24(14), 1735-1738, 1997b.
Pasko, V.P., U.S. Inan, and T.F. Bell, Spatial structure of sprites, Geophys. Res. Lett., 25, 2123-2126, 1998.
Pearse, R.W.B., and A.G. Gaydon, The Identification of Molecular Spectra, (4th edition), Wiley,New York, 1976.
Piani, C., D. Durran, M.J. Alexander, and J.R. Holton, A numerical study of three dimensionalgravity waves triggered by deep tropical convection and their role in the dynamics of Q.B.O.,J. Atmos. Sci., 57, 3689-36702, 2001.
Picard, R.H., R.R. O'Neil, H.A. Gardiner, J. Gibson, J.R. Winick, W.O. Gallery, A.T. Stair, Jr.,P.P. Wintersteiner, E.R. Hegblom, and E. Richards, Remote sensing of discrete stratospheric

Journal of Atmospheric and Solar-Terrestrial Physics – Preprint_____________________________________________________________________________________________
18
gravity-wave structure at 4.3-µm from the MSX satellite, Geophys. Res. Lett., 25, 2809-2812,1998.
Rowland, H.L., Theories and simulations of elves, sprites and blue jets, J. Atmos. Solar-Terr.Phys., 60, 831-844, 1998.
Rowland, H.L., R.F. Fernsler, and P.A. Bernhardt, Breakdown of the neutral atmosphere in theD-region due to lightning driven electromagnetic pulses, J. Geophys. Res., 101, 7935, 1996.
Salby, M.L., and R.R. Garcia, Transient response to localized episodic heating in the tropics.Part 1: Excitation and short-time near-field behavior, J. Atmos. Science, 44, 458-497, 1987.
Sentman, D.D., and E.M. Wescott, Video observations of upper atmospheric optical flashesrecorded from an aircraft, Geophys. Res. Lett., 20, 2857-2860, 1993.
Sentman, D.D., E.M. Wescott, D.L. Osborne, D.L. Hampton and M.J Heavner, Preliminaryresults from the Sprites94 aircraft campaign: 1. Red Sprites, Geophys. Res. Lett., 22, 1205-1208, 1995.
Sentman, D.D. (Editor), Effects of Thunderstorm Activity on the Upper Atmosphere andIonosphere, Special Issue of J. Atmos. Solar-Terr. Phys., 60, ( Nos. 7-9), 1998.
Sentman, D.D., E.M. Wescott, H.C. Stenbaek-Nielsen, M.J. Heavner, D.R. Moudry, and F.T.São Sabbas, Observations of gravity waves associated with a sprite-producing storm, EosTrans. AGU, 82 (48), Fall Meet. Suppl., Abstract A12B-06, 1999.
Sentman, D.D., H.C. Stenbaek-Nielsen, E.M. Wescott, M.J. Heavner, D.R. Moudry and F.T. SãoSabbas, "Effects of Lightning on the Middle and Upper Atmosphere: Some New Results," inSpace Weather Study Using Multipoint Techniques, COSPAR Colloquia Series, Volume 12,pp 267-274, Pergamon Press, New York, 2002.
Siefring, C., P. Bernhardt, J. Morrill, D. Sentman, E. Wescott, M. Heavner, D. Osborne, E.Bucsela, Correlation between ambient Near InfraRed (NIR) airglow and sprite structures,”EOS Trans. Am. Geophys. Union, 79, 1998.
Slanger, T.G., P.C. Cosby, D.L. Huestis, and D.E. Osterbrock, Vibrational level distribution ofO2(b1Σg
+, v=0-15) in the mesosphere and lower thermosphere region, J. Geophys. Res.,105(D16), 20,557-20,564, 2000.
Stenbaek-Nielsen, H.C., D.R. Moudry, E.M. Wescott, D.D. Sentman and F.T. São Sabbas,Sprites and possible mesospheric effects, Geophys. Res. Lett., 27, 3829-3832, 2000.
Su, H.-T., R.-R.. Hsu, A. B.-C. Chen, Y.-J. Lee, and L.-C. Lee, Observation of sprites over theAsian continent and over oceans around Taiwan, Geophys. Res. Lett.10.1029/2001GL013737, 27 February, 2002
Suszcynsky, D.M., R.A. Roussel-Dupré, W.A. Lyons, and R.A. Armstrong, Blue light imageryand photometry of sprites, J. Atmos. Solar-Terr. Phys., 60, 801, 1998.
Swenson, B.R., and A.Z. Liu, A model for calculating acoustic gravity wave energy andmomentum flux in the mesosphere from OH airglow, Geophys. Res. Lett., 25, 477, 1998.
Takahashi, U., Y. Watanabe, A. Uchida, M. Sera, M. Sato and H. Fukunishi, Energydistributions of electrons exciting sprites and elves inferred from the Fast Array Photometerobservations, EOS Trans. Am. Geophys. Union, 79, F175, 1998.
Taylor, M.J., and M.A. Hapgood, Identification of a thunderstorm as a source of short periodgravity waves in the upper atmospheric nightglow emissions, Planet. Space Sci., 36, 975-985, 1988.
Taylor, M.J., and M.J. Hill, Near infrared imaging of hydroxyl wave structure over an ocean siteat low latitudes, Geophys. Res. Lett., 18, 1333-1336, 1991.

Journal of Atmospheric and Solar-Terrestrial Physics – Preprint_____________________________________________________________________________________________
19
Taylor, M.J., D.N. Turnbull and R.P. Lowe, Coincident imaging and spectrometric observationsof zenith OH nightglow structure, Geophys. Res., Lett., 18, 1349-1352, 1991a.
Taylor, M.J., P.J. Espy, D.J. Baker, R.A. Sica P.C. Neal., and W. Pendleton, Jr., Simultaneousintensity temperature and imaging measurements of short period wave structure in the OHnightglow emissions, Planet. Space Sci., 39, 1171-1188, 1991b.
Taylor, M.J., V. Taylor and R. Edwards, “An Investigation of Thunderstorms as a Source ofShort Period Mesospheric Gravity Waves,” in The Upper Mesosphere and LowerThermosphere: A Review of Experiment and Theory, AGU Geophysical Monograph 87, p177, American Geophysical Union, Washington, D.C., 1995.
Turnbull, D.N., and R.P. Lowe, Temporal variations in the hydroxyl nightglow observed duringALOHA-90, Geophys. Res. Lett., 18, 1345.
Yee, J.-H., R. Niciejewski and M.Z. Luo, Observations of 12O ( )Σ and OH nightglow during the
ALOHA-90 campaign, Geophys. Res. Lett., 18, 1357-1360, 1991.

Journal of Atmospheric and Solar-Terrestrial Physics – Preprint_____________________________________________________________________________________________
20
Tables
Table 1. OH (X 2Π) Meinel Vibration-Rotation Bands
720 < λ < 1000 nmBand λ, nm
(Q-branch)
RelativeIntensity
∆v=3(3-0) 966
(R-branch)2
∆v =4(9-5) 1000 3(8-4) 940 8(7-3) 883 7(6-2) 834 5(5-1) 792 6(4-0) 753 3∆v =5(9-4) 776 10(8-3) 728 6
Source: Pearse and Gaydon, 1976.
Table 2. Comparison of Reported Gravity Wave Parameters
λh(km)
λz (km) τ (min) cph (m/s) cgh (m/s) cgz (m/s) ∆t (min) ϕ (deg)
Before 0430 50 30 10 85 58 27 43 31After 0500 40 20 11 61 48 24 49 27MSX 11/13 25 16 9 46 32 21 55 33MSX 10/2 50 18 15 56 50 18 64 20T&H 1988 26 7 17 38 23 11 105 15
λh: Horizontal wavelengthλz: Vertical wavelengthτ: Wave periodcph: Wave horizontal phase speedcgh: Wave horizontal group speedcgz: Wave vertical group speed∆t: Wave-energy propagation time from 15 to 85 km altitudeϕ: Elevation angle of group-velocity vector
Journal of Atmospheric and Solar-Terrestrial Physics – Preprint_____________________________________________________________________________________________
21
0.0
0.2
0.4
0.6
0.8
1.0
0.0
0.2
0.4
0.6
0.8
1.0
Filte
r Tra
nsm
ittan
ce
CC
D Q
uant
um E
ffici
ency
1000800600400Wavelength, nm
(8-3
)
(9-4
)(4-0
)
(5-1
)
(6-2
)
(7-3
)
(8-4
)
Effective TotalResponse
OH X MeinelTransitions
2Π
KAF0400 CCD Response
Schott RG-715 Red Cuttoff FilterReponse
CCD Camera and Red Filter Responses
Figures
Figure 1. CCD and cutoff filter responses as functions of wavelength, and the combined response pass band. Alsoshown are locations of the band origins of the OH (X 2Π) ∆v=4,5 Meinel sequences within the combined responsepass band.

Journal of Atmospheric and Solar-Terrestrial Physics – Preprint_____________________________________________________________________________________________
22
ND MN
IA
SD
MT
WY
CO
NE
KSMO
WI
ND MN
IA
SD
MT
WY
CONE
KS MO
WI
Figure 2. GOES-8 10-12 µm temperature maps of a thunderstorm over central Nebraska-western Iowa andassociated lightning studied during the night of 18 August, 1999. The two maps show the same storm separated bythree hours. Superimposed atop the maps are 5 min averages of lightning activity, where blue denotes negative CG(cloud-to-ground) lightning, and red denotes positive CG lightning. Adapted from near-real time maps downloadedfrom http://www.weather.com
Journal of Atmospheric and Solar-Terrestrial Physics – Preprint_____________________________________________________________________________________________
23
Figure 3. Outwardly expanding concentric ripples observed in OH emissions using 25 sec time exposure in the NIR.The field of view is approximately 60H x 40V deg. The dashed lines labeled “analysis strip” delineate the regionused to create Figure 5. The city lights of Custer, SD and lights from the Crazy Horse Monument are labeled at thebottom of the large plot. The stars in the figure are used to fix the viewing direction using the Smithsonian StarCatalog. The sprite on the main image is shown in the inset in more detail as it was recorded by a separate ICCDcamera.

Journal of Atmospheric and Solar-Terrestrial Physics – Preprint_____________________________________________________________________________________________
24
18 Aug 1999 0359-0404 UT
Bear Mt.
ND MN
IA
SD
MT
WY
CONE
KS MO
WI
Figure 4. GOES-8 weather image with image of Figure 3 mapped to the 85 km tangent surface and overlaid on topof it. The outward expanding ripples are seen to be nearly centered on the underlying thunderstorm. See text fordescription of the mapping projection used.

Journal of Atmospheric and Solar-Terrestrial Physics – Preprint_____________________________________________________________________________________________
25
Tim
e, m
in
Star
Slope = 61 m/s
Northward Propagating
Gravity Waves Slop
e = 62
m/s
Southw
ard P
ropa
gatin
g
Gravit
y Wav
es
Sprite
GenerationRegion
0
30
60
90
120
Transverse Distance at 85 km Altitude, km0 100 200 300 400
Figure 5. Color-coded position-time plot of emission intensity along the horizontal analysis strip indicated in Figure2. The color axis runs through purple-red-yellow with increasing intensity. The waves appear to propagate outwardand upward from the central vertical region of the figure. The wavelengths and periods of the waves are readilydiscernible from this plot, yielding a phase speed of about 60 m/sec. The right-to-left drift of the bright (yellow)central region with increasing time tracks the movement of the underlying thunderstorm across Nebraska. Stars andsprites that appear within the analysis strip are labeled.