Embed Size (px)
Citation preview

Fox-Hughes. Journal of Southern Hemisphere Earth Systems Science (2018) 68, doi: 10.22499/3.6801.012
Corresponding author: Paul Fox-Hughes, Bureau of Meteorology, Hobart, Tasmania Email: [email protected]
Observations of a tornado at an Automatic Weather Station in northern Tasmania
Paul Fox-Hughes, Ian Barnes-Keoghan and Adrian Porter
Bureau of Meteorology, Hobart, Australia
(Manuscript received February 2018; accepted November 2018)
On 15 April 2009, the Automatic Weather Station (AWS) at Scottsdale, in north-eastern Tasmania, recorded a wind gust of 54 ms-1 (194 kmh-1) as an active squall line crossed the state. Investigation of the environment, instrumentation, and dam-age resulted in the conclusion that this was a genuine wind gust caused by a tor-nado passing very close to the anemometer. This was the first direct AWS obser-vation of a tornado in Australia, and one of very few such observations in the world. In this report, we document the weather event which produced the tornado, briefly outline the synoptic situation leading to its occurrence, document addi-tional background observations that provide context for the event, and discuss the nature of the observations made by the AWS and the method by which the wind gust observations were verified.
The squall line was part of a cold front that crossed northern Tasmania on the morning of 15 April 2009. At 300 hPa, the orientation of the short-wave trough associated with the cold front changed from positively to strongly negatively tilted as it moved over central Victoria and Tasmania. The orientation of the trough and position of a jet streak within it suggested strong upper divergence and strong vertical motion. These contributed to thunderstorm development and re-sulted in very substantial vertical wind shear through the lower half of the tropo-sphere, which in turn contributed to the organisation of the severe convection. Near the surface, low cloud base and strong vertical windshear in the lowest kil-ometre provided conditions conducive to tornado development.
1 Introduction
A squall line associated with a cold front crossed the north coast of Tasmania during the morning of 15 April 2009. Associated with this squall line, an isolated wind gust of 54 ms-1 (194 kmh-1) was recorded by the Australian Government Bureau of Meteorology Automatic Weather Station (AWS) at the town of Scottsdale (see Figure 1 for locations mentioned) at 2226 UTC (UTC is ten hours behind Australian Eastern Standard Time). Subsequent investigations into the environment, the instrumen-tation, and the damage concluded that the cause of the gust was a tornado passing very close to the AWS. Widespread damage occurred across the north of Tasmania with the passage of the squall line, including (i) a number of houses sustained substantial structural damage at Boat Harbour (Figure 2a) and at Scottsdale, (ii) hundreds of trees were damaged, had branches ripped off, or were uprooted entirely, at locations including Westbury, Weymouth, Jetsonville, Scottsdale, Moorina (near Pioneer), Lottah, Goulds Country, and Cuprona (Figure 2b, c), (iii) 30,000 electricity customers were affected by power outages.
Much of the damage occurred in swathes from 30-40 m up to about 200 m wide. The gradient of damage was often intense, with a sharp boundary between undamaged and damaged trees or structures, including in the area of the Scottsdale AWS (Figure 3). Additionally, a resident of Legerwood reported seeing a rapidly moving, bright white, cylindrical column at about 2230 UTC. These features of the damage that occurred suggest that several tornadoes occurred as the front crossed northern Tasmania.

Fox-Hughes. Scottsdale tornado observation 216
Figure 1 Location of sites mentioned in text, including those where damage was reported. AWS locations are indicated with a purple square, West Takone radar with a red square, and Launceston Airport AWS and profiler with a green triangle. Blue diamonds identify AWS locations in Table 2 that are not discussed elsewhere.
Scottsdale AWS recorded a series of pressure anomalies at 2223:52 UTC indicating a rapid decrease in pressure. These observations were noted as errors and recorded in the AWS error log, which serendipitously enabled their recovery and analysis: such high-frequency data were not normally transmitted or stored. Observations of this magnitude were outside the normal operating range of the instrument and consequently required examination and validation to determine their accuracy. It was difficult to test the performance of the AWS anemometer end-to-end but Bureau of Meteorology Regional Engineering staff devised a practical and innovative end-to-end test to confirm that the anemometer was performing correctly.
The frequency of severe thunderstorms is greater about the north coast and hinterland of Tasmania than in other parts of the state (Jones 1990 and references therein, Jessup and Fox-Hughes 1991, Fox-Hughes et al. 1996). There are likely to be a number of reasons for this, as suggested in Jones (1990), among them being a greater likelihood of observation of severe thunderstorms as a consequence of the greater density of population across a relatively wide area, compared to the rest of Tasmania. In addition, the presence of a low-level moist layer, the sea surface temperature increasing towards the east and coastal wind convergence (in the northwest) along a trajectory at a small angle to the prevailing wind direction of many active fronts all contribute to an environment more frequently favourable for severe thunderstorm occurrence than is the case elsewhere in Tasmania.
In particular, severe thunderstorms that produce tornadoes have been documented along the Tasmanian north coast. The majority occur in the cooler months or in cold outbreaks during spring or autumn (Jones 1990, Jessup and Fox-Hughes 1991, Fox-Hughes et al. 1996) in the presence of substantial low-level wind shear, moderate instability, and in the proximity of a strong jet streak associated with an active upstream trough. These conditions are similar to those identified as favourable for the occurrence of “cool season” tornadoes in other parts of southern Australia and in California (Hanstrum et al. 2002),

Fox-Hughes. Scottsdale tornado observation 217
the United States more broadly (Pietrycha et al. 2004), the British Isles (Tyrrell 2007, Clark 2009), and in other parts of Europe (e.g. Wesolek and Mahieu 2011, Bech et al. 2011, Pucik et al. 2011).Such events may occur as a result of the passage of a derecho (a widespread, convective windstorm, Johns and Hirt 1987) or, more generally, quasi-linear convective system (QLCS, e.g. squall line or bow echo; Weisman and Trapp 2003). The relatively few cool-season tornado events that have been well documented in Australia (e.g. Hanstrum et al. 2002 and references therein) have mostly occurred as part of a broader frontal system. The event described here similarly resulted from the passage of an active cold front over the state.
The primary purpose of this report is to document the occurrence of severe thunderstorms over northern Tasmania on 15 April 2009, and the recording of tornadic winds at the Scottsdale AWS. We also briefly discuss the synoptic situation to place the event into meteorological context. The report is structured as follows: we first briefly outline the synoptic situation and meteorological development, then describe the extent and nature of the damage sustained across northern Tasmania on 15 April 2009. We detail the observations recorded by a number of platforms around northern Tasmania, and then those recorded by the Scottsdale AWS separately as a key part of the paper. While it is not our intent to provide a model-based analysis of the event, we include atmospheric soundings at Scottdale around the time of the tornado passage, derived from the recently available BARRA-TA high-resolution reanalysis of Tasmania, given the absence of corresponding observational data. We conclude with a discussion of the significance of the event in Tasmania and more broadly.
2 Synoptic summary
As indicated in the introduction, the primary focus of this report is to document the severe thunderstorms over northern Tasmania and AWS measurements of a tornado at Scottsdale. Hence, the description of the synoptic setting here is brief.
The squall line noted above was associated with a cold front, analysed between approximately 35 °S and 50 °S on Bureau of Meteorology National Meteorological and Oceanographic Centre (NMOC) charts (Figure 4), that crossed northern Tas-mania on the morning of 15 April 2009, embedded in a broad trough south of the Australian continent. The front approached Tasmania from the Great Australian Bight where, at 1200 UTC 14 April (Figure 4a)), it extended to a 990 hPa low-pressure system well south of the Australian continent. By 1800 UTC (Figure 4b), the front had advanced to just off the west coast of Tasmania, with NMOC analysing it as moving more rapidly eastward in the north (21 ms-1) than closer to the low centre (10 ms-1), which had deepened to 986 hPa. At 0000 UTC on 15 April (Figure 4c), the front had progressed to the far east of Tasmania, again moving more rapidly over its northern extent near Bass Strait than over waters south of Tasmania.
Figure 2 (a) House damage at Boat Harbour (b) Windbreak trees severely damaged at Jetsonville, 5 km northwest of Scottsdale (c) Line of trees damaged near the Scottsdale observation site (with equipment in the foreground). The arrows in the figure are separated by approximately 100 m.

Fox-Hughes. Scottsdale tornado observation 218
Figure 3 Path of damage near Scottsdale AWS. The aerial view was taken prior to 15 April 2009, and shows both the tree to the north of the AWS and the line of trees to the south (see Fig. 2c) as being intact. The inset shows the isolated tree to the north of the AWS largely stripped of branches, which are scattered around its base, on 16 April. True north is indicated by the arrow in the top right of the main image.
At 300 hPa (not shown), a jet streak with peak winds in excess of 60 ms-1 progressed around the upper level short-wave trough, contributing to a progressive change in orientation of the trough from positive to strongly negatively tilted (i.e. changing from tilting westward with decreasing latitude to tilting eastward with decreasing latitude) as it moved over central Victoria and Tasmania. Negatively tilted troughs have been frequently associated with the development of severe thunder-storms and other severe weather (MacDonald 1976, Speer and Leslie 2000, Atallah et al. 2007). Water Vapour (WV) imagery at three-hourly intervals from 1800 UTC 14 April to 0000 UTC 15 April is displayed in Figure 5. The short wave trough was evident at 1800 UTC (Figure 5a) as a dark (dry at upper levels) feature near 40°S 140°E, and became progressively more negatively tilted as it approached Tasmania at 2100 UTC (Figure 5b), and at 0000 UTC 15 April (Figure 5c) as it crossed the northwest coast. The position of the jet streak, inferred from the water vapour dry band, and orientation of the trough suggested strong upper divergence, a conclusion supported by the presence of strong transverse banding evident on the MTSAT 1800 UTC IR image over southern Victoria and Bass Strait (e.g. Figure 4b, Feren 1995). This, in turn, implied strong vertical motion, which would have contributed to thunderstorm development, and the negatively tilted trough also suggested very substantial wind shear, and subsequent organisation of severe convection.
3 Damage description
Damage was reported across the north coast of Tasmania, with details documented in Table 1. 30,000 electricity customers in northern Tasmania experienced outages, partly as a consequence of the widespread tree damage, as trees fell across pow-erlines, but also due to 30 power poles being blown over and 10 transformers being damaged by the intense lightning ac-companying the squall line.

Fox-Hughes. Scottsdale tornado observation 219
Table 1 Damage reports from 15 April 2009 (see Figure 1 for locations)
Location Damage description
Boat Harbour, Flowerdale and Wynyard extensive house damage between 1920-1940 UTC (Fig. 2a)
Scottsdale caravan and old bus overturned
Northern Tasmania widespread electricity disruption
Cuprona many trees damaged on a farm
Birralee row of trees uprooted in a damage swathe 200 m wide and approximately 1 km long
Tam O’Shanter farm near Weymouth 30-40 m wide band of trees damaged; farmhouse roof damaged (roofing insulation scattered in-side some rooms of the house); unofficial anemometer reading of 44 ms-1
Between Nunamara and Launceston several trees uprooted, up to 1 m diameter
near Jetsonville row of cypress trees uprooted/damaged
“Vinegroves” property near Scottsdale Approx. 400 m swathe cut through belt of trees
Near Scottsdale AWS Trees substantially damaged/destroyed;
Mt Stronach, approx. 2 km east of Scottsdale southwest-northeasterly line of trees was uprooted, 30 m wide and 200 m long
Scottsdale-Bridport Rd. Lines of trees damaged/knocked over
Lottah and Goulds Country large area of trees uprooted
Pioneer Several swathes of trees uprooted
Near the Scottsdale AWS a line of damage was evident (Figure 3), extending in a northwest to southeast direction from the north of the AWS, where a mature eucalypt tree (Figure 3, inset) suffered extensive damage. Near the AWS enclosure, an old bus that had been sitting on blocks for many years was toppled on to its side. A number of 6 m sheets of roofing iron were scattered about the property and some damage was sustained to the meteorological instrumentation (but not the AWS itself or the 10 m anemometer mast) - including a child’s swing set being picked up and wrapped around the evaporimeter 2 m wind mast. Approximately 400 m to the southeast of the AWS, a line of windbreak trees was damaged over a 100 m length (Figure 2c), with some trees uprooted and others snapped off some metres above the ground. Because the land in this area was largely cleared, it was difficult to identify the damage path beyond the limits plotted in Figure 3. In addition, the Scottsdale manual weather observer reported standing at her front door watching a dark mass of cloud, rain and blowing debris (including tree branches) cross her field of view approximately 50 m away, without feeling strong winds herself (Figure 2c and Figure 3).
4 Tasmanian 0bservations (other than at Scottsdale) and Modelling
West Takone radar was well placed to observe the progress of the cold front across northwest Tasmania, but became in-creasingly distant as the front moved into the northeast, towards Scottsdale. Several northern Tasmanian AWS recorded useful observations, including cloud height recordings, as did the Launceston Airport profiler.
4.1 Radar observations
West Takone radar is located approximately 35 km west-southwest of Burnie (Figure 1). The radar beam is at an elevation of 599 m. In 2009, West Takone was a WSR-81C C-Band non-Doppler radar with a 1.7⁰ beamwidth.

Fox-Hughes. Scottsdale tornado observation 220
Figure 4 MTSAT Infrared images and overlain Mean Sea Level Pressure analyses at (a) 1200 UTC (b) 1800 UTC 14 April and (c) 0000 UTC 15 April 2009.
The squall line moved eastward at an average speed of 23 ms-1 as it crossed northern Tasmania, but individual line segments and cells were faster and, in some cases, slower at times. For example, the convective cell that moved over Boat Harbour propagated at about 31 ms-1, as determined from successive radar observations. Individual storm cells were difficult to track at the distance of Scottsdale, however the cell passing immediately southwest of Scottsdale township moved at approxi-mately 25 ms-1 on a bearing of 290° (i.e. from the west-northwest), broadly consistent with other cells identifiable within the squall line as it crossed the central north coast of Tasmania.
Imagery from the West Takone radar (Figure 6) consistently showed a well-defined line of organised convection along the squall line, with evidence of a line echo wave pattern (LEWP, Johns 1993) and distinct bow echoes visible in some scans (Figure 6a-c). In particular, the radar image at 2221 UTC, immediately prior to the squall line reaching Scottsdale showed
Fox-Hughes. Scottsdale tornado observation 221
at least two bow-wave structures, one immediately northwest of Scottsdale and one to the south (Figure 6d), with a sugges-tion of a bookend vortex just to the southwest of Scottsdale. Bookend vortices have been documented as favourable locations for the occurrence of tornadoes, due to the enhanced vorticity in their vicinity (Przybylinski 1995), but tornadoes have also been reported from other parts of bow echoes (Johns and Doswell 1992), including from close to the bow echo apex (Atkins and St. Laurent 2009). The bow echoes had been visible since the squall line was just east of Burnie (Figure 6a), 90 minutes earlier. By 2221 UTC, however, they were less distinct due to the distance from the radar, 160 km, and an attenuating area of stratiform rainfall between the radar and leading edge of the squall line. The occurrence of LEWPs and bow echoes provided the major radar evidence for the severity of the event. There was no evidence in the sequence of radar images of individual cells moving at a substantial angle to the main convective line, unusual persistence of cells, or mesocyclones that, for instance, might have suggested the presence of supercell thunderstorms.
A vertical cross-section at 2220 UTC, close to the time that the squall line reached Scottsdale (Figure 6d), showed radar echo tops were approximately 11000 m high, with the narrow core around 50 dBz reaching to 6000 m (noting that these observations are approximate due to the 160 km distance from the radar to Scottsdale).
Figure 5 MTSAT Water Vapour images at (a) 1800 UTC and (b) 2100 UTC on 14 April, and (c) 0000 UTC on 15 April 2009. The location of the upper trough is indicated by the dashed red line.

Fox-Hughes. Scottsdale tornado observation 222
Figure 6 West Takone plan-position and range-height (vertical cross-section) radar images at (a) 2051 (b) 2121 (c) 2151 and (d) 2221 UTC. An organised line of storms exhibits bowing features in each frame including (d), near Scottsdale, despite the 160 km distance to the radar and attenuation by precipitation from trailing strati-form precipitation. The red circle in (d) indicates a possible bow echo bookend vortex.

Fox-Hughes. Scottsdale tornado observation 223
4.2 Lightning observations
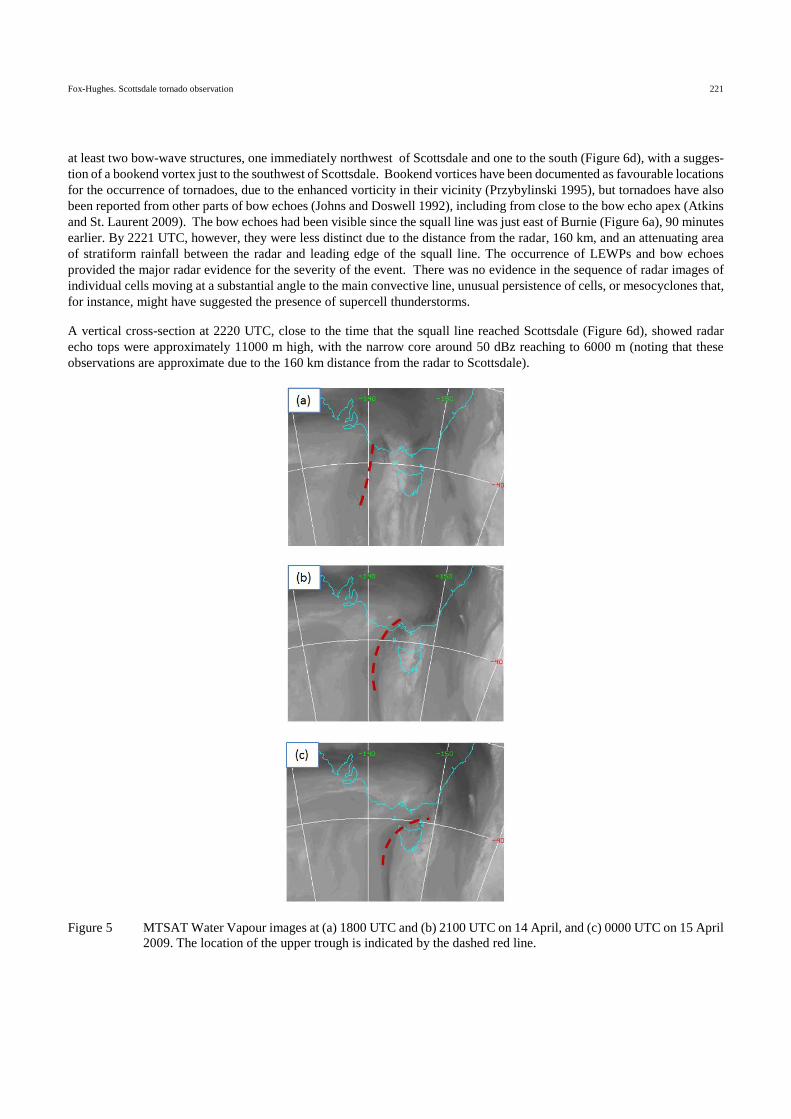
As noted in the damage description, intense lightning accompanied the passage of the squall line across northern Tasmania. Figure 7 displays lightning registrations from the GPATS lightning detection system between 1400 UTC on 14 April and 0200 UTC on 15 April over and around Tasmania. Widespread lightning occurred over northern Tasmania and surrounding waters, particularly over Bass Strait. Lightning only occurred over the far northwest and to the west of Tasmania prior to 2000 UTC (blue registrations), moving eastward after that time (green strikes). The greatest strike density was evident around the central north coast and to the northeast of Launceston, near Scottsdale.
4.3 AWS observations
As the front moved across northern Tasmania, it passed over a number of AWS (see Table 2). Gusty winds between 24-31 ms-1 were observed at several stations, and a gust of 32.4 ms-1 occurred at Devonport AWS on the central north coast at 2115 UTC. While these observations were, in a number of cases, severe (greater than 27.8 ms-1, or 100 kmh-1), none were close to the value reported at Scottsdale, and are presented here to provide context for that observation.
In addition to the basic parameters of temperature, humidity, pressure, wind and rainfall, BoM AWS at aerodromes are fitted with ceilometers to measure cloud base. Devonport and Launceston Airport AWS are the closest such representative obser-vation points to Scottsdale. Ceilometers on both AWS reported cloud bases in the range 1200-1500 metres well ahead of the squall line, decreasing to 300-400 metres within 2-3 minutes ahead of, and with, the squall line passage. In its wake, the cloud base gradually rose over the ensuing hour to above 3000 metres.
4.4 Profiler observations
A VHF boundary layer atmospheric radar (“profiler”) is sited at Launceston Airport, approximately 50 km to the southwest of Scottsdale, where the Launceston Airport AWS indicated that the gust front arrived at 2205 UTC. Figure 8 displays a hodograph of the profiler winds at 2145 UTC, sampling the immediate pre-frontal atmosphere. Winds in the left panel of Figure 8 are displayed from near the surface (990 hPa) to 570 hPa. The wind was close to northerly near the surface, backing to the northwest with height. The NNW-SSE orientation of the Tamar Valley, in which Launceston Airport is sited, is very likely to have influenced the direction of low-level airflow and is a factor that would be absent at Scottsdale. The 850 hPa wind observed at 2145 UTC was 28 ms-1 from 335°, resulting in windshear of 21 ms-1 between the surface and 850 hPa. Between the surface (at 990 hPa) and 900 hPa, wind shear was 19.5 ms-1.
Table 2 Maximum wind reports from northern Tasmanian AWS
Location Time (UTC) Windspeed (ms-1) Gust strength (ms-1)
King Is Airport 18:48 19.0 23.7
Smithton Airport 19:49 19.0 23.1
Luncheon Hill 19:57 15.4 29.3
Wynyard Airport 20:37 11.3 23.7
Sheffield 21:15 20.1 30.3
Devonport Airport 21:15 25.2 32.4
Low Head 21:41 17.5 22.6
Launceston 22:02 14.9 22.1
Cressy 22:05 14.9 20.6
Launceston Airport 22:10 21.1 28.3
Scottsdale 22:26 (22:27) 11.8 (18.0) 54.0 (54.0)
Flinders Island Airport 22:39 12.9 25.2
Swan Island 22:42 18.5 28.3
Fox-Hughes. Scottsdale tornado observation 224
Figure 7 Lightning recorded between 1400 UTC 14 April and 0200 UTC 15 April over and around Tasmania. Strikes registered between 1400-2000 UTC on 14 April are blue, while those after 2000 UTC are green.
A pressure-weighted storm motion vector of 335° at 30 ms-1 (represented by the red wind vector in Figure 8) was calculated, using all available winds from the surface to the top of the profile at 570 hPa. From this, storm-relative helicity of -169 m2s-2 was derived represented by the shaded area in Figure 8, indicating the possibility of tornadic supercell thunder-storms. When the actual storm motion derived from radar observations (25 ms-1, from 290°) was used, a much larger (neg-ative) value of -669 m2s-2 was calculated. The actual helicity in the storm environment most likely lay between these values, noting again the likely effect of the orientation of the Tamar Valley on the observed profiler winds. There was no evidence of supercell thunderstorms in the radar signature as the front crossed northern Tasmania, as discussed above, however the helicity values were indicative (as was the surface-850 hPa windshear) of an abundant supply of low-level horizontal vorti-city available for tilting by any low-level updraft which in turn promoted tornadogenesis (Rotunno 1981; Lilly 1982; Davies-Jones 1984).
4.5 Reanalysis atmospheric profiles
Only one routine atmospheric vertical sounding is conducted in Tasmania, at Hobart Airport, in what was very likely to have been a substantially different environment to that of Scottsdale during the morning of 15 April 2009. On the other hand, the first tranches of data from the Bureau of Meteorology Regional Reanalysis dataset (BARRA, Jakob et al. 2017) have recently become available. A high resolution downscale from the Australian regional BARRA is currently being completed over Tasmania, using a 1.5 km horizontal resolution, 70 vertical level, convection allowing version of the ACCESS numerical weather model. This was used to construct pseudo-atmospheric soundings at Scottsdale at 2000 and 2200 UTC 14 April and 0000 UTC 15 April 2009 (Figure 9).
At 2000 UTC (Figure 9a), the atmospheric sounding appears quite unstable, apart from a near-isothermal layer between 900 and 850 hPa. The model atmosphere also dries somewhat in this layer, but is moist near the surface and increasingly moist again up to 700 hPa, above which it dries somewhat once more. By 2200 UTC (Figure 9b), 26 minutes prior to the tornado passage, the atmosphere had become unstable throughout the troposphere, with the near-isothermal layer evident earlier eroded in the intervening two hours. Apart from the surface-800 hPa layer, which was moist but unsaturated, the model atmosphere was saturated through the depth of the troposphere, indicating a deep layer of cloud associated with the ap-proaching cold front and squall line, with a sharply defined tropopause at 300 hPa. Finally, at 0000 UTC (Figure 9c) fol-lowing the passage of the cold front, the atmosphere had stabilised somewhat and developed a frontal near-inversion between 900-850 hPa, but was still relatively moist. The near-surface (975 hPa) to 850 hPa wind shear over this period increased from 17.5 ms-1 from 313° at 2000 UTC (the winds in the sounding plot are displayed in knots, consistent with operational meteorological practice) to 22 ms-1 from 324° at 2200 UTC, before easing considerably at 0000 UTC on 15 April to 9 ms-1 from 277°.

Fox-Hughes. Scottsdale tornado observation 225
5 Scottsdale AWS observations
BoM AWS are installed and maintained to conform to, or exceed, World Meteorological Organisation and other specifica-tions, including those of the International Civil Aviation Organisation and Standards Association of Australia. Additionally, there are constraints specified on siting, to ensure that observations are representative of as large an area around the instru-ment site as possible. For example, any obstructions to wind flow less than 8 m in height should ideally be a distance 10 times the height of the obstruction from the measuring site (see, e.g. the BoM Observation Specification, available at: www.bom.gov.au/climate/cdo/about/observation_specification_2013.pdf). Thus, a 5 m tree should be 50 m or more from an anemometer. These constraints are not always able to be met in practice. Within an envelope of directions to the west and north of the Scottsdale AWS (wind directions immediately ahead of the tornado passage), an 8 m tree was sited approxi-mately 70 m to the north-northwest of the anemometer and therefore potentially able to affect the representativeness of wind recorded from that general direction. No other landscape features were of sufficient height to potentially affect the wind experienced at the AWS according to the siting specifications. It should be noted that these specifications assume a generally steady direction and speed, however the broader tornadic environment would have been highly turbulent and variable. This discussion does not alter the fact that at a specific time the AWS recorded an extreme gust, it simply means that the gust could not be expected to have been representative of a broad region around the AWS.
Scottsdale has an ALMOS AWS, with a Synchrotach 706 wind vane and 732 cup anemometer, together with a Vaisala PTB330B barometer. In 2009, most Tasmanian AWS, including Scottsdale, routinely reported half-hourly, with more fre-quent reports of strong gusts and other priority observations. The PTB330B has a stated accuracy of +/- 0.25 hPa and re-sponse time of 1 second, but the AWS is configured to sample the barometer output every 15 seconds. The cup anemometer outputs every second, with the output being the average of the past three seconds. Routine wind reports average the measured wind over the previous ten minutes, but during gusty conditions the averaging period can be as little as one minute. Gusts, however, are recorded as the three-second average wind described above.
Figure 8 Hodograph displaying Launceston Airport profiler winds at 2145 UTC 14 April. Winds at successive levels are represented by squares in the hodograph in the right-hand panel. Note that the hodograph application dis-plays windspeed in knots. Rings increment every 5 knots, with 10 knot increments indicated in purple. The pink node and wind barb is the 850 hPa wind, and the green is 700 hPa. The red square is a storm motion vector derived from pressure-weighted mean wind, as described in the text. Helicity is the area swept out (in grey) on the hodograph by wind vectors at successive heights.

Fox-Hughes. Scottsdale tornado observation 226
Figure 9 BARRA-TA soundings at Scottsdale for (a) 2000 UTC (b) 2200 UTC on 14 April and (c) 0000 UTC 15 April 2009.
The AWS, including anemometer, had last been inspected, calibrated and recorded as performing to within acceptable limits on 31 March 2009, approximately two weeks prior to the extreme wind gust report. There was no evidence of damage to the AWS or 10 m anemometer following the passage of the tornado. Some other instrumentation was damaged, however. A child's swing set was found wrapped around the 2 m anemometer associated with the site's pan evaporimeter, and a further (already decommissioned) anemometer, which had been used prior to the AWS installation some years earlier, was blown into nearby vegetation.
The Scottsdale AWS reported Special Weather Reports (SPECIs – even if not at an aerodrome, most Bureau AWS report according to aviation specifications) at 2226 and 2227 UTC. At 2226 UTC, the wind report was 11.8 ms-1 gusting to 54.0 ms-1 from due north (360⁰), and at 2227 UTC 18.0 ms-1 gusting to 54.0 ms-1 from the northwest (300⁰).
Fox-Hughes. Scottsdale tornado observation 227
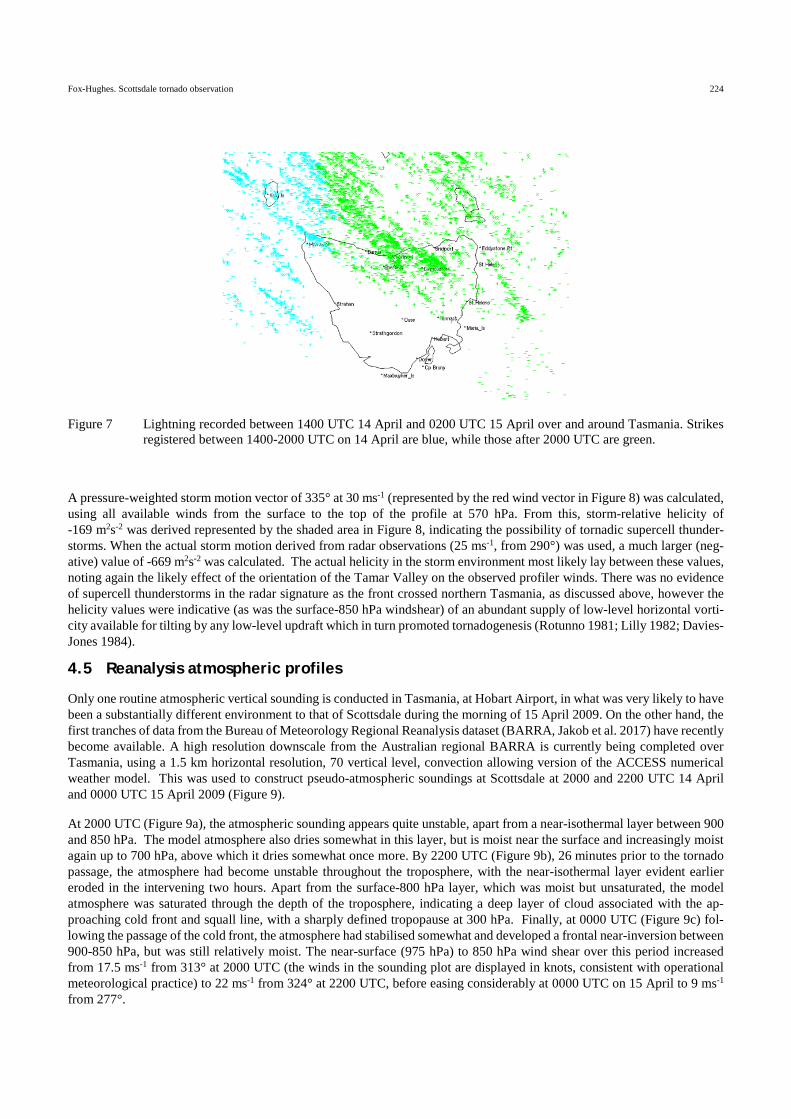
Examination of the AWS error log revealed no evidence that the anemometer was faulty (i.e. there were no wind readings that had been logged as faulty). However, a series of barometric pressure (BP) anomalies was recorded at 22:23:52 UTC as follows (see Figure 10 for a plot of pressure readings):
BP 22:23:52 14/04/09 969.7, 968.8, 968.9, 969.0, 967.6, 958.2, 970.0, 970.6, 970.6, 970.7
Thus, the AWS control software rejected ten successive low-pressure readings approximately two minutes prior to the strongest wind gust being reported (Figure 10). Figure 10 displays the readings using the date-time stamp assigned by the AWS, however it is difficult to identify the precise time of these readings, as the AWS software was not designed to resolve variations in weather parameters on a scale of seconds. The pressure sensor is sampled every 15 seconds, as noted above, with the error log report time-stamped by a central AWS clock at minute-resolution. Both the pressure sensor and anemom-eter, in addition, have finite response times (measured in seconds, or substantial fractions of a second). Thus, the precision of these readings cannot be confidently ascertained to better than a minute. This suggests there was a delay between the occurrence of the strongest gust and the lowest pressure. It also highlights an uncertainty in the wind directions noted above – the values observed represent an average over a finite time. While the tornado moved close to the AWS, the averaging period of the winds (one minute) means that, using the radar-derived storm speed at the time of its passage across Scottsdale, the tornado could have travelled one kilometre between wind observations, obscuring any information about the orientation of the tornado circulation.
6 Discussion
Tornadoes are relatively rare, small-scale phenomena and are consequently very infrequently measured. Thus, the measure-ment of a tornado by an AWS is a significant occurrence. A few such measurements have occurred in the United States (e.g. Blair et al. 2008 and references therein, Karstens et al. 2010, Lee et al. 2004) and more recently in Australia (Richter et al. 2016). Many of these tornadic events occurred in association with supercell thunderstorms, and the direct, instrumental measurement of a tornado associated with a convective line, which may not necessarily include a supercell thunderstorm, is poorly documented in the peer-reviewed literature, particularly in Australia.
Figure 10 Scottsdale station level pressure (green, values in hPa on left-hand y-axis) and one-minute wind gust speed (red, values in ms-1 on right-hand y-axis).

Fox-Hughes. Scottsdale tornado observation 228
The strength of the peak wind gust of 54 ms-1 recorded by the Scottsdale AWS anemometer is a valuable observation con-tributing to the conclusion that a tornado occurred. In addition, the observation was the highest wind gust reported from a settled (i.e. not alpine or remote coastal) location in Tasmania, so it was important to establish the accuracy of the AWS anemometer. However, it is difficult to test the performance of an AWS anemometer end-to-end, and a number of possibil-ities for error exist. On one hand, as noted above, it does not appear that the AWS itself suffered damage during the event, either from the wind itself or from debris carried in the wind. On the other hand, there could have been errors in the circuitry or configuration settings, resistance in the terminal or cable, or the wind speed frequency generator not performing correctly. In addition, Bureau of Meteorology anemometers are not calibrated to ensure accuracy at the high speeds associated with a tornado such as were reported on 15 April 2009. Conventionally, an end-to-end test may be conducted in a wind tunnel; however, this was not a practical solution for validating the Scottsdale anemometer to assess whether its extreme wind reading was correct. Dismantling and re-assembling the device in a purpose-designed testing environment would potentially change the interaction of its components, invalidating the test results. Tasmania and Antarctica Bureau of Meteorology Regional Engineering staff therefore devised an alternative test. They applied a variable speed electric drill to the anemom-eter to simulate high wind speeds. They confirmed the nominal drill rotation speed using a strobe light to ensure the drill performance was as expected, and recorded the wind speed reported by the AWS during this testing. This practical and innovative end-to-end testing revealed that the anemometer performed accurately at high drill rotation speeds, thereby indi-cating that the wind gust speed recorded on 15 April was credible.
Conditions around the time of occurrence of the tornado, on the squall line, were consistent with those documented in other tornado events. In particular, the low cloud base at the time of the squall line passage, observed at Devonport and Launceston Airports, corresponded to a low lifting condensation level found to be climatologically favourable for tornado occurrence (Rasmussen and Blanchard 1998, Thompson et al. 2012). Similarly, strong environmental low-level shear is evident from the Launceston Airport profiler, a condition closely associated with other accounts of tornado occurrence (Hanstrum et al. 2002, and references immediately above). The enhanced intensity of lightning over the central north of Tasmania and near Scottsdale, in particular, is also consistent with other documented cases of a "lightning jump" immediately prior to the occurrence of an increase in severity of thunderstorms (Williams et al. 1999, Gatlin and Goodman 2010, Rudlosky and Fuelberg 2013, Farnell et al. 2017).
BARRA pseudo-atmospheric soundings provided detail of the atmospheric state not available from observations, but con-sistent nonetheless with observations made elsewhere during the event, and with conditions reported elsewhere associated with tornadoes. Thus, the increasing low-level shear ahead of the tornado was consistent both with Launceston Airport and, as noted above, other tornado events. Similarly, the lowering of the cloud base ahead of the cold front in the modelled soundings is both expected from conceptual models of frontal passages and observed at those AWS exposed to the event and fitted with ceilometers (noting that the lowest observed cloud bases of 300-400 m were experienced only in the minutes immediately prior to the cold frontal passage).
This article has focussed on the observational record of the tornado passage, with only a brief discussion of the synoptic and mesoscale weather situation leading to the occurrence of the tornado. Similarly, only limited use has been made of the very recently available BARRA high-resolution reanalysis over Tasmania, to generate atmospheric soundings for the event. It is hoped that BARRA will be used to investigate the dynamics of this significant event in more detail in future.
Acknowledgements
A number of Bureau of Meteorology staff assisted in the collation or analysis of data for this report. Andrew Wood con-ducted an initial assessment of the AWS and surrounding damage in the days immediately following 15 April, while Brendan McMahon collected many reports from northern Tasmanian residents. With typically understated efficiency, David James prepared initial reports and saved some of the more volatile data. Alan Wain, Ivor Blockley and Jack Wells assisted in the de-archiving and display of “legacy” numerical weather prediction data. Rod MacDonald accompanied two of the authors (AP and PFH) to Scottsdale, repairing damage to the manual reporting equipment and assisting with data collection. All three of these are grateful to Mrs Val Hookway, Scottsdale manual weather observer at the time, for her report of the event, and for afternoon tea and the opportunity to dry out by the fire after a very wet field day. Hank de Wit developed Hodotool, used to display the Launceston Airport profiler data in Figure 8, and adapted his atmospheric sounding plotting software to plot model pseudo-soundings. Sam Sauvage assisted with accessing the model soundings, and the BARRA team have done outstanding work to develop an Australian regional reanalysis, from which the model soundings displayed in this paper were obtained. Reviews by Robert Johnson, of the Bureau of Meteorology National Operations Centre, and Mika Peace and

Fox-Hughes. Scottsdale tornado observation 229
Harald Richter, of the Bureau's Science to Services Program, resulted in substantial improvements to the content and read-ability of the manuscript. Many residents of northern Tasmania provided helpful reports and photographs of damage from this event.
The authors are grateful to two anonymous reviewers, whose comments helped improve the clarity and quality of the man-uscript.
References
Atallah, E., Bosart, L. F. and Aiyyer, A. R. 2007. Precipitation distribution associated with landfalling tropical cyclones over the eastern United States. Monthly Weather Review, 135(6):2185-2206.
Atkins, N.T. and St. Laurent, M. 2009. Bow echo mesovortices. Part I: Processes that influence their damaging potential Monthly Weather Review, 137(5):1497-1513.
Bech, J., Pineda, N., Rigo, T., Aran, M., Amaro, J., Gayà, M., Arús, J., Montanyà, J. and van der Velde, O. 2011. A Medi-terranean nocturnal heavy rainfall and tornadic event. Part I: Overview, damage survey and radar analysis. Atmospheric Research, 100(4):621-637.
Blair, S. F., Deroche, D. R. and Pietrycha, A. E. 2008. In situ observations of the 21 April 2007 Tulia, Texas tornado. E-Journal of Severe Storms Meteorology, 3 (3):1–27.
Chronis, T., Carey, L.D., Schultz, C.J., Schultz, E.V., Calhoun, K.M. and Goodman, S.J. 2015. Exploring lightning jump characteristics. Weather and Forecasting, 30(1):23-37.
Clark, M.R. 2009. The southern England tornadoes of 30 December 2006: Case study of a tornadic storm in a low CAPE, high shear environment. Atmospheric Research, 93(1):50-65.
Davies-Jones, R. 1984.Streamwise vorticity: The origin of updraft rotation in supercell storms. Journal of the Atmospheric Sciences, 41: 2991–3006.
Farnell, C., Rigo, T. and Pineda, N. 2017. Lightning jump as a nowcast predictor: Application to severe weather events in Catalonia. Atmospheric Research, 183:130-141.
Feren, G. 1995. The “Striated Delta” Cloud System–A Satellite Imagery Precursor to Major Cyclogenesis in the Eastern Australian-Western Tasman Sea Region. Weather and Forecasting, 10(2):286-309.
Fox-Hughes, P., Bally, J. and Hubbert, G. 1996. A tornadic thunderstorm in northwest Tasmania: 22 November 1992. Aus-tralian Meteorological Magazine, 45:161-75.
Gatlin, P.N. and Goodman, S.J., 2010. A total lightning trending algorithm to identify severe thunderstorms. Journal of Atmospheric and Oceanic Technology, 27(1):3-22.
Hanstrum, B.N., Mills, G.A., Watson, A., Monteverdi, J.P. and Doswell III, C.A. 2002. The cool-season tornadoes of Cali-fornia and southern Australia. Weather and Forecasting, 17(4):705-722.
Jakob, D., Su, C.-H., Eizenberg, N., Kociuba, G., Steinle, P., Fox-Hughes, P., and Bettio, L. 2017. An atmospheric high-resolution regional reanalysis for Australia. Bulletin of the Australian Meteorological and Oceanographic Society, 30(2):16-23.
Jessup, N. and Fox-Hughes, P. 1991. An analysis of thunderstorm activity over Tasmania on 9 December 1985. Meteoro-logical Note 197, Bureau of Meteorology, Melbourne, Australia.
Johns, R.H. and Hirt, W.D. 1987. Derechos: Widespread convectively induced windstorms. Weather and Forecasting, 2(1):32-49.
Johns, R.H. and Doswell III, C.A. 1992. Severe local storms forecasting. Weather and Forecasting, 7(4):588-612. Johns, R.H. 1993. Meteorological conditions associated with bow echo development in convective storms. Weather and
Forecasting, 8(2): 294-299. Jones, M. 1990. Tornadoes and waterspouts in northern Tasmania. Meteorological Note 192, Bureau of Meteorology, Mel-
bourne, Australia. Karstens, C.D., Samaras, T.M., Lee, B.D., Gallus Jr, W.A. and Finley, C.A. 2010. Near-ground pressure and wind measure-
ments in tornadoes. Monthly Weather Review, 138(7):2570-2588. Lee, J.J., Samaras, T. and Young, C.R. 2004. Pressure measurements at the ground in an F-4 tornado. Preprints, 22d Con-
ference on Severe Local Storms, Hyannis, MA, American Meteorological Society, CD-ROM (Vol. 15). Lilly, D. 1982. The development and maintenance of rotation in convective storms. Intense Atmospheric Vortices, Springer-
Verlag, 149–160. Macdonald, N. J. (1976), On the apparent relationship between convective activity and the shape of 500 mb troughs, Monthly
Weather Review, 04:1618-1622.

Fox-Hughes. Scottsdale tornado observation 230
Pietrycha, A.E., Davies, J.M., Ratzer, M. and Merzlock, P. 2004. Tornadoes in a Deceptively Small CAPE Environment: The 4/20/04 Outbreak in Illinois and Indiana. Preprints, 22nd Conference on Severe Local Storms, Hyannis, MA, Amer-ican Meteorological Society.
Púčik, T., Francová, M., Rýva, D., Kolář, M. and Ronge, L. 2011. Forecasting challenges during the severe weather outbreak in Central Europe on 25 June 2008. Atmospheric Research, 100(4):680-704.
Przybylinski, R.W. 1995. The bow echo: Observations, numerical simulations, and severe weather detection methods. Weather and Forecasting, 10(2):203-218.
Rasmussen, E.N. and Blanchard, D.O. 1998. A baseline climatology of sounding-derived supercell and tornado forecast parameters. Weather and Forecasting, 13(4):1148-1164.
Richter, H., Protat, A., Taylor, J. and Soderholm, J. 2016. Doppler radar and storm environment observations of a maritime tornadic supercell in Sydney, Australia. 28th AMS Conference on Severe Local Storms, Portland, Oregon, American Meteorological Society. [Available online at https://ams.confex.com/ams/28SLS/webprogram/Paper301711.html].
Rotunno, R. 1981. On the evolution of thunderstorm rotation. Monthly Weather Review, 109: 577–586. Rudlosky, S.D. and Fuelberg, H.E. 2013. Documenting storm severity in the mid-Atlantic region using lightning and radar
information. Monthly Weather Review, 141(9):3186-3202. Speer, M. S., and Leslie, L. M. 2000. A comparison of five flood rain events over the New South Wales north coast and a
case study. International Journal of Climatology, 20(5):543-563. Thompson, R.L., Smith, B.T., Grams, J.S., Dean, A.R. and Broyles, C. 2012. Convective modes for significant severe thun-
derstorms in the contiguous United States. Part II: Supercell and QLCS tornado environments. Weather and Forecasting, 27(5):1136-1154.
Tyrrell, J. 2007. Winter tornadoes in Ireland: The case of the Athlone tornado of 12 January 2004. Atmospheric Research, 83(2):242-253.
Weisman, M.L. and Trapp, R.J. 2003. Low-level mesovortices within squall lines and bow echoes. Part I: Overview and dependence on environmental shear. Monthly Weather Review, 131(11):2779-2803.
Wesolek, E. and Mahieu, P. 2011. The F4 tornado of August 3, 2008, in Northern France: Case study of a tornadic storm in a low CAPE environment. Atmospheric Research, 100(4):649-656.
Williams, E., Boldi, B., Matlin, A., Weber, M., Hodanish, S., Sharp, D., Goodman, S., Raghavan, R. and Buechler, D. 1999. The behavior of total lightning activity in severe Florida thunderstorms. Atmospheric Research, 51(3-4):245-265.