Embed Size (px)
Citation preview
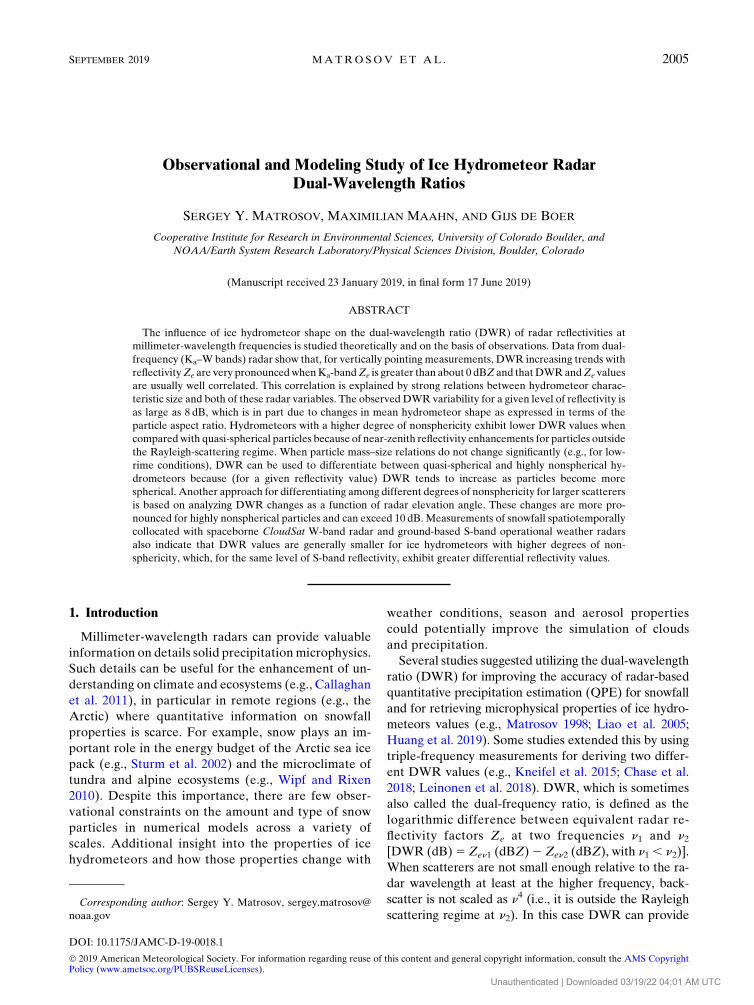
Observational and Modeling Study of Ice Hydrometeor RadarDual-Wavelength Ratios
SERGEY Y. MATROSOV, MAXIMILIAN MAAHN, AND GIJS DE BOER
Cooperative Institute for Research in Environmental Sciences, University of Colorado Boulder, and
NOAA/Earth System Research Laboratory/Physical Sciences Division, Boulder, Colorado
(Manuscript received 23 January 2019, in final form 17 June 2019)
ABSTRACT
The influence of ice hydrometeor shape on the dual-wavelength ratio (DWR) of radar reflectivities at
millimeter-wavelength frequencies is studied theoretically and on the basis of observations. Data from dual-
frequency (Ka–W bands) radar show that, for vertically pointing measurements, DWR increasing trends with
reflectivityZe are very pronouncedwhenKa-bandZe is greater than about 0 dBZ and thatDWRandZe values
are usually well correlated. This correlation is explained by strong relations between hydrometeor charac-
teristic size and both of these radar variables. The observed DWR variability for a given level of reflectivity is
as large as 8 dB, which is in part due to changes in mean hydrometeor shape as expressed in terms of the
particle aspect ratio. Hydrometeors with a higher degree of nonsphericity exhibit lower DWR values when
comparedwith quasi-spherical particles because of near-zenith reflectivity enhancements for particles outside
the Rayleigh-scattering regime. When particle mass–size relations do not change significantly (e.g., for low-
rime conditions), DWR can be used to differentiate between quasi-spherical and highly nonspherical hy-
drometeors because (for a given reflectivity value) DWR tends to increase as particles become more
spherical. Another approach for differentiating among different degrees of nonsphericity for larger scatterers
is based on analyzing DWR changes as a function of radar elevation angle. These changes are more pro-
nounced for highly nonspherical particles and can exceed 10 dB. Measurements of snowfall spatiotemporally
collocated with spaceborne CloudSat W-band radar and ground-based S-band operational weather radars
also indicate that DWR values are generally smaller for ice hydrometeors with higher degrees of non-
sphericity, which, for the same level of S-band reflectivity, exhibit greater differential reflectivity values.
1. Introduction
Millimeter-wavelength radars can provide valuable
information on details solid precipitationmicrophysics.
Such details can be useful for the enhancement of un-
derstanding on climate and ecosystems (e.g., Callaghan
et al. 2011), in particular in remote regions (e.g., the
Arctic) where quantitative information on snowfall
properties is scarce. For example, snow plays an im-
portant role in the energy budget of the Arctic sea ice
pack (e.g., Sturm et al. 2002) and the microclimate of
tundra and alpine ecosystems (e.g., Wipf and Rixen
2010). Despite this importance, there are few obser-
vational constraints on the amount and type of snow
particles in numerical models across a variety of
scales. Additional insight into the properties of ice
hydrometeors and how those properties change with
weather conditions, season and aerosol properties
could potentially improve the simulation of clouds
and precipitation.
Several studies suggested utilizing the dual-wavelength
ratio (DWR) for improving the accuracy of radar-based
quantitative precipitation estimation (QPE) for snowfall
and for retrieving microphysical properties of ice hydro-
meteors values (e.g., Matrosov 1998; Liao et al. 2005;
Huang et al. 2019). Some studies extended this by using
triple-frequency measurements for deriving two differ-
ent DWR values (e.g., Kneifel et al. 2015; Chase et al.
2018; Leinonen et al. 2018). DWR, which is sometimes
also called the dual-frequency ratio, is defined as the
logarithmic difference between equivalent radar re-
flectivity factors Ze at two frequencies n1 and n2[DWR (dB)5 Zen1 (dBZ)2 Zen2 (dBZ), with n1 , n2)].
When scatterers are not small enough relative to the ra-
dar wavelength at least at the higher frequency, back-
scatter is not scaled as n4 (i.e., it is outside the Rayleigh
scattering regime at n2). In this case DWR can provideCorresponding author: Sergey Y. Matrosov, sergey.matrosov@
noaa.gov
SEPTEMBER 2019 MATROSOV ET AL . 2005
DOI: 10.1175/JAMC-D-19-0018.1
� 2019 American Meteorological Society. For information regarding reuse of this content and general copyright information, consult the AMS CopyrightPolicy (www.ametsoc.org/PUBSReuseLicenses).
Unauthenticated | Downloaded 03/19/22 04:01 AM UTC
additional information on ice hydrometeor characteristic
size (e.g., median volume/mass or effective size), which
represents the entire particle size distribution (PSD).
One important DWR property is its relatively low
sensitivity to variations in ice particle bulk density (e.g.,
Matrosov 1998). Particle shape dependence of the DWR,
however, can be significant. This is especially true for
higher frequencies when the particle size–wavelength
ratios could be particularly large. Both airborne and
ground-based high-frequency dual-wavelength radar
systems (e.g., Ka and/or W bands) are increasingly used
to remotely sense ice hydrometeor microphysical prop-
erties and snowfall QPE (Liao et al. 2008; Matrosov et al.
2017; Mason et al. 2018). Unlike for liquid hydrometeors,
radar signal attenuation due to ice hydrometeors is rela-
tively small, meaning that high-frequency radars are well
suited for icemicrophysical studies. Often, beam pointing
of such radars is limited to zenith for ground-based sys-
tems or nadir for airborne and spaceborne systems.
Because DWR depends on hydrometeor shape
(Matrosov 1993; Matrosov et al. 2005), snowfall prop-
erty retrieval techniques utilizing the DWR usually as-
sume an average ice hydrometeor shape (e.g., Mason
et al. 2018; Huang et al. 2019). The shape parameter is
usually expressed as a particle aspect ratio, which is
defined as a ratio of hydrometeor minor and major
dimensions. Dual-wavelength effects become stronger
as particle size–wavelength ratio increases. As a result,
the DWR hydrometeor shape sensitivity is especially
strong when the shorter radar wavelength is at W band
(;94GHz), which is typically the highest frequency
used in meteorological radars.
An important practical use of DWR measurements
involves the ability to estimate hydrometeor sizes. There
are also indications (e.g., Matrosov and Heymsfield
2017) that characteristic size parameters of atmospheric
ice particles are well correlated with absolute reflectivity
factor (hereinafter just reflectivity), so a certain corre-
spondence between reflectivity and DWR can be ex-
pected. One objective of the current study is to analyze
such correspondence from both theory and observa-
tional data, and to establish at what reflectivity values,
on average, DWR measurements contain information
on particle properties. Another objective is to assess if
and under what conditionsDWRcan be potentially used
as some indicator of general particle shape.
The central focus of this study is on the millimeter-
wavelength DWR. Cloud radars operating at such
wavelengths are increasingly used for atmospheric ice
measurements. Observational data mostly came from the
second-generation U.S. Department of Energy (DOE)
scanning Atmospheric Radiation Measurement (ARM)
cloud radar (SACR-2) operating at Ka- (;35GHz) and
W-band (;94GHz) frequencies. In 2016–17, this radar
was deployed at the Oliktok Point (70.4958N, 149.8868W)
ARM Mobile Facility 3 (AMF3). The SACR-2 data are
available from the ARM Data Center (Matthews et al.
2016a,b).
2. Correspondence between reflectivity and DWRmeasurements
a. Observational data
Figure 1 shows scatterplots of Ka–W-band DWR
versus Ka-band reflectivity Ze from vertically pointing
SACR-2 measurements during three October 2016
(15, 18, and 21 October) and three May 2017 (9, 14, and
24 May) stratiform snowfall events. The data were
thresholded at a 3-dB signal-to-noise ratio and an ab-
solute value of mean Doppler velocity of 0.1m s21 to
mitigate clutter. The SACR-2 Ka- and W-band radar
beams are closely matched (;0.38 beamwidth). Range
sampling is 15m for both channels and the closest range
gate is at a distance of 0.375 km. The measurements
shown in Fig. 1 correspond to radar gates located be-
low 0.5 km, which was generally lower than the base
of supercooled liquid layers estimated from a collo-
cated ceilometer (not shown). Temperatures thorough
the atmospheric column generally were below freezing.
Using these lowest radar gates results in minimization
of differential attenuation due to cloud liquid.
Radar measurements were corrected for gaseous at-
tenuation using an approach described by Matrosov
and Turner (2018) and air pressure, humidity and tem-
perature vertical profiles from interpolated radiosonde
soundings at the AMF3 location. The effects of a relative
miscalibration between the SACR-2 Ka- and W-band
channels were accounted for by introducing a DWR-
relative correction term, which was calculated assum-
ing that gaseous attenuation-corrected reflectivities at
both frequencies are equal for small reflectivity values
(Ze,215dBZ). At these low reflectivities, it is expected
that particles are small compared to both wavelengths
and DWR ’ 0dB. The DWR-relative correction term
was generally less than about 0.7dB for the events con-
sidered in this study. The absolute calibration of the
W-band SACR-2 channel was verified by intercomparing
with the spaceborne CloudSat W-band radar during
the satellite overpasses in the close proximity (;3km) of
the AMF3 location. The corresponding intercompari-
sons indicated that the SACR-2 absolute calibration was
within ;2dB of the CloudSat radar measurements.
Figure 1 illustrates that DWRand absolute reflectivity
are, on average, strongly correlated, although the DWR
variability for a given value of Ze is very high. Shapes of
2006 JOURNAL OF APPL IED METEOROLOGY AND CL IMATOLOGY VOLUME 58
Unauthenticated | Downloaded 03/19/22 04:01 AM UTC
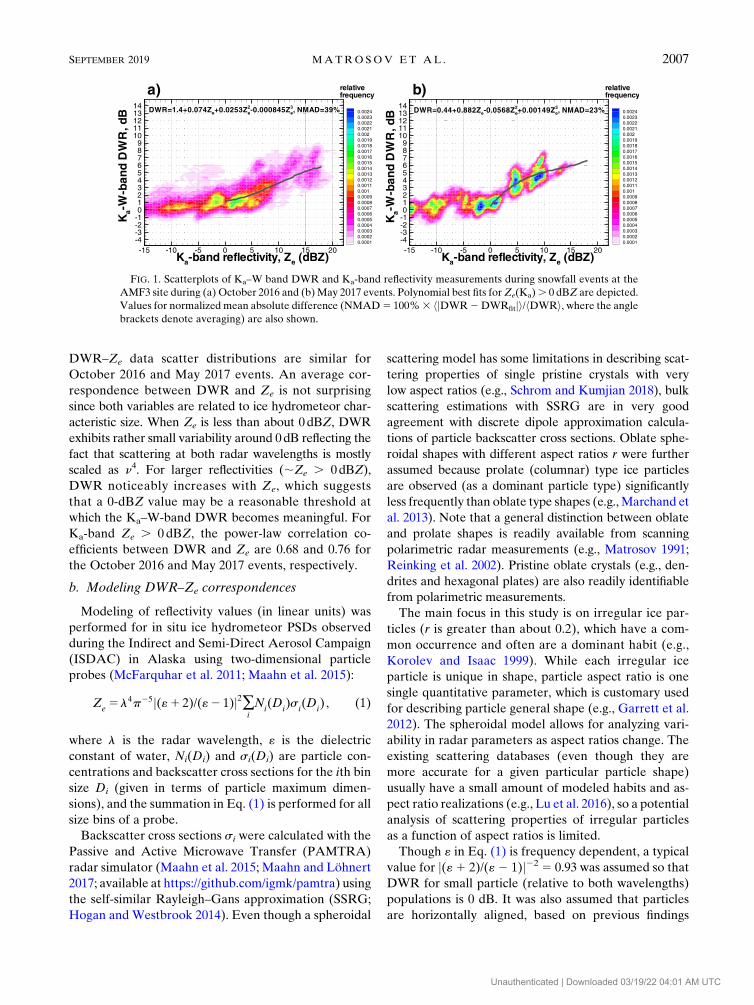
DWR–Ze data scatter distributions are similar for
October 2016 and May 2017 events. An average cor-
respondence between DWR and Ze is not surprising
since both variables are related to ice hydrometeor char-
acteristic size. When Ze is less than about 0dBZ, DWR
exhibits rather small variability around 0dB reflecting the
fact that scattering at both radar wavelengths is mostly
scaled as n4. For larger reflectivities (;Ze . 0dBZ),
DWR noticeably increases with Ze, which suggests
that a 0-dBZ value may be a reasonable threshold at
which the Ka–W-band DWR becomes meaningful. For
Ka-band Ze . 0 dBZ, the power-law correlation co-
efficients between DWR and Ze are 0.68 and 0.76 for
the October 2016 and May 2017 events, respectively.
b. Modeling DWR–Ze correspondences
Modeling of reflectivity values (in linear units) was
performed for in situ ice hydrometeor PSDs observed
during the Indirect and Semi-Direct Aerosol Campaign
(ISDAC) in Alaska using two-dimensional particle
probes (McFarquhar et al. 2011; Maahn et al. 2015):
Ze5 l4p25j(«1 2)/(«2 1)j2�
i
Ni(D
i)s
i(D
i) , (1)
where l is the radar wavelength, « is the dielectric
constant of water, Ni(Di) and si(Di) are particle con-
centrations and backscatter cross sections for the ith bin
size Di (given in terms of particle maximum dimen-
sions), and the summation in Eq. (1) is performed for all
size bins of a probe.
Backscatter cross sections si were calculated with the
Passive and Active Microwave Transfer (PAMTRA)
radar simulator (Maahn et al. 2015; Maahn and Löhnert2017; available at https://github.com/igmk/pamtra) using
the self-similar Rayleigh–Gans approximation (SSRG;
Hogan and Westbrook 2014). Even though a spheroidal
scattering model has some limitations in describing scat-
tering properties of single pristine crystals with very
low aspect ratios (e.g., Schrom and Kumjian 2018), bulk
scattering estimations with SSRG are in very good
agreement with discrete dipole approximation calcula-
tions of particle backscatter cross sections. Oblate sphe-
roidal shapes with different aspect ratios r were further
assumed because prolate (columnar) type ice particles
are observed (as a dominant particle type) significantly
less frequently than oblate type shapes (e.g., Marchand et
al. 2013). Note that a general distinction between oblate
and prolate shapes is readily available from scanning
polarimetric radar measurements (e.g., Matrosov 1991;
Reinking et al. 2002). Pristine oblate crystals (e.g., den-
drites and hexagonal plates) are also readily identifiable
from polarimetric measurements.
The main focus in this study is on irregular ice par-
ticles (r is greater than about 0.2), which have a com-
mon occurrence and often are a dominant habit (e.g.,
Korolev and Isaac 1999). While each irregular ice
particle is unique in shape, particle aspect ratio is one
single quantitative parameter, which is customary used
for describing particle general shape (e.g., Garrett et al.
2012). The spheroidal model allows for analyzing vari-
ability in radar parameters as aspect ratios change. The
existing scattering databases (even though they are
more accurate for a given particular particle shape)
usually have a small amount of modeled habits and as-
pect ratio realizations (e.g., Lu et al. 2016), so a potential
analysis of scattering properties of irregular particles
as a function of aspect ratios is limited.
Though « in Eq. (1) is frequency dependent, a typical
value for j(«1 2)/(«2 1)j22 5 0.93 was assumed so that
DWR for small particle (relative to both wavelengths)
populations is 0 dB. It was also assumed that particles
are horizontally aligned, based on previous findings
FIG. 1. Scatterplots of Ka–W band DWR and Ka-band reflectivity measurements during snowfall events at the
AMF3 site during (a) October 2016 and (b)May 2017 events. Polynomial best fits forZe(Ka). 0 dBZ are depicted.
Values for normalized mean absolute difference (NMAD5 100%3 hjDWR2DWRfitji/hDWRi, where the anglebrackets denote averaging) are also shown.
SEPTEMBER 2019 MATROSOV ET AL . 2007
Unauthenticated | Downloaded 03/19/22 04:01 AM UTC
from polarimetric radar measurements (e.g., Hogan
et al. 2012; Melnikov 2017) demonstrating that typical
particle standard deviations from preferential horizon-
tal orientation are usually rather small (;108–208).Backscatter of individual particles depends on particle
density, which is determined by their mass–size rela-
tions (i.e.,m–D relations) that are typically expressed by
power-law approximations:
m5aDb , (2)
where a and b are empirical constants. When modeling
radar variables using the SSRG approximation, solid ice
inclusions into the spheroidal particle shape are in-
troduced and the total mass is constrained by Eq. (2).
Backscatter is calculated depending on the area of
solid ice intersected by the cross section of a particle
that is perpendicular to the viewing direction (Hogan
and Westbrook 2014).
Von Lerber et al. (2017) found that median values
of the prefactor a and the exponent b in Eq. (2) for
unrimed and lightly rimed falling ice particles
near the ground are 0.0046 and 2.1 (cgs units here-
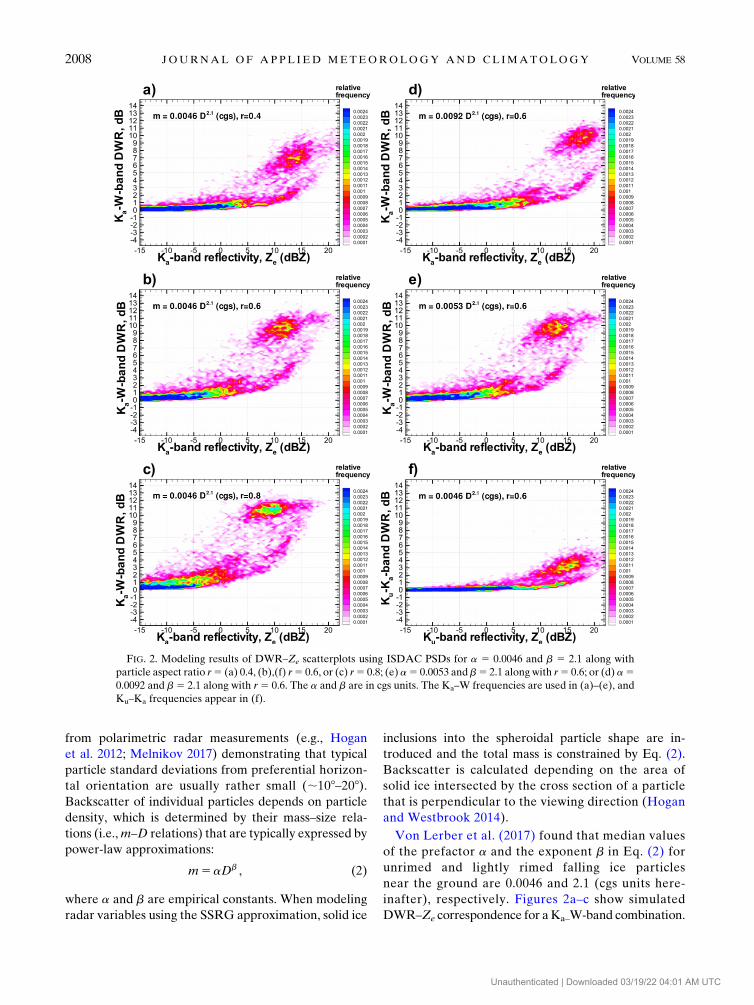
inafter), respectively. Figures 2a–c show simulated
DWR–Ze correspondence for aKa–W-band combination.
FIG. 2. Modeling results of DWR–Ze scatterplots using ISDAC PSDs for a 5 0.0046 and b 5 2.1 along with
particle aspect ratio r5 (a) 0.4, (b),(f) r5 0.6, or (c) r5 0.8; (e) a5 0.0053 and b5 2.1 alongwith r5 0.6; or (d) a50.0092 and b5 2.1 along with r5 0.6. The a and b are in cgs units. The Ka–W frequencies are used in (a)–(e), and
Ku–Ka frequencies appear in (f).
2008 JOURNAL OF APPL IED METEOROLOGY AND CL IMATOLOGY VOLUME 58
Unauthenticated | Downloaded 03/19/22 04:01 AM UTC
These calculations assume the values ofa and b discussed
above and are shown for particle aspect ratios 0.4, 0.6, and
0.8. This is an approximate range of particle mean aspect
ratios that have been frequently observed using direct
sensors and polarimetric radar-based retrievals including
parts of the 21 October 2016 event when in situ sampling
aloft was available (Matrosov et al. 2017). Correlation
coefficients between modeled DWR and Ze(Ka) are in
the range of 0.60–0.74 for Ze(Ka) . 0dBZ, which is
comparable to those from observations. As evident from
these figures, populations of hydrometeors with higher
degree of nonsphericity (i.e., with smaller r values) ex-
hibit smaller DWRs for a given reflectivity. This is
due to the zenith/nadir reflectivity enhancement effect
(relative to the slant viewing), which is observed for
larger nonspherical particles (e.g., Matrosov et al. 2012;
Marchand et al. 2013). This effect is much stronger
at W band than at Ka band; thus it generally causes
a decrease of DWR as particles with larger size–
wavelength ratios become more nonspherical. For ex-
treme cases (e.g., larger single dendrites), W-band
zenith reflectivity enhancements can be as high
as ;10 dB (Matrosov et al. 2012).
A comparison of Figs. 1a and 1b and 2a–c shows that
there is an approximate agreement between the data
scatter areas for observed and modeled data. Theoreti-
cal DWR values, however, are all positive, while the
observational DWRs can be negative because of some
residual relative calibration uncertainties and measure-
ment noise. This is particularly true during extreme
W-band zenith backscatter enhancements resulting from
particles with higher degree of nonsphericity aligned in a
nearly horizontal fashion.
Ice crystal riming causes the prefactor a in Eq. (2) to
increase while the exponent b does not change signifi-
cantly until extreme riming transitions the ice crystals to
graupel particles (Erfani and Mitchell 2017; von Lerber
et al. 2017). This results in an increase of particle bulk
density that elevates radar reflectivities at both fre-
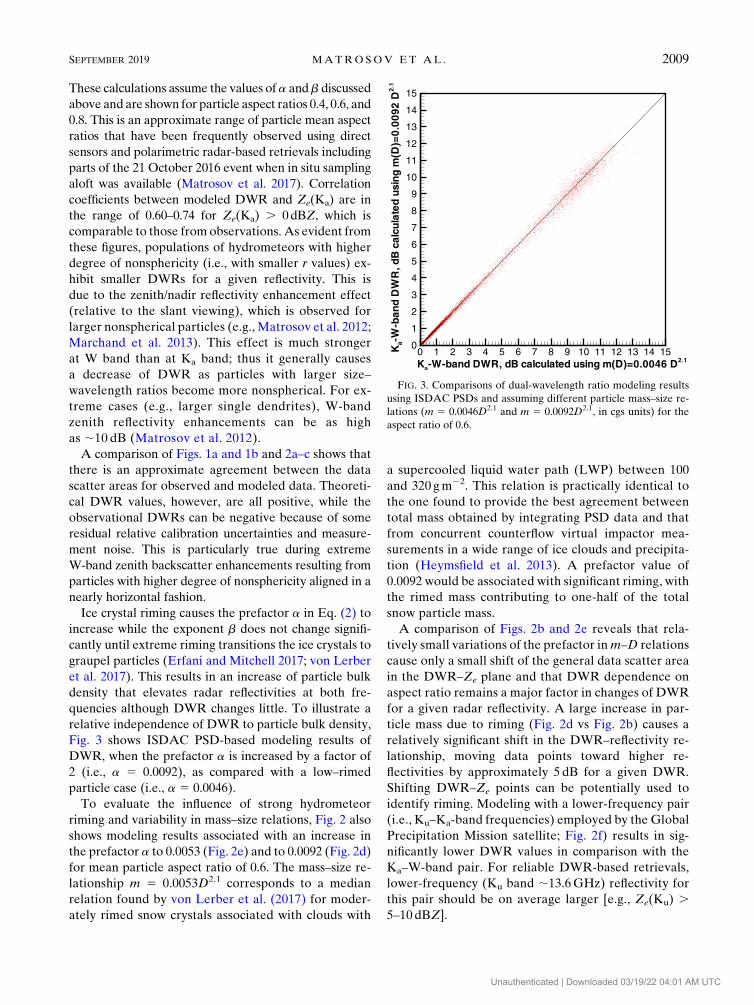
quencies although DWR changes little. To illustrate a
relative independence of DWR to particle bulk density,
Fig. 3 shows ISDAC PSD-based modeling results of
DWR, when the prefactor a is increased by a factor of
2 (i.e., a 5 0.0092), as compared with a low–rimed
particle case (i.e., a 5 0.0046).
To evaluate the influence of strong hydrometeor
riming and variability in mass–size relations, Fig. 2 also
shows modeling results associated with an increase in
the prefactor a to 0.0053 (Fig. 2e) and to 0.0092 (Fig. 2d)
for mean particle aspect ratio of 0.6. The mass–size re-
lationship m 5 0.0053D2.1 corresponds to a median
relation found by von Lerber et al. (2017) for moder-
ately rimed snow crystals associated with clouds with
a supercooled liquid water path (LWP) between 100
and 320 gm22. This relation is practically identical to
the one found to provide the best agreement between
total mass obtained by integrating PSD data and that
from concurrent counterflow virtual impactor mea-
surements in a wide range of ice clouds and precipita-
tion (Heymsfield et al. 2013). A prefactor value of
0.0092 would be associated with significant riming, with
the rimed mass contributing to one-half of the total
snow particle mass.
A comparison of Figs. 2b and 2e reveals that rela-
tively small variations of the prefactor inm–D relations
cause only a small shift of the general data scatter area
in the DWR–Ze plane and that DWR dependence on
aspect ratio remains a major factor in changes of DWR
for a given radar reflectivity. A large increase in par-
ticle mass due to riming (Fig. 2d vs Fig. 2b) causes a
relatively significant shift in the DWR–reflectivity re-
lationship, moving data points toward higher re-
flectivities by approximately 5 dB for a given DWR.
Shifting DWR–Ze points can be potentially used to
identify riming. Modeling with a lower-frequency pair
(i.e., Ku–Ka-band frequencies) employed by the Global
Precipitation Mission satellite; Fig. 2f) results in sig-
nificantly lower DWR values in comparison with the
Ka–W-band pair. For reliable DWR-based retrievals,
lower-frequency (Ku band ;13.6GHz) reflectivity for
this pair should be on average larger [e.g., Ze(Ku) .5–10 dBZ].
FIG. 3. Comparisons of dual-wavelength ratio modeling results
using ISDAC PSDs and assuming different particle mass–size re-
lations (m 5 0.0046D2.1 and m 5 0.0092D2.1, in cgs units) for the
aspect ratio of 0.6.
SEPTEMBER 2019 MATROSOV ET AL . 2009
Unauthenticated | Downloaded 03/19/22 04:01 AM UTC
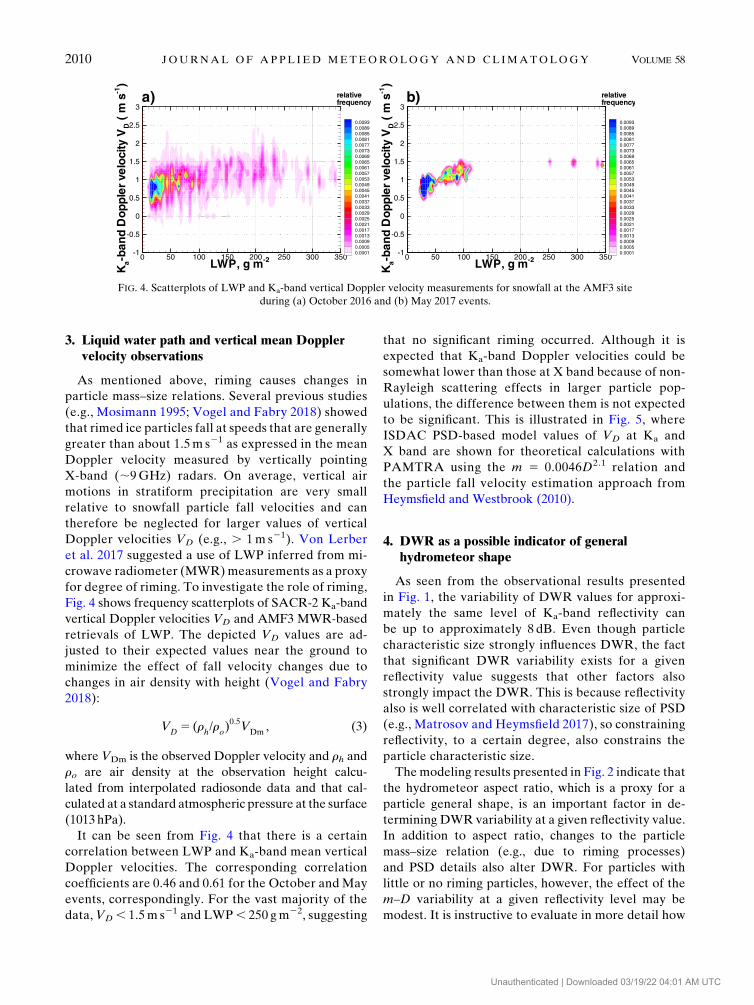
3. Liquid water path and vertical mean Dopplervelocity observations
As mentioned above, riming causes changes in
particle mass–size relations. Several previous studies
(e.g., Mosimann 1995; Vogel and Fabry 2018) showed
that rimed ice particles fall at speeds that are generally
greater than about 1.5m s21 as expressed in the mean
Doppler velocity measured by vertically pointing
X-band (;9GHz) radars. On average, vertical air
motions in stratiform precipitation are very small
relative to snowfall particle fall velocities and can
therefore be neglected for larger values of vertical
Doppler velocities VD (e.g., . 1m s21). Von Lerber
et al. 2017 suggested a use of LWP inferred from mi-
crowave radiometer (MWR)measurements as a proxy
for degree of riming. To investigate the role of riming,
Fig. 4 shows frequency scatterplots of SACR-2 Ka-band
vertical Doppler velocities VD and AMF3 MWR-based
retrievals of LWP. The depicted VD values are ad-
justed to their expected values near the ground to
minimize the effect of fall velocity changes due to
changes in air density with height (Vogel and Fabry
2018):
VD5 (r
h/r
o)0:5V
Dm, (3)
where VDm is the observed Doppler velocity and rh and
ro are air density at the observation height calcu-
lated from interpolated radiosonde data and that cal-
culated at a standard atmospheric pressure at the surface
(1013 hPa).
It can be seen from Fig. 4 that there is a certain
correlation between LWP and Ka-band mean vertical
Doppler velocities. The corresponding correlation
coefficients are 0.46 and 0.61 for the October and May
events, correspondingly. For the vast majority of the
data, VD , 1.5m s21 and LWP, 250 gm22, suggesting
that no significant riming occurred. Although it is
expected that Ka-band Doppler velocities could be
somewhat lower than those at X band because of non-
Rayleigh scattering effects in larger particle pop-
ulations, the difference between them is not expected
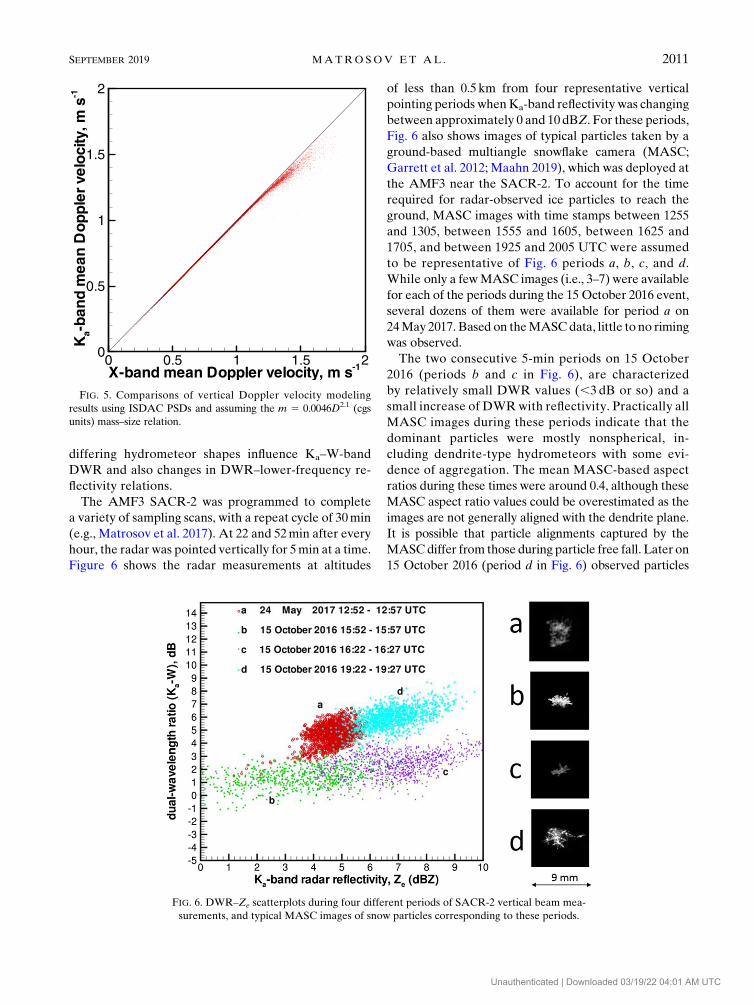
to be significant. This is illustrated in Fig. 5, where
ISDAC PSD-based model values of VD at Ka and
X band are shown for theoretical calculations with
PAMTRA using the m 5 0.0046D2.1 relation and
the particle fall velocity estimation approach from
Heymsfield and Westbrook (2010).
4. DWR as a possible indicator of generalhydrometeor shape
As seen from the observational results presented
in Fig. 1, the variability of DWR values for approxi-
mately the same level of Ka-band reflectivity can
be up to approximately 8 dB. Even though particle
characteristic size strongly influences DWR, the fact
that significant DWR variability exists for a given
reflectivity value suggests that other factors also
strongly impact the DWR. This is because reflectivity
also is well correlated with characteristic size of PSD
(e.g., Matrosov and Heymsfield 2017), so constraining
reflectivity, to a certain degree, also constrains the
particle characteristic size.
The modeling results presented in Fig. 2 indicate that
the hydrometeor aspect ratio, which is a proxy for a
particle general shape, is an important factor in de-
termining DWR variability at a given reflectivity value.
In addition to aspect ratio, changes to the particle
mass–size relation (e.g., due to riming processes)
and PSD details also alter DWR. For particles with
little or no riming particles, however, the effect of the
m–D variability at a given reflectivity level may be
modest. It is instructive to evaluate in more detail how
FIG. 4. Scatterplots of LWP and Ka-band vertical Doppler velocity measurements for snowfall at the AMF3 site
during (a) October 2016 and (b) May 2017 events.
2010 JOURNAL OF APPL IED METEOROLOGY AND CL IMATOLOGY VOLUME 58
Unauthenticated | Downloaded 03/19/22 04:01 AM UTC
differing hydrometeor shapes influence Ka–W-band
DWR and also changes in DWR–lower-frequency re-
flectivity relations.
The AMF3 SACR-2 was programmed to complete
a variety of sampling scans, with a repeat cycle of 30min
(e.g., Matrosov et al. 2017). At 22 and 52min after every
hour, the radar was pointed vertically for 5min at a time.
Figure 6 shows the radar measurements at altitudes
of less than 0.5 km from four representative vertical
pointing periods whenKa-band reflectivity was changing
between approximately 0 and 10dBZ. For these periods,
Fig. 6 also shows images of typical particles taken by a
ground-based multiangle snowflake camera (MASC;
Garrett et al. 2012; Maahn 2019), which was deployed at
the AMF3 near the SACR-2. To account for the time
required for radar-observed ice particles to reach the
ground, MASC images with time stamps between 1255
and 1305, between 1555 and 1605, between 1625 and
1705, and between 1925 and 2005 UTC were assumed
to be representative of Fig. 6 periods a, b, c, and d.
While only a fewMASC images (i.e., 3–7) were available
for each of the periods during the 15 October 2016 event,
several dozens of them were available for period a on
24May 2017. Based on theMASCdata, little to no riming
was observed.
The two consecutive 5-min periods on 15 October
2016 (periods b and c in Fig. 6), are characterized
by relatively small DWR values (,3 dB or so) and a
small increase of DWRwith reflectivity. Practically all
MASC images during these periods indicate that the
dominant particles were mostly nonspherical, in-
cluding dendrite-type hydrometeors with some evi-
dence of aggregation. The mean MASC-based aspect
ratios during these times were around 0.4, although these
MASC aspect ratio values could be overestimated as the
images are not generally aligned with the dendrite plane.
It is possible that particle alignments captured by the
MASCdiffer from those during particle free fall. Later on
15 October 2016 (period d in Fig. 6) observed particles
FIG. 5. Comparisons of vertical Doppler velocity modeling
results using ISDAC PSDs and assuming the m 5 0.0046D2.1 (cgs
units) mass–size relation.
FIG. 6. DWR–Ze scatterplots during four different periods of SACR-2 vertical beam mea-
surements, and typical MASC images of snow particles corresponding to these periods.
SEPTEMBER 2019 MATROSOV ET AL . 2011
Unauthenticated | Downloaded 03/19/22 04:01 AM UTC
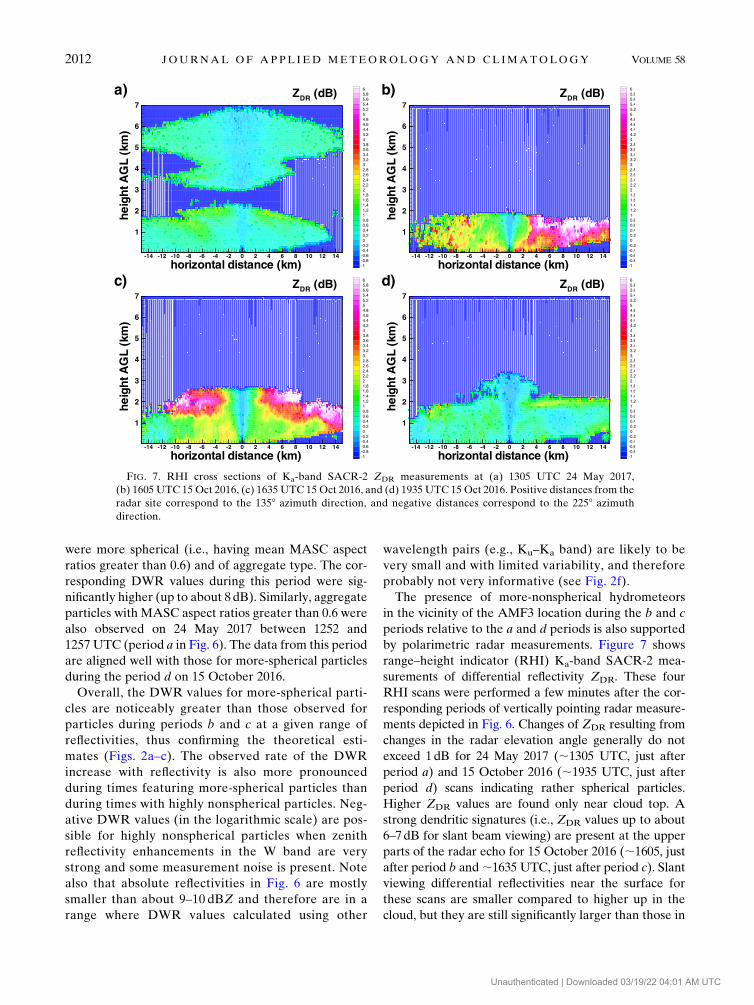
were more spherical (i.e., having mean MASC aspect
ratios greater than 0.6) and of aggregate type. The cor-
responding DWR values during this period were sig-
nificantly higher (up to about 8 dB). Similarly, aggregate
particles with MASC aspect ratios greater than 0.6 were
also observed on 24 May 2017 between 1252 and
1257 UTC (period a in Fig. 6). The data from this period
are aligned well with those for more-spherical particles
during the period d on 15 October 2016.
Overall, the DWR values for more-spherical parti-
cles are noticeably greater than those observed for
particles during periods b and c at a given range of
reflectivities, thus confirming the theoretical esti-
mates (Figs. 2a–c). The observed rate of the DWR
increase with reflectivity is also more pronounced
during times featuring more-spherical particles than
during times with highly nonspherical particles. Neg-
ative DWR values (in the logarithmic scale) are pos-
sible for highly nonspherical particles when zenith
reflectivity enhancements in the W band are very
strong and some measurement noise is present. Note
also that absolute reflectivities in Fig. 6 are mostly
smaller than about 9–10 dBZ and therefore are in a
range where DWR values calculated using other
wavelength pairs (e.g., Ku–Ka band) are likely to be
very small and with limited variability, and therefore
probably not very informative (see Fig. 2f).
The presence of more-nonspherical hydrometeors
in the vicinity of the AMF3 location during the b and c
periods relative to the a and d periods is also supported
by polarimetric radar measurements. Figure 7 shows
range–height indicator (RHI) Ka-band SACR-2 mea-
surements of differential reflectivity ZDR. These four
RHI scans were performed a few minutes after the cor-
responding periods of vertically pointing radar measure-
ments depicted in Fig. 6. Changes of ZDR resulting from
changes in the radar elevation angle generally do not
exceed 1dB for 24 May 2017 (;1305 UTC, just after
period a) and 15 October 2016 (;1935 UTC, just after
period d) scans indicating rather spherical particles.
Higher ZDR values are found only near cloud top. A
strong dendritic signatures (i.e., ZDR values up to about
6–7dB for slant beam viewing) are present at the upper
parts of the radar echo for 15 October 2016 (;1605, just
after period b and;1635 UTC, just after period c). Slant
viewing differential reflectivities near the surface for
these scans are smaller compared to higher up in the
cloud, but they are still significantly larger than those in
FIG. 7. RHI cross sections of Ka-band SACR-2 ZDR measurements at (a) 1305 UTC 24 May 2017,
(b) 1605 UTC 15 Oct 2016, (c) 1635 UTC 15 Oct 2016, and (d) 1935 UTC 15 Oct 2016. Positive distances from the
radar site correspond to the 1358 azimuth direction, and negative distances correspond to the 2258 azimuth
direction.
2012 JOURNAL OF APPL IED METEOROLOGY AND CL IMATOLOGY VOLUME 58
Unauthenticated | Downloaded 03/19/22 04:01 AM UTC
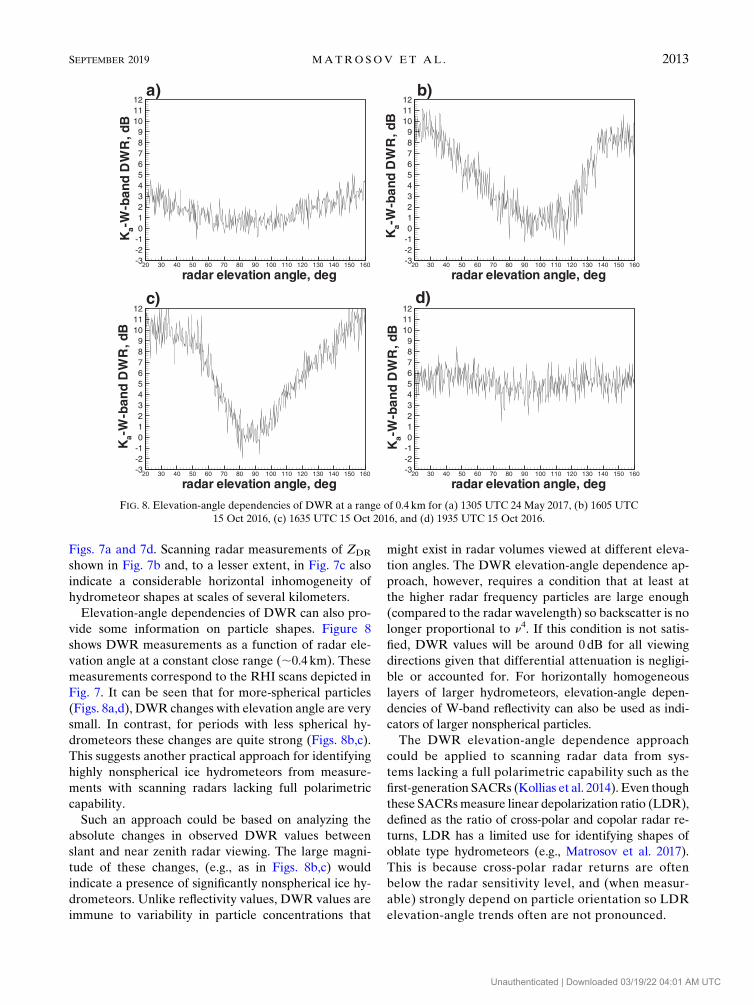
Figs. 7a and 7d. Scanning radar measurements of ZDR
shown in Fig. 7b and, to a lesser extent, in Fig. 7c also
indicate a considerable horizontal inhomogeneity of
hydrometeor shapes at scales of several kilometers.
Elevation-angle dependencies of DWR can also pro-
vide some information on particle shapes. Figure 8
shows DWR measurements as a function of radar ele-
vation angle at a constant close range (;0.4 km). These
measurements correspond to the RHI scans depicted in
Fig. 7. It can be seen that for more-spherical particles
(Figs. 8a,d), DWR changes with elevation angle are very
small. In contrast, for periods with less spherical hy-
drometeors these changes are quite strong (Figs. 8b,c).
This suggests another practical approach for identifying
highly nonspherical ice hydrometeors from measure-
ments with scanning radars lacking full polarimetric
capability.
Such an approach could be based on analyzing the
absolute changes in observed DWR values between
slant and near zenith radar viewing. The large magni-
tude of these changes, (e.g., as in Figs. 8b,c) would
indicate a presence of significantly nonspherical ice hy-
drometeors. Unlike reflectivity values, DWR values are
immune to variability in particle concentrations that
might exist in radar volumes viewed at different eleva-
tion angles. The DWR elevation-angle dependence ap-
proach, however, requires a condition that at least at
the higher radar frequency particles are large enough
(compared to the radar wavelength) so backscatter is no
longer proportional to n4. If this condition is not satis-
fied, DWR values will be around 0dB for all viewing
directions given that differential attenuation is negligi-
ble or accounted for. For horizontally homogeneous
layers of larger hydrometeors, elevation-angle depen-
dencies of W-band reflectivity can also be used as indi-
cators of larger nonspherical particles.
The DWR elevation-angle dependence approach
could be applied to scanning radar data from sys-
tems lacking a full polarimetric capability such as the
first-generation SACRs (Kollias et al. 2014). Even though
these SACRsmeasure linear depolarization ratio (LDR),
defined as the ratio of cross-polar and copolar radar re-
turns, LDR has a limited use for identifying shapes of
oblate type hydrometeors (e.g., Matrosov et al. 2017).
This is because cross-polar radar returns are often
below the radar sensitivity level, and (when measur-
able) strongly depend on particle orientation so LDR
elevation-angle trends often are not pronounced.
FIG. 8. Elevation-angle dependencies of DWR at a range of 0.4 km for (a) 1305 UTC 24 May 2017, (b) 1605 UTC
15 Oct 2016, (c) 1635 UTC 15 Oct 2016, and (d) 1935 UTC 15 Oct 2016.
SEPTEMBER 2019 MATROSOV ET AL . 2013
Unauthenticated | Downloaded 03/19/22 04:01 AM UTC
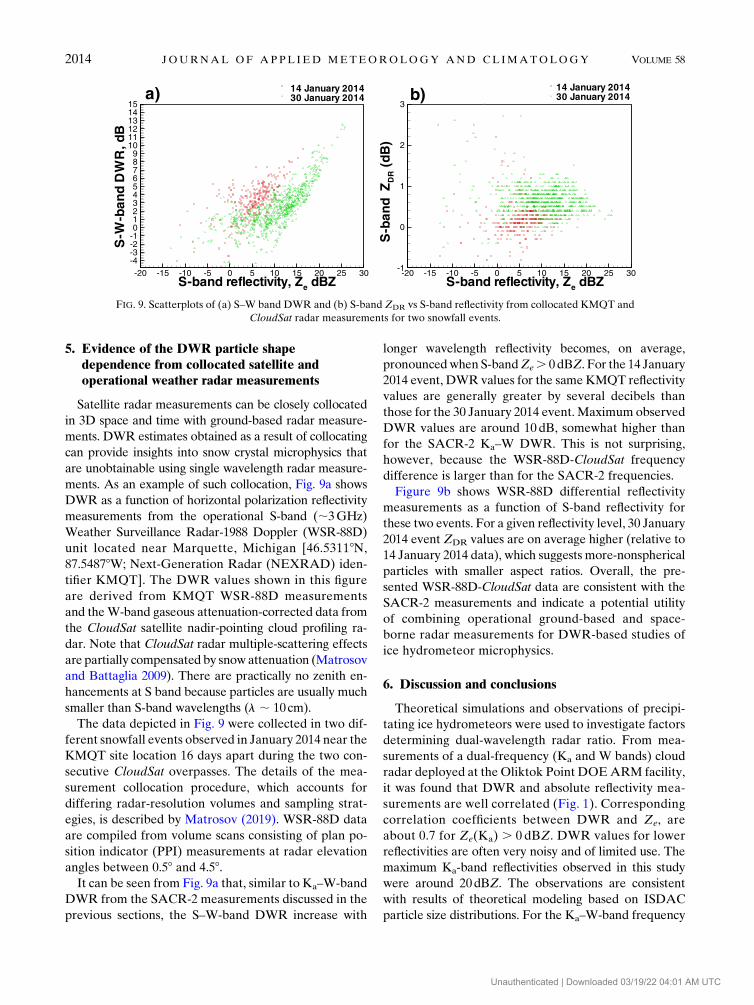
5. Evidence of the DWR particle shapedependence from collocated satellite andoperational weather radar measurements
Satellite radar measurements can be closely collocated
in 3D space and time with ground-based radar measure-
ments. DWR estimates obtained as a result of collocating
can provide insights into snow crystal microphysics that
are unobtainable using single wavelength radar measure-
ments. As an example of such collocation, Fig. 9a shows
DWR as a function of horizontal polarization reflectivity
measurements from the operational S-band (;3GHz)
Weather Surveillance Radar-1988 Doppler (WSR-88D)
unit located near Marquette, Michigan [46.53118N,
87.54878W; Next-Generation Radar (NEXRAD) iden-
tifier KMQT]. The DWR values shown in this figure
are derived from KMQT WSR-88D measurements
and theW-band gaseous attenuation-corrected data from
the CloudSat satellite nadir-pointing cloud profiling ra-
dar. Note that CloudSat radar multiple-scattering effects
are partially compensated by snow attenuation (Matrosov
and Battaglia 2009). There are practically no zenith en-
hancements at S band because particles are usually much
smaller than S-band wavelengths (l ; 10cm).
The data depicted in Fig. 9 were collected in two dif-
ferent snowfall events observed in January 2014 near the
KMQT site location 16 days apart during the two con-
secutive CloudSat overpasses. The details of the mea-
surement collocation procedure, which accounts for
differing radar-resolution volumes and sampling strat-
egies, is described by Matrosov (2019). WSR-88D data
are compiled from volume scans consisting of plan po-
sition indicator (PPI) measurements at radar elevation
angles between 0.58 and 4.58.It can be seen from Fig. 9a that, similar to Ka–W-band
DWR from the SACR-2 measurements discussed in the
previous sections, the S–W-band DWR increase with
longer wavelength reflectivity becomes, on average,
pronouncedwhen S-bandZe. 0dBZ. For the 14 January
2014 event, DWR values for the sameKMQT reflectivity
values are generally greater by several decibels than
those for the 30 January 2014 event. Maximum observed
DWR values are around 10dB, somewhat higher than
for the SACR-2 Ka–W DWR. This is not surprising,
however, because the WSR-88D-CloudSat frequency
difference is larger than for the SACR-2 frequencies.
Figure 9b shows WSR-88D differential reflectivity
measurements as a function of S-band reflectivity for
these two events. For a given reflectivity level, 30 January
2014 event ZDR values are on average higher (relative to
14 January 2014 data), which suggests more-nonspherical
particles with smaller aspect ratios. Overall, the pre-
sented WSR-88D-CloudSat data are consistent with the
SACR-2 measurements and indicate a potential utility
of combining operational ground-based and space-
borne radar measurements for DWR-based studies of
ice hydrometeor microphysics.
6. Discussion and conclusions
Theoretical simulations and observations of precipi-
tating ice hydrometeors were used to investigate factors
determining dual-wavelength radar ratio. From mea-
surements of a dual-frequency (Ka and W bands) cloud
radar deployed at theOliktok Point DOEARM facility,
it was found that DWR and absolute reflectivity mea-
surements are well correlated (Fig. 1). Corresponding
correlation coefficients between DWR and Ze, are
about 0.7 for Ze(Ka) . 0 dBZ. DWR values for lower
reflectivities are often very noisy and of limited use. The
maximum Ka-band reflectivities observed in this study
were around 20dBZ. The observations are consistent
with results of theoretical modeling based on ISDAC
particle size distributions. For the Ka–W-band frequency
FIG. 9. Scatterplots of (a) S–W band DWR and (b) S-band ZDR vs S-band reflectivity from collocated KMQT and
CloudSat radar measurements for two snowfall events.
2014 JOURNAL OF APPL IED METEOROLOGY AND CL IMATOLOGY VOLUME 58
Unauthenticated | Downloaded 03/19/22 04:01 AM UTC
pair commonly used in cloud radars, a relatively strong
general increase of DWR with reflectivity is observed
when the longer-wavelength Ze values are greater than
about 0dBZ. For pairs of longer wavelengths (e.g., Ku–Ka
bands), such an increase is expected starting at higher
reflectivity values. Therefore, corresponding DWR
values are significantly smaller, suggesting that the
addition of a third (lower) frequency radar measure-
ment is only beneficial for larger hydrometeor pop-
ulations exhibiting higher reflectivities. A relatively
strong correlation between DWR and Ze can be ex-
plained, in part, by the fact that both these variables
are relatively strongly related to the characteristic
particle size representing the entire PSD.
Although for a given size distribution DWR exhibits
very little dependence on particle density, the DWR
variability with particle aspect ratio (i.e., particle shape)
is significant. Theoretical calculations using in situ PSDs
and measurements with the vertically pointing dual-
frequency radar indicate that for commonly observed
ice hydrometeors, the DWR variability with particle
shape can be up to about 5–7dB or even higher (e.g.,
between particles with small aspect ratios and more-
spherical ice hydrometeors). For a given PSD, a general
decrease of DWR values with decreasing particle aspect
ratios is due to near zenith reflectivity enhancement of
W-band backscatter. These results point out to the im-
portance of particle shape assumptions or estimates
(e.g., from polarimetric radar measurements) in ice hy-
drometeor microphysical retrievals based on multifre-
quency radar measurements.
Although particle degree of nonsphericity changes
play an important role in the DWR variability (at a
given lower-frequency reflectivity), changes in other
microphysical parameters such as the m–D relation
coefficients (e.g., Fig. 2b vs Fig. 2e) and the PSD details
affect this variability. It results in a significant scatter of
DWR data points in Fig. 2 (and also in Fig. 1) for a
given valueZe. To illustrate the influence of PSD shape
on the relation between DWR and Ze, model calcula-
tions were performed assuming gamma-function PSD,
which is characterized by three parameters: the scaling
factor No, the PSD shape parameter m, and the charac-
teristic particle size such as median volume size Dmv. In
situ measurements conducted in ice clouds and pre-
cipitation indicate that the m parameter usually varies
between 22 and 1 (Matrosov and Heymsfield 2017).
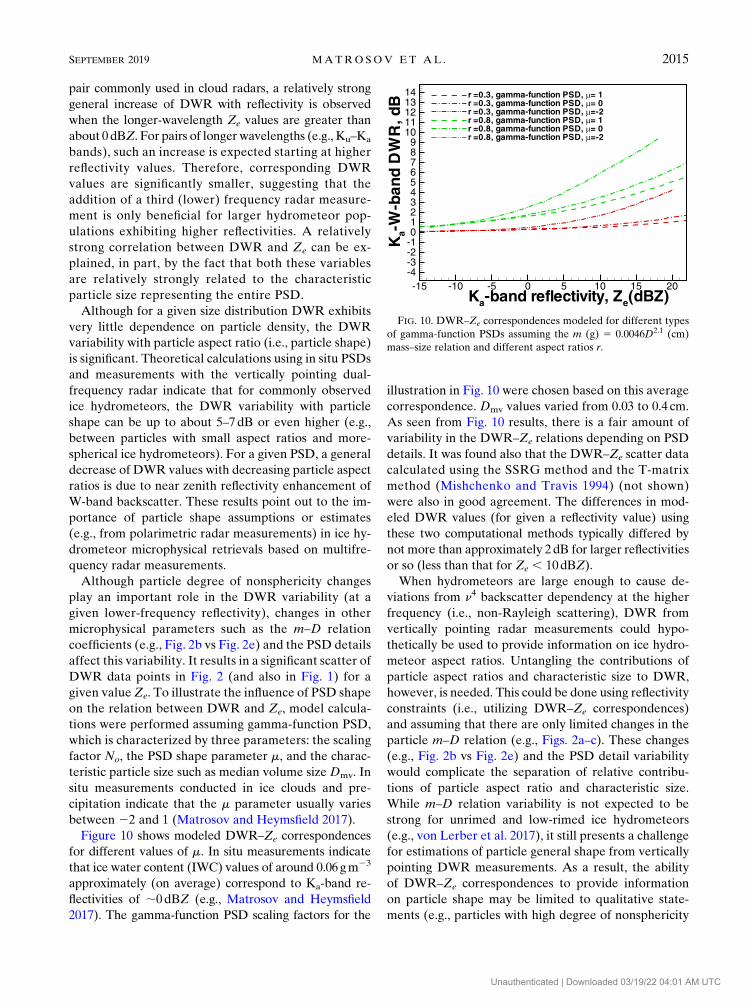
Figure 10 shows modeled DWR–Ze correspondences
for different values of m. In situ measurements indicate
that ice water content (IWC) values of around 0.06 gm23
approximately (on average) correspond to Ka-band re-
flectivities of ;0dBZ (e.g., Matrosov and Heymsfield
2017). The gamma-function PSD scaling factors for the
illustration in Fig. 10 were chosen based on this average
correspondence. Dmv values varied from 0.03 to 0.4 cm.
As seen from Fig. 10 results, there is a fair amount of
variability in the DWR–Ze relations depending on PSD
details. It was found also that the DWR–Ze scatter data
calculated using the SSRG method and the T-matrix
method (Mishchenko and Travis 1994) (not shown)
were also in good agreement. The differences in mod-
eled DWR values (for given a reflectivity value) using
these two computational methods typically differed by
not more than approximately 2dB for larger reflectivities
or so (less than that for Ze , 10dBZ).
When hydrometeors are large enough to cause de-
viations from n4 backscatter dependency at the higher
frequency (i.e., non-Rayleigh scattering), DWR from
vertically pointing radar measurements could hypo-
thetically be used to provide information on ice hydro-
meteor aspect ratios. Untangling the contributions of
particle aspect ratios and characteristic size to DWR,
however, is needed. This could be done using reflectivity
constraints (i.e., utilizing DWR–Ze correspondences)
and assuming that there are only limited changes in the
particle m–D relation (e.g., Figs. 2a–c). These changes
(e.g., Fig. 2b vs Fig. 2e) and the PSD detail variability
would complicate the separation of relative contribu-
tions of particle aspect ratio and characteristic size.
While m–D relation variability is not expected to be
strong for unrimed and low-rimed ice hydrometeors
(e.g., von Lerber et al. 2017), it still presents a challenge
for estimations of particle general shape from vertically
pointing DWR measurements. As a result, the ability
of DWR–Ze correspondences to provide information
on particle shape may be limited to qualitative state-
ments (e.g., particles with high degree of nonsphericity
FIG. 10. DWR–Ze correspondences modeled for different types
of gamma-function PSDs assuming the m (g) 5 0.0046D2.1 (cm)
mass–size relation and different aspect ratios r.
SEPTEMBER 2019 MATROSOV ET AL . 2015
Unauthenticated | Downloaded 03/19/22 04:01 AM UTC
vs more-spherical particles) unless the DWR infor-
mation is integrated into a more comprehensive tech-
nique involving additional radar variables allowing
estimates of additional influencing factors mentioned
above. Observational data shown in Fig. 6 suggest the
feasibility of such relatively crude particle shape esti-
mates, though the measurements considered here cor-
respond to unrimed and low-rimed hydrometeors, as
indicated by mean vertical Doppler velocity and LWP
observations. DWR values for a given Ka-band re-
flectivity forOctober 2016 cases in Fig. 1a are on average
smaller than those for the May 2017 cases (Fig. 1b). It
suggests the existence of particles with larger mean as-
pect ratios in the latter cases.
Another potentially useful dual-wavelength approach
for inferring general ice hydrometeor shape is to lever-
age the DWR dependencies on radar elevation angle.
SACR-2 measurements indicate that highly nonspheri-
cal ice particle populations that are large enough to
cause deviations from the n4 backscatter scaling (at least
at the higher-frequency band) exhibit strong elevation-
angle DWR dependence. The lowest DWR values for
such particles are observed near vertical beam pointing.
For more-spherical particles, observed DWR changes
with elevation angle are very small as expected from
their more symmetrical shapes. While differential at-
tenuation effects might introduce additional uncer-
tainties when scanning large volumes, at close ranges
their influence is not expected to be significant.
The collocation of high-frequency radar measure-
ments from space (i.e., W-band CloudSat radar) with
S-band ground-based operational weather radars offers
new opportunities for studying ice hydrometeor micro-
physics. Initial results from such collocations indicate
that for a given reflectivity level, S–W DWR values are
generally greater for more-nonspherical hydrometeors
(as identified by S-band differential reflectivity mea-
surements). This is consistent with the results obtained
using the dual-frequency SACR-2 measurements.
Acknowledgments. This work was supported by the
U.S. Department of Energy’s Atmospheric Systems
Research (ASR) program (DE-SC0013306) and NASA
Grant NNX16AQ36G.
REFERENCES
Callaghan, T. V., and Coauthors, 2011: Multiple effects of changes
in Arctic snow cover. Ambio, 40, 32–45, https://doi.org/
10.1007/s13280-011-0213-x.
Chase, R. J., and Coauthors, 2018: Evaluation of triple-frequency
radar retrieval of snowfall properties using coincident air-
borne in situ observations during OLYMPEX. Geophys. Res.
Lett., 45, 5752–5760, https://doi.org/10.1029/2018GL077997.
Erfani, E., and D. L. Mitchell, 2017: Growth of ice particle mass
and projected area during riming. Atmos. Chem. Phys., 17,
1241–1257, https://doi.org/10.5194/acp-17-1241-2017.
Garrett, T. J., C. Fallgatter, K. Shkurko, and D. Howlett, 2012:
Fall speed measurement and high-resolution multi-angle
photography of hydrometeors in free fall. Atmos. Meas.
Tech., 5, 2625–2633, https://doi.org/10.5194/amt-5-2625-
2012.
Heymsfield, A. J., and C. D. Westbrook, 2010: Advances in the
estimation of ice particle fall speeds using laboratory and field
measurements. J. Atmos. Sci., 67, 2469–2482, https://doi.org/
10.1175/2010JAS3379.1.
——, C. Schmitt, and A. Bansemer, 2013: Ice cloud particle size
distributions and pressure-dependent terminal velocities
from in situ observations at temperatures from 08 to 2868C.J. Atmos. Sci., 70, 4123–4154, https://doi.org/10.1175/JAS-D-
12-0124.1.
Hogan, R. J., and C. D. Westbrook, 2014: Equation for the mi-
crowave backscatter cross section of aggregate snowflakes using
the self-similar Rayleigh–Gans approximation. J. Atmos. Sci.,
71, 3292–3301, https://doi.org/10.1175/JAS-D-13-0347.1.
——, L. Tian, P. R. A. Brown, C. D. Westbrook, A. J. Heymsfield,
and J.D. Eastment, 2012: Radar scattering from ice aggregates
using the horizontally aligned oblate spheroid approximation.
J Appl. Meteor. Climatol., 51, 655–671, https://doi.org/10.1175/
JAMC-D-11-074.1.
Huang, G., V. N. Bringi, A. Newman, G. Lee, D. Moisseev,
and B. M. Notaros, 2019: Dual-wavelength radar technique
development for snow rate estimation: A case study from
GCPEx.Atmos. Meas. Tech., 12, 1409–1427, https://doi.org/
10.5194/amt-12-1409-2019.
Kneifel, S., A. von Lerber, J. Tiira, D. Moisseev, P. Kollias, and
J. Leinonen, 2015: Observed relations between snowfall mi-
crophysics and triple-frequency radar measurements.
J. Geophys. Res. Atmos., 120, 6034–6055, https://doi.org/
10.1002/2015JD023156.
Kollias, P., N. Bharadwaj, K. Widener, I. Jo, and K. Johnson, 2014:
Scanning ARM cloud radars: Operational sampling strate-
gies. J. Atmos. Oceanic Technol., 31, 569–582, https://doi.org/
10.1175/JTECH-D-13-00044.1.
Korolev, A. V., and G. A. Isaac, 1999: Ice particle habits in Arctic
clouds. Geophys. Res. Lett., 26, 1299–1302, https://doi.org/
10.1029/1999GL900232.
Leinonen, J., and Coauthors, 2018: Retrieval of snowflake micro-
physical properties from multifrequency radar observations.
Atmos. Meas. Tech., 11, 5471–5488, https://doi.org/10.5194/
amt-11-5471-2018.
Liao, L., R. Meneghini, T. Iguchi, and A. Detwiler, 2005: Use
of dual-wavelength radar for snow parameter estimates.
J. Atmos. Oceanic Technol., 22, 1494–1506, https://doi.org/
10.1175/JTECH1808.1.
——,——, L. Tian, and G. M. Heymsfield, 2008: Retrieval of snow
and rain from combined X- and W-band airborne radar
measurements. IEEE Trans. Geosci. Remote Sens., 46, 1514–
1524, https://doi.org/10.1109/TGRS.2008.916079.
Lu, Y., Z. Jiang, K. Aydin, J. Verlinde, E. Clothiaux, and G. Botta,
2016: A polarimetric scattering database for non-spherical ice
particles at microwave wavelengths. Atmos. Meas. Tech., 9,
5119–5134, https://doi.org/10.5194/amt-9-5119-2016.
Maahn, M., 2019: MASC snow particle images. ARM Mobile Fa-
cility (OLI) Oliktok Point, Alaska; AMF3 (M1). ARM Data
Center, accessed 21 February 2019, https://doi.org/10.5439/
1497701.
2016 JOURNAL OF APPL IED METEOROLOGY AND CL IMATOLOGY VOLUME 58
Unauthenticated | Downloaded 03/19/22 04:01 AM UTC
——, and U. Löhnert, 2017: Potential of higher-order moments
and slopes of the radar Doppler spectrum for retrieving
microphysical and kinematic properties of Arctic ice clouds.
J. Appl. Meteor. Climatol., 56, 263–282, https://doi.org/
10.1175/JAMC-D-16-0020.1.
——, ——, P. Kolias, R. C. Jackson, and G. M. McFarquhar, 2015:
Developing and evaluating ice cloud parameterizations for
forward modeling of radar moments using in situ aircraft ob-
servations. J. Atmos. Oceanic Technol., 32, 880–903, https://
doi.org/10.1175/JTECH-D-14-00112.1.
Marchand, R., G. G. Mace, A. G. Hallar, I. B. McCubbin, S. Y.
Matrosov, and M. D. Shupe, 2013: Enhanced radar backscat-
tering due to oriented ice particles at 95GHz during StormVEx.
J. Atmos. Oceanic Technol., 30, 2336–2351, https://doi.org/
10.1175/JTECH-D-13-00005.1.
Mason, S. L., C. J. Chiu, R. J. Hogan, D. Moisseev, and S. Kneifel,
2018: Retrievals of riming and snow density from vertically
pointingDoppler radars. J. Geophys. Res. Atmos., 123, 13 807–
13 834, https://doi.org/10.1029/2018JD028603
Matrosov, S. Y., 1991: Theoretical study of radar polarization
parameters obtained from cirrus clouds. J. Atmos. Sci., 48,
1062–1070, https://doi.org/10.1175/1520-0469(1991)048,1062:
TSORPP.2.0.CO;2.
——, 1993: Possibilities of cirrus particle sizing from dual-frequency
radarmeasurements. J.Geophys.Res., 98, 20 675–20 683, https://
doi.org/10.1029/93JD02335.
——, 1998: A dual-wavelength radar method to measure snowfall
rate. J. Appl. Meteor., 37, 1510–1521, https://doi.org/10.1175/
1520-0450(1998)037,1510:ADWRMT.2.0.CO;2.
——, 2019: Comparative evaluation of snowfall retrievals from
the CloudSat W-band radar using ground-based weather ra-
dars. J. Atmos. Oceanic Technol., 36, 101–111, https://doi.org/
10.1175/JTECH-D-18-0069.1.
——, and Battaglia, 2009: Influence of multiple scattering on
CloudSatmeasurements in snow: A model study.Geophys.
Res. Lett., 36, L12806, https://doi.org/10.1029/2009GL038704.
——, and A. J. Heymsfield, 2017: Empirical relations between size
parameters of ice hydrometeor populations and radar re-
flectivity. J Appl. Meteor. Climatol., 56, 2479–2488, https://
doi.org/10.1175/JAMC-D-17-0076.1.
——, and D. D. Turner, 2018: Retrieving mean temperature of
atmospheric liquid water layers using microwave radiometer
measurements. J. Atmos. Oceanic Technol., 35, 1091–1102,
https://doi.org/10.1175/JTECH-D-17-0179.1.
——, A. J. Heymsfield, and Z. Wang, 2005: Dual-frequency radar
ratio of nonspherical atmospheric hydrometeors. Geophys.
Res. Lett., 32, L13816, https://doi.org/10.1029/2005GL023210.
——, G. G. Mace, R. Marchand, M. D. Shupe, A. G. Hallar, and
I. B. McCubbin, 2012: Observations of ice crystal habits
with a scanning polarimetric W-band radar at slant linear
depolarization ratio mode. J. Atmos. Oceanic Technol., 29,
989–1008, https://doi.org/10.1175/JTECH-D-11-00131.1.
——, C. G. Schmitt, M. Maahn, and G. de Boer, 2017: Atmo-
spheric ice particle shape estimates from polarimetric radar
measurements and in situ observations. J. Atmos. Oceanic
Technol., 34, 2569–2587, https://doi.org/10.1175/JTECH-D-
17-0111.1.
Matthews, A., B. Isom, D. Nelson, I. Lindenmaier, J. Hardin,
K. Johnson and N. Bharadwaj, 2016a: Ka-Band Scanning
ARM Cloud Radar (KASACRVPTHRC), ARM Mobile
Facility (OLI) Oliktok Point, Alaska; AMF3 (M1). ARM
Data Center, accessed 21 October 2018, https://doi.org/
10.5439/1224840.
——, ——, ——, ——, ——, ——, and ——, 2016b: W-band
Scanning ARM Cloud Radar (WSACRVPTHRC). ARM
Mobile Facility (OLI) Oliktok Point, Alaska; AMF3 (M1).
ARMData Center, accessed 21 October 2018, https://doi.org/
10.5439/1224850.
McFarquhar, G. M., and Coauthors, 2011: Indirect and Semi-
Direct Aerosol Campaign: The impact of Arctic aerosols on
clouds. Bull. Amer. Meteor. Soc., 92, 183–201, https://doi.org/
10.1175/2010BAMS2935.1.
Melnikov, V., 2017: Parameters of cloud ice particles retrieved
from radar data. J. Atmos. Oceanic Technol., 34, 717–728,
https://doi.org/10.1175/JTECH-D-16-0123.1.
Mishchenko, M. I., and L. D. Travis, 1994: T-matrix computa-
tions of light scattering by larger spheroidal particles. Opt.
Commun., 109, 16–21, https://doi.org/10.1016/0030-4018(94)
90731-5.
Mosimann, L., 1995: An improved method for determining the
degree of snow crystal riming by vertical Doppler radar. At-
mos. Res., 37, 305–323, https://doi.org/10.1016/0169-8095(94)
00050-N.
Reinking, R. F., S. Y. Matrosov, R. A. Kropfli, and B. W. Bartram,
2002: Evaluation of a 458 slant quasi-linear radar polarizationstate for distinguishing drizzle droplets, pristine ice crystals,
and less regular ice particles. J. Atmos. Oceanic Technol., 19,
296–321, https://doi.org/10.1175/1520-0426-19.3.296.
Schrom, R. S., and M. R. Kumjian, 2018: Bulk-density represen-
tations of branched planar ice crystals: Errors in the polari-
metric radar variables. J Appl. Meteor. Climatol., 57, 333–346,
https://doi.org/10.1175/JAMC-D-17-0114.1.
Sturm, M., J. Holmgren, and D. K. Perovich, 2002: Winter snow
cover on the sea ice of the Arctic Ocean at the Surface Heat
Budget of the Arctic Ocean (SHEBA): Temporal evolution
and spatial variability. J. Geophys. Res., 107, 8047, https://
doi.org/10.1029/2000JC000400.
Vogel, J. M., and F. Fabry, 2018: Contrasting polarimetric obser-
vations of stratiform riming and nonriming events. J Appl.
Meteor. Climatol., 57, 457–476, https://doi.org/10.1175/JAMC-
D-16-0370.1.
von Lerber, A., D. Moisseev, L. F. Bliven, W. Petersen, A. Harri,
and V. Chandrasekar, 2017: Microphysical properties of snow
and their link to Ze–S relations during BAECC 2014.
J. Appl. Meteor. Climatol., 56, 1561–1582, https://doi.org/
10.1175/JAMC-D-16-0379.1.
Wipf, S., and C. Rixen, 2010: A review of snow manipulation ex-
periments in Arctic and alpine tundra ecosystems. Polar Res.,
29, 95–109, https://doi.org/10.1111/j.1751-8369.2010.00153.x.
SEPTEMBER 2019 MATROSOV ET AL . 2017
Unauthenticated | Downloaded 03/19/22 04:01 AM UTC