Embed Size (px)
Citation preview
Observation and Response Chart Usability Testing Phase i
Observation and Response Chart (ORC) Project
Usability Testing Phase Report
Observation and Response Chart Usability Testing Phase i
Preface
This report was prepared for the Australian Commission on Safety and Quality in Health Care’s program for Recognising and Responding to Clinical Deterioration
Suggested Citation
Elliott D, McKinley S, Perry L, Duffield C, Iedema R, Gallagher R, Fry M, Roche M, Allen E. 2011. Observation and Response Charts Usability Testing Report. University of Technology, Sydney
ISBN: 978-0-9806239-4-9 Online
978-0-9806239-5-6 Paperback Publication Date: 11/2011
Acknowledgements
Many thanks to Dr Nicola Dunbar, Program Lead for the Deteriorating Patient at the Australian Commission on Safety and Quality in Health Care, and other Commission staff who supported this work. Thanks also to our Clinical Reference Committee, and the Human Factors team, School of Psychology, University of Queensland.
We also sincerely thank the Hospital Executive of Prince of Wales Hospital / South East Sydney Local Health District for supporting the project through our secondment agreement for Miss Allen.
We acknowledge the important contributions from site executives, project officers and other staff from each of our clinical sites: Ballarat Health Services, Victoria (Ms Angie Spencer, Ms Rebecca Anderson); Calvary Wakefield and Calvary North Hospitals, South Australia (Ms Jane Cleveland, Ms Philipa Hilliard); Coffs Harbour Hospital, New South Wales (Dr Theresa Beswick, Ms Tracey Moore, Mr Marcus Hayward); Eastern Health, Victoria (Dr David Charlesworth, Ms Sam Brean); Lyell McEwin Hospital, South Australia (Ms Natalie Hewitt, Ms Ellie Prior); North Shore Private Hospital, New South Wales (Ms Sue Engle, Ms Dena-Louise Hogben); Northern Area Health Service, Tasmania (Ms Sophie Legge); Southern Health, Victoria (Ms Monica Finnigan, Mr Theo Does); St Vincent’s Hospital, Melbourne, Victroria (Ms Anne Maddock, Ms Caroline Scott); St Vincent’s Hospital, Toowoomba, Queensland (Ms Susan Cantwell, Ms Sam Ward).
Observation and Response Chart Usability Testing Phase ii
Table of Contents
Preface i
Acknowledgements i
Table of Contents ii
List of Tables v
List of Figures v
Definitions vi
Executive Summary vii
1. Introduction 1
2. Background 3
Research team 4
Collaboration with ACSQHC 5
Clinical Reference Committee 5
3. Methods 6
Study Aims 6
Design 6
Sample 6
Site Selection 6
Expressions of Interest for Clinical Sites 7
Site-based Project Officer Secondment 7
Selection of ORC version and sample wards 8
Observation and response charts 9
Modification of ORCs for trial sites 9
Clinical site preparation 9
Project officer training workshop 9
Clinical staff preparation 10
Data collection approaches 10
Field notes 11
User survey 11
Handover debrief 12
Audits 12
Data management and analyses 12
Ethical considerations 13
4. Results 14
Demographics 14
Field notes 14
User survey 14
Handover debrief 15
Audits 15
Study findings 16
Objective 1: Suitability of ORCs for observations of adult medical-surgical patients, and as a
prompt for responding to clinical deterioration 18
1.1 Suitability for observations of adult medical-surgical patients 18
1.1.2 Inside ORC 19
1.1.3 Outside ORC 27
Observation and Response Chart Usability Testing Phase iii
1.2 Suitability of ORC as a prompt for responding to episodes of clinical deterioration 30
1.2.2 Inside ORC 30
1.2.3 Outside ORC 31
Summary – suitability for documenting and as a prompt in clinical deterioration 33
Objective 2: Identification of any sections for modification 35
2.1 General layout 35
2.2 Inside ORC 36
2.3 Outside ORC 37
Summary – potential chart modifications 40
Objective 3: Application to practice with minimal training 42
3.1 General 42
3.2 Inside ORC 44
3.3 Outside ORC 44
Summary – training needs 45
5. Discussion 46
Major Findings 46
Modifications to ORC templates 47
Study limitations 48
Implications for Practice 48
Information and training issues pre-implementation 49
Recommendations to the Commission 50
Recommendations for Further Research 51
6. Conclusions 52
References 53
Appendices 54
Appendix A: ORC versions 54
Figure A1: ORC ‘R1’ 1 response level 55
Figure A2: ORC ‘R2’ 2 response levels 56
Figure A3: ORC ‘R4’ 4 response levels 57
Figure A4: ADDS - without blood pressure table 58
Figure A5: ADDS+ with blood pressure table 59
Figure A6: Information Side (front and back) 60
Appendix B: ORC modifications for clinical sites 61
Table B1: ADDS + 61
Table B2: ADDS – 64
Table B3: ORC - R4 67
Table B3: ORC - R2 73
Table B4: ORC – R1 82
Appendix C: Modifications of parameters for trial sites 84
Figure C1: Respiratory rate modifications made by site from ORC template 85
Figure C2: O2 saturation modifications made by site from ORC template 86
Figure C3: O2 flow rate modifications made by site from ORC template 86
Figure C4: Blood pressure modifications made by site from ORC template 87
Figure C5: Heart rate modifications made by site from ORC template 88
Figure C6: Temperature modifications made by site from ORC template 89
Figure C7: Consciousness modifications made by site from ORC template 90
Figure C8: Urine output modifications made by site from ORC template 90
Appendix D: Observation and Field Note Guidelines 91
Appendix E: Participant user survey 94
Appendix F: Handover Debrief Guidelines 96
Appendix G: Audit Guidelines 98
Observation and Response Chart Usability Testing Phase iv
Appendix H: Participant Information Sheet 101
Appendix I: Participant Consent Form 103
Appendix J: Field note comment frequencies 104
Appendix K: Handover debrief comment frequencies 105
Appendix L: Site specific data: User survey 106
Demographics by site 106
Education / training questions by site 107
Ease of use questions by site 109
Usability questions by site 111
Appendix M: Site specific data: Audits 113
Completion of observations by site according to chart instructions 113
Use of intervention, clinical review and additional observations sections by site 114
Appendix N: Comparison of variables on existing hospital charts and ORCs 115
Appendix O: Discussion and outcomes for potential modifications to ORC templates based on
usability testing findings 116
Observation and Response Chart Usability Testing Phase v
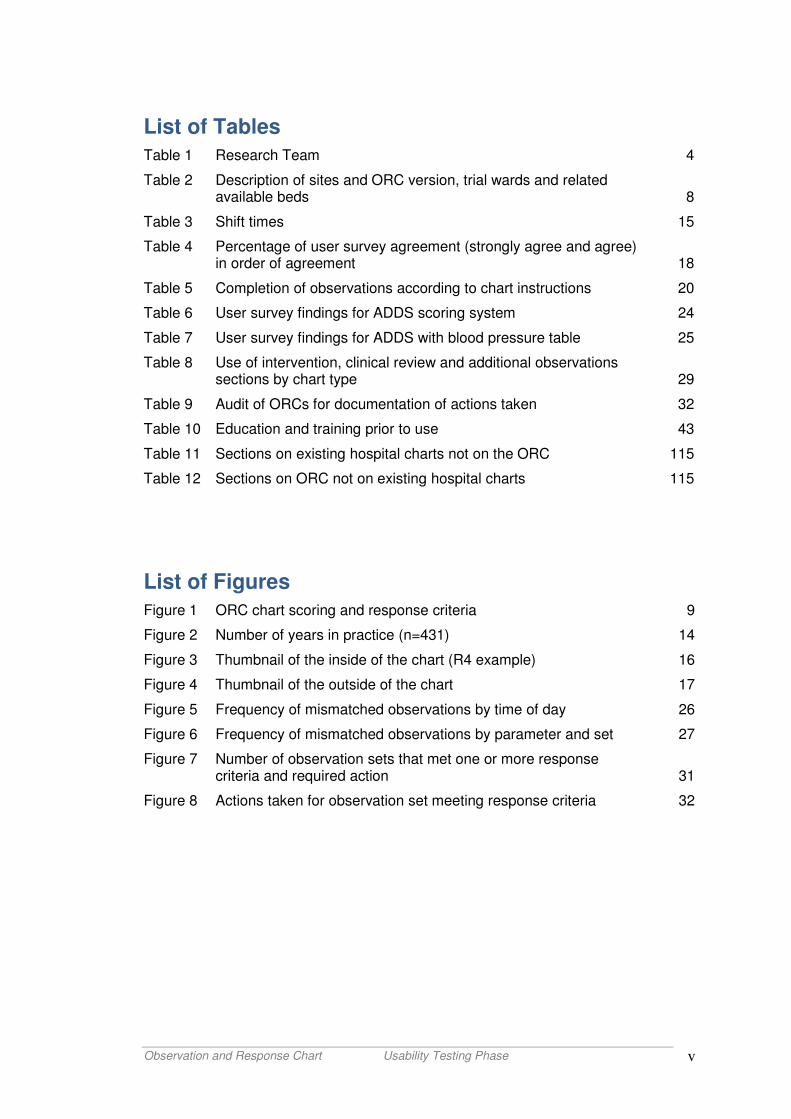
List of Tables
Table 1 Research Team 4
Table 2 Description of sites and ORC version, trial wards and related available beds 8
Table 3 Shift times 15
Table 4 Percentage of user survey agreement (strongly agree and agree) in order of agreement 18
Table 5 Completion of observations according to chart instructions 20
Table 6 User survey findings for ADDS scoring system 24
Table 7 User survey findings for ADDS with blood pressure table 25
Table 8 Use of intervention, clinical review and additional observations sections by chart type 29
Table 9 Audit of ORCs for documentation of actions taken 32
Table 10 Education and training prior to use 43
Table 11 Sections on existing hospital charts not on the ORC 115
Table 12 Sections on ORC not on existing hospital charts 115
List of Figures
Figure 1 ORC chart scoring and response criteria 9
Figure 2 Number of years in practice (n=431) 14
Figure 3 Thumbnail of the inside of the chart (R4 example) 16
Figure 4 Thumbnail of the outside of the chart 17
Figure 5 Frequency of mismatched observations by time of day 26
Figure 6 Frequency of mismatched observations by parameter and set 27
Figure 7 Number of observation sets that met one or more response criteria and required action 31
Figure 8 Actions taken for observation set meeting response criteria 32
Observation and Response Chart Usability Testing Phase vi
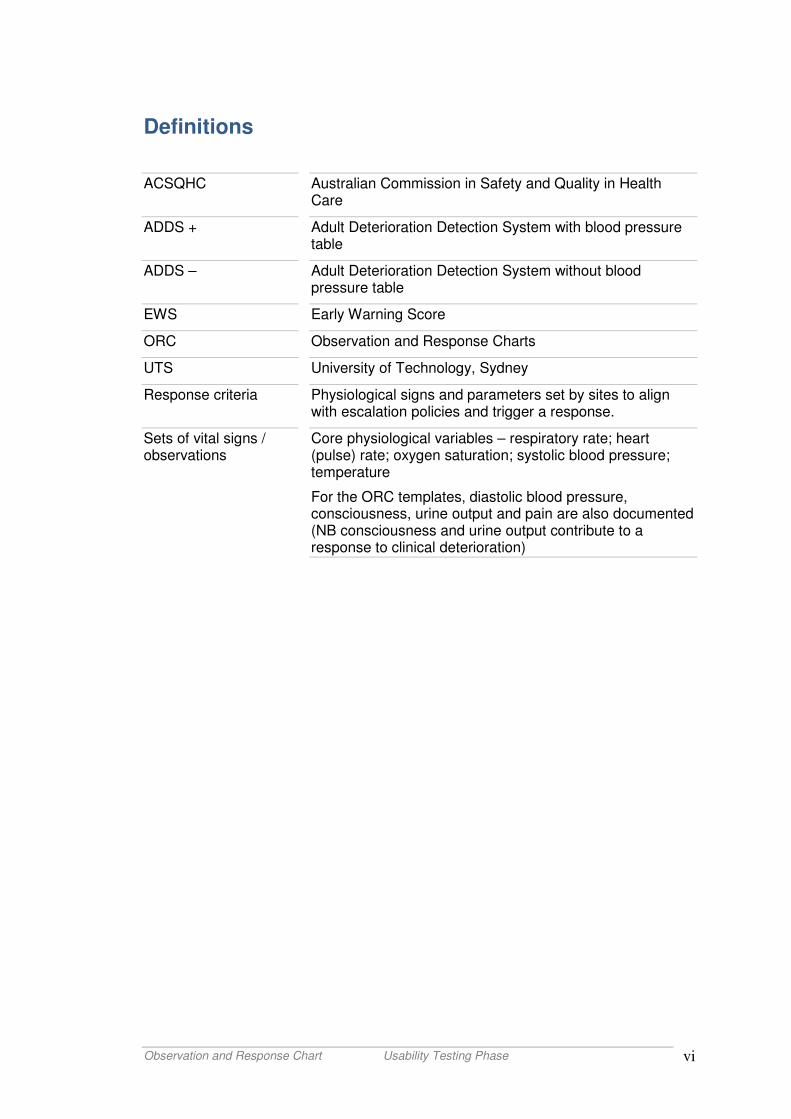
Definitions
ACSQHC Australian Commission in Safety and Quality in Health Care
ADDS + Adult Deterioration Detection System with blood pressure table
ADDS – Adult Deterioration Detection System without blood pressure table
EWS Early Warning Score
ORC Observation and Response Charts
UTS University of Technology, Sydney
Response criteria Physiological signs and parameters set by sites to align with escalation policies and trigger a response.
Sets of vital signs / observations
Core physiological variables – respiratory rate; heart (pulse) rate; oxygen saturation; systolic blood pressure; temperature
For the ORC templates, diastolic blood pressure, consciousness, urine output and pain are also documented (NB consciousness and urine output contribute to a response to clinical deterioration)
Observation and Response Chart Usability Testing Phase vii
Executive Summary
The Australian Commission on Safety and Quality in Health Care implemented a program of work on Recognising and Responding to Clinical Deterioration, which focuses on ensuring that hospital patients whose clinical condition deteriorates receive appropriate and timely care and treatment. The Observation and Response Chart (ORC) project forms an element of this program. The project objectives were to examine whether the ORCs: 1) were suitable for observations of adult medical-surgical patients, and prompt a response for episodes of clinical deterioration; 2) had any sections that require modifications; and 3) could be introduced and applied in practice with minimal training.
Study description
Ten clinical sites were selected from over 50 expressions of interest across all State jurisdictions. Site-based Project Officers were seconded for the project, and supported by a training workshop, Project Manager site visits, teleconferences, telephone and e-mail assistance. Sites selected one of the five versions of the ORC which best matched their existing rapid response system for managing deteriorating patients. Parameter values for the ORC templates were adjusted to match each site’s requirements. The project received ethics approval as a low / negligible-risk study at each site. ORCs were introduced into 2-3 wards at each site for a 24-hour period, and data were collected from a user survey, an audit of the ORC compared to the site’s existing observation chart, field observation notes from the project officer, and staff debrief sessions.
The ORCs were trialled in a total of 36 adult acute medical / surgical wards across 108 shifts, involving 623 mainly nurse participants. Chart reviews were conducted for 818 patients, user surveys were completed by 477 respondents, shift debrief sessions were recorded, and observations of documentation practices were documented in field notes by the site-based project officers.
Study findings
Overall findings indicated that 1) the majority of participants found the ORCs to be usable as observation charts for adult medical-surgical patients in clinical practice, and suitable as a prompt for observed clinical deterioration; 2) some sections of the ORCs were identified for possible modifications; and 3) the ORCs can be implemented into practice with some specific information and training.
The structure and layout of the A3-sized form with a left binding margin and an off-centre fold opening out to the right, generated some concerns for users, as did the use of bold lines in the charting area. There was strong acceptance for language, style and size of text, with participants agreeing that the charts enabled effective handover and aided in the management of a deteriorating patient. The colours for response codes were generally well supported. Two-thirds of respondents noted a preference for using the ORC compared to their
Observation and Response Chart Usability Testing Phase viii
current observation chart. Participants were generally positive of the ADDS chart versions, although only one site each used these versions, so findings were viewed cautiously.
Compliance with charting according to instructions was mixed. Existing practices of writing numerical values, and concerns about the precision of documenting a range, may require a broad and systemic cultural change, and are noted in recommendations to the Commission below. Some aspects in relation to implementation of the ORCs during the pilot phase will be managed through information and training resources (also noted below).
Remaining ORC sections received mostly positive feedback. Other charts were documented as not in use for the majority of cases. Fluid balance and neurological / neurovascular charts comprised one-half and one-quarter of the other charts in use, respectively. Systolic blood pressure, oxygen saturation, oxygen flow rate and heart rate were the most common parameters modified in the ‘modifications in use’ section. The intervention section was used in one-quarter of the cases. Additional observation sections were used commonly for glucose level, bowel activity and weight.
The ORCs were viewed positively, with high agreement for patient identification, managing deterioration, and enabling effective handover; the ADDS+ version had the highest approval. Documentation of actions were noted on the ORCs in only half of the cases. Fortunately for patients, there were no arrests, and only two abnormal observation sets required a ‘MET’ call during this data collection period.
Most respondents used an observation and response chart in practice for the first time during the study. Both formal and informal education was provided for participants, and overall the training provided was helpful and useful for almost all of the respondents. With respondents identifying education as helpful prior to using the ORC, there is clear a requirement for education and training prior to implementation.
Chart modifications
Following analyses and discussion with the chart developers, the following modifications were developed:
1. An optimal maximum of 56 rows are available to document the 9 variables on the ORC template (the minimum row height of 3.60 mm in the chart area enables a dot or arrow to be used without contributing to cognitive overload)
2. ‘Modifications in use’ tick box removed 3. Section heading revised to ‘Other Observation Charts In Use’ 4. ‘Modifications’ to observation values section enables up to 4 modifications
to be documented and signed for by the treating doctor 5. Section heading revised to ‘Interventions Associated With Abnormal Vital
Signs’ 6. Lower case letters (e.g. ‘a’) replace upper case letter for coding
interventions 7. Additional rows added for ‘interventions’
Observation and Response Chart Usability Testing Phase ix
8. ‘Clinical review’ section removed 9. ‘Clinical review requests’ section enables 3 requests to be documented
Information and training issues
Based on the study findings and the subsequent meeting reviewing the human factors aspects of the ORC templates, the following information and training issues were identified:
1. The use of bold vertical lines in the charting area minimises the risk of ‘column-shift’ error during documentation. These bold lines do not relate to the frequency of observations required for an individual patient; patients should have observations based on individual clinical decisions or organisational practice guidelines.
2. Focus on ‘patterns’ of observations, using the graphical representation of the dots, arrows and connecting lines in the charting area. Using these symbols and tracking patterns of deterioration is more effective than a series of numbers. Caution against writing in numerical values, as these numbers clutter the chart, lead to a risk of ‘cognitive overload’ for the observer, and detract from identifying signs of clinical deterioration.
3. Use of the ‘Modifications’ section enables observations within the ‘track and trigger’ approach to be tailored to the individual clinical context for each patient, and will minimise any false or inappropriate responses or interventions
4. The optimal maximum number of variables to be documented in the charting area is 9, as this minimises the risk of ‘cognitive overload’. Sites can modify the Commission templates to change the precision of the value ranges for each observation variable
5. The type of oxygen (02) delivery device can be documented in the ‘interventions’ section (e.g. Hudson Mask, hi-flow nasal cannula), rather than contributing to cognitive overload by attempting to squeeze information into an observational square in the charting area
6. Highlight the human factors basis for chart structure – an A3-sized form with a left binding margin, and an off-centre fold from the right. When folded, the cover page highlights to the user any ‘other observation charts in use’ and ‘modifications’ to parameter values for this patient. When folded out to the right, the inside left page contains the ‘charting area’ for documentation of observations. The inside right page provides information for the user including the response criteria and actions required; this page is not for writing). The final page contains ‘Interventions Associated with Abnormal Vital Signs’, ‘Clinical Review Requests’, and ‘Additional Observations’ sections. Importance, not frequency guides location of each section in the chart
7. Completion of the ‘Other Observation Charts in Use’ section enables a clinician to identify all relevant charts required to provide appropriate observation and care to an individual patient
8. Information is required for medical staff, to complete the ‘modifications’ section (see point 3 above)
Observation and Response Chart Usability Testing Phase x
9. Highlight the process and link of the ‘Intervention’ code to the related time at the bottom of the charting section
10. Highlight that Urine Output forms a scoring component of the ADDS system, and is also considered an important indicator within the suite of existing variables in flagging potential clinical deterioration. The variable also provides a useful prompt for busy clinicians to check on their patient’s urinary elimination. The range of values for output can be modified for individual sites, and specific documentation including abbreviations may be used in accordance with local documentation policies. This does not replace the need for accurate documentation of fluid intake, output and balance for specific clinical circumstances, using a Fluid Balance Chart
11. Specific Blood Glucose Level charts are to be used if a patient requires frequent monitoring and / or insulin management
12. Other variables have not been added to the ‘Additional Observations’ section to minimise the risk of cognitive overload. Other specific charts are to be used for specialised observations, as clinically indicated, with these noted in ‘Other Observation Charts In Use’ section of the ORC
For the pilot testing phase, a range of information resources will be developed to address the above issues, and support the site-based project officers during the preparation and implementation of the ORCs into their settings. The resources will include a project plan, posters, materials for use during ins-service sessions, and an FAQ sheet.
Recommendations to the Commission
The following recommendations are suggested for the Commission to consider:
1. Examine the optimal precision for parameter values, in relation to the minimal important clinical difference (MID), where treatment will change.
2. Discuss (perhaps via the Deteriorating Patient Advisory Committee) a. Recommending standard values for response system triggers b. Development of additional standard charts that complement the
ORC and lead to a harmonised suite of national observation charts c. The appropriateness of using term ‘heart rate’ in charts, when the
actual observational parameter is most commonly measurement of ‘pulse rate’.
Conclusions
Overall, clinical usability of the ORC versions was confirmed. A number of modifications to the chart templates, based on the study findings, were implemented. Information and training issues were also identified, to improve the usability and compliance with documentation, to improve the detection and response for patients with clinical deterioration.
Observation and Response Chart Usability Testing Phase 1
1. Introduction
This project is part of a larger program of work being conducted by the Australian Commission on Safety and Quality in Health Care (ACSQHC; the ‘Commission’) on ‘Recognising and Responding to Clinical Deterioration’ (ACSQHC, 2010). This work focuses on ensuring that hospital patients whose clinical condition deteriorates receive appropriate and timely care and treatment. This importance of this work is highlighted in the recently released ‘National consensus statement: essential elements for recognising and responding to clinical deterioration’ and other documents including a Background Paper and the Commission’s Project Plan (ACSQHC, 2009). The Commission's role is to:
• Promote, support and encourage the implementation of initiatives relating to health care safety and quality
• Collect, analyse, interpret and disseminate information relating to health care safety and quality
• Publish reports and papers relating to health care safety and quality
• Formulate, promote and support the implementation of standards, guidelines and indicators relating to health care safety and quality, and monitor their implementation and impact
• Advise on national clinical standards
• Formulate model national schemes that provide for the accreditation of organisations that provide health care services and relate to health care safety and quality
• Consult and co-operate with persons, organisations and governments on health care safety and quality
• Promote, support, encourage, conduct and evaluate training programs and research for purposes in connection with the performance of any of the Commission’s functions http://www.safetyandquality.gov.au/
One of the Commission's main initiatives in the program is to support the development of an evidence-based adult general observation chart that incorporates features to support the identification of patients who are deteriorating and prompt appropriate, timely action. The forms were designed:
• As a system for recording patient observations and specifying actions to be taken in response to patient clinical deterioration
• To support the accurate and timely recognition of clinical deterioration, and prompt action when deterioration is observed
• According to human factors principles
• To record physiological parameters (Element 1.6 of the National Consensus Statement; Respiratory Rate, Oxygen saturation, Heart Rate, Blood Pressure, Temperature, Consciousness Level
• To display thresholds for each physiological parameter or combination of parameters that indicate abnormality
• To specify the physiological parameters and other factors that trigger an escalation of care
Observation and Response Chart Usability Testing Phase 2
• To include actions required when care is escalated.
ACSQHC Evidence-based adult general observation chart. http://www.safetyandquality.gov.au/internet/safety/publishing.nsf/Content/RaRtCD_EBA-GOC
This report generates new information about the design of the ORCs that will inform the further refinement and development of the templates for the Commission, and contribute to the design and effective use of charts in a range of adult acute care settings.
Observation and Response Chart Usability Testing Phase 3
2. Background
Following a competitive research tender process, the ACSQHC appointed a team from the University of Technology, Sydney (UTS) to conduct a national research project to test and further develop an ‘Evidence-based adult general Observation and Response Chart (ORC)’.
The ‘Adult Deterioration Detection System’ (ADDS) charts were designed by the School of Psychology at the University of Queensland, using human factors research and heuristic analysis, with important features that assist the identification of the deteriorating patient to trigger appropriate and timely action. The two ADDS charts below were tested in a simulated environment.
In addition, three other ‘ORC’ charts were developed to account for different ‘track and trigger’ systems across the full range of health services. These charts were not tested in a simulated environment, prior to this clinical usability testing.
The five ‘versions’ of the ORC charts available for usability testing in the clinical environment were the:
1. Adult Deterioration Detection System (ADDS) with blood pressure table 2. Adult Deteriorating Detection System (ADDS) without blood pressure table 3. Single parameter system with four response categories (R4) 4. Single parameter system with two response categories (R2) 5. Single parameter system with one response category (R1)
The two ADDS versions of the chart reflect a multi-parameter track and trigger system. Other versions use a single-parameter system (Preece et al. 2010). Further information about the background to these charts, draft versions and other relevant reports including the consensus statement and implementation and action guide are available at:
http://www.safetyandquality.gov.au/internet/safety/publishing.nsf/Content/RaRtCD_EBA-GOC
http://www.safetyandquality.gov.au/internet/safety/publishing.nsf/Content/prog-patientsrisk-lp
Note that each version of the ORC is structured as an A3-sized form with a layout of a left binding margin with an off-centre fold from the right. When opened, the inside left page is the charting or documenting page, while the inside right page is for information, and is designed to be not written on. Both outside pages are for documentation.
Observation and Response Chart Usability Testing Phase 4
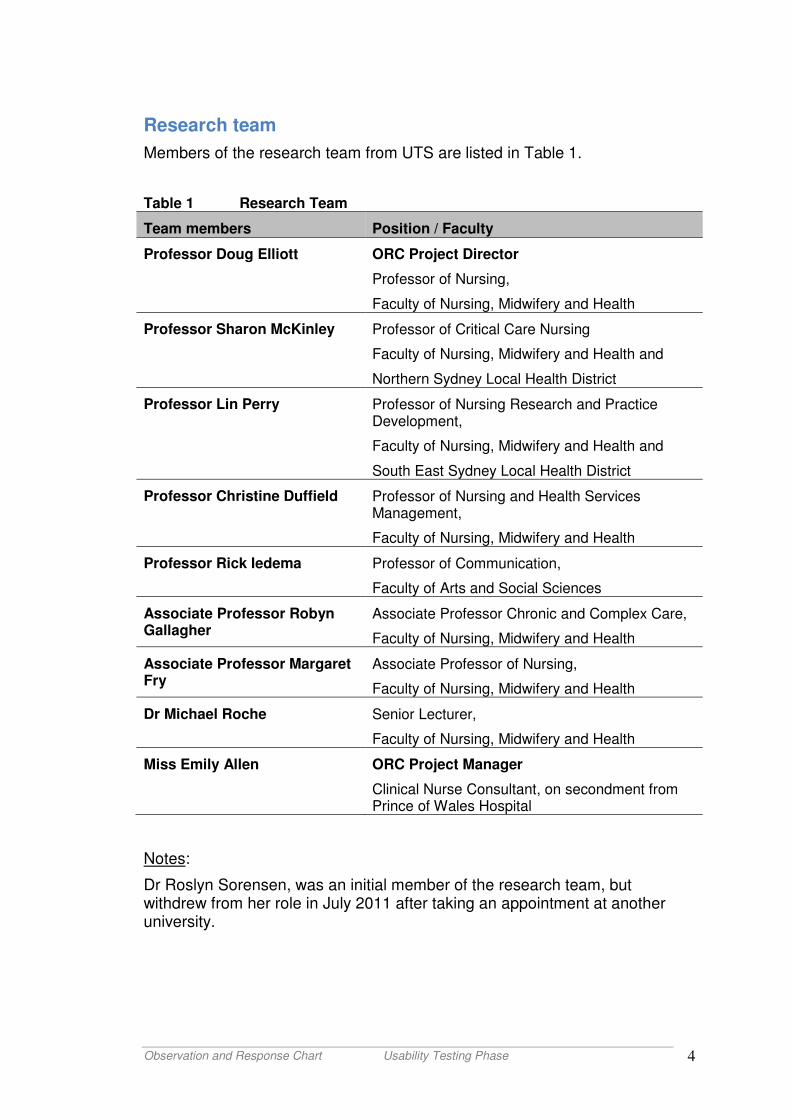
Research team
Members of the research team from UTS are listed in Table 1.
Table 1 Research Team
Team members Position / Faculty
Professor Doug Elliott
ORC Project Director
Professor of Nursing,
Faculty of Nursing, Midwifery and Health
Professor Sharon McKinley
Professor of Critical Care Nursing
Faculty of Nursing, Midwifery and Health and
Northern Sydney Local Health District
Professor Lin Perry
Professor of Nursing Research and Practice Development,
Faculty of Nursing, Midwifery and Health and
South East Sydney Local Health District
Professor Christine Duffield
Professor of Nursing and Health Services Management,
Faculty of Nursing, Midwifery and Health
Professor Rick Iedema
Professor of Communication,
Faculty of Arts and Social Sciences
Associate Professor Robyn Gallagher
Associate Professor Chronic and Complex Care,
Faculty of Nursing, Midwifery and Health
Associate Professor Margaret Fry
Associate Professor of Nursing,
Faculty of Nursing, Midwifery and Health
Dr Michael Roche
Senior Lecturer,
Faculty of Nursing, Midwifery and Health
Miss Emily Allen ORC Project Manager
Clinical Nurse Consultant, on secondment from Prince of Wales Hospital
Notes:
Dr Roslyn Sorensen, was an initial member of the research team, but withdrew from her role in July 2011 after taking an appointment at another university.
Observation and Response Chart Usability Testing Phase 5
Collaboration with ACSQHC
A ‘partnered research project’ was an essential approach for ensuring feasibility of this type of project. We therefore created ongoing links with the Commission, all levels of health professionals at each clinical site, including identification of a ‘local champion’ at the executive level to facilitate and support the project, selection of a site-based Project Officer (PO) to liaise with the research team on operational issues, and developed a Clinical Reference Committee (see below).
Clinical Reference Committee
A Clinical Reference Committee was formed to support the project and research team, to:
1. provide solutions-focused advice to our project team in terms of standards and practices
2. support the data collection processes 3. review any proposed changes to the study procedures.
Members of the Committee provided a broad range of experiences from different State / Territory jurisdictions:
• Nicola Dunbar – ACSQHC
• Doug Elliott – Project Director
• Emily Allen – Project Manager
• George Cerchez – Director, Medical Integration, Primary and Rural Health, Department of Health and Human Services, Tasmania
• Mary Miller – previously Project Manager, Clinical Deterioration, WA Country Health Service
• Charles Pain – Clinical Excellence Commission, NSW
• Megan Preece – Human Factors, University of Queensland
• Rachelle Morris – Nurse Manager, Caboolture Hospital, Queensland Health
Observation and Response Chart Usability Testing Phase 6
3. Methods
This section describes the major methodological components of the project: study aims, design, site selection, observation and response chart versions, clinical site preparation, data collection approaches, data management and analyses, and ethical considerations.
Study Aims
The overall aim of the project was to examine the usability of each ORC in an appropriate clinical context (general adult medical / surgical wards or equivalent areas). The related objectives were to examine whether the ORCs:
1. Were suitable for observations of adult medical-surgical patients, and prompt a response for episodes of clinical deterioration
2. Had any sections that require modifications
3. Could be introduced and applied in practice with minimal training.
Note that an aim of this phase was to not identify any preference for a particular version of the ORC suite of charts. Versions of the chart were therefore not compared to each other, and only one version was used and examined at each clinical site.
Design
A prospective mixed-methods design examined and explored the ‘usability’ of the five versions of ORCs in a range of adult clinical areas. This design optimised the quantity and quality of data collected, included a self-report survey by users; field notes from a site-based Project Officer’s observations of ORC use; short interviews with clinical staff; and audits of the ORCs to examine the documentation of observations, and any trigger decisions based on completion of the ORC.
Sample
The sample size for this phase evolved during development of the project to 10 sites. Initially, a sample size of five sites was proposed, one for each version of the ORC. However, given the interest following the request for expression of interest to participate, we modified the project to include 10 sites in this phase (see below).
Site Selection
Identifying partners to participate as ‘clinical sites’ was an important component for the project. As a condition of participation, hospital partners were to:
Observation and Response Chart Usability Testing Phase 7
• Demonstrate a commitment and an ability to test the ORC as outlined in the ‘data collection’ section below
• Have no conflict of interest with other equivalent health service or State-based projects
• Nominate a site-based Project Officer for secondment to the project for the period of site-specific data collection
• Provide some executive and additional clinical support (if required) for the Project Officer during the data collection period.
Expressions of Interest for Clinical Sites
Expressions of interest to participate as clinical sites in the project were sought, using the ACSQHC contacts list. A range of hospital / health service types and sizes were anticipated to provide a comprehensive assessment of the ORCs. Sites were selected in collaboration with the Commission and following a general consultation with the Reference Committee. The timeline of activities in relation to site selection is outlined below:
• 6th December 2010: request for expressions of interest
• 4th February 2011: submissions for expressions of interest due
• 9th February: site selection meeting
• 15th February: notification of selected sites, and sites placed on reserve list
After selection of the clinical sites, our Project Manager liaised with a nominated executive from each site to:
• Identify and select an appropriate staff member for funded secondment as the site-based Project Officer for the duration of the preparation and implementation of data collection
• Select wards and other clinical units as samples for ORC usability testing
• Identify the most appropriate ORC for usability testing
• Prepare for appropriate ethics clearance.
Site-based Project Officer Secondment
Secondment of a Project Officer from each clinical site was viewed as integral to the feasibility of the project, to facilitate ORC testing and enable optimal project outcomes. A Registered Nurse who was currently in a role as an educator / staff development officer / liaison nurse with an understanding of clinical deterioration and track and trigger / response systems, and a strong rapport with ward-based nursing and medical staff was ideally suited to this project work. The project also presented an excellent opportunity for career development and training for the Project Officers. Their role was to:
• Manage the roll-out of each phase of ORC introduction and data collection in the selected clinical areas
Observation and Response Chart Usability Testing Phase 8
• Liaise and collaborate with ward staff, hospital executives and relevant committees
• Provide information and education to all participating wards and hospital staff
• Collect data from staff and ORCs, and provide collated data to the research team.
Selection of ORC version and sample wards
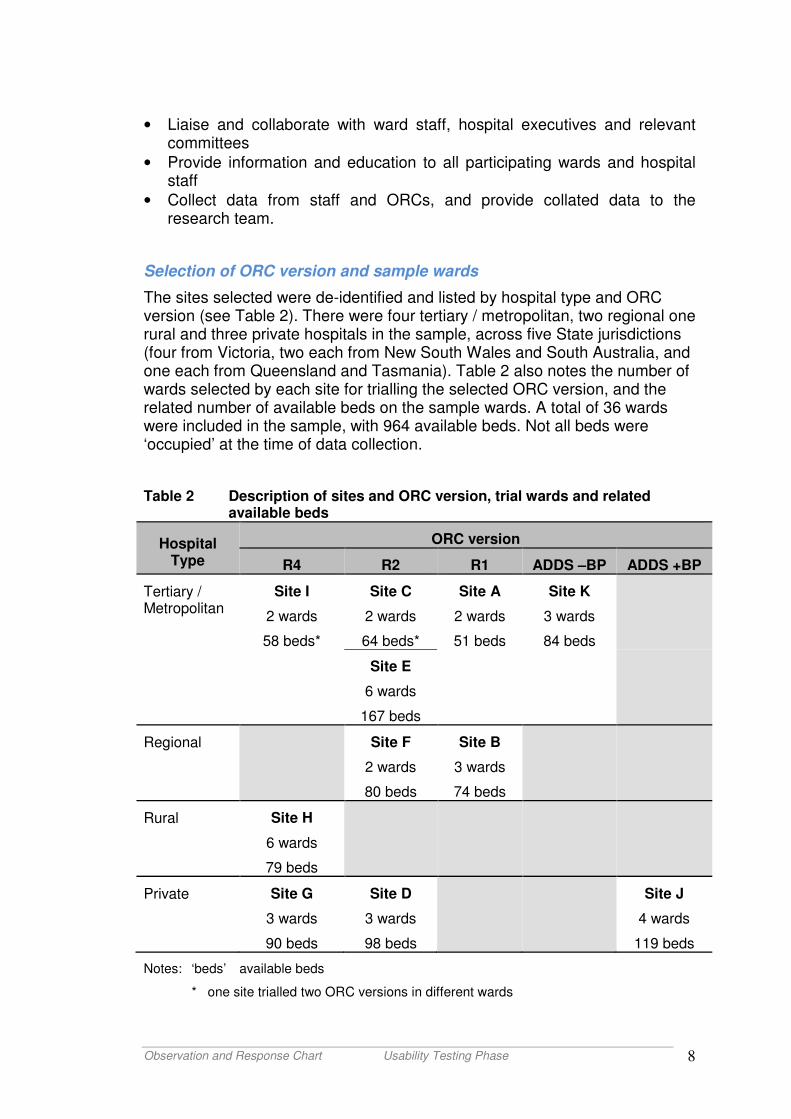
The sites selected were de-identified and listed by hospital type and ORC version (see Table 2). There were four tertiary / metropolitan, two regional one rural and three private hospitals in the sample, across five State jurisdictions (four from Victoria, two each from New South Wales and South Australia, and one each from Queensland and Tasmania). Table 2 also notes the number of wards selected by each site for trialling the selected ORC version, and the related number of available beds on the sample wards. A total of 36 wards were included in the sample, with 964 available beds. Not all beds were ‘occupied’ at the time of data collection.
Table 2 Description of sites and ORC version, trial wards and related available beds
Hospital Type
ORC version
R4 R2 R1 ADDS –BP ADDS +BP
Tertiary / Metropolitan
Site I
2 wards
58 beds*
Site C
2 wards
64 beds*
Site A
2 wards
51 beds
Site K
3 wards
84 beds
Site E
6 wards
167 beds
Regional
Site F
2 wards
80 beds
Site B
3 wards
74 beds
Rural Site H
6 wards
79 beds
Private Site G
3 wards
90 beds
Site D
3 wards
98 beds
Site J
4 wards
119 beds
Notes: ‘beds’ available beds
* one site trialled two ORC versions in different wards
Observation and Response Chart Usability Testing Phase 9
Observation and response charts
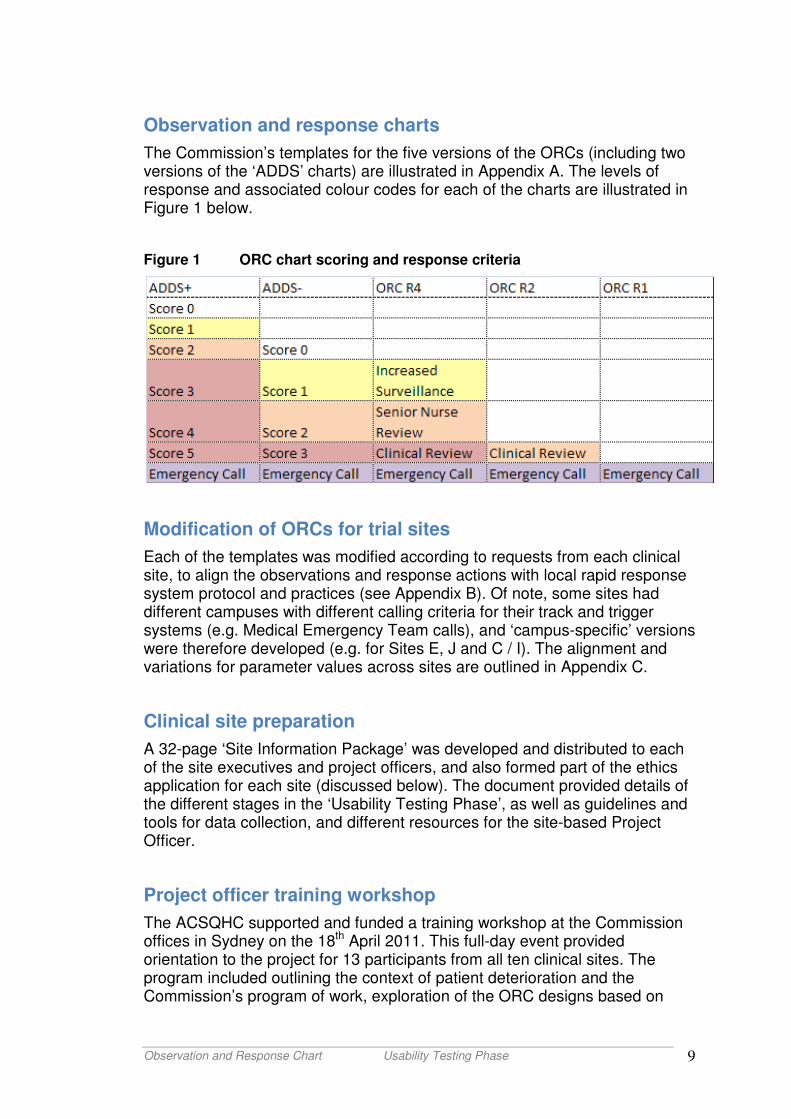
The Commission’s templates for the five versions of the ORCs (including two versions of the ‘ADDS’ charts) are illustrated in Appendix A. The levels of response and associated colour codes for each of the charts are illustrated in Figure 1 below.
Figure 1 ORC chart scoring and response criteria
Modification of ORCs for trial sites
Each of the templates was modified according to requests from each clinical site, to align the observations and response actions with local rapid response system protocol and practices (see Appendix B). Of note, some sites had different campuses with different calling criteria for their track and trigger systems (e.g. Medical Emergency Team calls), and ‘campus-specific’ versions were therefore developed (e.g. for Sites E, J and C / I). The alignment and variations for parameter values across sites are outlined in Appendix C.
Clinical site preparation
A 32-page ‘Site Information Package’ was developed and distributed to each of the site executives and project officers, and also formed part of the ethics application for each site (discussed below). The document provided details of the different stages in the ‘Usability Testing Phase’, as well as guidelines and tools for data collection, and different resources for the site-based Project Officer.
Project officer training workshop
The ACSQHC supported and funded a training workshop at the Commission offices in Sydney on the 18th April 2011. This full-day event provided orientation to the project for 13 participants from all ten clinical sites. The program included outlining the context of patient deterioration and the Commission’s program of work, exploration of the ORC designs based on
Observation and Response Chart Usability Testing Phase 10
human factors development, introduction to the ORC Project and project team, and description of the data collection approaches using short demonstration videos, patient scenarios and practice sessions.
Clinical staff preparation
Although training on completion of the chart was minimal as per the intent of the Commission, staff preparation for data collection was essential, and so each Project Officer informed all relevant clinical staff (primarily nursing staff) about the ORC and the project. This included orientation to the components and features of the chart, and the aims of the project and related data collection processes, specifically the need for ‘dual-documentation’ of observations during the 24-hour data collection period. Given the issue of shift-work and access to staff, this information was in both written (information posters, information sheets in the communications folder or equivalent, e-mail) and verbal forms (shift handovers preceding the data collection period, depending on staff rostering patterns and practices).
For the required double documentation of patient observations, clinical staff were requested to:
1. Document on the hospital’s current observation chart first as per usual practice, as this document formed part of a patient’s medico-legal record
2. Then document the observations on the trial ORC during the same documentation activity, or as soon as possible after the observations were taken, to minimise any variations between the two charts.
On the designated data collection day for that ward, the Project Officer distributed the selected ORC for commencement at the start of the ‘observation day’ (commonly early afternoon).
Data collection approaches
The mixed-methods approach comprised:
• observations and field notes from the site-based Project Officer,
• a self-report survey by users,
• handover de-briefs (short interviews with small groups of clinical staff), and
• an audit of the ORCs for completeness of documentation of observations, compared to the hospital’s existing observation chart.
Any addition to workload of clinical staff was identified as a risk to study compliance and feasibility, and therefore data collection aimed to minimise ‘respondent burden’ by scheduling each ward to complete the ‘dual-documenting’ of observations on the existing hospital chart and the designated ORC only within one 24-hour period. A continuous 24-hour cycle of observations in each ward was most appropriate for testing the usability of
Observation and Response Chart Usability Testing Phase 11
the ORCs, and enabled assessment on the use of charts at night, when ambient lighting is lower.
A staged process was developed for each hospital site, so that data collection for each ward was undertaken in sequential 24-hour periods, separated by a data collation day to allow completion of data collection from the previous ward, and preparation for the next ward.
Field notes
A site-based project officer collected field notes at each of the 10 participating sites whilst carrying out observations of practices relating to the use of the selected ORC. During peak periods of observation (e.g. 1000, 1400, 1800 hours), the Project Officer observed staff observation practices, and communicated briefly with users for any anecdotal comments on the usability of the ORC. These observations and comments were documented as field notes. Guidelines were provided to support the Project Officer in this activity (see Appendix D).
User survey
A user-satisfaction survey was developed for staff to complete at the end of their observation activities for the shift. The survey comprised 28 items relating to the design and components of the ORC. The ADDS charts included seven additional items relating to scoring and the blood pressure table (see Appendix E). These items were equivalent to those already developed and used in the online survey and simulation experiments of previous projects as elements of the ORC design development. In broad terms, the issues in relation to usability in the clinical setting included:
• Clarity of text (size, font type)
• Layout (including size of chart, flow and format of observation parameters)
• Comprehensiveness
• Ease of documenting
• Capacity to trigger a response for a deteriorating patient
Survey items included dichotomous and Likert-scale response levels for ease of completion. Demographic characteristics of each user were also be collected, including designation and qualifications of staff, employment type (full-time, part-time, casual, agency), employment period (ward, hospital), and employment experience (years of employment). Level of staff, particularly in relation to nursing or other care staff, was important to collect, given that the intent of the ORC was for it to be used by all levels of clinical staff undertaking patient observations without specific training.
Observation and Response Chart Usability Testing Phase 12
Both paper-based and online versions of the survey were developed, with each taking approximately five minutes to complete. Each Project Officer distributed the paper-based surveys to users at the beginning of their shift, and then collected the surveys at the time of user completion, to ensure an optimal return rate and completeness of the survey. For staff that preferred and had access to internet-enabled computers in their work area, a site-unique link to Survey Monkey was provided. Only one user survey per participant was completed.
Handover debrief
At the completion of each shift (particularly after night duty), the Project Officer conducted short interviews with a group of staff. These debrief sessions were audio-taped with participants’ permission for later transcription of de-identified verbatim comments. The aim of these interviews was to identify and explore the broad issues for clinical staff related to documentation in the ORC. Guidelines were provided to support the Project Officer in this activity (see Appendix F).
Audits
Dual documentation was a requirement of the usability phase as the ORC had not been approved for medical records, and the current hospital chart therefore remained in practice as part of the legal medical record during the trial. Following completion of the 24-hour period of ‘dual-documentation’ data collection for each ward, the Project Officer audited the ORCs for completeness of documentation of observations, compared to the hospital’s existing observation chart. These data were entered via Survey Monkey, with guidelines provided to support the Project Officer (see Appendix G).
Compliance between the dual sets of observations documentation were audited, comparing sets of vital signs on the ORC with sets of vital signs on the existing hospital chart to identify when (time of day) and where (variable on ORC) errors may occur. As noted earlier, the existing hospital charts were considered the ‘correct’ documentation and served as a ‘comparator’ for purposes of this audit. Any vital sign sets on the ORC that did not match the vital sign sets on the existing hospital chart were considered as ‘mismatched’. Details of mismatched vital sign sets were collected for a maximum of five sets per ORC.
Data management and analyses
The Project Officer at each site assessed the quantitative data for completeness, before being entered either locally or centrally (for de-identified paper-based user surveys). All data were then cleaned and checked for errors centrally by the Project Manager prior to data analysis. Qualitative interview and field notes data were transcribed for analysis at each site and transmitted to the research team for collation prior to analyses.
Observation and Response Chart Usability Testing Phase 13
Quantitative data from the user survey and audit were analysed descriptively using frequencies and proportions, for each site individually and for the total sample. Transcribed qualitative data from the field notes of observations, de-brief sessions, and open-ended questions from the user survey were entered into N-Vivo and examined initially via content analysis (where appropriate including counts of categories of text) and then thematic analysis. Coding of text used categories aligned with the project aims; e.g. clarity of text, chart format and layout, comprehensiveness, ease of documenting, and capacity to trigger a response for a deteriorating patient.
Ethical considerations
Each clinical site approved the study as a negligible / low-risk project, given clinical staff (not patients) were study participants and the level of risk entailed. Informed consent was gained from participants (all relevant clinical staff) for the survey, observations and interviews, as required (see Appendix H, Participant Information Sheet and Appendix I, Participant Consent Form). Confidentiality of participants’ identity was guaranteed. All data are stored as per NHMRC guidelines.
Observation and Response Chart Usability Testing Phase 14
4. Results
This section initially reports demographic details in relation to each of the data collection techniques: field notes, user survey, handover debrief, and audits. Findings for the three study objectives are then presented, as noted earlier in the methods section.
Demographics
Field notes
A total of 36 wards participated across the 10 sites, with 85 pages of field notes produced relating to actions, comments and conversations relevant to the usability and clinical application of the ORC. Frequencies of comments related to specific ORC items are described in Appendix J.
User survey
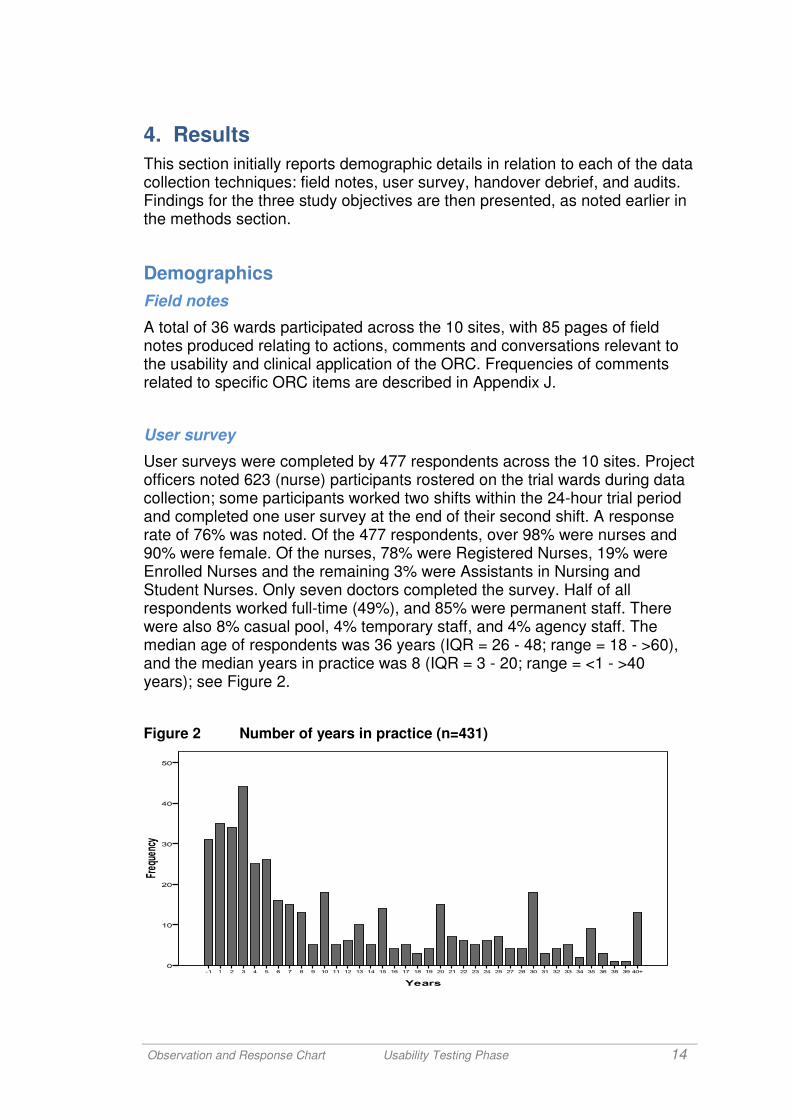
User surveys were completed by 477 respondents across the 10 sites. Project officers noted 623 (nurse) participants rostered on the trial wards during data collection; some participants worked two shifts within the 24-hour trial period and completed one user survey at the end of their second shift. A response rate of 76% was noted. Of the 477 respondents, over 98% were nurses and 90% were female. Of the nurses, 78% were Registered Nurses, 19% were Enrolled Nurses and the remaining 3% were Assistants in Nursing and Student Nurses. Only seven doctors completed the survey. Half of all respondents worked full-time (49%), and 85% were permanent staff. There were also 8% casual pool, 4% temporary staff, and 4% agency staff. The median age of respondents was 36 years (IQR = 26 - 48; range = 18 - >60), and the median years in practice was 8 (IQR = 3 - 20; range = <1 - >40 years); see Figure 2.
Figure 2 Number of years in practice (n=431)
Observation and Response Chart Usability Testing Phase 15
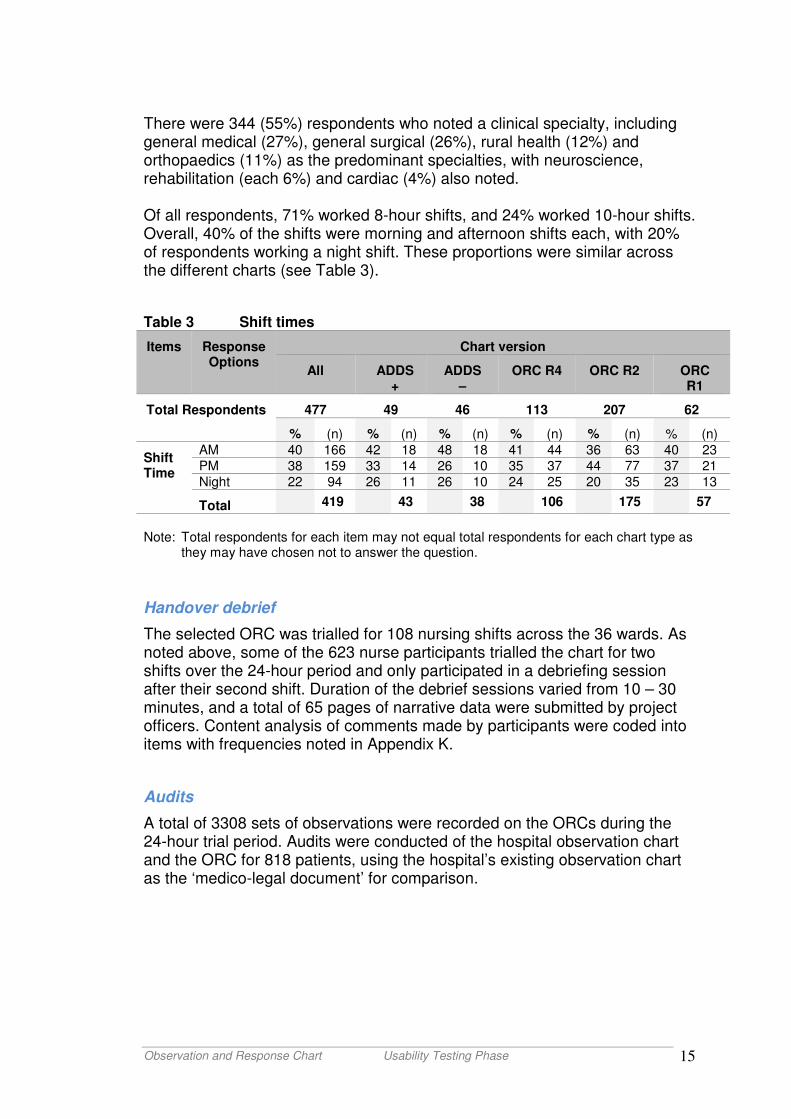
There were 344 (55%) respondents who noted a clinical specialty, including general medical (27%), general surgical (26%), rural health (12%) and orthopaedics (11%) as the predominant specialties, with neuroscience, rehabilitation (each 6%) and cardiac (4%) also noted. Of all respondents, 71% worked 8-hour shifts, and 24% worked 10-hour shifts. Overall, 40% of the shifts were morning and afternoon shifts each, with 20% of respondents working a night shift. These proportions were similar across the different charts (see Table 3).
Table 3 Shift times
Items Response Options
Chart version
All ADDS +
ADDS –
ORC R4 ORC R2 ORC R1
Total Respondents 477 49 46 113 207 62
% (n) % (n) % (n) % (n) % (n) % (n)
Shift Time
AM 40 166 42 18 48 18 41 44 36 63 40 23
PM 38 159 33 14 26 10 35 37 44 77 37 21
Night 22 94 26 11 26 10 24 25 20 35 23 13
Total 419 43 38 106 175 57
Note: Total respondents for each item may not equal total respondents for each chart type as
they may have chosen not to answer the question.
Handover debrief
The selected ORC was trialled for 108 nursing shifts across the 36 wards. As noted above, some of the 623 nurse participants trialled the chart for two shifts over the 24-hour period and only participated in a debriefing session after their second shift. Duration of the debrief sessions varied from 10 – 30 minutes, and a total of 65 pages of narrative data were submitted by project officers. Content analysis of comments made by participants were coded into items with frequencies noted in Appendix K.
Audits
A total of 3308 sets of observations were recorded on the ORCs during the 24-hour trial period. Audits were conducted of the hospital observation chart and the ORC for 818 patients, using the hospital’s existing observation chart as the ‘medico-legal document’ for comparison.
Observation and Response Chart Usability Testing Phase 16
Study findings
The following results are presented in order of the three main objectives, combining data from the field notes, user survey, handover debrief, and audits. The main study objectives were to examine whether the ORCs:
1. Were suitable for observations of adult medical-surgical patients, and prompt a response for episodes of clinical deterioration
2. Had any sections that require modifications
3. Could be introduced and applied in practice with minimal training.
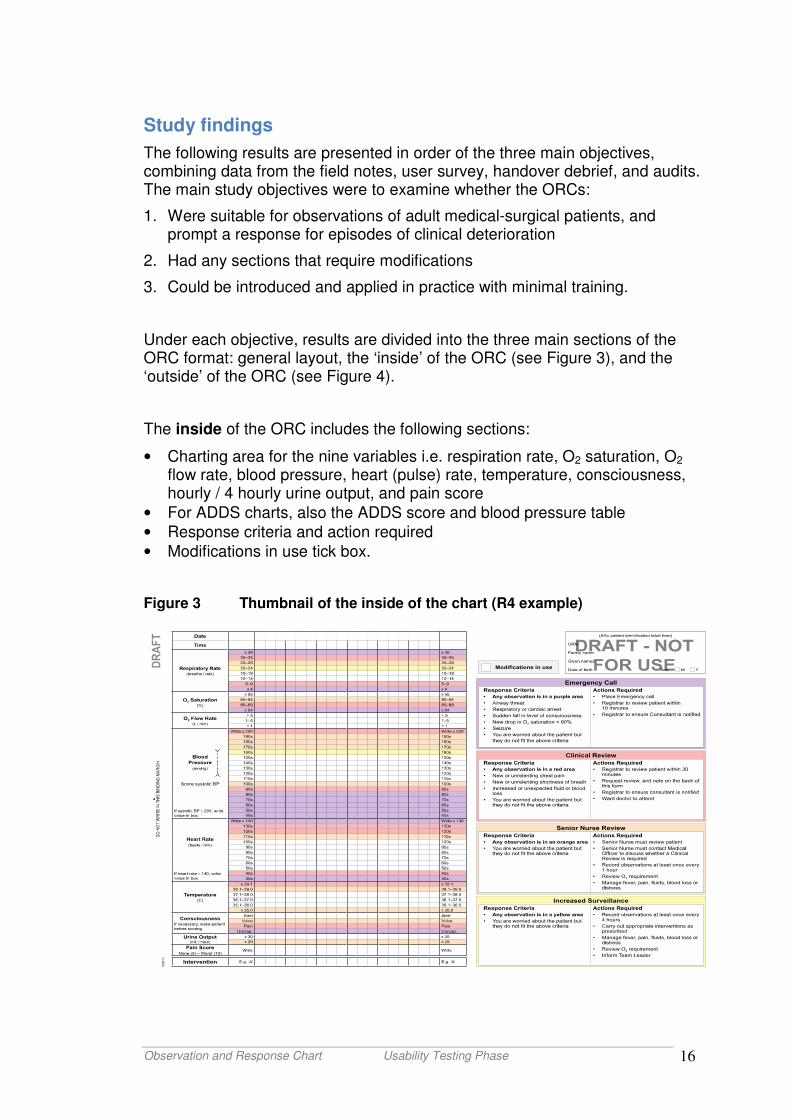
Under each objective, results are divided into the three main sections of the ORC format: general layout, the ‘inside’ of the ORC (see Figure 3), and the ‘outside’ of the ORC (see Figure 4).
The inside of the ORC includes the following sections:
• Charting area for the nine variables i.e. respiration rate, O2 saturation, O2 flow rate, blood pressure, heart (pulse) rate, temperature, consciousness, hourly / 4 hourly urine output, and pain score
• For ADDS charts, also the ADDS score and blood pressure table
• Response criteria and action required
• Modifications in use tick box.
Figure 3 Thumbnail of the inside of the chart (R4 example)
Observation and Response Chart
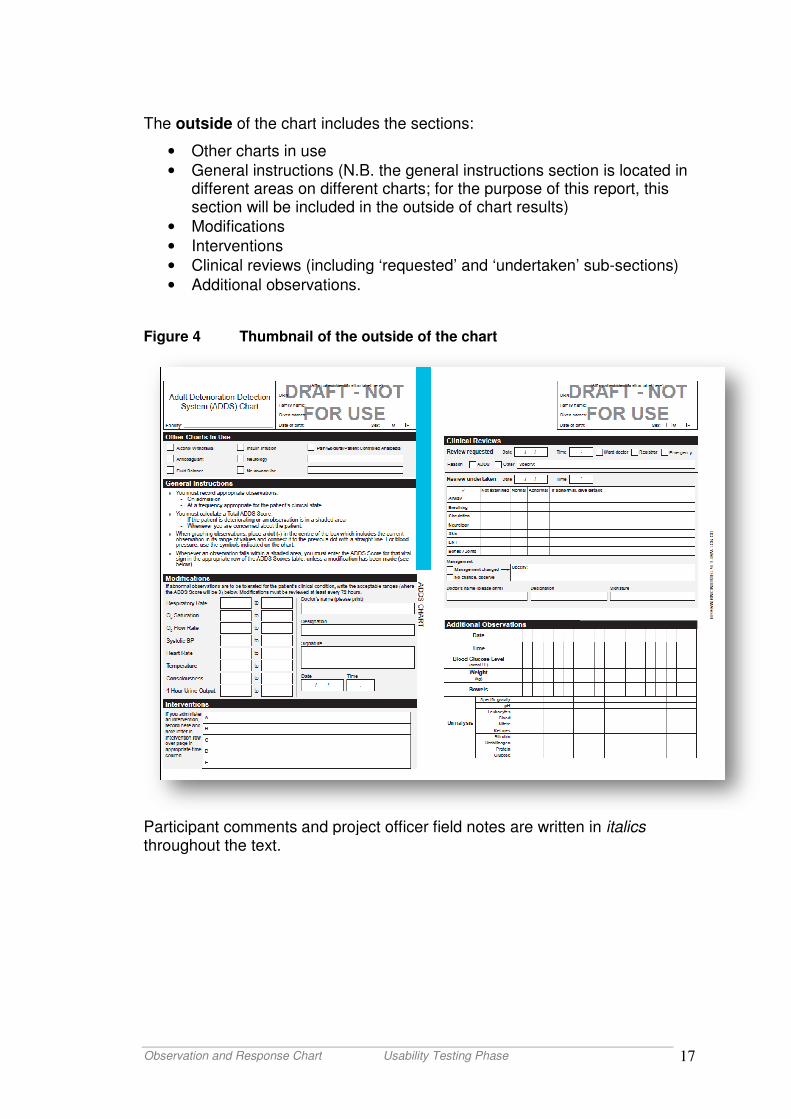
The outside of the chart
• Other charts in use
• General instructionsdifferent areas on different charts; for the purpose of this report, this section will be included in the outside of chart results)
• Modifications
• Interventions
• Clinical review
• Additional observations.
Figure 4 Thumbnail of the outside of the chart
Participant comments and project officer field notes are written in throughout the text.
Observation and Response Chart Usability Testing Phase
of the chart includes the sections:
ther charts in use
eneral instructions (N.B. the general instructions section is located in different areas on different charts; for the purpose of this report, this section will be included in the outside of chart results)
linical reviews (including ‘requested’ and ‘undertaken
dditional observations.
Thumbnail of the outside of the chart
Participant comments and project officer field notes are written in
17
(N.B. the general instructions section is located in different areas on different charts; for the purpose of this report, this
undertaken’ sub-sections)
Participant comments and project officer field notes are written in italics
Observation and Response Chart Usability Testing Phase 18
Objective 1: Suitability of ORCs for observations of adult medical-surgical patients, and as a prompt for responding to clinical deterioration
1.1 Suitability for observations of adult medical-surgical patients
1.1.1 General layout
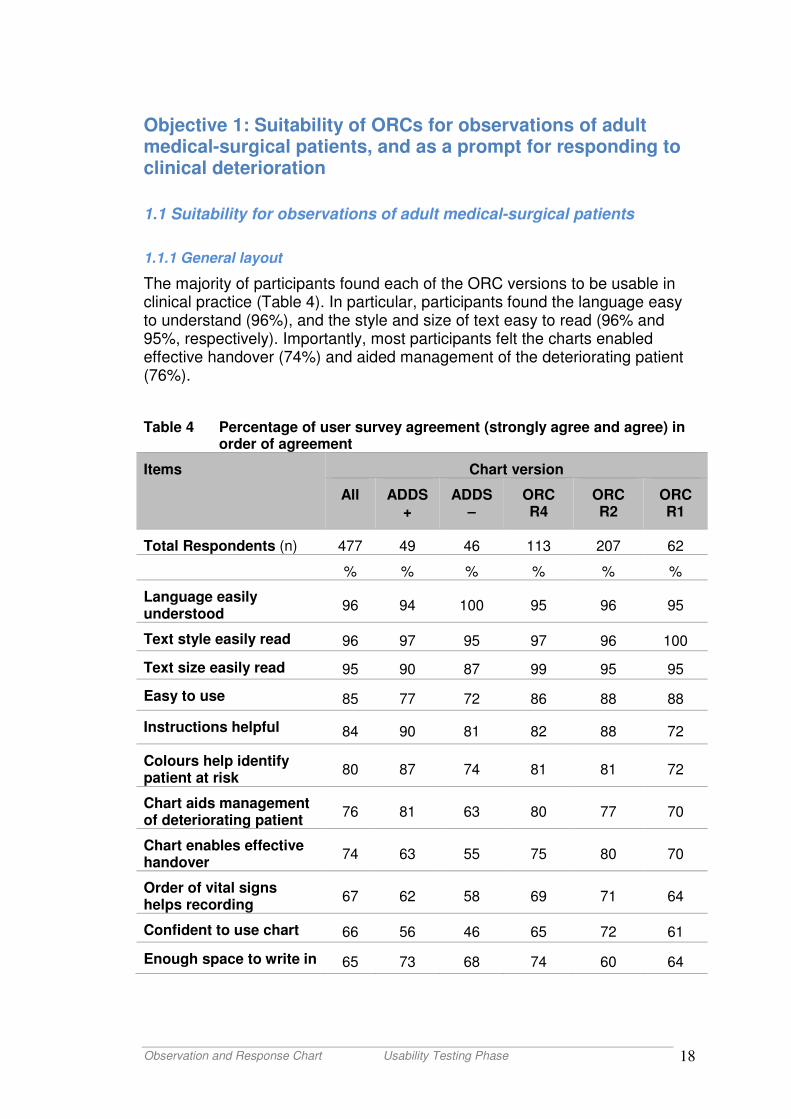
The majority of participants found each of the ORC versions to be usable in clinical practice (Table 4). In particular, participants found the language easy to understand (96%), and the style and size of text easy to read (96% and 95%, respectively). Importantly, most participants felt the charts enabled effective handover (74%) and aided management of the deteriorating patient (76%).
Table 4 Percentage of user survey agreement (strongly agree and agree) in order of agreement
Items Chart version
All ADDS +
ADDS –
ORC R4
ORC R2
ORC R1
Total Respondents (n) 477 49 46 113 207 62
% % % % % %
Language easily understood
96 94 100 95 96 95
Text style easily read 96 97 95 97 96 100
Text size easily read 95 90 87 99 95 95
Easy to use 85 77 72 86 88 88
Instructions helpful 84 90 81 82 88 72
Colours help identify patient at risk
80 87 74 81 81 72
Chart aids management of deteriorating patient
76 81 63 80 77 70
Chart enables effective handover
74 63 55 75 80 70
Order of vital signs helps recording
67 62 58 69 71 64
Confident to use chart 66 56 46 65 72 61
Enough space to write in 65 73 68 74 60 64
Observation and Response Chart Usability Testing Phase 19
Comments from participants included:
Loved the colours, easy to use, thought charts looked complicated but once used liked that they helped identify if there was an issue with a patient
Liked colours, liked size of boxes. Much easier to read than usual chart. Easy to use. Great for junior nurses.
Participants were less positive about being confident to use the charts (66%) and having enough space to write in (65%). The most positive responses were for the ADDS+, ORC R4 and R2 versions, while the ADDS- and ORC R1 had substantially less agreement overall. Note however that both of these charts had small sample sizes (n = 46 and 62, respectively), and site-based factors may have influenced these findings.
Many comments were made on aspects of the ORC relating to structure, format and layout of the charts that influenced its usability in clinical practice. One aspect was that the chart size and fold made it difficult to fit in the current bedside folder and to write on when fully open. This caused staff to fold the chart inside out or remove it from the folder, which led to further confusion about which was the front of the chart and which was the back of the chart. For example:
It’s difficult to use in our current folders as unable to unfold it without removing it. Need to get different folders to make chart user friendly.
Both sides of back and front look similar, depending how charts were folded the back and front were different.
Several participants also commented that patients requiring frequent observations would need multiple charts; for example:
If you have post-operative patients or blood transfusion observations you go through the form very quickly.
There were 56 participant comments about space issues, even though 65% (range 60-74%) of participants agreed that there was enough space on the ORC to write in (see Table 4). For this 24-hour trial, only one ORC form was required in 91% of cases.
1.1.2 Inside ORC
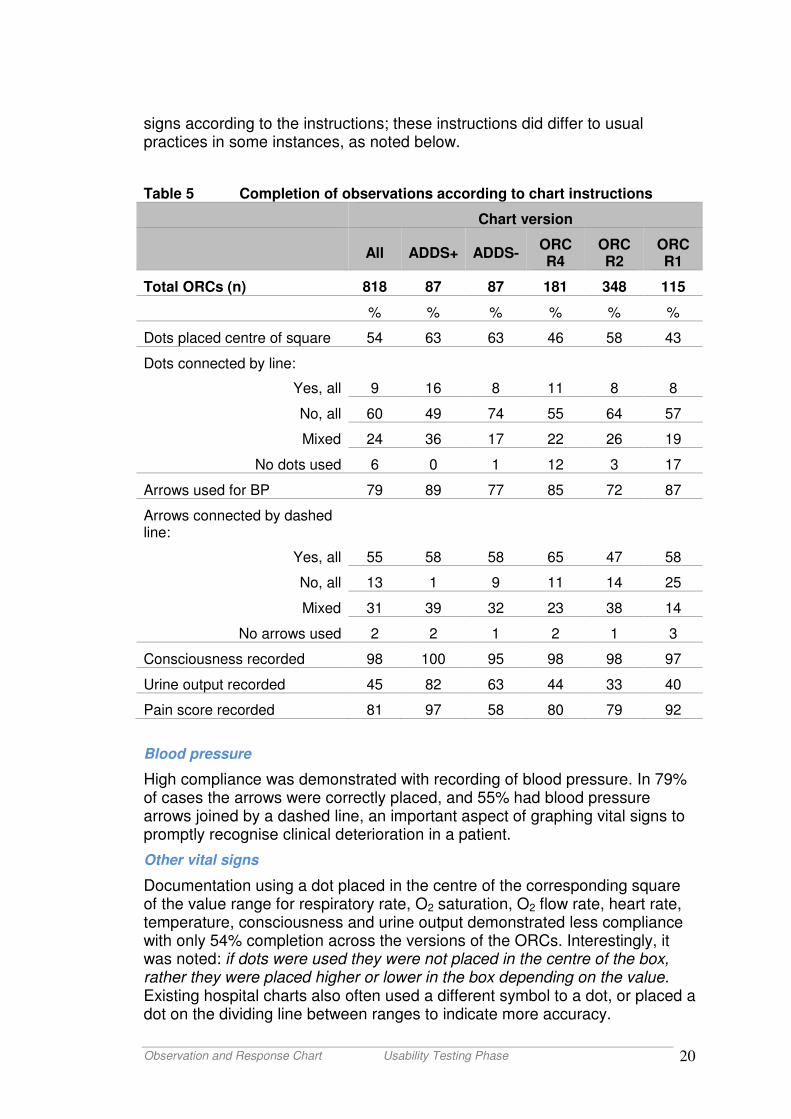
Recording of vital signs on the ORCs were audited from two perspectives, first for compliance according to instructions provided on the charts (see ‘general instructions’, Appendix A); and second to explore the accuracy in dual documentation. Table 5 illustrates the level of compliance in documenting vital
Observation and Response Chart Usability Testing Phase 20
signs according to the instructions; these instructions did differ to usual practices in some instances, as noted below.
Table 5 Completion of observations according to chart instructions
Chart version
All ADDS+ ADDS-
ORC R4
ORC R2
ORC R1
Total ORCs (n) 818 87 87 181 348 115
% % % % % %
Dots placed centre of square 54 63 63 46 58 43
Dots connected by line:
Yes, all 9 16 8 11 8 8
No, all 60 49 74 55 64 57
Mixed 24 36 17 22 26 19
No dots used 6 0 1 12 3 17
Arrows used for BP 79 89 77 85 72 87
Arrows connected by dashed line:
Yes, all 55 58 58 65 47 58
No, all 13 1 9 11 14 25
Mixed 31 39 32 23 38 14
No arrows used 2 2 1 2 1 3
Consciousness recorded 98 100 95 98 98 97
Urine output recorded 45 82 63 44 33 40
Pain score recorded 81 97 58 80 79 92
Blood pressure
High compliance was demonstrated with recording of blood pressure. In 79% of cases the arrows were correctly placed, and 55% had blood pressure arrows joined by a dashed line, an important aspect of graphing vital signs to promptly recognise clinical deterioration in a patient.
Other vital signs
Documentation using a dot placed in the centre of the corresponding square of the value range for respiratory rate, O2 saturation, O2 flow rate, heart rate, temperature, consciousness and urine output demonstrated less compliance with only 54% completion across the versions of the ORCs. Interestingly, it was noted: if dots were used they were not placed in the centre of the box, rather they were placed higher or lower in the box depending on the value. Existing hospital charts also often used a different symbol to a dot, or placed a dot on the dividing line between ranges to indicate more accuracy.
Observation and Response Chart Usability Testing Phase 21
A straight line was to be inserted to connect dots between time points, however there was also poor compliance noted, making trends in vital signs more difficult to recognise (see Table 5). Only 9% of ORCs had all dots connected by a line and in 60% the dots were not connected at all. It was noted from field notes that, often however the first person filled in the ORC the next person continued in same manner.
Overwhelmingly, staff indicated a strong preference to record a numerical value because of concern that the existing ranges in the parameter values were too wide to illustrate changes in a patient’s condition. This is clearly evident in over 80 participant comments that reflected how they are accustomed to recording vital signs with more precision, and therefore prefer to write a precise numeral. For example:
Dot points are not specific enough. What happens if the patient ends up being a coroner’s case and specific details are being asked regarding the heart rate? I won’t be able to answer these questions, all I will have to refer to is a dot.
Importantly, this raises the issue of what the minimal clinically important difference (MID) is for each of the vital sign parameter ranges. The discrepancy between actual measurements and recording of vital signs is particularly highlighted with digital values from automated observation devices, especially for blood pressure, heart (pulse) rate, oxygen saturation, and temperature.
Oxygen saturation and flow levels
A number of participants raised particular concerns about the ranges in oxygen flow rate and saturation sections, and that it would be difficult to see changes in a patient’s condition. One participant noted, Thought it was a big gap from 94-100% [for oxygen saturation]. We would intervene at 94%. With this big range you can’t graph it improving. In particular, a trend won’t be seen with increasing O2 requirements and that it will be difficult to see weaning. There was also concern about not having a record of the oxygen delivery device in this section and that it may lead to an inappropriate device being used.
Urine output
The lowest compliance with documentation related to urine output, with only 45% correct completion (range 33-82%; see Table 5). This parameter also generated the most frequent comments, often reflecting frustration by participants. Participants were unclear of what was required, particularly if a fluid balance chart was in use or the patient was weighed instead. Some participant wrote a guess urine output for those not on a fluid balance chart. Further, the idea of double documenting on the ORC and fluid balance charts felt like an increased burden on their workload. More positively, some participants thought that urine output was a good trigger to ask the patient if they were passing urine when carrying out their usual vital sign round, which they would normally not do.
Observation and Response Chart Usability Testing Phase 22
Consciousness and pain scores
The ORC sections with the highest level of compliance with chart instructions were for recording of consciousness (95%-100%) and pain scores (58%-97%) (Table 5).
It is useful to have the pain score as it prompts you to assess this and consider its relationship to other variables
Vertical bold lines in charting area
The inclusion of vertical bold lines every three columns was another aspect of the ORC graphing area that raised comments. The bold lines are included to minimise the risk of ‘column shift’ error when staff are documenting vital signs. Three columns is the optimal number to minimise the risk of error occurring. However, staff found the bold lines confusing and felt it distracted them from recording patient’s vital signs according to the required frequency. For example, with hospital patients who are on four or six hourly observations unless their clinical condition requires closer monitoring, this means in a 24-hour period a patient will have four or six sets of vital signs recorded on their observation chart. Example comments included:
Not sure when to start a new date, does it have to be after a dark dividing line?
Bold line after ever 3 boxes is confusing, why is it even there?
Response colours in the charting area
The use of colours was an important element of the ORC that triggers the user to recognise a change in the patient’s clinical condition. Participants were asked to indicate their colour preferences, in the user survey, and explain why. Seventy-three respondents indicated a preference for one or more of the colours used. The majority thought the ‘emergency’ purple should be changed to red or blue (42%) for reasons such as ‘red is more suited than purple for a rapid response – more alarming’ and ‘blue should indicate possible medical emergency as per Code Blue’. Other comments include red and purple ‘should be reversed – red for danger?’ and purple ‘does not alert enough for rapid response’. Respondents (32%) also considered that orange and yellow shades were ‘too similar in colour and all “wishy-washy” colours’ and they ‘cannot differentiate’ between them. Another respondent commented that the orange and red are ‘not distinct enough – too close to each other’. Other respondents also reflected this view; red, orange and yellow were considered to be too similar.
Response criteria and action required
Few comments were provided regarding the ‘response criteria and action required’ section on the right inside page. Some staff commented that this section was really useful, especially for supporting and providing guidance to new and inexperienced staff. Others thought that nurse’s clinical judgement should be included because the patient could be in a zone that requires you to
Observation and Response Chart Usability Testing Phase 23
ring a medical officer when it may be because the patient is simply anxious and the nurses could deal with it. Staff also felt reassured by this section, for example: If you follow the guidelines here and the patient has a negative outcome, you know that you did everything that you were supposed to.
Modifications in use tick box
The ‘modifications in use’ tick box was included on the inside page of the ORC to trigger staff to look at the ‘modifications’ section on the outside page. However, in 72% of the charts with documented modifications, no tick or mark was written in the ‘modifications in use’ box.
ADDS scoring
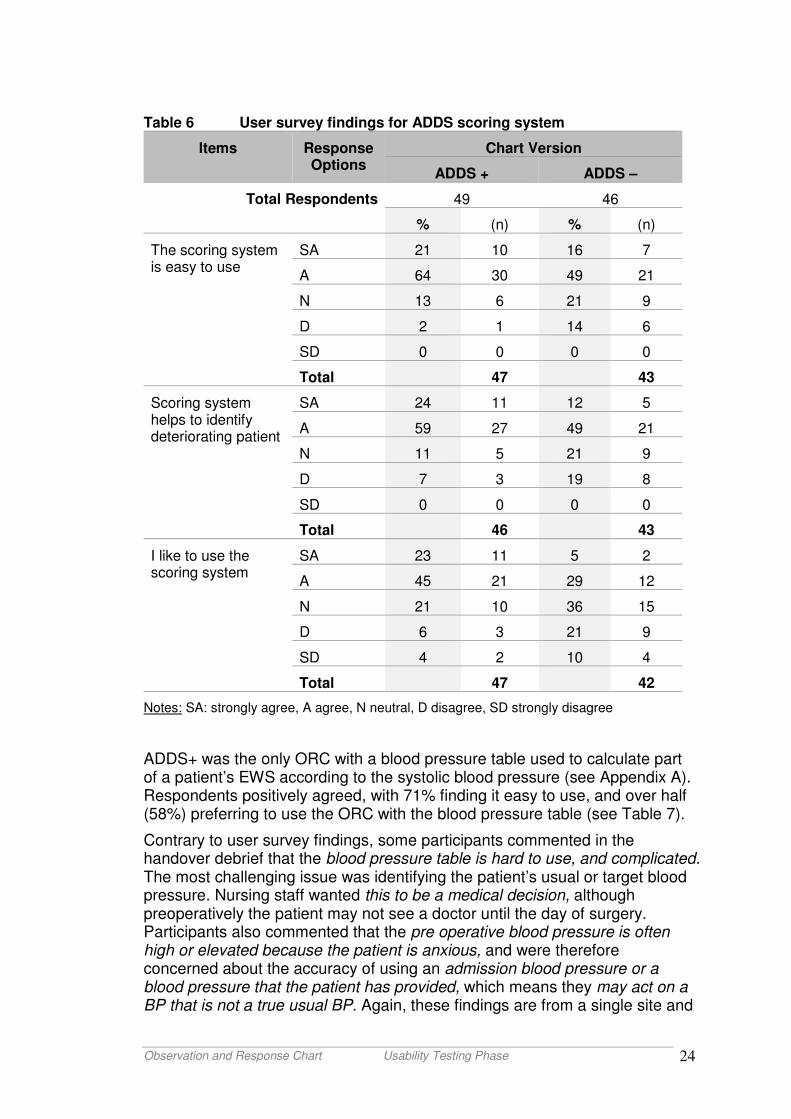
The ADDS+ and ADDS- ORC versions both use an early warning scoring system (EWS), an important aspect of recording vital signs that supports early identification of clinical deterioration in a patient. User survey respondents were positive about the EWS system with the majority agreeing that it was easy to use on the ADDS+ and ADDS- (85% and 65% respectively). The system was liked by 68% of respondents using the ADDS+, 34% using the ADDS-, and 36% were neutral in the latter (see Table 6).
The majority of comments made by participants support the findings of the user survey suggesting that it is easy to work out scores as you are doing the observations. Although, one nurse commented that they found it challenging because, you chart at the top and then find out what the score is, and then you’re having to come down to the bottom and put in your score, so your eyes are having to go to the top and then the bottom again. Another nurse scored each separately and, found it really annoying, although you get used to it after a while. One nurse had used similar charts elsewhere and thought other charts where you score each parameter straight under the specific parameter was easier.
Some participants commented on the scoring being too sensitive, for example most people will score a 1-3 and it is impractical to do 2 hourly observations on all patients. Sites do however have the opportunity to tailor responses for each range of ADDS scores, and this response could be modified. One participant commented that they were concerned if no modification written the patient would get an unnecessary score for a minor thing or a score for something that is expected like oxygen therapy post op. As noted earlier, these findings were from single sites with relatively small participant numbers, and therefore should be viewed with caution.
Observation and Response Chart Usability Testing Phase 24
Table 6 User survey findings for ADDS scoring system
Items Response Options
Chart Version
ADDS + ADDS –
Total Respondents 49 46
% (n) % (n)
The scoring system is easy to use
SA 21 10 16 7
A 64 30 49 21
N 13 6 21 9
D 2 1 14 6
SD 0 0 0 0
Total 47 43
Scoring system helps to identify deteriorating patient
SA 24 11 12 5
A 59 27 49 21
N 11 5 21 9
D 7 3 19 8
SD 0 0 0 0
Total 46 43
I like to use the scoring system
SA 23 11 5 2
A 45 21 29 12
N 21 10 36 15
D 6 3 21 9
SD 4 2 10 4
Total 47 42
Notes: SA: strongly agree, A agree, N neutral, D disagree, SD strongly disagree
ADDS+ was the only ORC with a blood pressure table used to calculate part of a patient’s EWS according to the systolic blood pressure (see Appendix A). Respondents positively agreed, with 71% finding it easy to use, and over half (58%) preferring to use the ORC with the blood pressure table (see Table 7).
Contrary to user survey findings, some participants commented in the handover debrief that the blood pressure table is hard to use, and complicated. The most challenging issue was identifying the patient’s usual or target blood pressure. Nursing staff wanted this to be a medical decision, although preoperatively the patient may not see a doctor until the day of surgery. Participants also commented that the pre operative blood pressure is often high or elevated because the patient is anxious, and were therefore concerned about the accuracy of using an admission blood pressure or a blood pressure that the patient has provided, which means they may act on a BP that is not a true usual BP. Again, these findings are from a single site and
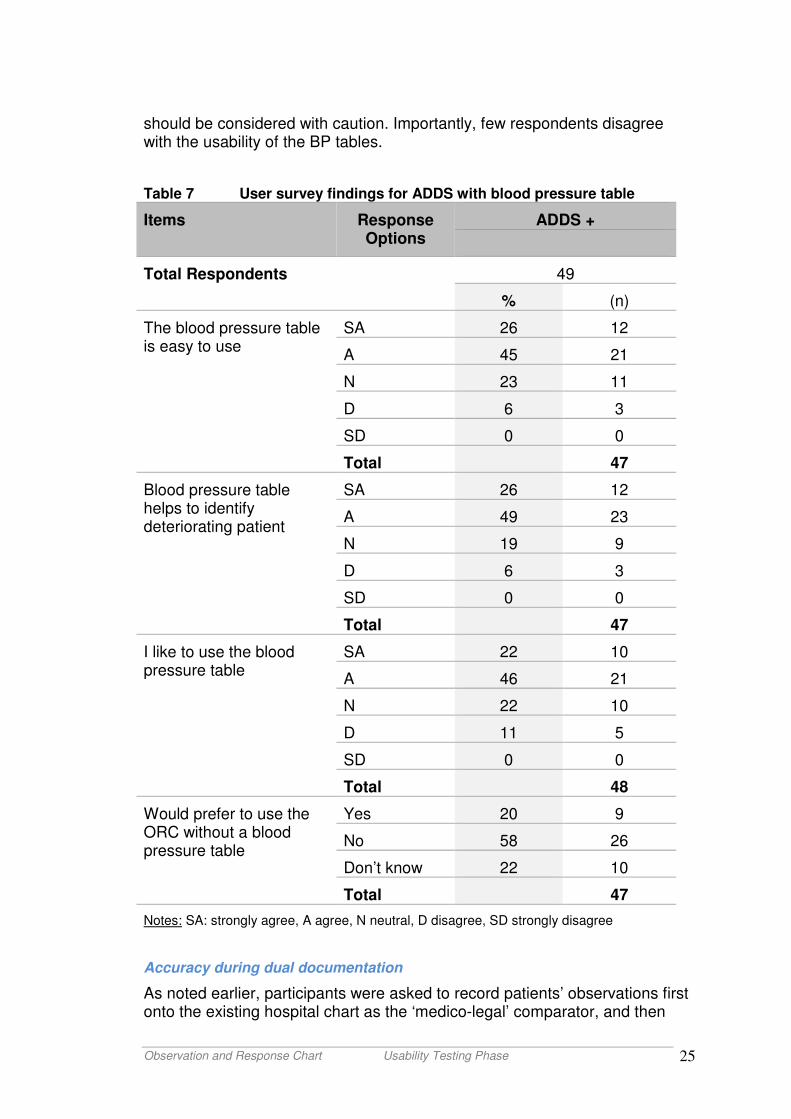
Observation and Response Chart Usability Testing Phase 25
should be considered with caution. Importantly, few respondents disagree with the usability of the BP tables.
Table 7 User survey findings for ADDS with blood pressure table
Items Response Options
ADDS +
Total Respondents 49
% (n)
The blood pressure table is easy to use
SA 26 12
A 45 21
N 23 11
D 6 3
SD 0 0
Total 47
Blood pressure table helps to identify deteriorating patient
SA 26 12
A 49 23
N 19 9
D 6 3
SD 0 0
Total 47
I like to use the blood pressure table
SA 22 10
A 46 21
N 22 10
D 11 5
SD 0 0
Total 48
Would prefer to use the ORC without a blood pressure table
Yes 20 9
No 58 26
Don’t know 22 10
Total 47
Notes: SA: strongly agree, A agree, N neutral, D disagree, SD strongly disagree
Accuracy during dual documentation
As noted earlier, participants were asked to record patients’ observations first onto the existing hospital chart as the ‘medico-legal’ comparator, and then
Observation and Response Chart Usability Testing Phase 26
immediately following on to the ORC. Field notes however clearly revealed a range of different documentation practices throughout the 24-hour trial. For example, participants recorded observations on:
• Both charts contemporaneously, as required by the study
• The hospital chart first beside the patient and then on the ORC outside the patient’s room
• A piece of paper at the point of measuring and then took both charts away from the patient to record
• The existing chart throughout the shift and then transcribed them all to the ORC at the end of the shift.
This disparity in practices of recording observations adds a level of complexity to interpreting the following data, which should be considered with caution.
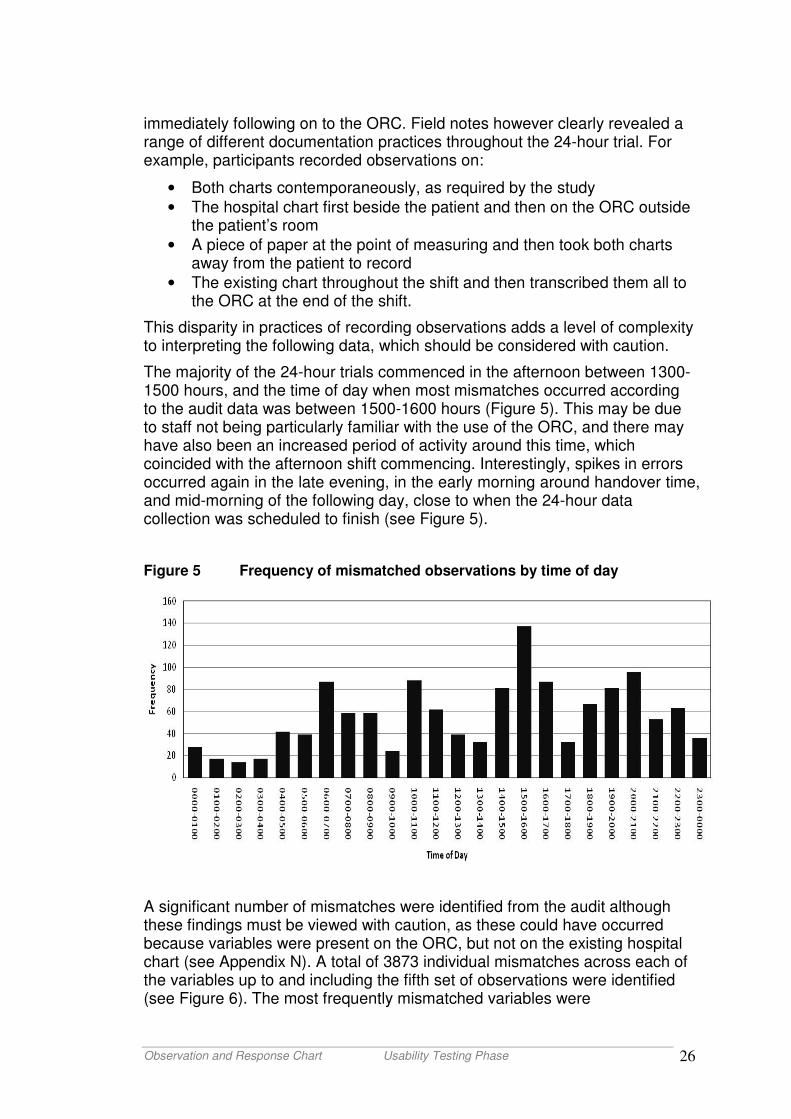
The majority of the 24-hour trials commenced in the afternoon between 1300-1500 hours, and the time of day when most mismatches occurred according to the audit data was between 1500-1600 hours (Figure 5). This may be due to staff not being particularly familiar with the use of the ORC, and there may have also been an increased period of activity around this time, which coincided with the afternoon shift commencing. Interestingly, spikes in errors occurred again in the late evening, in the early morning around handover time, and mid-morning of the following day, close to when the 24-hour data collection was scheduled to finish (see Figure 5).
Figure 5 Frequency of mismatched observations by time of day
A significant number of mismatches were identified from the audit although these findings must be viewed with caution, as these could have occurred because variables were present on the ORC, but not on the existing hospital chart (see Appendix N). A total of 3873 individual mismatches across each of the variables up to and including the fifth set of observations were identified (see Figure 6). The most frequently mismatched variables were
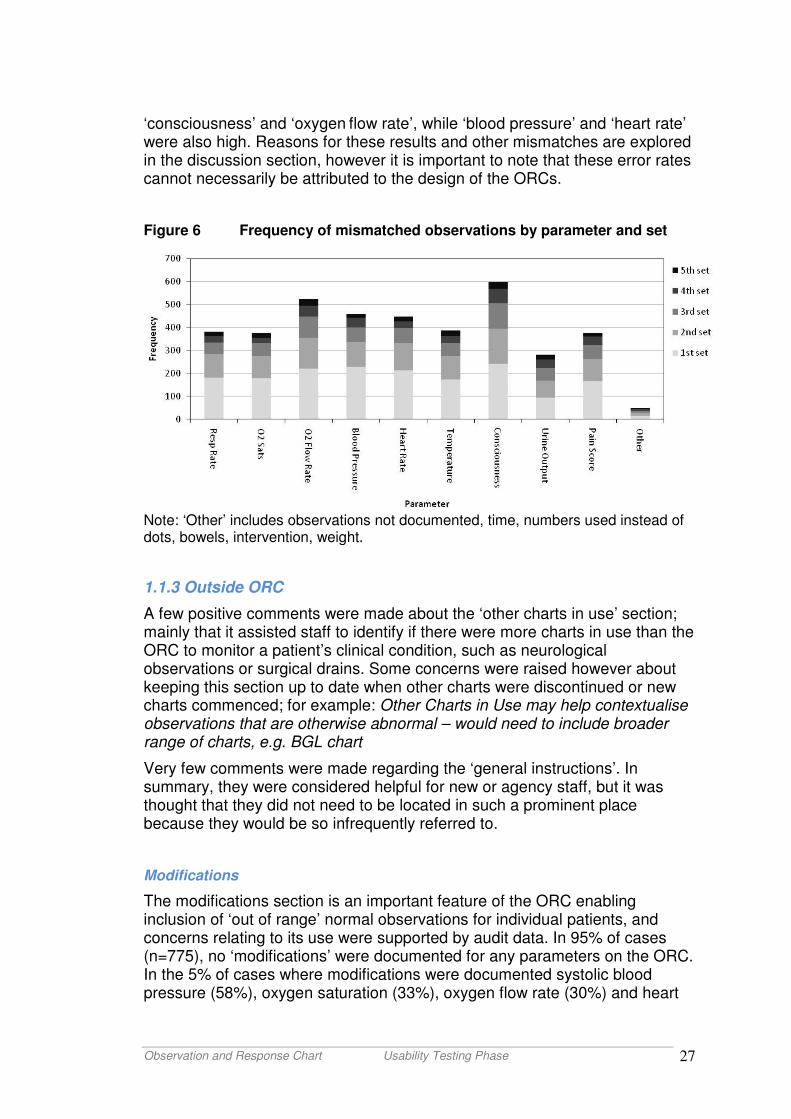
Observation and Response Chart Usability Testing Phase 27
‘consciousness’ and ‘oxygen flow rate’, while ‘blood pressure’ and ‘heart rate’ were also high. Reasons for these results and other mismatches are explored in the discussion section, however it is important to note that these error rates cannot necessarily be attributed to the design of the ORCs.
Figure 6 Frequency of mismatched observations by parameter and set
Note: ‘Other’ includes observations not documented, time, numbers used instead of dots, bowels, intervention, weight.
1.1.3 Outside ORC
A few positive comments were made about the ‘other charts in use’ section; mainly that it assisted staff to identify if there were more charts in use than the ORC to monitor a patient’s clinical condition, such as neurological observations or surgical drains. Some concerns were raised however about keeping this section up to date when other charts were discontinued or new charts commenced; for example: Other Charts in Use may help contextualise observations that are otherwise abnormal – would need to include broader range of charts, e.g. BGL chart
Very few comments were made regarding the ‘general instructions’. In summary, they were considered helpful for new or agency staff, but it was thought that they did not need to be located in such a prominent place because they would be so infrequently referred to.
Modifications
The modifications section is an important feature of the ORC enabling inclusion of ‘out of range’ normal observations for individual patients, and concerns relating to its use were supported by audit data. In 95% of cases (n=775), no ‘modifications’ were documented for any parameters on the ORC. In the 5% of cases where modifications were documented systolic blood pressure (58%), oxygen saturation (33%), oxygen flow rate (30%) and heart
Observation and Response Chart Usability Testing Phase 28
rate (30%), were the most frequently modified parameters. Temperature, consciousness, and urine output were modified in 7% of cases.
This section was the most frequently commented section from the handover debrief (n = 64). A number of positive comments noted its intent and participants thought it would be really helpful if it was used appropriately, and documented correctly. More importantly, it provided immediate access to information without having to trawl through patients’ sometimes considerable medical records to find relevant documentation. One participant noted: Hopefully the modification section will decrease the amount of inappropriate MET calls due to poor documentation by medical team.
However, there was a considerable amount of confusion about how it would actually work in practice; for example: How would modifications to yellow be distinguished from modifications to MET (purple) or other colours?
First, the current layout provided only one modification to be made to each of the vital signs parameters, and if further modifications were required a new chart would have to be commenced. Second, the validity / review period varied from 48 hours to 72 hours across the ORCs templates. While this may be appropriate for patients who have acutely changing clinical conditions, it does not accommodate chronic patients who fall within calling criteria on a daily basis. In this latter case, frequent reviews would lead to an unnecessary increase in workload. Third, there was confusion about who is responsible for completing this section. Some participants asked if there was scope for nurse-initiated modifications such as a respiratory nurse being able to document modified ranges for oxygen saturations. Finally, there was concern raised about engaging doctors to complete this section and the response a nurse would get if they asked doctors to complete it; for example:
Modification section is a good idea but doctors need to be educated so we don’t have to chase them to fill it in. Review every 72hrs won’t happen!
Intervention
In 25% of cases there was documentation in the ‘intervention’ section (see Table 8), with comments made by participants overwhelmingly positive; for example: I liked the interventions section as it makes it clear that you took action and what action you took for the observation. Gives you ownership of the vital signs you take.
While participants liked this section and thought there was great benefit, there was still considerable confusion about how to use it, and what to document. One participant was not sure if you could use the same letter twice, if the problem is the same and the action is the same do I need to write a new letter or can I just use the same letter I used before? Others found the lettering confusing i.e. A = analgesia. Several other comments and questions were about what to write in the intervention section and if it had to be recorded in the medical records as well, requiring double documentation; for example: Hard to know what to write, is it exactly the same as the action required or just what you did what was different to the action required.
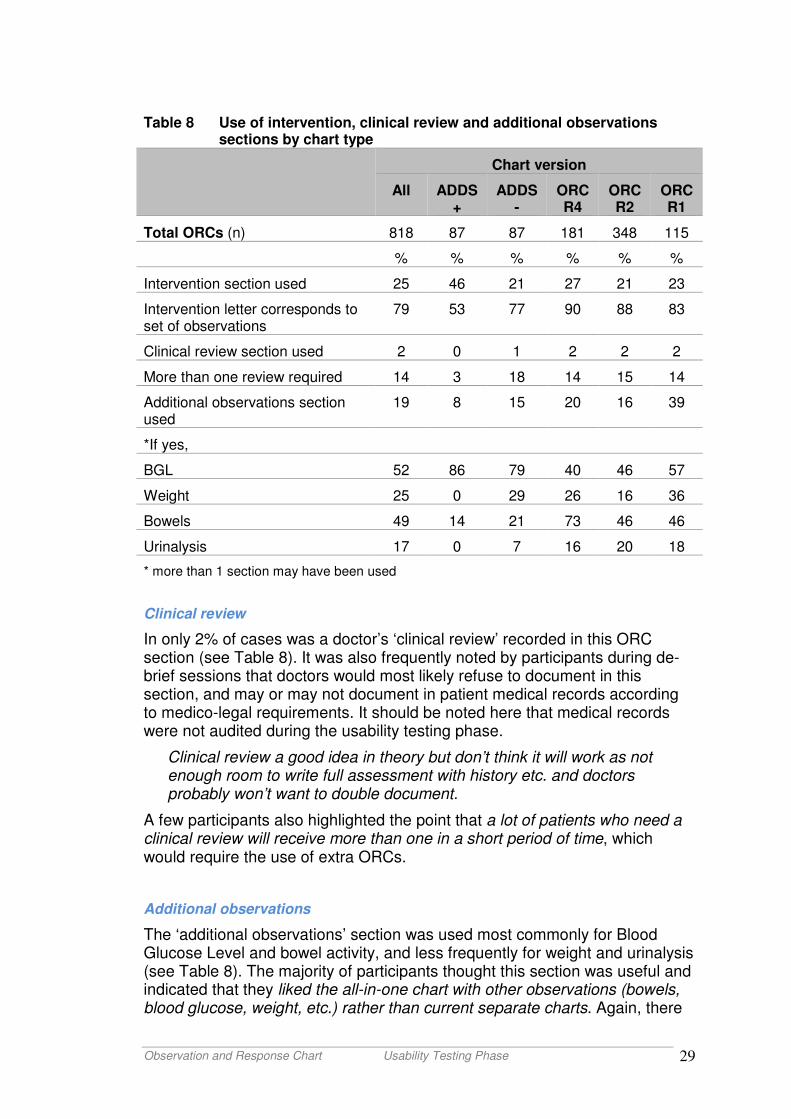
Observation and Response Chart Usability Testing Phase 29
Table 8 Use of intervention, clinical review and additional observations sections by chart type
Chart version
All ADDS +
ADDS -
ORC R4
ORC R2
ORC R1
Total ORCs (n) 818 87 87 181 348 115
% % % % % %
Intervention section used 25 46 21 27 21 23
Intervention letter corresponds to set of observations
79 53 77 90 88 83
Clinical review section used 2 0 1 2 2 2
More than one review required 14 3 18 14 15 14
Additional observations section used
19 8 15 20 16 39
*If yes,
BGL 52 86 79 40 46 57
Weight 25 0 29 26 16 36
Bowels 49 14 21 73 46 46
Urinalysis 17 0 7 16 20 18
* more than 1 section may have been used
Clinical review
In only 2% of cases was a doctor’s ‘clinical review’ recorded in this ORC section (see Table 8). It was also frequently noted by participants during de-brief sessions that doctors would most likely refuse to document in this section, and may or may not document in patient medical records according to medico-legal requirements. It should be noted here that medical records were not audited during the usability testing phase.
Clinical review a good idea in theory but don’t think it will work as not enough room to write full assessment with history etc. and doctors probably won’t want to double document.
A few participants also highlighted the point that a lot of patients who need a clinical review will receive more than one in a short period of time, which would require the use of extra ORCs.
Additional observations
The ‘additional observations’ section was used most commonly for Blood Glucose Level and bowel activity, and less frequently for weight and urinalysis (see Table 8). The majority of participants thought this section was useful and indicated that they liked the all-in-one chart with other observations (bowels, blood glucose, weight, etc.) rather than current separate charts. Again, there
Observation and Response Chart Usability Testing Phase 30
was some confusion about how to use this section mainly relating to frequency of recording observations, especially the blood glucose level, and that it may lead to double documenting again; as commented:
Unsure about blood glucose level - is this one off or is this regular? – need to specify.
1.2 Suitability of ORC as a prompt for responding to episodes of clinical deterioration
This usability testing phase examined the ORC to examine suitability for prompting or triggering a response to episodes of clinical deterioration. Details of actions taken, if required, were only collected if recorded on the ORC. The aim of this objective was to test the usability of the ORC, not the impact or patient outcomes (to be explored in the pilot phase), and medical records were therefore not audited.
1.2.1 General layout
Eighty percent (80%) of respondents agreed that the ORCs helped to identify when a patient is at risk, a finding consistent across each version of the ORC (see Table 4). This positive response was further supported by 76% of respondents acknowledging that the ORC aids management of the deteriorating patient, and enables effective clinical handover of the patient’s condition (74%). In particular, the ADDS+ (EWS) system received a high number of positive responses, for supporting the management of the deteriorating patient (87%), including the scoring system (blood pressure table; (83%). The ADDS- system received slightly less positive responses (63%). The ADDS- and R1 had the lowest agreement across the ORC versions for the colours identifying a patient at risk (74% and 72%, respectively).
One comment was however noted from a participant that the ADDS scoring system failed to trigger a clinical review for a patient when it was required; One doctor phoned for post op bleeding but did not get an ADD score for this. Note that the ADDS chart does not include fluid or volume loss in the scoring system except for Urine Output. While other versions of the ORCs also do not document fluid / blood loss in the charting area, other response options are provided for ‘increased or unexpected fluid or blood loss’ in the ‘response criteria and actions required’ section. This fluid loss should also be identified with correct documentation on a fluid balance chart.
1.2.2 Inside ORC
The ‘Response Criteria’ and ‘Actions Required’ are printed next to the charting area on the ORC, highlighting their importance to the functioning of a track and trigger system. When recorded vital signs fall within certain parameters a
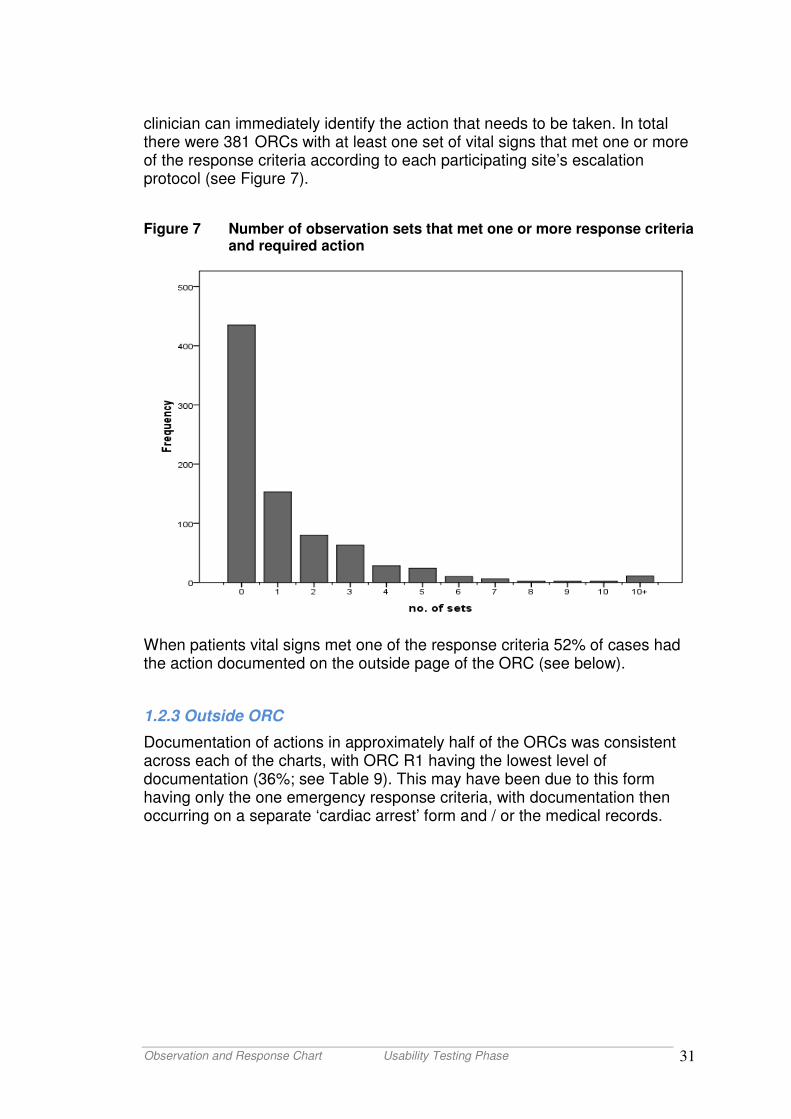
Observation and Response Chart Usability Testing Phase 31
clinician can immediately identify the action that needs to be taken. In total there were 381 ORCs with at least one set of vital signs that met one or more of the response criteria according to each participating site’s escalation protocol (see Figure 7).
Figure 7 Number of observation sets that met one or more response criteria and required action
When patients vital signs met one of the response criteria 52% of cases had the action documented on the outside page of the ORC (see below).
1.2.3 Outside ORC
Documentation of actions in approximately half of the ORCs was consistent across each of the charts, with ORC R1 having the lowest level of documentation (36%; see Table 9). This may have been due to this form having only the one emergency response criteria, with documentation then occurring on a separate ‘cardiac arrest’ form and / or the medical records.
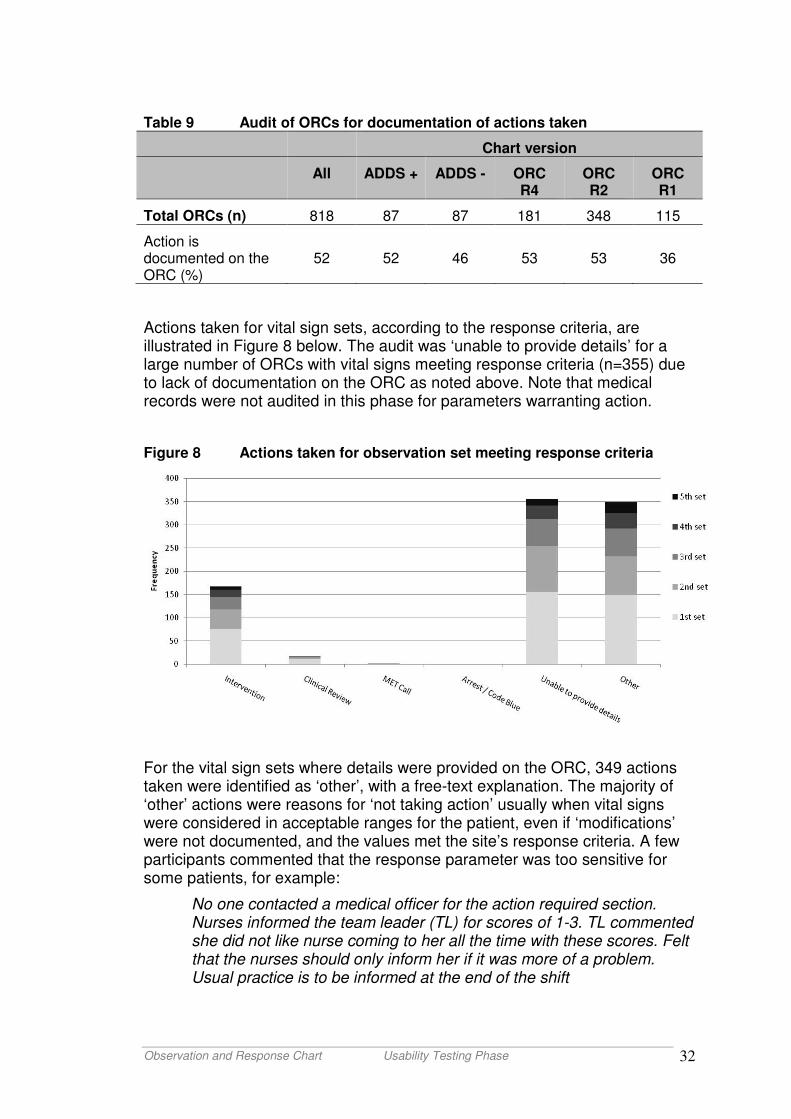
Observation and Response Chart Usability Testing Phase 32
Table 9 Audit of ORCs for documentation of actions taken
Chart version
All ADDS + ADDS - ORC R4
ORC R2
ORC R1
Total ORCs (n) 818 87 87 181 348 115
Action is documented on the ORC (%)
52 52 46 53 53 36
Actions taken for vital sign sets, according to the response criteria, are illustrated in Figure 8 below. The audit was ‘unable to provide details’ for a large number of ORCs with vital signs meeting response criteria (n=355) due to lack of documentation on the ORC as noted above. Note that medical records were not audited in this phase for parameters warranting action.
Figure 8 Actions taken for observation set meeting response criteria
For the vital sign sets where details were provided on the ORC, 349 actions taken were identified as ‘other’, with a free-text explanation. The majority of ‘other’ actions were reasons for ‘not taking action’ usually when vital signs were considered in acceptable ranges for the patient, even if ‘modifications’ were not documented, and the values met the site’s response criteria. A few participants commented that the response parameter was too sensitive for some patients, for example:
No one contacted a medical officer for the action required section. Nurses informed the team leader (TL) for scores of 1-3. TL commented she did not like nurse coming to her all the time with these scores. Felt that the nurses should only inform her if it was more of a problem. Usual practice is to be informed at the end of the shift
Observation and Response Chart Usability Testing Phase 33
Coloured band too quick to trigger a review and or unnecessary level of response. Need to go through channels and full process so all responses should be the same but have some sort of guide as to when to expedite the escalation
Another participant thought that an oxygen saturation of 95% in yellow is not warranted – in fact I recorded in the >95% to avoid having to report.
The remaining ‘other’ actions were either an ‘intervention’ or a ‘medical review’. Only two sets of observations throughout the data collection period required a ‘MET’ call and none required an ‘arrest / code call’.
Summary – suitability for documenting and as a prompt in clinical deterioration
The majority of participants found the ORCs to be usable in clinical practice, with high acceptance for language, style and size of text. Three-quarters of participants agreed that the charts enabled effective handover and aided in the management of a deteriorating patient. The colours for response codes were generally well supported, although there were some concerns with delineation of shades of yellow-orange for the charts with numerous colours (e.g. ADDS, R4).
The structure and layout of the A3-sized form with a left binding margin, and an off-centre fold from the right, generated some concerns for users, particularly when using A4-sized folders or clipboards that are commonly located at the foot of a patient’s bed.
Compliance with documentation instructions for the 9 variables in the charting area was mixed. Dots were placed in the centre of the square in just over half of the charts, but were not connected by lines in 60%. Arrows were used for blood pressure consistently well, but the systolic and diastolic arrows were connected by a dotted line in only just over half the time. Documenting of consciousness and pain score (81%) was consistently high, while urine output was documented for less than half of the charts. Historical practice of writing numerical values into the chart sections was evident. Participants were concerned about the precision of documenting a range (sometimes of 10 mmHg for Blood Pressure), particularly for the parameters respiratory rate, O2 saturation, O2 flow rate, blood pressure, heart rate, and temperature. Compliance for documentation of Consciousness and Pain were high, but participants were unsure about how to document to Urine Output. Use of vertical bold lines every 3 columns in the charting area was also confusing for participants. All of these issues will require specific information and training during implementation of the ORCs into practice, with a need to highlight the rationale for documentation from a human factors perspective.
The ADDS chart versions were used by only one site each, and so findings were viewed cautiously because of the small sample sizes. Participants were generally positive of these versions, particularly the chart with the blood pressure table for scoring abnormal values (ADDS +).
Observation and Response Chart Usability Testing Phase 34
The need for dual documentation of observations resulted in a range of actual documentation practices that may have influenced the mismatches between charts, and so these results were also viewed with caution.
The remaining ORC sections received mostly positive feedback; ‘Other Charts In Use’, ‘Modifications’ sections were used and viewed positively, with some minor concerns noted by users. The ‘General Instructions’ were also useful, but perhaps mostly for new or agency staff. Interestingly however, the instructions included the need for use of symbols (dots, arrows, and connecting lines) for documentation, which often had low levels of compliance. The ‘Intervention’ was used in only one quarter of cases, but was viewed as a positive feature, although there was some confusion about the ‘coding’ letters. A ‘Clinical Review’ was used in only a small number of cases, with the assumption that doctors wrote any review in the patient medical records. The ‘Additional Observations’ section was used mostly for Blood Glucose Level and Bowel activity. Some related issues are also addressed in Objectives 2 and 3, below.
As a prompt for responding to clinical deterioration, the ORCs were viewed positively, with high agreement for patient identification, managing deterioration, and enabling effective handover. The ADDS+ version had the highest approval. Of note, no ORC version can identify ‘increased or unexpected fluid or blood loss’ in the charting area, and so other charts (such as Fluid Balance) are required as adjuncts to the ORC.
Documentation of actions were noted on the ORCs in only half of the cases,when a response was indicated, with most documentation probably continuing to be in the patient’s medical records. No arrests were called, and only two abnormal observation sets required a ‘MET’ call for this sample.
Observation and Response Chart Usability Testing Phase 35
Objective 2: Identification of any sections for modification
As identified from some of the results from Objective 1, a range of comments and suggestions were noted regarding possible modifications to the ORC forms.
2.1 General layout
Chart format
Suggestions were made by participants about the layout, format, and size of the ORCs. A common theme was that nurses wanted one chart to replace other charts.
Many comments related to folding of the ORC and how it was difficult to fit in the folder. For example, It’s difficult to use in our current folders as unable to unfold it without removing from folder, and also noted some difficulty with chart in current folder as having to pull chart out from clip to write on. Others commented that the chart was “too big” or “too cumbersome, found the chart hard to fold to fit into the bedside folder, and felt that an A4 page would be much more suitable. Of concern, one comment noted, All the charts have ripped out already because of the size. Another comment noted, Overall the ORC feels organised but I didn’t look at back as it was folded over. One project officer observed, To document on the ORC the nurse took the chart out of the folder and used the bedside table.
It was observed by project officers that nearly all ORCs had been folded back so that “Action” instructions were not visible at the same time as the charting grid. This also meant the ‘back’ of the ORC was now the ’inside’ pages and was rarely opened or looked at. It was observed that an RN was unable to find bowels, weight section in extra observations, as both sides of back and front look similar, and depending how charts were folded the back and front was different. Subsequent investigations suggested that it may be due to the pages being folded in the middle rather than maintaining the left margin. Some charts were refolded and hole-punched in the middle, but most were also still folded back on themselves. The usual observation chart is a single A4 page. Further suggestions were made, to design the chart similar to the National Inpatient Medication Chart (NIMC), including:
• Need to have front page shorter like drug charts so it works in the folders
• Make it the same as med chart (NIMC) with back page higher to allow chart to open while still in folder
• Please put design chart as national drug chart.
Some suggestions were made to move sections to different areas of the ORC. For example, Observation chart to be separate from clinical review and modifications chart. Other comments were, Might be good to have the Additional observations & interventions on same page and then modifications & Clinical review on the other, and The BSL would be better where the Consciousness is and vice versa.
Observation and Response Chart Usability Testing Phase 36
2.2 Inside ORC
As noted for Objective 1, the inside of the ORC (or the ‘documentation’ side of form) includes the following sections:
• Charting area (left, ‘documentation’ side)
• Modifications in use tick box
• Response criteria
Suggestions for modifications for these sections identified from the data are discussed below:
Observation charting area
Comments about the observation charting area were overwhelmingly positive because the vitals don’t overlap like on our current chart. Most participants agreed that separate parameters made it clearer to read and easy to see trends in the patient’s clinical condition. However, certain aspects of the charting requirements such as parameter values and use of dots raised some issues.
Value ranges and use of dots
As discussed in Objective 1, other comments were made about ranges being too wide to illustrate deterioration in a patient’s clinical condition. Whilst participants agreed the vital sign section is much clearer but needs some major adjusting when it comes to ranges, there were also mixed opinions over dots – most liked the graph idea but felt they needed to write numbers to achieve accuracy. This caused participants to document the actual figure rather than place a dot to graph a patient’s vital signs.
Parameters where ranges caused the most issues were respiration rate, O2
saturations, O2 flow rate, and temperature. Again, participants wanted to write numbers rather than dots because it is difficult to tell if O2 flow rate is increasing using dots, also writing the number particularly for temp is more appropriate. Other concerns were raised about the range for respirations 9-20 – too broad as large difference between the two and the difference between 21 and 30 maybe significant. Suggestions were also made for a legend to identify the oxygen delivery device such as room air, nasal prongs, Hudson Mask, Hi-Flow CPAP, re-breather.
Participants also raised specific concerns about the precision and practicality of ranges used for blood pressure and heart rate, especially when reporting to other members of the clinical team about a patient’s condition. It has been common practice for many years to document and report exact figures and would require a significant change in practice culture for health professionals to accept the use of ranges in daily practice. Comments included:
Need to able to distinguish between 110 or 115 for the pulse etc
Blood pressure and heart rates increments of 5 instead of 10
Scoring not in increments of 10 but in 5’s e.g. BP 90 or 99 –large difference when deciding to give GTN
Observation and Response Chart Usability Testing Phase 37
Suggestions were made by participants to increase the precision of the ranges by placing a faint horizontal line across the graphing area to indicate the midpoint of the range. For example, again staff commented on the lack of specificity with the SBP but understood we were looking “at a trend”. The current chart has many small lines which they felt was better.
Some comments related to not being able to document cardiac rhythm and lying / standing blood pressure, for example:
When HR >100 should specify in legend to document regular / irregular; need more clarification
The chart does not distinguish whether the heart rate is irregular
Don’t think lying & standing blood pressure would be clear especially as a difference of 19 (e.g. 100 – 119).
Urine output section
A significant number of suggestions were made for urine output, such as changing recording to per shift / change mls to HPU / NPU / add IDC, void in toilet, incontinent / need option to indicate patients do not void with every observation. Other participants did not recognise the benefits of monitoring urine output and suggested that it is removed from chart or replaced with bowels. Many suggested the inclusion of a fluid balance total or summary and that a legend would be useful for IDC, voided in toilet, incontinent.
Modifications in use tick box
As noted for Objective 1, this tick box feature was not commonly used, even when modifications were documented on the ORC. No suggestions were noted from participants.
Response criteria
As noted for Objective 1, while some participants noted this section’s usefulness, others suggested that it should be removed with a laminated version placed in the bedside folder, to allow for additional columns in the graphing area.
2.3 Outside ORC
Suggestions for modifications for the ‘Other charts in use’, ‘General instructions’ and ‘Modifications’ sections are discussed below:
Other charts in use
For the majority of ORCs ‘other charts in use’ were not indicated in this section (83%; n=679). Other charts in use that were identified were predominantly fluid balance (n=104) and neurological / neurovascular charts (n=50), which comprised one-half and one-quarter of all other indicated charts in use respectively. Additional charts in use were pain/epidural/PCA (n=23), diabetic / blood glucose level (n=11), anticoagulant (n=8), limbs (n=3), alcohol
Observation and Response Chart Usability Testing Phase 38
withdrawal (n=2). Other charts where only one instance of use was indicated included food, NFR, frequent observations, insulin infusion and bowels.
Some staff considered this section useful because they felt that ‘other charts in use’ may help contextualise observations that are otherwise abnormal – would need to include broader range of charts, e.g. BGL chart. Another participant commented that ‘other charts in use’ is a great idea, just need to get in the habit of using it.
Other participants however, found this section unnecessary and thought it would be difficult to keep up to date because it can change from day to day. Not many staff saw value in the ‘Other Charts in Use’ section – concern that if chart had been discontinued or wrong box ticked that a lot of time could be wasted looking for something that doesn’t exist. Staff also thought that this section is already captured in care plan and therefore not needed.
General instructions
As noted earlier in Objective 1, there were very few participant comments related to this section. One suggestion was to re-locate to a less prominent position as they were referred to infrequently.
Modifications
Participants made a number of comments about the modifications section, as noted in Objective 1. The main issue was only having enough room to document one modification per ORC, which meant a new chart would have to be used, if further modifications were required, and before the observation charting area was fully utilised. Concerns relating to the review period of 72 hours for modifications were raised for example, someone with COPD whose oxygen saturation is never above 80% shouldn’t have to have modification reviewed every 72hrs, it’s a waste of resources, and the ORC needs to be able to make a modification stand for the whole admission.
Alternative suggestions were made to offer different review periods such as writing the end times, having a tick box for review at 72 hours, 1 week or for the duration of stay. Another suggestion was to develop a separate modifications sheet. A few participants commented on the ‘modifications in use’ tick box next to the charting area and that they would rather see a tick box next to each parameter rather than an overall tick box. Another participant asked if it would be possible to have NFR status on the chart.
Interventions
The overall feedback on the ‘interventions section’ was very positive, as noted in Objective 1. However, several participants suggested relocating this section to the same page as the observations charting area so that documentation relating to observations could be easily viewed without having to turn the page.
Other requests were made to increase the space for writing in because we do a lot of interventions for the one patient so this section will not be big enough. There are also potentially 18 interventions (sets of observations) on the ORC versus only 8 lines to write interventions in.
Observation and Response Chart Usability Testing Phase 39
Many helpful comments were made to improve the usability of this section in relation to the coding letter that connects the set of observations with the documented intervention or action. There was evidence of lack of understanding about what to document and how to use the coding. One AIN asked what ‘A’ in interventions stood for as ‘A’ has been documented in all columns, AIN thought ‘A’ stood for alert and so numbers were recommended instead. However, this may cause confusion with the ADDS scoring ORCs.
Clinical review
As noted earlier, some participants highlighted that patients who need a clinical review will receive more than one in a short period of time, which would require the use of extra ORCs.
Additional observations
Participants made a number of positive comments about the potential benefits of the additional observation section on the ORC, as discussed in Objective 1. There were few suggestions made to increase the area size for recording blood glucose level, and to move this section to the main observation graphing area. Other suggestions were made to move the additional observations section to the middle with the other observations and replace the general instructions. Frequent requests were made to incorporate more observations into this section to save having multiple charts. These include limb observations and GCS score; dressing observations and drain tube recording; IV resite due; PICC, CVC; a blank section to personalise observation data for pt – e.g. surg/med thoracic with chest drains or large abdomen with drain tubes, daily girth measurements; epidural and PCA observations; IV insertion dates, drain insertion, NG insertion date and FBC summary; and TPN chart. One of the more common issues appeared to be that clinical specialities have created charts to record observations specific to their areas for example,
This chart is not working on this ward (neurosurgery), as we need a neurological observations chart
Removal of sections
Participants were asked to identify if any of the following sections could be removed. There were 313 participants who responded to this section; the majority indicated that urine output could be removed (n=154). Other sections with lower responses include interventions (n=31), consciousness (n=30), modifications in use (n=22), response criteria and actions required (n=19), pain (n=16), and O2 flow rate (n=10). Twenty-six respondents indicated that no sections should be removed from the chart.
Observation and Response Chart Usability Testing Phase 40
Summary – potential chart modifications
Based on results from this section, a list of potential modifications to the ORC versions were developed (see below), and were discussed at a meeting with representatives from the Commission, the Human Factors team from the University of Queensland, and the ORC Project team from UTS. The outcomes of that meeting in relation to both modifications and education are reported in the Discussion section. The list of potential chart modifications, in chart sections or areas, were:
Charting area
• Remove vertical bold lines or move to 4 / 6 columns
• Delete rows above first emergency call line to create more space to narrow parameters
• Increase the precision for each parameter by using faint horizontal lines (i.e. at 5 bpm / mmHg)
• Remove ‘modifications in use’ tick box and locate one next to each parameter
• Parameter value ranges to be narrower so trend is clearly seen when changes occur (e.g. respiratory rate, O2 saturations, O2 flow, temperature)
• Add O2 delivery method
Response Criteria and Actions Required
• Move ‘response criteria and actions required’ section to back page
• Clear guidelines that should NOT repeat what is already in graphing area to action
Other charts in use
• Delete ‘other charts in use’ section
Modifications
• Separate each box so that modified parameters are documented individually, as all vital signs won’t necessarily be modified at the same time
• Develop specific training information for ‘modifications’ section
Interventions
• Relocate ‘interventions’ section to charting area / page
• Add date, time, signature / initials for each comment in interventions
• Provide guidelines on how and what to document i.e. actions taken relevant to vital signs
• Additional rows to be added to ‘intervention’ sections
Urine Output
• Remove urine output section
• Change to fluid balance chart (FBC) trigger
• Does patient require FBC as well
• Need to be able to document HNPU, PUIT, IDC
• Add fluid balance summary to front or back of chart
Observation and Response Chart Usability Testing Phase 41
General layout
• Move fold / binding to centre of ORC
• Add page numbers
• Move instructions to back at bottom of chart
Clinical Review
• Remove review undertaken section
• Add extra ‘review requested’ sections so that nurse can document when request made
Additional Observations
• Move blood glucose level to charting area
• Keep weight & bowels documentation
• Add sections for additional observations
Other
• Develop educational tools – how to use ORC
• Generate consensus on the required precision for documentation for observation values
• Standardise values for response system triggers
• Consider development of additional standard charts that complement the ORC and lead to a harmonised suite of national observation charts
• Use of term ‘heart rate’ in charts, when actual observational parameter is most commonly measurement of ‘pulse rate’
These issues were explored with the human factors group – see later ‘Discussion’ section.
Observation and Response Chart Usability Testing Phase 42
Objective 3: Application to practice with minimal training
3.1 General
As noted in the Methods, the intent from the Commission was for the ORC versions to be used in practice with minimal training. Some views on training from the participants were explored in the use survey (see below).
ORC user training
Table 10 describes previous experiences and the education and training provided prior to the ORC trial. Most respondents (78%) had not used a type of observation and response chart in practice prior to the ORC Project. Formal education was provided by site-based project officers to 61% of respondents, and overall the training provided was considered helpful and useful for 98% of respondents. After a short trial period of 24-hours per ward, where staff would have used the ORC for only one or two shifts, almost two-thirds of respondents (63%) noted a preference for using the ORC instead of their current observation chart, and a significant majority (88%) felt confident in completing the ORC.
There appeared however to be some lack of clarity about what an observation and response chart is. One site already had a type of track and trigger observation chart in use, but 50% of respondents indicated that they had not used an ORC prior to the trial.
Overall, with respondents noting that the education was helpful prior to using the ORC, this suggests there is a requirement for education and training prior to implementation. Some of these issues were highlighted in relation to possible modifications to the ORCs (see Objective 2).
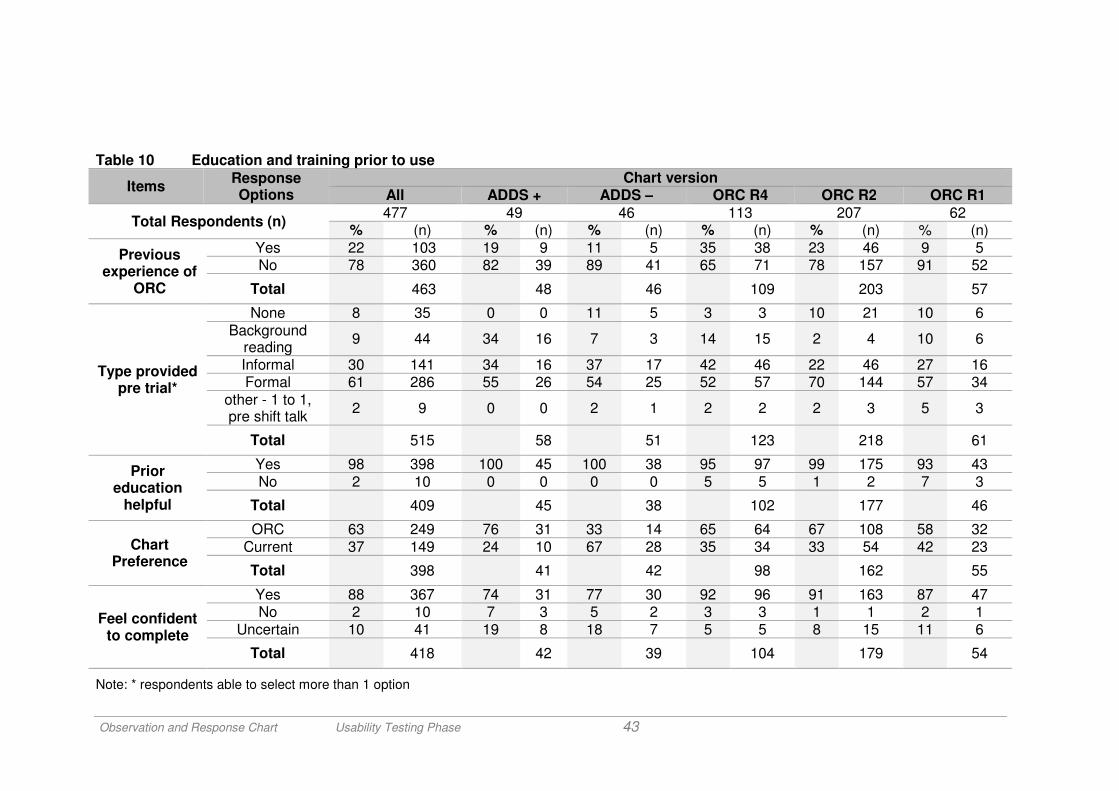
Observation and Response Chart Usability Testing Phase 43
Table 10 Education and training prior to use
Items Response Options
Chart version All ADDS + ADDS – ORC R4 ORC R2 ORC R1
Total Respondents (n) 477 49 46 113 207 62
% (n) % (n) % (n) % (n) % (n) % (n)
Previous experience of
ORC
Yes 22 103 19 9 11 5 35 38 23 46 9 5 No 78 360 82 39 89 41 65 71 78 157 91 52
Total 463 48 46 109 203 57
Type provided pre trial*
None 8 35 0 0 11 5 3 3 10 21 10 6 Background
reading 9 44 34 16 7 3 14 15 2 4 10 6
Informal 30 141 34 16 37 17 42 46 22 46 27 16 Formal 61 286 55 26 54 25 52 57 70 144 57 34
other - 1 to 1, pre shift talk
2 9 0 0 2 1 2 2 2 3 5 3
Total 515 58 51 123 218 61
Prior education
helpful
Yes 98 398 100 45 100 38 95 97 99 175 93 43 No 2 10 0 0 0 0 5 5 1 2 7 3
Total 409 45 38 102 177 46
Chart Preference
ORC 63 249 76 31 33 14 65 64 67 108 58 32 Current 37 149 24 10 67 28 35 34 33 54 42 23
Total 398 41 42 98 162 55
Feel confident to complete
Yes 88 367 74 31 77 30 92 96 91 163 87 47 No 2 10 7 3 5 2 3 3 1 1 2 1
Uncertain 10 41 19 8 18 7 5 5 8 15 11 6
Total 418 42 39 104 179 54
Note: * respondents able to select more than 1 option
Observation and Response Chart Usability Testing Phase 44
3.2 Inside ORC
This section focuses on the charting area section, where most issues were identified. Little further information in relation to training was evident for the other sections including the ADDS scoring, blood pressure table; response criteria and action required; and modifications in use tick box.
Observation charting area
As noted previously, there were a number of compliance issues related to correct documentation of vital signs, and applying human factors principles, to minimise risk where errors in detecting clinical deterioration often occur. These issues can be improved with further information and training.
Blood pressure
A number of comments were directed specifically at the recording of blood pressure. Some staff stated that the chart needs to have clear information on how to complete the blood pressure section; and several staff required clarification about the documenting of systolic blood pressure in the coloured zone, the reason why should be more evident, one other participant stated they were uncertain how to document blood pressure and how to score.
There was frequent confusion about the response required for a blood pressure in the coloured zone and that it needs to be clearer that this is for systolic blood pressure and not diastolic. A number of participants commented similarly that:
The purple shading is confusing with regards the blood pressure variable on the ORC, is the shading for systolic or diastolic blood pressure?
It is not clear that it is systolic only in purple section for an emergency call
3.3 Outside ORC
This section focuses on the modifications and interventions sections, where some training or information issues were identified. Little further information was evident for the other sections – general instructions, clinical reviews, additional observations.
Modifications
There was clear evidence of the need for further instructions and guidance for staff and how to document in the modifications section. Participants frequently asked what to do when patient’s vital signs fall outside the modifications and how to distinguish between modifications in different coloured zones. Other respondents were unsure about what to do if more modifications need to be made.
Observation and Response Chart Usability Testing Phase 45
Interventions
Similarly, many participants also requested guidelines on what to document and how to use the intervention section, asking if it was necessary to double-document in the case notes. There was some confusion relating to the use of capital letters to code the intervention record linked to the set of abnormal observations for example, what does A, B, C, D, E mean? and that more clarification is needed.
Summary – training needs
The majority of respondents were using an observation and response chart in practice for the first time. After this short trial, two-thirds of participants preferred the ORC compared to their usual hospital chart, and a significant majority felt confident in completing the chart. Formal education was provided for most of the participants, and overall the training provided was helpful and useful for almost all of the respondents. With the respondents identifying the education as helpful prior to using the ORC, there is clear a requirement for education and training prior to implementation.
As noted in the summary for Objective 2, the list of potential modifications to the ORC versions developed also had implications for information and training for correct and effective use of the charts in clinical practice. The education issues are reported in the following Discussion section.
Observation and Response Chart Usability Testing Phase 46
5. Discussion
Major Findings
In relation to the three stated study objectives, overall findings indicated that 1) the majority of participants found the ORCs to be usable in clinical practice, and suitable as a prompt for observed clinical deterioration; 2) some sections of the ORCs were identified for modifications; and 3) the ORCs can be implemented with some specific information and training.
The structure and layout of the A3-sized form with a left binding margin and an off-centre fold, generated some concerns for users, as did the use of bold lines in the charting area. There was strong acceptance for language, style and size of text, with participants agreeing that the charts enabled effective handover and aided in the management of a deteriorating patient. The colours for response codes were generally well supported. Two-thirds of respondents noted a preference for using the ORC compared to their current observation chart.
Compliance with charting according to instructions was mixed. Existing practices of writing numerical values, and concerns about the precision of documenting a range, may require a broad and systemic cultural change, and is noted in some recommendations to the Commission below. Some aspects in relation to implementation of the ORCs during the pilot phase will be managed through information and training resources (also noted below). Participants were generally positive of the ADDS chart versions, although only one site each used these, so findings were viewed cautiously.
Remaining ORC sections received mostly positive feedback. Other charts were documented as not in use for the majority of cases. Fluid balance and neurological / neurovascular charts comprised one-half and one-quarter of the other charts in use, respectively. Systolic blood pressure, oxygen saturation, oxygen flow rate and heart rate were the most common parameters modified in the ‘modifications in use’ section. The intervention section was used in one-quarter of the cases. Additional observation sections were used commonly for glucose level, bowel activity and weight.
As a prompt for responding to clinical deterioration, the ORCs were viewed positively, with high agreement for patient identification, managing deterioration, and enabling effective handover. The ADDS+ version had the highest approval. Documentation of actions was noted on the ORCs in only half of the cases. There were no arrests, and only two abnormal observation sets required a ‘MET’ call during this data collection.
Issues were identified for possible modification of the following sections: Charting area, ‘Response Criteria and Actions Required’, ‘Other Charts In Use’, ‘Modifications’, ‘Interventions’, ‘Urine Output’, general layout, ‘Clinical Review’, ‘Additional Observations’, and other issues.
The majority of respondents used an observation and response chart in practice for the first time. Formal education was provided for most of the participants, and overall the training provided was helpful and useful for almost all of the respondents. With respondents identifying the education as
Observation and Response Chart Usability Testing Phase 47
helpful prior to using the ORC, there is clear a requirement for education and training prior to implementation.
Overall, the findings indicated that some modifications would be of benefit, and more detailed information and training is required to enable optimal compliance with documentation instructions. These instructions are based on human factors principles and evidence from safety science literature. These issues are explored further in the following sections.
Modifications to ORC templates
As noted previously from the results for Objective 2, findings from this usability testing in the clinical environment generated some suggestions for review and potential modifications for the ORC version templates. The outcomes of a meeting with representatives from the Commission, the Human Factors team from the University of Queensland, and the ORC Project team from UTS on the 26th October 2011, relating to both modifications and education are reported in Appendix O. In summary, the following modifications were implemented:
1. There is a maximum 56 rows available to document the 9 variables on the ORC template (the minimum row height of 3.60 mm in the chart area enables a dot or arrow to be used without contributing to cognitive overload)
2. The ‘modifications in use’ tick box removed 3. Section heading revised to ‘Other Observation Charts In Use’ 4. The ‘modifications’ to observation values section enables up to 4
modifications to be documented and signed for by the treating doctor 5. Section heading revised to ‘Interventions Associated With Abnormal Vital
Signs’ 6. Lower case letters (e.g. ‘a’) replace upper case letter for coding
interventions 7. Additional rows added for ‘interventions’ (now 8, from 5) 8. Chart pages labelled in footer as ‘inside left page’ (charting area), ‘inside
right page’ (information page; not for writing), ‘front page’ (documentation of ‘other observation charts in use’ and ‘modifications’), and ‘back page’ (documentation of ‘Interventions Associated with Abnormal Vital Signs’, ‘Clinical Review Requests’, and ‘Additional Observations’)
9. ‘Clinical review’ section removed 10. ‘Clinical review requests’ section enables 3 requests to be documented
(up from 1)
Additional issues that are not core components of the ORC templates, but could be modified to meet individual site needs are also noted below. These modifications would need to replace an existing section, so that no more than 9 variables are documented:
1. Add oxygen (02) delivery device / method, or alternatively could be documented in the ‘interventions’ section of the ORC
Observation and Response Chart Usability Testing Phase 48
2. Urine output in charting area can be modified for ORC versions to indicate ‘yes’ or ‘no’ for urination during a timeframe of the charting area. Note that for the ADDS versions, urine output is a criteria in the ADDS scoring system, and is to be retained
3. Blood Glucose Level remains in the ‘Additional Observations’ section of the templates, but could replace one of the 9 variables in the charting area; specific blood glucose / insulin administration charts to be used if a patient requires frequent monitoring
Study limitations
A number of limitations were noted:
1. The data collection period of 24 hours per ward was selected to minimise participant burden (primarily nursing staff), particularly in relation to the need for dual documentation of observations on the hospital’s usual chart as well as the selected ORC. This collection time resulted in only a short period of time for the chart to be used in practice. A longer data collection period may have provided a different scope and pattern or responses, as participants became more familiar and confident with using the ORC.
2. The 24-hour cycle of data collection was designed to enable involvement and feedback from night-duty staff. While 22% of our participants worked a night shift during data collection, there were higher numbers of participants working day or evening shifts. Again, a longer data collection would have potentially involved more staff working nights. Importantly however, the charts and specifically the colours for coding responses appeared to be appropriate for use in low-light contexts such as night duty.
3. Instructions for the dual documentation of existing observation charts and the trial ORCs included contemporaneous completion. In practice, variations to this were observed, which may have unduly influenced the accuracy of documentation when comparing charts.
4. Versions of the charts were not directly compared to each other in sites. While this was not the aim of the study, it also limited ability to identify any preference for a particular version of the ORC suite of charts.
Implications for Practice
The study procedure reflected the intent from the Commission that the ORCs be implemented with minimal training. The ‘general instructions’ section of the forms were included in the usability testing, and retained for future versions of the templates. These instructions included the use of dots placed in a charting square that reflected a value range for the measured variable (e.g. 10 beats / minute for heart rate), arrows to denote systolic and diastolic blood pressure, and dotted lines to connect the data points to highlight variations and patterns for each of the 9 variables in the charting area.
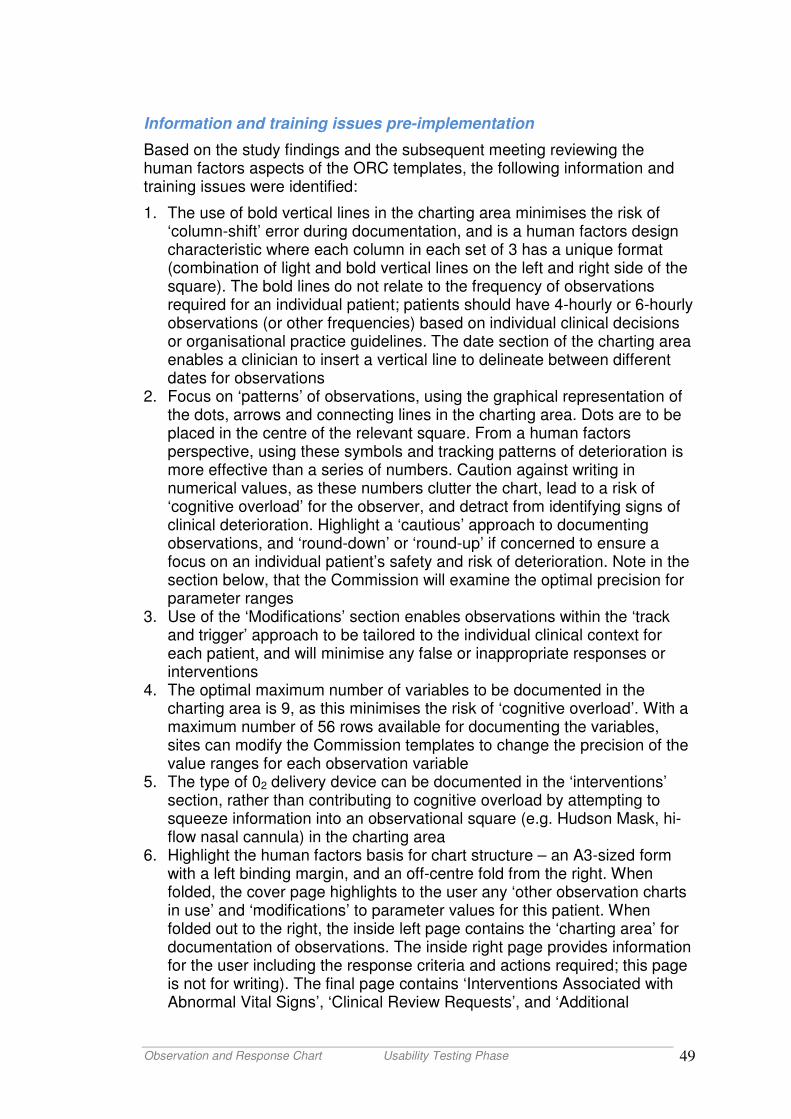
Observation and Response Chart Usability Testing Phase 49
Information and training issues pre-implementation
Based on the study findings and the subsequent meeting reviewing the human factors aspects of the ORC templates, the following information and training issues were identified:
1. The use of bold vertical lines in the charting area minimises the risk of ‘column-shift’ error during documentation, and is a human factors design characteristic where each column in each set of 3 has a unique format (combination of light and bold vertical lines on the left and right side of the square). The bold lines do not relate to the frequency of observations required for an individual patient; patients should have 4-hourly or 6-hourly observations (or other frequencies) based on individual clinical decisions or organisational practice guidelines. The date section of the charting area enables a clinician to insert a vertical line to delineate between different dates for observations
2. Focus on ‘patterns’ of observations, using the graphical representation of the dots, arrows and connecting lines in the charting area. Dots are to be placed in the centre of the relevant square. From a human factors perspective, using these symbols and tracking patterns of deterioration is more effective than a series of numbers. Caution against writing in numerical values, as these numbers clutter the chart, lead to a risk of ‘cognitive overload’ for the observer, and detract from identifying signs of clinical deterioration. Highlight a ‘cautious’ approach to documenting observations, and ‘round-down’ or ‘round-up’ if concerned to ensure a focus on an individual patient’s safety and risk of deterioration. Note in the section below, that the Commission will examine the optimal precision for parameter ranges
3. Use of the ‘Modifications’ section enables observations within the ‘track and trigger’ approach to be tailored to the individual clinical context for each patient, and will minimise any false or inappropriate responses or interventions
4. The optimal maximum number of variables to be documented in the charting area is 9, as this minimises the risk of ‘cognitive overload’. With a maximum number of 56 rows available for documenting the variables, sites can modify the Commission templates to change the precision of the value ranges for each observation variable
5. The type of 02 delivery device can be documented in the ‘interventions’ section, rather than contributing to cognitive overload by attempting to squeeze information into an observational square (e.g. Hudson Mask, hi-flow nasal cannula) in the charting area
6. Highlight the human factors basis for chart structure – an A3-sized form with a left binding margin, and an off-centre fold from the right. When folded, the cover page highlights to the user any ‘other observation charts in use’ and ‘modifications’ to parameter values for this patient. When folded out to the right, the inside left page contains the ‘charting area’ for documentation of observations. The inside right page provides information for the user including the response criteria and actions required; this page is not for writing). The final page contains ‘Interventions Associated with Abnormal Vital Signs’, ‘Clinical Review Requests’, and ‘Additional
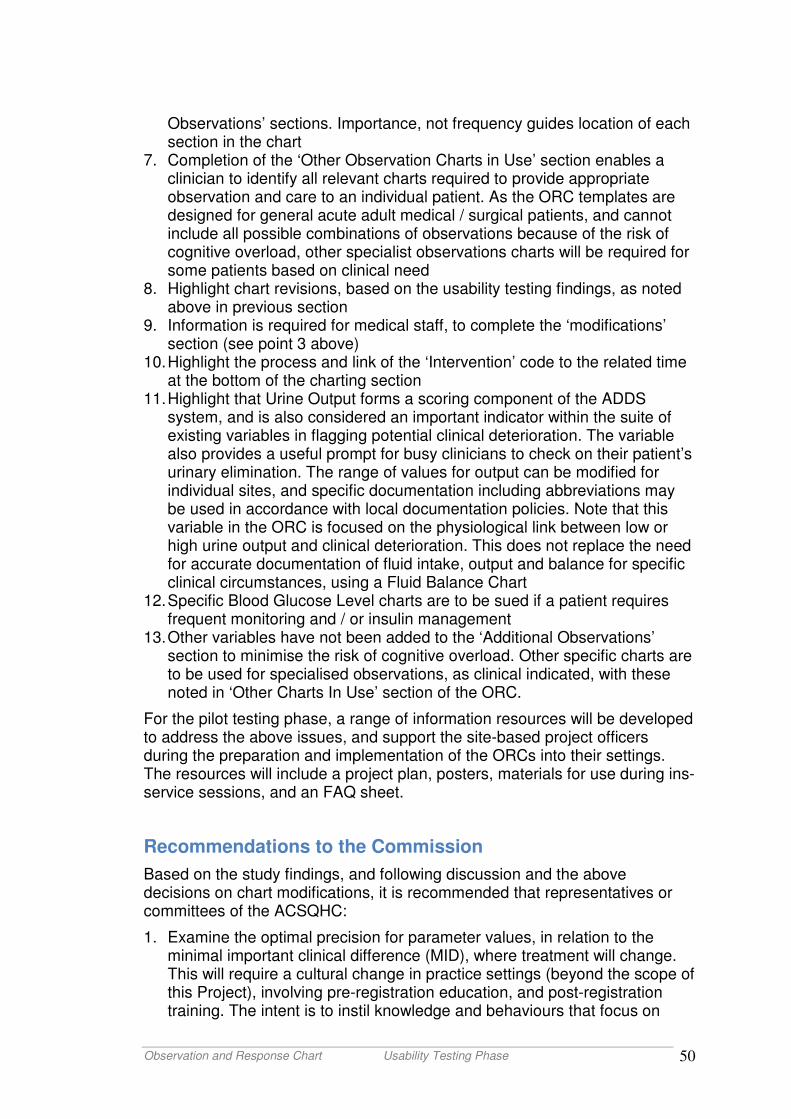
Observation and Response Chart Usability Testing Phase 50
Observations’ sections. Importance, not frequency guides location of each section in the chart
7. Completion of the ‘Other Observation Charts in Use’ section enables a clinician to identify all relevant charts required to provide appropriate observation and care to an individual patient. As the ORC templates are designed for general acute adult medical / surgical patients, and cannot include all possible combinations of observations because of the risk of cognitive overload, other specialist observations charts will be required for some patients based on clinical need
8. Highlight chart revisions, based on the usability testing findings, as noted above in previous section
9. Information is required for medical staff, to complete the ‘modifications’ section (see point 3 above)
10. Highlight the process and link of the ‘Intervention’ code to the related time at the bottom of the charting section
11. Highlight that Urine Output forms a scoring component of the ADDS system, and is also considered an important indicator within the suite of existing variables in flagging potential clinical deterioration. The variable also provides a useful prompt for busy clinicians to check on their patient’s urinary elimination. The range of values for output can be modified for individual sites, and specific documentation including abbreviations may be used in accordance with local documentation policies. Note that this variable in the ORC is focused on the physiological link between low or high urine output and clinical deterioration. This does not replace the need for accurate documentation of fluid intake, output and balance for specific clinical circumstances, using a Fluid Balance Chart
12. Specific Blood Glucose Level charts are to be sued if a patient requires frequent monitoring and / or insulin management
13. Other variables have not been added to the ‘Additional Observations’ section to minimise the risk of cognitive overload. Other specific charts are to be used for specialised observations, as clinical indicated, with these noted in ‘Other Charts In Use’ section of the ORC.
For the pilot testing phase, a range of information resources will be developed to address the above issues, and support the site-based project officers during the preparation and implementation of the ORCs into their settings. The resources will include a project plan, posters, materials for use during ins-service sessions, and an FAQ sheet.
Recommendations to the Commission
Based on the study findings, and following discussion and the above decisions on chart modifications, it is recommended that representatives or committees of the ACSQHC:
1. Examine the optimal precision for parameter values, in relation to the minimal important clinical difference (MID), where treatment will change. This will require a cultural change in practice settings (beyond the scope of this Project), involving pre-registration education, and post-registration training. The intent is to instil knowledge and behaviours that focus on
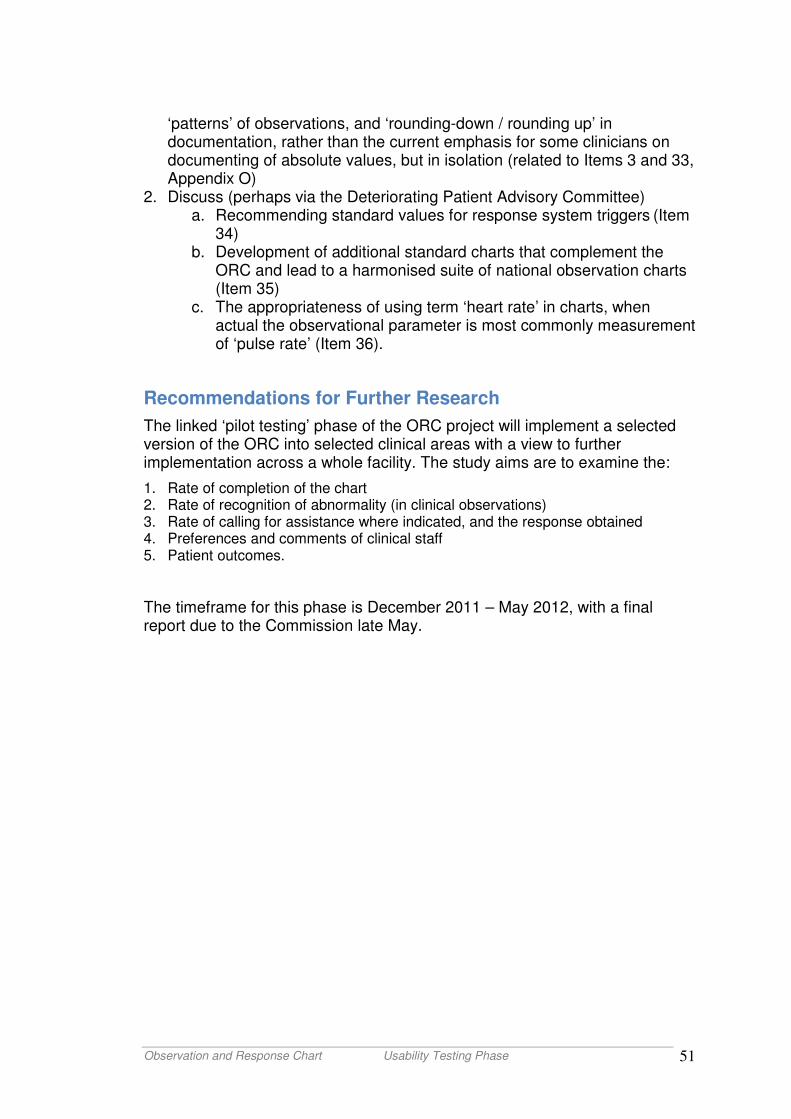
Observation and Response Chart Usability Testing Phase 51
‘patterns’ of observations, and ‘rounding-down / rounding up’ in documentation, rather than the current emphasis for some clinicians on documenting of absolute values, but in isolation (related to Items 3 and 33, Appendix O)
2. Discuss (perhaps via the Deteriorating Patient Advisory Committee) a. Recommending standard values for response system triggers (Item
34) b. Development of additional standard charts that complement the
ORC and lead to a harmonised suite of national observation charts (Item 35)
c. The appropriateness of using term ‘heart rate’ in charts, when actual the observational parameter is most commonly measurement of ‘pulse rate’ (Item 36).
Recommendations for Further Research
The linked ‘pilot testing’ phase of the ORC project will implement a selected version of the ORC into selected clinical areas with a view to further implementation across a whole facility. The study aims are to examine the:
1. Rate of completion of the chart 2. Rate of recognition of abnormality (in clinical observations) 3. Rate of calling for assistance where indicated, and the response obtained 4. Preferences and comments of clinical staff 5. Patient outcomes.
The timeframe for this phase is December 2011 – May 2012, with a final report due to the Commission late May.
Observation and Response Chart Usability Testing Phase 52
6. Conclusions
This study of 10 clinical sites examined the usability of 5 versions of ORCs, each selected to reflect the track and trigger systems used in each of the hospitals. The ORCs were trialled in a total of 36 adult acute medical / surgical wards across 108 shifts, involving 623 mainly nurse participants. Chart reviews were conducted for 818 patients, user surveys were completed by 477 respondents, shift debrief sessions were recorded, and observations of documentation practices were documented in field notes from the site-based project officers.
Overall, clinical usability of the ORCs was confirmed. A number of modifications to the chart templates were implemented, based on the study findings. Information and training issues were also identified, to improve the usability and compliance with documentation, to improve the detection and response for patients with clinical deterioration.
Observation and Response Chart Usability Testing Phase 53
References
Australian Commission on Safety and Quality in Health Care [ACSQHC]. Evidence-based adult general observation chart 2011 Available at: http://www.safetyandquality.gov.au/internet/safety/publishing.nsf/Content/RaRtCD_EBA-GOC accessed 23 November 2011
Australian Commission on Safety and Quality in Health Care [ACSQHC]. Recognising and Responding to Clinical Deterioration 2010
Australian Commission on Safety and Quality in Health Care [ACSQHC]. National consensus statement: essential elements for recognising and responding to clinical deterioration 2009
Preece MHW, Hill A, Horswill MS, Dunbar N, Adams LM, Stephens J-AL, Christofidis MJ, Watson MO. Developer’s Guide for Observation and Response Charts. School of Psychology, The University or Queensland; Australian Commission on Safety and Quality in Health Care 2010
Observation and Response Chart Usability Testing Phase 54
Appendices
Appendix A: ORC versions
Figure A1 ORC ‘R1’ 1 response level
Figure A2 ORC ‘R2’ 2 response levels
Figure A3 ORC ‘R4’ 4 response levels
Figure A4 ADDS - without blood pressure table
Figure A5 ADDS + with blood pressure table
Figure A6 Reverse (information) side, all versions
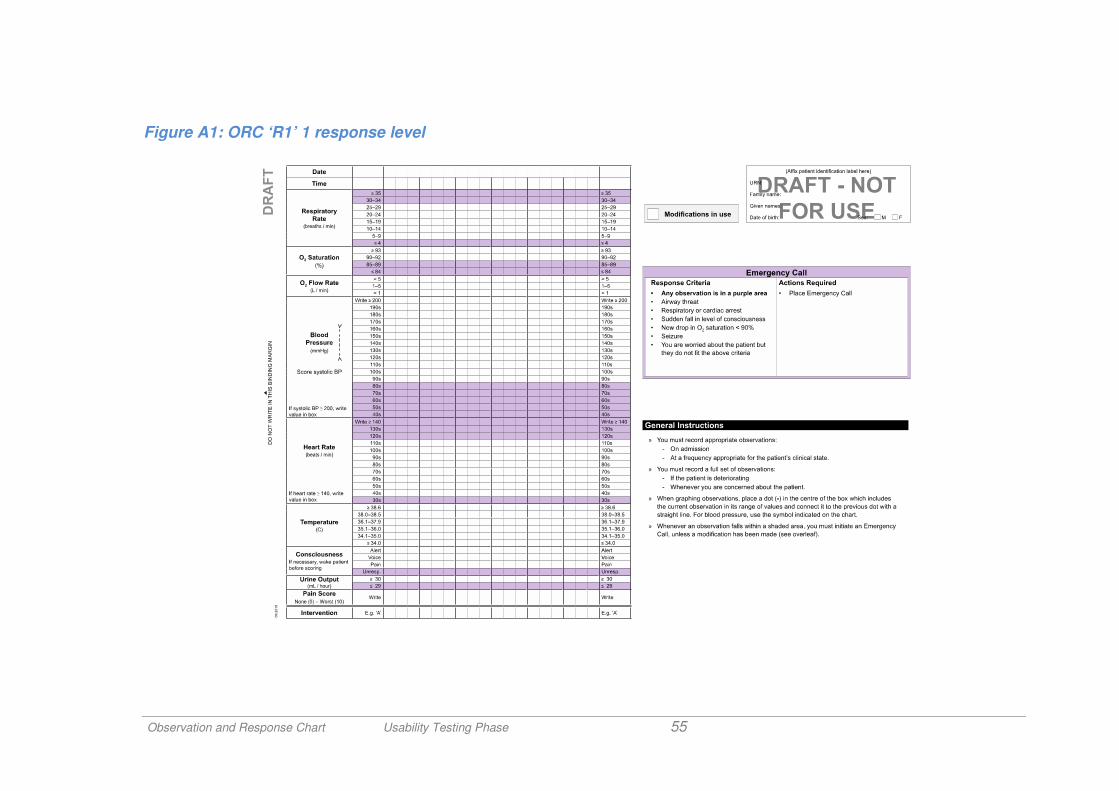
Observation and Response Chart Usability Testing Phase 55
Figure A1: ORC ‘R1’ 1 response level
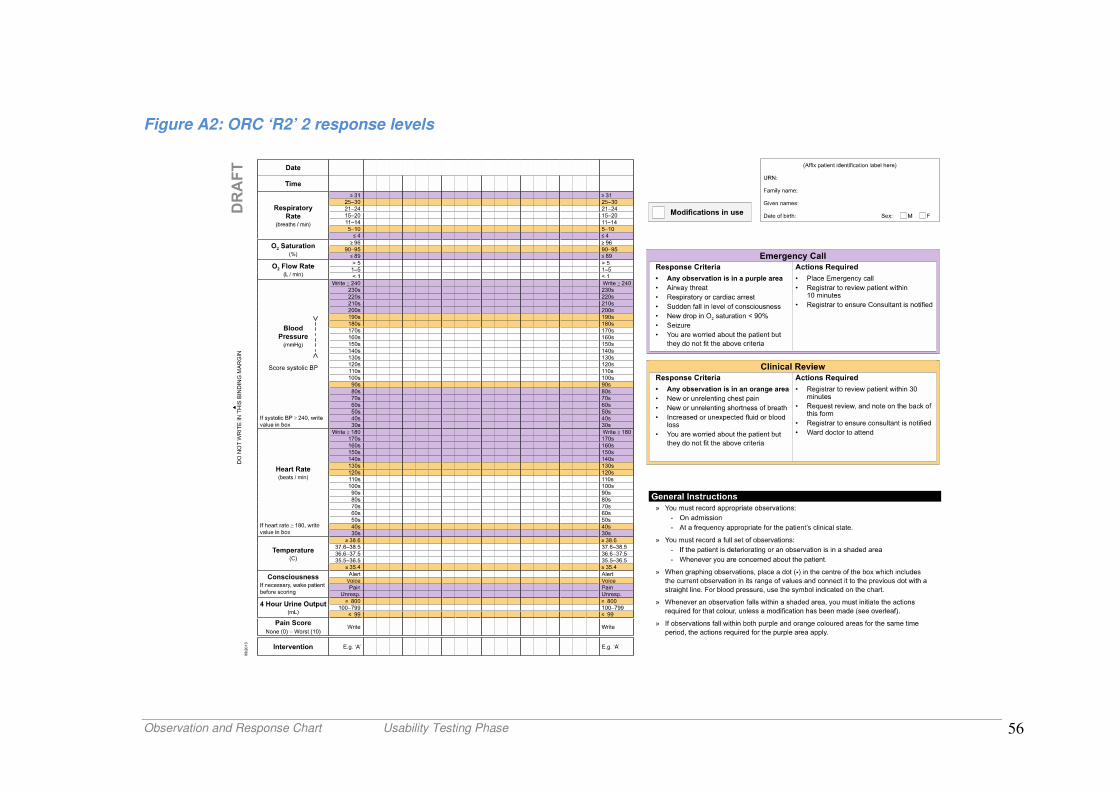
Observation and Response Chart Usability Testing Phase 56
Figure A2: ORC ‘R2’ 2 response levels
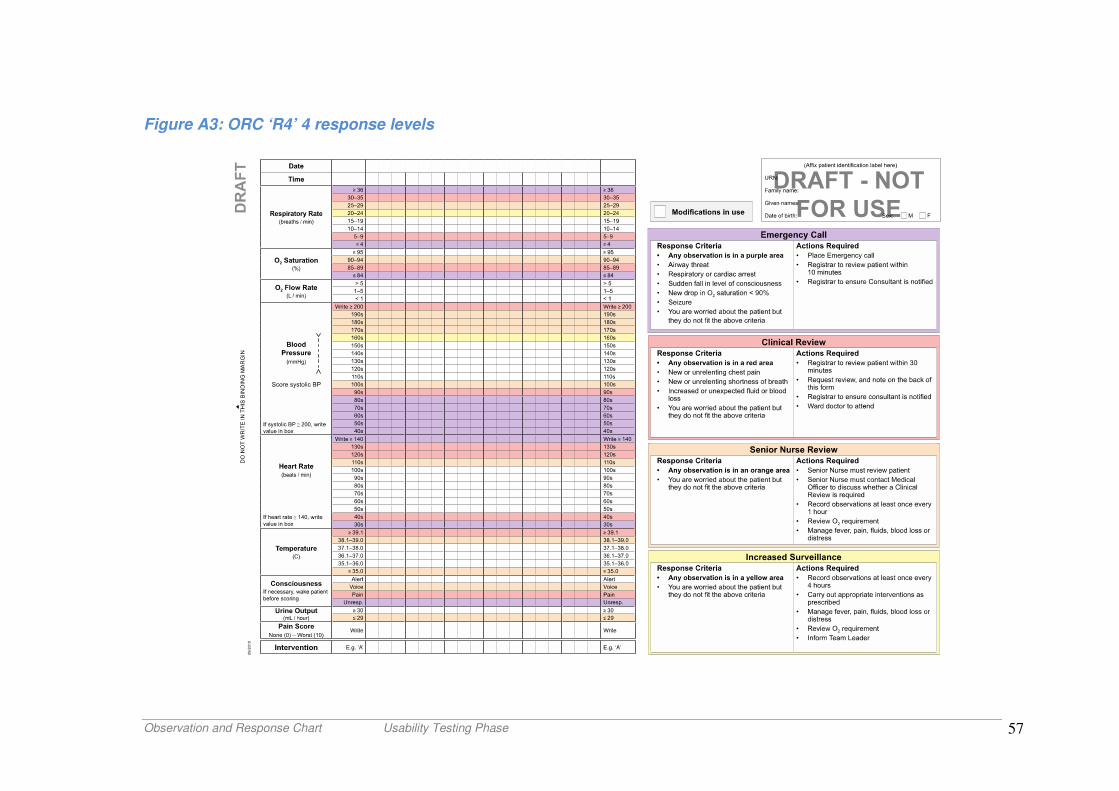
Observation and Response Chart Usability Testing Phase 57
Figure A3: ORC ‘R4’ 4 response levels
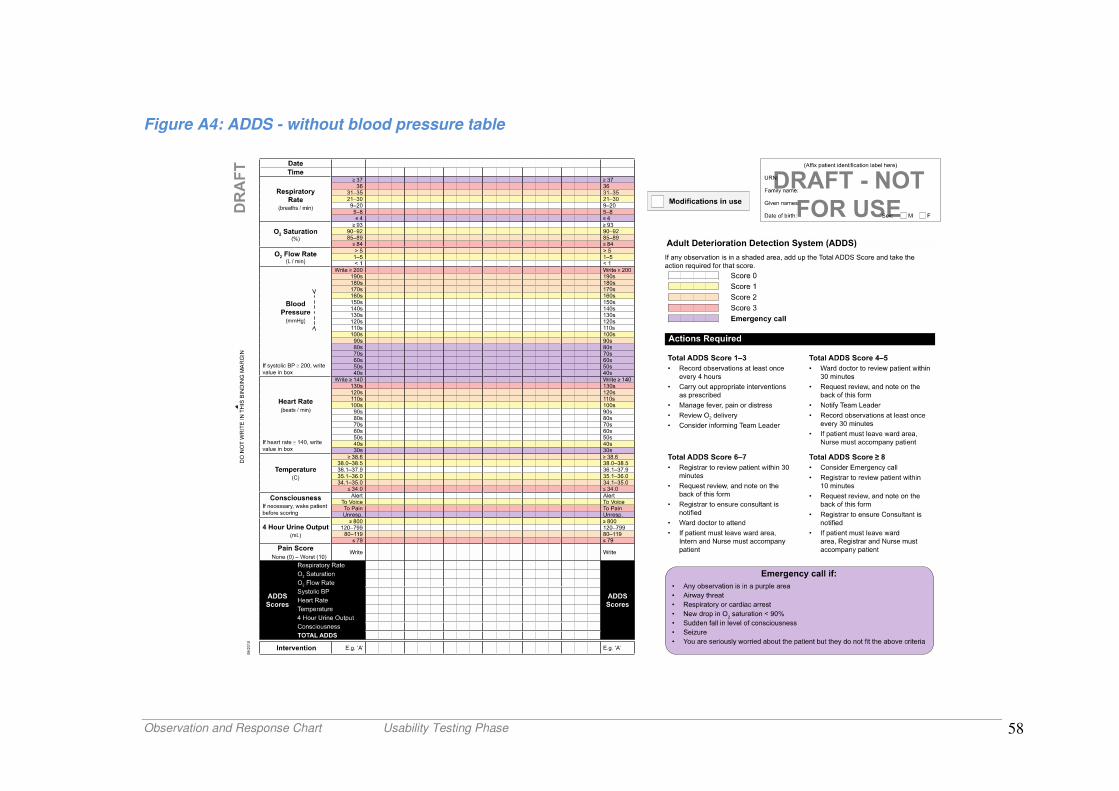
Observation and Response Chart Usability Testing Phase 58
Figure A4: ADDS - without blood pressure table
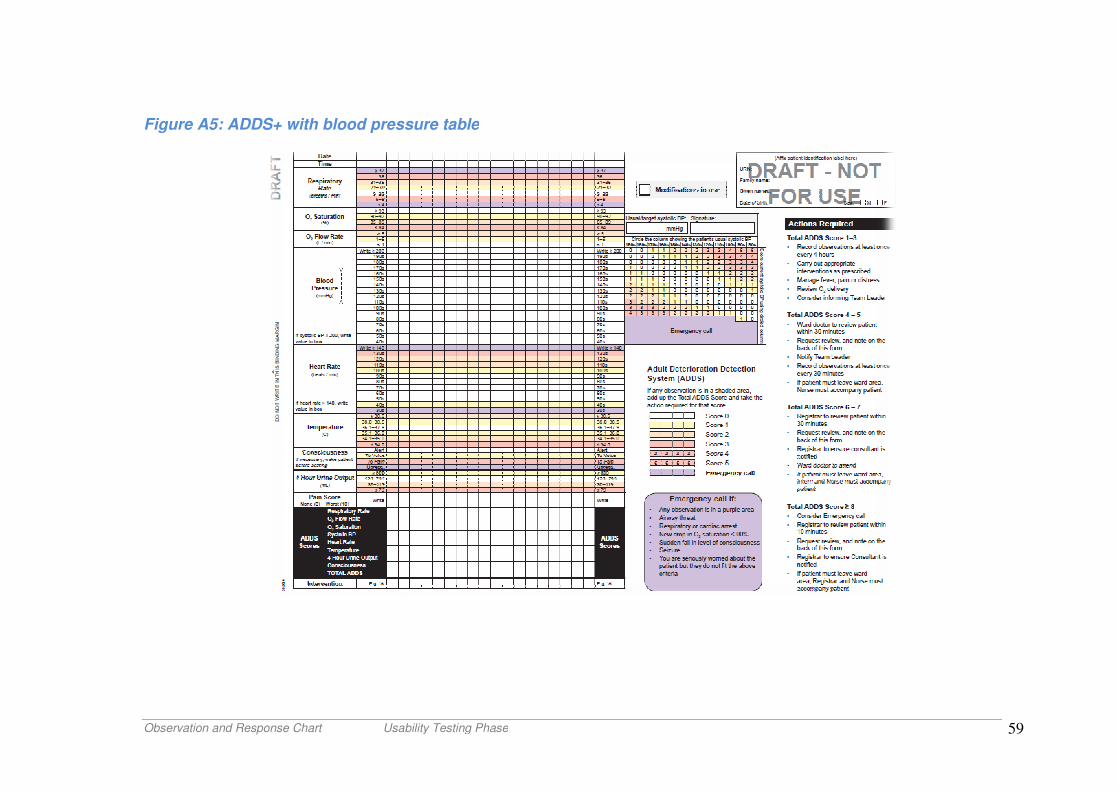
Observation and Response Chart Usability Testing Phase
Figure A5: ADDS+ with blood pressure table
Usability Testing Phase
ADDS+ with blood pressure table
59
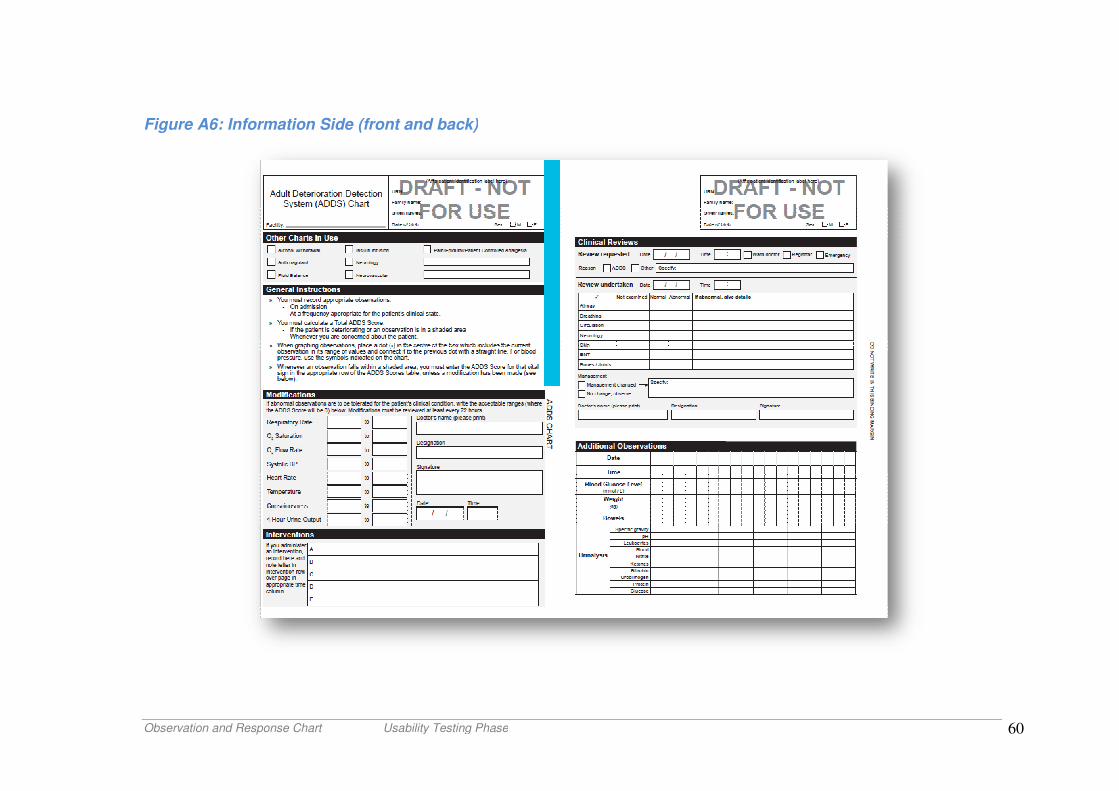
Observation and Response Chart Usability Testing Phase
Figure A6: Information Side (front and back)
Usability Testing Phase
(front and back)
60
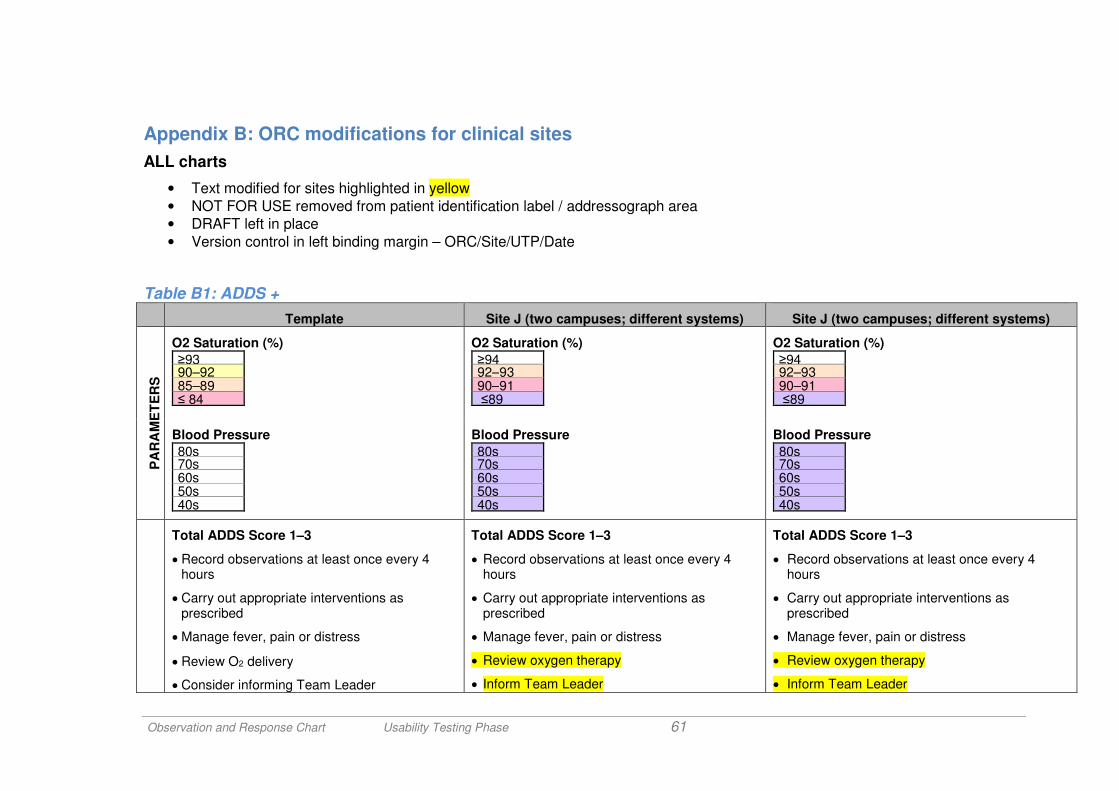
Observation and Response Chart Usability Testing Phase 61
Appendix B: ORC modifications for clinical sites
ALL charts
• Text modified for sites highlighted in yellow
• NOT FOR USE removed from patient identification label / addressograph area
• DRAFT left in place
• Version control in left binding margin – ORC/Site/UTP/Date
Table B1: ADDS +
Template Site J (two campuses; different systems) Site J (two campuses; different systems)
PA
RA
ME
TE
RS
O2 Saturation (%)
≥93 90–92 85–89 ≤ 84
O2 Saturation (%)
≥94 92–93 90–91 ≤89
O2 Saturation (%)
≥94 92–93 90–91 ≤89
Blood Pressure
80s 70s 60s 50s 40s
Blood Pressure
80s 70s 60s 50s 40s
Blood Pressure
80s 70s 60s 50s 40s
Total ADDS Score 1–3
• Record observations at least once every 4 hours
• Carry out appropriate interventions as prescribed
• Manage fever, pain or distress
• Review O2 delivery
• Consider informing Team Leader
Total ADDS Score 1–3
• Record observations at least once every 4 hours
• Carry out appropriate interventions as prescribed
• Manage fever, pain or distress
• Review oxygen therapy
• Inform Team Leader
Total ADDS Score 1–3
• Record observations at least once every 4 hours
• Carry out appropriate interventions as prescribed
• Manage fever, pain or distress
• Review oxygen therapy
• Inform Team Leader
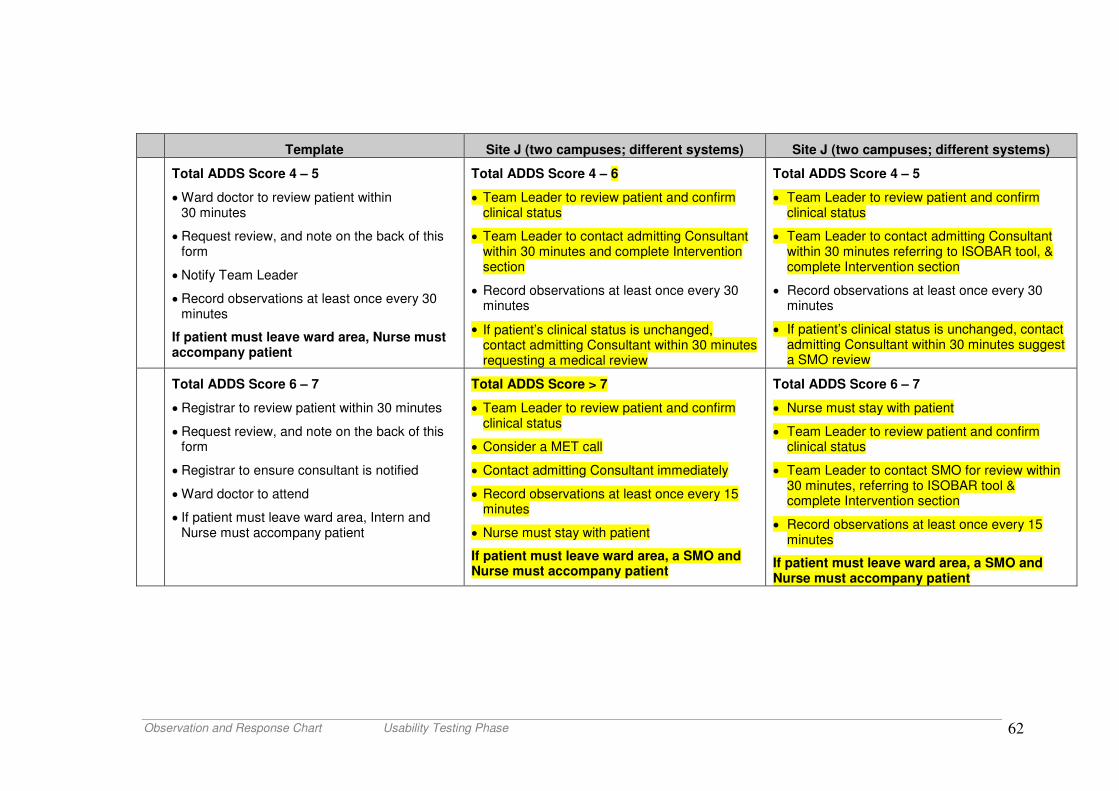
Observation and Response Chart Usability Testing Phase 62
Template Site J (two campuses; different systems) Site J (two campuses; different systems)
Total ADDS Score 4 – 5
• Ward doctor to review patient within 30 minutes
• Request review, and note on the back of this form
• Notify Team Leader
• Record observations at least once every 30 minutes
If patient must leave ward area, Nurse must accompany patient
Total ADDS Score 4 – 6
• Team Leader to review patient and confirm clinical status
• Team Leader to contact admitting Consultant within 30 minutes and complete Intervention section
• Record observations at least once every 30 minutes
• If patient’s clinical status is unchanged, contact admitting Consultant within 30 minutes requesting a medical review
Total ADDS Score 4 – 5
• Team Leader to review patient and confirm clinical status
• Team Leader to contact admitting Consultant within 30 minutes referring to ISOBAR tool, & complete Intervention section
• Record observations at least once every 30 minutes
• If patient’s clinical status is unchanged, contact admitting Consultant within 30 minutes suggest a SMO review
Total ADDS Score 6 – 7
• Registrar to review patient within 30 minutes
• Request review, and note on the back of this form
• Registrar to ensure consultant is notified
• Ward doctor to attend
• If patient must leave ward area, Intern and Nurse must accompany patient
Total ADDS Score > 7
• Team Leader to review patient and confirm clinical status
• Consider a MET call
• Contact admitting Consultant immediately
• Record observations at least once every 15 minutes
• Nurse must stay with patient
If patient must leave ward area, a SMO and Nurse must accompany patient
Total ADDS Score 6 – 7
• Nurse must stay with patient
• Team Leader to review patient and confirm clinical status
• Team Leader to contact SMO for review within 30 minutes, referring to ISOBAR tool & complete Intervention section
• Record observations at least once every 15 minutes
If patient must leave ward area, a SMO and Nurse must accompany patient
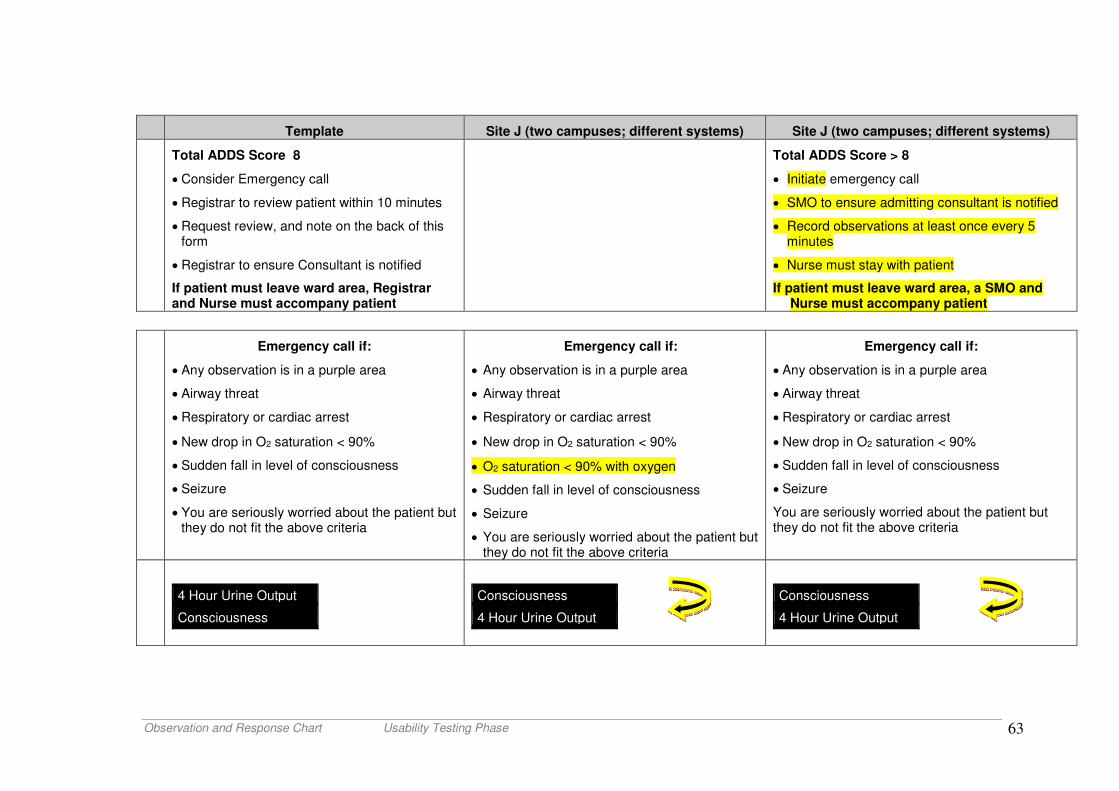
Observation and Response Chart Usability Testing Phase 63
Template Site J (two campuses; different systems) Site J (two campuses; different systems)
Total ADDS Score 8
• Consider Emergency call
• Registrar to review patient within 10 minutes
• Request review, and note on the back of this form
• Registrar to ensure Consultant is notified
If patient must leave ward area, Registrar and Nurse must accompany patient
Total ADDS Score > 8
• Initiate emergency call
• SMO to ensure admitting consultant is notified
• Record observations at least once every 5 minutes
• Nurse must stay with patient
If patient must leave ward area, a SMO and Nurse must accompany patient
Emergency call if:
• Any observation is in a purple area
• Airway threat
• Respiratory or cardiac arrest
• New drop in O2 saturation < 90%
• Sudden fall in level of consciousness
• Seizure
• You are seriously worried about the patient but they do not fit the above criteria
Emergency call if:
• Any observation is in a purple area
• Airway threat
• Respiratory or cardiac arrest
• New drop in O2 saturation < 90%
• O2 saturation < 90% with oxygen
• Sudden fall in level of consciousness
• Seizure
• You are seriously worried about the patient but they do not fit the above criteria
Emergency call if:
• Any observation is in a purple area
• Airway threat
• Respiratory or cardiac arrest
• New drop in O2 saturation < 90%
• Sudden fall in level of consciousness
• Seizure
You are seriously worried about the patient but they do not fit the above criteria
4 Hour Urine Output
Consciousness
Consciousness
4 Hour Urine Output
Consciousness
4 Hour Urine Output
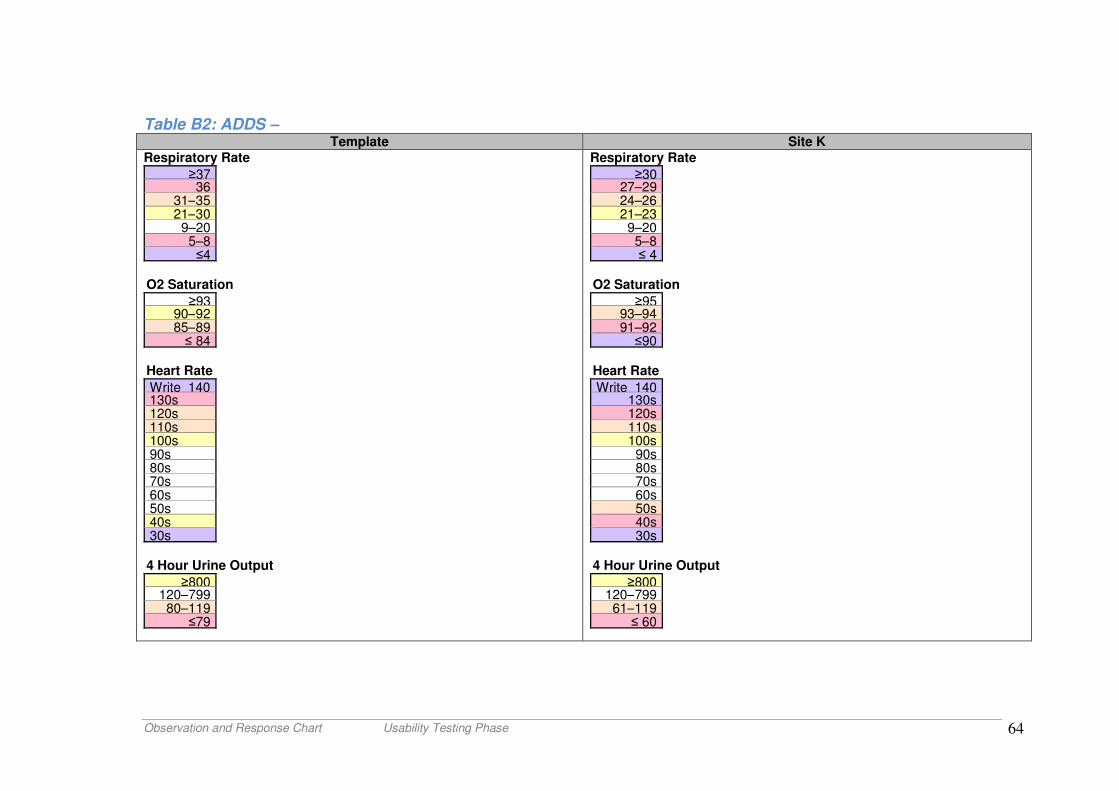
Observation and Response Chart Usability Testing Phase 64
Table B2: ADDS – Template Site K
Respiratory Rate
≥37 36
31–35 21–30
9–20 5–8 ≤4
O2 Saturation
≥93 90–92 85–89 ≤ 84
Heart Rate
Write 140 130s 120s 110s 100s 90s 80s 70s 60s 50s 40s 30s 4 Hour Urine Output
≥800 120–799 80–119
≤79
Respiratory Rate
≥30 27–29 24–26 21–23
9–20 5–8 ≤ 4
O2 Saturation
≥95 93–94 91–92
≤90 Heart Rate
Write 140 130s 120s 110s 100s
90s 80s 70s 60s 50s 40s 30s
4 Hour Urine Output
≥800 120–799 61–119 ≤ 60
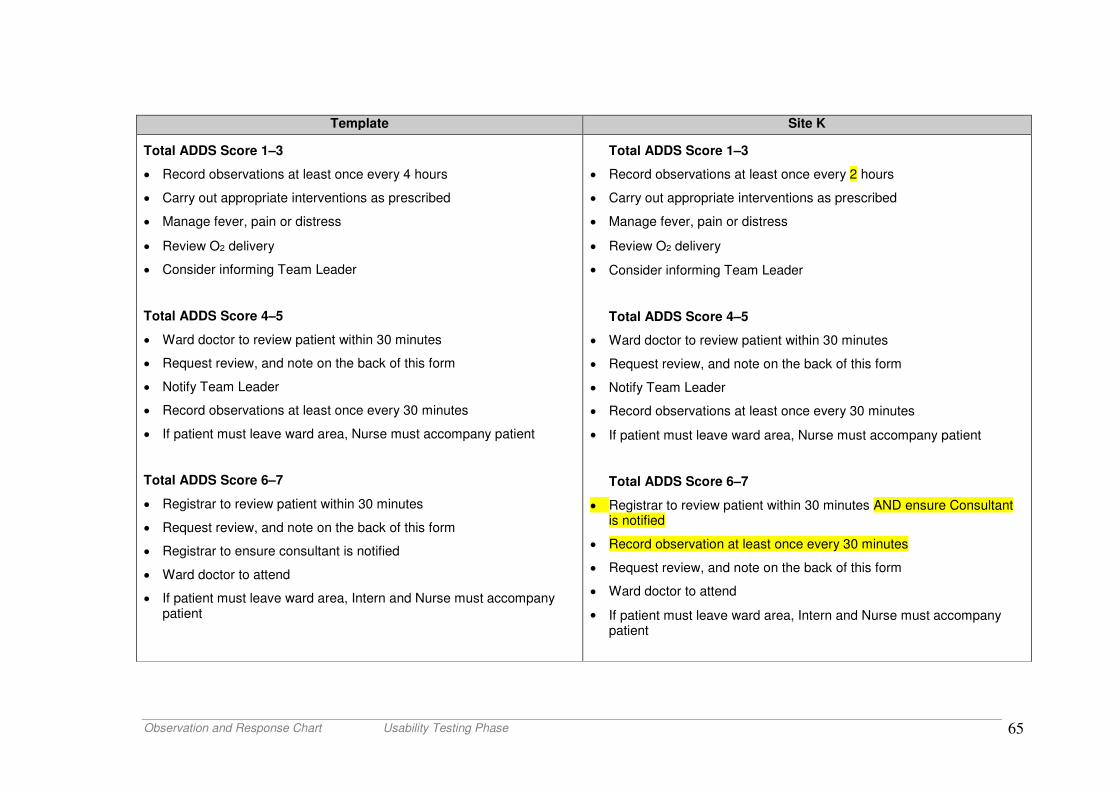
Observation and Response Chart Usability Testing Phase 65
Template Site K
Total ADDS Score 1–3
• Record observations at least once every 4 hours
• Carry out appropriate interventions as prescribed
• Manage fever, pain or distress
• Review O2 delivery
• Consider informing Team Leader
Total ADDS Score 4–5
• Ward doctor to review patient within 30 minutes
• Request review, and note on the back of this form
• Notify Team Leader
• Record observations at least once every 30 minutes
• If patient must leave ward area, Nurse must accompany patient
Total ADDS Score 6–7
• Registrar to review patient within 30 minutes
• Request review, and note on the back of this form
• Registrar to ensure consultant is notified
• Ward doctor to attend
• If patient must leave ward area, Intern and Nurse must accompany patient
Total ADDS Score 1–3
• Record observations at least once every 2 hours
• Carry out appropriate interventions as prescribed
• Manage fever, pain or distress
• Review O2 delivery
• Consider informing Team Leader
Total ADDS Score 4–5
• Ward doctor to review patient within 30 minutes
• Request review, and note on the back of this form
• Notify Team Leader
• Record observations at least once every 30 minutes
• If patient must leave ward area, Nurse must accompany patient
Total ADDS Score 6–7
• Registrar to review patient within 30 minutes AND ensure Consultant is notified
• Record observation at least once every 30 minutes
• Request review, and note on the back of this form
• Ward doctor to attend
• If patient must leave ward area, Intern and Nurse must accompany patient
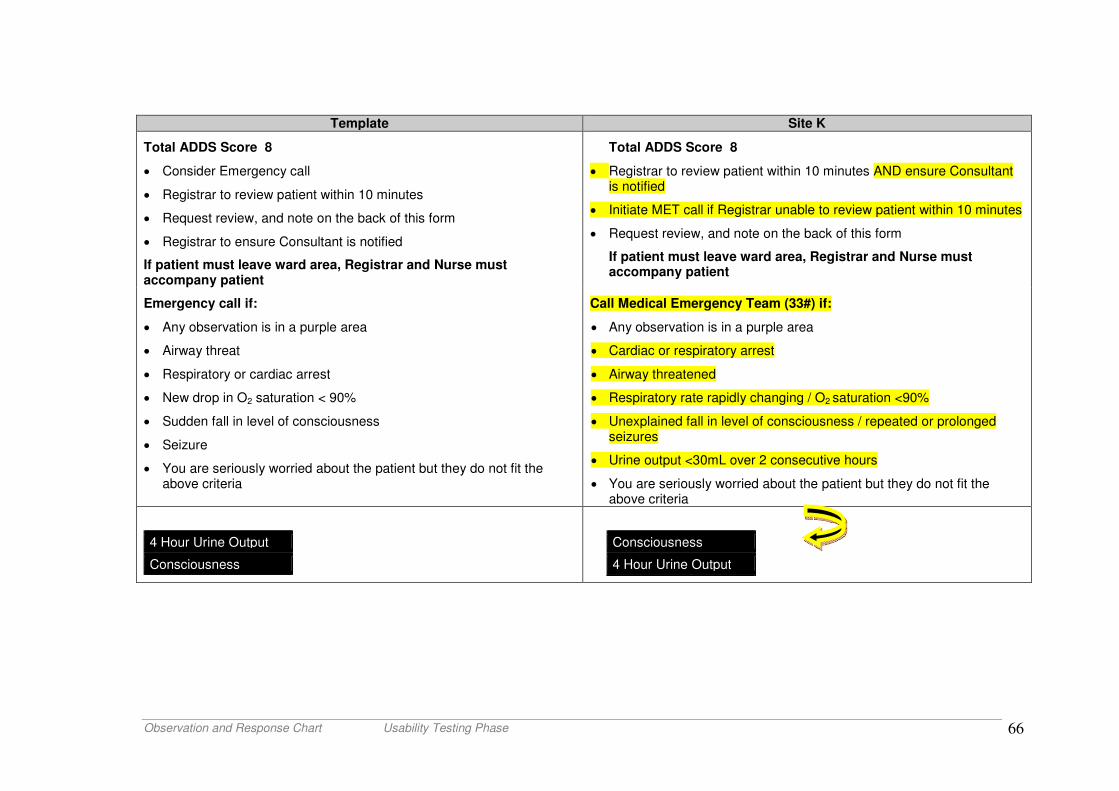
Observation and Response Chart Usability Testing Phase 66
Template Site K
Total ADDS Score 8
• Consider Emergency call
• Registrar to review patient within 10 minutes
• Request review, and note on the back of this form
• Registrar to ensure Consultant is notified
If patient must leave ward area, Registrar and Nurse must accompany patient
Total ADDS Score 8
• Registrar to review patient within 10 minutes AND ensure Consultant is notified
• Initiate MET call if Registrar unable to review patient within 10 minutes
• Request review, and note on the back of this form
If patient must leave ward area, Registrar and Nurse must accompany patient
Emergency call if:
• Any observation is in a purple area
• Airway threat
• Respiratory or cardiac arrest
• New drop in O2 saturation < 90%
• Sudden fall in level of consciousness
• Seizure
• You are seriously worried about the patient but they do not fit the above criteria
Call Medical Emergency Team (33#) if:
• Any observation is in a purple area
• Cardiac or respiratory arrest
• Airway threatened
• Respiratory rate rapidly changing / O2 saturation <90%
• Unexplained fall in level of consciousness / repeated or prolonged seizures
• Urine output <30mL over 2 consecutive hours
• You are seriously worried about the patient but they do not fit the above criteria
4 Hour Urine Output
Consciousness
Consciousness
4 Hour Urine Output
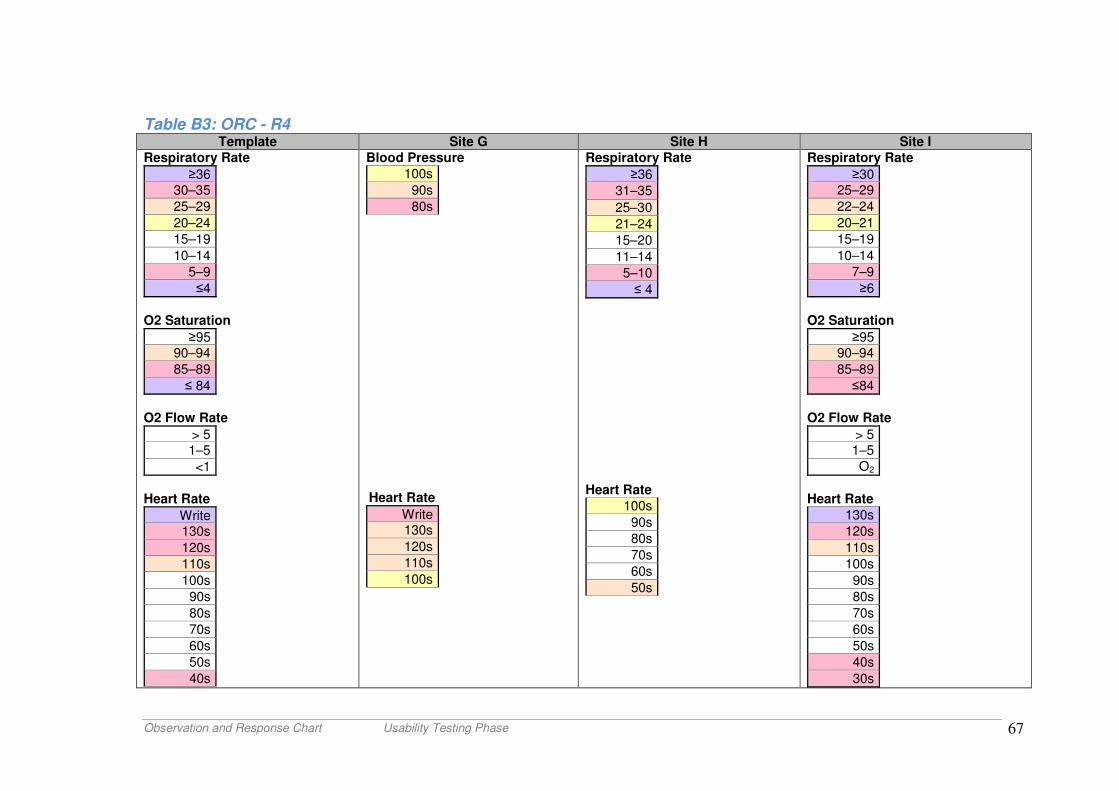
Observation and Response Chart Usability Testing Phase 67
Table B3: ORC - R4 Template Site G Site H Site I
Respiratory Rate
≥36 30–35
25–29
20–24
15–19
10–14
5–9
≤4
O2 Saturation
≥95 90–94
85–89
≤ 84
O2 Flow Rate
> 5 1–5
<1
Heart Rate
Write 130s
120s
110s
100s
90s
80s
70s
60s
50s
40s
Blood Pressure
100s
90s
80s
Heart Rate
Write 130s
120s
110s
100s
Respiratory Rate
≥36
31–35
25–30
21–24
15–20
11–14
5–10
≤ 4
Heart Rate
100s
90s
80s
70s
60s
50s
Respiratory Rate
≥30 25–29
22–24
20–21
15–19
10–14
7–9
≥6
O2 Saturation
≥95 90–94
85–89
≤84
O2 Flow Rate
> 5 1–5
O2 delivery
Heart Rate
130s
120s
110s
100s
90s
80s
70s
60s
50s
40s
30s

Observation and Response Chart Usability Testing Phase 68
Temperature
≥39.1 38.1–39.0
37.1–38.0
36.1–37.0
35.1–36.0
≤35.0
Consciousness
Alert To Voice
To Pain
Unresp.
Urine Output
≥30 ≤29
Temperature
≥39.1 38–39
37.1–37.9
36.1–37.0
35.1–36.0
≤35.0
Urine Output
≥26 ≤ 25
Consciousness
Alert To Voice
To Pain
Unresp.
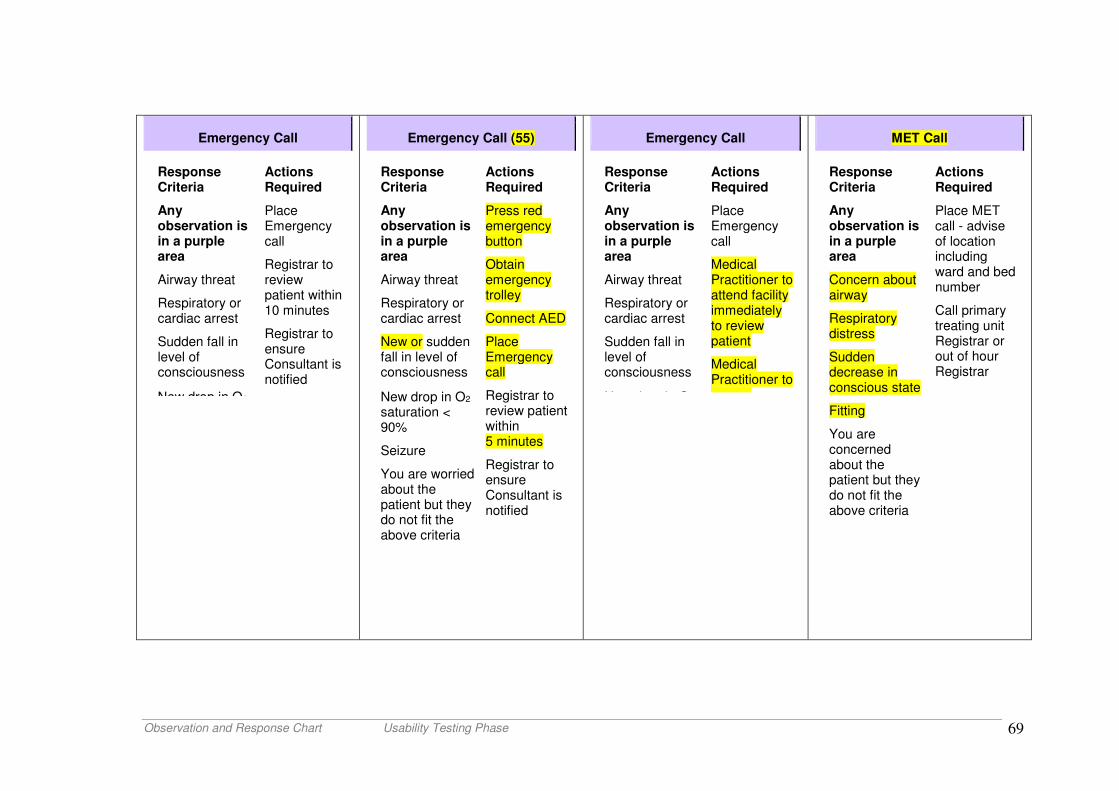
Observation and Response Chart Usability Testing Phase 69
Emergency Call
Response Criteria
Any observation is in a purple area
Airway threat
Respiratory or cardiac arrest
Sudden fall in level of consciousness
New drop in O2
Actions Required
Place Emergency call
Registrar to review patient within 10 minutes
Registrar to ensure Consultant is notified
Emergency Call (55)
Response Criteria
Any observation is in a purple area
Airway threat
Respiratory or cardiac arrest
New or sudden fall in level of consciousness
New drop in O2 saturation < 90%
Seizure
You are worried about the patient but they do not fit the above criteria
Actions Required
Press red emergency button
Obtain emergency trolley
Connect AED
Place Emergency call
Registrar to review patient within 5 minutes
Registrar to ensure Consultant is notified
Emergency Call
Response Criteria
Any observation is in a purple area
Airway threat
Respiratory or cardiac arrest
Sudden fall in level of consciousness
New drop in O
Actions Required
Place Emergency call
Medical Practitioner to attend facility immediately to review patient
Medical Practitioner to ensure
MET Call
Response Criteria
Any observation is in a purple area
Concern about airway
Respiratory distress
Sudden decrease in conscious state
Fitting
You are concerned about the patient but they do not fit the above criteria
Actions Required
Place MET call - advise of location including ward and bed number
Call primary treating unit Registrar or out of hour Registrar
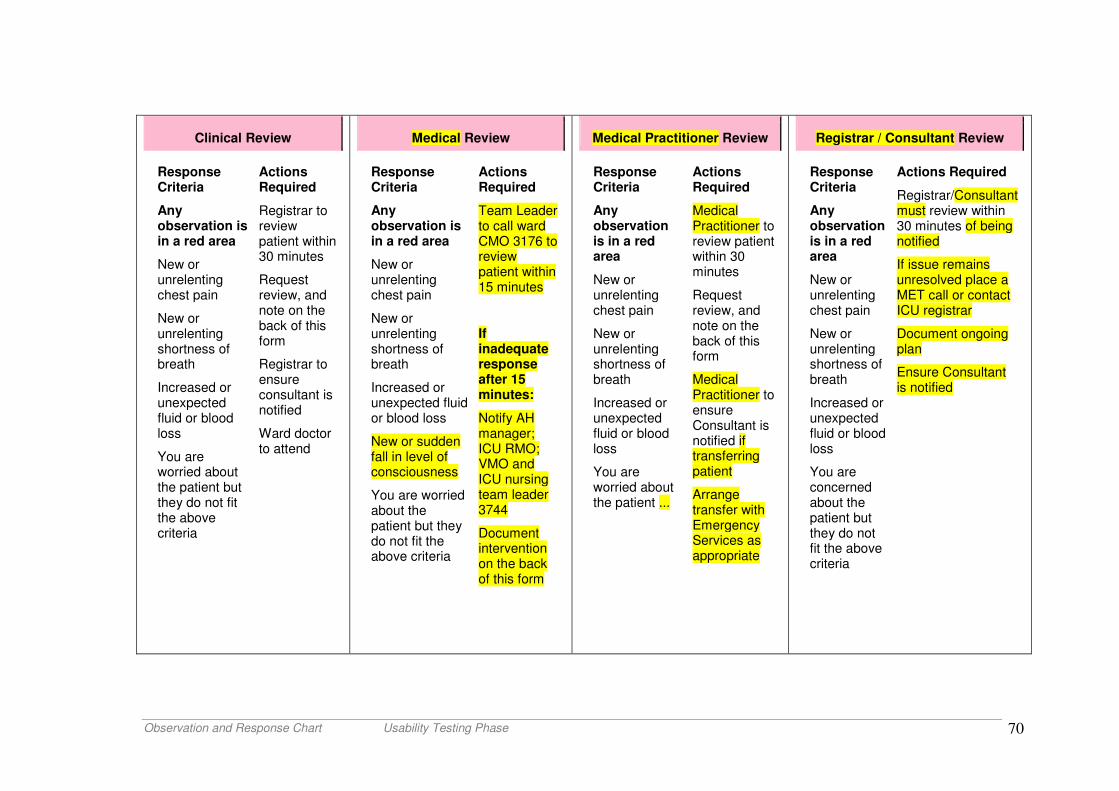
Observation and Response Chart Usability Testing Phase 70
Clinical Review
Response Criteria
Any observation is in a red area
New or unrelenting chest pain
New or unrelenting shortness of breath
Increased or unexpected fluid or blood loss
You are worried about the patient but they do not fit the above criteria
Actions Required
Registrar to review patient within 30 minutes
Request review, and note on the back of this form
Registrar to ensure consultant is notified
Ward doctor to attend
Medical Review
Response Criteria
Any observation is in a red area
New or unrelenting chest pain
New or unrelenting shortness of breath
Increased or unexpected fluid or blood loss
New or sudden fall in level of consciousness
You are worried about the patient but they do not fit the above criteria
Actions Required
Team Leader to call ward CMO 3176 to review patient within 15 minutes
If inadequate response after 15 minutes:
Notify AH manager; ICU RMO; VMO and ICU nursing team leader 3744
Document intervention on the back of this form
Medical Practitioner Review
Response Criteria
Any observation is in a red area
New or unrelenting chest pain
New or unrelenting shortness of breath
Increased or unexpected fluid or blood loss
You are worried about the patient ...
Actions Required
Medical Practitioner to review patient within 30 minutes
Request review, and note on the back of this form
Medical Practitioner to ensure Consultant is notified if transferring patient
Arrange transfer with Emergency Services as appropriate
Registrar / Consultant Review
Response Criteria
Any observation is in a red area
New or unrelenting chest pain
New or unrelenting shortness of breath
Increased or unexpected fluid or blood loss
You are concerned about the patient but they do not fit the above criteria
Actions Required
Registrar/Consultant must review within 30 minutes of being notified
If issue remains unresolved place a MET call or contact ICU registrar
Document ongoing plan
Ensure Consultant is notified
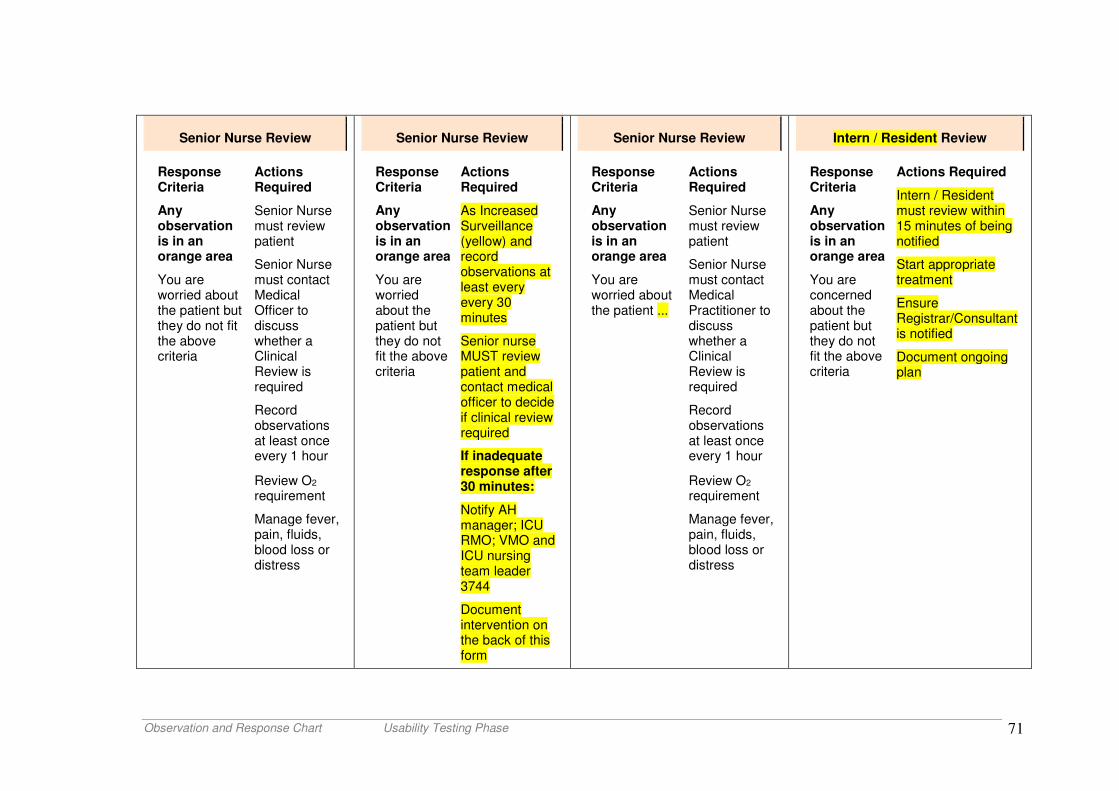
Observation and Response Chart Usability Testing Phase 71
Senior Nurse Review
Response Criteria
Any observation is in an orange area
You are worried about the patient but they do not fit the above criteria
Actions Required
Senior Nurse must review patient
Senior Nurse must contact Medical Officer to discuss whether a Clinical Review is required
Record observations at least once every 1 hour
Review O2 requirement
Manage fever, pain, fluids, blood loss or distress
Senior Nurse Review
Response Criteria
Any observation is in an orange area
You are worried about the patient but they do not fit the above criteria
Actions Required
As Increased Surveillance (yellow) and record observations at least every every 30 minutes
Senior nurse MUST review patient and contact medical officer to decide if clinical review required
If inadequate response after 30 minutes:
Notify AH manager; ICU RMO; VMO and ICU nursing team leader 3744
Document intervention on the back of this form
Senior Nurse Review
Response Criteria
Any observation is in an orange area
You are worried about the patient ...
Actions Required
Senior Nurse must review patient
Senior Nurse must contact Medical Practitioner to discuss whether a Clinical Review is required
Record observations at least once every 1 hour
Review O2 requirement
Manage fever, pain, fluids, blood loss or distress
Intern / Resident Review
Response Criteria
Any observation is in an orange area
You are concerned about the patient but they do not fit the above criteria
Actions Required
Intern / Resident must review within 15 minutes of being notified
Start appropriate treatment
Ensure Registrar/Consultant is notified
Document ongoing plan
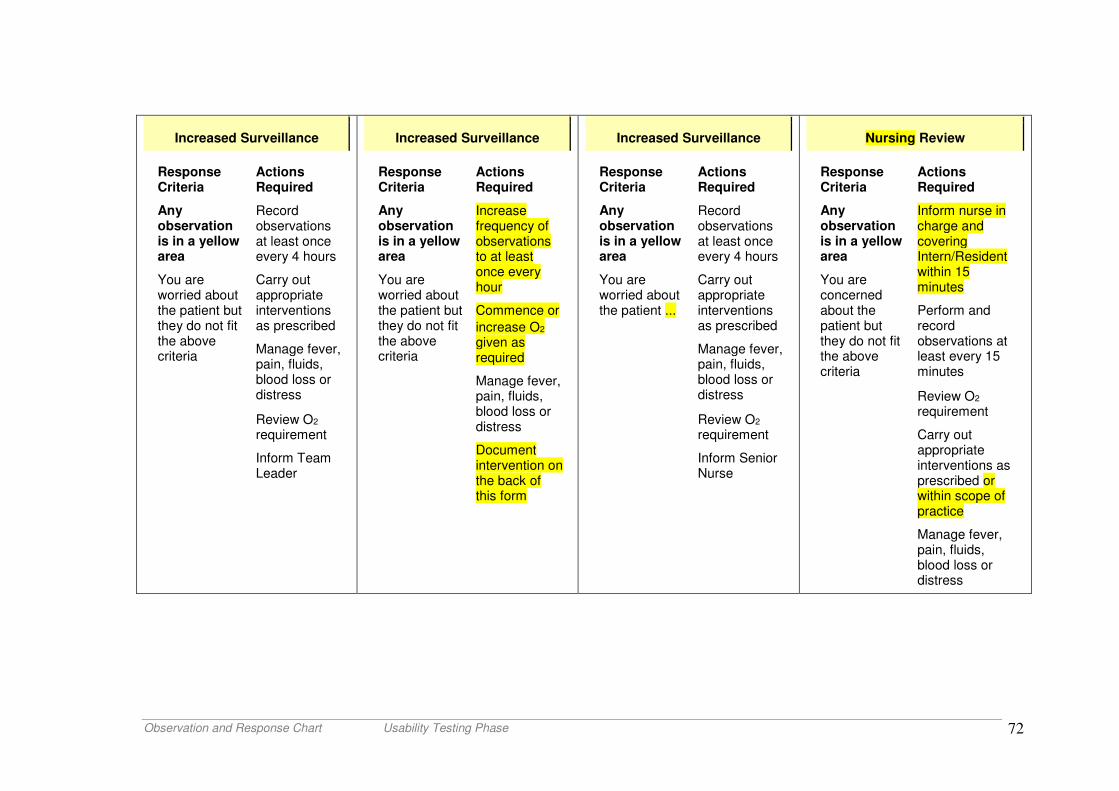
Observation and Response Chart Usability Testing Phase 72
Increased Surveillance
Response Criteria
Any observation is in a yellow area
You are worried about the patient but they do not fit the above criteria
Actions Required
Record observations at least once every 4 hours
Carry out appropriate interventions as prescribed
Manage fever, pain, fluids, blood loss or distress
Review O2 requirement
Inform Team Leader
Increased Surveillance
Response Criteria
Any observation is in a yellow area
You are worried about the patient but they do not fit the above criteria
Actions Required
Increase frequency of observations to at least once every hour
Commence or
increase O2 given as required
Manage fever, pain, fluids, blood loss or distress
Document intervention on the back of this form
Increased Surveillance
Response Criteria
Any observation is in a yellow area
You are worried about the patient ...
Actions Required
Record observations at least once every 4 hours
Carry out appropriate interventions as prescribed
Manage fever, pain, fluids, blood loss or distress
Review O2 requirement
Inform Senior Nurse
Nursing Review
Response Criteria
Any observation is in a yellow area
You are concerned about the patient but they do not fit the above criteria
Actions Required
Inform nurse in charge and covering Intern/Resident within 15 minutes
Perform and record observations at least every 15 minutes
Review O2 requirement
Carry out appropriate interventions as prescribed or within scope of practice
Manage fever, pain, fluids, blood loss or distress
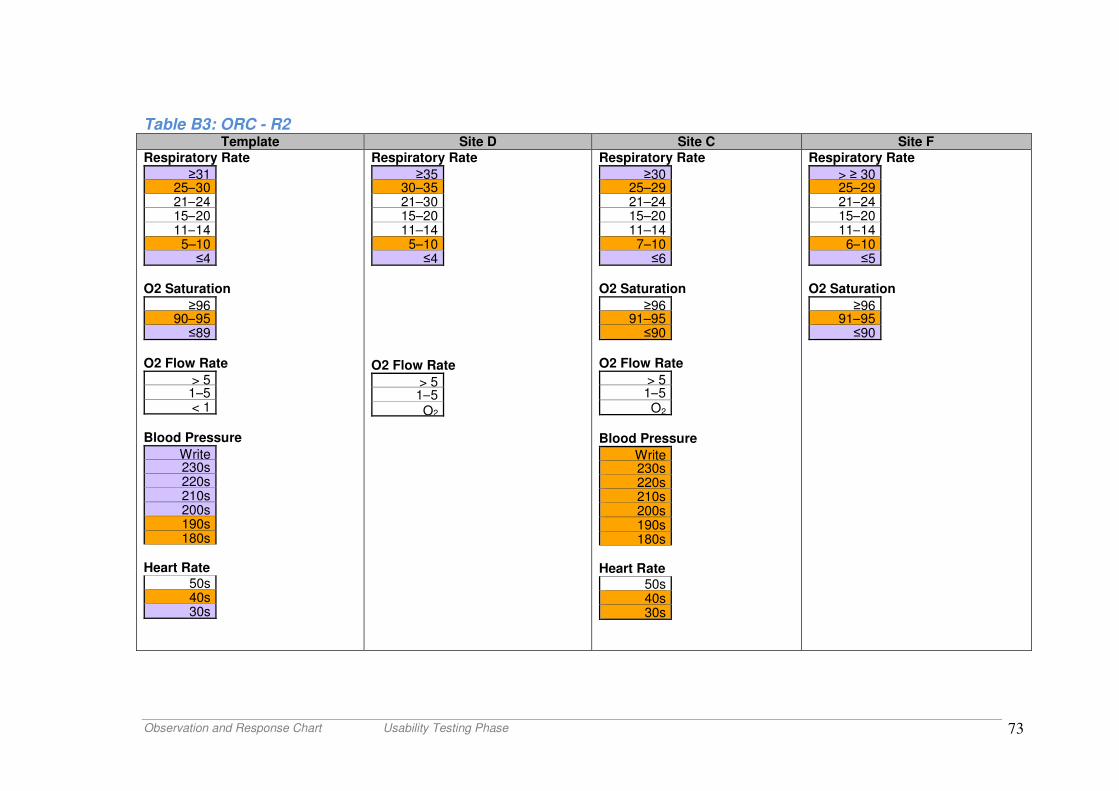
Observation and Response Chart Usability Testing Phase 73
Table B3: ORC - R2 Template Site D Site C Site F
Respiratory Rate
≥31 25–30 21–24 15–20 11–14
5–10 ≤4
O2 Saturation
≥96 90–95
≤89 O2 Flow Rate
> 5 1–5 < 1
Blood Pressure
Write 230s 220s 210s 200s 190s 180s
Heart Rate
50s 40s 30s
Respiratory Rate
≥35 30–35 21–30 15–20 11–14
5–10 ≤4
O2 Flow Rate
> 5 1–5 O2
Respiratory Rate
≥30 25–29 21–24 15–20 11–14
7–10 ≤6
O2 Saturation
≥96 91–95
≤90 O2 Flow Rate
> 5 1–5 O2
Blood Pressure
Write 230s 220s 210s 200s 190s 180s
Heart Rate
50s 40s 30s
Respiratory Rate
> ≥ 30 25–29 21–24 15–20 11–14
6–10 ≤5
O2 Saturation
≥96 91–95
≤90
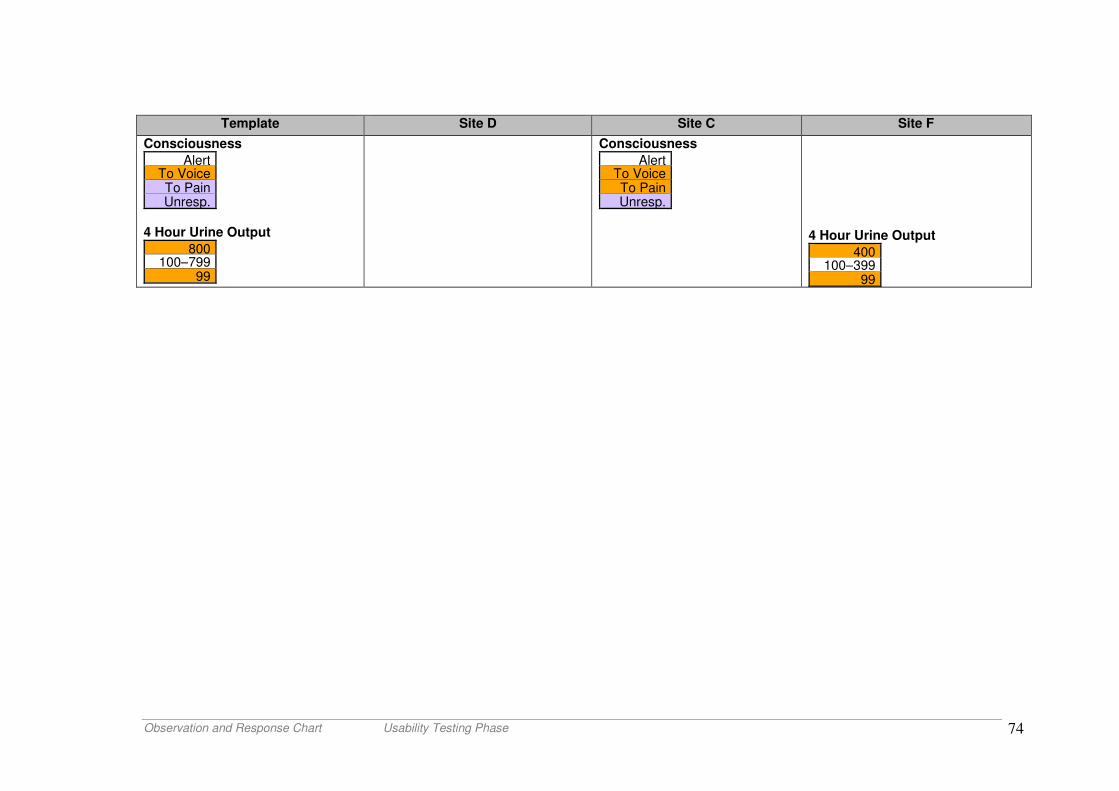
Observation and Response Chart Usability Testing Phase 74
Template Site D Site C Site F
Consciousness
Alert To Voice To Pain Unresp.
4 Hour Urine Output
800 100–799
99
Consciousness
Alert To Voice To Pain Unresp.
4 Hour Urine Output
400 100–399
99
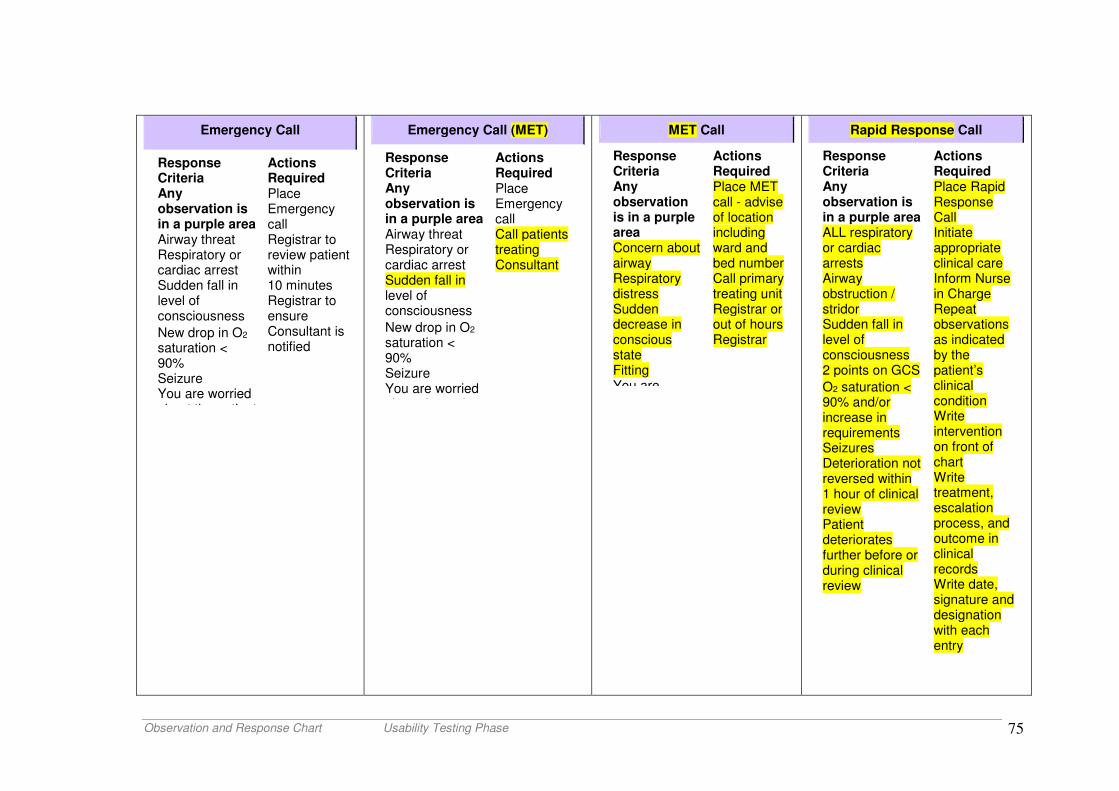
Observation and Response Chart Usability Testing Phase 75
Emergency Call
Response Criteria Any observation is in a purple area Airway threat Respiratory or cardiac arrest Sudden fall in level of consciousness
New drop in O2 saturation < 90% Seizure You are worried about the patient
Actions Required Place Emergency call Registrar to review patient within 10 minutes Registrar to ensure Consultant is notified
Emergency Call (MET)
Response Criteria Any observation is in a purple area Airway threat Respiratory or cardiac arrest Sudden fall in level of consciousness
New drop in O2 saturation < 90% Seizure You are worried about the patient
Actions Required Place Emergency call Call patients treating Consultant
MET Call
Response Criteria Any observation is in a purple area Concern about airway Respiratory distress Sudden decrease in conscious state Fitting You are
Actions Required Place MET call - advise of location including ward and bed number Call primary treating unit Registrar or out of hours Registrar
Rapid Response Call
Response Criteria Any observation is in a purple area ALL respiratory or cardiac arrests Airway obstruction / stridor Sudden fall in level of consciousness 2 points on GCS
O2 saturation < 90% and/or increase in requirements Seizures Deterioration not reversed within 1 hour of clinical review Patient deteriorates further before or during clinical review
Actions Required Place Rapid Response Call Initiate appropriate clinical care Inform Nurse in Charge Repeat observations as indicated by the patient’s clinical condition Write intervention on front of chart Write treatment, escalation process, and outcome in clinical records Write date, signature and designation with each entry
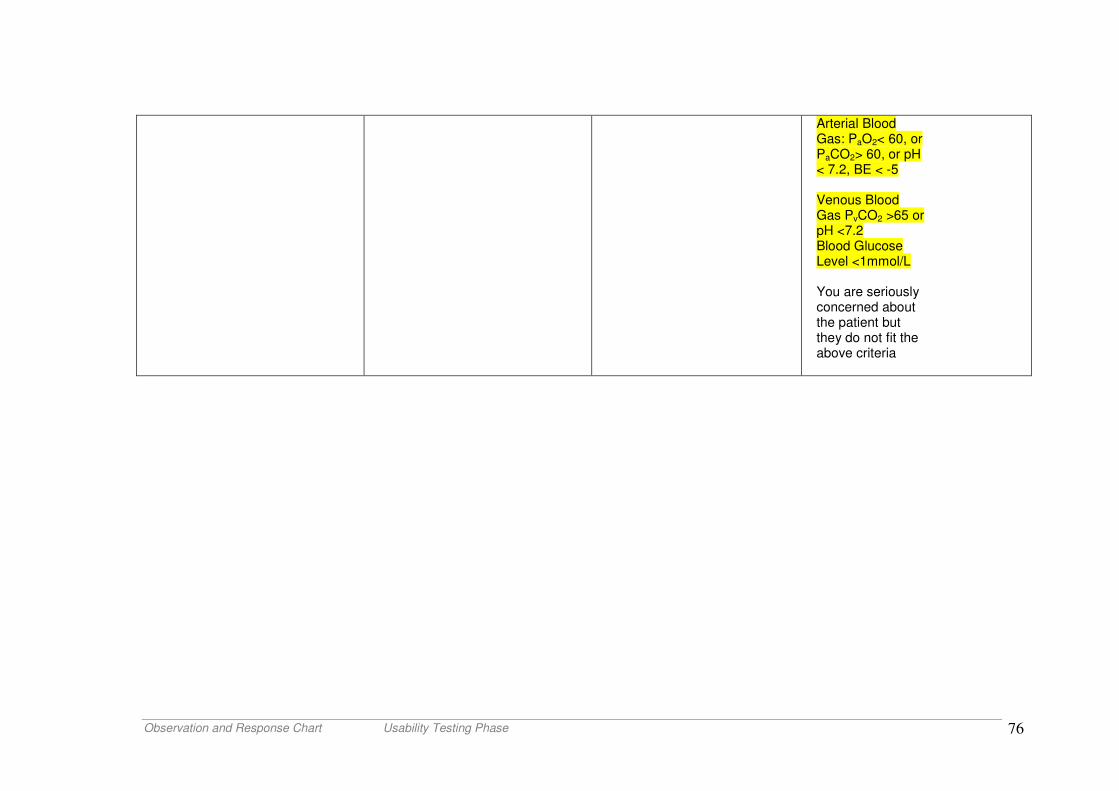
Observation and Response Chart Usability Testing Phase 76
Arterial Blood Gas: PaO2< 60, or PaCO2> 60, or pH < 7.2, BE < -5 Venous Blood Gas PvCO2 >65 or pH <7.2 Blood Glucose Level <1mmol/L You are seriously concerned about the patient but they do not fit the above criteria
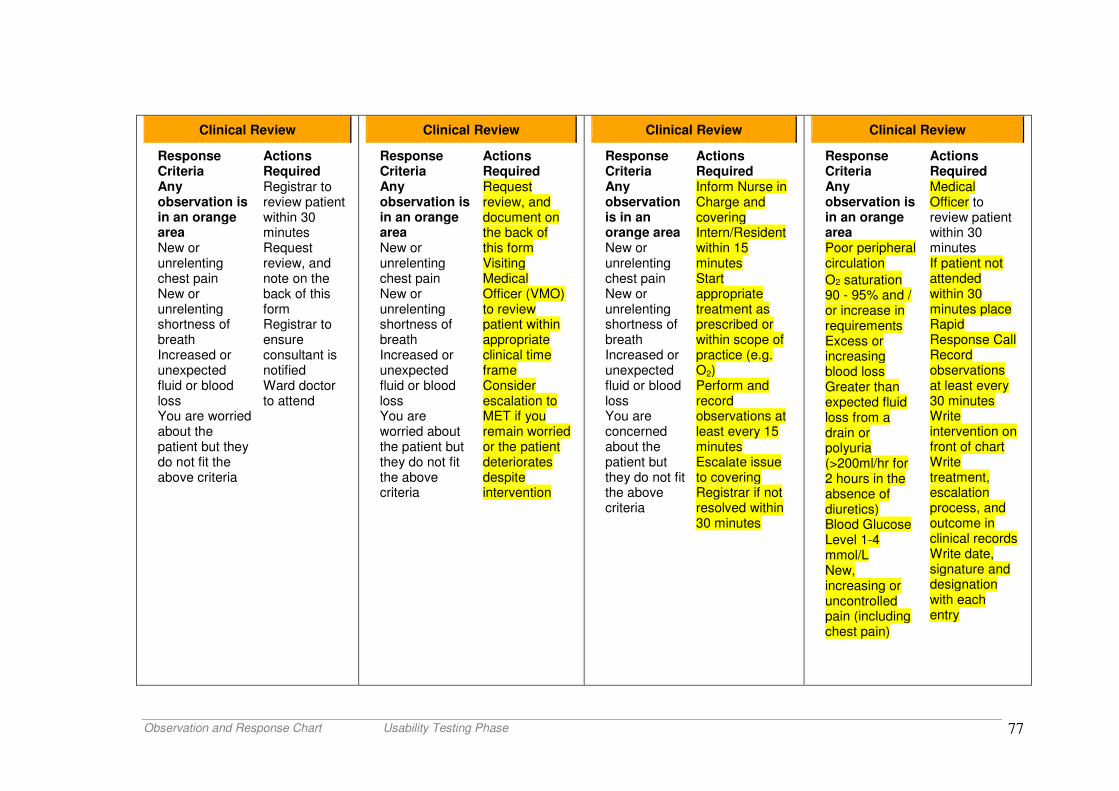
Observation and Response Chart Usability Testing Phase 77
Clinical Review
Response Criteria Any observation is in an orange area New or unrelenting chest pain New or unrelenting shortness of breath Increased or unexpected fluid or blood loss You are worried about the patient but they do not fit the above criteria
Actions Required Registrar to review patient within 30 minutes Request review, and note on the back of this form Registrar to ensure consultant is notified Ward doctor to attend
Clinical Review
Response Criteria Any observation is in an orange area New or unrelenting chest pain New or unrelenting shortness of breath Increased or unexpected fluid or blood loss You are worried about the patient but they do not fit the above criteria
Actions Required Request review, and document on the back of this form Visiting Medical Officer (VMO) to review patient within appropriate clinical time frame Consider escalation to MET if you remain worried or the patient deteriorates despite intervention
Clinical Review
Response Criteria Any observation is in an orange area New or unrelenting chest pain New or unrelenting shortness of breath Increased or unexpected fluid or blood loss You are concerned about the patient but they do not fit the above criteria
Actions Required Inform Nurse in Charge and covering Intern/Resident within 15 minutes Start appropriate treatment as prescribed or within scope of practice (e.g. O2) Perform and record observations at least every 15 minutes Escalate issue to covering Registrar if not resolved within 30 minutes
Clinical Review
Response Criteria Any observation is in an orange area Poor peripheral circulation
O2 saturation 90 - 95% and / or increase in requirements Excess or increasing blood loss Greater than expected fluid loss from a drain or polyuria (>200ml/hr for 2 hours in the absence of diuretics) Blood Glucose Level 1-4 mmol/L New, increasing or uncontrolled pain (including chest pain)
Actions Required Medical Officer to review patient within 30 minutes If patient not attended within 30 minutes place Rapid Response Call Record observations at least every 30 minutes Write intervention on front of chart Write treatment, escalation process, and outcome in clinical records Write date, signature and designation with each entry
Observation and Response Chart Usability Testing Phase 78
You are worried about the patient but they do not fit the above criteria
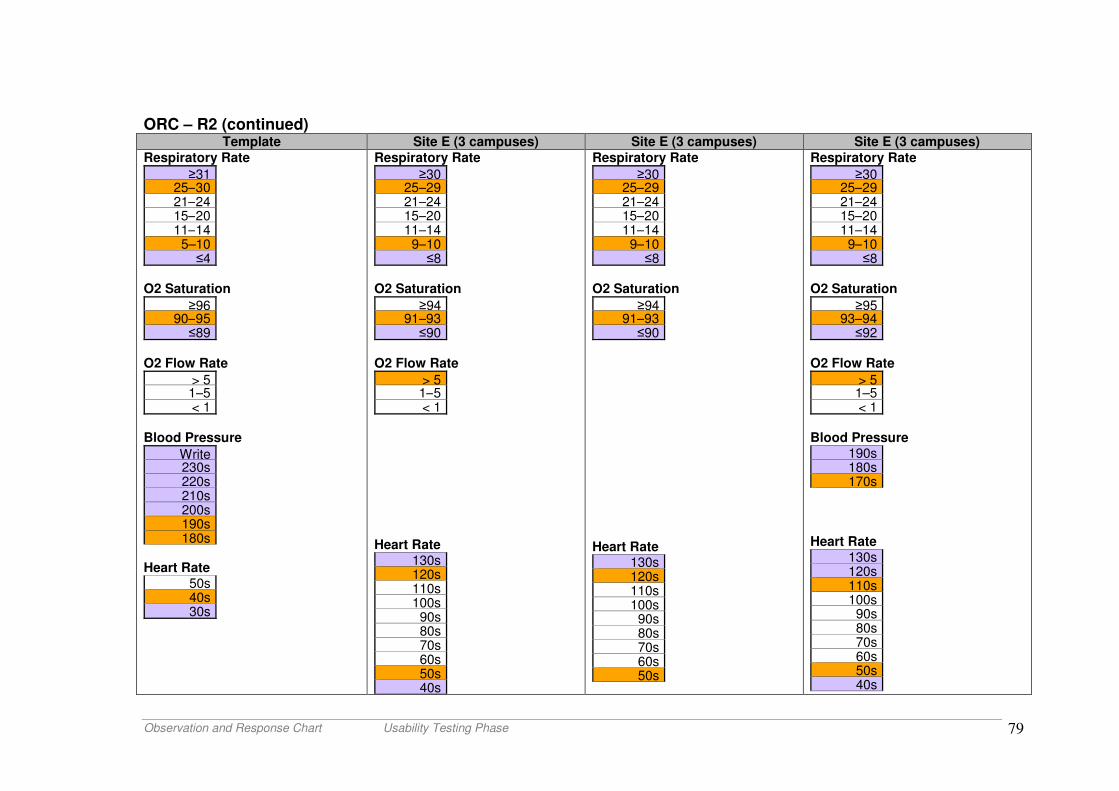
Observation and Response Chart Usability Testing Phase 79
ORC – R2 (continued) Template Site E (3 campuses) Site E (3 campuses) Site E (3 campuses)
Respiratory Rate
≥31 25–30 21–24 15–20 11–14
5–10 ≤4
O2 Saturation
≥96 90–95
≤89 O2 Flow Rate
> 5 1–5 < 1
Blood Pressure
Write 230s 220s 210s 200s 190s 180s
Heart Rate
50s 40s 30s
Respiratory Rate
≥30 25–29 21–24 15–20 11–14
9–10 ≤8
O2 Saturation
≥94 91–93
≤90 O2 Flow Rate
> 5 1–5 < 1
Heart Rate
130s 120s 110s 100s
90s 80s 70s 60s 50s 40s
Respiratory Rate
≥30 25–29 21–24 15–20 11–14
9–10 ≤8
O2 Saturation
≥94 91–93
≤90 Heart Rate
130s 120s 110s 100s
90s 80s 70s 60s 50s
Respiratory Rate
≥30 25–29 21–24 15–20 11–14
9–10 ≤8
O2 Saturation
≥95 93–94
≤92 O2 Flow Rate
> 5 1–5 < 1
Blood Pressure
190s 180s 170s
Heart Rate
130s 120s 110s 100s
90s 80s 70s 60s 50s 40s
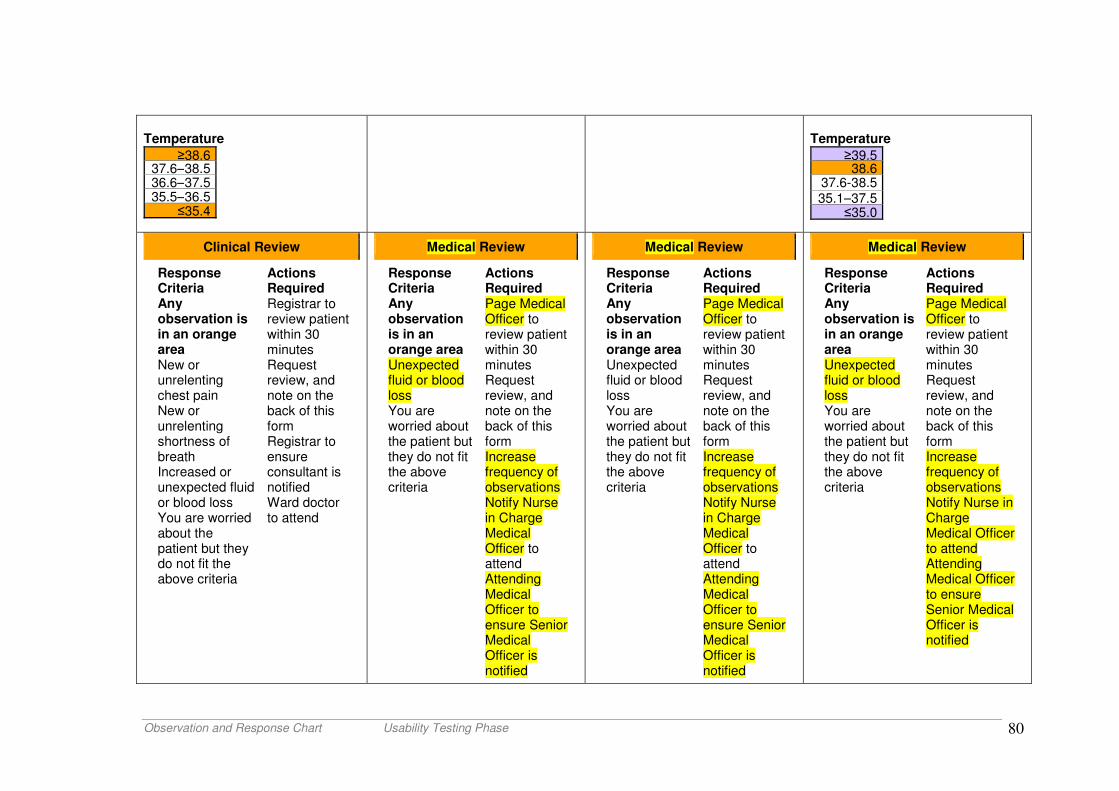
Observation and Response Chart Usability Testing Phase 80
Temperature
≥38.6 37.6–38.5 36.6–37.5 35.5–36.5
≤35.4
Temperature
≥39.5 38.6
37.6-38.5 35.1–37.5
≤35.0
Clinical Review
Response Criteria Any observation is in an orange area New or unrelenting chest pain New or unrelenting shortness of breath Increased or unexpected fluid or blood loss You are worried about the patient but they do not fit the above criteria
Actions Required Registrar to review patient within 30 minutes Request review, and note on the back of this form Registrar to ensure consultant is notified Ward doctor to attend
Medical Review
Response Criteria Any observation is in an orange area Unexpected fluid or blood loss You are worried about the patient but they do not fit the above criteria
Actions Required Page Medical Officer to review patient within 30 minutes Request review, and note on the back of this form Increase frequency of observations Notify Nurse in Charge Medical Officer to attend Attending Medical Officer to ensure Senior Medical Officer is notified
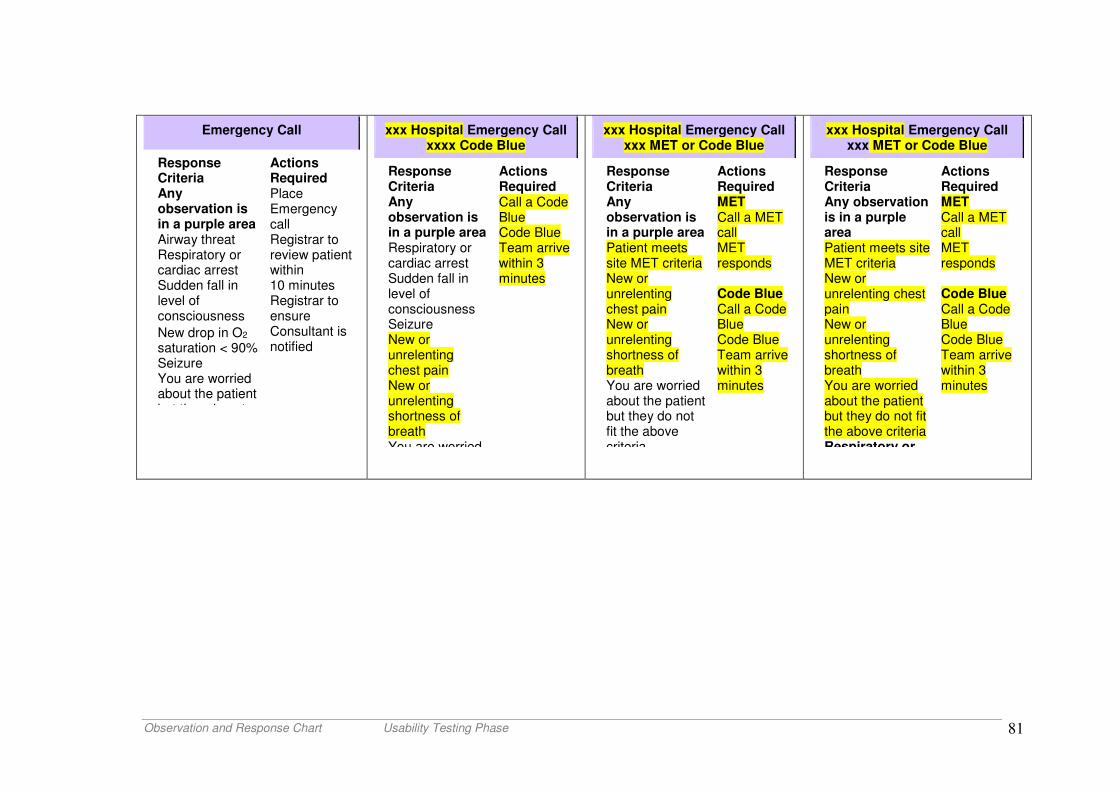
Observation and Response Chart Usability Testing Phase 81
Emergency Call
Response Criteria Any observation is in a purple area Airway threat Respiratory or cardiac arrest Sudden fall in level of consciousness
New drop in O2 saturation < 90% Seizure You are worried about the patient but they do not
Actions Required Place Emergency call Registrar to review patient within 10 minutes Registrar to ensure Consultant is notified
xxx Hospital Emergency Call xxxx Code Blue
Response Criteria Any observation is in a purple area Respiratory or cardiac arrest Sudden fall in level of consciousness Seizure New or unrelenting chest pain New or unrelenting shortness of breath You are worried
Actions Required Call a Code Blue Code Blue Team arrive within 3 minutes
xxx Hospital Emergency Call xxx MET or Code Blue
Response Criteria Any observation is in a purple area Patient meets site MET criteria New or unrelenting chest pain New or unrelenting shortness of breath You are worried about the patient but they do not fit the above criteria
Actions Required MET Call a MET call MET responds Code Blue Call a Code Blue Code Blue Team arrive within 3 minutes
xxx Hospital Emergency Call xxx MET or Code Blue
Response Criteria Any observation is in a purple area Patient meets site MET criteria New or unrelenting chest pain New or unrelenting shortness of breath You are worried about the patient but they do not fit the above criteria Respiratory or
Actions Required MET Call a MET call MET responds Code Blue Call a Code Blue Code Blue Team arrive within 3 minutes
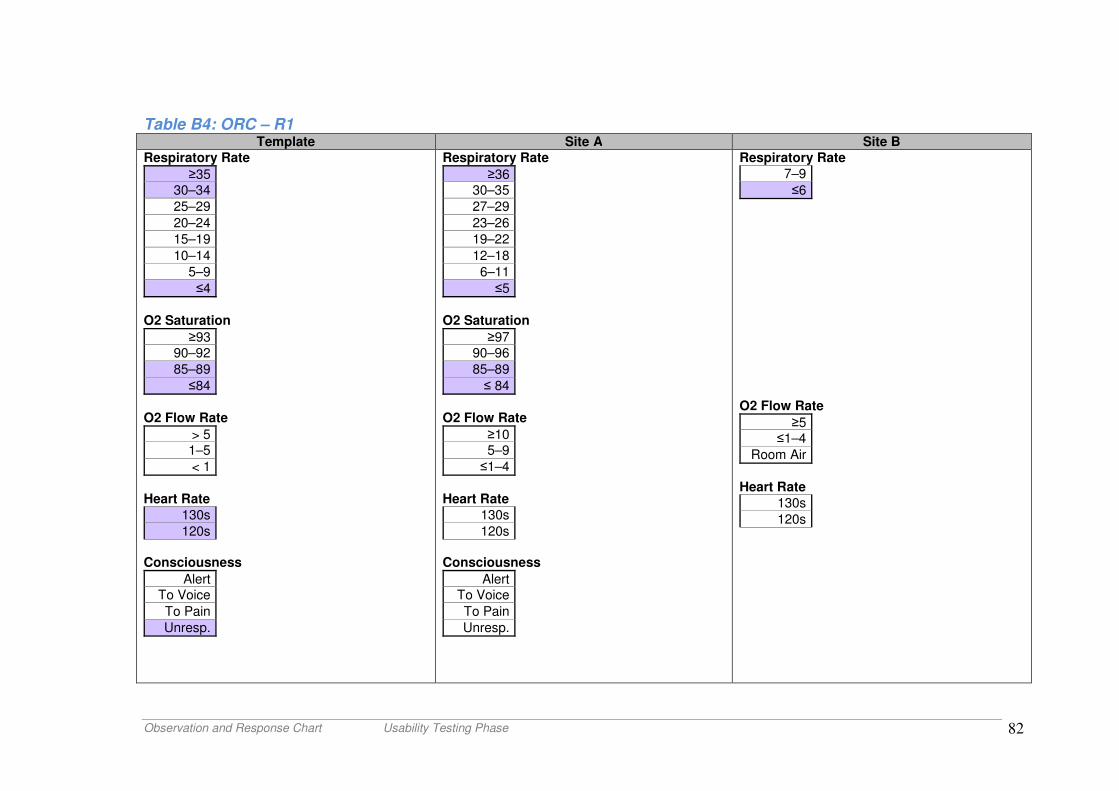
Observation and Response Chart Usability Testing Phase 82
Table B4: ORC – R1 Template Site A Site B
Respiratory Rate
≥35 30–34
25–29
20–24
15–19
10–14
5–9
≤4
O2 Saturation
≥93 90–92
85–89
≤84
O2 Flow Rate
> 5 1–5
< 1
Heart Rate
130s
120s
Consciousness
Alert To Voice
To Pain
Unresp.
Respiratory Rate
≥36 30–35
27–29
23–26
19–22
12–18
6–11
≤5
O2 Saturation
≥97 90–96
85–89
≤ 84
O2 Flow Rate
≥10 5–9
≤1–4
Heart Rate
130s
120s
Consciousness
Alert To Voice
To Pain
Unresp.
Respiratory Rate
7–9
≤6
O2 Flow Rate
≥5 ≤1–4
Room Air
Heart Rate
130s
120s
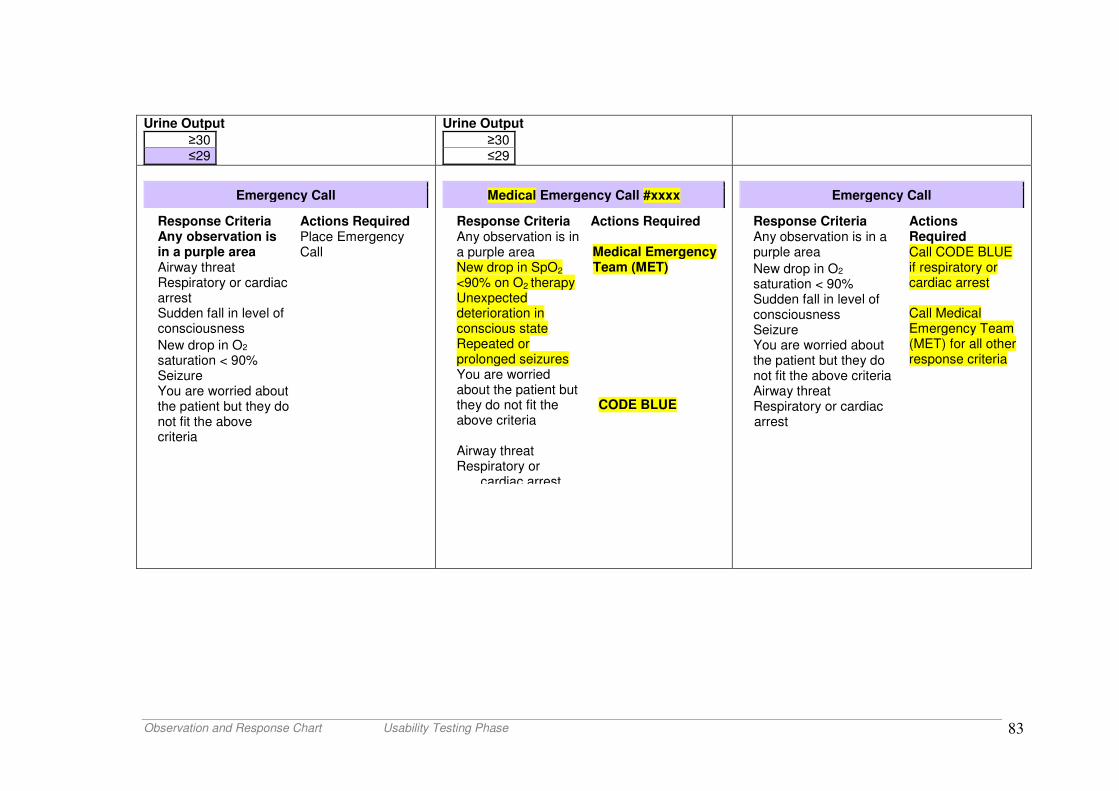
Observation and Response Chart Usability Testing Phase 83
Urine Output
≥30 ≤29
Urine Output
≥30 ≤29
Emergency Call
Response Criteria Any observation is in a purple area Airway threat Respiratory or cardiac arrest Sudden fall in level of consciousness
New drop in O2 saturation < 90% Seizure You are worried about the patient but they do not fit the above criteria
Actions Required Place Emergency Call
Medical Emergency Call #xxxx
Response Criteria Any observation is in a purple area New drop in SpO2 <90% on O2 therapy
Unexpected deterioration in conscious state Repeated or prolonged seizures You are worried about the patient but they do not fit the above criteria Airway threat Respiratory or
cardiac arrest
Actions Required Medical Emergency Team (MET) CODE BLUE
Emergency Call
Response Criteria Any observation is in a purple area
New drop in O2 saturation < 90% Sudden fall in level of consciousness Seizure You are worried about the patient but they do not fit the above criteria Airway threat Respiratory or cardiac arrest
Actions Required Call CODE BLUE if respiratory or cardiac arrest Call Medical Emergency Team (MET) for all other response criteria
Observation and Response Chart Usability Testing Phase 84
Appendix C: Modifications of parameters for trial sites
The following figures illustrate the original values and response criteria with accompanying colour codes for each of the five versions of the ORCs, compared to the modifications for each of the sites trialling that version of the chart, for the parameters:
• Respiratory rate
• Oxygen saturation
• Oxygen flow rate
• Blood pressure
• Heart rate
• Temperature
• Consciousness level
• Urine output
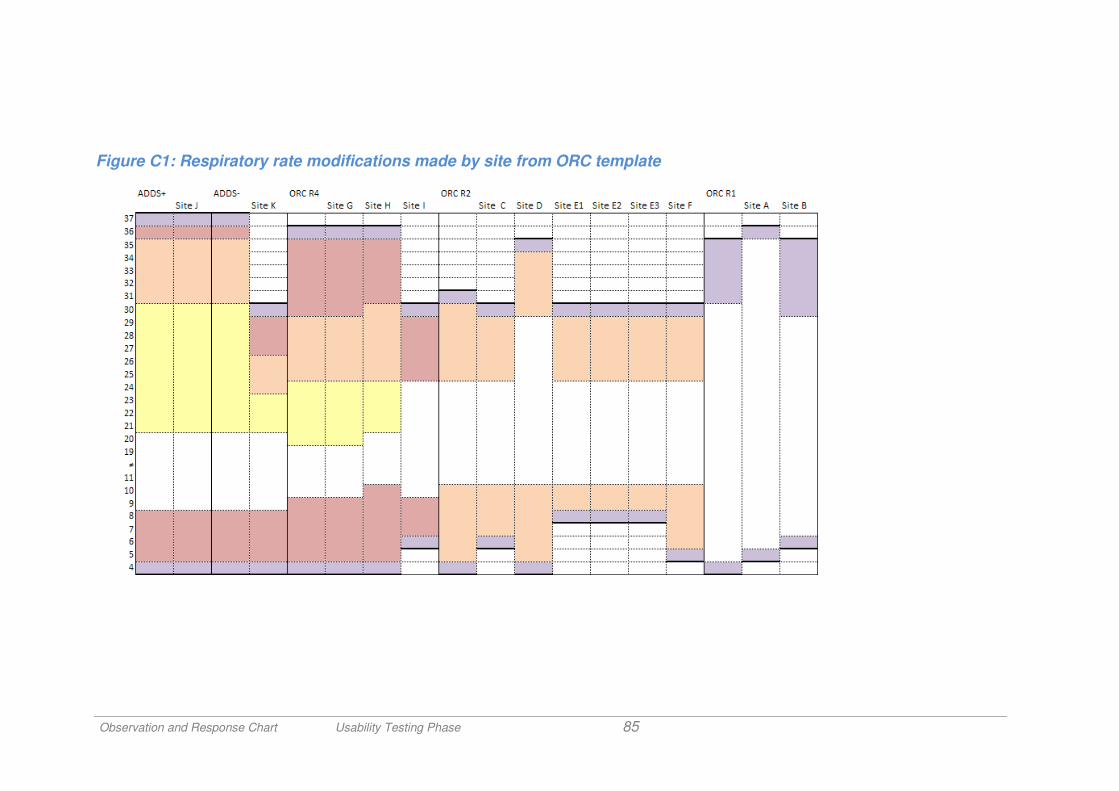
Observation and Response Chart Usability Testing Phase 85
Figure C1: Respiratory rate modifications made by site from ORC template
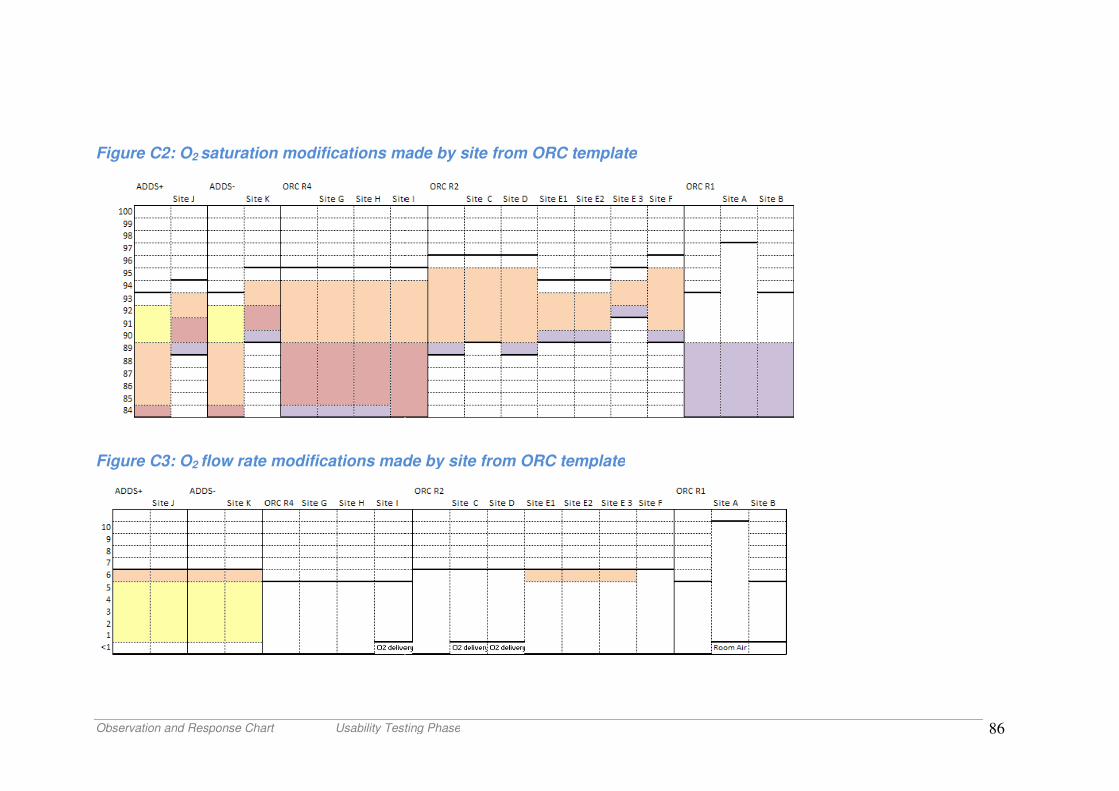
Observation and Response Chart Usability Testing Phase
Figure C2: O2 saturation modifications made by site from ORC template
Figure C3: O2 flow rate modifications made by site from ORC template
Usability Testing Phase
saturation modifications made by site from ORC template
flow rate modifications made by site from ORC template
86
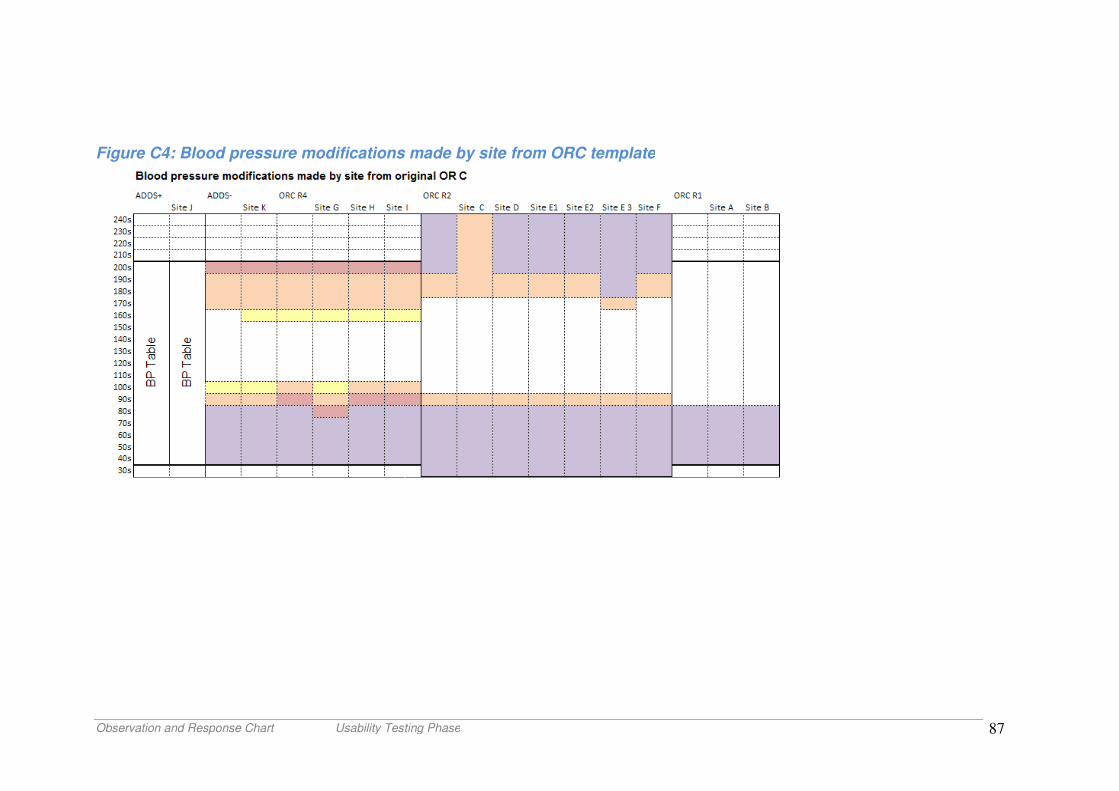
Observation and Response Chart Usability Testing Phase
Figure C4: Blood pressure modifications made by site from ORC template
Usability Testing Phase
Blood pressure modifications made by site from ORC template
87
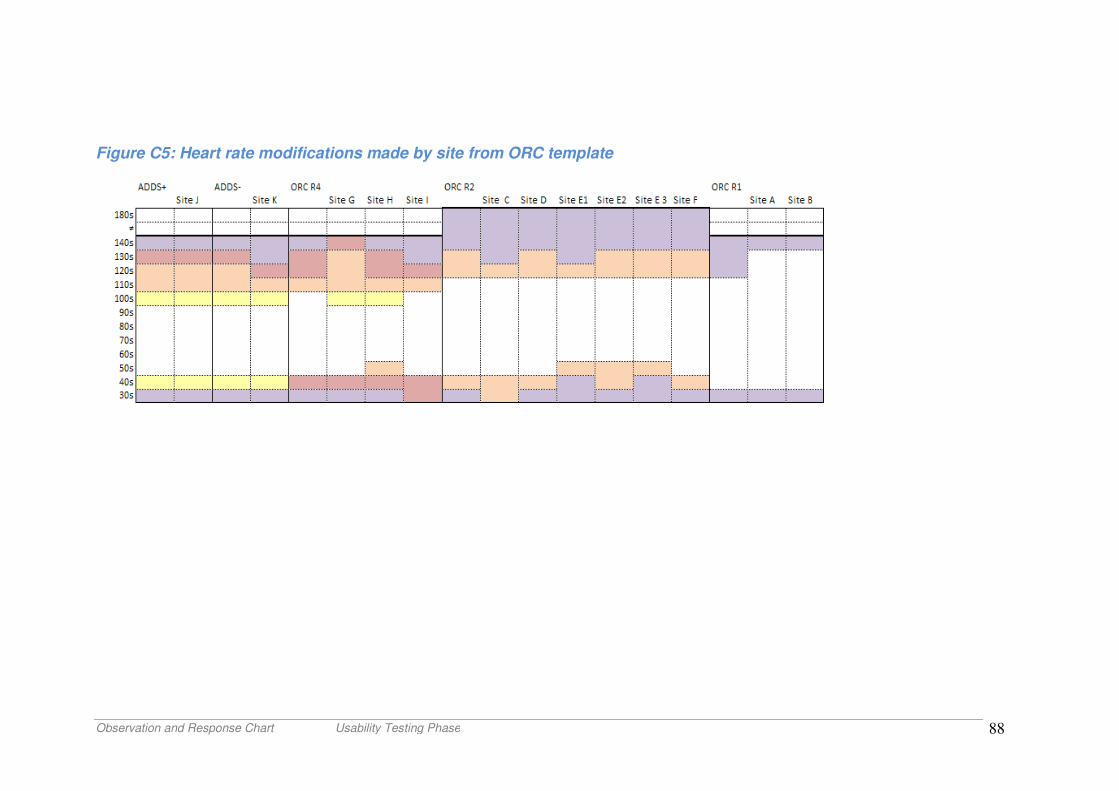
Observation and Response Chart Usability Testing Phase
Figure C5: Heart rate modifications made by
Usability Testing Phase
Heart rate modifications made by site from ORC template
88
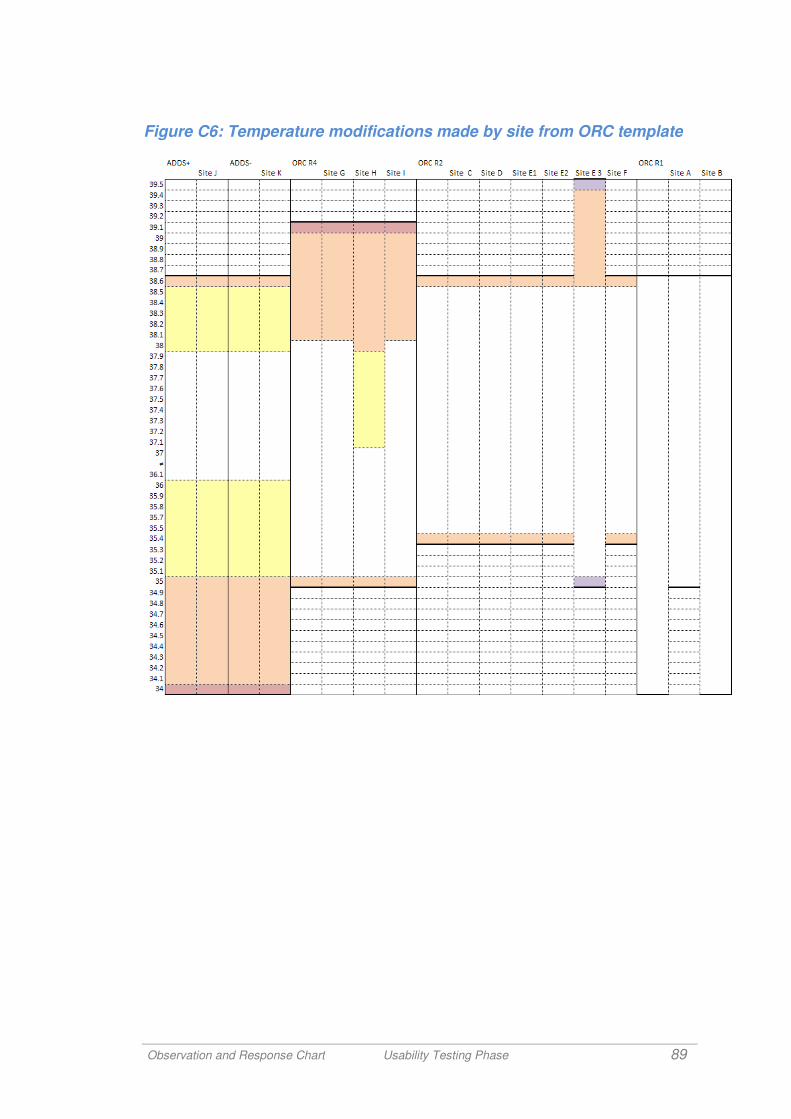
Observation and Response Chart
Figure C6: Temperature modifications made by site from ORC template
Observation and Response Chart Usability Testing Phase
Temperature modifications made by site from ORC template
89
Temperature modifications made by site from ORC template
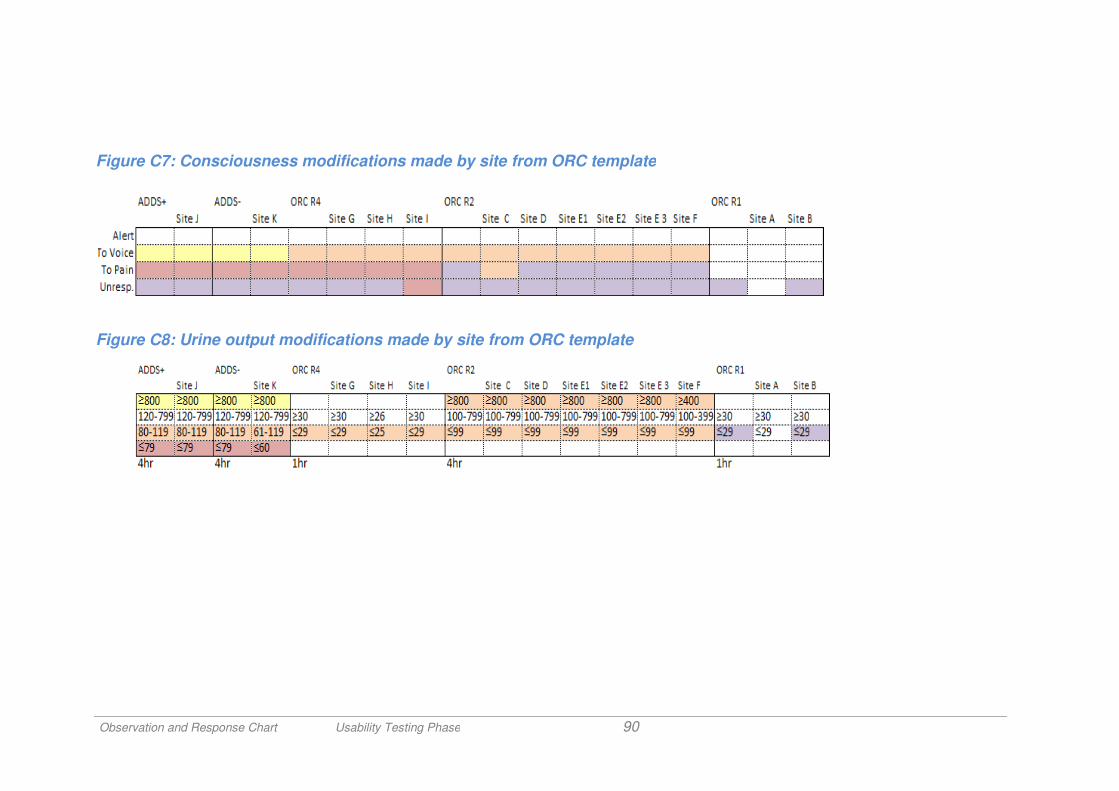
Observation and Response Chart Usability Testing Phase
Figure C7: Consciousness modifications made by site from ORC template
Figure C8: Urine output modifications made by
Usability Testing Phase 90
Consciousness modifications made by site from ORC template
Urine output modifications made by site from ORC template
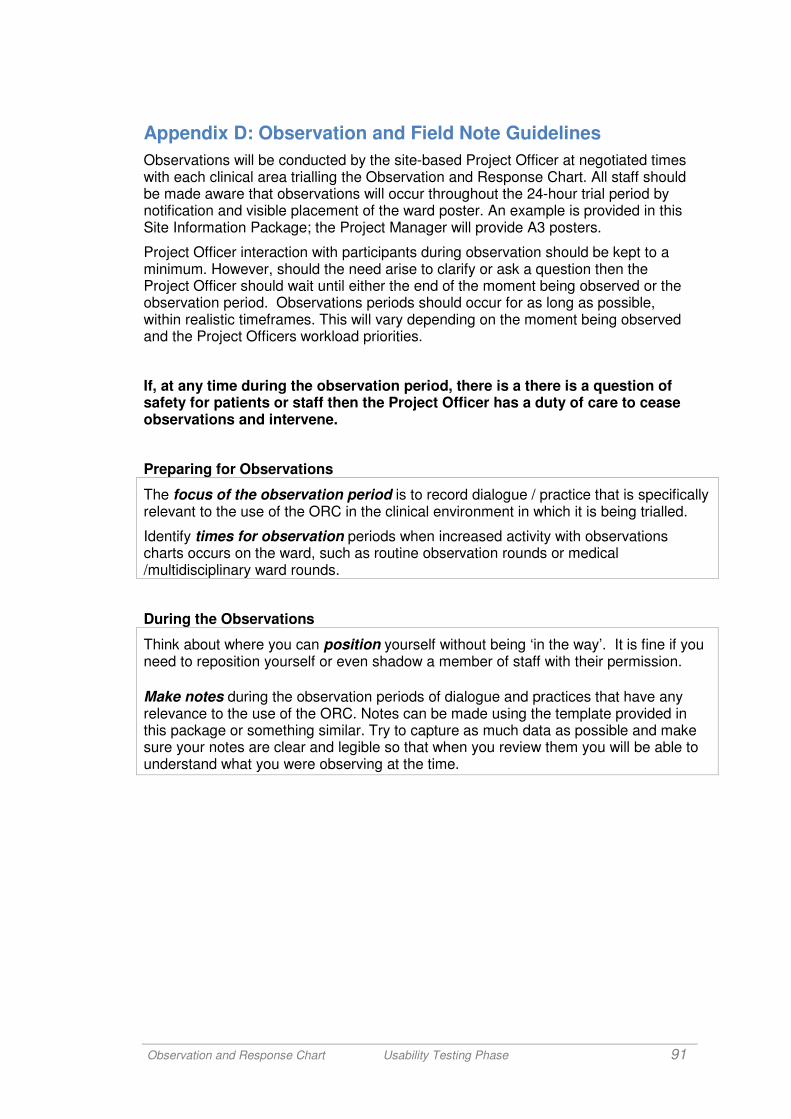
Observation and Response Chart Usability Testing Phase 91
Appendix D: Observation and Field Note Guidelines
Observations will be conducted by the site-based Project Officer at negotiated times with each clinical area trialling the Observation and Response Chart. All staff should be made aware that observations will occur throughout the 24-hour trial period by notification and visible placement of the ward poster. An example is provided in this Site Information Package; the Project Manager will provide A3 posters.
Project Officer interaction with participants during observation should be kept to a minimum. However, should the need arise to clarify or ask a question then the Project Officer should wait until either the end of the moment being observed or the observation period. Observations periods should occur for as long as possible, within realistic timeframes. This will vary depending on the moment being observed and the Project Officers workload priorities.
If, at any time during the observation period, there is a there is a question of safety for patients or staff then the Project Officer has a duty of care to cease observations and intervene.
Preparing for Observations
The focus of the observation period is to record dialogue / practice that is specifically relevant to the use of the ORC in the clinical environment in which it is being trialled.
Identify times for observation periods when increased activity with observations charts occurs on the ward, such as routine observation rounds or medical /multidisciplinary ward rounds.
During the Observations
Think about where you can position yourself without being ‘in the way’. It is fine if you need to reposition yourself or even shadow a member of staff with their permission.
Make notes during the observation periods of dialogue and practices that have any relevance to the use of the ORC. Notes can be made using the template provided in this package or something similar. Try to capture as much data as possible and make sure your notes are clear and legible so that when you review them you will be able to understand what you were observing at the time.
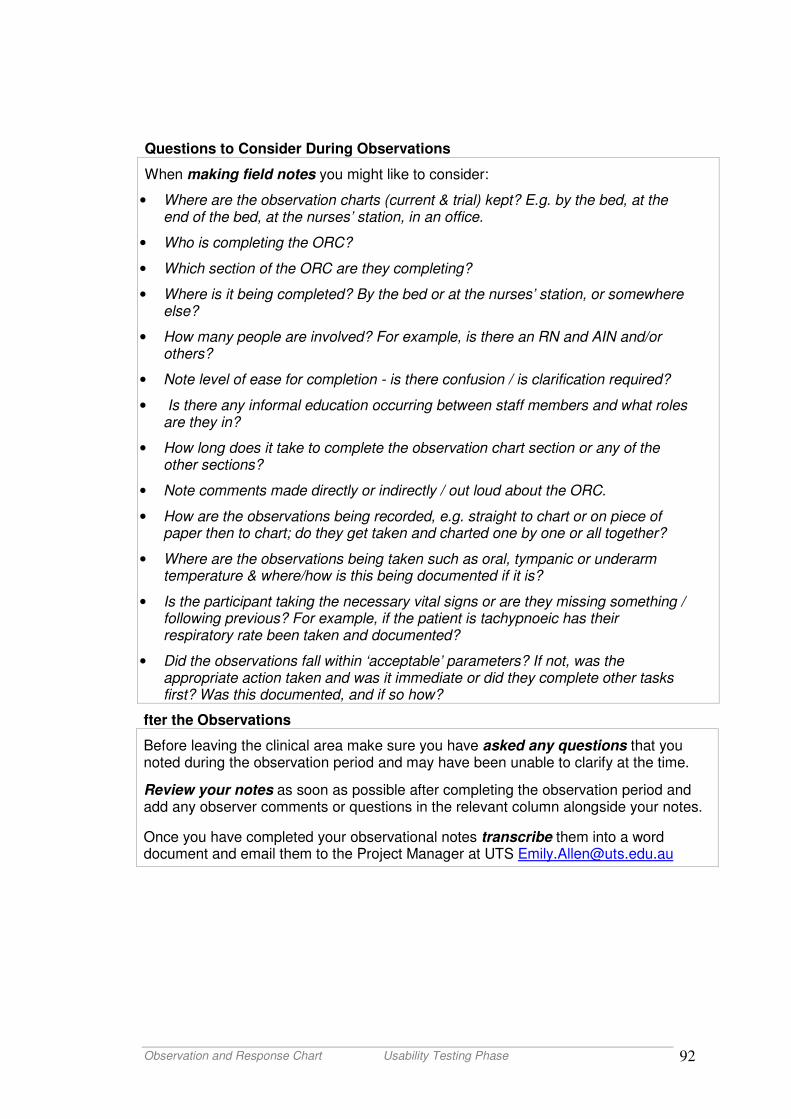
Observation and Response Chart Usability Testing Phase 92
fter the Observations
Before leaving the clinical area make sure you have asked any questions that you noted during the observation period and may have been unable to clarify at the time.
Review your notes as soon as possible after completing the observation period and add any observer comments or questions in the relevant column alongside your notes.
Once you have completed your observational notes transcribe them into a word document and email them to the Project Manager at UTS [email protected]
Questions to Consider During Observations
When making field notes you might like to consider:
• Where are the observation charts (current & trial) kept? E.g. by the bed, at the end of the bed, at the nurses’ station, in an office.
• Who is completing the ORC?
• Which section of the ORC are they completing?
• Where is it being completed? By the bed or at the nurses’ station, or somewhere else?
• How many people are involved? For example, is there an RN and AIN and/or others?
• Note level of ease for completion - is there confusion / is clarification required?
• Is there any informal education occurring between staff members and what roles are they in?
• How long does it take to complete the observation chart section or any of the other sections?
• Note comments made directly or indirectly / out loud about the ORC.
• How are the observations being recorded, e.g. straight to chart or on piece of paper then to chart; do they get taken and charted one by one or all together?
• Where are the observations being taken such as oral, tympanic or underarm temperature & where/how is this being documented if it is?
• Is the participant taking the necessary vital signs or are they missing something / following previous? For example, if the patient is tachypnoeic has their respiratory rate been taken and documented?
• Did the observations fall within ‘acceptable’ parameters? If not, was the appropriate action taken and was it immediate or did they complete other tasks first? Was this documented, and if so how?
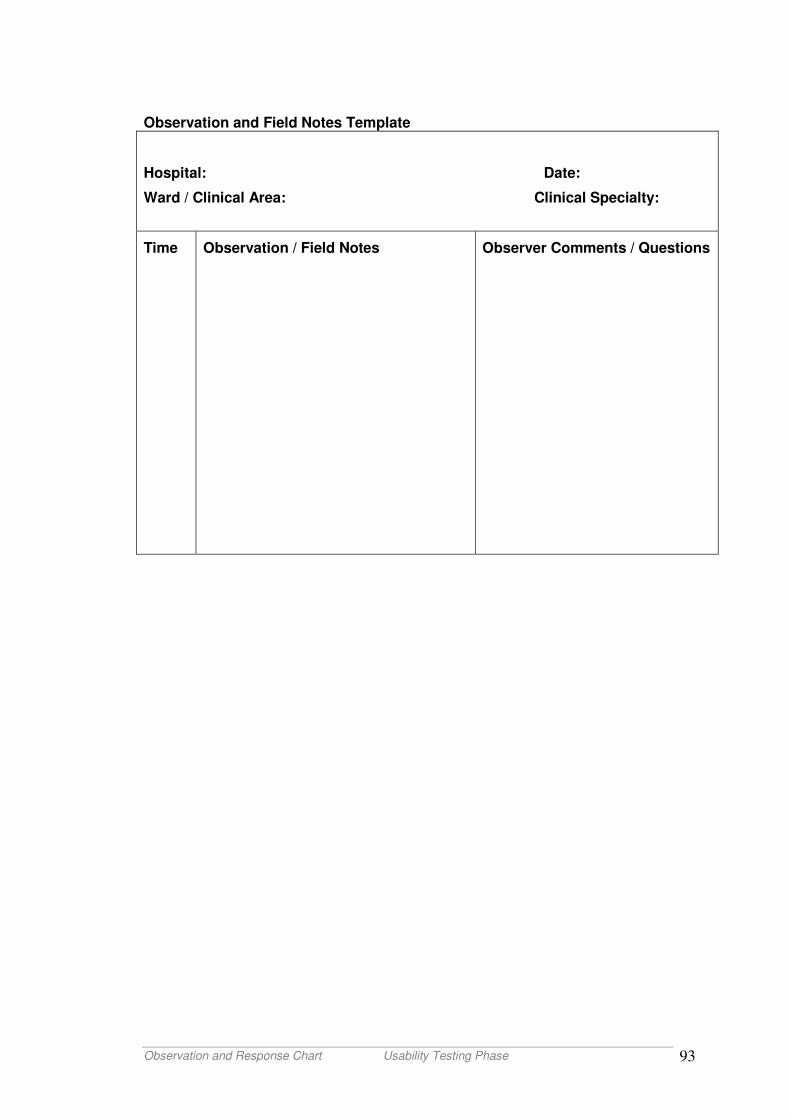
Observation and Response Chart Usability Testing Phase 93
Observation and Field Notes Template
Hospital: Date:
Ward / Clinical Area: Clinical Specialty:
Time
Observation / Field Notes Observer Comments / Questions
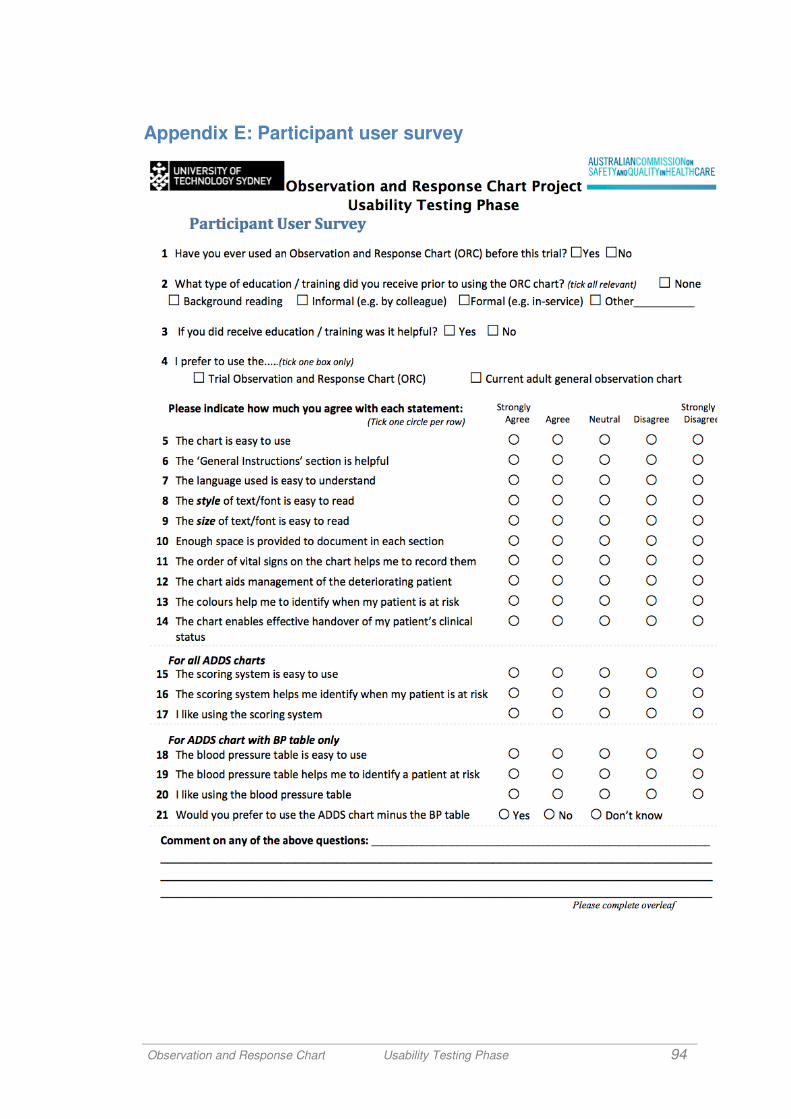
Observation and Response Chart
Appendix E: Participant user survey
Observation and Response Chart Usability Testing Phase
Participant user survey
94
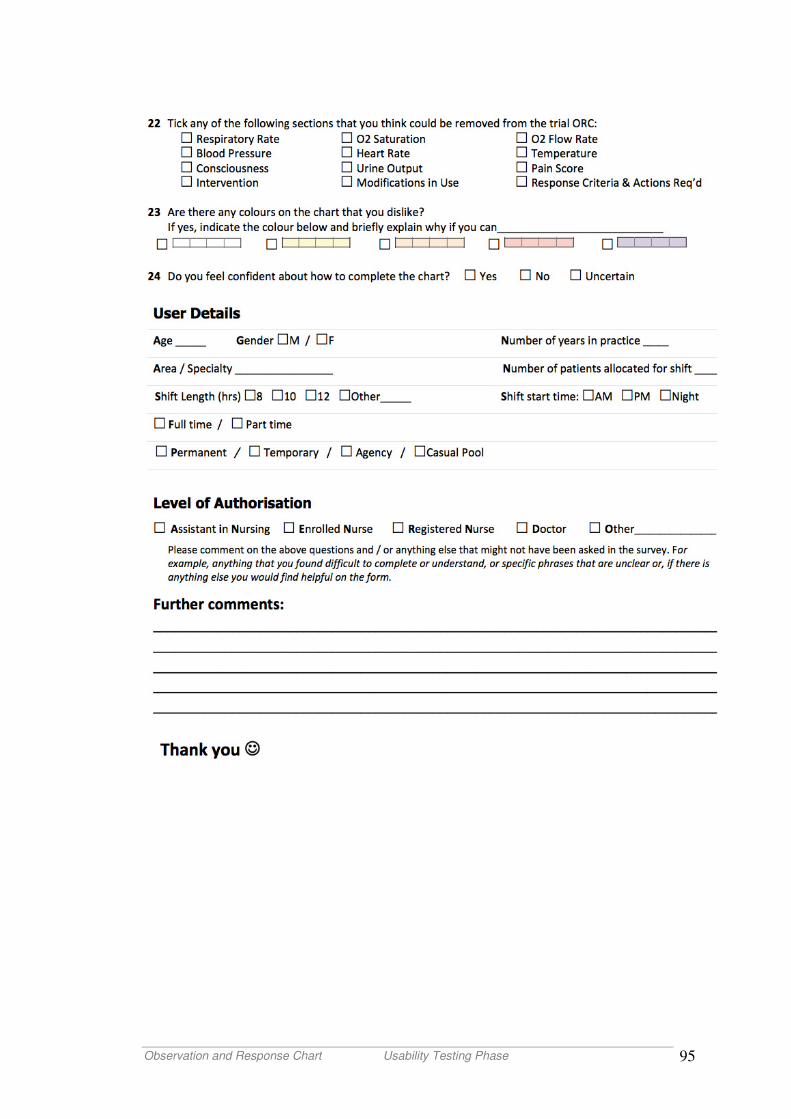
Observation and Response Chart
Observation and Response Chart Usability Testing Phase
95
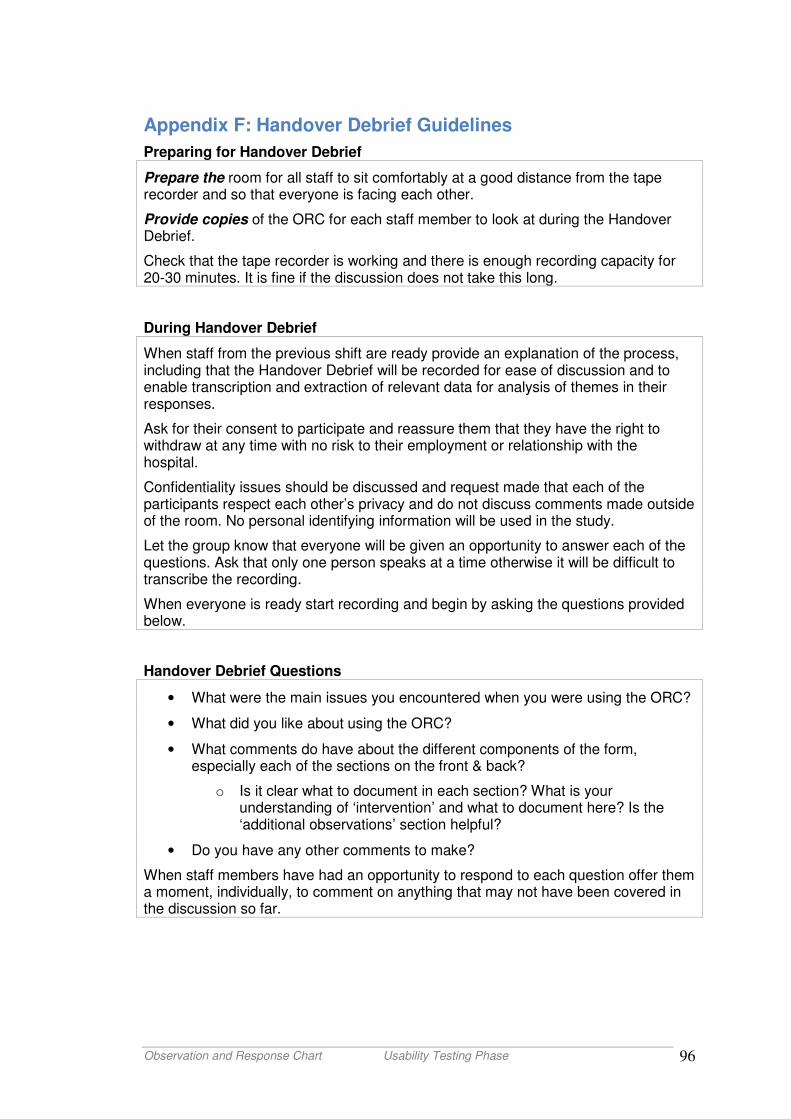
Observation and Response Chart Usability Testing Phase 96
Appendix F: Handover Debrief Guidelines
Preparing for Handover Debrief
Prepare the room for all staff to sit comfortably at a good distance from the tape recorder and so that everyone is facing each other.
Provide copies of the ORC for each staff member to look at during the Handover Debrief.
Check that the tape recorder is working and there is enough recording capacity for 20-30 minutes. It is fine if the discussion does not take this long.
During Handover Debrief
When staff from the previous shift are ready provide an explanation of the process, including that the Handover Debrief will be recorded for ease of discussion and to enable transcription and extraction of relevant data for analysis of themes in their responses.
Ask for their consent to participate and reassure them that they have the right to withdraw at any time with no risk to their employment or relationship with the hospital.
Confidentiality issues should be discussed and request made that each of the participants respect each other’s privacy and do not discuss comments made outside of the room. No personal identifying information will be used in the study.
Let the group know that everyone will be given an opportunity to answer each of the questions. Ask that only one person speaks at a time otherwise it will be difficult to transcribe the recording.
When everyone is ready start recording and begin by asking the questions provided below.
Handover Debrief Questions
• What were the main issues you encountered when you were using the ORC?
• What did you like about using the ORC?
• What comments do have about the different components of the form, especially each of the sections on the front & back?
o Is it clear what to document in each section? What is your understanding of ‘intervention’ and what to document here? Is the ‘additional observations’ section helpful?
• Do you have any other comments to make?
When staff members have had an opportunity to respond to each question offer them a moment, individually, to comment on anything that may not have been covered in the discussion so far.
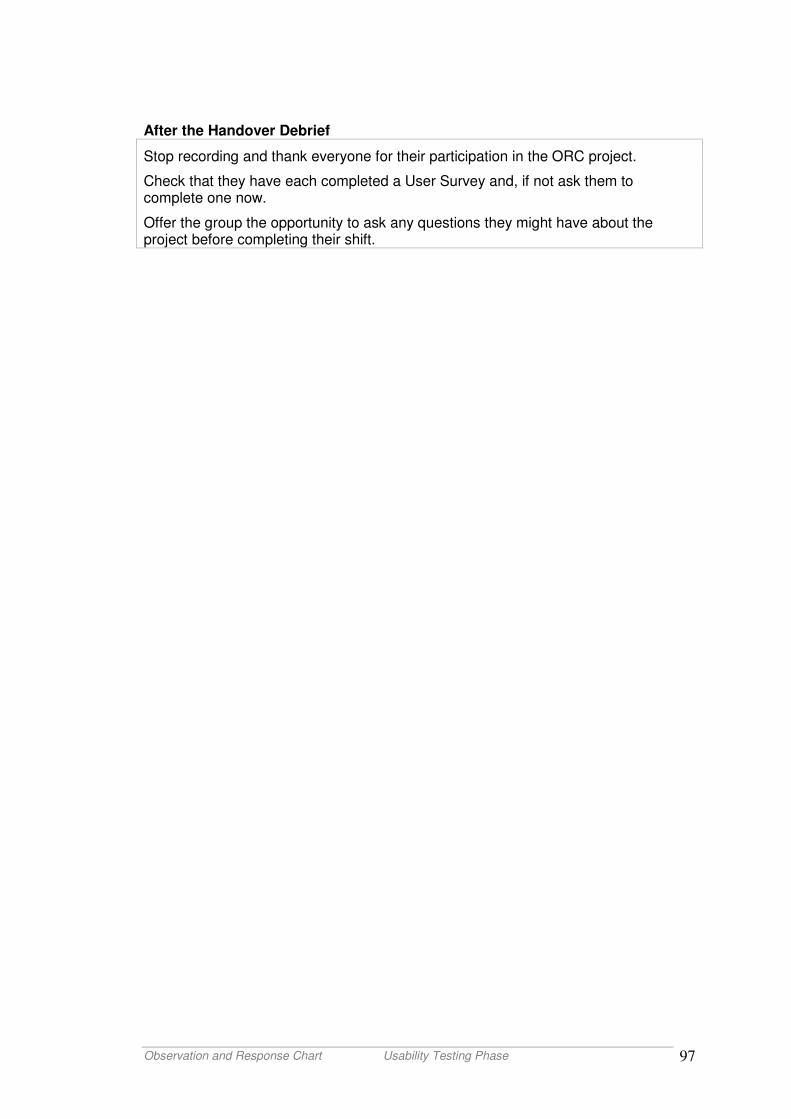
Observation and Response Chart Usability Testing Phase 97
After the Handover Debrief
Stop recording and thank everyone for their participation in the ORC project.
Check that they have each completed a User Survey and, if not ask them to complete one now.
Offer the group the opportunity to ask any questions they might have about the project before completing their shift.
Observation and Response Chart Usability Testing Phase 98
Appendix G: Audit Guidelines
Considerations
The current adult observation chart is the ‘gold standard’ when auditing i.e. the observations on this chart are considered correct.
Highlight columns where ‘Mismatched Obs’ occur for ease of entering details
Each site has its own unique link / URL – this will be emailed to each Project Officer prior to data collection.
General Audit Information Section
Question 1 - Chart ID Number
Write the ID number for the patient episode on all related charts including the trial ORC(s) and the copy(s) of the current adult observation chart.
Start at 0001, then 0002 and so on.
Question 3 - Patient Initials
Enter 2 or 3 initials (this is just for look back purposes only and not data analysis).
‘Set of obs’ definition:
A ‘set of obs’ includes all observations at one time point, i.e. each parameter that has been documented in 1 column.
Chart Information Side (front and back)
In this section you are auditing what has been documented on the Information side of the Observation and Response Chart. You do not need the current observation chart to answer any of the questions on this page.
Observation Charting (inside)
In this section you are auditing the documentation of vital signs. You will need both charts to answer questions 1, 13 & 14. Remember the current adult observation chart is the ‘gold standard’.
Tip: when answering question 13 use a highlighter to identify the columns on both charts where the mismatched obs occur. This will make it easier to answer the questions on the following pages.
Questions 2 to 12 you only need to refer to the trial ORC.
Mismatched Obs Details
Observation and Response Chart Usability Testing Phase 99
When answering the questions in this section only enter the details of 1 set of mismatched obs at a time. At the end of the page you will be asked if you have another set of mismatched obs to enter.
If yes, you will go to a new page to answer the same questions with the next set of mismatched obs. If no, you will go to Response Criteria and Actions.
You should complete the same number of pages as the answer you gave to Q13 on the Observation Charting page.
Copy of page: Mismatched Obs Details
These are a repeat of the previous page for entering extra sets of mismatched obs.
Response Criteria and Actions
In this section you are auditing how often the patient’s vital signs meet one of the response criteria, and the actions that were required for that set of obs.
N.B. If none of the patient’s vital signs required a response click No in Q2 and you will be taken to the Final Page.
Response Criteria and Action Details
When answering the questions in this section only enter the details for 1 set of obs that met one or more response criteria, and required action.
At the end of the page you will be asked if you have another set of obs meeting response criteria and requiring action.
If yes, you will go to a new page.
If no, you will go to the Final Page.
Question 3
ADDS charts will need to enter the total ADDS score for that set of obs.
R1, R2 & R4 charts will need to enter the corresponding letter(s) to the coloured section (shown above Question 3)
Copy of page: Response Criteria and Action Details
These are a repeat of the previous page for entering extra details of obs that met response criteria and actions.
Final Page
Whenever possible, it is recommended that you click Yes and check your entries. This will help to reduce data entry errors and improve quality of data.
Observation and Response Chart Usability Testing Phase 100
Other Helpful Information
If any problems contact the ORC Project Manager on 02 9514 4843 or [email protected]
Survey Monkey has been set so that you can return to the audit if you get called away. If you have any problems when trying to re-access please contact the ORC Project Manager.
Observation and Response Chart Usability Testing Phase 101
Appendix H: Participant Information Sheet
What is the purpose of the Observation and Response Chart (ORC) Project?
Improving recognition and system responses to the clinical deterioration of patients is an important goal for the Australian Commission for Safety and Quality in Health Care (ACSQHC). This project aims to test the ‘usability’ / user satisfaction of an ORC by:
Examining the suitability for clinical monitoring of patients where general adult observation charts are used and its ability to prompt a response when there is clinical deterioration and;
Identifying if any sections require modification and;
Test if the chart may be introduced and used in practice with minimal training.
Who is undertaking the ORC Project?
The University of Technology Sydney (UTS) is undertaking this project for ACSQHC. Your hospital / health service volunteered to be involved in the Project because of their interest in improving recognition and system responses to clinical deterioration of patients.
Your local Project Officer is _______________________________ (print name).
Why am I being invited to participate in the ORC Project?
You have been invited to participate because you use a general adult observation chart in your area of clinical practice to monitor your patients’ clinical condition.
If I do participate, what does it involve?
You will complete a trial chart alongside your current adult observation chart for the duration of a shift. This is because the current adult observation chart is a legal document and forms part of each patient’s medical records. The trial chart will not be filed in the medical records but kept in a locked file by the Project Officer.
During the shift the Project Officer will observe and make notes relating to the use of the trial chart. You can make comments about the use and design of the trial chart whilst being observed, and the Project Officer may also ask you questions about the usability of the trial chart.
At the end of your shift you will be asked for feedback by completing an anonymous User Survey (5-10 minutes).
You will also participate in a Handover Debrief (15-20 minutes), which will be audio recorded and transcribed by the Project Officer. No personal identifying information will be kept or linked to the transcription.
Your Project Officer will co-ordinate and support all data collection on your ward.
Observation and Response Chart Usability Testing Phase 102
Are there any risks / inconvenience to me participating in the ORC Project?
There are no foreseeable risks to your participation. There may be some inconvenience with dual documentation and the extra time required to complete the User Survey and participate in the Handover Debrief.
What if I don’t want to take part in the ORC Project, or if I want to withdraw later?
If you do not want to participate please inform the Project Officer so that you are not rostered on a chart trial shift. Not participating will not influence your employment or working relationships.
Who do I contact if I have any concerns or complaints?
ORC Project Manager, Emily Allen on [email protected] or 02 9514 4843
ORC Project Officer, <details to be inserted>
Local HREC, <details to be inserted>
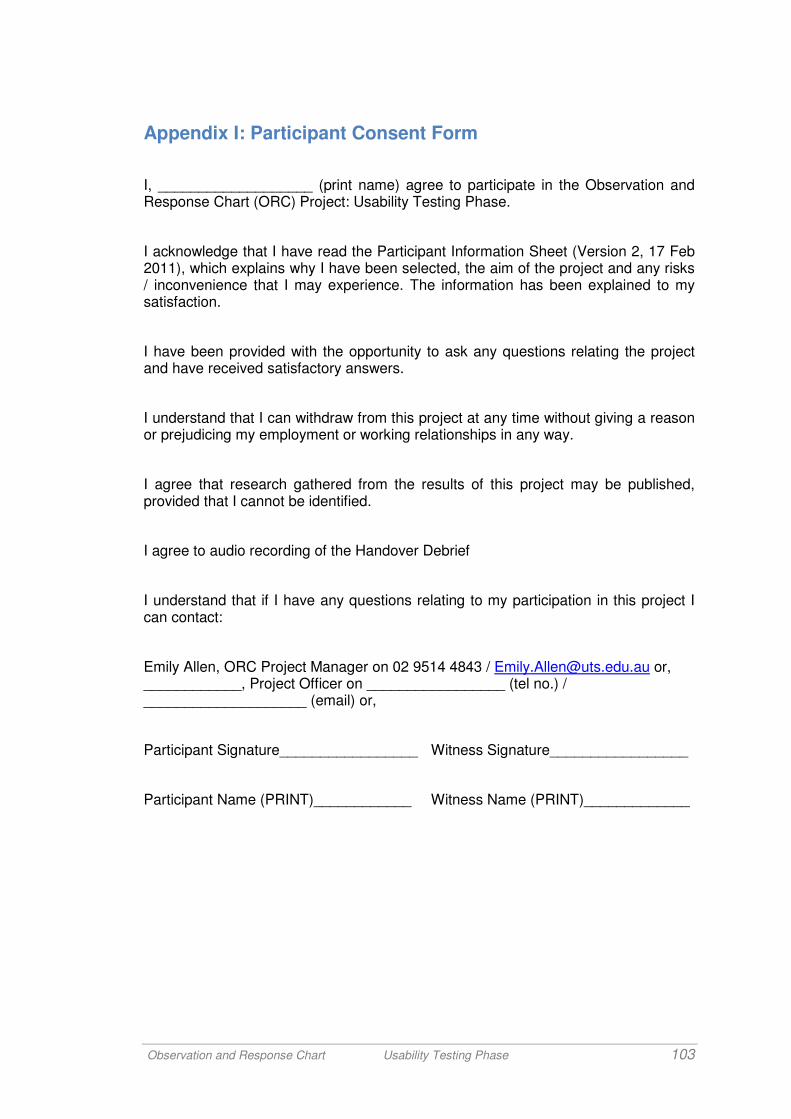
Observation and Response Chart Usability Testing Phase 103
Appendix I: Participant Consent Form
I, ___________________ (print name) agree to participate in the Observation and Response Chart (ORC) Project: Usability Testing Phase.
I acknowledge that I have read the Participant Information Sheet (Version 2, 17 Feb 2011), which explains why I have been selected, the aim of the project and any risks / inconvenience that I may experience. The information has been explained to my satisfaction.
I have been provided with the opportunity to ask any questions relating the project and have received satisfactory answers.
I understand that I can withdraw from this project at any time without giving a reason or prejudicing my employment or working relationships in any way.
I agree that research gathered from the results of this project may be published, provided that I cannot be identified.
I agree to audio recording of the Handover Debrief
I understand that if I have any questions relating to my participation in this project I can contact:
Emily Allen, ORC Project Manager on 02 9514 4843 / [email protected] or, ____________, Project Officer on _________________ (tel no.) / ____________________ (email) or,
Participant Signature_________________ Witness Signature_________________
Participant Name (PRINT)____________ Witness Name (PRINT)_____________
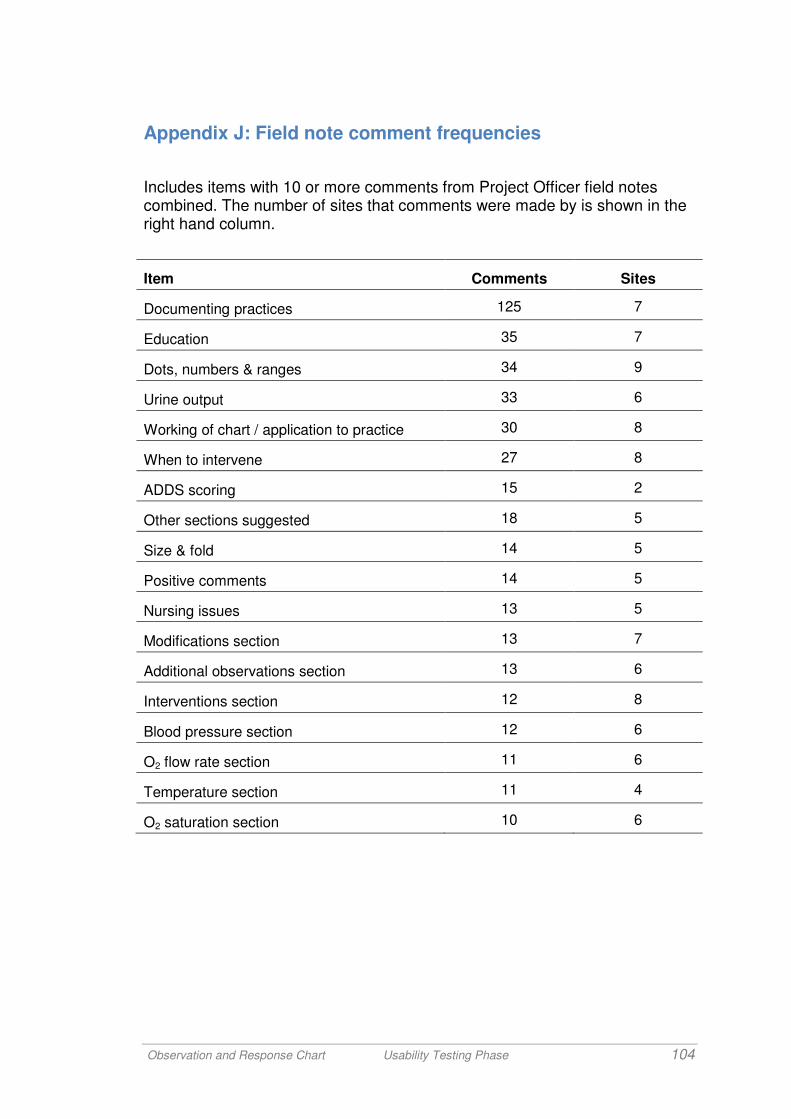
Observation and Response Chart Usability Testing Phase 104
Appendix J: Field note comment frequencies
Includes items with 10 or more comments from Project Officer field notes combined. The number of sites that comments were made by is shown in the right hand column.
Item Comments Sites
Documenting practices 125 7
Education 35 7
Dots, numbers & ranges 34 9
Urine output 33 6
Working of chart / application to practice 30 8
When to intervene 27 8
ADDS scoring 15 2
Other sections suggested 18 5
Size & fold 14 5
Positive comments 14 5
Nursing issues 13 5
Modifications section 13 7
Additional observations section 13 6
Interventions section 12 8
Blood pressure section 12 6
O2 flow rate section 11 6
Temperature section 11 4
O2 saturation section 10 6
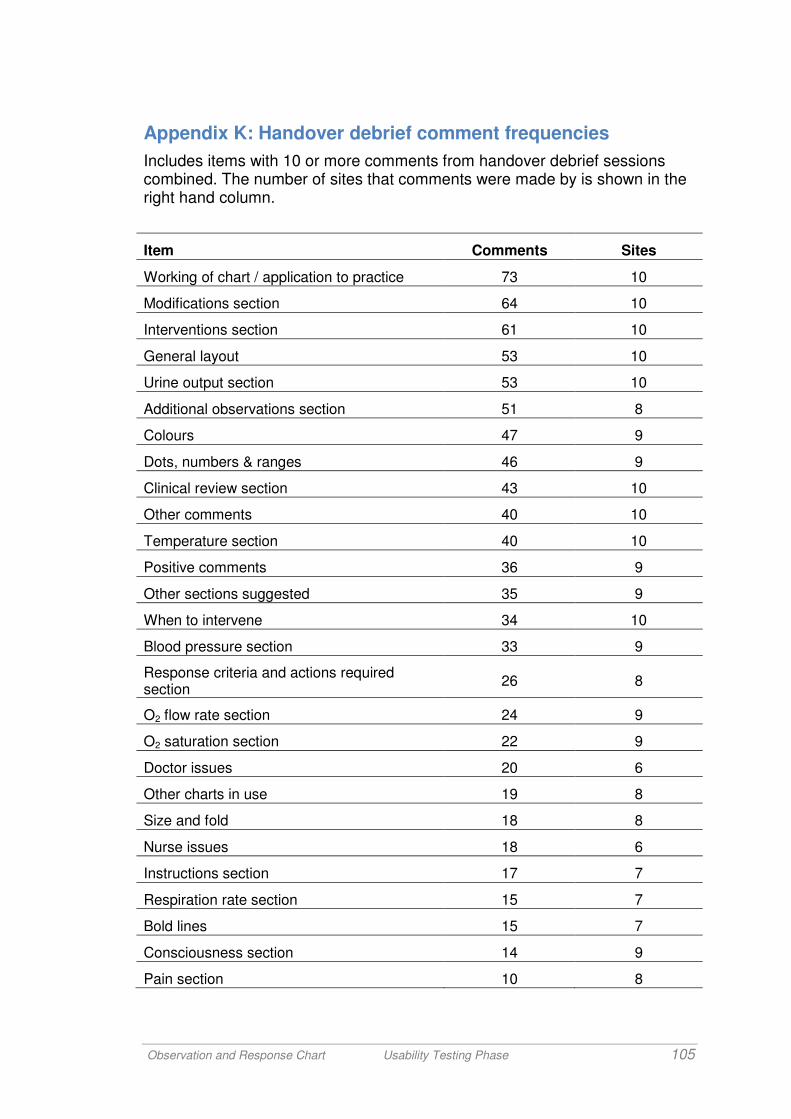
Observation and Response Chart Usability Testing Phase 105
Appendix K: Handover debrief comment frequencies
Includes items with 10 or more comments from handover debrief sessions combined. The number of sites that comments were made by is shown in the right hand column.
Item Comments Sites
Working of chart / application to practice 73 10
Modifications section 64 10
Interventions section 61 10
General layout 53 10
Urine output section 53 10
Additional observations section 51 8
Colours 47 9
Dots, numbers & ranges 46 9
Clinical review section 43 10
Other comments 40 10
Temperature section 40 10
Positive comments 36 9
Other sections suggested 35 9
When to intervene 34 10
Blood pressure section 33 9
Response criteria and actions required section
26 8
O2 flow rate section 24 9
O2 saturation section 22 9
Doctor issues 20 6
Other charts in use 19 8
Size and fold 18 8
Nurse issues 18 6
Instructions section 17 7
Respiration rate section 15 7
Bold lines 15 7
Consciousness section 14 9
Pain section 10 8
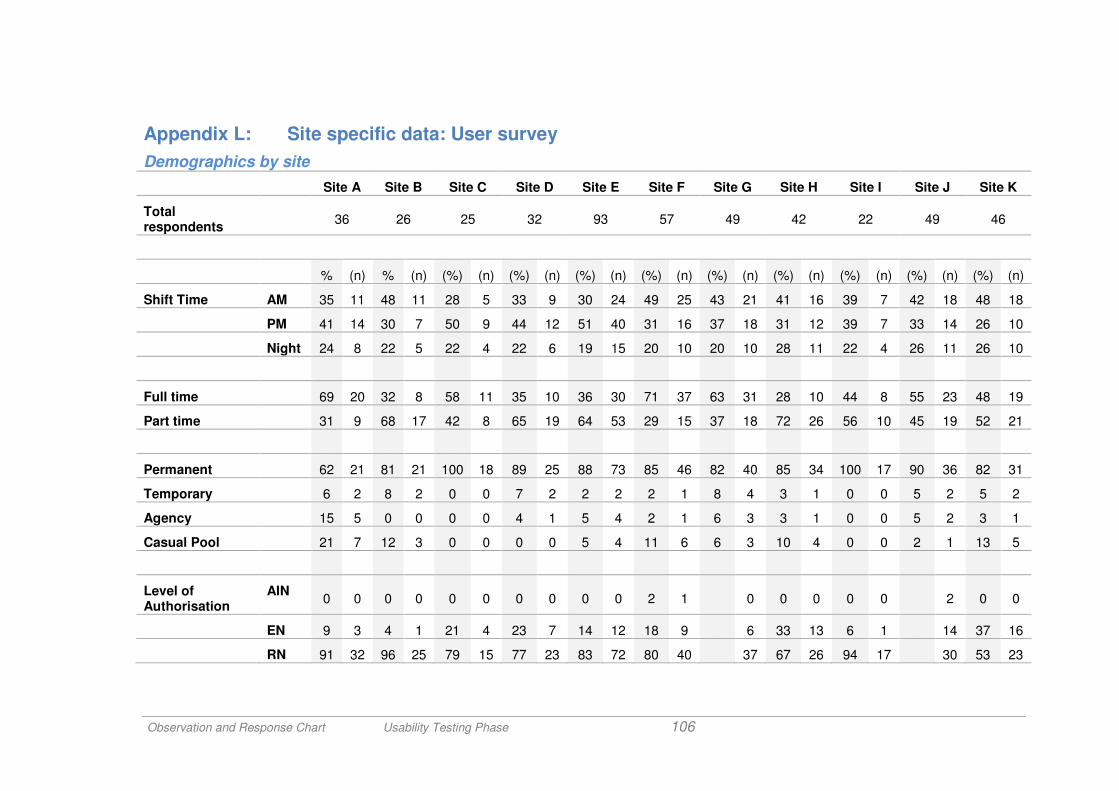
Observation and Response Chart Usability Testing Phase 106
Appendix L: Site specific data: User survey
Demographics by site
Site A Site B Site C Site D Site E Site F Site G Site H Site I Site J Site K
Total respondents
36 26 25 32 93 57 49 42 22 49 46
% (n) % (n) (%) (n) (%) (n) (%) (n) (%) (n) (%) (n) (%) (n) (%) (n) (%) (n) (%) (n)
Shift Time AM 35 11 48 11 28 5 33 9 30 24 49 25 43 21 41 16 39 7 42 18 48 18
PM 41 14 30 7 50 9 44 12 51 40 31 16 37 18 31 12 39 7 33 14 26 10
Night 24 8 22 5 22 4 22 6 19 15 20 10 20 10 28 11 22 4 26 11 26 10
Full time 69 20 32 8 58 11 35 10 36 30 71 37 63 31 28 10 44 8 55 23 48 19
Part time 31 9 68 17 42 8 65 19 64 53 29 15 37 18 72 26 56 10 45 19 52 21
Permanent 62 21 81 21 100 18 89 25 88 73 85 46 82 40 85 34 100 17 90 36 82 31
Temporary 6 2 8 2 0 0 7 2 2 2 2 1 8 4 3 1 0 0 5 2 5 2
Agency 15 5 0 0 0 0 4 1 5 4 2 1 6 3 3 1 0 0 5 2 3 1
Casual Pool 21 7 12 3 0 0 0 0 5 4 11 6 6 3 10 4 0 0 2 1 13 5
Level of Authorisation
AIN 0 0 0 0 0 0 0 0 0 0 2 1 0 0 0 0 0 2 0 0
EN 9 3 4 1 21 4 23 7 14 12 18 9 6 33 13 6 1 14 37 16
RN 91 32 96 25 79 15 77 23 83 72 80 40 37 67 26 94 17 30 53 23
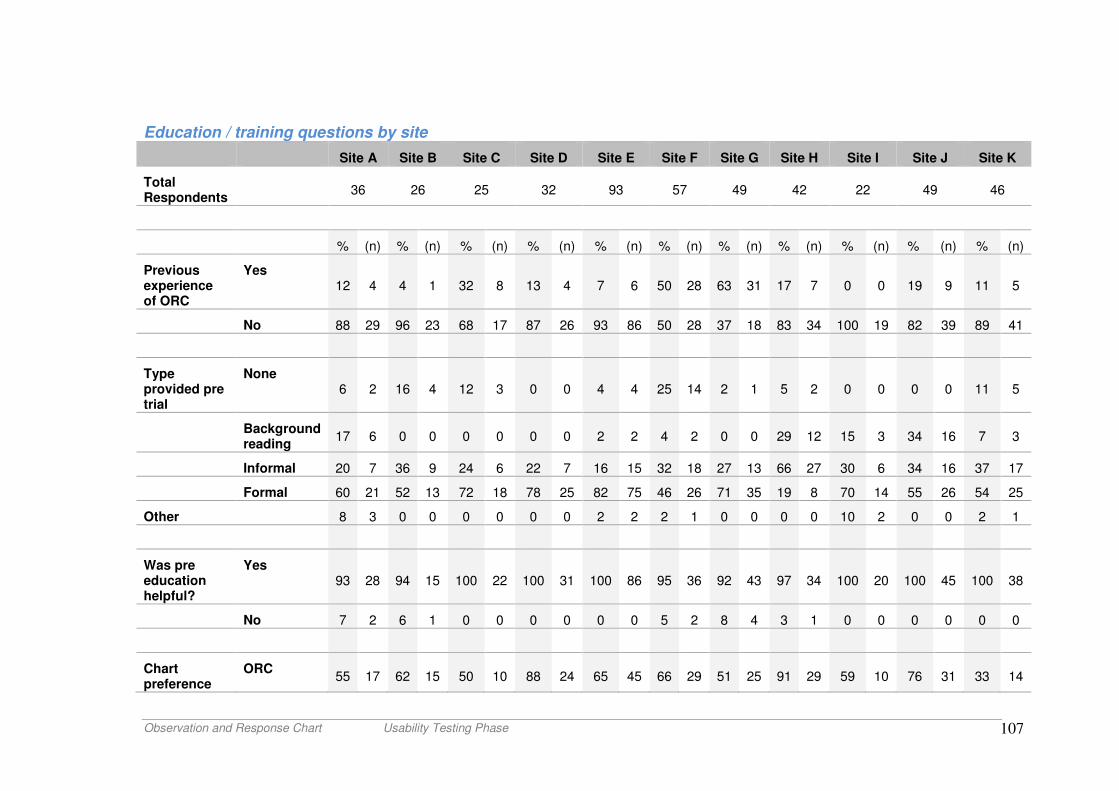
Observation and Response Chart Usability Testing Phase 107
Education / training questions by site
Site A Site B Site C Site D Site E Site F Site G Site H Site I Site J Site K
Total Respondents
36 26 25 32 93 57 49 42 22 49 46
% (n) % (n) % (n) % (n) % (n) % (n) % (n) % (n) % (n) % (n) % (n)
Previous experience of ORC
Yes 12 4 4 1 32 8 13 4 7 6 50 28 63 31 17 7 0 0 19 9 11 5
No 88 29 96 23 68 17 87 26 93 86 50 28 37 18 83 34 100 19 82 39 89 41
Type provided pre trial
None 6 2 16 4 12 3 0 0 4 4 25 14 2 1 5 2 0 0 0 0 11 5
Background reading
17 6 0 0 0 0 0 0 2 2 4 2 0 0 29 12 15 3 34 16 7 3
Informal 20 7 36 9 24 6 22 7 16 15 32 18 27 13 66 27 30 6 34 16 37 17
Formal 60 21 52 13 72 18 78 25 82 75 46 26 71 35 19 8 70 14 55 26 54 25
Other 8 3 0 0 0 0 0 0 2 2 2 1 0 0 0 0 10 2 0 0 2 1
Was pre education helpful?
Yes 93 28 94 15 100 22 100 31 100 86 95 36 92 43 97 34 100 20 100 45 100 38
No 7 2 6 1 0 0 0 0 0 0 5 2 8 4 3 1 0 0 0 0 0 0
Chart preference
ORC 55 17 62 15 50 10 88 24 65 45 66 29 51 25 91 29 59 10 76 31 33 14
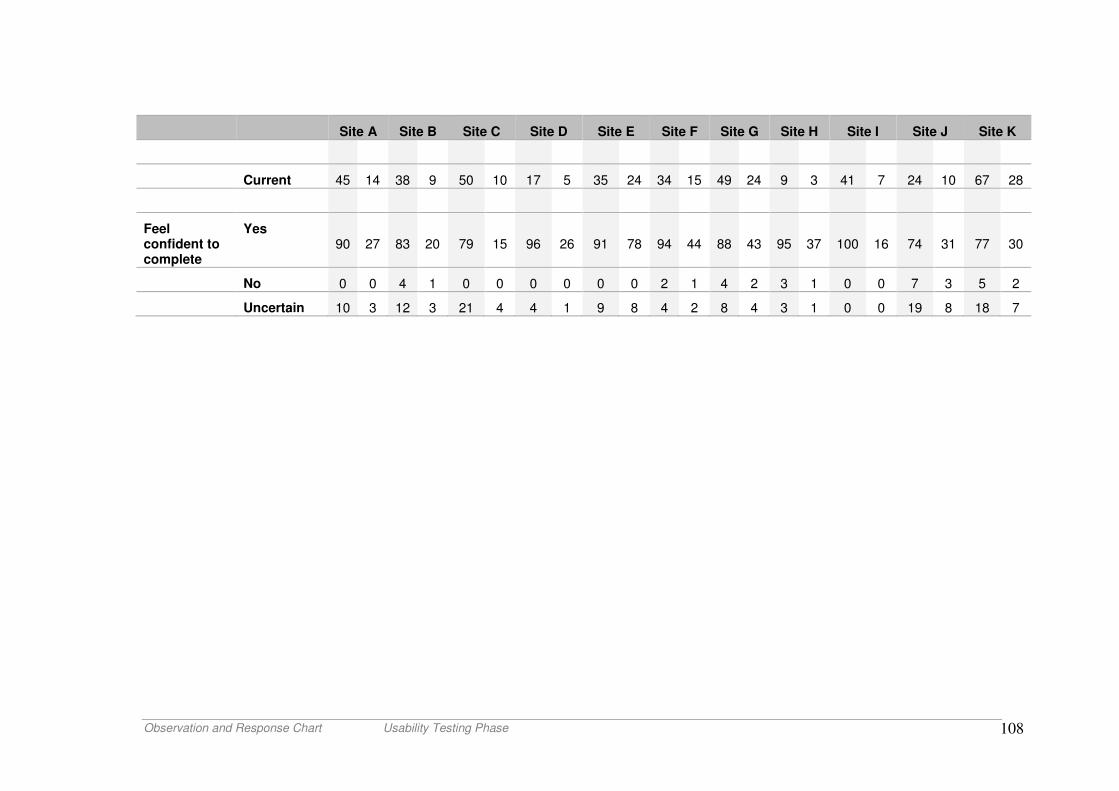
Observation and Response Chart Usability Testing Phase 108
Site A Site B Site C Site D Site E Site F Site G Site H Site I Site J Site K
Current 45 14 38 9 50 10 17 5 35 24 34 15 49 24 9 3 41 7 24 10 67 28
Feel confident to complete
Yes 90 27 83 20 79 15 96 26 91 78 94 44 88 43 95 37 100 16 74 31 77 30
No 0 0 4 1 0 0 0 0 0 0 2 1 4 2 3 1 0 0 7 3 5 2
Uncertain 10 3 12 3 21 4 4 1 9 8 4 2 8 4 3 1 0 0 19 8 18 7
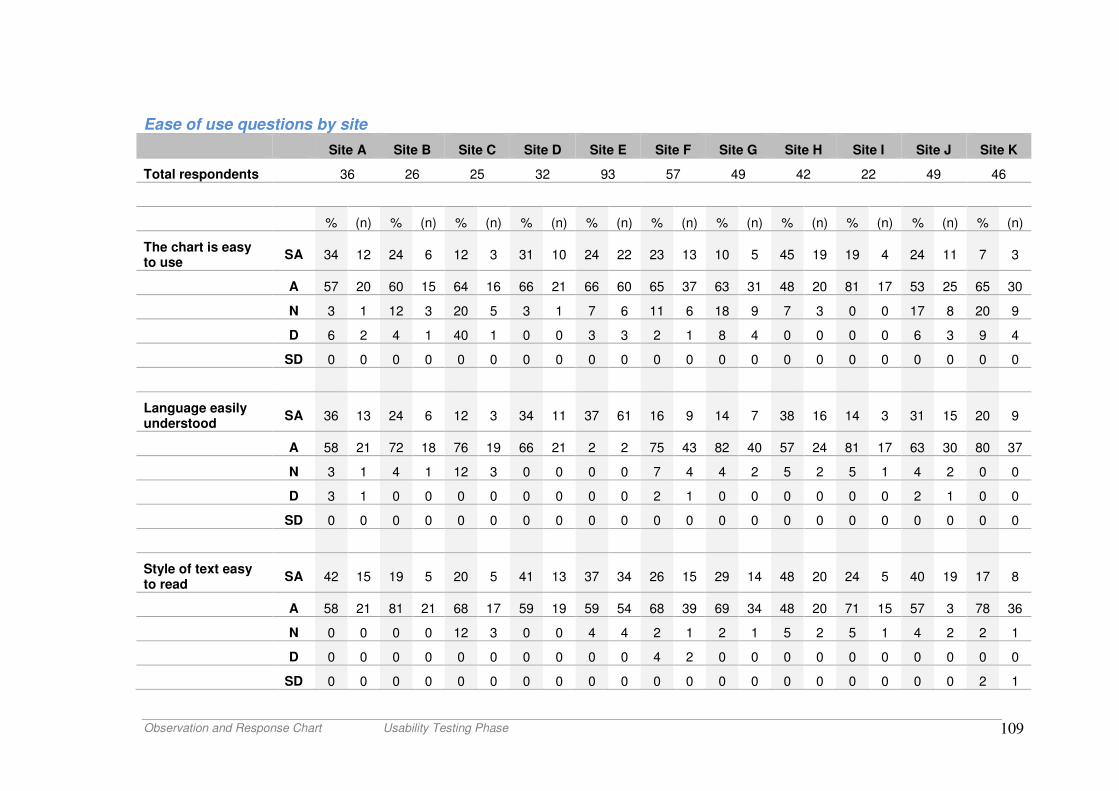
Observation and Response Chart Usability Testing Phase 109
Ease of use questions by site
Site A Site B Site C Site D Site E Site F Site G Site H Site I Site J Site K
Total respondents 36 26 25 32 93 57 49 42 22 49 46
% (n) % (n) % (n) % (n) % (n) % (n) % (n) % (n) % (n) % (n) % (n)
The chart is easy to use
SA 34 12 24 6 12 3 31 10 24 22 23 13 10 5 45 19 19 4 24 11 7 3
A 57 20 60 15 64 16 66 21 66 60 65 37 63 31 48 20 81 17 53 25 65 30
N 3 1 12 3 20 5 3 1 7 6 11 6 18 9 7 3 0 0 17 8 20 9
D 6 2 4 1 40 1 0 0 3 3 2 1 8 4 0 0 0 0 6 3 9 4
SD 0 0 0 0 0 0 0 0 0 0 0 0 0 0 0 0 0 0 0 0 0 0
Language easily understood
SA 36 13 24 6 12 3 34 11 37 61 16 9 14 7 38 16 14 3 31 15 20 9
A 58 21 72 18 76 19 66 21 2 2 75 43 82 40 57 24 81 17 63 30 80 37
N 3 1 4 1 12 3 0 0 0 0 7 4 4 2 5 2 5 1 4 2 0 0
D 3 1 0 0 0 0 0 0 0 0 2 1 0 0 0 0 0 0 2 1 0 0
SD 0 0 0 0 0 0 0 0 0 0 0 0 0 0 0 0 0 0 0 0 0 0
Style of text easy to read
SA 42 15 19 5 20 5 41 13 37 34 26 15 29 14 48 20 24 5 40 19 17 8
A 58 21 81 21 68 17 59 19 59 54 68 39 69 34 48 20 71 15 57 3 78 36
N 0 0 0 0 12 3 0 0 4 4 2 1 2 1 5 2 5 1 4 2 2 1
D 0 0 0 0 0 0 0 0 0 0 4 2 0 0 0 0 0 0 0 0 0 0
SD 0 0 0 0 0 0 0 0 0 0 0 0 0 0 0 0 0 0 0 0 2 1
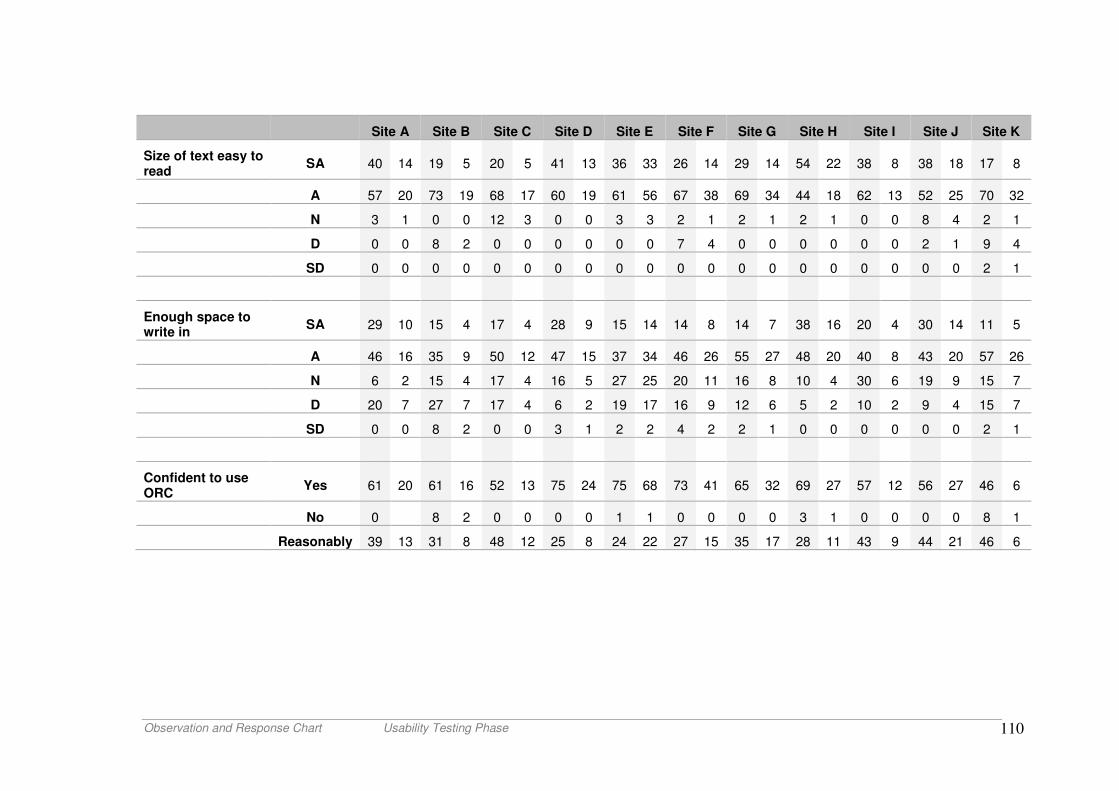
Observation and Response Chart Usability Testing Phase 110
Site A Site B Site C Site D Site E Site F Site G Site H Site I Site J Site K
Size of text easy to read
SA 40 14 19 5 20 5 41 13 36 33 26 14 29 14 54 22 38 8 38 18 17 8
A 57 20 73 19 68 17 60 19 61 56 67 38 69 34 44 18 62 13 52 25 70 32
N 3 1 0 0 12 3 0 0 3 3 2 1 2 1 2 1 0 0 8 4 2 1
D 0 0 8 2 0 0 0 0 0 0 7 4 0 0 0 0 0 0 2 1 9 4
SD 0 0 0 0 0 0 0 0 0 0 0 0 0 0 0 0 0 0 0 0 2 1
Enough space to write in
SA 29 10 15 4 17 4 28 9 15 14 14 8 14 7 38 16 20 4 30 14 11 5
A 46 16 35 9 50 12 47 15 37 34 46 26 55 27 48 20 40 8 43 20 57 26
N 6 2 15 4 17 4 16 5 27 25 20 11 16 8 10 4 30 6 19 9 15 7
D 20 7 27 7 17 4 6 2 19 17 16 9 12 6 5 2 10 2 9 4 15 7
SD 0 0 8 2 0 0 3 1 2 2 4 2 2 1 0 0 0 0 0 0 2 1
Confident to use ORC
Yes 61 20 61 16 52 13 75 24 75 68 73 41 65 32 69 27 57 12 56 27 46 6
No 0 8 2 0 0 0 0 1 1 0 0 0 0 3 1 0 0 0 0 8 1
Reasonably 39 13 31 8 48 12 25 8 24 22 27 15 35 17 28 11 43 9 44 21 46 6
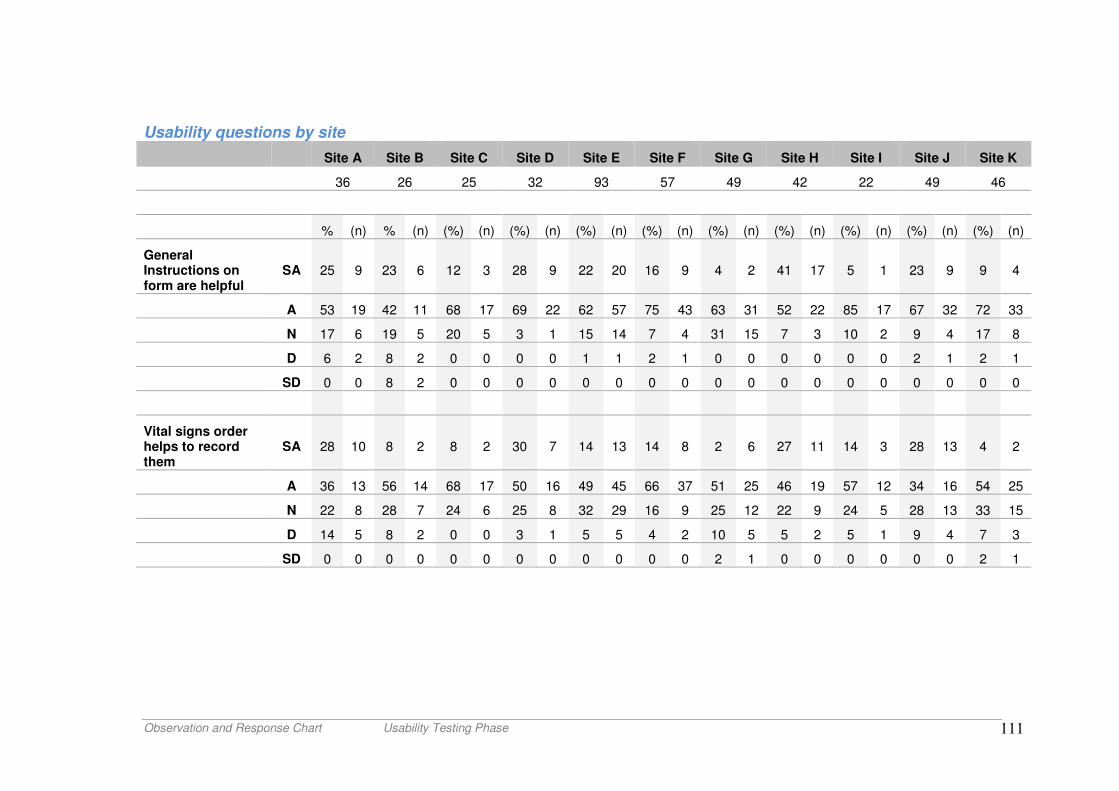
Observation and Response Chart Usability Testing Phase 111
Usability questions by site
Site A Site B Site C Site D Site E Site F Site G Site H Site I Site J Site K
36 26 25 32 93 57 49 42 22 49 46
% (n) % (n) (%) (n) (%) (n) (%) (n) (%) (n) (%) (n) (%) (n) (%) (n) (%) (n) (%) (n)
General Instructions on form are helpful
SA 25 9 23 6 12 3 28 9 22 20 16 9 4 2 41 17 5 1 23 9 9 4
A 53 19 42 11 68 17 69 22 62 57 75 43 63 31 52 22 85 17 67 32 72 33
N 17 6 19 5 20 5 3 1 15 14 7 4 31 15 7 3 10 2 9 4 17 8
D 6 2 8 2 0 0 0 0 1 1 2 1 0 0 0 0 0 0 2 1 2 1
SD 0 0 8 2 0 0 0 0 0 0 0 0 0 0 0 0 0 0 0 0 0 0
Vital signs order helps to record them
SA 28 10 8 2 8 2 30 7 14 13 14 8 2 6 27 11 14 3 28 13 4 2
A 36 13 56 14 68 17 50 16 49 45 66 37 51 25 46 19 57 12 34 16 54 25
N 22 8 28 7 24 6 25 8 32 29 16 9 25 12 22 9 24 5 28 13 33 15
D 14 5 8 2 0 0 3 1 5 5 4 2 10 5 5 2 5 1 9 4 7 3
SD 0 0 0 0 0 0 0 0 0 0 0 0 2 1 0 0 0 0 0 0 2 1
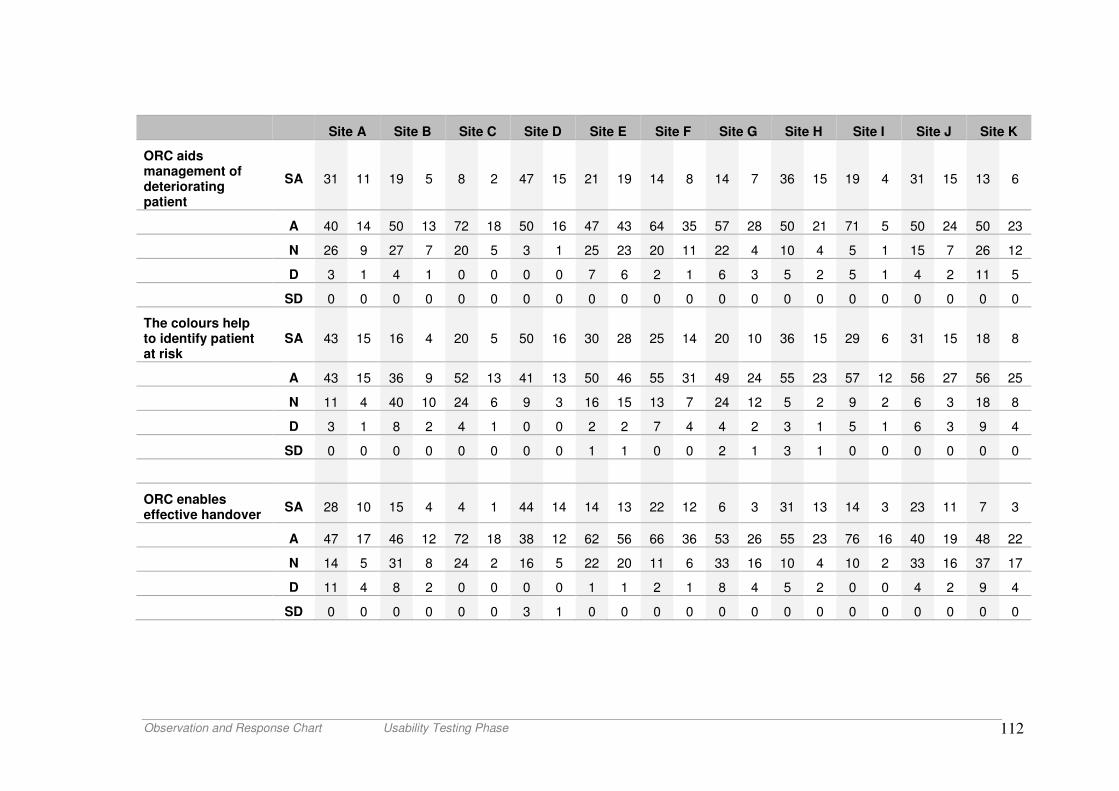
Observation and Response Chart Usability Testing Phase 112
Site A Site B Site C Site D Site E Site F Site G Site H Site I Site J Site K
ORC aids management of deteriorating patient
SA 31 11 19 5 8 2 47 15 21 19 14 8 14 7 36 15 19 4 31 15 13 6
A 40 14 50 13 72 18 50 16 47 43 64 35 57 28 50 21 71 5 50 24 50 23
N 26 9 27 7 20 5 3 1 25 23 20 11 22 4 10 4 5 1 15 7 26 12
D 3 1 4 1 0 0 0 0 7 6 2 1 6 3 5 2 5 1 4 2 11 5
SD 0 0 0 0 0 0 0 0 0 0 0 0 0 0 0 0 0 0 0 0 0 0
The colours help to identify patient at risk
SA 43 15 16 4 20 5 50 16 30 28 25 14 20 10 36 15 29 6 31 15 18 8
A 43 15 36 9 52 13 41 13 50 46 55 31 49 24 55 23 57 12 56 27 56 25
N 11 4 40 10 24 6 9 3 16 15 13 7 24 12 5 2 9 2 6 3 18 8
D 3 1 8 2 4 1 0 0 2 2 7 4 4 2 3 1 5 1 6 3 9 4
SD 0 0 0 0 0 0 0 0 1 1 0 0 2 1 3 1 0 0 0 0 0 0
ORC enables effective handover
SA 28 10 15 4 4 1 44 14 14 13 22 12 6 3 31 13 14 3 23 11 7 3
A 47 17 46 12 72 18 38 12 62 56 66 36 53 26 55 23 76 16 40 19 48 22
N 14 5 31 8 24 2 16 5 22 20 11 6 33 16 10 4 10 2 33 16 37 17
D 11 4 8 2 0 0 0 0 1 1 2 1 8 4 5 2 0 0 4 2 9 4
SD 0 0 0 0 0 0 3 1 0 0 0 0 0 0 0 0 0 0 0 0 0 0
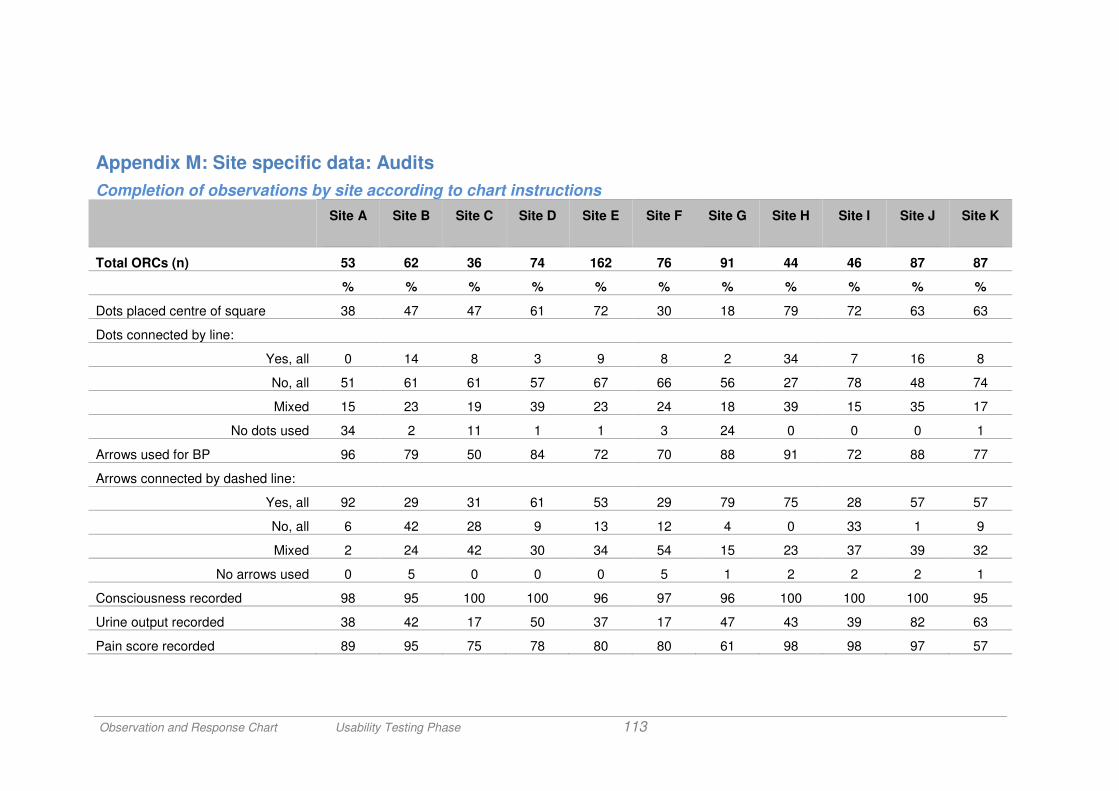
Observation and Response Chart Usability Testing Phase 113
Appendix M: Site specific data: Audits
Completion of observations by site according to chart instructions
Site A
Site B
Site C
Site D
Site E
Site F Site G
Site H
Site I
Site J
Site K
Total ORCs (n) 53 62 36 74 162 76 91 44 46 87 87
% % % % % % % % % % %
Dots placed centre of square 38 47 47 61 72 30 18 79 72 63 63
Dots connected by line:
Yes, all 0 14 8 3 9 8 2 34 7 16 8
No, all 51 61 61 57 67 66 56 27 78 48 74
Mixed 15 23 19 39 23 24 18 39 15 35 17
No dots used 34 2 11 1 1 3 24 0 0 0 1
Arrows used for BP 96 79 50 84 72 70 88 91 72 88 77
Arrows connected by dashed line:
Yes, all 92 29 31 61 53 29 79 75 28 57 57
No, all 6 42 28 9 13 12 4 0 33 1 9
Mixed 2 24 42 30 34 54 15 23 37 39 32
No arrows used 0 5 0 0 0 5 1 2 2 2 1
Consciousness recorded 98 95 100 100 96 97 96 100 100 100 95
Urine output recorded 38 42 17 50 37 17 47 43 39 82 63
Pain score recorded 89 95 75 78 80 80 61 98 98 97 57
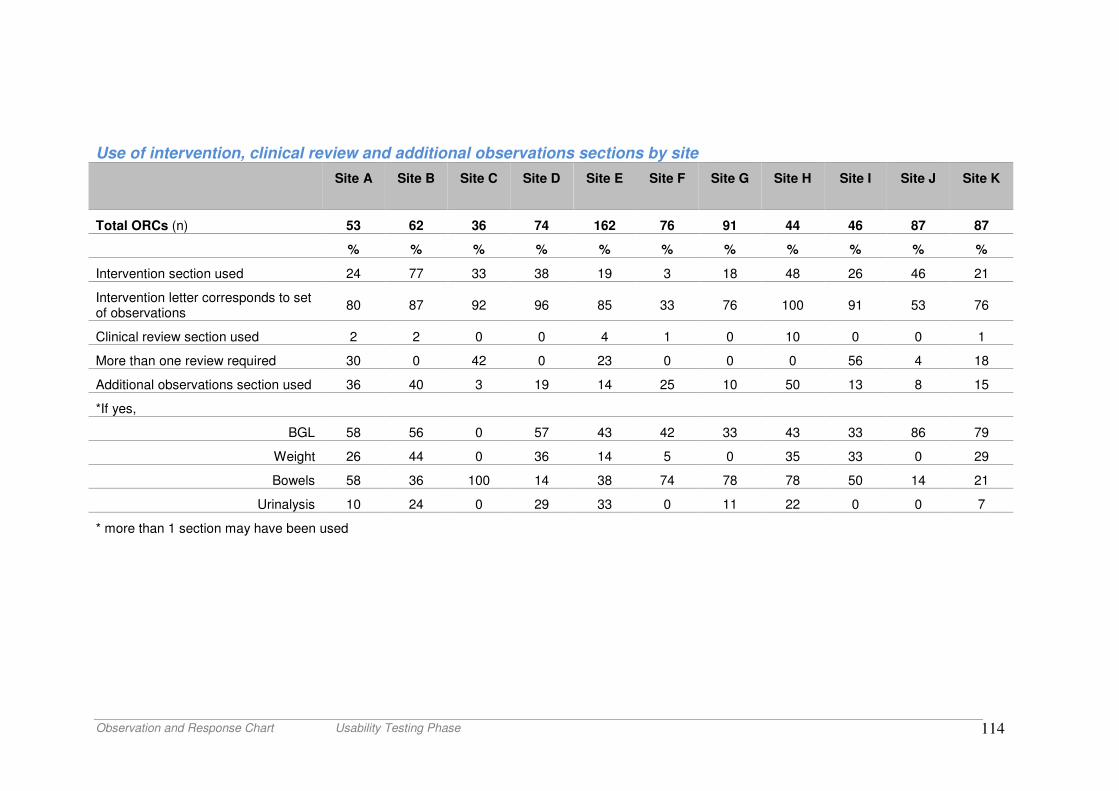
Observation and Response Chart Usability Testing Phase 114
Use of intervention, clinical review and additional observations sections by site
Site A Site B
Site C Site D Site E Site F Site G Site H Site I Site J Site K
Total ORCs (n) 53 62 36 74 162 76 91 44 46 87 87
% % % % % % % % % % %
Intervention section used 24 77 33 38 19 3 18 48 26 46 21
Intervention letter corresponds to set of observations
80 87 92 96 85 33 76 100 91 53 76
Clinical review section used 2 2 0 0 4 1 0 10 0 0 1
More than one review required 30 0 42 0 23 0 0 0 56 4 18
Additional observations section used 36 40 3 19 14 25 10 50 13 8 15
*If yes,
BGL 58 56 0 57 43 42 33 43 33 86 79
Weight 26 44 0 36 14 5 0 35 33 0 29
Bowels 58 36 100 14 38 74 78 78 50 14 21
Urinalysis 10 24 0 29 33 0 11 22 0 0 7
* more than 1 section may have been used
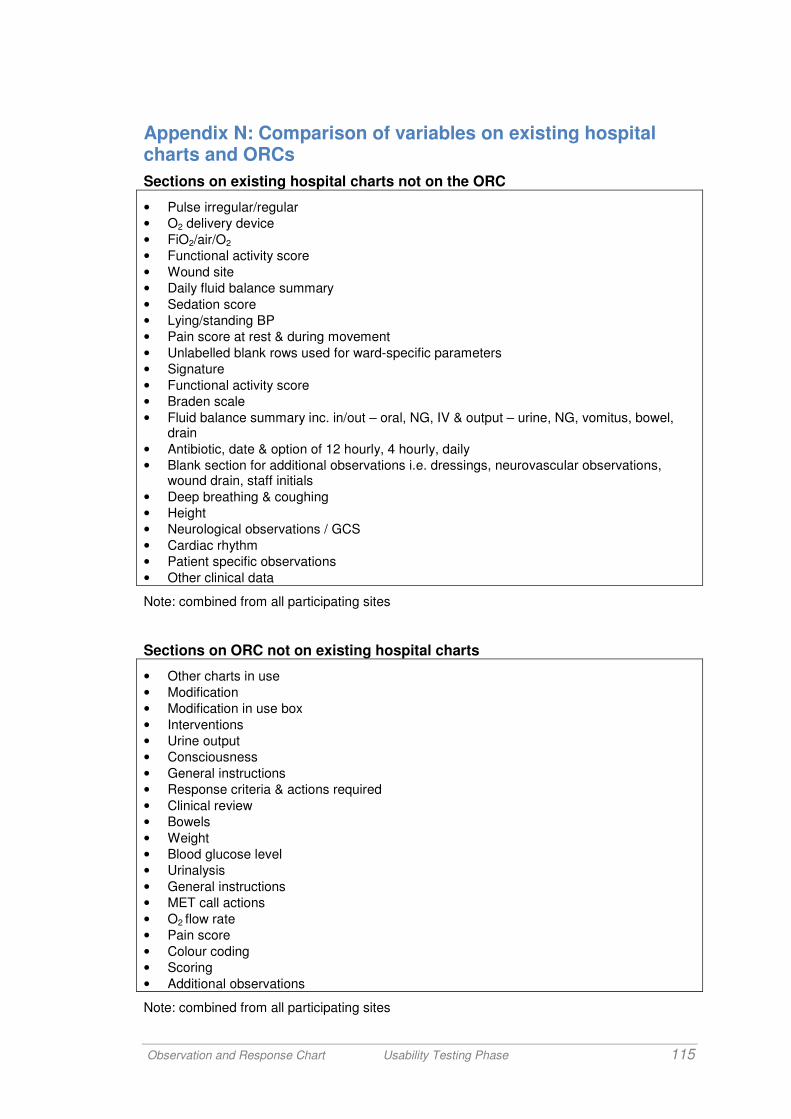
Observation and Response Chart Usability Testing Phase 115
Appendix N: Comparison of variables on existing hospital charts and ORCs
Sections on existing hospital charts not on the ORC
• Pulse irregular/regular
• O2 delivery device
• FiO2/air/O2
• Functional activity score
• Wound site
• Daily fluid balance summary
• Sedation score
• Lying/standing BP
• Pain score at rest & during movement
• Unlabelled blank rows used for ward-specific parameters
• Signature
• Functional activity score
• Braden scale
• Fluid balance summary inc. in/out – oral, NG, IV & output – urine, NG, vomitus, bowel, drain
• Antibiotic, date & option of 12 hourly, 4 hourly, daily
• Blank section for additional observations i.e. dressings, neurovascular observations, wound drain, staff initials
• Deep breathing & coughing
• Height
• Neurological observations / GCS
• Cardiac rhythm
• Patient specific observations
• Other clinical data
Note: combined from all participating sites
Sections on ORC not on existing hospital charts
• Other charts in use
• Modification
• Modification in use box
• Interventions
• Urine output
• Consciousness
• General instructions
• Response criteria & actions required
• Clinical review
• Bowels
• Weight
• Blood glucose level
• Urinalysis
• General instructions
• MET call actions
• O2 flow rate
• Pain score
• Colour coding
• Scoring
• Additional observations
Note: combined from all participating sites
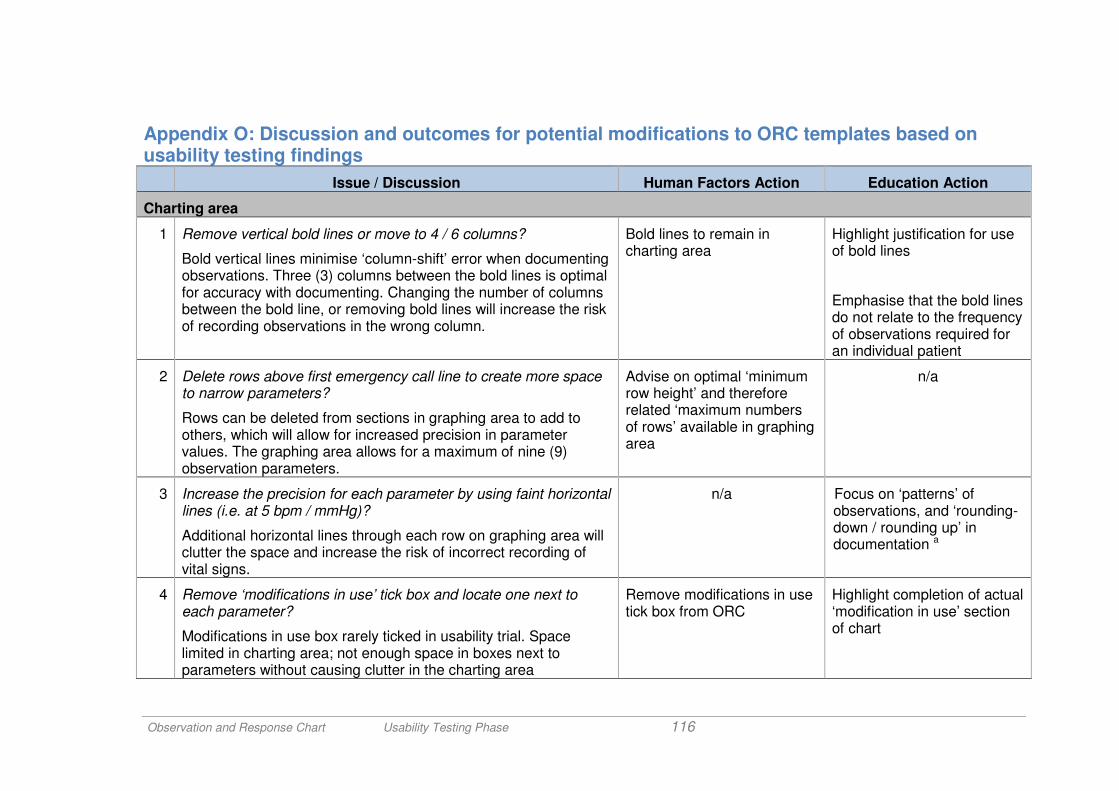
Observation and Response Chart Usability Testing Phase 116
Appendix O: Discussion and outcomes for potential modifications to ORC templates based on usability testing findings
Issue / Discussion Human Factors Action Education Action
Charting area
1 Remove vertical bold lines or move to 4 / 6 columns?
Bold vertical lines minimise ‘column-shift’ error when documenting observations. Three (3) columns between the bold lines is optimal for accuracy with documenting. Changing the number of columns between the bold line, or removing bold lines will increase the risk of recording observations in the wrong column.
Bold lines to remain in charting area
Highlight justification for use of bold lines
Emphasise that the bold lines do not relate to the frequency of observations required for an individual patient
2 Delete rows above first emergency call line to create more space to narrow parameters?
Rows can be deleted from sections in graphing area to add to others, which will allow for increased precision in parameter values. The graphing area allows for a maximum of nine (9) observation parameters.
Advise on optimal ‘minimum row height’ and therefore related ‘maximum numbers of rows’ available in graphing area
n/a
3 Increase the precision for each parameter by using faint horizontal lines (i.e. at 5 bpm / mmHg)?
Additional horizontal lines through each row on graphing area will clutter the space and increase the risk of incorrect recording of vital signs.
n/a Focus on ‘patterns’ of observations, and ‘rounding-down / rounding up’ in documentation a
4 Remove ‘modifications in use’ tick box and locate one next to each parameter?
Modifications in use box rarely ticked in usability trial. Space limited in charting area; not enough space in boxes next to parameters without causing clutter in the charting area
Remove modifications in use tick box from ORC
Highlight completion of actual ‘modification in use’ section of chart
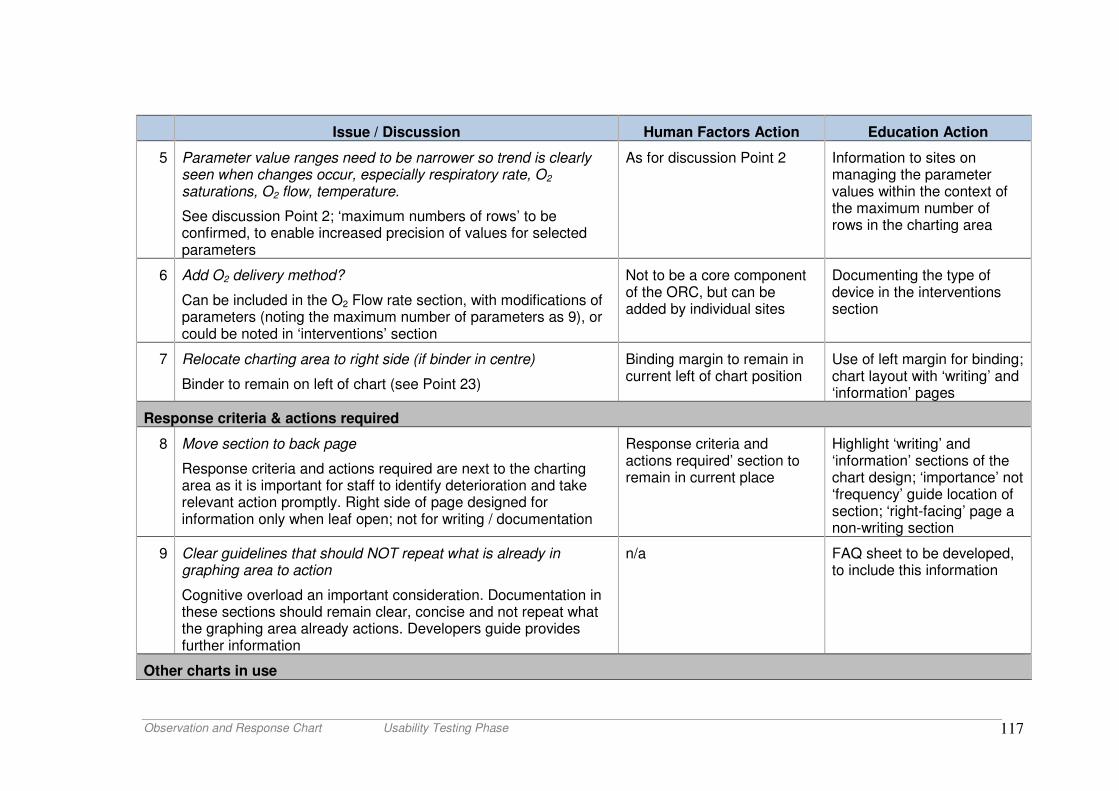
Observation and Response Chart Usability Testing Phase 117
Issue / Discussion Human Factors Action Education Action
5 Parameter value ranges need to be narrower so trend is clearly seen when changes occur, especially respiratory rate, O2 saturations, O2 flow, temperature.
See discussion Point 2; ‘maximum numbers of rows’ to be confirmed, to enable increased precision of values for selected parameters
As for discussion Point 2 Information to sites on managing the parameter values within the context of the maximum number of rows in the charting area
6 Add O2 delivery method?
Can be included in the O2 Flow rate section, with modifications of parameters (noting the maximum number of parameters as 9), or could be noted in ‘interventions’ section
Not to be a core component of the ORC, but can be added by individual sites
Documenting the type of device in the interventions section
7 Relocate charting area to right side (if binder in centre)
Binder to remain on left of chart (see Point 23)
Binding margin to remain in current left of chart position
Use of left margin for binding; chart layout with ‘writing’ and ‘information’ pages
Response criteria & actions required
8 Move section to back page
Response criteria and actions required are next to the charting area as it is important for staff to identify deterioration and take relevant action promptly. Right side of page designed for information only when leaf open; not for writing / documentation
Response criteria and actions required’ section to remain in current place
Highlight ‘writing’ and ‘information’ sections of the chart design; ‘importance’ not ‘frequency’ guide location of section; ‘right-facing’ page a non-writing section
9 Clear guidelines that should NOT repeat what is already in graphing area to action
Cognitive overload an important consideration. Documentation in these sections should remain clear, concise and not repeat what the graphing area already actions. Developers guide provides further information
n/a FAQ sheet to be developed, to include this information
Other charts in use
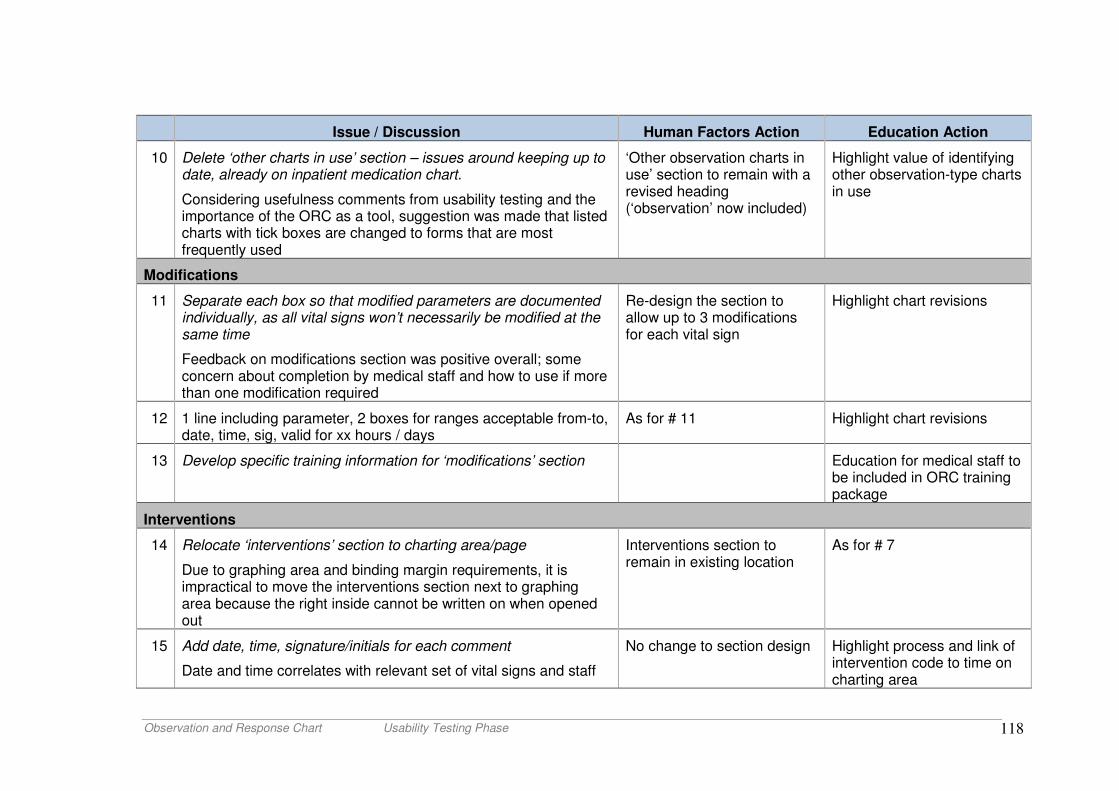
Observation and Response Chart Usability Testing Phase 118
Issue / Discussion Human Factors Action Education Action
10 Delete ‘other charts in use’ section – issues around keeping up to date, already on inpatient medication chart.
Considering usefulness comments from usability testing and the importance of the ORC as a tool, suggestion was made that listed charts with tick boxes are changed to forms that are most frequently used
‘Other observation charts in use’ section to remain with a revised heading (‘observation’ now included)
Highlight value of identifying other observation-type charts in use
Modifications
11 Separate each box so that modified parameters are documented individually, as all vital signs won’t necessarily be modified at the same time
Feedback on modifications section was positive overall; some concern about completion by medical staff and how to use if more than one modification required
Re-design the section to allow up to 3 modifications for each vital sign
Highlight chart revisions
12 1 line including parameter, 2 boxes for ranges acceptable from-to, date, time, sig, valid for xx hours / days
As for # 11 Highlight chart revisions
13 Develop specific training information for ‘modifications’ section Education for medical staff to be included in ORC training package
Interventions
14 Relocate ‘interventions’ section to charting area/page
Due to graphing area and binding margin requirements, it is impractical to move the interventions section next to graphing area because the right inside cannot be written on when opened out
Interventions section to remain in existing location
As for # 7
15 Add date, time, signature/initials for each comment
Date and time correlates with relevant set of vital signs and staff
No change to section design Highlight process and link of intervention code to time on charting area
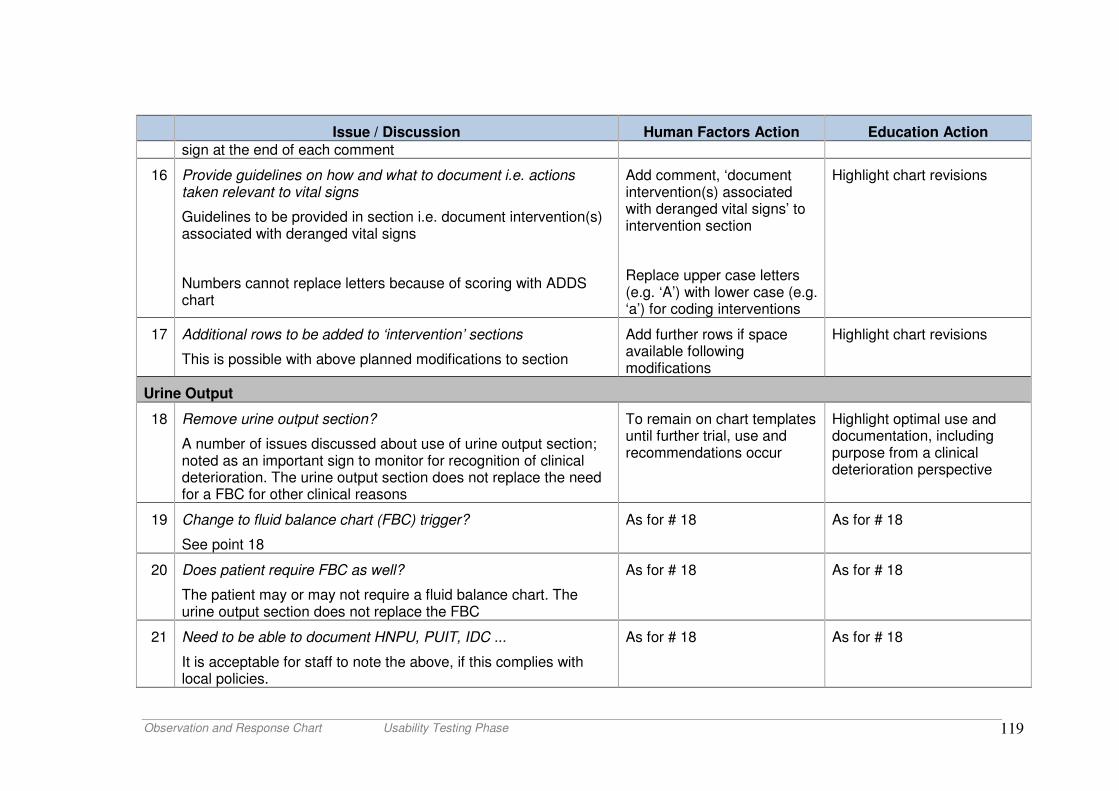
Observation and Response Chart Usability Testing Phase 119
Issue / Discussion Human Factors Action Education Action
sign at the end of each comment
16 Provide guidelines on how and what to document i.e. actions taken relevant to vital signs
Guidelines to be provided in section i.e. document intervention(s) associated with deranged vital signs
Numbers cannot replace letters because of scoring with ADDS chart
Add comment, ‘document intervention(s) associated with deranged vital signs’ to intervention section
Replace upper case letters (e.g. ‘A’) with lower case (e.g. ‘a’) for coding interventions
Highlight chart revisions
17 Additional rows to be added to ‘intervention’ sections
This is possible with above planned modifications to section
Add further rows if space available following modifications
Highlight chart revisions
Urine Output
18 Remove urine output section?
A number of issues discussed about use of urine output section; noted as an important sign to monitor for recognition of clinical deterioration. The urine output section does not replace the need for a FBC for other clinical reasons
To remain on chart templates until further trial, use and recommendations occur
Highlight optimal use and documentation, including purpose from a clinical deterioration perspective
19 Change to fluid balance chart (FBC) trigger?
See point 18
As for # 18 As for # 18
20 Does patient require FBC as well?
The patient may or may not require a fluid balance chart. The urine output section does not replace the FBC
As for # 18 As for # 18
21 Need to be able to document HNPU, PUIT, IDC ...
It is acceptable for staff to note the above, if this complies with local policies.
As for # 18 As for # 18
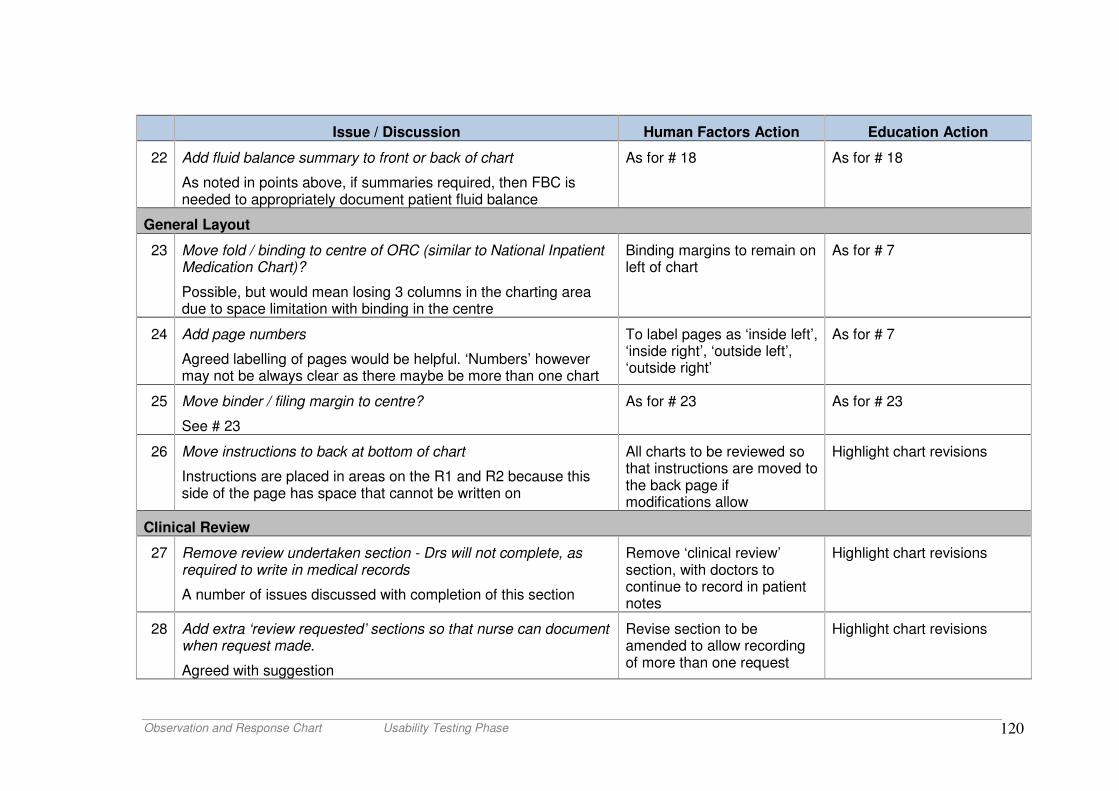
Observation and Response Chart Usability Testing Phase 120
Issue / Discussion Human Factors Action Education Action
22 Add fluid balance summary to front or back of chart
As noted in points above, if summaries required, then FBC is needed to appropriately document patient fluid balance
As for # 18 As for # 18
General Layout
23 Move fold / binding to centre of ORC (similar to National Inpatient Medication Chart)?
Possible, but would mean losing 3 columns in the charting area due to space limitation with binding in the centre
Binding margins to remain on left of chart
As for # 7
24 Add page numbers
Agreed labelling of pages would be helpful. ‘Numbers’ however may not be always clear as there maybe be more than one chart
To label pages as ‘inside left’, ‘inside right’, ‘outside left’, ‘outside right’
As for # 7
25 Move binder / filing margin to centre?
See # 23
As for # 23 As for # 23
26 Move instructions to back at bottom of chart
Instructions are placed in areas on the R1 and R2 because this side of the page has space that cannot be written on
All charts to be reviewed so that instructions are moved to the back page if modifications allow
Highlight chart revisions
Clinical Review
27 Remove review undertaken section - Drs will not complete, as required to write in medical records
A number of issues discussed with completion of this section
Remove ‘clinical review’ section, with doctors to continue to record in patient notes
Highlight chart revisions
28 Add extra ‘review requested’ sections so that nurse can document when request made.
Agreed with suggestion
Revise section to be amended to allow recording of more than one request
Highlight chart revisions
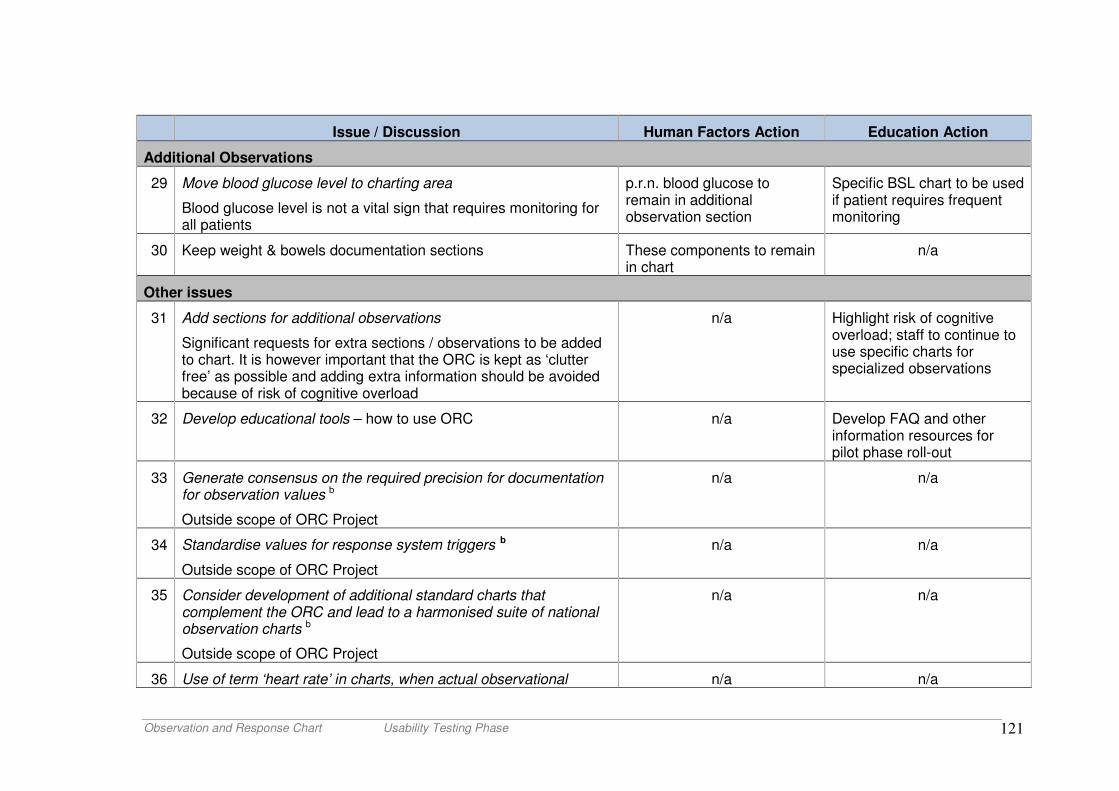
Observation and Response Chart Usability Testing Phase 121
Issue / Discussion Human Factors Action Education Action
Additional Observations
29 Move blood glucose level to charting area
Blood glucose level is not a vital sign that requires monitoring for all patients
p.r.n. blood glucose to remain in additional observation section
Specific BSL chart to be used if patient requires frequent monitoring
30 Keep weight & bowels documentation sections These components to remain in chart
n/a
Other issues
31 Add sections for additional observations
Significant requests for extra sections / observations to be added to chart. It is however important that the ORC is kept as ‘clutter free’ as possible and adding extra information should be avoided because of risk of cognitive overload
n/a Highlight risk of cognitive overload; staff to continue to use specific charts for specialized observations
32 Develop educational tools – how to use ORC n/a Develop FAQ and other information resources for pilot phase roll-out
33 Generate consensus on the required precision for documentation for observation values b
Outside scope of ORC Project
n/a n/a
34 Standardise values for response system triggers b
Outside scope of ORC Project
n/a n/a
35 Consider development of additional standard charts that complement the ORC and lead to a harmonised suite of national observation charts b
Outside scope of ORC Project
n/a n/a
36 Use of term ‘heart rate’ in charts, when actual observational n/a n/a
Observation and Response Chart Usability Testing Phase 122
Issue / Discussion Human Factors Action Education Action parameter is most commonly measurement of ‘pulse rate’ b
This issue was not identified from the usability testing data, but was raised by a member of the UTS research team. This was discussed, and it was agreed that ‘pulse rate’ was the more correct term
Notes:
a ACSQHC to examine the optimal precision for parameter values, in relation to the minimal important clinical difference (MID), where treatment will change; this will require a cultural change in practice settings, involving pre-registration education, and post-registration training (item 3)
b For discussion at the Deteriorating Patient Advisory Committee (items 35-36)


![[ORC-xx] OracleJSP](https://img.pdfslide.us/doc/110x75/5419fce17bef0ade168b45df/orc-xx-oraclejsp.jpg)