Embed Size (px)
Citation preview
Chemical Engineering Science 63 (2008) 3960 -- 3965
Contents lists available at ScienceDirect
Chemical Engineering Science
journal homepage: www.e lsev ier .com/ locate /ces
Observation and modelling of capillary flow occlusion resulting from the capture ofsuperparamagnetic nanoparticles in amagnetic field
B. Hallmark, N.J. Darton, X. Han, S. Palit, M.R. Mackley, N.K.H. Slater∗
Department of Chemical Engineering, New Museums Site, Pembroke St, Cambridge CB2 3RA, UK
A R T I C L E I N F O A B S T R A C T
Article history:Received 22 November 2007Received in revised form 24 April 2008Accepted 29 April 2008Available online 6 May 2008
Keywords:Biochemical engineeringBiomedical engineeringFluid mechanicsNumerical analysis
The magnetic field mediated capture of 10nm diameter superparamagnetic nanoparticles, in the formof agglomerates of mean diameter 330 and 580nm, from microcapillary flows has been observed andmodelled. The steady state thickness of the captured layer in microcapillaries of diameter 400--800�mcould be predicted for both the 330 and the 580nm diameter agglomerates at flow rates of between0.1 and 0. 4mlmin−1. The model provides insight into blockage formation at a constant flow rate as aprecursor to the prediction of thrombotic embolism in magnetic directed therapies. Capillary constrictionwas particularly acute for the 580nm agglomerates in large microcapillaries (800�m) with flow rates of0. 1mlmin−1. From this model, agglomerates of diameter 330nm or less offer the potential for minimalmicrocapillary occlusion in a range of flow rates.
© 2008 Elsevier Ltd. All rights reserved.
1. Introduction
The magnetic field mediated targeting of superparamagneticnanoparticle linked therapeutic agents to specific sites of diseasein the body is an exciting prospect. Intentional embolization withmagnetic particles has been used therapeutically with some successto selectively stop blood supply to tumours, causing them to necro-tize (Sako et al., 1986). However, in drug delivery settings excessivenanoparticle accumulation might block small blood capillaries,causing a thrombotic embolism, which is undesirable.
Magnetic nanoparticles are already in use clinically as contrastagents in magnetic resonance imaging (Pankhurst et al., 2003). How-ever, to date there appear to have only been three early stage clin-ical trials of magnetic targeting of paramagnetic nanoparticles inhumans. In two of these trials, the chemotherapeutic drug epiru-bicin linked to 100nm paramagnetic nanoparticles was administeredintravenously. These nanoparticles were successfully targeted withminimal side effects to tumours with an externally applied 0.2--0.8 Tmagnet placed by the tumour (Lubbe et al., 1999, 1996). Wilson et al.(2004) delivered a sample of intra-arterially administered doxoru-bicin linked 0.5--5�m superparamagnetic nanoparticles to tumoursin patients with an external 1.5 T magnet placed adjacent to the tu-mour. Although patients reported short lived abdominal pain duringinjection of the drug bearing nanoparticles, embolization was notdetected in post procedure angiography (Wilson et al., 2004). Whilst
∗ Corresponding author. Tel.: +447786232492.E-mail address: [email protected] (N.K.H. Slater).
0009-2509/$ - see front matter © 2008 Elsevier Ltd. All rights reserved.doi:10.1016/j.ces.2008.04.057
tissue penetration of pharmaceutical linked nanoparticles is impor-tant in this paper we develop and test a model to assess the effectthat the size of the administered paramagnetic nanoparticles has onthe constriction of capillaries as a result of magnetic targeting.
2. Materials
FeCl3 ·6H2O, FeCl2 ·4H2O, NH3 ·H2O and HCl were obtained fromFisher Scientific (UK) and PMAA from Sigma Aldrich. The capillaryarrays were manufactured in-house from a commercially availableplastomer (Dow Affinity�) using a novel extrusion-based processthat has been previously described (Hallmark et al., 2005a, b).
3. Methods
A 10nm superparamagnetic magnetite (Fe3O4) nanoparticleswere synthesized by co-precipitation of Fe2+ and Fe3+ aqueous saltsolutions upon addition of a base in an oxygen-free, non-oxidizing,environment as described by Xia et al. (2005) using overhead mix-ing rather than ultrasonication to mix the reaction solution (Dartonet al., 2008). To reduce agglomeration of the superparamagneticnanoparticles, 3% by weight PMAA was added and the pH adjusted to7.4 (Mendenhall et al., 1996). This resulted in agglomerates, assumedto be spherical, of the 10nm superparamagnetic nanoparticles of575 ± 8. 0nm in diameter as measured by a Brookhaven Zeta-sizer.To obtain smaller agglomerates of diameter 328 ± 3. 5nm a sampleof nanoparticles in 3% by weight PMAA was sonicated with a 330Wultrasonic cell crusher (Heat Systems XL-2020) on full power for10min. These particle sizes were considered suitable for this work
B. Hallmark et al. / Chemical Engineering Science 63 (2008) 3960 -- 3965 3961
Fig. 1. Schematic diagram of the apparatus to measure magnetic in-flow capture ofsuperparamagnetic nanoparticles.
because they were large enough to enable in-flow capture with a0.5 T NdFeB magnet but still relatively small to potentially improvetissue penetration at target site. To reduce possible surface coat in-teractions or unevenness no encapsulation of particles was used.The magnetic properties of the nanoparticles were measured usingSQUID magnetometery at 293K from −1 to 1T, which showed thatthe particles were superparamagnetic with a magnetic susceptibilityof 1. 57 × 10−4.
Nanoparticle capture was studied in a novel plastic capillary ar-ray, termed a microcapillary film or MCF (Hallmark et al., 2005a,b)containing capillaries of 410�m diameter. The MCFs were fabri-cated in-house from a commercially available polymer resin, DowAffinity Plastomer, using a novel extrusion process (Hallmark et al.,2005b). MCFs provide low refraction for optical microscopy and pre-vious research has characterized fluid flows in the material (Hornunget al., 2006). Only one of the 19 available capillaries was used ineach film. A typical experiment would proceed as follows. A steadyflow of an aqueous solution of PMAA (3%w/w) was first estab-lished in the test capillary and its flow rate was accurately controlledby an HPLC pump (Kontron 422). An electro-mechanical injectionvalve unit (VICI Valco) was used to introduce into the flow 2mlslugs of 40mgml−1 superparamagnetic nanoparticles suspended inPMAA solution (3%w/w). Superparamagnetic particles were magnet-ically targeted with a 0.5 T NdFeB permanent magnet (e-magnets UK,Sheffield). The solution leaving the film was not recycled. The setupof the apparatus is illustrated schematically in Fig. 1.
Experiments were carried out on two sizes of nanoparticle ag-gregate (330 and 580nm). Flow-rates less than 1mlmin−1 provedoptimal for capture and hence flows between 0.1 and 0. 5mlmin−1
were examined in steps of 0. 05mlmin−1. These volumetric flowrates correspond to superficial linear velocities of 1.3 and 6. 3 cms−1,respectively, with steps of 0. 6 cms−1. The Reynolds numbers corre-sponding to these flow velocities are 1.7 and 8.0, respectively, using ameasured fluid viscosity of PMAA solution (3%w/w) of 2. 5×10⁻³ Pa sand a density of 1024kgm−3. Additionally, the physical properties ofthe PMAA solution (3%w/w) are close to those of blood, with valuesof blood viscosity reported circa 3. 3 × 10⁻³ Pa s (Lowe et al., 2000)
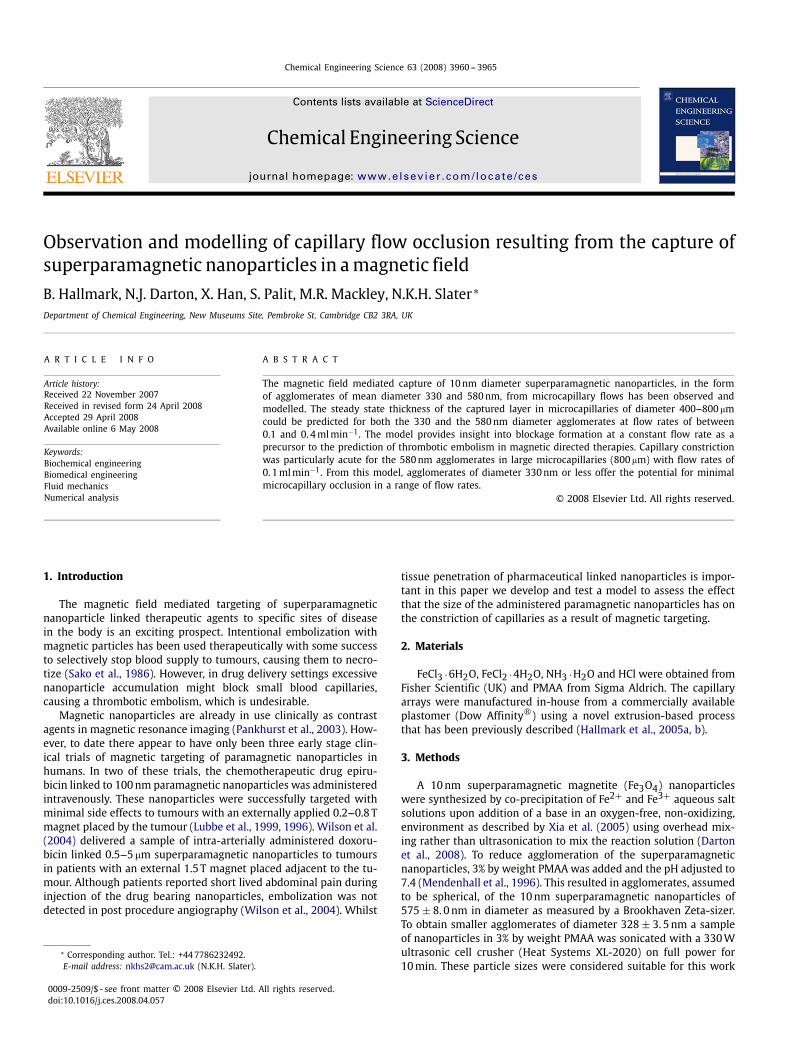
Fig. 2. Photomicrograph of a layer of captured nanoparticles in a microcapillary. Theflow direction is from right to left, and the magnet is positioned on the upper wallof the microcapillary.
and density between 1043 and 1051kgm−3 (Hinghofer-Szalkayand Greenleaf, 1987).
Nanoparticle capture was observed until one of two criteria weremet; either a steady thickness of captured nanoparticles had beenheld for over an hour after the injected pulse, or the initial layerwas eroded by the flow. When a stable layer of captured nanopar-ticles formed its thickness depended on the flow rate and particlesize (Darton et al., 2008). Erosion was the dominant behaviour athigher flow-rates. A photomicrograph illustrating a layer of capturednanoparticles in a microcapillary is shown in Fig. 2.
4. Model
The stability of a steady-state layer of magnetically capturednanoparticles within a flowing fluid depends on the relative mag-nitude of the forces acting on each nanoparticle within the layer.Two dominant forces act on a stationary nanoparticle at the wallof a capillary: the hydrodynamic force resulting from the flow fieldaround the nanoparticle and the magnetic force due to the presenceof a magnetic field gradient. Electrostatic forces and Van de Waal’sforces have been neglected as in other work in this area (Ebneret al., 1997). A key assumption in the model is that the capturednanoparticle layer is stable when the magnetic forces are greaterthan the hydrodynamic forces. When the two forces become equalthe nanoparticle layer is assumed to become unstable and subjectto erosion.
4.1. Hydrodynamic analysis
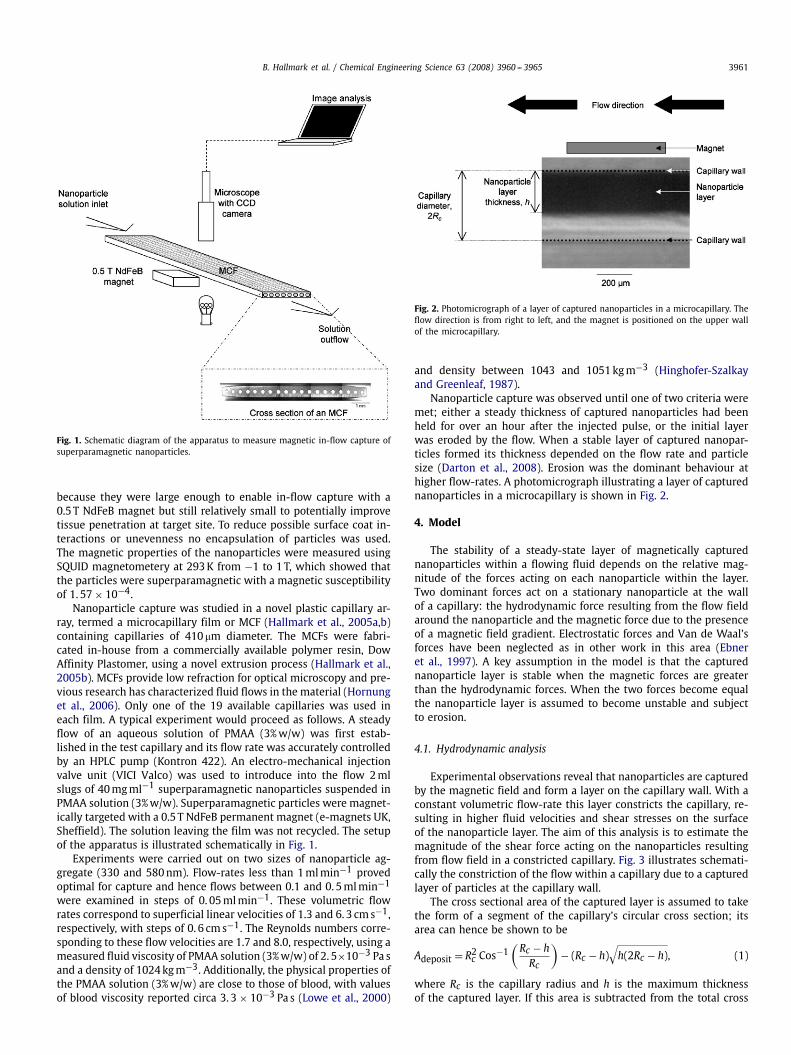
Experimental observations reveal that nanoparticles are capturedby the magnetic field and form a layer on the capillary wall. With aconstant volumetric flow-rate this layer constricts the capillary, re-sulting in higher fluid velocities and shear stresses on the surfaceof the nanoparticle layer. The aim of this analysis is to estimate themagnitude of the shear force acting on the nanoparticles resultingfrom flow field in a constricted capillary. Fig. 3 illustrates schemati-cally the constriction of the flow within a capillary due to a capturedlayer of particles at the capillary wall.
The cross sectional area of the captured layer is assumed to takethe form of a segment of the capillary’s circular cross section; itsarea can hence be shown to be
Adeposit = R2c Cos−1(Rc − hRc
)− (Rc − h)
√h(2Rc − h), (1)
where Rc is the capillary radius and h is the maximum thicknessof the captured layer. If this area is subtracted from the total cross
3962 B. Hallmark et al. / Chemical Engineering Science 63 (2008) 3960 -- 3965
Fig. 3. Schematic diagram showing the flow constriction of a capillary due to nanoparticle capture, highlighting the forces acting on a layer of magnetic nanoparticles.
sectional area of the capillary, then an equivalent hydraulic radiusfor the area available for the fluid flow can be found,
rh =
√√√√√�R2c − R2c Cos−1(Rc − hRc
)+ (Rc − h)
√h(2Rc − h)
�. (2)
For low Reynolds number flows, the flow in the capillary is laminarand unidirectional, having a parabolic velocity profile,
u(r) = 2Q
�r2h
(1 − r2
r2h
), (3)
where Q is the volumetric flow-rate of fluid through the capillaryand r is a radial co-ordinate. If the fluid in the capillary is assumedto be Newtonian, then the maximum shear stress due to the flow isat the wall of the capillary, and is equal to
�max = �
(dudr
)r=rh
= − 4�Q√
�(�R2c−R2c Cos
−1(Rc−hRc
)+(Rc−h)
√h(2Rc−h)
)3/2 . (4)
The hydrodynamic force, Fh, acting on a single nanoparticle of radiusrp in the flow direction resulting from the shear stress can be thoughtof as the maximum shear stress acting on the surface area of a circleof the same diameter of the nanoparticle, i.e.
Fh = −4�Q
√�3r2p(
�R2c − R2c Cos−1(Rc − hRc
)+ (Rc − h)
√h(2Rc − h)
)3/2 . (5)
4.2. Magnetic analysis
The magnetic field is assumed to be that of a dipole acting from apoint in space, with a magnetic field, H, described in spherical polarco-ordinates as (see, for example, Duffin, 1998),
H(r, �,�) =
⎡⎢⎢⎣
−�
2�r3Cos �
−�
4�r3Sin �
0
⎤⎥⎥⎦ . (6)
Here, � is the strength of dipole moment, which for a bar magnet isdefined as
� = BiVm�0
, (7)
where Bi is the intrinsic induction of the magnet, Vm is the magnetvolume and �0 is the permittivity of a vacuum.
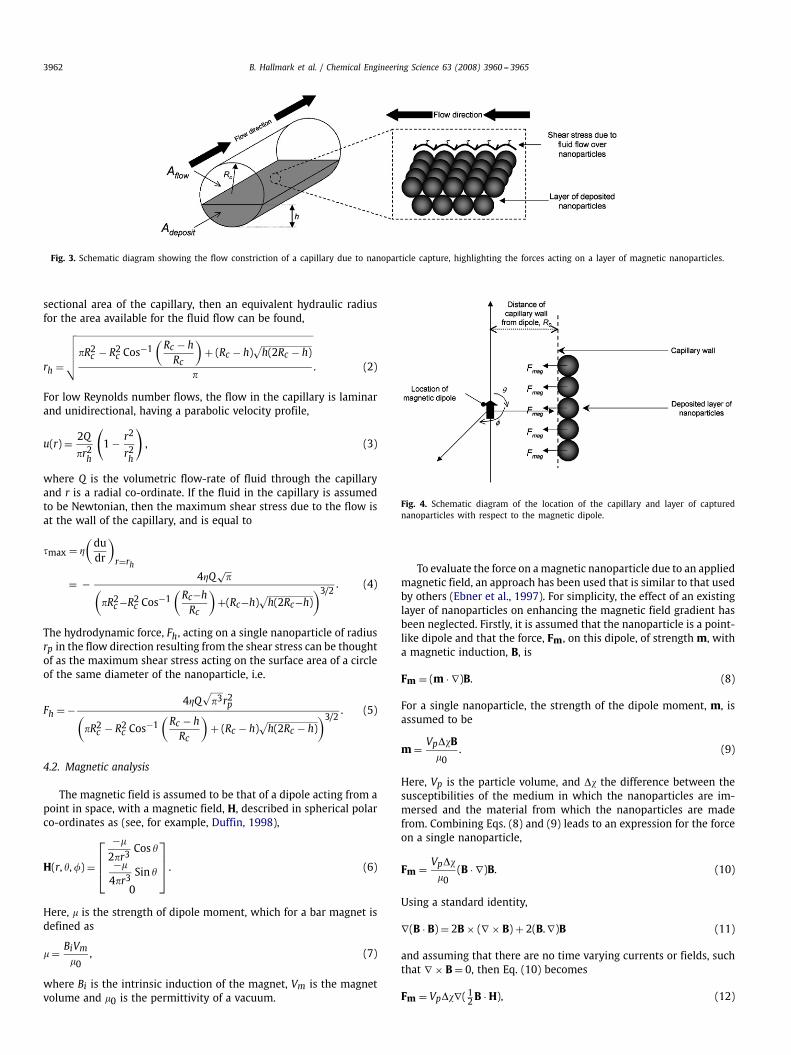
Fig. 4. Schematic diagram of the location of the capillary and layer of capturednanoparticles with respect to the magnetic dipole.
To evaluate the force on amagnetic nanoparticle due to an appliedmagnetic field, an approach has been used that is similar to that usedby others (Ebner et al., 1997). For simplicity, the effect of an existinglayer of nanoparticles on enhancing the magnetic field gradient hasbeen neglected. Firstly, it is assumed that the nanoparticle is a point-like dipole and that the force, Fm, on this dipole, of strength m, witha magnetic induction, B, is
Fm = (m · ∇)B. (8)
For a single nanoparticle, the strength of the dipole moment, m, isassumed to be
m = Vp��B�0
. (9)
Here, Vp is the particle volume, and �� the difference between thesusceptibilities of the medium in which the nanoparticles are im-mersed and the material from which the nanoparticles are madefrom. Combining Eqs. (8) and (9) leads to an expression for the forceon a single nanoparticle,
Fm = Vp��
�0(B · ∇)B. (10)
Using a standard identity,
∇(B · B) = 2B × (∇ × B) + 2(B.∇)B (11)
and assuming that there are no time varying currents or fields, suchthat ∇ × B = 0, then Eq. (10) becomes
Fm = Vp��∇( 12B · H), (12)
B. Hallmark et al. / Chemical Engineering Science 63 (2008) 3960 -- 3965 3963
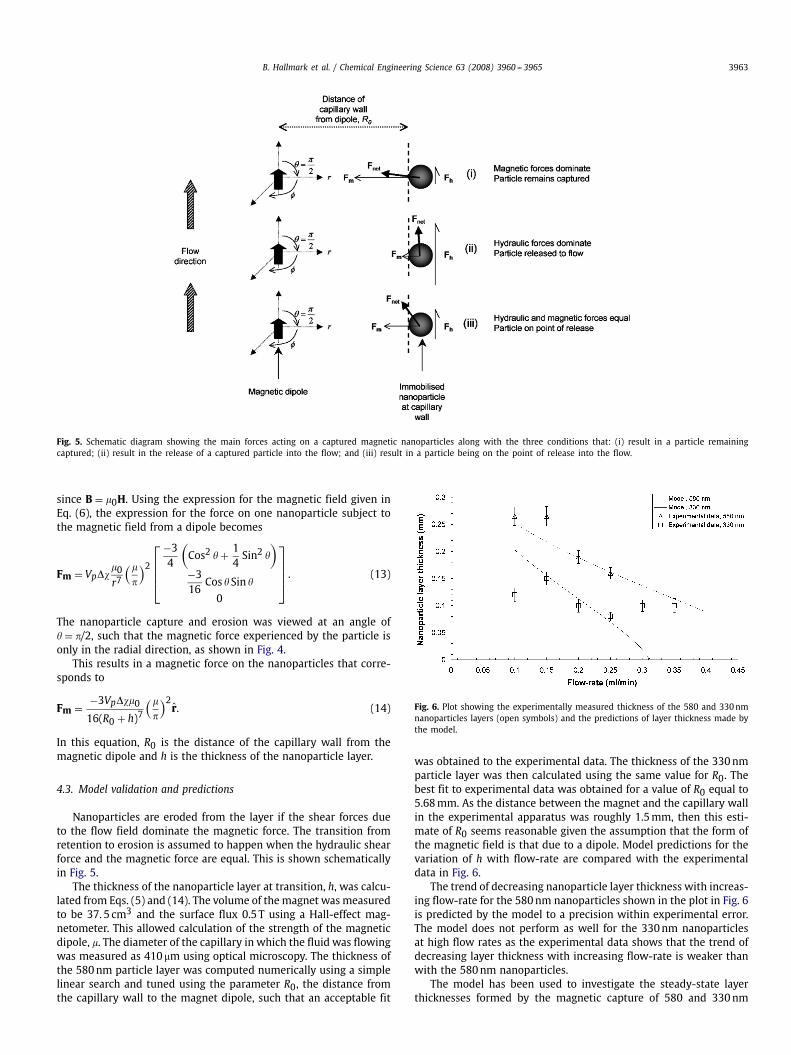
Fig. 5. Schematic diagram showing the main forces acting on a captured magnetic nanoparticles along with the three conditions that: (i) result in a particle remainingcaptured; (ii) result in the release of a captured particle into the flow; and (iii) result in a particle being on the point of release into the flow.
since B = �0H. Using the expression for the magnetic field given inEq. (6), the expression for the force on one nanoparticle subject tothe magnetic field from a dipole becomes
Fm = Vp���0r7
(�
�
)2⎡⎢⎢⎢⎣
−34
(Cos2 � + 1
4Sin2 �
)−316
Cos � Sin �
0
⎤⎥⎥⎥⎦ . (13)
The nanoparticle capture and erosion was viewed at an angle of� = �/2, such that the magnetic force experienced by the particle isonly in the radial direction, as shown in Fig. 4.
This results in a magnetic force on the nanoparticles that corre-sponds to
Fm = −3Vp���0
16(R0 + h)7
(�
�
)2r̂. (14)
In this equation, R0 is the distance of the capillary wall from themagnetic dipole and h is the thickness of the nanoparticle layer.
4.3. Model validation and predictions
Nanoparticles are eroded from the layer if the shear forces dueto the flow field dominate the magnetic force. The transition fromretention to erosion is assumed to happen when the hydraulic shearforce and the magnetic force are equal. This is shown schematicallyin Fig. 5.
The thickness of the nanoparticle layer at transition, h, was calcu-lated from Eqs. (5) and (14). The volume of themagnet was measuredto be 37. 5 cm3 and the surface flux 0.5 T using a Hall-effect mag-netometer. This allowed calculation of the strength of the magneticdipole, �. The diameter of the capillary in which the fluid was flowingwas measured as 410�m using optical microscopy. The thickness ofthe 580nm particle layer was computed numerically using a simplelinear search and tuned using the parameter R0, the distance fromthe capillary wall to the magnet dipole, such that an acceptable fit
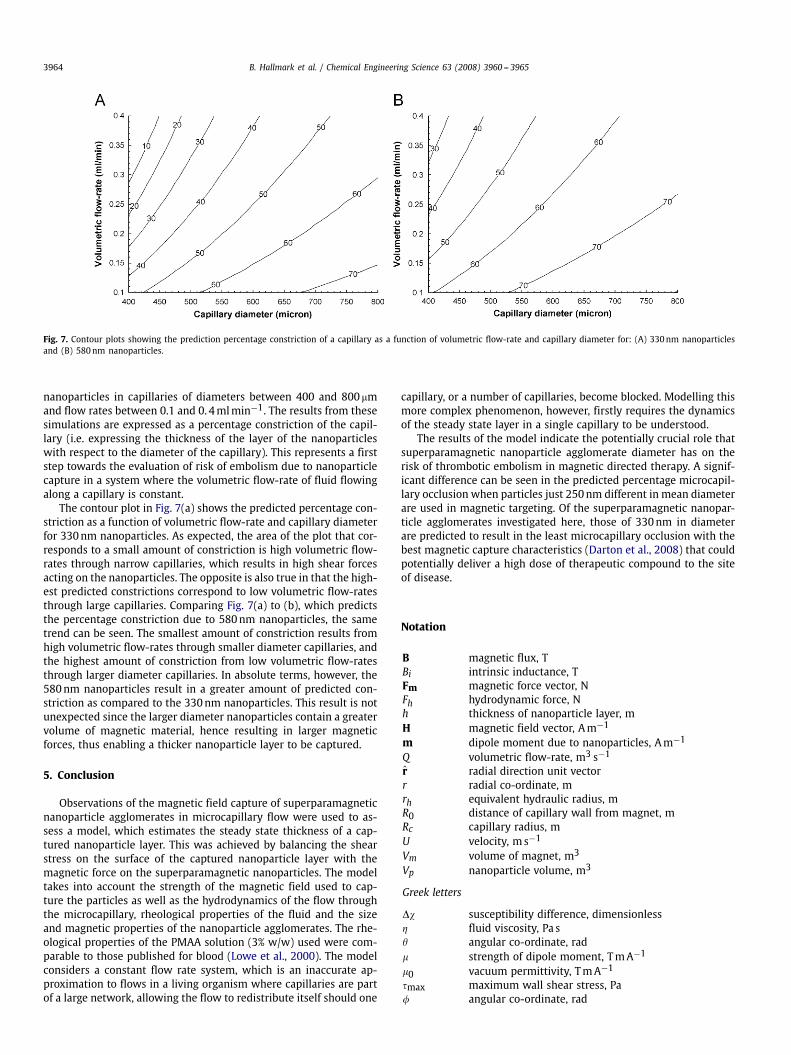
Fig. 6. Plot showing the experimentally measured thickness of the 580 and 330nmnanoparticles layers (open symbols) and the predictions of layer thickness made bythe model.
was obtained to the experimental data. The thickness of the 330nmparticle layer was then calculated using the same value for R0. Thebest fit to experimental data was obtained for a value of R0 equal to5.68mm. As the distance between the magnet and the capillary wallin the experimental apparatus was roughly 1.5mm, then this esti-mate of R0 seems reasonable given the assumption that the form ofthe magnetic field is that due to a dipole. Model predictions for thevariation of h with flow-rate are compared with the experimentaldata in Fig. 6.
The trend of decreasing nanoparticle layer thickness with increas-ing flow-rate for the 580nm nanoparticles shown in the plot in Fig. 6is predicted by the model to a precision within experimental error.The model does not perform as well for the 330nm nanoparticlesat high flow rates as the experimental data shows that the trend ofdecreasing layer thickness with increasing flow-rate is weaker thanwith the 580nm nanoparticles.
The model has been used to investigate the steady-state layerthicknesses formed by the magnetic capture of 580 and 330nm
3964 B. Hallmark et al. / Chemical Engineering Science 63 (2008) 3960 -- 3965
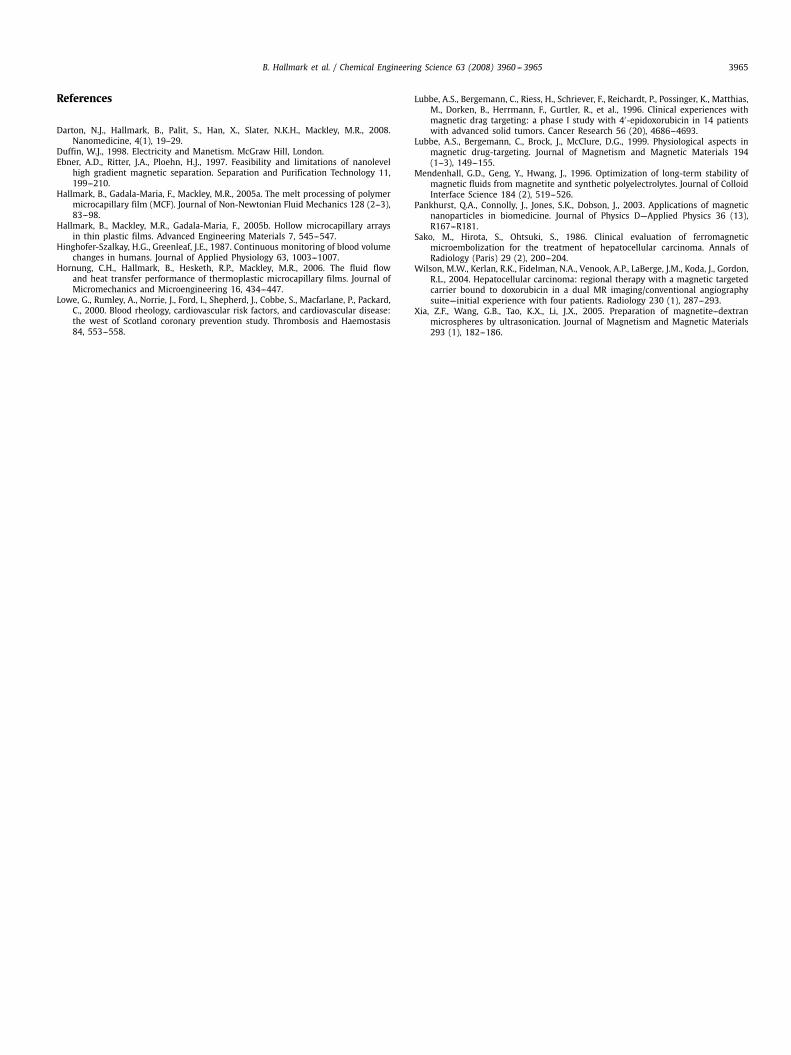
Fig. 7. Contour plots showing the prediction percentage constriction of a capillary as a function of volumetric flow-rate and capillary diameter for: (A) 330nm nanoparticlesand (B) 580nm nanoparticles.
nanoparticles in capillaries of diameters between 400 and 800�mand flow rates between 0.1 and 0. 4mlmin−1. The results from thesesimulations are expressed as a percentage constriction of the capil-lary (i.e. expressing the thickness of the layer of the nanoparticleswith respect to the diameter of the capillary). This represents a firststep towards the evaluation of risk of embolism due to nanoparticlecapture in a system where the volumetric flow-rate of fluid flowingalong a capillary is constant.
The contour plot in Fig. 7(a) shows the predicted percentage con-striction as a function of volumetric flow-rate and capillary diameterfor 330nm nanoparticles. As expected, the area of the plot that cor-responds to a small amount of constriction is high volumetric flow-rates through narrow capillaries, which results in high shear forcesacting on the nanoparticles. The opposite is also true in that the high-est predicted constrictions correspond to low volumetric flow-ratesthrough large capillaries. Comparing Fig. 7(a) to (b), which predictsthe percentage constriction due to 580nm nanoparticles, the sametrend can be seen. The smallest amount of constriction results fromhigh volumetric flow-rates through smaller diameter capillaries, andthe highest amount of constriction from low volumetric flow-ratesthrough larger diameter capillaries. In absolute terms, however, the580nm nanoparticles result in a greater amount of predicted con-striction as compared to the 330nm nanoparticles. This result is notunexpected since the larger diameter nanoparticles contain a greatervolume of magnetic material, hence resulting in larger magneticforces, thus enabling a thicker nanoparticle layer to be captured.
5. Conclusion
Observations of the magnetic field capture of superparamagneticnanoparticle agglomerates in microcapillary flow were used to as-sess a model, which estimates the steady state thickness of a cap-tured nanoparticle layer. This was achieved by balancing the shearstress on the surface of the captured nanoparticle layer with themagnetic force on the superparamagnetic nanoparticles. The modeltakes into account the strength of the magnetic field used to cap-ture the particles as well as the hydrodynamics of the flow throughthe microcapillary, rheological properties of the fluid and the sizeand magnetic properties of the nanoparticle agglomerates. The rhe-ological properties of the PMAA solution (3% w/w) used were com-parable to those published for blood (Lowe et al., 2000). The modelconsiders a constant flow rate system, which is an inaccurate ap-proximation to flows in a living organism where capillaries are partof a large network, allowing the flow to redistribute itself should one
capillary, or a number of capillaries, become blocked. Modelling thismore complex phenomenon, however, firstly requires the dynamicsof the steady state layer in a single capillary to be understood.
The results of the model indicate the potentially crucial role thatsuperparamagnetic nanoparticle agglomerate diameter has on therisk of thrombotic embolism in magnetic directed therapy. A signif-icant difference can be seen in the predicted percentage microcapil-lary occlusion when particles just 250nm different in mean diameterare used in magnetic targeting. Of the superparamagnetic nanopar-ticle agglomerates investigated here, those of 330nm in diameterare predicted to result in the least microcapillary occlusion with thebest magnetic capture characteristics (Darton et al., 2008) that couldpotentially deliver a high dose of therapeutic compound to the siteof disease.
Notation
B magnetic flux, TBi intrinsic inductance, TFm magnetic force vector, NFh hydrodynamic force, Nh thickness of nanoparticle layer, mH magnetic field vector, Am−1
m dipole moment due to nanoparticles, Am−1
Q volumetric flow-rate, m3 s−1
r̂ radial direction unit vectorr radial co-ordinate, mrh equivalent hydraulic radius, mR0 distance of capillary wall from magnet, mRc capillary radius, mU velocity, ms−1
Vm volume of magnet, m3
Vp nanoparticle volume, m3
Greek letters
�� susceptibility difference, dimensionless� fluid viscosity, Pa s� angular co-ordinate, rad� strength of dipole moment, TmA−1
�0 vacuum permittivity, TmA−1
�max maximum wall shear stress, Pa� angular co-ordinate, rad
B. Hallmark et al. / Chemical Engineering Science 63 (2008) 3960 -- 3965 3965
References
Darton, N.J., Hallmark, B., Palit, S., Han, X., Slater, N.K.H., Mackley, M.R., 2008.Nanomedicine, 4(1), 19–29.
Duffin, W.J., 1998. Electricity and Manetism. McGraw Hill, London.Ebner, A.D., Ritter, J.A., Ploehn, H.J., 1997. Feasibility and limitations of nanolevel
high gradient magnetic separation. Separation and Purification Technology 11,199--210.
Hallmark, B., Gadala-Maria, F., Mackley, M.R., 2005a. The melt processing of polymermicrocapillary film (MCF). Journal of Non-Newtonian Fluid Mechanics 128 (2--3),83--98.
Hallmark, B., Mackley, M.R., Gadala-Maria, F., 2005b. Hollow microcapillary arraysin thin plastic films. Advanced Engineering Materials 7, 545--547.
Hinghofer-Szalkay, H.G., Greenleaf, J.E., 1987. Continuous monitoring of blood volumechanges in humans. Journal of Applied Physiology 63, 1003--1007.
Hornung, C.H., Hallmark, B., Hesketh, R.P., Mackley, M.R., 2006. The fluid flowand heat transfer performance of thermoplastic microcapillary films. Journal ofMicromechanics and Microengineering 16, 434--447.
Lowe, G., Rumley, A., Norrie, J., Ford, I., Shepherd, J., Cobbe, S., Macfarlane, P., Packard,C., 2000. Blood rheology, cardiovascular risk factors, and cardiovascular disease:the west of Scotland coronary prevention study. Thrombosis and Haemostasis84, 553--558.
Lubbe, A.S., Bergemann, C., Riess, H., Schriever, F., Reichardt, P., Possinger, K., Matthias,M., Dorken, B., Herrmann, F., Gurtler, R., et al., 1996. Clinical experiences withmagnetic drag targeting: a phase I study with 4′-epidoxorubicin in 14 patientswith advanced solid tumors. Cancer Research 56 (20), 4686--4693.
Lubbe, A.S., Bergemann, C., Brock, J., McClure, D.G., 1999. Physiological aspects inmagnetic drug-targeting. Journal of Magnetism and Magnetic Materials 194(1--3), 149--155.
Mendenhall, G.D., Geng, Y., Hwang, J., 1996. Optimization of long-term stability ofmagnetic fluids from magnetite and synthetic polyelectrolytes. Journal of ColloidInterface Science 184 (2), 519--526.
Pankhurst, Q.A., Connolly, J., Jones, S.K., Dobson, J., 2003. Applications of magneticnanoparticles in biomedicine. Journal of Physics D---Applied Physics 36 (13),R167--R181.
Sako, M., Hirota, S., Ohtsuki, S., 1986. Clinical evaluation of ferromagneticmicroembolization for the treatment of hepatocellular carcinoma. Annals ofRadiology (Paris) 29 (2), 200--204.
Wilson, M.W., Kerlan, R.K., Fidelman, N.A., Venook, A.P., LaBerge, J.M., Koda, J., Gordon,R.L., 2004. Hepatocellular carcinoma: regional therapy with a magnetic targetedcarrier bound to doxorubicin in a dual MR imaging/conventional angiographysuite---initial experience with four patients. Radiology 230 (1), 287--293.
Xia, Z.F., Wang, G.B., Tao, K.X., Li, J.X., 2005. Preparation of magnetite--dextranmicrospheres by ultrasonication. Journal of Magnetism and Magnetic Materials293 (1), 182--186.


![Capillary thermostatting in capillary electrophoresis · Capillary thermostatting in capillary electrophoresis ... 75 µm BF 3 Injection: ... 25-µm id BF 5 capillary. Voltage [kV]](https://img.pdfslide.us/doc/110x75/5c176ff509d3f27a578bf33a/capillary-thermostatting-in-capillary-electrophoresis-capillary-thermostatting.jpg)