Embed Size (px)
Citation preview
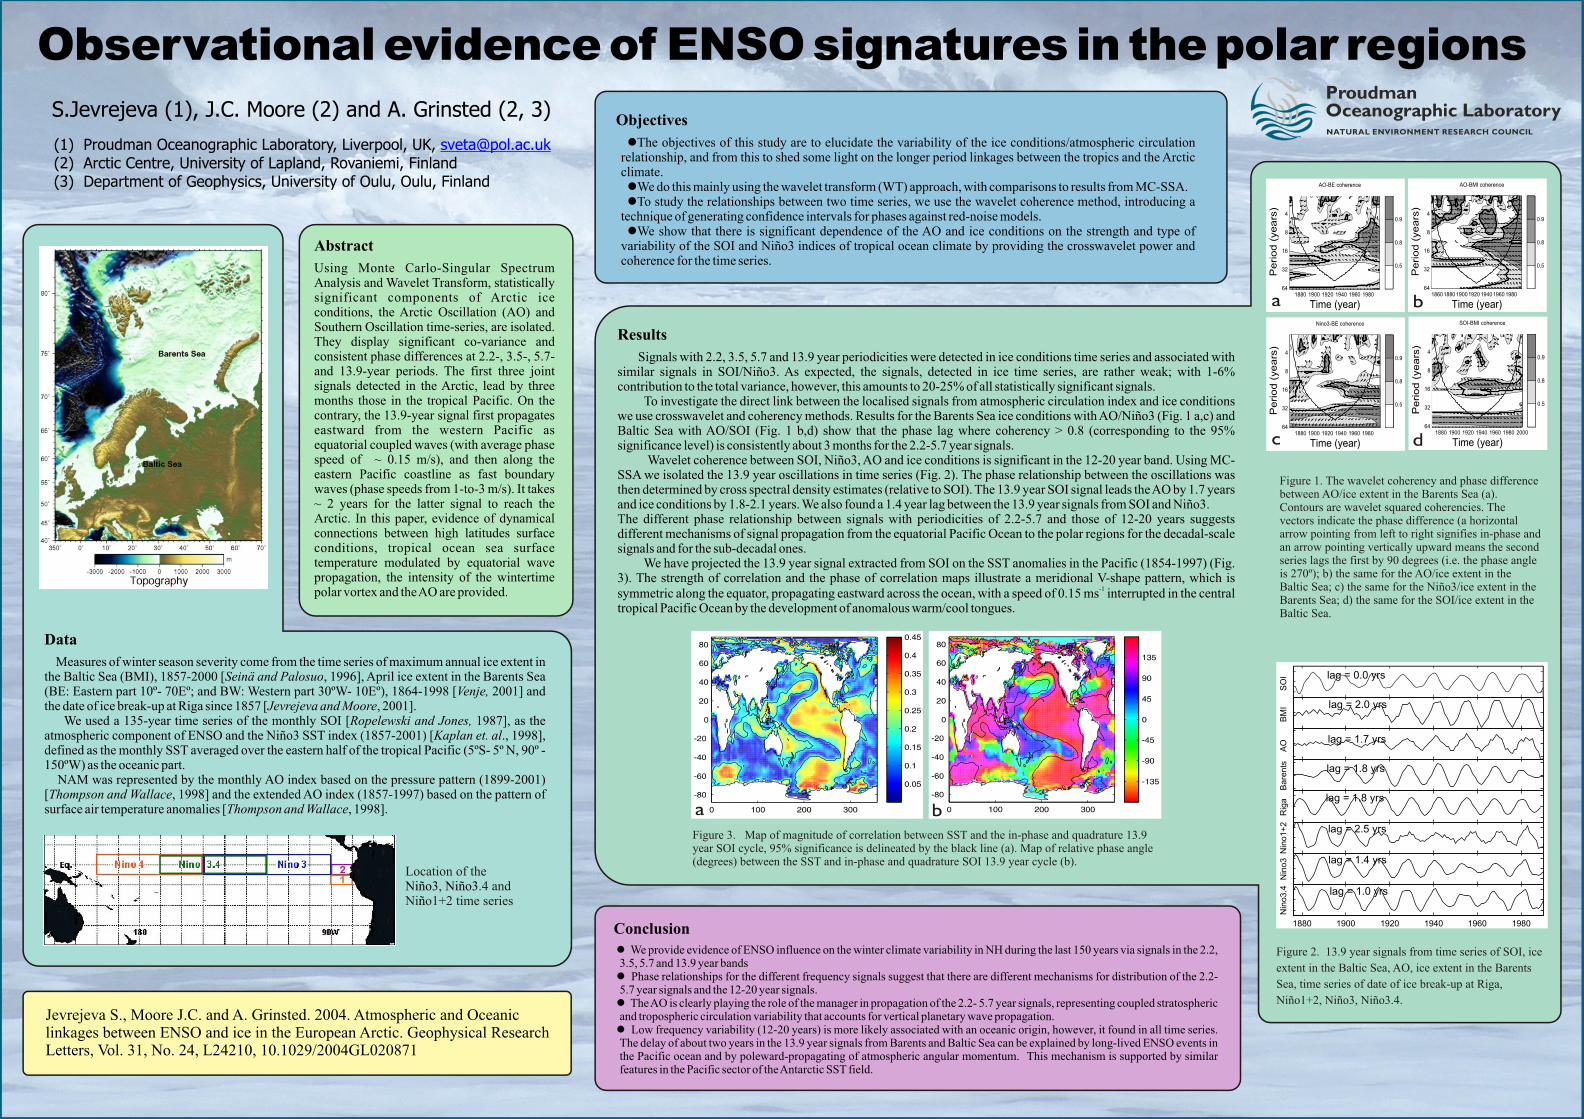
Observational evidence of ENSO signatures in the polar regions S.Jevrejeva (1), J.C. Moore (2) and A. Grinsted (2, 3)
(1) Proudman Oceanographic Laboratory, Liverpool, UK, (2) Arctic Centre, University of Lapland, Rovaniemi, Finland(3) Department of Geophysics, University of Oulu, Oulu, Finland
Abstract
Using Monte Carlo-Singular Spectrum Analysis and Wavelet Transform, statistically significant components of Arctic ice conditions, the Arctic Oscillation (AO) and Southern Oscillation time-series, are isolated. They display significant co-variance and consistent phase differences at 2.2-, 3.5-, 5.7- and 13.9-year periods. The first three joint signals detected in the Arctic, lead by three months those in the tropical Pacific. On the contrary, the 13.9-year signal first propagates eastward from the western Pacific as equatorial coupled waves (with average phase speed of ~ 0.15 m/s), and then along the eastern Pacific coastline as fast boundary waves (phase speeds from 1-to-3 m/s). It takes ~ 2 years for the latter signal to reach the Arctic. In this paper, evidence of dynamical connections between high latitudes surface conditions, tropical ocean sea surface temperature modulated by equatorial wave propagation, the intensity of the wintertime polar vortex and the AO are provided.
Figure 1. The wavelet coherency and phase difference between AO/ice extent in the Barents Sea (a). Contours are wavelet squared coherencies. The vectors indicate the phase difference (a horizontal arrow pointing from left to right signifies in-phase and an arrow pointing vertically upward means the second series lags the first by 90 degrees (i.e. the phase angle is 270º); b) the same for the AO/ice extent in the Baltic Sea; c) the same for the Niño3/ice extent in the Barents Sea; d) the same for the SOI/ice extent in the Baltic Sea.
Objectives
lThe objectives of this study are to elucidate the variability of the ice conditions/atmospheric circulation relationship, and from this to shed some light on the longer period linkages between the tropics and the Arctic climate. lWe do this mainly using the wavelet transform (WT) approach, with comparisons to results from MC-SSA. lTo study the relationships between two time series, we use the wavelet coherence method, introducing a
technique of generating confidence intervals for phases against red-noise models. lWe show that there is significant dependence of the AO and ice conditions on the strength and type of
variability of the SOI and Niño3 indices of tropical ocean climate by providing the crosswavelet power and coherence for the time series.
Data
Measures of winter season severity come from the time series of maximum annual ice extent in the Baltic Sea (BMI), 1857-2000 [Seinä and Palosuo, 1996], April ice extent in the Barents Sea (BE: Eastern part 10º- 70Eº; and BW: Western part 30ºW- 10Eº), 1864-1998 [Venje, 2001] and the date of ice break-up at Riga since 1857 [Jevrejeva and Moore, 2001]. We used a 135-year time series of the monthly SOI [Ropelewski and Jones, 1987], as the atmospheric component of ENSO and the Niño3 SST index (1857-2001) [Kaplan et. al., 1998], defined as the monthly SST averaged over the eastern half of the tropical Pacific (5ºS- 5º N, 90º -150ºW) as the oceanic part. NAM was represented by the monthly AO index based on the pressure pattern (1899-2001) [Thompson and Wallace, 1998] and the extended AO index (1857-1997) based on the pattern of surface air temperature anomalies [Thompson and Wallace, 1998].
Location of the , .4 and
Ni o1+2 time seriesNiño3 Niño3
ñ
Results
Signals with 2.2, 3.5, 5.7 and 13.9 year periodicities were detected in ice conditions time series and associated with similar signals in SOI/Niño3. As expected, the signals, detected in ice time series, are rather weak; with 1-6% contribution to the total variance, however, this amounts to 20-25% of all statistically significant signals.
To investigate the direct link between the localised signals from atmospheric circulation index and ice conditions we use crosswavelet and coherency methods. Results for the Barents Sea ice conditions with AO/Niño3 (Fig. 1 a,c) and Baltic Sea with AO/SOI (Fig. 1 b,d) show that the phase lag where coherency > 0.8 (corresponding to the 95% significance level) is consistently about 3 months for the 2.2-5.7 year signals. Wavelet coherence between SOI, Niño3, AO and ice conditions is significant in the 12-20 year band. Using MC-SSA we isolated the 13.9 year oscillations in time series (Fig. 2). The phase relationship between the oscillations was then determined by cross spectral density estimates (relative to SOI). The 13.9 year SOI signal leads the AO by 1.7 years and ice conditions by 1.8-2.1 years. We also found a 1.4 year lag between the 13.9 year signals from SOI and Niño3. The different phase relationship between signals with periodicities of 2.2-5.7 and those of 12-20 years suggests different mechanisms of signal propagation from the equatorial Pacific Ocean to the polar regions for the decadal-scale signals and for the sub-decadal ones. We have projected the 13.9 year signal extracted from SOI on the SST anomalies in the Pacific (1854-1997) (Fig. 3). The strength of correlation and the phase of correlation maps illustrate a meridional V-shape pattern, which is
-1symmetric along the equator, propagating eastward across the ocean, with a speed of 0.15 ms interrupted in the central tropical Pacific Ocean by the development of anomalous warm/cool tongues.
Figure 2. 13.9 year signals from time series of SOI, ice
extent in the Baltic Sea, AO, ice extent in the Barents
Sea, time series of date of ice break-up at Riga,
Niño1+2, Niño3, Niño3.4.
Conclusionl We provide evidence of ENSO influence on the winter climate variability in NH during the last 150 years via signals in the 2.2, 3.5, 5.7 and 13.9 year bands l Phase relationships for the different frequency signals suggest that there are different mechanisms for distribution of the 2.2-5.7 year signals and the 12-20 year signals. l The AO is clearly playing the role of the manager in propagation of the 2.2- 5.7 year signals, representing coupled stratospheric and tropospheric circulation variability that accounts for vertical planetary wave propagation. l Low frequency variability (12-20 years) is more likely associated with an oceanic origin, however, it found in all time series. The delay of about two years in the 13.9 year signals from Barents and Baltic Sea can be explained by long-lived ENSO events in the Pacific ocean and by poleward-propagating of atmospheric angular momentum. This mechanism is supported by similar features in the Pacific sector of the Antarctic SST field.
Figure 3. Map of magnitude of correlation between SST and the in-phase and quadrature 13.9 year SOI cycle, 95% significance is delineated by the black line (a). Map of relative phase angle (degrees) between the SST and in-phase and quadrature SOI 13.9 year cycle (b).
Jevrejeva S., Moore J.C. and A. Grinsted. 2004. Atmospheric and Oceanic linkages between ENSO and ice in the European Arctic. Geophysical Research Letters, Vol. 31, No. 24, L24210, 10.1029/2004GL020871
a b
a b
c d


![Anil Obser[1]. Report](https://img.pdfslide.us/doc/110x75/577d2cb01a28ab4e1eac9d9d/anil-obser1-report.jpg)