Embed Size (px)
Citation preview

Figure 2: Modular Energy Generator Functional Layout
Objec&ve:
TechnicalApproach:
Accomplishments:
NextSteps:
Poten&alImpact:
Y8.AP.B Implementation of a Modular
Electric Generator in the Dominican Republic LandonMackey,GregNorris,EricGreen,DiZhu,TahaArif,Dr.EwanPritchard
To design a Modular Electric Generator (“MEG”) comprised of proven US manufactured products for customer specific application that will be piloted in Punta Cana, Dominican Republic under the CEPM utility.
Figure 1: MEG Pilot Location
PuntaCana
• Site Load Demand, Solar and Wind Renewable Resource Analysis • Detailed Cost and Impact Analysis, and Power System Simulation • Control Development and Real-Time HIL (Hardware in Loop) Testing • Control Implementation and testing of Battery Management & Chargers • Component Sizing selection finalized for all critical components • Financial Feasibility assessment completed for lifecycle of product
• MEG System Prototype Construction and full scale Performance Testing • Factory Acceptance Testing (FAT) and Pilot Commissioning on Site • System Level Controls Integration and External Messaging Protocols • Low Voltage Continuity of Operation System Integration and Testing
• Improve electric grid stability and power reliability for unstable electric power systems in wide variety of energy applications around the World
• Provides reduction of cost, time, and difficulty of renewable energy integration through modular system design and onboard management • Increase penetration of renewable energy anywhere in the world • Commercially marketable, that is capable of being easily and rapidly
shipped and implemented worldwide, with variable inputs and loads
Electric Utility Grid
AC Loads
Natural Gas DC Generator
Renewables
Battery Energy Storage
DC Loads
Power Conversion
Modules
Hybrid Load and Grid Tie Inverter
240V AC Grid Input
Figure 3: Traditional Microgrid compared to the MEG Solution
Figure 5: MEG Profile on Summer Sunny (Left) and Summer Cloudy (Right) day
Figure 4: Modular Energy Generators ready to Ship World-wide
Internal Energy Management Interface and Connectability • Battery Energy Storage – 42.9 kWh of
Advanced Chemistry Battery Capacity • Power Input Rectification and Battery
Chargers – Modular 3 kW multi-input Units • Internal Combustion Generation – 10 kW
Natural Gas, rectified output DC Generation • Hybrid Load and Grid Tie Inverter – 6.5 kW
total AC Output to Load and Grid • Battery Management and Control System –
Pos-En and FREEDM Systems Center developed advanced Control Algorithm
• Cooling – Electronic Device, Atmospheric, and Internal Combustion Engine cooling systems integrated in MEG without external support
• Capacities of rectifiers, inverters, batteries, and more are scalable to customer needs
• Renewable Fed and Renewable Prioritizing – Receives energy from Renewable energy resources to charge energy storage, supply load, and back-feed electric grid
• Grid Fed – During periods without sufficient renewable energy generation – energy is pulled from the existing electric utility grid
• Accepts AC and DC inputs from a wide variety of resources including Wind, Solar, Hydro, and synchronous generation
• Natural Gas Fed – Using existing Natural Gas distribution in the Dominican Republic to supply emergency generation capability
• AC and DC output – Directly supplies the needs of the load without inefficient, load side converters, improving system efficiency

Y8.AP.C Diagnostics and Prognostics for the Electric Grid Using Temporal Causal Models
Rishabh Jain, Srdjan Lukic, NC State University, NCAjay Chhokra, Abhishek Dubey, Gabor Karsai, Vanderbilt University, TN
Technical Approach:
Accomplishments:
• Diagnose relay misoperations/component failures duringfaults using the temporal event data from the protectionrelays, and prognose possible cascaded failures.
• Develop a real-time reference too to assist on-field decisionmaking for day-to-day operations, and training.
• Integrate the Reasoners using thehierarchical architecture.
• Refine prognostic techniques, designalgorithms, and evaluate performance.
• Develop TCD component models ofcommon smart grid transmission system.
• Demonstrate the functionality of thereasoner in Real time.
Temporal Causal Diagrams (TCD)Composed of1) ‘Timed Failure Propagation Graphs’ to capture the
faults in network and effects across the system2) ‘Timed Discrete Event Models’ of the system
components which arrest the propagation of fault ina network.
Hierarchical Reasoning
Next Steps:
Simulation and Diagnosis Results
E1 • Fault in Line TL5_4
E2 • Distance Relays trip and isolate the line L5_4
E3• Power redistribution• Overload in line TL3_4
E4• Distance Relay for line TL3_4 trips due to
load encroachment
E5• Power redistribution• Lines L2_4 and L6_11 experience overload.
E6• Inadequate Zone 2 settings for relays
attached to L2_4 forces a misoperation.
E7 • Blackout
Case Study – IEEE 14 Bus System
Motivation:• Utilize the protection device flags to assess the
system condition at any given time, and hypothizethe fault propagation
• Minimize human error and lack of coordination tomake grid operations more resilient.
• Coordinate between different sections of gridwithout exchanging system data
TFPG Graphs for a simple 2-source system
Use of external simulators to refine systemlevel hypothesis
• Modeling use cases for a cascadescenario for IEEE 14 Bus system, andfaults followed by relay mis-operation.
• Development of accurate Reasoners andappropriate observers to test against theabove use cases
• Successful demo presenting 1) The faultscenarios and Cascade failures withcorresponding relay operations asobserved from the system using the RealTime Digital Simulator, 2) Observing thesame scenarios from Reasoner’sperspective:
System level Reasoner was able toidentify relay misoperation, andprognose next possible failures.
Award CNS:1329803
System Hierarchy
a) Distance Relay
b) BreakerBehavior Models
Objective:

Existing Designs and Drawbacks
Design 1: Simple Structure, but idle magnets, higher leakages from idle magnets, higherend winding length.Design 2: No idle magnets, lower end winding but 3D flux path in both stator and rotor-needs soft magnetic composite (SMC) material for production (Brittle and higher reluctance).Design 3: No idle magnet, lower ending winding but 3D flux path in rotor needs SMCmaterial, stator lamination needs bending making the stacking procedure complicated.
1
Figure 1: Different types of existing TFM designs.
2 3
Proposed Design
Flux path- shown in right.2D flux path in stator makinguse of lamination possible.Features• Inner stator design- better
space utilization.• For ring winding, copper
volume and winding lengthis directly proportional toeffective radius of the ring.Inner stator gives significantadvantage in this area.
• Lower copper volume results in lower copper loss enablinghigher current density operation compared to conventionalmotor. [𝑃𝑃𝐶𝐶𝐶𝐶𝐶𝐶𝐶𝐶𝐶𝐶𝐶𝐶 = 𝐽𝐽2𝜌𝜌𝐶𝐶𝐶𝐶𝐶𝐶𝐶𝐶𝐶𝐶𝐶𝐶𝑉𝑉𝐶𝐶𝐶𝐶𝐶𝐶𝐶𝐶𝐶𝐶𝐶𝐶]
• Stator poles made of lamination steel would have samethickness throughout radial direction making lower air gap poleface area for inner stator design. This drawback is mitigated byintroducing the novel idea of overlapping stator poles.
• A term called ‘Over Span Factor’ (OSF) is introduced thatcontrols the overlapping between adjacent stator poles. LargerOSF reduces end winding length, increases pole face area andsignificantly improves torque production.
Y8.AP.D: Transverse Flux Permanent Magnet Motor for Low Speed High Torque Applications
Adeeb Ahmed, Iqbal Husain
Objective:
Technical Approach:
Accomplishments:
Next Steps:
Potential Impact:
• Designing a high torque density motor using Transverse flux topology.• Ring type winding for lower winding length and higher fill factor resulting in lower copper loss.• Focus on conventional motor manufacturing approach for practicality.
Transverse Flux Machine (TFM) Introduction• Electric machines with transverse flux path (Flux path not confined in a 2D plane).• Pros• Complex flux path enables using ring type winding resulting in shorter end winding length.• Ring winding also allows high number of pole pairs.• Torque is theoretically directly proportional to number of poles- enabling a high torque
density design.• Cons• Typically suffers high leakage flux, reducing the torque generation unless otherwise
produced in ideal case.• Higher leakage also accounts for lower power factor.• Manufacturing difficulty due to complex structure.
Vertical gap to stop leakage Coil 1
Coil 2
Figure 2: 2D flux path
(a) (b) (c) (d)Figure 3: (a) Top view with low OSF (b) 3D view for low OSF
(c) Top view with high OSF (d) 3D view for high OSF.
PerformancePeak Torque (Nm) 47.7Corner Speed (RPM) 280Max Speed (RPM) 600Minimum Ripple (%) 3.06Volume Torque Density (Nm/L) 26.8Torque per mass (Total) (Nm/kg) 5.93Torque per mass (Active) (Nm/kg) 8.93
Structural Design
Figure 5: Partial view of the stator with supporting structure
}Phase 1
}Phase 2
}Phase 3
Design ParametersOuter Diameter (mm) 135Total Axial Length (mm) 124Air gap length (mm) 1Number of Turns 15DC Bus Voltage (Volt) 60 RMS Phase Current (A) 45RMS Current Density (A/mm2) 10.4Magnet Type N42HMagnet Mass (kg) 0.605Lamination Mass (kg) 2.96Copper Mass (kg) 1Active Mass (kg) 5.35Total Mass (Including supportingstructure (kg)
8
• Complete stress analysis will be done to asses structural capability of the motor• A prototype will be built using 29 gauge (0.35 mm) M19 Steel• Suitable control algorithm will be determined to further improve the torque ripple performance• Finally, all EM performance will be compared with FEA result by testing the motor in dynamometer
• High torque density performance with no forced cooling requirement makes themotor suitable for small vehicle traction operation.
• A scaled version can be used for direct drive wind turbine application.• With necessary optimization, the design can be modified for high speed operation as
well. Outer rotor design with inner surface magnets reduces the risk for rotor failure.
Electromagnetic Performance
4
4
4
4
4
6
66 6
6
8
88
8
8
10 10 10
10
10
12
12 12
12
12
14
1414
1414
1616
16
16
1818
18
18
2020
20
2022
2222
22
6
6
6
6
6
2424
24
2426
2626
2628
2828
2830
3030
3032
3232
32
3434
34
3436 3636
3638 3838
38
8
8
8
40 4040
4042 4242 4244 4444 4446 46 46 4648
48 48 485050 50 50
10
10
1012
12
4
4
4
6
6
14
Direct Axis Current (A)
Qua
drat
ure
Axi
s C
urre
nt
-60 -50 -40 -30 -20 -10 00
10
20
30
40
50
60
5
10
15
20
25
30
35
40
45
50
50
50
505050
5050
50 52
52
525252
5252
52 54
54
545454
5454
54 56
56
565656
5656
56 58
58
585858
5858
58 60
60
606060
6060
60 62
62
626262
6262
62 64
64
646464
6464
64 66
66
666666
6666
66 68
68
686868
68
68
68 70
70
707070
70
70
70 72
72
727272
72
72
72 74
74
747474
74
74
74 76
76
767676
76
76
76 78
78
787878
78
78
78 80
80
808080
80
80
80 82
82
828282
82
82
8284
84
848484
84
84
84
86
86
8686
86
868686
8888
88
8888
8888
9090
90
9090
90
92
92
92
92
88
Speed (RPM)
Torq
ue (N
m)
Efficiency
0 100 200 300 400 500 600
5
10
15
20
25
30
35
40
45
• Finite Element Analysis was performed using Maxwell 15.0.7.• Primary objective function in the design was set as torque maximization.• Necessary tuning in magnet pole arc coefficient and stator shape was performed to limit
the torque ripple to a reasonable value.• Maximum torque per ampere (MTPA) with flux weakening control approach was
simulated for computing the efficiency plot.• Stator shape was modified to reduce stator leakage flux and increase power factor• Demagnetization test was performed considering 120˚C magnet temperature and full
rated current along d-axis. No demagnetization occurs for magnet grade N42H or higher.• Thermal FEA was performed and coil temperature was found below 180˚C in worst
condition.
(a) (b) (c) Figure 4: (a) Efficiency at 80˚C coil temperature (b) Percentage torque ripple (c) MMF inside
magnet with large demagnetization current.
Knee point for N42H at 120 ˚C
=525 kA/m
Max H=454 kA/m

Y8.AP.E Community Energy Storage System with Smart InverterHao Tu, Dr. Srdjan Lukic
Objective:
Technical Approach:
Accomplishments:
Next Steps:
Potential Impact:
Distributed Energy Storage Device (DESD) is one of the building blocks for the FREEDMsystem. This project aims at developing a 5 kW Community Energy Storage (CES) systemwith smart inverter. A smart inverter interfacing the DESD with the grid is able to switchbetween modes, set the power command, handling fault situation etc. based on only localinformation.
Power stage:With SiC MOSFET device the designed switching
frequency is 40 kHz.The battery used is SCiB battery from Toshiba which
provide a stable and superior performance.The battery voltage is boosted to grid voltage through a
boost converter. This enables a direct connection to thegrid eliminating the need of bulky transformer.
Communication system:MODBUS protocol between DSP and Beaglebone
Black(BBB),CAN protocol between Battery Management Unit(BMU)
and BBB,MQTT protocol between BBB and SST.
The power stage design has been finished. The dimension is5.5’ x 5.5’ x 7’, excluding the DC capacitor and the outputfilter.
The inverter controller with an LCL filter is designed. A innerloop PR controller is used to regulate the capacitor currentwhile the outer loop is to regulate the output current.
All communication systems have been implemented.The battery management interface has been created in
LabView.
Finishing the boost converter design,Testing the system as a whole, Implementing the phasor measurement on the DSP,Conducting Hardware in the Loop test with OPAL-RT,Designing distributed energy management algorithm running on BBB.
This project provides a standardized and sturdy solution to the DESD control. The functions implemented in the smartinverter could also be employed by other devices like Distributed Renewable Energy Resource (DRER).

Low Cost NMP-Free Lithium Electrode Synthesis Y8.AP.F
Jim P. Zheng, Pedro Moss, Eric Egwu Kalu,Annadanesh Shellikeri, Venroy Watson, Olivier Barbier
Objective:
Technical Approach:
Accomplishments:
Next Steps:
Potential Impact:
Minimizing the cost of production of LiFePO4 batteries by eliminating the use of N-Methyl-2-pyrrolidone (NMP) in the fabrication of the electrodes
Develop A DRY-METHOD for electrodes production without using NMP
Fabricate coin cells using electrodes obtain from industrial companies (MTI, CHINA).
Compare life cycles and rate of coin cells made with the different electrodes.
Optimize the method to be applicable to other battery chemistry.
Environmental friendly because no toxic solvent was used in this methodElectrode is immediately ready for cell construction ( no need for drying)Cost effective since electrodes productions is expensive in the mixing and drying stage of
the manufacturing process, 15% of manufacturing cost come from drying and solvent recovery stage.
Conduct resistivity test on the material in order to model the equivalent circuit of the propose material Conduct long term cycle analysis and rate analysis on pouch cells.
Performance Graph 0 200 400 600 800 10000
10
20
30
40
50
60
70
80
90
100
110 IH FC 108 CV FC 120 CH FC 109
Spec
ific Ca
p (mA
/g)
CYCLE # (#)
Disc electrodes for coin cell production

Effect of Temperature on the Electrochemical Performance of N-methyl Pyrrolidone (NMP)-free
LiFePO4 (LFP) Cathodes Y8.AP.GKendall Parker, Venroy Watson, Olivier Barbier, Annadanesh Shellikeri, Eric Egwu Kalu
Objective:
Technical Approach:
Accomplishments:
Next Steps:
Potential Impact:
Pursue phase 2 of NMP-free electrode fabrication method: Exploring the effect of high and low temperatures on LFP cathodes
Assemble coin cells for electrochemical characterization
Complete Electrochemical Impedance Spectroscopy (EIS) on coin cells above & below room temperature
Perform charge/discharge analysis
Concluded literature review on Lithium Ion and LFP batteries
Learned NMP-free electrode fabrication method
Manufactured LFP electrodes for coin cell assembly
Performed electrochemical tests
Develop an electrochemical model (ECM)
Assemble LiFePO4 pouch battery cells using NMP-free method
Validating performance of LFPs in extreme conditions will extend operation limits and increase stability of batteries for commercial use
Utilizing NMP-free LFP electrodes lowers production cost and decreases safety risk
Cycle #Cycle #5 10 15 20 25 30
Disc
harg
e Spe
cific
Capa
city
(mAh
/g)
Disc
harg
e Spe
cific
Capa
city
(mAh
/g)
0
20
40
60
80
100
120
140
160
38.5𝑚𝑚𝑚𝑚𝑔𝑔
77.1𝑚𝑚𝑚𝑚𝑔𝑔
154.2𝑚𝑚𝑚𝑚𝑔𝑔 168.7
𝑚𝑚𝑚𝑚𝑔𝑔
198.0𝑚𝑚𝑚𝑚𝑔𝑔
241.0𝑚𝑚𝑚𝑚𝑔𝑔
Cycles at Room Temp (~20°C)
Cycle #Cycle #5 10 15 20 25 30
Disc
harg
e Spe
cific
Capa
city
(mAh
/g)
Disc
harg
e Spe
cific
Capa
city
(mAh
/g)
0
20
40
60
80
100
120
140
160
Cycles at 60°C38.5
𝑚𝑚𝑚𝑚𝑔𝑔
77.1𝑚𝑚𝑚𝑚𝑔𝑔
154.2𝑚𝑚𝑚𝑚𝑔𝑔 168.7
𝑚𝑚𝑚𝑚𝑔𝑔
198.0𝑚𝑚𝑚𝑚𝑔𝑔
241.0𝑚𝑚𝑚𝑚𝑔𝑔
Legend
NMP Free, In House (IH)Competitor - China (CH)Conventional Wet-Chemistry (CV)Competitor - MTI Corp (MTI)

Modeling Lithium-Ion Battery Degradation Y8.AP.H
Eugene N. Moss Jr., Ruben Nelson, Mark H. Weatherspoon
Objective:
Technical Approach:
Accomplishments:
Next Steps:
Potential Impact:
To develop a virtual model of a Lithium Manganese Oxide/Lithium Titanate Oxide (LMO/LTO) battery.
To cycle battery under adverse and ambient conditions to observe capacity fade potential drop over long term cycling.
Use the Li-ion Battery module in COMSOL to create a 1D LTO/LMO Li-ion battery model. Illustrate the battery condition as it is influenced by temperature. Cycle battery to observe simulation of physical changes on battery degradation.
Costs associated with physical battery tests may be avoided while gaining a complete understanding of physical changes and battery performance.
Determine the correct parameters for the LTO battery. Observe how porosity and electrode thickness affect battery performance.
Cost Analysis Modeling for Peak Shaving of Energy Storage Devices Y8.AP.I
R. Scott, L. Morris, M.H. Weatherspoon
Objective:
Technical Approach:
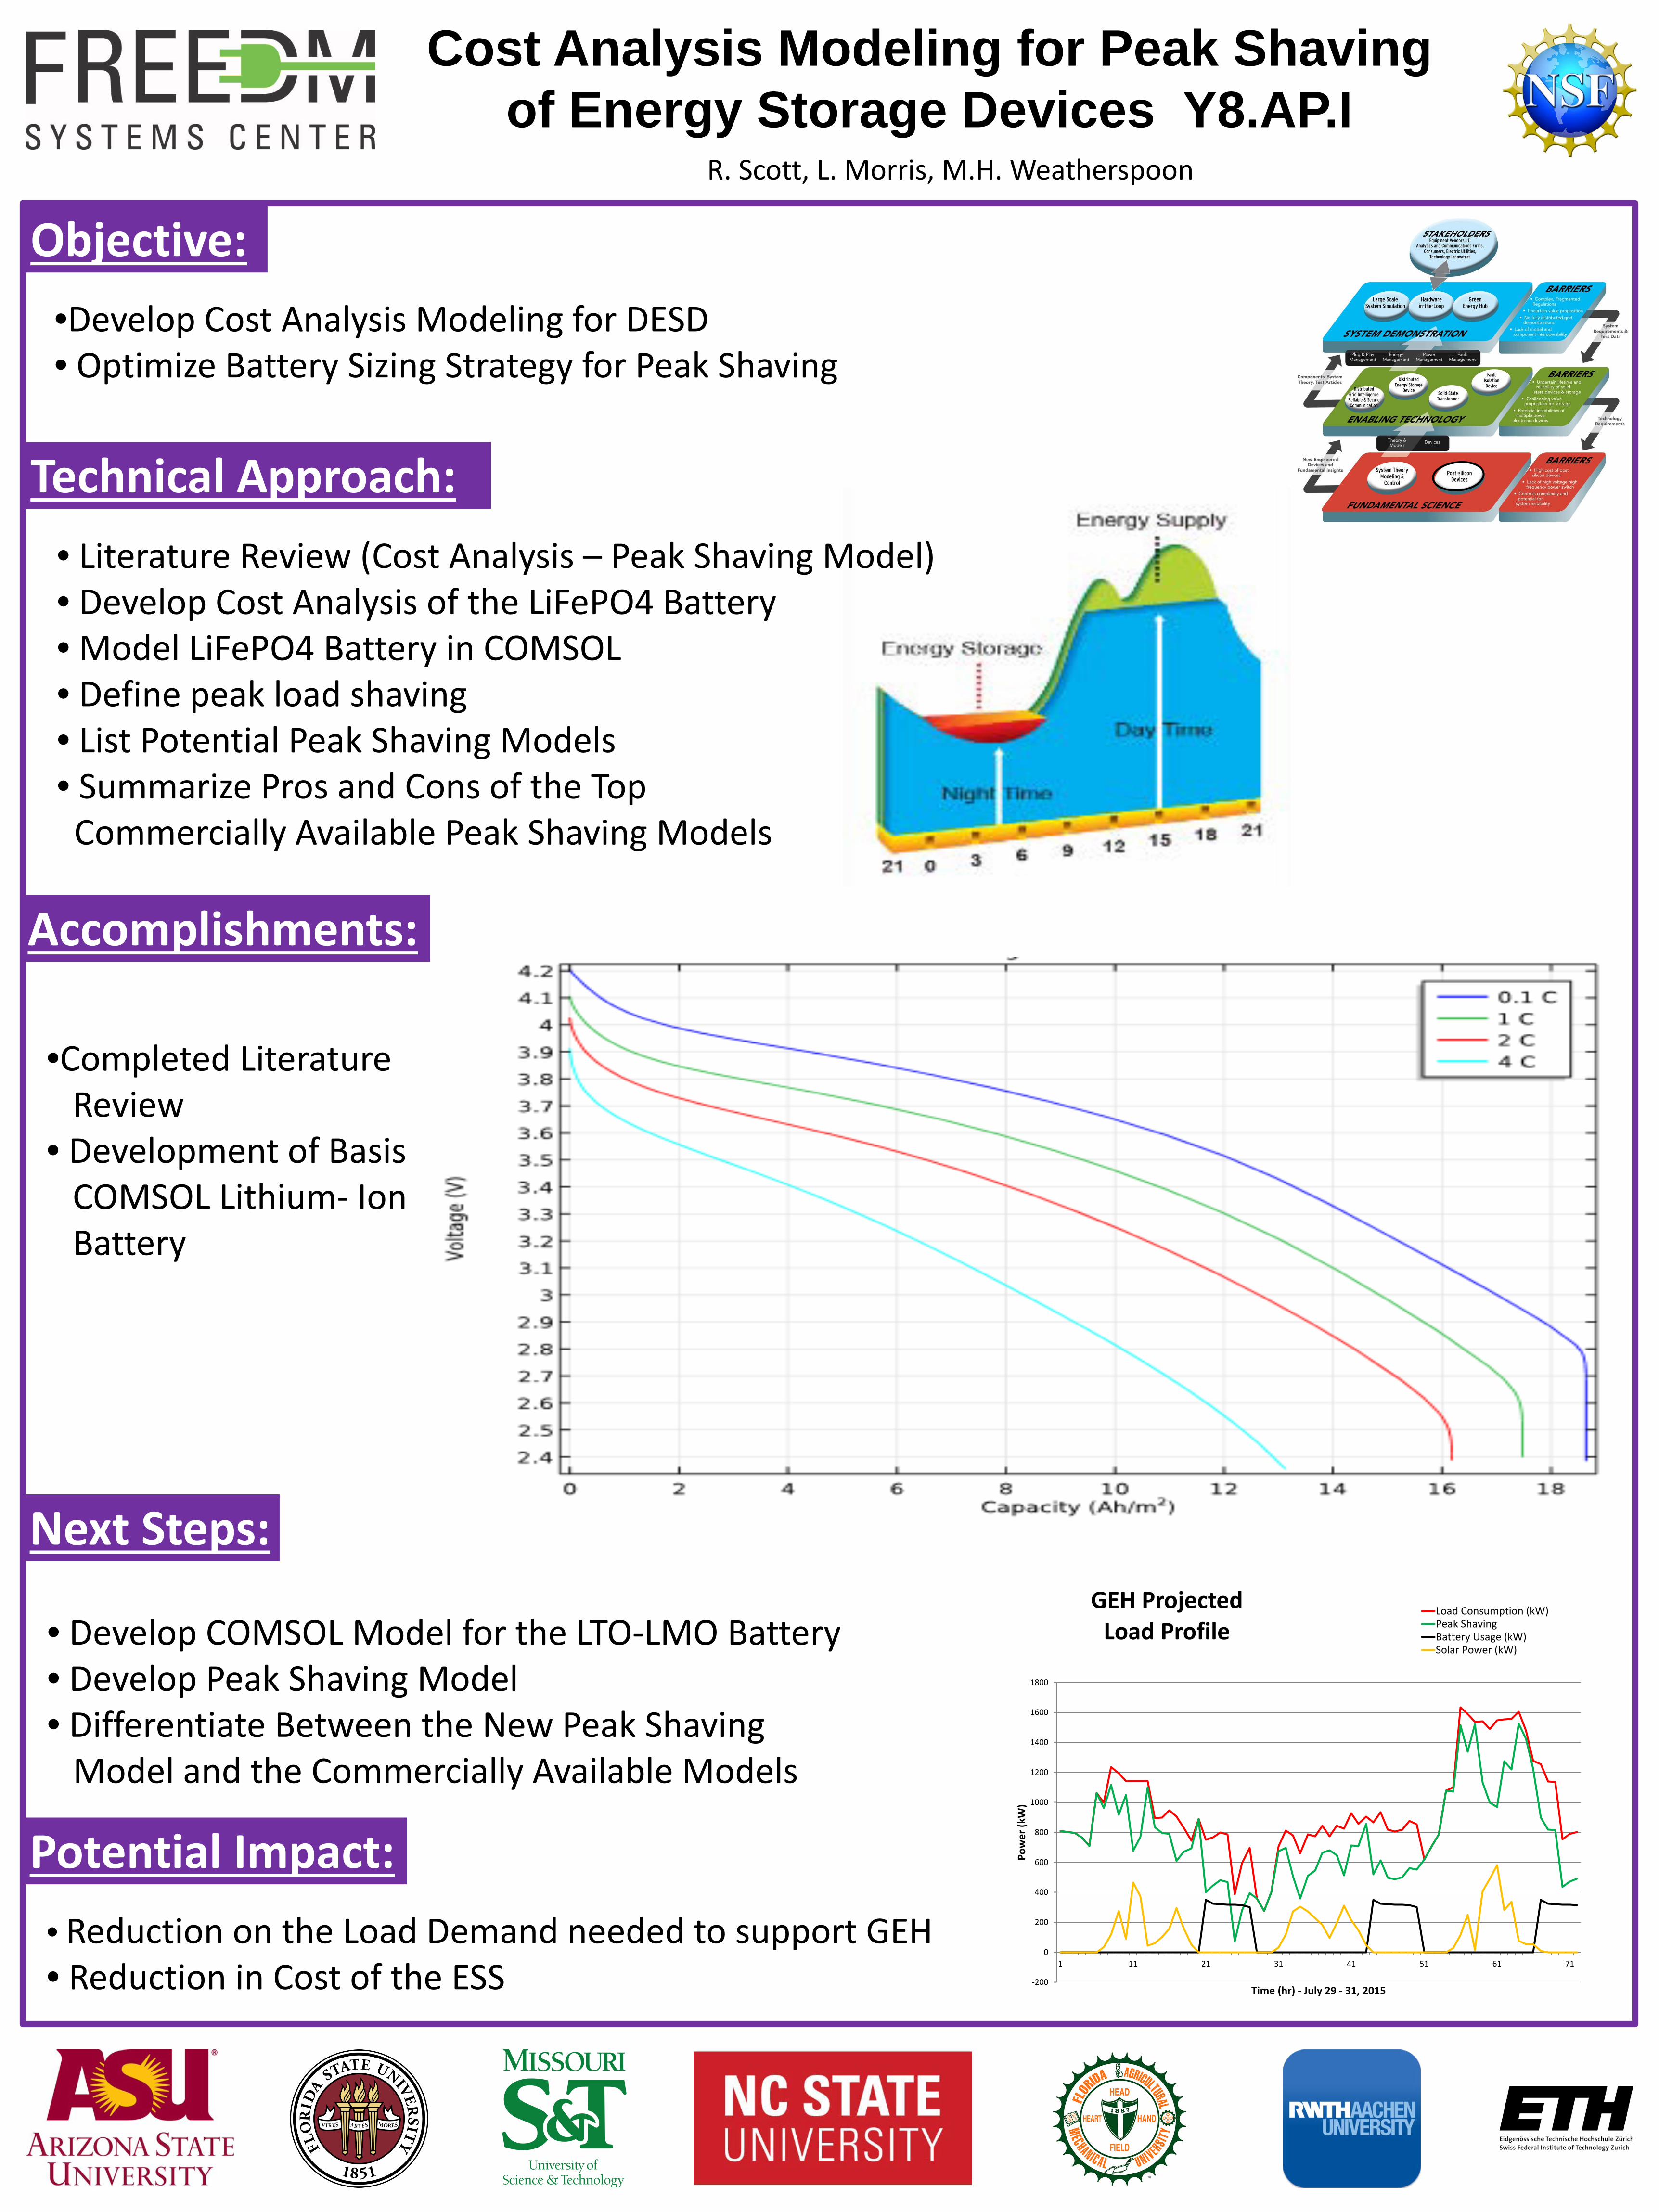
Accomplishments:
Next Steps:
Potential Impact:
•Develop Cost Analysis Modeling for DESD• Optimize Battery Sizing Strategy for Peak Shaving
• Literature Review (Cost Analysis – Peak Shaving Model)• Develop Cost Analysis of the LiFePO4 Battery • Model LiFePO4 Battery in COMSOL• Define peak load shaving • List Potential Peak Shaving Models• Summarize Pros and Cons of the Top
Commercially Available Peak Shaving Models
• Reduction on the Load Demand needed to support GEH• Reduction in Cost of the ESS
• Develop COMSOL Model for the LTO-LMO Battery• Develop Peak Shaving Model • Differentiate Between the New Peak Shaving
Model and the Commercially Available Models
-200
0
200
400
600
800
1000
1200
1400
1600
1800
1 11 21 31 41 51 61 71
Pow
er (k
W)
Time (hr) - July 29 - 31, 2015
GEH Projected Load Profile
Load Consumption (kW)Peak ShavingBattery Usage (kW)Solar Power (kW)
•Completed LiteratureReview
• Development of BasisCOMSOL Lithium- IonBattery