Embed Size (px)
Citation preview
Ob j ec t i v e s
Di ff eren t i a t e b /w fi xed and v a r i ab l e c o s t s
Break-ev en p o i n t s ( un i t s & d o l l a r amo unt )
Defi ne b us i ness , fi nanc i a l , and t o t a l r i sk .
Ca l c u l a t e t he d eg ree o f each r i sk .
Sho w t he d y nami cs o f t he d eg ree o f a l l 3 r i sk s a s t he fi rm’ s sa l e s l e v e l c hang es
Chapter 6Break-Even and Leverage
Analysis
Introduction
The importance of managing the firm cost is as important as keeping track of its profits.
In fact, costs are an important component in determining the profitability of the firm.
Additionally, cost analysis will have a direct impact on managerial decisions regarding: How to price the firm products. How to finance the firms assets
General Type of Costs
Variable Costs Cost expected to change at the same rate as Sales. Such as sales commissions, raw material costs, hourly
wages.
Fixed Cost Cost that are expected to remain constant regardless
of the quantity produced. Such as building rents, salaries, depreciation
Properties of Each Cost Type
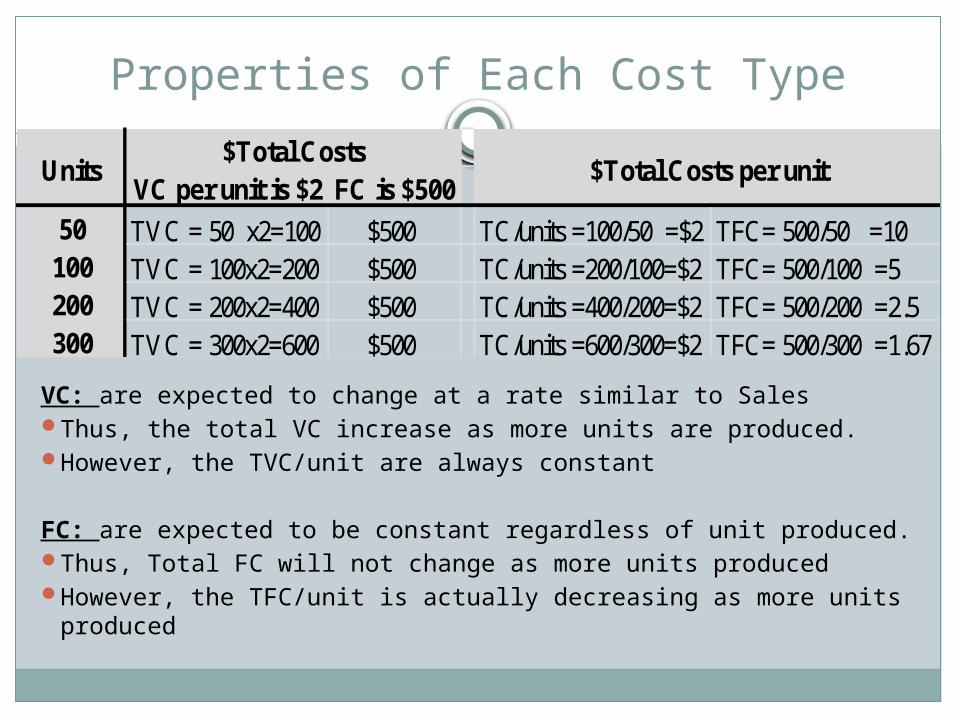
VC: are expected to change at a rate similar to SalesThus, the total VC increase as more units are produced.However, the TVC/unit are always constant
FC: are expected to be constant regardless of unit produced.Thus, Total FC will not change as more units producedHowever, the TFC/unit is actually decreasing as more units
produced
$Total CostsVC per unit is $2 FC is $500
50 TVC = 50 x2=100 $500 TC/units =100/50 =$2 TFC= 500/50 =10100 TVC = 100x2=200 $500 TC/units =200/100=$2 TFC= 500/100 =5200 TVC = 200x2=400 $500 TC/units =400/200=$2 TFC= 500/200 =2.5300 TVC = 300x2=600 $500 TC/units =600/300=$2 TFC= 500/300 =1.67
$Total Costs per unitUnits
Break-even Analysis
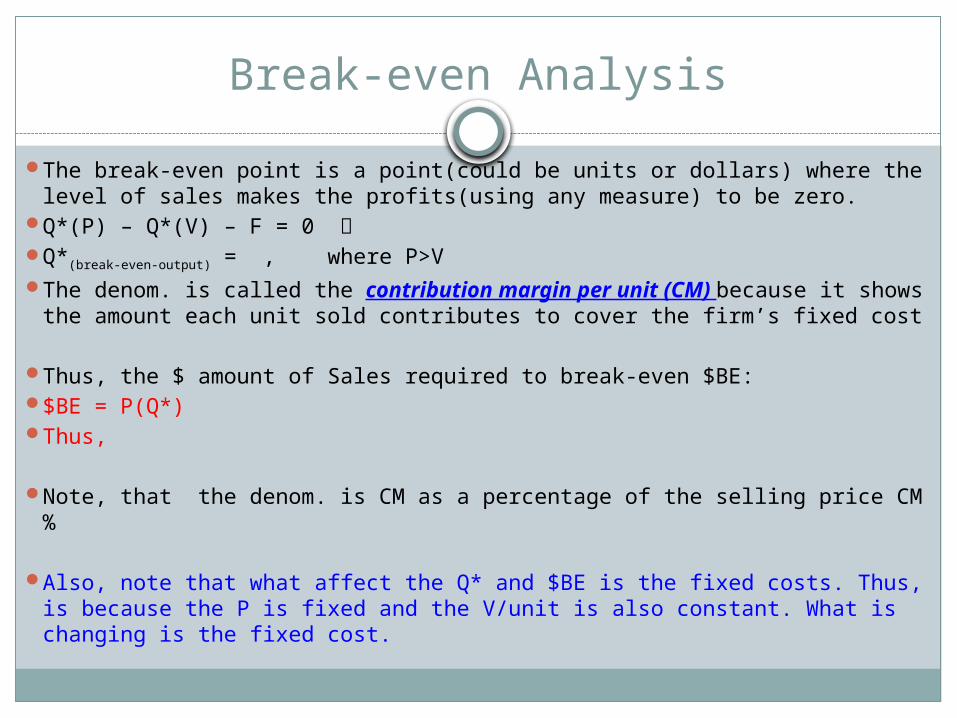
The break-even point is a point(could be units or dollars) where the level of sales makes the profits(using any measure) to be zero.
Q*(P) – Q*(V) – F = 0 Q*(break-even-output) = , where P>V The denom. is called the contribution margin per unit (CM) because it
shows the amount each unit sold contributes to cover the firm’s fixed cost
Thus, the $ amount of Sales required to break-even $BE: $BE = P(Q*) Thus,
Note, that the denom. is CM as a percentage of the selling price CM%
Also, note that what affect the Q* and $BE is the fixed costs. Thus, is because the P is fixed and the V/unit is also constant. What is changing is the fixed cost.
Break-Even Chart
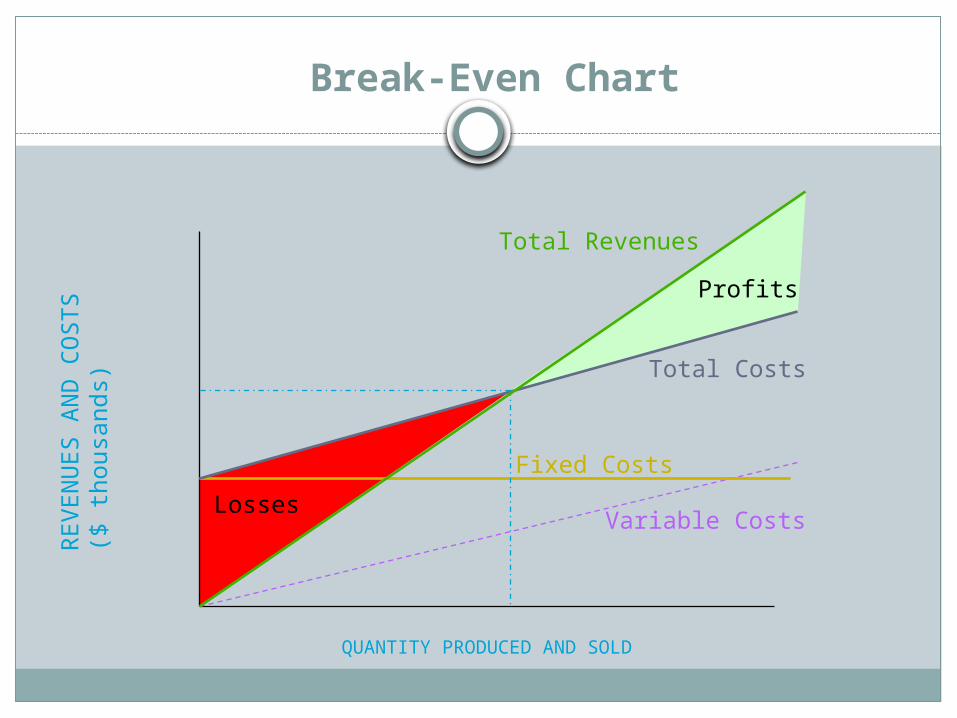
QUANTITY PRODUCED AND SOLD
Total Revenues
Profits
Fixed Costs
Variable CostsLosses
RE
VE
NU
ES
AN
D C
OS
TS
($ t
hou
san
ds)
Total Costs
Operating Break-Even Point (OBE)
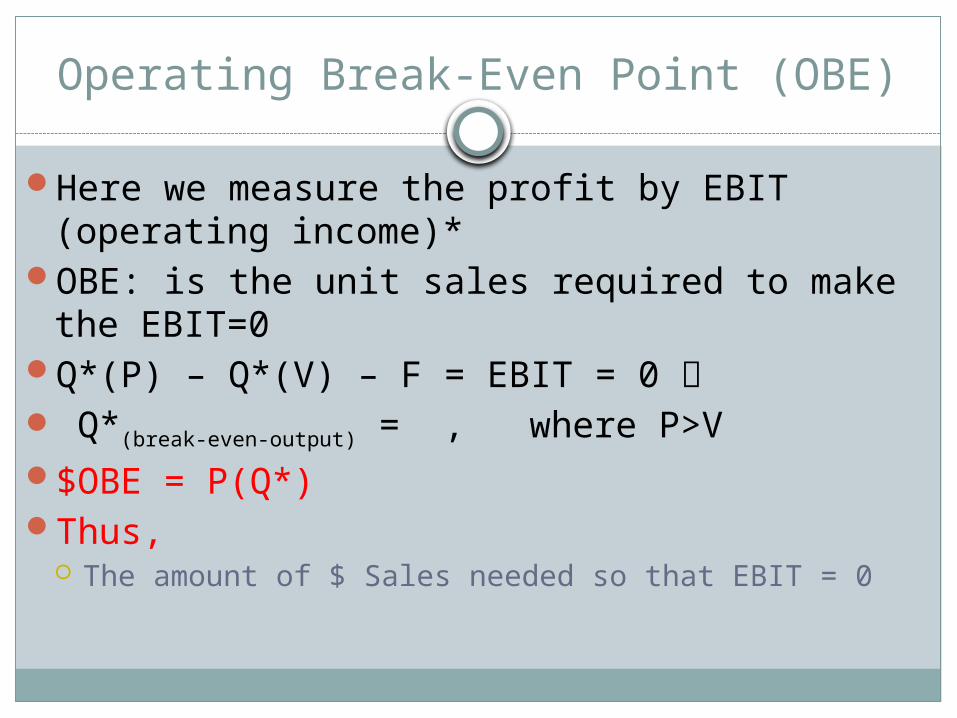
Here we measure the profit by EBIT (operating income)*
OBE: is the unit sales required to make the EBIT=0
Q*(P) – Q*(V) – F = EBIT = 0 Q*(break-even-output) = , where P>V$OBE = P(Q*)Thus,
The amount of $ Sales needed so that EBIT = 0
Other Break-Even Points
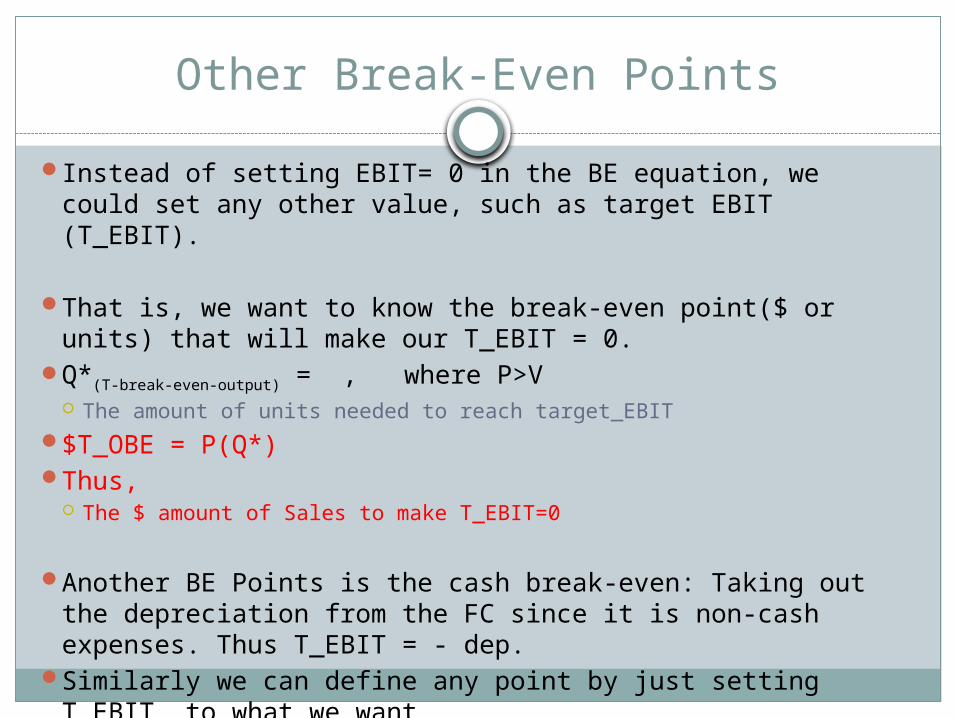
Instead of setting EBIT= 0 in the BE equation, we could set any other value, such as target EBIT (T_EBIT).
That is, we want to know the break-even point($ or units) that will make our T_EBIT = 0.
Q*(T-break-even-output) = , where P>V The amount of units needed to reach target_EBIT
$T_OBE = P(Q*) Thus,
The $ amount of Sales to make T_EBIT=0
Another BE Points is the cash break-even: Taking out the depreciation from the FC since it is non-cash expenses. Thus T_EBIT = - dep.
Similarly we can define any point by just setting T_EBIT to what we want
Examples
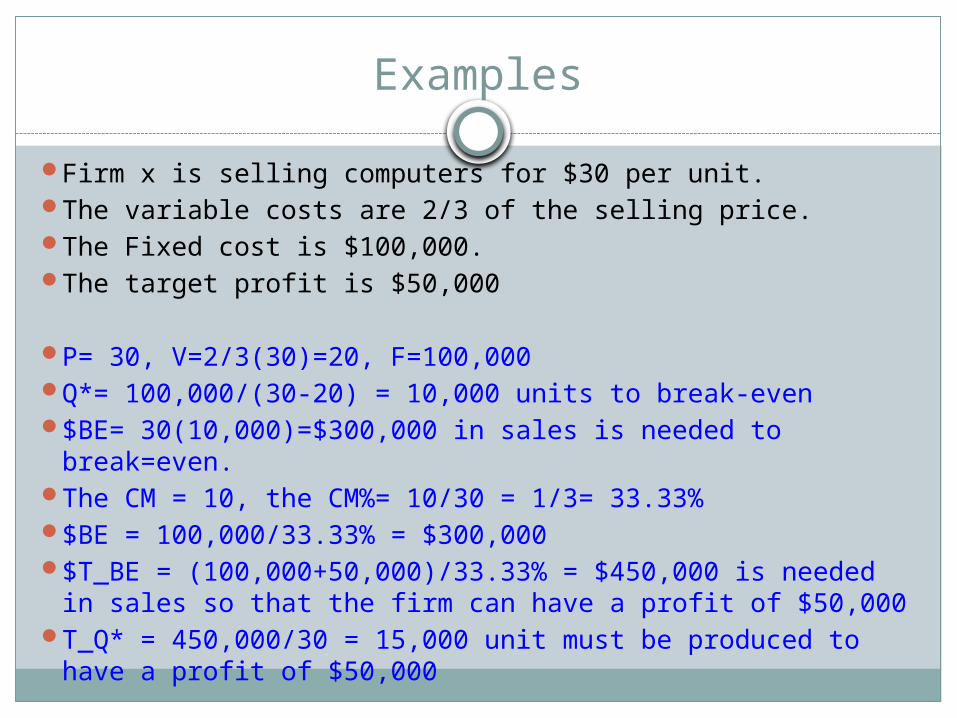
Firm x is selling computers for $30 per unit.The variable costs are 2/3 of the selling price.The Fixed cost is $100,000. The target profit is $50,000
P= 30, V=2/3(30)=20, F=100,000Q*= 100,000/(30-20) = 10,000 units to break-even$BE= 30(10,000)=$300,000 in sales is needed to
break=even. The CM = 10, the CM%= 10/30 = 1/3= 33.33%$BE = 100,000/33.33% = $300,000$T_BE = (100,000+50,000)/33.33% = $450,000 is needed in
sales so that the firm can have a profit of $50,000T_Q* = 450,000/30 = 15,000 unit must be produced to have
a profit of $50,000
Leverage Analysis
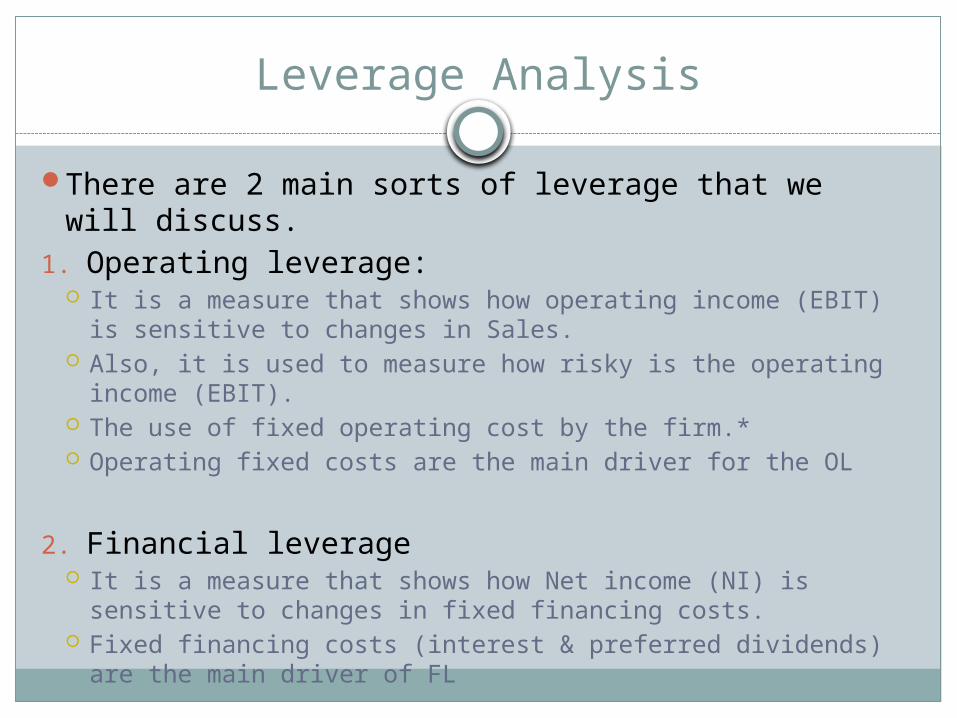
There are 2 main sorts of leverage that we will discuss.
1. Operating leverage: It is a measure that shows how operating income (EBIT) is
sensitive to changes in Sales. Also, it is used to measure how risky is the operating income
(EBIT). The use of fixed operating cost by the firm.* Operating fixed costs are the main driver for the OL
2. Financial leverage It is a measure that shows how Net income (NI) is sensitive to
changes in fixed financing costs. Fixed financing costs (interest & preferred dividends) are the
main driver of FL
Operating leverage OL
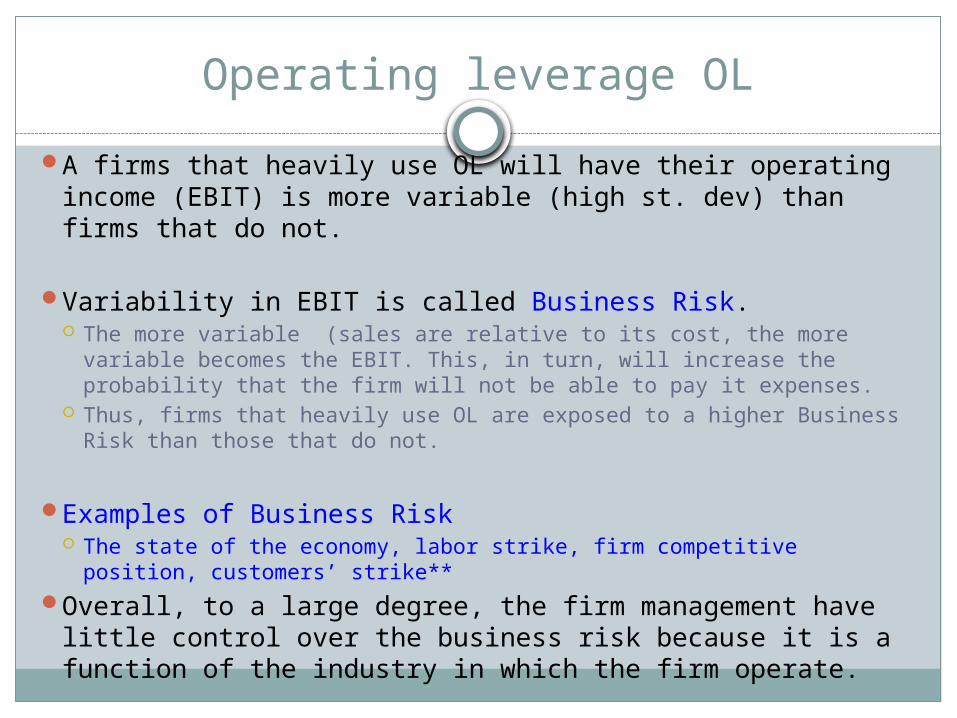
A firms that heavily use OL will have their operating income (EBIT) is more variable (high st. dev) than firms that do not.
Variability in EBIT is called Business Risk. The more variable (sales are relative to its cost, the more variable
becomes the EBIT. This, in turn, will increase the probability that the firm will not be able to pay it expenses.
Thus, firms that heavily use OL are exposed to a higher Business Risk than those that do not.
Examples of Business Risk The state of the economy, labor strike, firm competitive position,
customers’ strike**Overall, to a large degree, the firm management have little
control over the business risk because it is a function of the industry in which the firm operate.
The Degree of the Operating Leverage DOL
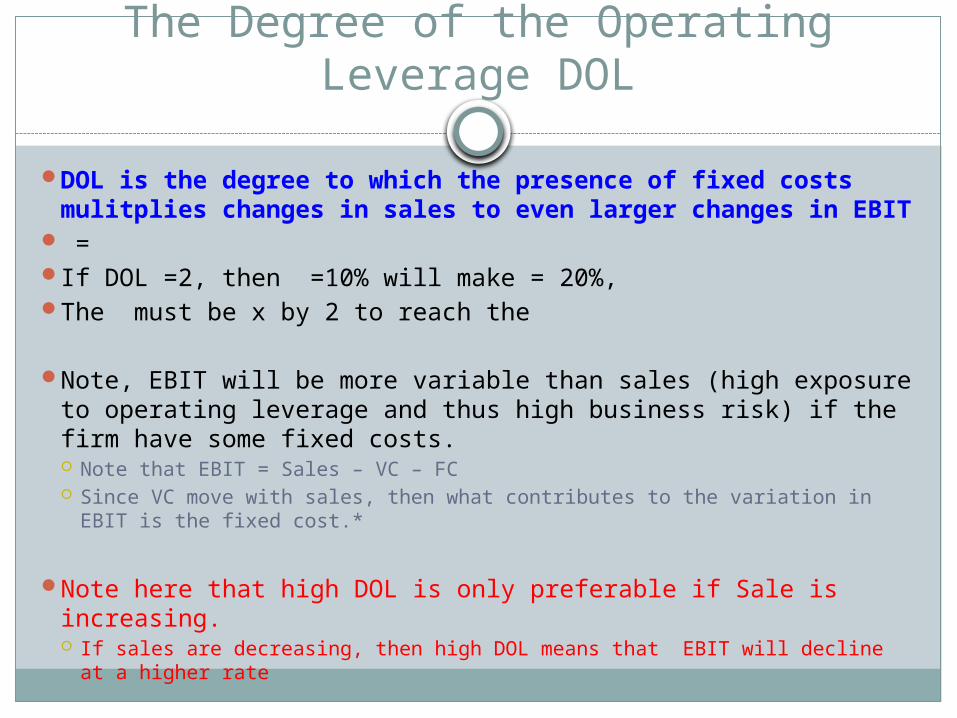
DOL is the degree to which the presence of fixed costs mulitplies changes in sales to even larger changes in EBIT = If DOL =2, then =10% will make = 20%, The must be x by 2 to reach the
Note, EBIT will be more variable than sales (high exposure to operating leverage and thus high business risk) if the firm have some fixed costs. Note that EBIT = Sales – VC – FC Since VC move with sales, then what contributes to the variation in EBIT
is the fixed cost.*
Note here that high DOL is only preferable if Sale is increasing. If sales are decreasing, then high DOL means that EBIT will decline at a
higher rate
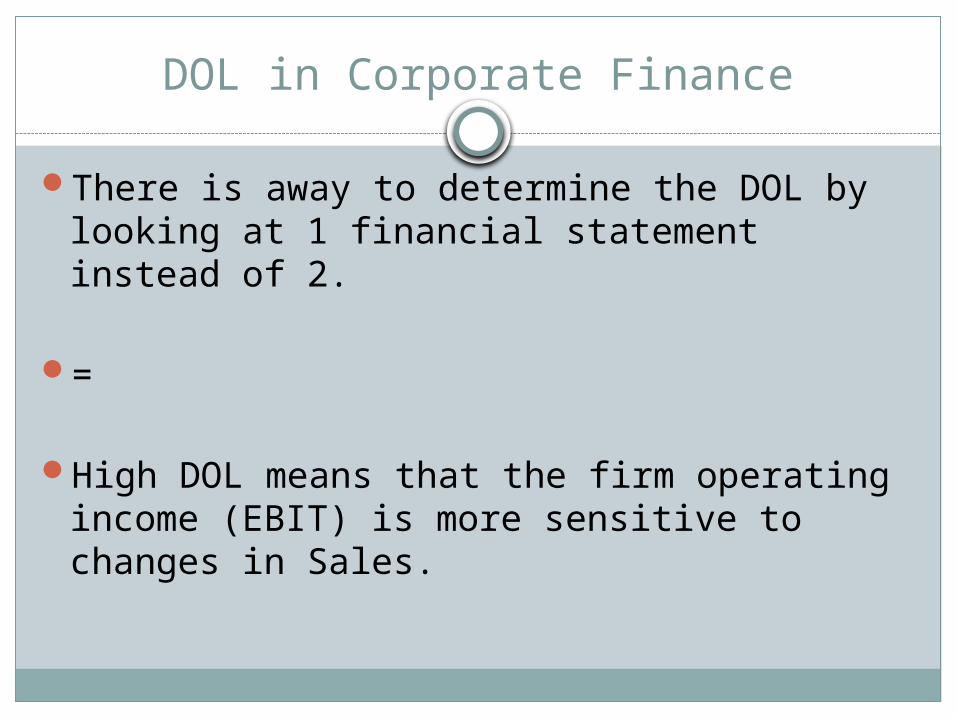
DOL in Corporate Finance
There is away to determine the DOL by looking at 1 financial statement instead of 2.
=
High DOL means that the firm operating income (EBIT) is more sensitive to changes in Sales.
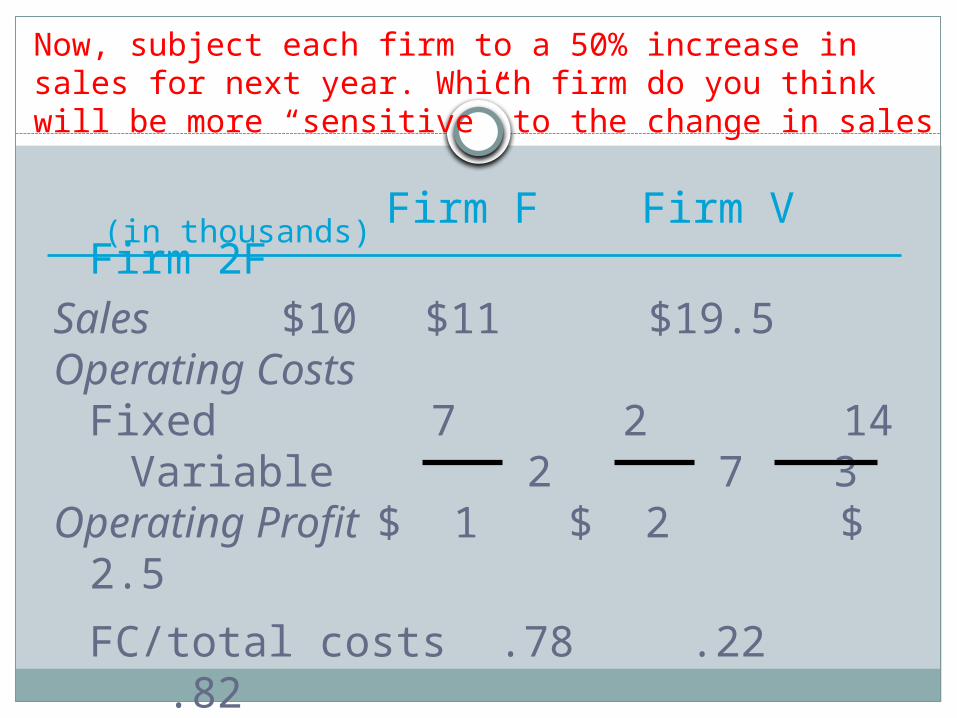
Now, subject each firm to a 50% increase in sales for next year. Which firm do you think will be more “sensitive” to the change in sales
Firm F Firm V Firm 2F
Sales $10 $11 $19.5Operating Costs
Fixed 7 2 14
Variable 2 7 3Operating Profit $ 1 $ 2 $
2.5
FC/total costs .78 .22 .82
FC/sales .70 .18 .72
(in thousands)
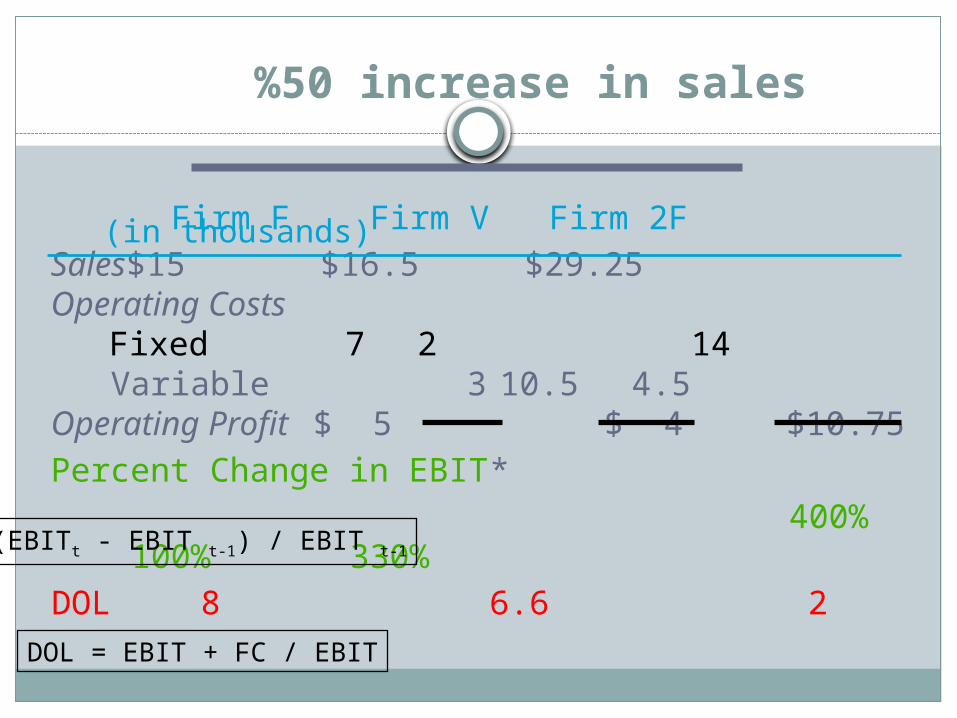
%50 increase in sales
Firm F Firm V Firm 2FSales $15 $16.5 $29.25Operating Costs
Fixed 7 2 14 Variable 3 10.5 4.5Operating Profit $ 5 $ 4 $10.75Percent Change in EBIT* 400% 100% 330%DOL 8 6.6 2
(in thousands)
(EBITt - EBIT t-1) / EBIT t-1
DOL = EBIT + FC / EBIT
Financial Leverage FL
The sensitivity of Net income to changes in fixed financing costs, such as interest expenses, preferred dividends. Thus, it is similar to the OL, but instead of fixed operating
cost, we use fixed financing cost.
A high FL firm means that its profit (net income) is very sensitive to changes in fixed financing costs. Thus, it would be exposed to the financial risk
High probability not meeting its fixed financing costs (default) Possible insolvency Bankruptcy if it defaulted on interest payment obligations
Obviously, the more debt, the more levered the firm is, the more exposure to financial risk.
Financial leverage FL
Unlike operating leverage (OL), financial leverage can be controlled by management. It’s their decision to finance asset by equity, preferred
equity, and/or debt. Its their say what type of debt to use (long vs short). Its their choice how much of each type of financing to
use
Thus, the financial risk exposure is determined by management choices.
The Degree of the Financial Leverage (DFL)
=If DFL=2, then = 10% will make =20%,
Similar to DOL, high DFL is only preferable if EBIT is increasing. If EBIT is decreasing, then high DFL means that EPS
(which factors in interest expenses and preferred dividends) will decline at a higher rate
DFL in Corporate Finance
There is away to determine the DFL by looking at 1 financial statement instead of 2.
We want to how much EBIT (before paying any financing costs) – nominator
is relatively to the earning after paying all financing costs, including preferred dividends, but before taxing all these costs
The Combined Leverage (CL)
Is combining both leverages (operating and financial).
It is the variability of the net income measured by EPS. This is called the (Total Risk)
A firm with a high total leverage means that its EPS is highly sensitive to changes in sales.
Degree of Combined Leverage (DCL)
Note that the degree of the combined leverage is multiplicative instead of additive.
Thus, DCL = DOL x DFL= =