Embed Size (px)
Citation preview
40
Objective Measures of Cognitive Load Using Deep Multi-ModalLearning — A Use-Case in Aviation
JUSTIN C. WILSON, Computer and Cyber Sciences, United States Air Force Academy, USASUKU NAIR, AT&T Center for Virtualization, Southern Methodist University, USASANDRO SCIELZO, Link Training and Simulation, L3Harris Technologies, USAERIC C. LARSON, Computer Science, AT&T Center for Virtualization, Southern Methodist University, USA
The capability of measuring human performance objectively is hard to overstate, especially in the context of the instructorand student relationship within the process of learning. In this work, we investigate the automated classification of cognitiveload leveraging the aviation domain as a surrogate for complex task workload induction. We use a mixed virtual and physicalflight environment, given a suite of biometric sensors utilizing the HTC Vive Pro Eye and the E4 Empatica. We create andevaluate multiple models. And we have taken advantage of advancements in deep learning such as generative learning,multi-modal learning, multi-task learning, and x-vector architectures to classify multiple tasks across 40 subjects inclusive ofthree subject types — pilots, operators, and novices. Our cognitive load model can automate the evaluation of cognitive loadagnostic to subject, subject type, and flight maneuver (task) with an accuracy of over 80%. Further, this approach is validatedwith real-flight data from five test pilots collected over two test and evaluation flights on a C-17 aircraft.
CCS Concepts: • Computing methodologies→Multi-task learning; Transfer learning; •Human-centered comput-ing → Mixed / augmented reality.
Additional Key Words and Phrases: cognitive load classification, workload, deep learning, virtual reality
ACM Reference Format:Justin C. Wilson, Suku Nair, Sandro Scielzo, and Eric C. Larson. 2021. Objective Measures of Cognitive Load Using DeepMulti-Modal Learning — A Use-Case in Aviation. Proc. ACM Interact. Mob. Wearable Ubiquitous Technol. 5, 1, Article 40(March 2021), 35 pages. https://doi.org/10.1145/3448111
1 INTRODUCTION AND MOTIVATIONContext-aware computing is an operative force that facilitates ubiquitous computing. Through context, a machinecan be rendered capable of response, projection, and adjustment in support of the human-in-the-loop, whichincreases the “[informational] bandwidth” [26] of an interaction between a human and a machine. Within theUbiComp community Yvonne Rogers highlighted augmented learning environments as a key application areawithin the UbiComp community, further describing the classroom is an under-explored area in UbiComp research[80]. Moreover, objectively measuring internal states such as cognitive load has “significant implications foradaptive automation” [17], such as adaptive aiding or adaptive task allocation [84]. Haapalainen et al. pointed out
Authors’ addresses: Justin C. Wilson, [email protected], Computer and Cyber Sciences, United States Air Force Academy,Colorado, USA; Suku Nair, [email protected], AT&T Center for Virtualization, Southern Methodist University, Dallas, Texas, USA; Sandro Scielzo,[email protected], Link Training and Simulation, L3Harris Technologies, Arlington, Texas, USA; Eric C. Larson, [email protected],Computer Science, AT&T Center for Virtualization, Southern Methodist University, Dallas, Texas, USA.
Permission to make digital or hard copies of all or part of this work for personal or classroom use is granted without fee provided thatcopies are not made or distributed for profit or commercial advantage and that copies bear this notice and the full citation on the first page.Copyrights for components of this work owned by others than the author(s) must be honored. Abstracting with credit is permitted. To copyotherwise, or republish, to post on servers or to redistribute to lists, requires prior specific permission and/or a fee. Request permissions [email protected].© 2021 Copyright held by the owner/author(s). Publication rights licensed to ACM.2474-9567/2021/3-ART40 $15.00https://doi.org/10.1145/3448111
Proc. ACM Interact. Mob. Wearable Ubiquitous Technol., Vol. 5, No. 1, Article 40. Publication date: March 2021.
40:2 • Justin C. Wilson, Suku Nair, Sandro Scielzo, and Eric C. Larson
the value in understanding and measuring such latent human metrics in order to discern the best opportunity to“proactively and seamlessly [provide] the right information at the right time” [41]. This motivates the need forcontext related research in the UbiComp community that focuses on specific application areas, where contextcan be defined more concretely or in areas where context has a stricter definition. In this research, we focus onthe application area of aviation.
In aviation, context- or situation-aware avionics — capable of assisting either the flight instructor or the aviatorin understanding the human-machine state [15] in real-time— is highly sought after. Instructors seek to understandthe internal context of students while they learn. This is important in assessing their development of manydiverse skills. Performance of aviators is currently assessed through instructor observation and review. Throughthis observation instructors can intuit the internal context of aviators while they learn. While understandingthis latent context is considered a key (but challenging) assessment, the automated sensing of this context hasnot fully materialized. By inferring context related to learning automatically, instructors and trainees can moreeasily determine when mastery of a particular skill is achieved, expediting the learning process and, potentially,improving the overall quality of learner understanding.To this end, a way of objectively measuring cognitive load is needed. There are many works that have
endeavored to provide a solution to this problem. Until now no one has shown significant classification accuracyacross all subjects [1, 4, 17, 31, 41, 57, 64, 78]. Our contribution is a cognitive load classification model thatworks inter-subject and across aviation tasks, and we provide evidence that ourmodelmay generalizeto new aviation scenarios outside the training and simulation environment.
In this research we use the aviation domain for inducing and evaluating cognitive workload. The methods andapplications used within this research are applicable to, and may be replicated within, an array of other domainsor tasks such as driving an automobile. The activities of this research involve the collection of physiologicalmeasures relevant to aviators as they undergo simulated flight scenarios for both low and high levels of inducedworkload. We propose two versions of a new method for cognitive load classification: one with fixed-width input,and the other variable-width input. The basic structure of these models take shape through the use of x-vectorlike architectures and deep, multi-modal, multi-task, and generative learning. Multiple time series modalitiesfrom physiological sensors are encoded into a latent space. Statistics layers are calculated and passed through tothe bottleneck, and finally through to multiple task layers. The task labels are derived from subjective ratingscales — both NASA-TLX and Bedford workload were collected. Data are collected in a mixed-reality trainingenvironment using a physical flight simulator, a virtual reality environment, and a gaze-tracking sensor forcollecting pupillometry and a wrist-worn sensor suite for capturing photoplethysmography, wrist acceleration,peripheral skin temperature, and electrodermal activity. From these devices the multiple synchronized datastreams are classified into cognitive load. These results are compared to a more traditional classifier — randomforests. We detail our work as follows:
• We designed and carried out a human subjects experiment for aviators in a variety of flight scenarios,discussed in Section 4.
• We introduce a methodology for aligning subjective labels in the context of cognitive load theory usingestablished statistical techniques.
• We investigate three competing architectures, a random forest and two deep learning classifiers, and weshow accuracy across subject, subject-type, and maneuver.
• We present our method’s generalizability through test and evaluation of the models with real-flight datausing five test pilot subjects.
Understanding the internal context of an aviator during a simulation are important aspects of the learningexperience. With an objective cognizance of human cognition, it may be possible to personalize the learning
Proc. ACM Interact. Mob. Wearable Ubiquitous Technol., Vol. 5, No. 1, Article 40. Publication date: March 2021.
Objective Measures of Cognitive Load Using Deep Multi-Modal Learning — A Use-Case in Aviation • 40:3
experience for students, expediting the educational effectiveness by maximally challenging the learner withoutoverloading them.
2 BACKGROUNDBecause cognitive load has been explored by a number of diverse communities, our work relates to numerousresearch works. We therefore divide our discussion into three key areas: (1) cognitive load, (2) measures ofcognitive load, and (3) cognitive load in aviation. We note that these research communities are not mutuallyexclusive, but this categorization provides sufficient differences to motivate the various implications of our work.
2.1 Cognitive LoadThere are mixed views on what cognitive load or workload is — note that these two terms are often usedinterchangeably. In the context of aviation, Cooper and Harper defined workload as “the amount of effort andattention, both physical and mental, that a pilot must provide to attain a given level of performance” [22]. Wherephysical workload is described as the “effort expended by the pilot in moving or imposing forces on the controlsduring a specified piloting task” [22]. Mental workload, being much harder to quantify and separate, was describedin the amount of mental compensation required by a pilot to complete a task [22]. Roscoe and Ellis found that 80%of military and commercial pilots view workload “in terms of effort.” They found that when pilots rate the amountof workload they assess it from the perspective of “spare capacity.” Therefore, they redefined workload as “theintegrated physical and mental effort generated by the perceived demands of a specified piloting task” [83]. TheirBedford Workload scale emphasizes the available human resources as it pertains to workload. The creators ofNASA Task Load Index (NASA-TLX), Hart and Staveland, defined workload in terms of “a hypothetical constructthat represents the cost of accomplishing mission requirements for the human operator” [45, 46]. In Hart’s paper,titled NASA TLX; 20 years later, she pointed out a prevailing theme with workload in the psychological literature.Workload in literature has many interpretations and it is a “testament to the complexity of the construct” [45].One such definition: cognitive load can be described as the load that a task or activity places on an individual’sworking memory [7, 17, 52]. Therefore, given the disagreements amongst subject matter experts, it is no surprisethat test subjects would have similar and yet diverse thoughts and opinions about how they perceive workload[45]. Thus, in attempting to build a classifier that works across subjects, this can present an obstacle.As with cognitive load, working memory has varying definitions of its own. Still, it can be thought of as a
cognitive system centered around short-term memory and the mental processes involved — “holding informationin [the] mind and mentally working with it” [27]. Baddeley et al. describes working memory as “multiplespecialized components of cognition that allow humans to comprehend and mentally represent their immediateenvironment, to retain information about their immediate past experience, to support the acquisition of newknowledge, to solve problems, and formulate, relate, and act on current goals” [6]. Fuster describes workingmemory in the context of neuroscience and phenomenology as “sustained attention focused on an executivecognit for the processing of prospective action” [33]. That is, working memory can be thought of as “attentionfocused on an internal representation” [33]. The limitations of working memory have been heavily explored[3, 5, 7, 16, 21, 24, 52]. The idea of a limited working memory can be traced back to George A. Miller [66].Miller suggested that, in general, the human processing capability is limited to near seven elements. That is, it isestimated that humans can recall up to seven numbers in their immediate, respective memories before loss. It hasbeen shown that working memory capacity can refer to either short-term memory limitations, mental processingpower, or both [19, 20, 24, 58, 68, 69, 87, 104] — therefore it is more apt to refer to memory capacity as the mentalbandwidth of working memory.
Proc. ACM Interact. Mob. Wearable Ubiquitous Technol., Vol. 5, No. 1, Article 40. Publication date: March 2021.
40:4 • Justin C. Wilson, Suku Nair, Sandro Scielzo, and Eric C. Larson
2.2 Measures of Cognitive LoadThere are two key ways to measure or approximate cognitive load, subjectively and objectively. We discuss eachin turn as it relates to our research approach.
2.2.1 Subjective Measures. These measures often vary. Because subjective measures are rating scales, theyare based on the assumption that people can, to a certain degree, reliably self-evaluate and report the mentaleffort required to complete a task [71]. Pass et al. notes that this has been demonstrated on several occasions[17, 45, 46, 72]. Moreover, subjective rating methods used most often target overall workload as these techniquesusually involve a questionnaire that is delineated by one or more semantically separable scales. In our research,we also adopt the idea that there are semantically separable scales for aviators reporting their workload viaquestionnaire. Pass et al. further noted that while most scales are multi-dimensional, using variables such as“mental effort, fatigue, and frustration” [71], single-dimension scales have been shown to be sensitive, valid, andreliable [34, 74]. In this work, we utilize both the NASA-TLX (multi-dimensional) and the Bedford Workload(uni-dimensional) scales to measure the overall workload. NASA-TLX defined a weighting scheme that canbe applied, which was intended as a method to reduce subject variability and increase sensitivity. A commonmodification is to not use this weighting scheme at all — calling it Raw TLX (RTLX). Interestingly, there havebeen mixed results with the use of the weighting scheme [45], showing evidence the that scheme works [47],or that it doesn’t work [63], or that it has no effect [10]. In this research we have chosen to use RTLX fortime considerations—reducing the intrusion of the rating on the ongoing experiment and reducing the timecommitment for participants.
2.2.2 Objective Measures. Like their subjective counterpart, these methods also vary. They are evaluated intwo fundamental ways: (1) by utilizing performance data with primary and, sometimes, secondary tasks and (2)through the use of physiological or biometric measures. Performance-based measures come in two flavors: (1)primary task only — based on primary task performance; or (2) primary and secondary tasks — where evaluationis concerned with the performance of the secondary task as an indicator of load induced by the primary task. Inother words, the evaluation is looking at the “spare capacity” to conduct the secondary task, given the primarytask. Typically, the secondary task is simple in nature, requiring sustained attention, but it differs from theprimary task [71]. In our initial, 10 subject, feasibility study, we looked at a secondary task as a way to drive upthe workload, but ultimately decided against it. As Pass et al. observed, “it can interfere considerably with theprimary task” [71] and, in our case, the biometric data we collected was contaminated by the secondary task.That is, certain biometric measures would sync in time with the pilot attending to the secondary task, which isnot a realistic observation of what we would expect from the biometric data in a normal flight environment.Physiological or biometric measures are based on the idea that evidence of cognitive or mental function is
present in psychological or biometric responses [71] — measures like heart rate variability (HRV), pupil dilation,and galvanic skin response. These physiological markers are then evaluated as a measure of cognitive load[9, 14, 42, 49, 73, 77, 105, 108]. Of note, Ursin and Ursin observed that such physiological measures do not measure“imposed load,” but instead, they inform how the subject themselves perceives load, and in particular, how they“cope with” such workload [105], which is, ideally, what we want to capture [42]. Indeed, it is possible to havetwo subjects achieve the same task performance while expending discernibly different amounts of mental effort[71]. The use of physiological measures for classification of cognitive load is a key goal of this research. Giventhe previous research discussed here we can now properly formulate the following research question:
Can we accurately and reliably use multiple physiological/biometric modalities to objectively evaluate cognitiveload as latent context across subjects and across tasks?
Proc. ACM Interact. Mob. Wearable Ubiquitous Technol., Vol. 5, No. 1, Article 40. Publication date: March 2021.
Objective Measures of Cognitive Load Using Deep Multi-Modal Learning — A Use-Case in Aviation • 40:5
2.3 Cognitive Load in AviationPrevious research in cognitive load for aviators and operators has established a relationship among cognitiveworkload and various performances. In the late 1980’s a study was conducted using electroencephalogram (EEG),heart rate (HR), and eye blinks of pilots flying 90 minute missions, a “four ship formation” [96]. Each pilot flewthe same mission in both actual flight and in the simulator. They correlated the more difficult portion of themission with higher HR, fewer eye blinks, and increased EEG activity for both the simulator and the aircraft, anA7. This same pattern of correlation was found irrespective of wing position (pilot lead vs wing-man positionswithin the formation). However, the amplitude of this pattern was reduced within the simulator, as the lowestHRs and highest blinks were recorded. “These data [validates] the fact that physiological measures are usefulindices of pilot workload in actual flight conditions, and can be used to compare flight vs simulator missions”[108].During the first decade of the twenty-first century, cognitive load in personalization systems for operators
and aviators had been investigated through a number of efforts. DARPA’s vision for the AugCog program wasto develop a “robust, noninvasive, real-time, cognitive state detection technology for measuring the cognitiveprocessing state of the user” [89]. And through the Integrated Intelligent Flight Deck (IIFD) Project, NASA soughta “future flight deck system [that] is aware of the vehicle, operator, and airspace system state.” They envisioneda system that could sense and adapt to “internal and external hazards...providing key information to facilitatetimely and appropriate responses” [67]. Unfortunately, the equipment, at this time was considered too bulky,and much of the processing was conducted offline or post-task. For modern hardware, new low-cost, wearabledevices and the pervasiveness of hardware-accelerated machine learning systems on mobile devices mitigatethese concerns. While many research experiments have been carried out showing the ideas to be promising, noneof this research has resulted in a truly robust implementation.Salden et al. [86] validated the hypothesis that dynamic task selection leads to more efficient training. They
evaluated the differential effects of four-task selection methods on training of air traffic control trainees. Theyreviewed one non-dynamic condition where learning tasks were presented in a fixed order, as well as threedynamic conditions where presentation order was based on performance, mental effort, or both, showing thatdynamic task selection leads to more efficient training. While air traffic controls are not aircrew, they are excellentproxies given their level of task saturation and position in the aviation domain.A number of studies utilized electroencephalogram (EEG) and eye tracking sensors [28, 30, 60, 92]. However,
other sensors have also been evaluated including speech prosody [48], functional near-infrared spectroscopy(fNIRS) [44], electrocardiogram (ECG), galvanic skin response (GSR), heart rate, and respiration [90], pulseoximetry [93], and thermal Imaging [101]. The results of these works are mixed. Most works are only proof ofconcept, collecting preliminary physiological data and showing that the sensor data is high fidelity, even in thecontext of flight. A number of studies make broad, non-specific conclusions about the physiological signals suchas “there exist[s] significant differences in the extracted features among different subjects” [60].Operator Performance Laboratory (OPL) has published several papers on the successes of specific sensors
[30, 60, 90, 93]. Their sensor suite consists of eye and head tracking, ECG, EEG, Electromyography (EMG), GSR,respiration, oxygen saturation (𝑆𝑝𝑂2), facial thermography, pulse wave, and fNIRS. In [91], they sought to assessworkload with a tool that works to unify flight data with physiological measures into a single framework, in flightand in real-time. They released a demonstration paper about their capabilities under a training task example [93].
More recently, OPL participated in the Objective Measures of Pilot Workload study, at Edwards AFB [64]. Usingdata collected from seven test pilots over five real world flights in a C-17 military cargo aircraft and a simulator.Martin et al. found they could measure intra-subject relative workload using an ECG sensor that appears to followthe trends of workload. They use and an algorithm they call a chaotic physiological classifier, the foundationfor which is based in chaos theory [31, 64]. Because this was a workload measure relative to the subject, this
Proc. ACM Interact. Mob. Wearable Ubiquitous Technol., Vol. 5, No. 1, Article 40. Publication date: March 2021.
40:6 • Justin C. Wilson, Suku Nair, Sandro Scielzo, and Eric C. Larson
metric needed to be normalized for each pilot’s physiological response. During flight they used ‘organic evolution’where they scaled the workload metric by taking “the minimum and the maximum observed values of” a subsetof a pilot’s maneuvers defined by high and low workload apriori “into a 1..10 range.” Given the limited data set,only so many conclusions can be made.
Despite the broad research completed in the areas of cognition and aviation, we must ultimately conclude thatno one has succeeded at a statistically sensitive, task-agnostic, and subject-agnostic objective pilot workloadclassifier.
3 SENSING MODALITIESIn this research, we use a number of sensing modalities including photoplethysmography (PPG), electrodermalactivity (EDA), peripheral skin temperature, and wrist acceleration in conjunction with gaze metrics includingpupillary response and eye blinks. We hypothesize that combining these modalities could help provide insightsinto the cognitive load of an individual more reliably than previous works. In order to keep the form factor for thebiometric measurements less intrusive, mobile, and compact, an all-in-one, wrist-worn device, the Empatica E4wrist band, was selected. The device was issued with FDA approval for monitoring seizures, but the research-baseddevice is simply used as a data collection instrument. We also employ the use of the HTC VIVE Pro Eye, whichcontains an integrated Tobii eye tracker that provides eye-tracking and pupillary response measurements.We enumerate a subset of the modalities used in our study, with brief motivations for the inclusion of each
where the connection to cognitive load might not be obvious. Photoplethysmography: A number of measurementscan be inferred directly from a continuous PPG signal, including heart rate, heart rate variability (HRV), andinter-beat interval (IBI). Kahneman showed that heart rate can be used for precise tracking of mental effortduring performance of a mental task [53]. Further, heart rate in aviators has been shown to increase with levelsof workload while in flight [81, 82, 97] and in simulators [61, 62, 70]. Electro-dermal Activity (also known asgalvanic skin response): The EDA complex can be broken down into two main components: tonic and phasic.The tonic component is the smooth underlying, slowly changing, and continuous physiological response. Thephasic component is the rapidly changing or high frequency portion of the EDA signal. We use both in ouranalyses. The gaze metrics included both pupillary response and eye blinks. Eye blink studies have demonstratedthere is a correlation among tasks that require attention and fewer eye blinks and/or shorter duration blinks[8, 35, 102, 108]. Wrist Acceleration is used for assessing movements of the wrist in all three-axes on the throttlehand of the pilot. The wrist acceleration can be a proxy for a number of pilot actions in the flight scenario, as itmay capture nuanced indications of activity or aircraft control. For example, Gray showed that the ’effort’ thata pilot puts into manipulating an aircraft can be observed through the concept of inceptor pilot workload [38].Where an inceptor is just the control inputs such as the stick. This workload is measured through a combinationof two independent variables duty cycle and aggressiveness, and they can be evaluated from the origin of the plotbetween these two variables.We build upon research for measuring cognitive workload and methods for acquisition of physiological
measures during longer duration tasks in order to make them more appropriate for learners during simulatedflight. In particular, we investigate methods of combining these modalities using deep learning techniques andconvolution, which may be able to more properly fuse the sensor information for use in a cognitive load classifier.
4 DATA COLLECTIONIn order to inform the design and evaluate our cognitive load classifier, we designed a human subjects experiment(approved by the University IRB). The overall objective was to collect a large dataset made up of various subjectphysiological responses with various simulator maneuvers. This section discusses the procedures and equipmentused to collect the data needed for modeling.
Proc. ACM Interact. Mob. Wearable Ubiquitous Technol., Vol. 5, No. 1, Article 40. Publication date: March 2021.
Objective Measures of Cognitive Load Using Deep Multi-Modal Learning — A Use-Case in Aviation • 40:7
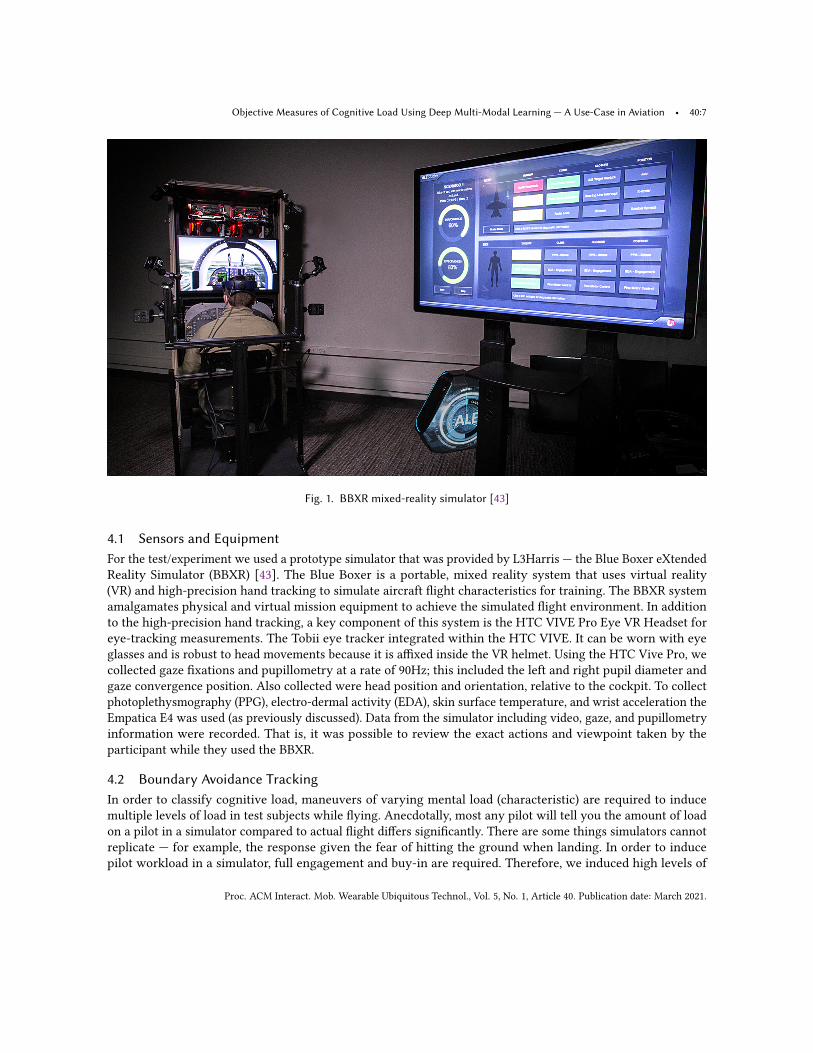
Fig. 1. BBXR mixed-reality simulator [43]
4.1 Sensors and EquipmentFor the test/experiment we used a prototype simulator that was provided by L3Harris — the Blue Boxer eXtendedReality Simulator (BBXR) [43]. The Blue Boxer is a portable, mixed reality system that uses virtual reality(VR) and high-precision hand tracking to simulate aircraft flight characteristics for training. The BBXR systemamalgamates physical and virtual mission equipment to achieve the simulated flight environment. In additionto the high-precision hand tracking, a key component of this system is the HTC VIVE Pro Eye VR Headset foreye-tracking measurements. The Tobii eye tracker integrated within the HTC VIVE. It can be worn with eyeglasses and is robust to head movements because it is affixed inside the VR helmet. Using the HTC Vive Pro, wecollected gaze fixations and pupillometry at a rate of 90Hz; this included the left and right pupil diameter andgaze convergence position. Also collected were head position and orientation, relative to the cockpit. To collectphotoplethysmography (PPG), electro-dermal activity (EDA), skin surface temperature, and wrist acceleration theEmpatica E4 was used (as previously discussed). Data from the simulator including video, gaze, and pupillometryinformation were recorded. That is, it was possible to review the exact actions and viewpoint taken by theparticipant while they used the BBXR.
4.2 Boundary Avoidance TrackingIn order to classify cognitive load, maneuvers of varying mental load (characteristic) are required to inducemultiple levels of load in test subjects while flying. Anecdotally, most any pilot will tell you the amount of loadon a pilot in a simulator compared to actual flight differs significantly. There are some things simulators cannotreplicate — for example, the response given the fear of hitting the ground when landing. In order to inducepilot workload in a simulator, full engagement and buy-in are required. Therefore, we induced high levels of
Proc. ACM Interact. Mob. Wearable Ubiquitous Technol., Vol. 5, No. 1, Article 40. Publication date: March 2021.
40:8 • Justin C. Wilson, Suku Nair, Sandro Scielzo, and Eric C. Larson
workload through the use of Boundary Avoidance Tracking (BAT) theory [39], which originates from the flighttest community.A flight test technique (FTT) is a methodology founded in engineering principles and used in flight test to
determine the characteristics of an aircraft. The test data gleaned from these techniques are typically used whenevaluating an aircraft to ensure it meets a specific pre-existing requirement [39]. Boundary avoidance tracking isa flight test technique used to understand the “pilot-in-the-loop handling qualities” [39] such as pilot-inducedoscillation (PIO). PIO occurs when a pilot drives the “pilot/aircraft system into instability,” which can occur whenthe pilot input is out-of-phase with the aircraft [37, 39]. BAT is founded in the concept of avoiding boundaries;this occurs when a “pilot controls an aircraft to avoid a condition rather than maintain a condition” [38]. The keyhere is that the pilot is tracking the aircraft state in order to avoid a condition, not maintain one. By reducingthe boundaries in a buildup manner, heavy workload can be induced as a consequence. Gray showed that asthe boundaries collapse, the allowable error decreases, and actual error decreases with increasing performance.However, this only happens to an extent. Once the allowable error is sufficiently small, instabilities occur, and“workload...increase[s] until the pilot can no longer accomplish the task” [39]. Gray likened this to riding a bikeacross a beam or an elevated narrow path at an unsafe height. If this path is progressively made "narrower andnarrower" further along the path, the “rider will clearly increase his [or her] effort to stay” in the center ofthat path. Once this path becomes narrow enough, the rider can no longer remain stable and “oscillates off the”path [39].The BAT workload buildup technique is defined as a process where the tolerance for error or boundary is
reduced in a step-wise manner — driving up the difficulty with each step. The pilots are expected to ‘role-play’ asif the boundaries are safety-critical. In our studies, we have sought to drive maximal load. If a test subject foundthemselves in a pilot-induced oscillation, prior to completion of the maneuver. We asked them to stay in the PIOas long as possible until they can no longer fly the maneuver as this is a high cognitive load state.
4.3 MethodologyThe data collection effort consisted of a repeated measures experiment. Each flight maneuver was flown at leasttwice. The experiments were approved by the Southern Methodist University IRB, protocol H18-105-LARE. Theforty test subjects consisted of twenty-one pilots, nine operators, and ten novices. The individuals within pilotgroup represented diverse flight backgrounds, all had flying experience in heavy, rotary, and/or fighter-typeaircraft. Some individuals within the pilot group had commercial flying experience. Operators included navalflight officers (NFOs), combat systems officers (CSOs), remotely piloted aircraft (RPA) sensor operators, andavionics technicians; all with some flight or simulation experience. Novices consisted of those who had no aircraftexperience at all. Gaze data and screen capture video were recorded for each maneuver.The maneuvers flown during this experiment are listed as follows:
• Cruise Maneuver : the subject was instructed to fly straight and level maintaining 12,500 ft and 350 knots-indicated airspeed (KIAS) with tolerances of ±100 ft and ±15 KIAS for five minutes.
• Normal Takeoff : the subject was positioned on the centerline of the runway 13R at (simulated) Falon NavalAir Station (NAS) KNFL. The subject was asked to smoothly apply max power, rotate at 140 KIAS, andpitch between seven and ten degrees nose high – climbing 3,000 ft and leveling off. Tolerances included:±1◦, ±10 ft centerline, and ±2 deg runway heading.
• Normal Landing: the subject was positioned on final to runway 13R at Falon NAS. At decision height, 500 ftabove ground level (AGL), the subject initiated a full-stop landing. The subject was instructed to verbalizehis or her desired touchdown point upon nearing the runway. Tolerances included the nose-wheel within10 feet of centerline.
Proc. ACM Interact. Mob. Wearable Ubiquitous Technol., Vol. 5, No. 1, Article 40. Publication date: March 2021.
Objective Measures of Cognitive Load Using Deep Multi-Modal Learning — A Use-Case in Aviation • 40:9
• Boundary Avoidance Tracking — Longitudinal Axis: the subject was positioned behind a target aircraft thatmoved periodically, at random, in the vertical axis. As the target aircraft moved, the subject was asked tokeep their aircraft’s crosshair inside of a defined boundary about the target’s longitudinal cross-section.With the progression of the maneuver, in a build up manner, the task difficulty was increased by reducingthe boundary spacing.
• Boundary Avoidance Tracking — Lateral Axis: the subject joined on a target aircraft’s right-wing. The targetmoved periodically and at random intervals in the vertical axis. As the target aircraft moved, the subjectwas asked to keep their aircraft’s wing or canopy handle inside of a defined boundary about the target’slateral cross-section. With the progression of the maneuver, in a build up manner, the task difficulty wasincreased by reducing the boundary spacing.
• Air Intercept: the subject begin flying straight and level. The subject obtained a radar lock on the banditaircraft. They offset his/her aircraft 30◦ left or right and descend 10◦ nose low to the bandit’s altitude.At level-off, the pilot accelerated to greater than 400 KIAS, and executed an intercept/escort profile. Thesubject closed for visual identification (VID) and verification of the aircraft markings (fin flash).
For both boundary avoidance tracking (BAT) tasks, when the subject overshot a boundary, they were askedto rapidly recover and place the aircraft back into position and continue the maneuver. The BAT tasks weredesigned to increase the required pilot workload to complete the maneuver. To this end, the simulator operatorhad the ability to manipulate the pitch control laws to increase/decrease the overall response of the aircraft. Theoperator altered the control laws in such a manner as to ensure the subject was stabilized before stepping to thenext adjustment in a buildup manner. In practice, this ability proved more useful in compensating for inceptorinput (stick) deadband than inducing workload. The subject flew each BAT maneuver for a minimum of fiveminutes.
Each subject was given five minutes to familiarize themselves with the aircraft prior to data collection. Duringthis time any questions were answered. The Novices were shown how to use the stick, throttle, rudder pedals,and the heads-up-display (HUD) visuals were explained. For each maneuver, the subject was asked to performthe maneuver as he or she normally would. Novices were asked to execute the maneuver as best they could.Each subject was given the opportunity to practice the air intercept maneuver once, as it is a more complicatedmaneuver, this data was also captured.The full study was conducted during 2019. The data were collected from June 2019 to September 2019. All
the tasks in this experiment took approximately two hours to complete per subject. The temperature in thesimulator room was set to a constant 68𝑜 for each subject’s data collection. We built a data set covering all fortysubjects including twenty-one pilots, nine operators, and ten novices. Over forty hours of physiological datawere collected inclusive of the time between maneuvers. On average each subject performed twelve maneuvers.The average maneuver length was 4 minutes long, with a median of 5 minutes, and a standard deviation of 1.6minutes — a minimum length of 1.4 minutes and maximum length of 9.8 minutes.
4.4 Participant DemographicsTable 1 lists the subject demographic information over forty test subjects. This includes the sample mean, standarddeviation, min and max values for subject age, flight hours, and number of aircraft flown. Further the percentagesfor type of flight experience are listed. Note that the flight experience is not exclusive to military or civilian, asubject can have both. Therefore flight experience can add up to greater than 100%.
5 DATA REDUCTIONDespite the careful design of our human subjects tests, a number of noise sources are unavoidable. To mitigatethe effects of noise (both intra- and inter-subject) the workload labels were manipulated in three ways: (1)
Proc. ACM Interact. Mob. Wearable Ubiquitous Technol., Vol. 5, No. 1, Article 40. Publication date: March 2021.
40:10 • Justin C. Wilson, Suku Nair, Sandro Scielzo, and Eric C. Larson
Table 1. Subject Demographics
Age Hours Aircraft Flown Flight ExperienceSubjects 𝑥 𝜎 Min Max 𝑥 𝜎 Min Max 𝑥 𝜎 Min Max Civilian Military
All Subjects 42.0 10.7 22 61 2816.0 2876.6 0.0 13000.0 4.2 3.7 0 12 25.0% 72.5%Pilots 47.4 7.3 35 61 4631.8 2739.3 1700.0 13000.0 6.5 2.6 3 12 42.9% 100.0%
Operators a 37.9 20.0 23 43 1910.0 1550.0 0.0 4500.0 3.9 3.9 0 9 11.1% 88.9%Novices 34.8 22.8 22 53 0.0 0.0 0.0 0.0 0.0 0.0 0 0 0.0% 0.0%
aFor operators, operator time and pilot time, if applicable, are reported combined.
inter-subject alignment, (2) label correction, and (3) label imputation. We explain the reasoning and methodsof correction for each of the three methods in the following sections. We consider our method of inter-subjectalignment to be an important contribution of this work and, therefore, elaborate on this method in detail. Finally,we conclude this section with discussion of preprocessing and standardization of the sensor data so that it isappropriate for use in a classification model.
5.1 Inter-subject AlignmentA key issue with the classification of cognitive load is proper labeling. An absolute inter-subject scale does notexist, but is the ultimate goal of many cognitive load studies. The use of the assumed cognitive demand of thetask, the mental load characteristic [71], (e.g., the estimated difficulty of a task) is problematic. Any two subjectscan potentially accomplish the same task with the same level of performance using varying levels of requisitecognitive load [71, 105]. This is often dependent on some level of their skill at a task, especially for learned(automated) schemas that bypasses working memory like playing an instrument [18, 71, 103]. Chen et al. [17],provided an example of the variance of subjective labels when compared to the validated task difficulty (mentalload characteristic), finding the subjective labels to be the best discriminator. But this only works intra-subject;it breaks when we attempt to generalize the method to be inter-subject. Haapalainen et al. and Appel et al.attempted such a feat, but Haapalainen et al. did not succeed and Appel et al. was left with mixed results [4, 41].
There is a fundamental problem with using the task difficulty as the label. For example, let us assume that anabsolute scale for cognitive workload exists — a scale from one to ten. We can define a workload inducing taskwith two levels, where the second level is more difficult than the first. Two subjects participate in a repeatedmeasures experiment. Subject one reports an average absolute cognitive load of one on the first level and anaverage absolute cognitive load of six on the second level. Subject two reports an average absolute cognitive loadof six on the first task, and an average absolute cognitive load of nine on the second level. Both completed the taskswith equal performance. Clearly, subject two required more workload to attain the same level of performancefor both levels of the task. Assuming enough quality physiological data were collected, a binary intra-subjectclassifier can be built for each subject using the task difficulty as labels. However, if an inter-subject attempt ismade, subject data for task one — a one and six on the absolute cognitive load scale — are passed to the modelduring training among similar difficulty-labeled samples. And for task two, a six and nine. Thus, this presents aconflict. This is compounded by the fact that the subjective reported cognitive load from each subject, in real life,is not absolute (one subject reporting a cognitive load of “one” could be another subject’s “two”). Because thesubjective labels are not absolute, we must find a way to align them between subjects.In this research we used both Bedford and NASA-TLX rating scales[46, 83]. It is important to note that the
Bedford workload scale was intended to be used as a subject- and task-relative workload measure. And it hasa tendency towards less sensitivity at the low end of workload ratings. Further, Hart and Staveland did notintend NASA-TLX for “absolute judgments or comparisons across different types of tasks,” finding them not very
Proc. ACM Interact. Mob. Wearable Ubiquitous Technol., Vol. 5, No. 1, Article 40. Publication date: March 2021.
Objective Measures of Cognitive Load Using Deep Multi-Modal Learning — A Use-Case in Aviation • 40:11
meaningful given subjects are not likely to remember specific instances of low, medium, or high workload [46].This could explain the observed phenomenon in Chen et al.’s work [17], where workload comparisons at finerresolution than three levels were no longer in relative agreement. In our effort to align the subjective labels,we made a critical assumption. We bounded our data by assuming we had achieved minimum and maximumcognitive load for each subject. Our experiment was designed to acquire both minimally and maximally loadeddata from the subjects. Therefore, we conclude any errors from this assumption are sufficiently mitigated. Whilethis assumption helps to bound the upper and lower cognitive load scores, intra-subject, it does not inform howto transform scores within the bounds for each subject. Therefore, we conducted a non-linear transformationto align the subjective ratings cross-subjects. In the statistics literature, this method is often referred to asquantile transformation [32]. In our experiments, we use this transformation method, bounded by the intra-subjectextrema, to align labels for each classification task. For each classification task, a subjective rating’s correspondingquantile was used as the task label for categorical and binary classes. That is, binary tasks used two quantiles andmulti-class tasks used the number of classes. The transformed values from 10 quantiles were used for the ordinalregression task.One limitation of our alignment procedure is that it does not account for different subjective ratings across
flight maneuvers. Hart and Staveland’s observed a lack of meaning in subjective ratings across tasks [46]. Whileone method for addressing this may be made to bound within a flight task, it is not clear if each flight maneuverconstitutes a sufficiently different task (as defined by Hart and Staveland). In our analyses, however, we did notfind that such a task-specific bounding was needed to create a reliable classifier. This could be because thesetasks were flown within the same time period for a given subject and the subject perceived their load along thesame scale. Or rather, one can surmise that it is just a layer of noise within the subjective ratings for a givensubject. We also note that this noise can be partially mitigated for pilots through proper training. For example,someone professionally trained, such as a test pilot, may offer a less variable set of ratings because the methodsof self-assessment and subjective rating is included in their instruction.
The level of correction needed in our analyses highlights the critical need for an objective workload measure.Additionally, it was evident with our data that we were dealing with “overall workload” for the flight maneuver,rather than more fine grained measures such as turning or elevating the plane [71]. Any attempts to divide ourdata into smaller time segments with the same workload rating yielded a divergent model during training. Thisis understandable given the test methodology and standard practices of collecting cognitive load, subjectively.Workload labeling is an open research problem that needs further investigation. Even so, we argue that ourproposed alignment procedure sufficiently aligns the data inter-subject so that overall workload for the flightmaneuver may be assessed.
5.2 Label CorrectionOnce a method for aligning inter-subject was settled upon, an effort was made to address the intra-subject noise.That is, the noise given the subjectivity of human-subjects and their abilities to discern relative levels of cognitiveload. Hart and Staveland had found subjects’ abilities to remember specific instances of low, medium, or highworkload fleeting [46]. While we did conduct the experiment within roughly a two-hour period for a givensubject, there is likely still noise within the data. Anecdotally, the pilot population is particularly susceptible to“under-reporting” cognitive load—reporting a scenario as easier than it truly was for the pilot. To assist with thisissue, we adjusted some labels based upon expert review of the maneuver. In order to inform label adjustment,several additional resources of information were captured including screen-capture video of the pilot performingthe maneuver (i.e., what the pilot saw) and the annotations from the researcher conducting the experiment. Postdata collection, the data for the specific maneuver was analyzed and the recording was reviewed. Given the testconductor’s notes and the screen-capture video, if warranted, the label was adjusted. Data collection, review, and
Proc. ACM Interact. Mob. Wearable Ubiquitous Technol., Vol. 5, No. 1, Article 40. Publication date: March 2021.
40:12 • Justin C. Wilson, Suku Nair, Sandro Scielzo, and Eric C. Larson
adjustment were completed by the same researcher — a USAF Test Pilot School graduate and instructor. Thecriteria for adjustment was that something in the observed rating and maneuver was “at odds” with previousobservations for the same pilot. This was conducted before any model construction (to avoid bias). Using expertopinion to correct observed subjective ratings is common practice in a number of fields including management[25], user experience [2], and military [23], among many others.As an example, subject 18’s second lateral BAT maneuver resulted in a modification. The subject’s raw
labels included 90-mental demand, 90-physical demand, 90-temporal demand, 50-performance, 90-effort, and80-frustration for NASA-TLX, where each sub-scale was based on a 100 point scale, and a Bedford workload ratingof four. The subject was visibly overloaded, struggled to fly the task, had a significant change in skin conductancelevel, numerous skin conductance responses, many significant 15-20 second pupillary swings, and a low blinkcount. Given these observations, the subject’s Bedford workload rating was changed to a nine in accordance withthe Bedford description — “Extremely high workload. No spare capacity. Serious doubts on ability to maintainlevel of effort” [83]. In the data collected, only the Bedford rating or Mental Demand sub-scale were adjusted. Intotal, 57 labels were adjusted from a total of 446 ratings (about 12% of ratings). All label correction was completeprior to any machine learning modeling and was based solely on observations (including observing sensor datafrom EDA and pupillary response) and recommendations from the researcher conducting the experiment. Wefurther note that the sensor data observed was not used to select ratings for change. Rather, these measures wereused to help verify the reviewer’s opinion (based on observation, experiment notes, and participant video) thatthe subject reported load inaccurately.
5.3 Label ImputationIn the collected data, there were missing subjective ratings for two different maneuvers flown by two differentsubjects. The ratings were missing due to transcription errors. As with label correction the physiological data,test conductor notes, and video recordings were reviewed by an expert. Taking this into account we imputedthe labels using other maneuver ratings. In both cases the Bedford rating for the maneuver was present, but theNASA-TLX ratings were missing. After expert review, the mental demand sub-scale rating was imputed a ratingof 50 because the Bedford rating was five (halfway for either scale). The remaining sub-scales were copied from asimilar maneuver.
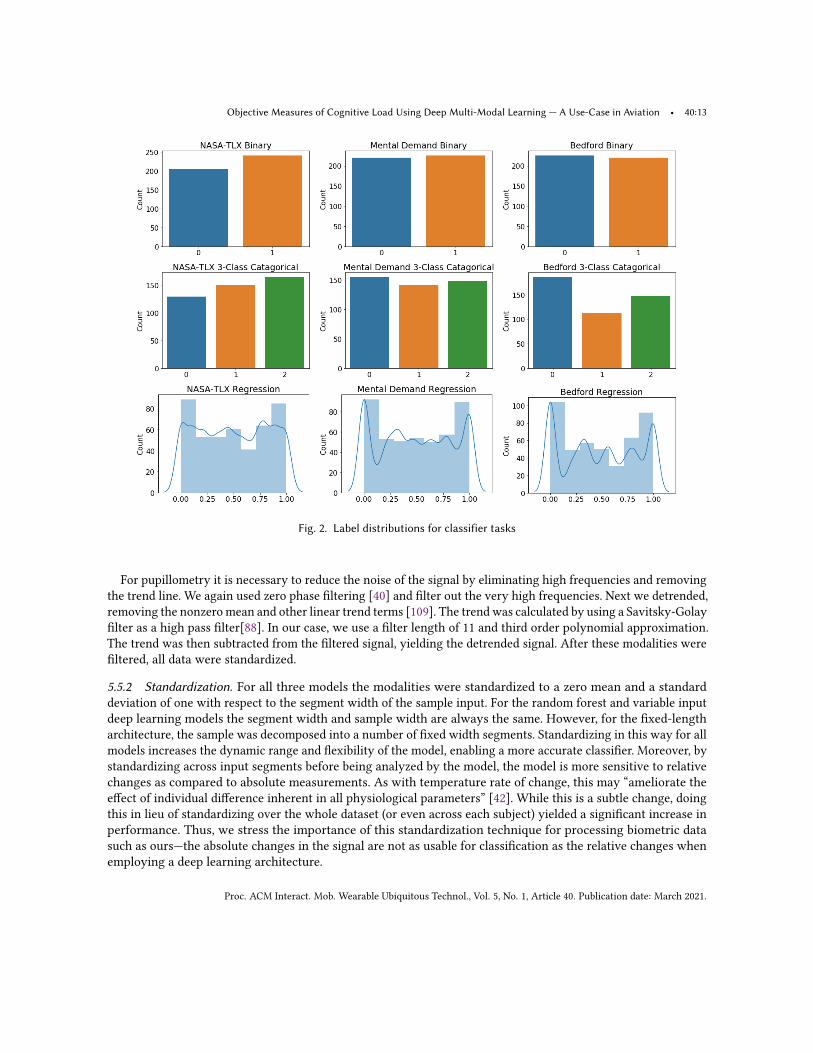
5.4 Rating DomainsUltimately we chose to classify three subjective ratings or rating domains. Because the semantic meanings behindeach is different, it is useful to inform which rating domain works best for classification. Specifically, we classifythe average or equal weight NASA-TLX ratings (RTLX), the mental demand sub-scale of NASA-TLX, and BedfordWorkload ratings. Four classifier tasks were utilized from each rating domain, including: (1) binary, (2) two-classcategorical, (3) three-class categorical, and (4) regression. Note that the difference between binary and two-classcategorical is only relevant in the context of our deep learning architecture. That is, our binary classifier regressesto a single output value which can be above or below a threshold, and the two-class categorical model regressesto two probabilistic outputs which are compared for deciding if the prediction is one class or another.
5.5 Modality Preprocessing and Standardization5.5.1 Preprocessing. Preprocessing was conducted on both EDA and pupillometry prior to use. For EDA, thetonic and phasic components were separated from the original EDA waveform by using a finite impulse response(FIR) filter. We use a butterworth low pass filter with [13] with two Hz cutoff. The coefficients were appliedforward and backward to intensify the effect as well as remove any delay from the filtering process [40].
Proc. ACM Interact. Mob. Wearable Ubiquitous Technol., Vol. 5, No. 1, Article 40. Publication date: March 2021.
Objective Measures of Cognitive Load Using Deep Multi-Modal Learning — A Use-Case in Aviation • 40:13
Fig. 2. Label distributions for classifier tasks
For pupillometry it is necessary to reduce the noise of the signal by eliminating high frequencies and removingthe trend line. We again used zero phase filtering [40] and filter out the very high frequencies. Next we detrended,removing the nonzeromean and other linear trend terms [109]. The trend was calculated by using a Savitsky-Golayfilter as a high pass filter[88]. In our case, we use a filter length of 11 and third order polynomial approximation.The trend was then subtracted from the filtered signal, yielding the detrended signal. After these modalities werefiltered, all data were standardized.
5.5.2 Standardization. For all three models the modalities were standardized to a zero mean and a standarddeviation of one with respect to the segment width of the sample input. For the random forest and variable inputdeep learning models the segment width and sample width are always the same. However, for the fixed-lengtharchitecture, the sample was decomposed into a number of fixed width segments. Standardizing in this way for allmodels increases the dynamic range and flexibility of the model, enabling a more accurate classifier. Moreover, bystandardizing across input segments before being analyzed by the model, the model is more sensitive to relativechanges as compared to absolute measurements. As with temperature rate of change, this may “ameliorate theeffect of individual difference inherent in all physiological parameters” [42]. While this is a subtle change, doingthis in lieu of standardizing over the whole dataset (or even across each subject) yielded a significant increase inperformance. Thus, we stress the importance of this standardization technique for processing biometric datasuch as ours—the absolute changes in the signal are not as usable for classification as the relative changes whenemploying a deep learning architecture.
Proc. ACM Interact. Mob. Wearable Ubiquitous Technol., Vol. 5, No. 1, Article 40. Publication date: March 2021.
40:14 • Justin C. Wilson, Suku Nair, Sandro Scielzo, and Eric C. Larson
5.6 Engineered FeaturesWhile we relied heavily on deep learning for feature extraction, we also engineered more traditional features thatcapture specific properties of certain modalities. Moreover, these features provide a baseline for comparing themore automated feature extraction used by convolutional networks. For each signal, we calculate the minimum,maximum, standard deviation, and mean. We perform this calculation for the raw EDA signal, peripheral skintemperature, acceleration magnitude, skin conductance response (SCR), interbeat interval, and left and rightpupillary response, resulting in (7 signals) x (4 aggregations) = 28 features. These aggregations were calculated inorder to “snapshot” the signal’s characteristics in a way that is easily analyzed by a traditional machine learningapproach, such as a random forest. Furthermore, we captured more signal specific measures that are common inthe biometric analysis community. Specifically, we measured SDRR, pNN50, SCR count, left and right blink, andaverage blink rate (6 additional features). The pNN50 and SDRR were calculated according to [94]. Specifically,SDRR is the standard deviation of RR intervals, and pNN50 is the percentage of successive RR intervals that aredifferent by more than 50ms. Where “RR intervals [are] interbeat intervals between all successive heartbeats” [94].Ultimately, all engineered features were normalized across the dataset between 0 and 1. Finally, most engineeredfeatures employed a sliding window approach, whereby peaks and troughs were calculated within each window,and then as estimates for a number of features such as blinks.With regards to pupillary response, the minimum, maximum, standard deviation, and mean were taken.
Specifically pupillary response was calculated from the detrended signal as a difference from the peak to anestimated baseline point, where the peak was found with a 20-second sliding window. Because the exact start ofan external stimuli is unknown, we found the preceding two troughs and took the average. This baseline wasa minimum of 20-seconds, which is much larger than what Wangwiwattana et al. [106] used — a five secondsbaseline. Wangwiwattana et al. knew where the stimulus began in their experiments, but we cannot ascertainstimuli specifically because multiple stimuli may occur in one maneuver. Because troughs are easy to find, weposited that the average over the two preceding troughs would arrive much closer to the true baseline then justusing the preceding trough as the start point. Also, we did not use the percentage of the pupillary response —(𝑝𝑒𝑎𝑘𝑣𝑎𝑙𝑢𝑒 − 𝑏𝑎𝑠𝑒𝑙𝑖𝑛𝑒)/𝑏𝑎𝑠𝑒𝑙𝑖𝑛𝑒 — as with [56] nor a correction factor for lighting [76, 106]. The advantages ofa percentage pupillary change are understood as providing a standardization regardless of a unit measurement ororiginal baseline size. However we found it beneficial to just take the minimum, maximum, standard deviation, andmean of the papillary responses, followed by a normalization, between 0 and 1, for the whole dataset. However,this approach may not generalize outside of our application, as we benefited from not needing to use a correctionfactor as the lighting within the HTC VIVE Pro Headset was relatively constant.For blinks, a window size of 500 milliseconds was used to capture the high frequency troughs from the
unmodified pupil diameter data. This is common practice for extracting blinks from pupillary diameter [106].Moreover, if the left or right eye differed significantly (with one eye providing unrealistic results), the other eyewas utilized in place of this eye blink data (a threshold of 3mm on the pupil diameter was employed for judging‘realistic’ pupil size). This problem most often occurred with subjects wearing glasses, where the eye trackerwould report anomalous pupil diameter due to spectral reflections from the wearer’s glasses.
Skin conductance responses were measured through the use of a 3.25 second sliding window. First, the peakof the conductance is found; then the preceding trough 3 seconds prior is found. If the difference is greater than.01 `𝑆 , the SCR was recorded and associated statistics calculated. Each sample was normalized between 0 and 1.This was done due to the characteristics of EDA as observed from [11, 14], discussed in Section 3. Ultimately weseek to observe the relative changes in and intensity of SCRs between both samples in lieu of absolute measures.
Proc. ACM Interact. Mob. Wearable Ubiquitous Technol., Vol. 5, No. 1, Article 40. Publication date: March 2021.
Objective Measures of Cognitive Load Using Deep Multi-Modal Learning — A Use-Case in Aviation • 40:15
6 ARCHITECTUREIn this research three architectures were used to classify cognitive load. Specifically, we used a more traditionalrandom forest model, which served as a comparison for the other two models. We used two variants of a novelarchitecture we coined as Biometric Multi-Modal, Multi-Task, X-Vector architecture or 𝐵𝑀3𝑇𝑋 . We propose twoversions of a new method for cognitive load classification: one with fixed-length input, and the other variable-length input. The basic structure of these models take shape through the use of x-vector-inspired architectures anddeep, multi-modal, multi-task, and generative learning. As an overview, multiple 1-Dmodalities from physiologicalsensors are encoded into a latent space using a variational auto-encoder’s encoder for each modality. Then, takinginspiration from x-vectors [99], statistics pooling layers are calculated and passed onto the bottleneck (the layersdirectly following the pooling), and finally through to multiple task layers. In this section, we discuss the randomforests model, the necessary deep learning background, the generative models — variational auto-encodersarchitectures — used in both versions of the 𝐵𝑀3𝑇𝑋 architecture, and finally fixed-length and variable-lengthinput architectures.
6.1 Random ForestsAs a baseline, a random forests classifier [12] was built for each task using only the engineered features, asdiscussed in Section 5.6. We assume the reader is familiar with the basic concepts of random forests, and we listthe relevant parameters used in training. For each model, we employed bootstrapping with sampling preferenceproportional to mis-classified training samples, randomized bagging of features based on
√𝑁𝑓 , balanced class
weights (inversely proportional to frequency in training set), and 1,000 trees. The split criterion for both thebinary and two-class categorical classifiers used the gini impurity [12], while the regressor versions used meansquared error.
6.2 TrainingGenerically, training was conducted in the same manner for all three architectures. Cross-subject, k-fold cross-validation was utilized and folds were stratified across participant background: novice, operator, and pilot. Becausethere were only nine operators, the lowest subject count (Section 4.3), the stratification of folds across subjecttype was organized with two pilots, one operator, and one novice. This left a tenth grouping of one novice andthree pilots for the test dataset. Practically, this means that each validation fold had at least one example of anovice, operator, and pilot. It is important to note that by using cross-subject, k-fold cross validation, we ensurethat the model is built assuming no calibration biometric data for the test participants are available. For therandom forests classifier each task was trained as a separate model.
6.3 Machine Learning BackgroundBoth versions of the 𝐵𝑀3𝑇𝑋 architectures are similar in that they follow the basic structure through the useof multiple modality variational encoders, statistics layers, bottleneck layers, and multi-task layers. They takeadvantage of several key concepts from within machine learning: (1) multi-task learning [75, 85], (2) multi-modal learning [59, 79], (3) variational autoencoders [55], and (4) x-vectors. Further, the variable-length inputversion takes advantage of transfer learning [51, 75]. A discussion of each methodology in the context of deeplearning is beyond the scope of this paper. However, we do expand on the usage of x-vectors for our architecture.In our discussion of neural networks, we adopt the terminology of “dense layers” to refer to fully connectedlayers followed by a non-linear activation function and convolutional layers denote 1-D temporal convolutions.Moreover, we use the term “separable convolution” to denote convolutional layers where each channel is separatedand convolved with a different filter before it is convolved with a second filter that weights the outputs of eachfilter. This differs slightly from the definitions of “separable convolution” used in the signal processing community,
Proc. ACM Interact. Mob. Wearable Ubiquitous Technol., Vol. 5, No. 1, Article 40. Publication date: March 2021.
40:16 • Justin C. Wilson, Suku Nair, Sandro Scielzo, and Eric C. Larson
where a higher dimensional convolution can be carried out by multiple chained lower dimensional convolutions(though in practice, the separable convolution can approximate this behavior). Finally, the use of the term“multi-task” in our application refers only to the concept of learning multiple classification tasks. These tasks arenot cross-domain tasks—they are all in the context of aviation and all are in the context of the same experiment.
6.3.1 X-Vector Inspiration. Our architecture borrows key concepts from the x-vector training architecturecommonly employed in speaker verification systems [98]. X-vectors are fixed-dimensional embeddings trained,given a deep neural network, on variable-length speech utterances. They are instrumental within the domain ofspeaker recognition as they create embeddings to capture speaker characteristics over the entire utterance andgeneralize well to other speakers [98, 99]. More specifically, the core architecture uses time-delay neural networksat its frame-level layers. The features learned are aggregated within a statistics pooling layer, where mean andstandard deviation are taken across the temporal dimension of final frame-level output. At the segment-level, thispooling layer’s output is passed to two additional dense hidden layers before reaching the final softmax outputlayer. The dense learned features at either dense layer are then extracted and used for speaker recognition [98].The key aspect of this architecture is its ability to learn latent features which capture the speaker characteristicsfrom variable-length utterances. While our architectures are end-to-end, we borrow key aspects from the x-vectorarchitecture, including (1) the statistical pooling layer that enables ‘segment-level’ classification (in our case,across the entire observation), and (2) the hierarchical learning of latent features, where each dimension is anabstraction of the input observation. While they utilize time-delay neural networks, we use more traditional 1-Dconvolutions and separable convolutions.
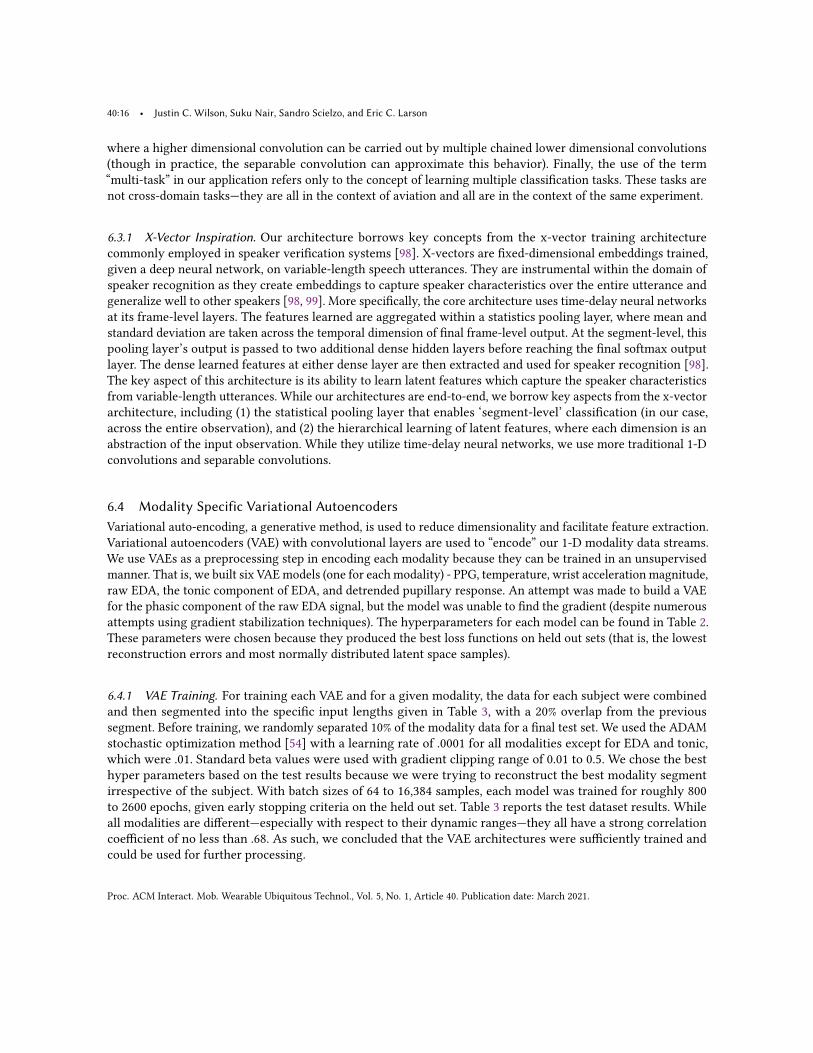
6.4 Modality Specific Variational AutoencodersVariational auto-encoding, a generative method, is used to reduce dimensionality and facilitate feature extraction.Variational autoencoders (VAE) with convolutional layers are used to “encode” our 1-D modality data streams.We use VAEs as a preprocessing step in encoding each modality because they can be trained in an unsupervisedmanner. That is, we built six VAEmodels (one for each modality) - PPG, temperature, wrist acceleration magnitude,raw EDA, the tonic component of EDA, and detrended pupillary response. An attempt was made to build a VAEfor the phasic component of the raw EDA signal, but the model was unable to find the gradient (despite numerousattempts using gradient stabilization techniques). The hyperparameters for each model can be found in Table 2.These parameters were chosen because they produced the best loss functions on held out sets (that is, the lowestreconstruction errors and most normally distributed latent space samples).
6.4.1 VAE Training. For training each VAE and for a given modality, the data for each subject were combinedand then segmented into the specific input lengths given in Table 3, with a 20% overlap from the previoussegment. Before training, we randomly separated 10% of the modality data for a final test set. We used the ADAMstochastic optimization method [54] with a learning rate of .0001 for all modalities except for EDA and tonic,which were .01. Standard beta values were used with gradient clipping range of 0.01 to 0.5. We chose the besthyper parameters based on the test results because we were trying to reconstruct the best modality segmentirrespective of the subject. With batch sizes of 64 to 16,384 samples, each model was trained for roughly 800to 2600 epochs, given early stopping criteria on the held out set. Table 3 reports the test dataset results. Whileall modalities are different—especially with respect to their dynamic ranges—they all have a strong correlationcoefficient of no less than .68. As such, we concluded that the VAE architectures were sufficiently trained andcould be used for further processing.
Proc. ACM Interact. Mob. Wearable Ubiquitous Technol., Vol. 5, No. 1, Article 40. Publication date: March 2021.
Objective Measures of Cognitive Load Using Deep Multi-Modal Learning — A Use-Case in Aviation • 40:17
Table 2. VAE Architecture: The VAE configurations for each modality. A layer’s parameters are denoted as ‘Layer Type<Kernel Size>-<Strides>-<Filters>-[Activation Type (ReLU if not noted)].’
Photoplethysmography Wrist Acceleration Peripheral Skin Temperature Raw EDA Tonic Pupillary Response
Input Length98 32 98 98 98 2205
EncoderConv1D 3-1-128 Conv1D 3-1-128 Conv1D 3-1-128 Conv1D 3-1-128 Conv1D 3-1-128 Conv1D 3-1-128SepConv1D 3-2-64 SepConv1D 3-1-64 SepConv1D 3-2-64 SepConv1D 3-2-64 SepConv1D 3-2-64 SepConv1D 3-2-64SepConv1D 3-2-32 SepConv1D 3-1-32-tanh SepConv1D 3-2-32 SepConv1D 3-2-32 SepConv1D 3-2-32 SepConv1D 3-2-32
SepConv1D 3-2-16-tanh Weighted Suma SepConv1D 3-2-16-tanh SepConv1D 3-2-16-tanh SepConv1D 3-1-16-tanh SepConv1D 3-2-16-tanhWeighted Suma Weighted Suma Weighted Suma Weighted Suma Weighted Suma
Latent Dimensions (Mean and Std. Dev. - Dense Layers)9 16 9 9 9 9
DecoderDense-224 Dense-320 Dense-224 Dense-224 Dense-224 Dense-70,656
2 x UpSampling 2 x UpSampling 2 x UpSampling 2 x UpSampling 2 x UpSampling 2 x UpSamplingSepConv1D 3-1-16 SepConv1D 3-1-16 SepConv1D 3-1-16 SepConv1D 3-1-16 SepConv1D 3-1-16 SepConv1D 3-4-162 x UpSampling 2 x UpSampling 2 x UpSampling 2 x UpSampling 2 x UpSampling 2 x UpSampling
SepConv1D 3-1-32 SepConv1D 3-1-32 SepConv1D 3-1-32 SepConv1D 3-1-32 SepConv1D 3-1-32 SepConv1D 3-2-322 x UpSampling SepConv1D 3-1-64 2 x UpSampling 2 x UpSampling 2 x UpSampling 2 x UpSampling
SepConv1D 3-1-64 Conv1D 3-1-1-linear SepConv1D 3-1-64 SepConv1D 3-1-64 SepConv1D 3-1-64 SepConv1D 3-1-64Conv1D 3-1-1-linear Conv1D 3-1-1-linear Conv1D 3-1-1-linear Conv1D 3-1-1-linear 2 x UpSampling
SepConv1D 3-1-32Conv1D 3-1-1-linear
Output Length98 32 98 98 98 2205
aA weighted sum across filters i.e. SepConv1D 1-1-1(BOLD) Pruning location for variable-length 𝐵𝑀3𝑇𝑋 architecture.
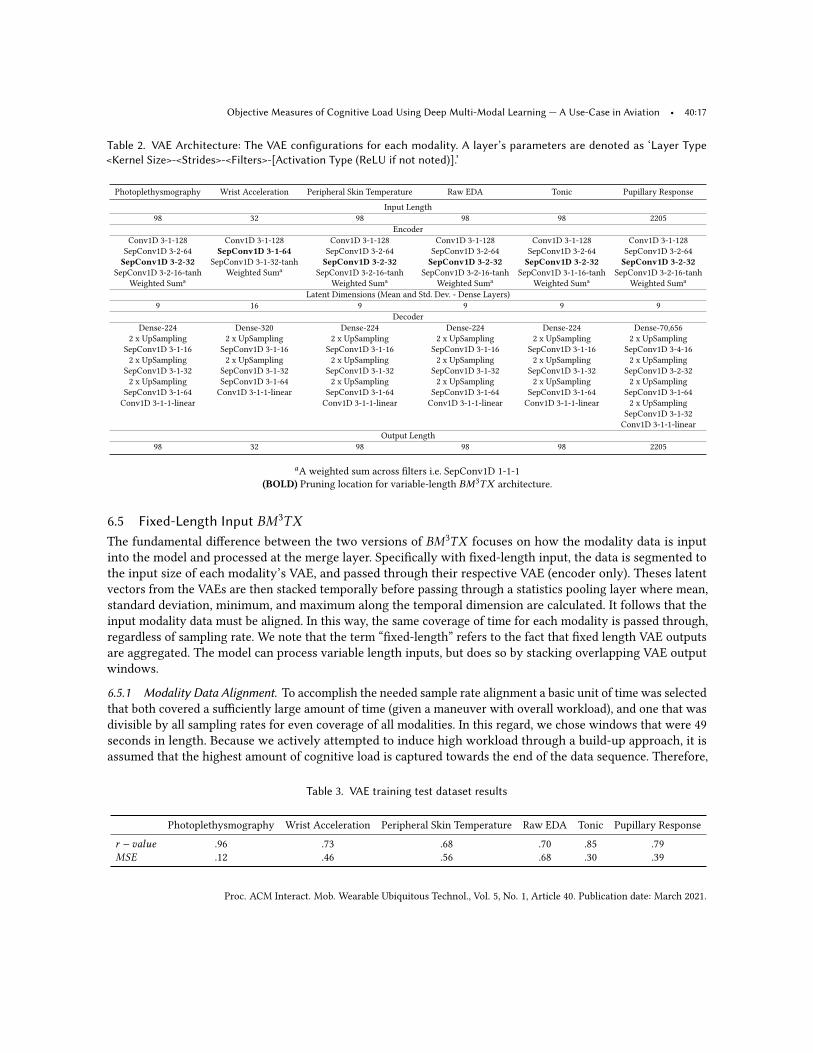
6.5 Fixed-Length Input 𝐵𝑀3𝑇𝑋
The fundamental difference between the two versions of 𝐵𝑀3𝑇𝑋 focuses on how the modality data is inputinto the model and processed at the merge layer. Specifically with fixed-length input, the data is segmented tothe input size of each modality’s VAE, and passed through their respective VAE (encoder only). Theses latentvectors from the VAEs are then stacked temporally before passing through a statistics pooling layer where mean,standard deviation, minimum, and maximum along the temporal dimension are calculated. It follows that theinput modality data must be aligned. In this way, the same coverage of time for each modality is passed through,regardless of sampling rate. We note that the term “fixed-length” refers to the fact that fixed length VAE outputsare aggregated. The model can process variable length inputs, but does so by stacking overlapping VAE outputwindows.
6.5.1 Modality Data Alignment. To accomplish the needed sample rate alignment a basic unit of time was selectedthat both covered a sufficiently large amount of time (given a maneuver with overall workload), and one that wasdivisible by all sampling rates for even coverage of all modalities. In this regard, we chose windows that were 49seconds in length. Because we actively attempted to induce high workload through a build-up approach, it isassumed that the highest amount of cognitive load is captured towards the end of the data sequence. Therefore,
Table 3. VAE training test dataset results
Photoplethysmography Wrist Acceleration Peripheral Skin Temperature Raw EDA Tonic Pupillary Response
𝑟 − 𝑣𝑎𝑙𝑢𝑒 .96 .73 .68 .70 .85 .79𝑀𝑆𝐸 .12 .46 .56 .68 .30 .39
Proc. ACM Interact. Mob. Wearable Ubiquitous Technol., Vol. 5, No. 1, Article 40. Publication date: March 2021.
40:18 • Justin C. Wilson, Suku Nair, Sandro Scielzo, and Eric C. Larson
we right justify (temporally) the maneuver data in 49-second chunks, starting at the end of the maneuver anddropping the first several seconds, [0 𝑡𝑜 49) 𝑠𝑒𝑐𝑜𝑛𝑑𝑠 , of data at the onset of the maneuver. Table 4 provides adescription of the alignment parameters given a modality.
Table 4. Modality Alignment Parameters
Modality Segment Length Sampling Rate Segment Samples VAE Input Length Latent Vectors per Segment
Photoplethysmography 49 Seconds 64 3136 98 32Wrist Acceleration 49 Seconds 32 1568 32 49Peripheral Skin Temperature 49 Seconds 4 196 98 2Raw EDA 49 Seconds 4 196 98 2Tonic 49 Seconds 4 196 98 2Pupillary Response 49 Seconds 90 4410 2205 2
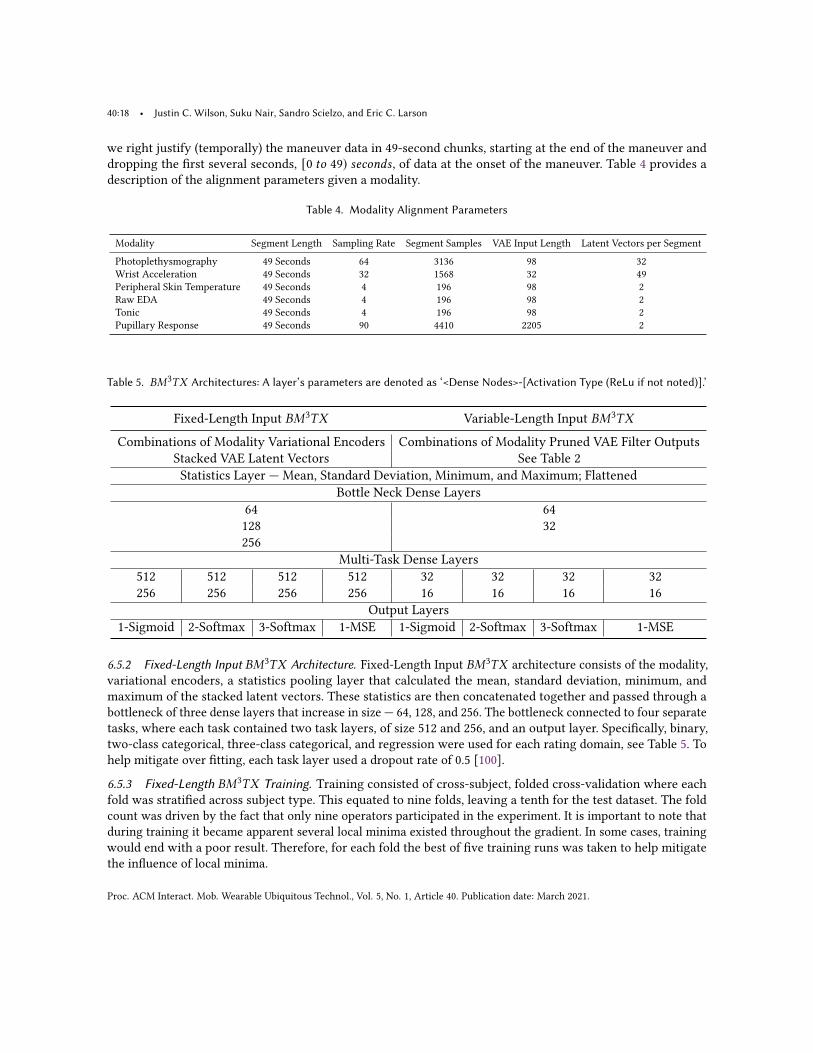
Table 5. 𝐵𝑀3𝑇𝑋 Architectures: A layer’s parameters are denoted as ‘<Dense Nodes>-[Activation Type (ReLu if not noted)].’
Fixed-Length Input 𝐵𝑀3𝑇𝑋 Variable-Length Input 𝐵𝑀3𝑇𝑋
Combinations of Modality Variational Encoders Combinations of Modality Pruned VAE Filter OutputsStacked VAE Latent Vectors See Table 2Statistics Layer — Mean, Standard Deviation, Minimum, and Maximum; Flattened
Bottle Neck Dense Layers64 64128 32256
Multi-Task Dense Layers512 512 512 512 32 32 32 32256 256 256 256 16 16 16 16
Output Layers1-Sigmoid 2-Softmax 3-Softmax 1-MSE 1-Sigmoid 2-Softmax 3-Softmax 1-MSE
6.5.2 Fixed-Length Input 𝐵𝑀3𝑇𝑋 Architecture. Fixed-Length Input 𝐵𝑀3𝑇𝑋 architecture consists of the modality,variational encoders, a statistics pooling layer that calculated the mean, standard deviation, minimum, andmaximum of the stacked latent vectors. These statistics are then concatenated together and passed through abottleneck of three dense layers that increase in size — 64, 128, and 256. The bottleneck connected to four separatetasks, where each task contained two task layers, of size 512 and 256, and an output layer. Specifically, binary,two-class categorical, three-class categorical, and regression were used for each rating domain, see Table 5. Tohelp mitigate over fitting, each task layer used a dropout rate of 0.5 [100].
6.5.3 Fixed-Length 𝐵𝑀3𝑇𝑋 Training. Training consisted of cross-subject, folded cross-validation where eachfold was stratified across subject type. This equated to nine folds, leaving a tenth for the test dataset. The foldcount was driven by the fact that only nine operators participated in the experiment. It is important to note thatduring training it became apparent several local minima existed throughout the gradient. In some cases, trainingwould end with a poor result. Therefore, for each fold the best of five training runs was taken to help mitigatethe influence of local minima.
Proc. ACM Interact. Mob. Wearable Ubiquitous Technol., Vol. 5, No. 1, Article 40. Publication date: March 2021.
Objective Measures of Cognitive Load Using Deep Multi-Modal Learning — A Use-Case in Aviation • 40:19
Training was conducted in three phases. First, the VAEs were trained as discussed in Section 6.4.1. Second, themodality data was passed through the modality encoders and the corresponding statistics were pooled for eachsubject’s maneuver. This transformed dataset was then parsed into folds for training and testing. The remainingportion of the architecture, from the merge layer through task output, was trained using the ADAM stochasticoptimization method [54] with a learning rate of .0001. Standard beta values were used with gradient clipping of1.0. L1 and L2 regularization were used each with _ = .001. We employed a batch size of 64 samples. The modelswere trained for roughly 250 epochs, given early stopping. Our training results are described in Section 7. Wechoose the best hyper-parameters, given our results through stratified, across-subject, folded training.
6.6 Variable-Length Input 𝐵𝑀3𝑇𝑋
Ideally, our goal is a model that can handle variable-length input without the need for windowing from the fixedlength VAEs. To this end we took advantage of the inherent ability of convolutions within each VAE (given thatthey can be applied to any size input). That is, we apply the learned convolutional kernel across the entire inputdata length — scaling the output with the length of the input [36]. Because convolutions both use parametersharing and learn equivariant representations, convolutions provide “a means of working with inputs of variablesize” [36]. Where parameter sharing is the use of the same parameter for more than one function within a model— the kernel.
In a convolutional neural network the kernel is used at nearly every position of the input. Thus, a convolutionallayer learns a set of parameters for all locations regardless of input length. Because of this, the layer has theequivariance property; that is, the layer is equivariant to translation. Equivariance means, “if the input changes,the output changes in the same way” — where 𝑓 (𝑔(𝑥)) = 𝑔(𝑓 (𝑥)) [36]. Goodfellow et al. provide an examplefor time-series data. Specifically, a convolution captures different learned features that appear within the input.Should a similar feature appear later in time, that representation will manifest within the output. Therefore,convolutions are robust to translations and are independent of input length, which is exactly what we requiregiven variable length maneuver data. “Convolution[s for] the processing [of] variably sized inputs makes senseonly for inputs that have variable size because they contain varying amounts of observation of the same kind ofthing — different lengths of recordings over time” [36]. With convolutions, input length is a free parameter.With the promising results of fixed-length 𝐵𝑀3𝑇𝑋 , we evolved the architecture by eliminating the weighted
summation and dense layers of the trained VAE, focusing only on the encoding convolutional filters. In the samefashion as with x-vectors, Section 6.3.1, we apply a statistics pooling layer directly to the outputs of the filtersfrom the dimensionality reducing convolutional neural network of the VAE (encoder only). The statistic layercomputes the mean, standard deviation, min, and max across the filters, for each modality. With the statisticspooling layer directly attached to the filter output of the convolutional layers, the convolutions are decoupledfrom the requirement of a global input length. This is because the statistics layer will always produce the sameoutput size, giving the dense bottleneck network a fixed-length input size. However, there is a caveat, whichdepends on the implementation and optimizations of a given deep learning API, in our case Keras. Each sample ina batch must be the same length therefore we used a batch size of one (which can dramatically increase trainingtime because it reduces parallelism in the feed-forward and back propagation protocols).
The new variable-length input 𝐵𝑀3𝑇𝑋 architecture thus consists of the modality variational encoders whichwere pruned just before the separable convolutional layer with the hyperbolic tangent activation. Moreover, thefilters were not frozen during training to allow finetuning. Therefore, the VAE training provided a starting pointfor the full optimization. The pruning location is highlighted on Table 2 in bold. The statistics pooling layer iscalculated across each filter output, thus “aggregat[ing...across] the time dimension” [99], and concatenated. Twobottleneck layers are used, with 64 and 32 nodes. The bottleneck connects to four separate tasks, where each
Proc. ACM Interact. Mob. Wearable Ubiquitous Technol., Vol. 5, No. 1, Article 40. Publication date: March 2021.
40:20 • Justin C. Wilson, Suku Nair, Sandro Scielzo, and Eric C. Larson
task contained two task layers, of size 32 and 16, with an output layer. Specifically, binary, two-class categorical,three-class categorically, and regression were used for a given rating domain, see Table 5.
6.6.1 Variable-Length 𝐵𝑀3𝑇𝑋 Training. As with fixed-length 𝐵𝑀3𝑇𝑋 training consisted of a cross-subject, foldedcross-validation where each fold was stratified across subject type. This equated to nine folds, leaving a tenth forthe test dataset. The local minima issue plaguing the fixed-length version continued with this architecture. It wasapparent several local minima exist throughout the gradient. In some cases, training would end with poor results.Again, the best of five training runs was taken.
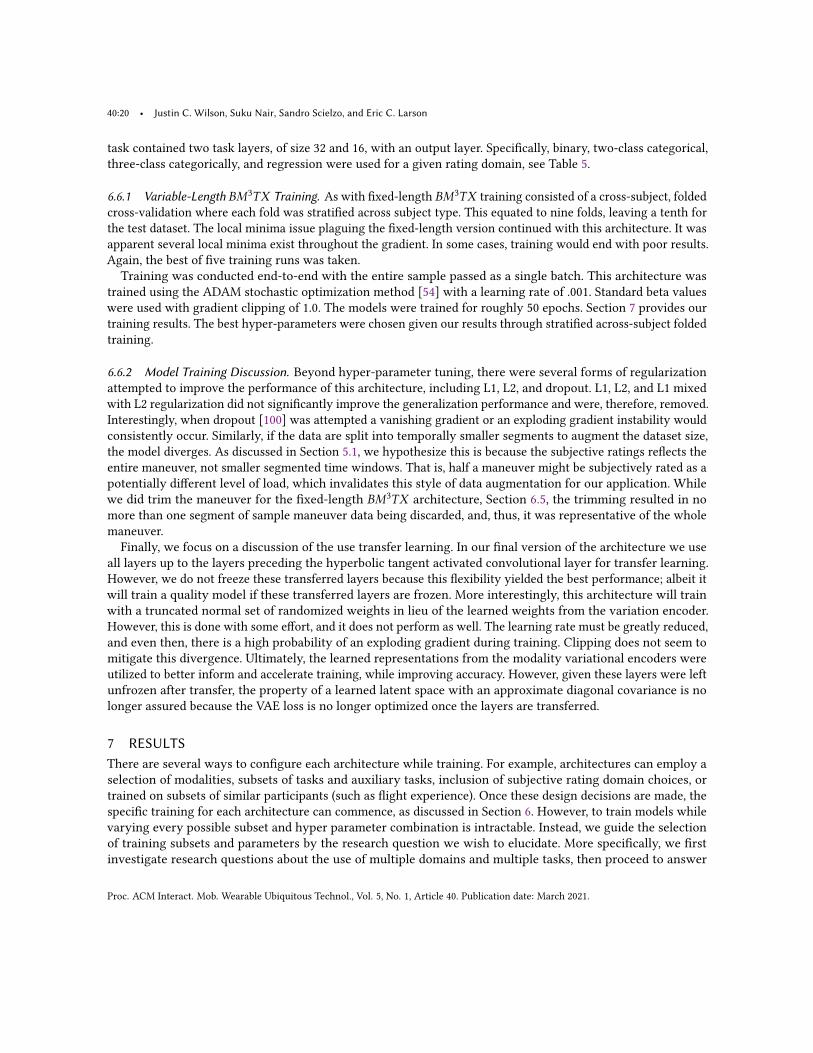
Training was conducted end-to-end with the entire sample passed as a single batch. This architecture wastrained using the ADAM stochastic optimization method [54] with a learning rate of .001. Standard beta valueswere used with gradient clipping of 1.0. The models were trained for roughly 50 epochs. Section 7 provides ourtraining results. The best hyper-parameters were chosen given our results through stratified across-subject foldedtraining.
6.6.2 Model Training Discussion. Beyond hyper-parameter tuning, there were several forms of regularizationattempted to improve the performance of this architecture, including L1, L2, and dropout. L1, L2, and L1 mixedwith L2 regularization did not significantly improve the generalization performance and were, therefore, removed.Interestingly, when dropout [100] was attempted a vanishing gradient or an exploding gradient instability wouldconsistently occur. Similarly, if the data are split into temporally smaller segments to augment the dataset size,the model diverges. As discussed in Section 5.1, we hypothesize this is because the subjective ratings reflects theentire maneuver, not smaller segmented time windows. That is, half a maneuver might be subjectively rated as apotentially different level of load, which invalidates this style of data augmentation for our application. Whilewe did trim the maneuver for the fixed-length 𝐵𝑀3𝑇𝑋 architecture, Section 6.5, the trimming resulted in nomore than one segment of sample maneuver data being discarded, and, thus, it was representative of the wholemaneuver.Finally, we focus on a discussion of the use transfer learning. In our final version of the architecture we use
all layers up to the layers preceding the hyperbolic tangent activated convolutional layer for transfer learning.However, we do not freeze these transferred layers because this flexibility yielded the best performance; albeit itwill train a quality model if these transferred layers are frozen. More interestingly, this architecture will trainwith a truncated normal set of randomized weights in lieu of the learned weights from the variation encoder.However, this is done with some effort, and it does not perform as well. The learning rate must be greatly reduced,and even then, there is a high probability of an exploding gradient during training. Clipping does not seem tomitigate this divergence. Ultimately, the learned representations from the modality variational encoders wereutilized to better inform and accelerate training, while improving accuracy. However, given these layers were leftunfrozen after transfer, the property of a learned latent space with an approximate diagonal covariance is nolonger assured because the VAE loss is no longer optimized once the layers are transferred.
7 RESULTSThere are several ways to configure each architecture while training. For example, architectures can employ aselection of modalities, subsets of tasks and auxiliary tasks, inclusion of subjective rating domain choices, ortrained on subsets of similar participants (such as flight experience). Once these design decisions are made, thespecific training for each architecture can commence, as discussed in Section 6. However, to train models whilevarying every possible subset and hyper parameter combination is intractable. Instead, we guide the selectionof training subsets and parameters by the research question we wish to elucidate. More specifically, we firstinvestigate research questions about the use of multiple domains and multiple tasks, then proceed to answer
Proc. ACM Interact. Mob. Wearable Ubiquitous Technol., Vol. 5, No. 1, Article 40. Publication date: March 2021.
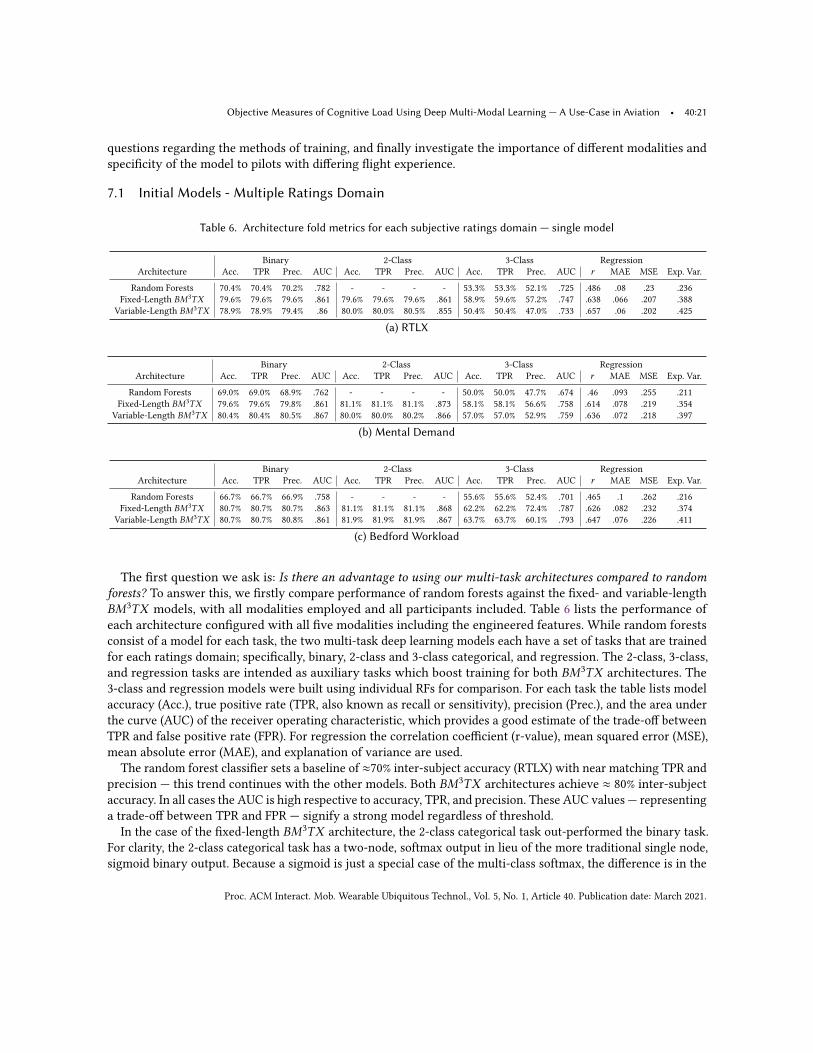
Objective Measures of Cognitive Load Using Deep Multi-Modal Learning — A Use-Case in Aviation • 40:21
questions regarding the methods of training, and finally investigate the importance of different modalities andspecificity of the model to pilots with differing flight experience.
7.1 Initial Models - Multiple Ratings Domain
Table 6. Architecture fold metrics for each subjective ratings domain — single model
Binary 2-Class 3-Class RegressionArchitecture Acc. TPR Prec. AUC Acc. TPR Prec. AUC Acc. TPR Prec. AUC 𝑟 MAE MSE Exp. Var.
Random Forests 70.4% 70.4% 70.2% .782 - - - - 53.3% 53.3% 52.1% .725 .486 .08 .23 .236Fixed-Length 𝐵𝑀3𝑇𝑋 79.6% 79.6% 79.6% .861 79.6% 79.6% 79.6% .861 58.9% 59.6% 57.2% .747 .638 .066 .207 .388
Variable-Length 𝐵𝑀3𝑇𝑋 78.9% 78.9% 79.4% .86 80.0% 80.0% 80.5% .855 50.4% 50.4% 47.0% .733 .657 .06 .202 .425
(a) RTLX
Binary 2-Class 3-Class RegressionArchitecture Acc. TPR Prec. AUC Acc. TPR Prec. AUC Acc. TPR Prec. AUC 𝑟 MAE MSE Exp. Var.
Random Forests 69.0% 69.0% 68.9% .762 - - - - 50.0% 50.0% 47.7% .674 .46 .093 .255 .211Fixed-Length 𝐵𝑀3𝑇𝑋 79.6% 79.6% 79.8% .861 81.1% 81.1% 81.1% .873 58.1% 58.1% 56.6% .758 .614 .078 .219 .354
Variable-Length 𝐵𝑀3𝑇𝑋 80.4% 80.4% 80.5% .867 80.0% 80.0% 80.2% .866 57.0% 57.0% 52.9% .759 .636 .072 .218 .397
(b) Mental Demand
Binary 2-Class 3-Class RegressionArchitecture Acc. TPR Prec. AUC Acc. TPR Prec. AUC Acc. TPR Prec. AUC 𝑟 MAE MSE Exp. Var.
Random Forests 66.7% 66.7% 66.9% .758 - - - - 55.6% 55.6% 52.4% .701 .465 .1 .262 .216Fixed-Length 𝐵𝑀3𝑇𝑋 80.7% 80.7% 80.7% .863 81.1% 81.1% 81.1% .868 62.2% 62.2% 72.4% .787 .626 .082 .232 .374
Variable-Length 𝐵𝑀3𝑇𝑋 80.7% 80.7% 80.8% .861 81.9% 81.9% 81.9% .867 63.7% 63.7% 60.1% .793 .647 .076 .226 .411
(c) Bedford Workload
The first question we ask is: Is there an advantage to using our multi-task architectures compared to randomforests? To answer this, we firstly compare performance of random forests against the fixed- and variable-length𝐵𝑀3𝑇𝑋 models, with all modalities employed and all participants included. Table 6 lists the performance ofeach architecture configured with all five modalities including the engineered features. While random forestsconsist of a model for each task, the two multi-task deep learning models each have a set of tasks that are trainedfor each ratings domain; specifically, binary, 2-class and 3-class categorical, and regression. The 2-class, 3-class,and regression tasks are intended as auxiliary tasks which boost training for both 𝐵𝑀3𝑇𝑋 architectures. The3-class and regression models were built using individual RFs for comparison. For each task the table lists modelaccuracy (Acc.), true positive rate (TPR, also known as recall or sensitivity), precision (Prec.), and the area underthe curve (AUC) of the receiver operating characteristic, which provides a good estimate of the trade-off betweenTPR and false positive rate (FPR). For regression the correlation coefficient (r-value), mean squared error (MSE),mean absolute error (MAE), and explanation of variance are used.
The random forest classifier sets a baseline of ≈70% inter-subject accuracy (RTLX) with near matching TPR andprecision — this trend continues with the other models. Both 𝐵𝑀3𝑇𝑋 architectures achieve ≈ 80% inter-subjectaccuracy. In all cases the AUC is high respective to accuracy, TPR, and precision. These AUC values — representinga trade-off between TPR and FPR — signify a strong model regardless of threshold.
In the case of the fixed-length 𝐵𝑀3𝑇𝑋 architecture, the 2-class categorical task out-performed the binary task.For clarity, the 2-class categorical task has a two-node, softmax output in lieu of the more traditional single node,sigmoid binary output. Because a sigmoid is just a special case of the multi-class softmax, the difference is in the
Proc. ACM Interact. Mob. Wearable Ubiquitous Technol., Vol. 5, No. 1, Article 40. Publication date: March 2021.
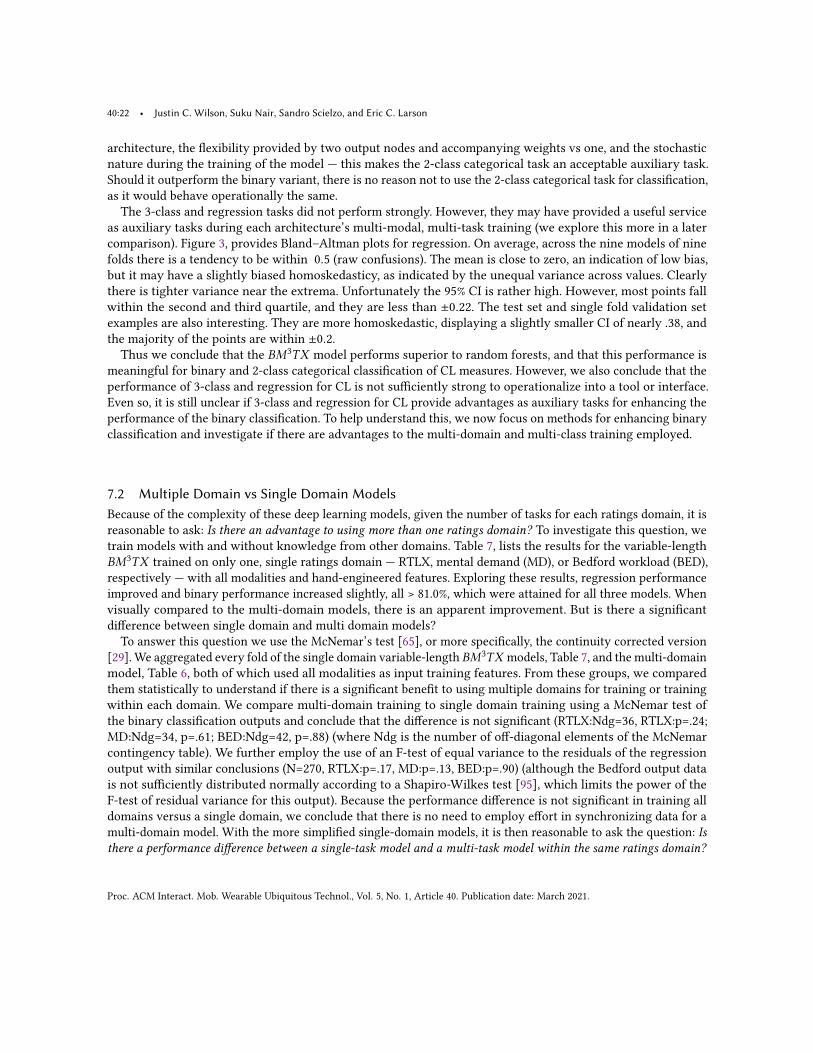
40:22 • Justin C. Wilson, Suku Nair, Sandro Scielzo, and Eric C. Larson
architecture, the flexibility provided by two output nodes and accompanying weights vs one, and the stochasticnature during the training of the model — this makes the 2-class categorical task an acceptable auxiliary task.Should it outperform the binary variant, there is no reason not to use the 2-class categorical task for classification,as it would behave operationally the same.
The 3-class and regression tasks did not perform strongly. However, they may have provided a useful serviceas auxiliary tasks during each architecture’s multi-modal, multi-task training (we explore this more in a latercomparison). Figure 3, provides Bland–Altman plots for regression. On average, across the nine models of ninefolds there is a tendency to be within 0.5 (raw confusions). The mean is close to zero, an indication of low bias,but it may have a slightly biased homoskedasticy, as indicated by the unequal variance across values. Clearlythere is tighter variance near the extrema. Unfortunately the 95% CI is rather high. However, most points fallwithin the second and third quartile, and they are less than ±0.22. The test set and single fold validation setexamples are also interesting. They are more homoskedastic, displaying a slightly smaller CI of nearly .38, andthe majority of the points are within ±0.2.Thus we conclude that the 𝐵𝑀3𝑇𝑋 model performs superior to random forests, and that this performance is
meaningful for binary and 2-class categorical classification of CL measures. However, we also conclude that theperformance of 3-class and regression for CL is not sufficiently strong to operationalize into a tool or interface.Even so, it is still unclear if 3-class and regression for CL provide advantages as auxiliary tasks for enhancing theperformance of the binary classification. To help understand this, we now focus on methods for enhancing binaryclassification and investigate if there are advantages to the multi-domain and multi-class training employed.
7.2 Multiple Domain vs Single Domain ModelsBecause of the complexity of these deep learning models, given the number of tasks for each ratings domain, it isreasonable to ask: Is there an advantage to using more than one ratings domain? To investigate this question, wetrain models with and without knowledge from other domains. Table 7, lists the results for the variable-length𝐵𝑀3𝑇𝑋 trained on only one, single ratings domain — RTLX, mental demand (MD), or Bedford workload (BED),respectively — with all modalities and hand-engineered features. Exploring these results, regression performanceimproved and binary performance increased slightly, all > 81.0%, which were attained for all three models. Whenvisually compared to the multi-domain models, there is an apparent improvement. But is there a significantdifference between single domain and multi domain models?
To answer this question we use the McNemar’s test [65], or more specifically, the continuity corrected version[29]. We aggregated every fold of the single domain variable-length 𝐵𝑀3𝑇𝑋 models, Table 7, and the multi-domainmodel, Table 6, both of which used all modalities as input training features. From these groups, we comparedthem statistically to understand if there is a significant benefit to using multiple domains for training or trainingwithin each domain. We compare multi-domain training to single domain training using a McNemar test ofthe binary classification outputs and conclude that the difference is not significant (RTLX:Ndg=36, RTLX:p=.24;MD:Ndg=34, p=.61; BED:Ndg=42, p=.88) (where Ndg is the number of off-diagonal elements of the McNemarcontingency table). We further employ the use of an F-test of equal variance to the residuals of the regressionoutput with similar conclusions (N=270, RTLX:p=.17, MD:p=.13, BED:p=.90) (although the Bedford output datais not sufficiently distributed normally according to a Shapiro-Wilkes test [95], which limits the power of theF-test of residual variance for this output). Because the performance difference is not significant in training alldomains versus a single domain, we conclude that there is no need to employ effort in synchronizing data for amulti-domain model. With the more simplified single-domain models, it is then reasonable to ask the question: Isthere a performance difference between a single-task model and a multi-task model within the same ratings domain?
Proc. ACM Interact. Mob. Wearable Ubiquitous Technol., Vol. 5, No. 1, Article 40. Publication date: March 2021.
Objective Measures of Cognitive Load Using Deep Multi-Modal Learning — A Use-Case in Aviation • 40:23
(a)
(b) (c)
Fig. 3. Variable-Length 𝐵𝑀3𝑇𝑋 : Bland–Altman plot for regression, including (a) all nine folds, (b) test set, and (c) one fold
Table 7. Architecture fold metrics for variable-length 𝐵𝑀3𝑇𝑋 — a separate model for each subjective ratings domain
Binary 2-Class 3-Class RegressionRatings Domain Acc. TPR Prec. AUC Acc. TPR Prec. AUC Acc. TPR Prec. AUC 𝑟 MAE MSE Exp. Var.
RTLX 81.9% 81.9% 82.6% .864 80.7% 80.7% 81.5% .867 58.5% 58.5% 57.1% .782 .716 .051 .181 .513Mental Demand 81.9% 81.9% 82.0% .88% 82.2% 82.2% 82.3% .883% 59.3% 59.3% 53.7% .765% .707 .059 .196 .499Bedford Workload 81.5% 81.5% 81.5% .859 80.7% 80.7% 80.8% .852 60.4% 60.4% 55.4% .756% .648 .074 .222 .420
7.3 Multi-Task vs Single Task ModelsTo answer the question of the necessity for multiple tasks within a single domain, we trained several models,given the power-set of the five modalities, with either a single binary task or four tasks (binary, 2-class and 3-classcategorical, and regression). That is, excluding the null set, we trained 31 combinations. We further included twomore variants for a total of 33 models per ratings domain and task training type (single- or multi-task). The twovariants were the four modalities of the Empatica E4 and the combination of all modalities, i.e., the addition ofpupillary response. We combined these two versions with their corresponding engineered features that are pairedwith their respective modalities. We call these sets a ratings domain family of models. In all, 192 models were builtand trained, half single-task and half multi-task. By taking the average accuracy across each domain family ofmodels and plotting, there is a clear difference between single-task and multi-task, as depicted in Figure 4. In fact,
Proc. ACM Interact. Mob. Wearable Ubiquitous Technol., Vol. 5, No. 1, Article 40. Publication date: March 2021.
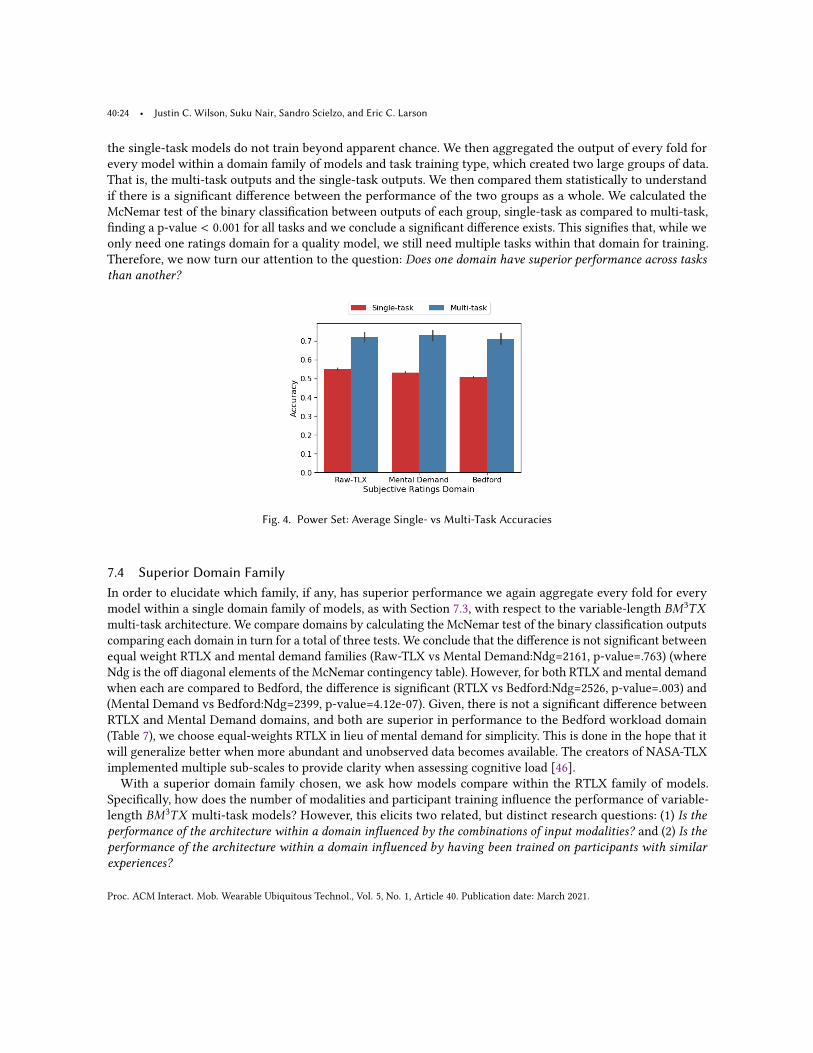
40:24 • Justin C. Wilson, Suku Nair, Sandro Scielzo, and Eric C. Larson
the single-task models do not train beyond apparent chance. We then aggregated the output of every fold forevery model within a domain family of models and task training type, which created two large groups of data.That is, the multi-task outputs and the single-task outputs. We then compared them statistically to understandif there is a significant difference between the performance of the two groups as a whole. We calculated theMcNemar test of the binary classification between outputs of each group, single-task as compared to multi-task,finding a p-value < 0.001 for all tasks and we conclude a significant difference exists. This signifies that, while weonly need one ratings domain for a quality model, we still need multiple tasks within that domain for training.Therefore, we now turn our attention to the question: Does one domain have superior performance across tasksthan another?
Fig. 4. Power Set: Average Single- vs Multi-Task Accuracies
7.4 Superior Domain FamilyIn order to elucidate which family, if any, has superior performance we again aggregate every fold for everymodel within a single domain family of models, as with Section 7.3, with respect to the variable-length 𝐵𝑀3𝑇𝑋
multi-task architecture. We compare domains by calculating the McNemar test of the binary classification outputscomparing each domain in turn for a total of three tests. We conclude that the difference is not significant betweenequal weight RTLX and mental demand families (Raw-TLX vs Mental Demand:Ndg=2161, p-value=.763) (whereNdg is the off diagonal elements of the McNemar contingency table). However, for both RTLX and mental demandwhen each are compared to Bedford, the difference is significant (RTLX vs Bedford:Ndg=2526, p-value=.003) and(Mental Demand vs Bedford:Ndg=2399, p-value=4.12e-07). Given, there is not a significant difference betweenRTLX and Mental Demand domains, and both are superior in performance to the Bedford workload domain(Table 7), we choose equal-weights RTLX in lieu of mental demand for simplicity. This is done in the hope that itwill generalize better when more abundant and unobserved data becomes available. The creators of NASA-TLXimplemented multiple sub-scales to provide clarity when assessing cognitive load [46].With a superior domain family chosen, we ask how models compare within the RTLX family of models.
Specifically, how does the number of modalities and participant training influence the performance of variable-length 𝐵𝑀3𝑇𝑋 multi-task models? However, this elicits two related, but distinct research questions: (1) Is theperformance of the architecture within a domain influenced by the combinations of input modalities? and (2) Is theperformance of the architecture within a domain influenced by having been trained on participants with similarexperiences?
Proc. ACM Interact. Mob. Wearable Ubiquitous Technol., Vol. 5, No. 1, Article 40. Publication date: March 2021.
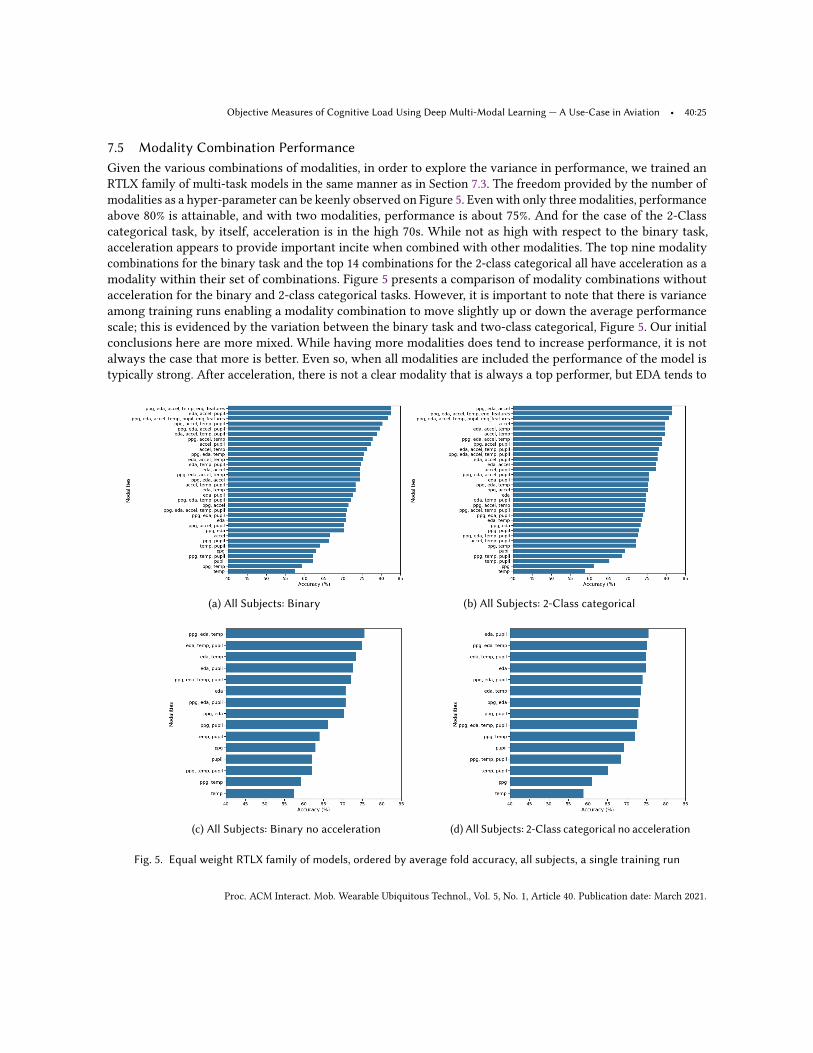
Objective Measures of Cognitive Load Using Deep Multi-Modal Learning — A Use-Case in Aviation • 40:25
7.5 Modality Combination PerformanceGiven the various combinations of modalities, in order to explore the variance in performance, we trained anRTLX family of multi-task models in the same manner as in Section 7.3. The freedom provided by the number ofmodalities as a hyper-parameter can be keenly observed on Figure 5. Even with only three modalities, performanceabove 80% is attainable, and with two modalities, performance is about 75%. And for the case of the 2-Classcategorical task, by itself, acceleration is in the high 70s. While not as high with respect to the binary task,acceleration appears to provide important incite when combined with other modalities. The top nine modalitycombinations for the binary task and the top 14 combinations for the 2-class categorical all have acceleration as amodality within their set of combinations. Figure 5 presents a comparison of modality combinations withoutacceleration for the binary and 2-class categorical tasks. However, it is important to note that there is varianceamong training runs enabling a modality combination to move slightly up or down the average performancescale; this is evidenced by the variation between the binary task and two-class categorical, Figure 5. Our initialconclusions here are more mixed. While having more modalities does tend to increase performance, it is notalways the case that more is better. Even so, when all modalities are included the performance of the model istypically strong. After acceleration, there is not a clear modality that is always a top performer, but EDA tends to
(a) All Subjects: Binary (b) All Subjects: 2-Class categorical
(c) All Subjects: Binary no acceleration (d) All Subjects: 2-Class categorical no acceleration
Fig. 5. Equal weight RTLX family of models, ordered by average fold accuracy, all subjects, a single training run
Proc. ACM Interact. Mob. Wearable Ubiquitous Technol., Vol. 5, No. 1, Article 40. Publication date: March 2021.
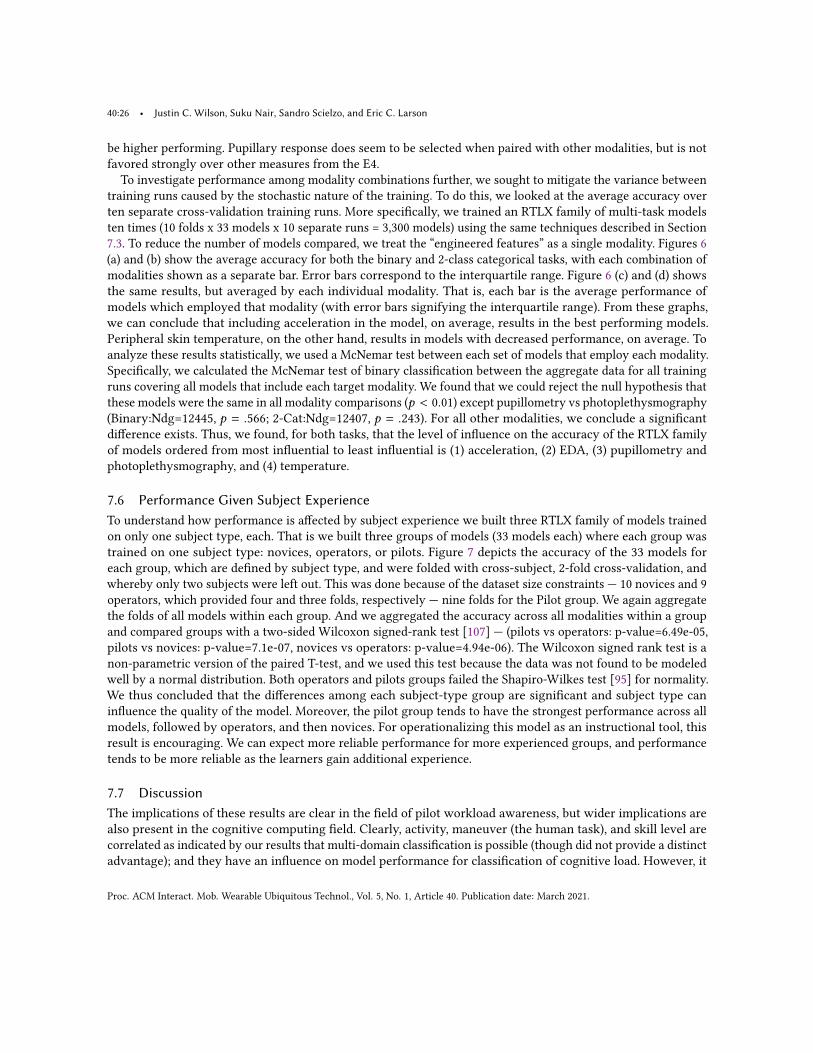
40:26 • Justin C. Wilson, Suku Nair, Sandro Scielzo, and Eric C. Larson
be higher performing. Pupillary response does seem to be selected when paired with other modalities, but is notfavored strongly over other measures from the E4.
To investigate performance among modality combinations further, we sought to mitigate the variance betweentraining runs caused by the stochastic nature of the training. To do this, we looked at the average accuracy overten separate cross-validation training runs. More specifically, we trained an RTLX family of multi-task modelsten times (10 folds x 33 models x 10 separate runs = 3,300 models) using the same techniques described in Section7.3. To reduce the number of models compared, we treat the “engineered features” as a single modality. Figures 6(a) and (b) show the average accuracy for both the binary and 2-class categorical tasks, with each combination ofmodalities shown as a separate bar. Error bars correspond to the interquartile range. Figure 6 (c) and (d) showsthe same results, but averaged by each individual modality. That is, each bar is the average performance ofmodels which employed that modality (with error bars signifying the interquartile range). From these graphs,we can conclude that including acceleration in the model, on average, results in the best performing models.Peripheral skin temperature, on the other hand, results in models with decreased performance, on average. Toanalyze these results statistically, we used a McNemar test between each set of models that employ each modality.Specifically, we calculated the McNemar test of binary classification between the aggregate data for all trainingruns covering all models that include each target modality. We found that we could reject the null hypothesis thatthese models were the same in all modality comparisons (𝑝 < 0.01) except pupillometry vs photoplethysmography(Binary:Ndg=12445, 𝑝 = .566; 2-Cat:Ndg=12407, 𝑝 = .243). For all other modalities, we conclude a significantdifference exists. Thus, we found, for both tasks, that the level of influence on the accuracy of the RTLX familyof models ordered from most influential to least influential is (1) acceleration, (2) EDA, (3) pupillometry andphotoplethysmography, and (4) temperature.
7.6 Performance Given Subject ExperienceTo understand how performance is affected by subject experience we built three RTLX family of models trainedon only one subject type, each. That is we built three groups of models (33 models each) where each group wastrained on one subject type: novices, operators, or pilots. Figure 7 depicts the accuracy of the 33 models foreach group, which are defined by subject type, and were folded with cross-subject, 2-fold cross-validation, andwhereby only two subjects were left out. This was done because of the dataset size constraints — 10 novices and 9operators, which provided four and three folds, respectively — nine folds for the Pilot group. We again aggregatethe folds of all models within each group. And we aggregated the accuracy across all modalities within a groupand compared groups with a two-sided Wilcoxon signed-rank test [107] — (pilots vs operators: p-value=6.49e-05,pilots vs novices: p-value=7.1e-07, novices vs operators: p-value=4.94e-06). The Wilcoxon signed rank test is anon-parametric version of the paired T-test, and we used this test because the data was not found to be modeledwell by a normal distribution. Both operators and pilots groups failed the Shapiro-Wilkes test [95] for normality.We thus concluded that the differences among each subject-type group are significant and subject type caninfluence the quality of the model. Moreover, the pilot group tends to have the strongest performance across allmodels, followed by operators, and then novices. For operationalizing this model as an instructional tool, thisresult is encouraging. We can expect more reliable performance for more experienced groups, and performancetends to be more reliable as the learners gain additional experience.
7.7 DiscussionThe implications of these results are clear in the field of pilot workload awareness, but wider implications arealso present in the cognitive computing field. Clearly, activity, maneuver (the human task), and skill level arecorrelated as indicated by our results that multi-domain classification is possible (though did not provide a distinctadvantage); and they have an influence on model performance for classification of cognitive load. However, it
Proc. ACM Interact. Mob. Wearable Ubiquitous Technol., Vol. 5, No. 1, Article 40. Publication date: March 2021.
Objective Measures of Cognitive Load Using Deep Multi-Modal Learning — A Use-Case in Aviation • 40:27
(a) All Subjects: Binary (b) All Subjects: 2-Class categorical
(c) Binary: Target modality average (d) 2-class categorical: Target modality average
Fig. 6. Equal weight RTLX family of models, ordered by average fold accuracy averaged over 10 training runs, all subjects
is unclear how these three factors are inter-related based on our analyses. Gray [38] may have had the correctapproach with his introduction of pilot inceptor workload. Inceptor workload may support a method of labelalignment, as discussed in Section 5.1. Specifically, it may be possible to use the “aggressiveness vs duty cyclesmethod” to label an observed maneuver without subjective ratings. As such, further investigation into activityand cognitive load is warranted.The implication of modality choice is relatively clear. In our analyses the modality combination was a hyper
parameter with some combinations outperforming others. While the use of many modalities was typically agood performer, it was never consistently better than using a subset of modalities, which has implications for anumber of applications. Many applications can get a “good-enough” classification using only the sensors fromthe E4 wrist-band. We have shown that acceleration and EDA are the top two influencing modalities. With PPGon par with pupillometry. Others may find a more reliable result with the inclusion of pupillary response becauseit adds yet another vantage point with the potential to provide more context. However other considerations needto be further investigated. These include investigation of modality fault tolerance, modality inter-change through
Proc. ACM Interact. Mob. Wearable Ubiquitous Technol., Vol. 5, No. 1, Article 40. Publication date: March 2021.
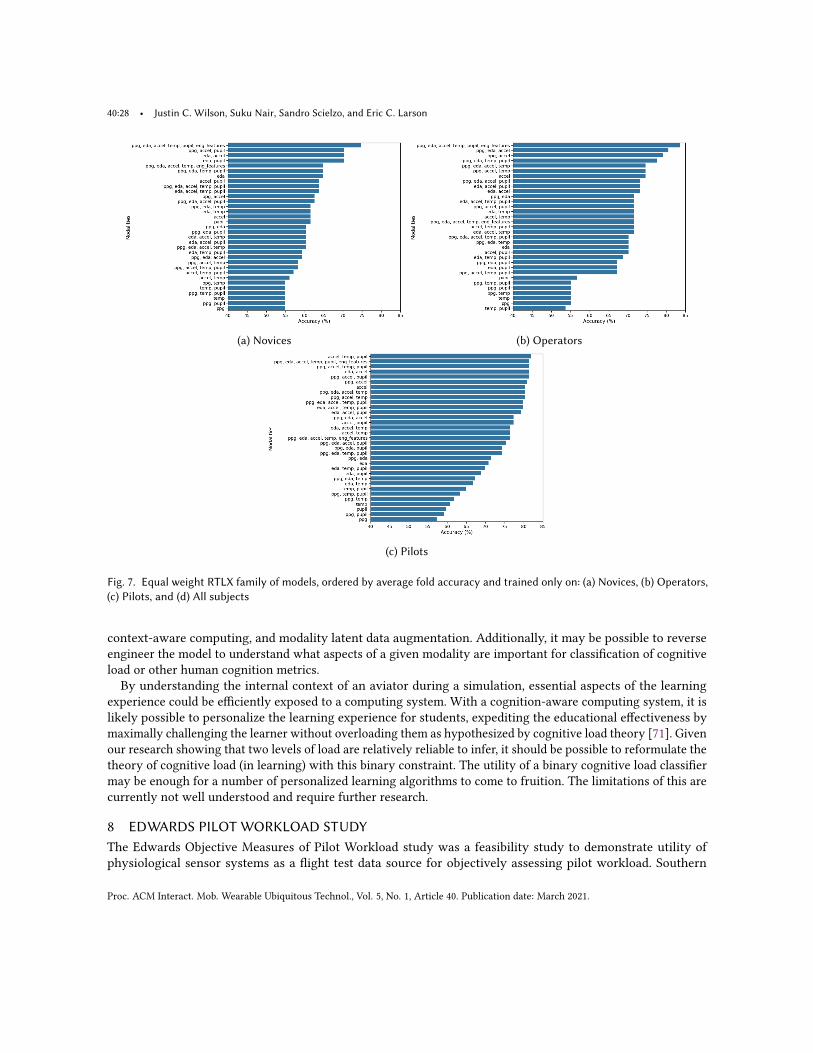
40:28 • Justin C. Wilson, Suku Nair, Sandro Scielzo, and Eric C. Larson
(a) Novices (b) Operators
(c) Pilots
Fig. 7. Equal weight RTLX family of models, ordered by average fold accuracy and trained only on: (a) Novices, (b) Operators,(c) Pilots, and (d) All subjects
context-aware computing, and modality latent data augmentation. Additionally, it may be possible to reverseengineer the model to understand what aspects of a given modality are important for classification of cognitiveload or other human cognition metrics.By understanding the internal context of an aviator during a simulation, essential aspects of the learning
experience could be efficiently exposed to a computing system. With a cognition-aware computing system, it islikely possible to personalize the learning experience for students, expediting the educational effectiveness bymaximally challenging the learner without overloading them as hypothesized by cognitive load theory [71]. Givenour research showing that two levels of load are relatively reliable to infer, it should be possible to reformulate thetheory of cognitive load (in learning) with this binary constraint. The utility of a binary cognitive load classifiermay be enough for a number of personalized learning algorithms to come to fruition. The limitations of this arecurrently not well understood and require further research.
8 EDWARDS PILOT WORKLOAD STUDYThe Edwards Objective Measures of Pilot Workload study was a feasibility study to demonstrate utility ofphysiological sensor systems as a flight test data source for objectively assessing pilot workload. Southern
Proc. ACM Interact. Mob. Wearable Ubiquitous Technol., Vol. 5, No. 1, Article 40. Publication date: March 2021.
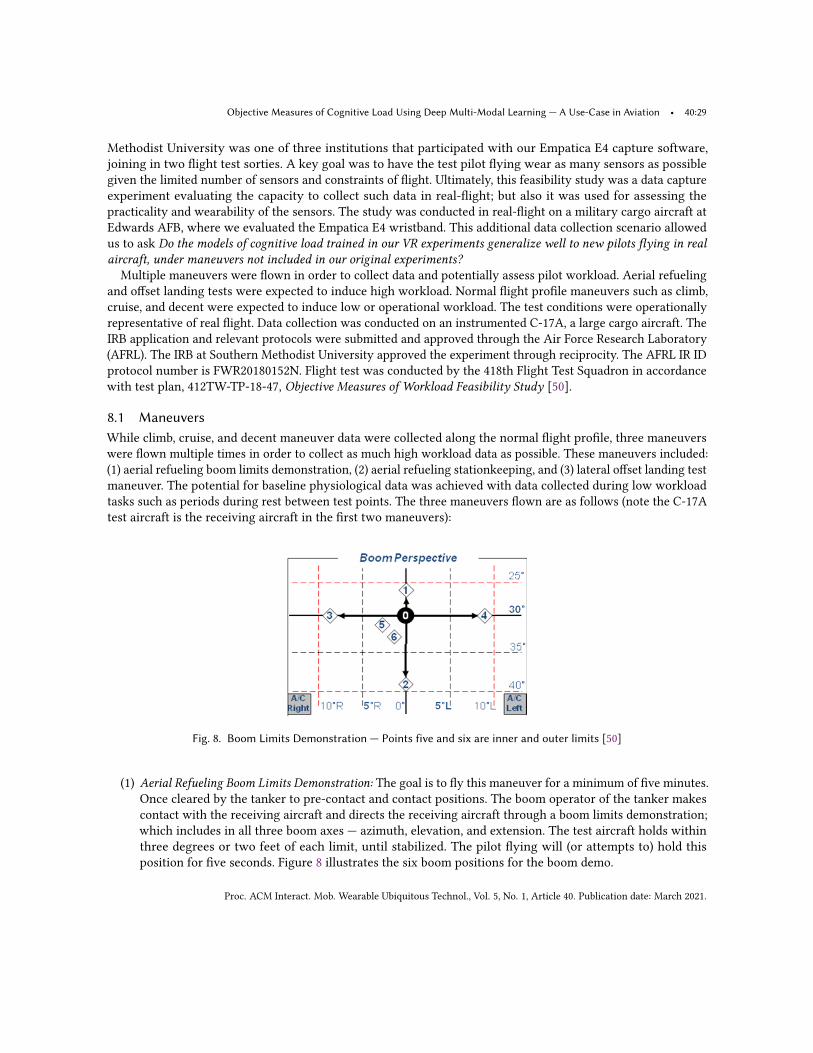
Objective Measures of Cognitive Load Using Deep Multi-Modal Learning — A Use-Case in Aviation • 40:29
Methodist University was one of three institutions that participated with our Empatica E4 capture software,joining in two flight test sorties. A key goal was to have the test pilot flying wear as many sensors as possiblegiven the limited number of sensors and constraints of flight. Ultimately, this feasibility study was a data captureexperiment evaluating the capacity to collect such data in real-flight; but also it was used for assessing thepracticality and wearability of the sensors. The study was conducted in real-flight on a military cargo aircraft atEdwards AFB, where we evaluated the Empatica E4 wristband. This additional data collection scenario allowedus to ask Do the models of cognitive load trained in our VR experiments generalize well to new pilots flying in realaircraft, under maneuvers not included in our original experiments?
Multiple maneuvers were flown in order to collect data and potentially assess pilot workload. Aerial refuelingand offset landing tests were expected to induce high workload. Normal flight profile maneuvers such as climb,cruise, and decent were expected to induce low or operational workload. The test conditions were operationallyrepresentative of real flight. Data collection was conducted on an instrumented C-17A, a large cargo aircraft. TheIRB application and relevant protocols were submitted and approved through the Air Force Research Laboratory(AFRL). The IRB at Southern Methodist University approved the experiment through reciprocity. The AFRL IR IDprotocol number is FWR20180152N. Flight test was conducted by the 418th Flight Test Squadron in accordancewith test plan, 412TW-TP-18-47, Objective Measures of Workload Feasibility Study [50].
8.1 ManeuversWhile climb, cruise, and decent maneuver data were collected along the normal flight profile, three maneuverswere flown multiple times in order to collect as much high workload data as possible. These maneuvers included:(1) aerial refueling boom limits demonstration, (2) aerial refueling stationkeeping, and (3) lateral offset landing testmaneuver. The potential for baseline physiological data was achieved with data collected during low workloadtasks such as periods during rest between test points. The three maneuvers flown are as follows (note the C-17Atest aircraft is the receiving aircraft in the first two maneuvers):
Fig. 8. Boom Limits Demonstration — Points five and six are inner and outer limits [50]
(1) Aerial Refueling Boom Limits Demonstration: The goal is to fly this maneuver for a minimum of five minutes.Once cleared by the tanker to pre-contact and contact positions. The boom operator of the tanker makescontact with the receiving aircraft and directs the receiving aircraft through a boom limits demonstration;which includes in all three boom axes — azimuth, elevation, and extension. The test aircraft holds withinthree degrees or two feet of each limit, until stabilized. The pilot flying will (or attempts to) hold thisposition for five seconds. Figure 8 illustrates the six boom positions for the boom demo.
Proc. ACM Interact. Mob. Wearable Ubiquitous Technol., Vol. 5, No. 1, Article 40. Publication date: March 2021.
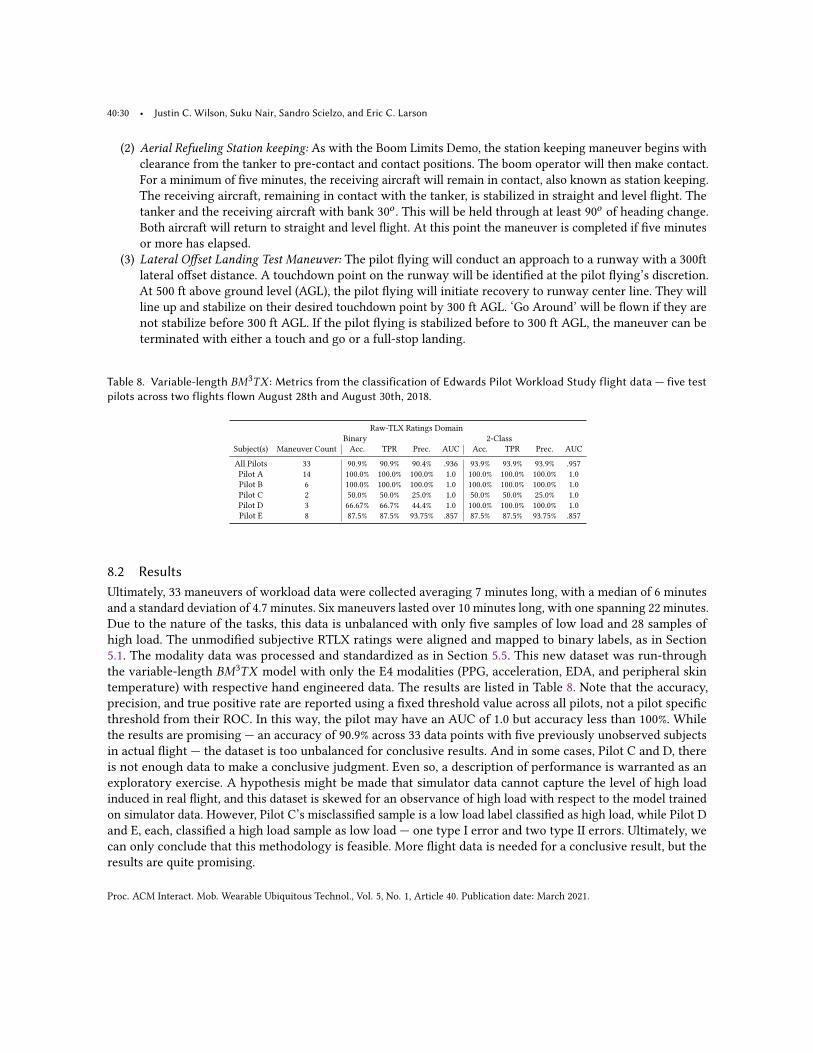
40:30 • Justin C. Wilson, Suku Nair, Sandro Scielzo, and Eric C. Larson
(2) Aerial Refueling Station keeping: As with the Boom Limits Demo, the station keeping maneuver begins withclearance from the tanker to pre-contact and contact positions. The boom operator will then make contact.For a minimum of five minutes, the receiving aircraft will remain in contact, also known as station keeping.The receiving aircraft, remaining in contact with the tanker, is stabilized in straight and level flight. Thetanker and the receiving aircraft with bank 30𝑜 . This will be held through at least 90𝑜 of heading change.Both aircraft will return to straight and level flight. At this point the maneuver is completed if five minutesor more has elapsed.
(3) Lateral Offset Landing Test Maneuver: The pilot flying will conduct an approach to a runway with a 300ftlateral offset distance. A touchdown point on the runway will be identified at the pilot flying’s discretion.At 500 ft above ground level (AGL), the pilot flying will initiate recovery to runway center line. They willline up and stabilize on their desired touchdown point by 300 ft AGL. ‘Go Around’ will be flown if they arenot stabilize before 300 ft AGL. If the pilot flying is stabilized before to 300 ft AGL, the maneuver can beterminated with either a touch and go or a full-stop landing.
Table 8. Variable-length 𝐵𝑀3𝑇𝑋 : Metrics from the classification of Edwards Pilot Workload Study flight data — five testpilots across two flights flown August 28th and August 30th, 2018.
Raw-TLX Ratings DomainBinary 2-Class
Subject(s) Maneuver Count Acc. TPR Prec. AUC Acc. TPR Prec. AUC
All Pilots 33 90.9% 90.9% 90.4% .936 93.9% 93.9% 93.9% .957Pilot A 14 100.0% 100.0% 100.0% 1.0 100.0% 100.0% 100.0% 1.0Pilot B 6 100.0% 100.0% 100.0% 1.0 100.0% 100.0% 100.0% 1.0Pilot C 2 50.0% 50.0% 25.0% 1.0 50.0% 50.0% 25.0% 1.0Pilot D 3 66.67% 66.7% 44.4% 1.0 100.0% 100.0% 100.0% 1.0Pilot E 8 87.5% 87.5% 93.75% .857 87.5% 87.5% 93.75% .857
8.2 ResultsUltimately, 33 maneuvers of workload data were collected averaging 7 minutes long, with a median of 6 minutesand a standard deviation of 4.7 minutes. Six maneuvers lasted over 10 minutes long, with one spanning 22 minutes.Due to the nature of the tasks, this data is unbalanced with only five samples of low load and 28 samples ofhigh load. The unmodified subjective RTLX ratings were aligned and mapped to binary labels, as in Section5.1. The modality data was processed and standardized as in Section 5.5. This new dataset was run-throughthe variable-length 𝐵𝑀3𝑇𝑋 model with only the E4 modalities (PPG, acceleration, EDA, and peripheral skintemperature) with respective hand engineered data. The results are listed in Table 8. Note that the accuracy,precision, and true positive rate are reported using a fixed threshold value across all pilots, not a pilot specificthreshold from their ROC. In this way, the pilot may have an AUC of 1.0 but accuracy less than 100%. Whilethe results are promising — an accuracy of 90.9% across 33 data points with five previously unobserved subjectsin actual flight — the dataset is too unbalanced for conclusive results. And in some cases, Pilot C and D, thereis not enough data to make a conclusive judgment. Even so, a description of performance is warranted as anexploratory exercise. A hypothesis might be made that simulator data cannot capture the level of high loadinduced in real flight, and this dataset is skewed for an observance of high load with respect to the model trainedon simulator data. However, Pilot C’s misclassified sample is a low load label classified as high load, while Pilot Dand E, each, classified a high load sample as low load — one type I error and two type II errors. Ultimately, wecan only conclude that this methodology is feasible. More flight data is needed for a conclusive result, but theresults are quite promising.
Proc. ACM Interact. Mob. Wearable Ubiquitous Technol., Vol. 5, No. 1, Article 40. Publication date: March 2021.
Objective Measures of Cognitive Load Using Deep Multi-Modal Learning — A Use-Case in Aviation • 40:31
9 CONCLUSIONIn this research we use the aviation domain for inducing and evaluating cognitive workload. We evaluatednumerous machine learning models to classify cognitive load across subject and across task.We find that wecan accurately and reliably use multiple physiological/biometric modalities to objectively evaluatetwo levels of cognitive load in a simulated flight environment. To the best of our knowledge, these resultsset a new state-of-the-art in cognitive load inference.The activities of this research involved the collection of physiological measures relevant to aviators as they
underwent simulated flight scenarios for both low and high levels of induced workload. We proposed a newconcept of subjective label alignment as a way of reducing the noise inherent in subjective cognitive load ratings.We further proposed two versions of a new method for cognitive load classification: one with fixed-width input,and the other variable-width input. These architectures took advantage of x-vector like architectures and deepmulti-modal, multi-task, and generative learning, with many time series modalities from physiological sensorsencoded into a latent space. Statistics layers are calculated and passed through to the bottleneck, and finallypassed through to multiple task layers classifying multiple tasks across 40 subjects inclusive of three subjecttypes — pilots, operators, and novices. Our approach was further validated with real-flight data from five testpilots collected over two test and evaluation flights on a C-17 aircraft.The importance of measuring human performance objectively across subjects is hard to overstate, and the
results of this research suggests cognitive load can be objectively classified across subject and activities into atleast two levels with reliable accuracy and in near-real time, > 81.0%. Additional levels of sensitivity shouldand need to be investigated further. Interestingly, the skill level of participants influences the accuracy of themodel, with more reliable results for pilots with increased flight experience. Furthermore, this methodology forclassification of cognitive load may be important in establishing the context of an aviator while in-flight. Thescope of our conclusions is limited to scenarios from our experiments, but the classification of cognitive loadacross maneuvers for additional flight tasks or for other activities in other domains are likely applicable. Weleave the investigation of cognitive load classification in additional flight activities and other disciplines to futurework. By understanding these internal states and granting a machine access to this context we increase theinformational bandwidth and enrich the interaction between the human and the machine. By reliably inferringcontext, numerous ubiquitous computing applications are enabled, especially in learning environments. Thus,our work has broad implications in context-aware computing, where the inclusion of cognitive load inferencemay prove transformative.
ACKNOWLEDGMENTSWe wish the thank Lt Col Paul Calhoun, the 418th Flight Test Squadron, and the Air Force Test Center forthe opportunity to collect physiological data in-flight. Lt Col Paul Calhoun’s insight and advice were crucialthroughout the process. We also wish to thank William R. Gray for his thoughts and guidance on pilot workloadand boundary avoidance tracking. Finally we would like to thank the anonymous reviewers for their thoughtfuland thorough suggestions.
REFERENCES[1] Yomna Abdelrahman, Eduardo Velloso, Tilman Dingler, Albrecht Schmidt, and Frank Vetere. 2017. Cognitive heat: exploring the usage
of thermal imaging to unobtrusively estimate cognitive load. Proceedings of the ACM on Interactive, Mobile, Wearable and UbiquitousTechnologies 1, 3 (2017), 1–20. Publisher: ACM New York, NY, USA.
[2] William Albert and Thomas Tullis. 2013. Measuring the user experience: collecting, analyzing, and presenting usability metrics. Newnes.[3] John R Anderson, Lynne M Reder, and Christian Lebiere. 1996. Working memory: Activation limitations on retrieval. Cognitive
psychology 30, 3 (1996), 221–256. Publisher: Academic Press.
Proc. ACM Interact. Mob. Wearable Ubiquitous Technol., Vol. 5, No. 1, Article 40. Publication date: March 2021.

40:32 • Justin C. Wilson, Suku Nair, Sandro Scielzo, and Eric C. Larson
[4] Tobias Appel, Christian Scharinger, Peter Gerjets, and Enkelejda Kasneci. 2018. Cross-subject workload classification using pupil-relatedmeasures. In Proceedings of the 2018 ACM Symposium on Eye Tracking Research & Applications. 1–8.
[5] Alan D Baddeley and Graham Hitch. 2017. Working memory. In Exploring Working Memory. Routledge, 43–79.[6] Alan D. Baddeley, Robert H. Logie, Akira Miyake, and Priti Shah. 1999. The Multiple-Component Model. In Models of working memory:
Mechanisms of active maintenance and executive control. Cambridge University Press, 28.[7] Pierre Barrouillet, Sophie Bernardin, Sophie Portrat, Evie Vergauwe, and Valérie Camos. 2007. Time and cognitive load in working
memory. Journal of Experimental Psychology: Learning, Memory, and Cognition 33, 3 (2007), 570. Publisher: American PsychologicalAssociation.
[8] Lance O Bauer, Barbara D Strock, Robert Goldstein, John A Stern, and Larry C Walrath. 1985. Auditory discrimination and the eyeblink.Psychophysiology 22, 6 (1985), 636–641. Publisher: Wiley Online Library.
[9] Jackson Beatty. 1982. Task-evoked pupillary responses, processing load, and the structure of processing resources. Psychologicalbulletin 91, 2 (1982), 276. Publisher: American Psychological Association.
[10] Alvah C Bittner Jr, James C Byers, Susan G Hill, Allen L Zaklad, and Richard E Christ. 1989. Generic workload ratings of a mobileair defense system (LOS-FH). In Proceedings of the Human Factors Society Annual Meeting, Vol. 33. SAGE Publications Sage CA: LosAngeles, CA, 1476–1480. Issue: 20.
[11] Jason J Braithwaite, Derrick G Watson, Robert Jones, and Mickey Rowe. 2013. A guide for analysing electrodermal activity (EDA) &skin conductance responses (SCRs) for psychological experiments. Psychophysiology 49, 1 (2013), 1017–1034.
[12] Leo Breiman. 2001. Random forests. Machine learning 45, 1 (2001), 5–32. Publisher: Springer.[13] Stephen Butterworth and others. 1930. On the theory of filter amplifiers. Wireless Engineer 7, 6 (1930), 536–541.[14] John T. Cacioppo, Louis G. Tassinary, and Gary Berntson. 2007. Handbook of Psychophysiology. Cambridge University Press.[15] Paul Calhoun. 2016. DARPA Emerging Technologies. Strategic Studies Quarterly (2016), 91–113.[16] Robbie Case, D Midian Kurland, and Jill Goldberg. 1982. Operational efficiency and the growth of short-term memory span. Journal of
experimental child psychology 33, 3 (1982), 386–404. Publisher: Elsevier.[17] Siyuan Chen, Julien Epps, and Fang Chen. 2011. A comparison of four methods for cognitive load measurement. In Proceedings of
the 23rd Australian Computer-Human Interaction Conference (OzCHI ’11). Association for Computing Machinery, Canberra, Australia,76–79. https://doi.org/10.1145/2071536.2071547
[18] Michelene TH Chi, Robert Glaser, and Ernest Rees. 1981. Expertise in problem solving. Technical Report. PITTSBURGH UNIV PALEARNING RESEARCH AND DEVELOPMENT CENTER.
[19] Adam Chuderski. 2014. The relational integration task explains fluid reasoning above and beyond other working memory tasks.Memory & Cognition 42, 3 (2014), 448–463. Publisher: Springer.
[20] Roberto Colom, Francisco J Abad, M. Ángeles Quiroga, Pei Chun Shih, and Carmen Flores-Mendoza. 2008. Working memory andintelligence are highly related constructs, but why? Intelligence 36, 6 (2008), 584–606. Publisher: Elsevier.
[21] Andrew RA Conway and Randall W Engle. 1994. Working memory and retrieval: A resource-dependent inhibition model. Journal ofExperimental Psychology: General 123, 4 (1994), 354. Publisher: American Psychological Association.
[22] George E Cooper and Robert P Harper Jr. 1969. The use of pilot rating in the evaluation of aircraft handling qualities. Technical Report.Advisory group for aerospace research and development Neuilly-Sur-Seine (France).
[23] Richard VL Cooper and Gary R Nelson. 1976. Analytic Methods for Adjusting Subjective Rating Schemes. Technical Report. RAND CORPSANTA MONICA CA.
[24] Meredyth Daneman and Patricia A Carpenter. 1980. Individual differences in working memory and reading. Journal of Memory andLanguage 19, 4 (1980), 450. Publisher: Academic Press.
[25] B William Demeré, Karen L Sedatole, and Alexander Woods. 2019. The role of calibration committees in subjective performanceevaluation systems. Management Science 65, 4 (2019), 1562–1585.
[26] Anind K. Dey and Gregory D. Abowd. 1999. Towards a Better Understanding of Context and Context-Awareness. In Proceedingsof the 1st International Symposium on Handheld and Ubiquitous Computing (HUC ’99). Springer-Verlag, London, UK, UK, 304–307.http://dl.acm.org/citation.cfm?id=647985.743843 event-place: Karlsruhe, Germany.
[27] Adele Diamond. 2013. Executive functions. Annual review of psychology 64 (2013), 135–168. https://doi.org/10.1146/annurev-psych-113011-143750 Publisher: Annual Reviews.
[28] Michael C Dorneich, Stephen D Whitlow, Santosh Mathan, Patricia May Ververs, Deniz Erdogmus, Andre Adami, Misha Pavel, andTian Lan. 2007. Supporting real-time cognitive state classification on a mobile individual. Journal of Cognitive Engineering and DecisionMaking 1, 3 (2007), 240–270. Publisher: SAGE Publications Sage CA: Los Angeles, CA.
[29] Allen L Edwards. 1948. Note on the “correction for continuity” in testing the significance of the difference between correlatedproportions. Psychometrika 13, 3 (1948), 185–187. Publisher: Springer.
[30] Kyle Kent Edward Ellis. 2009. Eye tracking metrics for workload estimation in flight deck operations. Theses and Dissertations (2009),288.
Proc. ACM Interact. Mob. Wearable Ubiquitous Technol., Vol. 5, No. 1, Article 40. Publication date: March 2021.

Objective Measures of Cognitive Load Using Deep Multi-Modal Learning — A Use-Case in Aviation • 40:33
[31] J Engler, T Schnell, and M Walwanis. 2013. Deterministically nonlinear dynamical classification of cognitive workload. In Interser-vice/Industry Training, Simulation, and Education Conference, Orlando, FL.
[32] Michael Falk. 1999. A simple approach to the generation of uniformly distributed random variables with prescribed correlations.Communications in Statistics-Simulation and Computation 28, 3 (1999), 785–791.
[33] Joaquin Fuster. 2015. Overview of Prefrontal Functions: E Pluribus Unum – Coordinating New Sequences of Purposeful Action. In Theprefrontal cortex. Academic Press, 394.
[34] A Gimino. 2002. Students’ investment of mental effort. In annual meeting of the american educational research association, New Orleans,LA.
[35] Robert Goldstein, Larry C Walrath, John A Stern, and Barbara D Strock. 1985. Blink activity in a discrimination task as a function ofstimulus modality and schedule of presentation. Psychophysiology 22, 6 (1985), 629–635. Publisher: Wiley Online Library.
[36] Ian Goodfellow, Yoshua Bengio, and Aaron Courville. 2016. Convolutional Networks. In Deep Learning. The MIT Press, 321–361.[37] William Gray. 2004. Boundary-escape tracking: a new conception of hazardous PIO. Technical Report. AIR FORCE FLIGHT TEST
CENTER EDWARDS AFB CA.[38] WR Gray. 2007. A boundary avoidance tracking flight test technique for performance and workload assessment. In Proceedings of the
38th Symposium of Society of Experimental Test Pilots, San Diego.[39] William Gray. 2008. A generalized handling qualities flight test technique utilizing boundary avoidance tracking. In 2008 US Air Force
T&E Days. 1648.[40] Fredrik Gustafsson. 1996. Determining the initial states in forward-backward filtering. IEEE Transactions on signal processing 44, 4
(1996), 988–992. Publisher: IEEE.[41] Eija Haapalainen, SeungJun Kim, Jodi F. Forlizzi, and Anind K. Dey. 2010. Psycho-physiological measures for assessing cognitive
load. In Proceedings of the 12th ACM international conference on Ubiquitous computing. ACM, Copenhagen Denmark, 301–310. https://doi.org/10.1145/1864349.1864395
[42] Peter A Hancock, Najmedin Meshkati, and MM Robertson. 1985. Physiological reflections of mental workload. Aviation, space, andenvironmental medicine (1985). Publisher: Aerospace Medical Assn.
[43] Thais Hanson. 2018. L3 Introduces First-Ever High-Fidelity, Mixed Reality Deployable Training Simulator. https://www.l3t.com/link/press/l3-introduces-first-ever-high-fidelity-mixed-reality-deployable-training-simulator
[44] Joshua Harrison, Kurtuluş İzzetoğlu, Hasan Ayaz, Ben Willems, Sehchang Hah, Ulf Ahlstrom, Hyun Woo, Patricia A Shewokis, Scott CBunce, and Banu Onaral. 2014. Cognitive workload and learning assessment during the implementation of a next-generation air trafficcontrol technology using functional near-infrared spectroscopy. IEEE Transactions on Human-Machine Systems 44, 4 (2014), 429–440.Publisher: IEEE.
[45] Sandra G Hart. 2006. NASA-task load index (NASA-TLX); 20 years later. In Proceedings of the human factors and ergonomics societyannual meeting, Vol. 50. Sage Publications Sage CA: Los Angeles, CA, 904–908. Issue: 9.
[46] Sandra G. Hart and Lowell E. Staveland. 1988. Development of NASA-TLX (Task Load Index): Results of Empirical and TheoreticalResearch. In Advances in Psychology, Peter A. Hancock and Najmedin Meshkati (Eds.). Human Mental Workload, Vol. 52. North-Holland,139–183. https://doi.org/10.1016/S0166-4115(08)62386-9
[47] Keith C Hendy, Kevin M Hamilton, and Lois N Landry. 1993. Measuring subjective workload: when is one scale better than many?Human Factors 35, 4 (1993), 579–601. Publisher: SAGE Publications Sage CA: Los Angeles, CA.
[48] Kerttu Huttunen, Heikki Keränen, Eero Väyrynen, Rauno Pääkkönen, and Tuomo Leino. 2011. Effect of cognitive load on speechprosody in aviation: Evidence from military simulator flights. Applied ergonomics 42, 2 (2011), 348–357. Publisher: Elsevier.
[49] Shamsi T Iqbal, Xianjun Sam Zheng, and Brian P Bailey. 2004. Task-evoked pupillary response to mental workload in human-computerinteraction. In CHI’04 extended abstracts on Human factors in computing systems. 1477–1480.
[50] John P. Wilder, Patrick S. Martin, and Eric Santroch. 2018. Objective Measures of Workload Feasibility Study, 412TW-TP-18-47, USAF,Air Force Test Center, Edwards AFB, California.
[51] Jonathan Baxter, Rich Caruana, Tom Mitchell, Lorien Y. Pratt, Daniel L. Silver, and Sebastian Thurn. 1995. Post-NIPS*95 Workshop onTransfer in Inductive Systems. http://socrates.acadiau.ca/courses/comp/dsilver/NIPS95_LTL/\transfer.workshop.1995.html
[52] Marcel A Just and Patricia A Carpenter. 1992. A capacity theory of comprehension: individual differences in working memory.Psychological review 99, 1 (1992), 122. Publisher: American Psychological Association.
[53] Daniel Kahneman, Bernard Tursky, David Shapiro, and Andrew Crider. 1969. Pupillary, heart rate, and skin resistance changes duringa mental task. Journal of experimental psychology 79, 1p1 (1969), 164. Publisher: American Psychological Association.
[54] Diederik P. Kingma and Jimmy Ba. 2017. Adam: A Method for Stochastic Optimization. arXiv:1412.6980 [cs] (Jan. 2017). http://arxiv.org/abs/1412.6980 arXiv: 1412.6980 version: 8.
[55] Diederik P. Kingma and Max Welling. 2013. Auto-Encoding Variational Bayes. (Dec. 2013). https://arxiv.org/abs/1312.6114v10[56] Jeffrey Michael Klingner. 2010. Measuring cognitive load during visual tasks by combining pupillometry and eye tracking. PhD Thesis.
Stanford University Palo Alto, CA.
Proc. ACM Interact. Mob. Wearable Ubiquitous Technol., Vol. 5, No. 1, Article 40. Publication date: March 2021.

40:34 • Justin C. Wilson, Suku Nair, Sandro Scielzo, and Eric C. Larson
[57] Thomas Kosch, Mariam Hassib, Daniel Buschek, and Albrecht Schmidt. 2018. Look into my eyes: using pupil dilation to estimatemental workload for task complexity adaptation. In Extended Abstracts of the 2018 CHI Conference on Human Factors in ComputingSystems. 1–6.
[58] Patrick C Kyllonen and Raymond E Christal. 1990. Reasoning ability is (little more than) working-memory capacity?! Intelligence 14, 4(1990), 389–433. Publisher: Elsevier.
[59] Dana Lahat, Tülay Adali, and Christian Jutten. 2015. Multimodal data fusion: an overview of methods, challenges, and prospects. Proc.IEEE 103, 9 (2015), 1449–1477. Publisher: IEEE.
[60] Feng Li, Jiang Li, Frederic McKenzie, Guangfan Zhang, Wei Wang, Aaron Pepe, Roger Xu, Thomas Schnell, Nick Anderson, and DeanHeitkamp. 2012. Engagement Assessment Using EEG Signals. (2012).
[61] Ernest Lindholm and Cary M Cheatham. 1983. Autonomic activity and workload during learning of a simulated aircraft carrier landingtask. Aviation, space, and environmental medicine (1983). Publisher: Aerospace Medical Assn.
[62] A Lindqvist, Esko Keskinen, K Antila, L Halkola, T Peltonen, and I Välimäki. 1983. Heart rate variability, cardiac mechanics, andsubjectively evaluated stress during simulator flight. Aviation, space, and environmental medicine (1983). Publisher: Aerospace MedicalAssn.
[63] Yili Liu and Christopher D Wickens. 1994. Mental workload and cognitive task automaticity: an evaluation of subjective and timeestimation metrics. Ergonomics 37, 11 (1994), 1843–1854. Publisher: Taylor & Francis.
[64] Patrick Martin, Paul Calhoun, Tom Schnell, and Colton Thompson. 2019. Objective Measures of Pilot Workload. 63RD SETP SYMPOSIUMPROCEEDINGS (Sept. 2019). https://secure.whoglue.net/setp_admin/papers/SETP%20Pilot%20Workload%20Study%20PA%20Released.pdf
[65] Quinn McNemar. 1947. Note on the sampling error of the difference between correlated proportions or percentages. Psychometrika 12,2 (1947), 153–157. Publisher: Springer.
[66] George A Miller. 1956. The magical number seven, plus or minus two: Some limits on our capacity for processing information.Psychological review 63, 2 (1956), 81. Publisher: American Psychological Association.
[67] NASA Aviation Safety Program. 2006. NASA - Portal Information Site. https://www.hq.nasa.gov/office/aero/avsafe/iifd/ LibraryCatalog: www.hq.nasa.gov Publisher: Brian Dunbar.
[68] Klaus Oberauer, H-M Süß, Ralf Schulze, Oliver Wilhelm, and Werner W Wittmann. 2000. Working memory capacity-facets of acognitive ability construct. Personality and individual differences 29, 6 (2000), 1017–1045. Publisher: Elsevier.
[69] Klaus Oberauer, Heinz-Martin Süß, Oliver Wilhelm, and Werner W Wittman. 2003. The multiple faces of working memory: Storage,processing, supervision, and coordination. Intelligence 31, 2 (2003), 167–193. Publisher: Elsevier.
[70] CHJM Opmeer. 1973. The information content of successive RR-interval times in the ECG. Preliminary results using factor analysisand frequency analysis. Ergonomics 16, 1 (1973), 105–112. Publisher: Taylor & Francis.
[71] Fred Paas, Juhani E Tuovinen, Huib Tabbers, and Pascal WM Van Gerven. 2003. Cognitive load measurement as a means to advancecognitive load theory. Educational psychologist 38, 1 (2003), 63–71. Publisher: Taylor & Francis.
[72] Fred G Paas. 1992. Training strategies for attaining transfer of problem-solving skill in statistics: A cognitive-load approach. Journal ofeducational psychology 84, 4 (1992), 429. Publisher: American Psychological Association.
[73] Fred GWC Paas and Jeroen JG Van Merriënboer. 1994. Variability of worked examples and transfer of geometrical problem-solvingskills: A cognitive-load approach. Journal of educational psychology 86, 1 (1994), 122. Publisher: American Psychological Association.
[74] Fred G. W. C. Paas and Jeroen J. G. Van Merriënboer. 1994. Instructional control of cognitive load in the training of complex cognitivetasks. Educational Psychology Review 6, 4 (Dec. 1994), 351–371. https://doi.org/10.1007/BF02213420
[75] Sinno Jialin Pan and Qiang Yang. 2010. A Survey on Transfer Learning. IEEE Transactions on Knowledge and Data Engineering 22, 10(Oct. 2010), 1345–1359. https://doi.org/10.1109/TKDE.2009.191
[76] Ken Pfeuffer, Jason Alexander, and Hans Gellersen. 2016. Partially-indirect bimanual input with gaze, pen, and touch for pan, zoom,and ink interaction. In Proceedings of the 2016 CHI Conference on Human Factors in Computing Systems. 2845–2856.
[77] Jan L Plass, Roxana Moreno, and Roland Brünken. 2010. Cognitive load theory. Cambridge university press.[78] Sohail Rafiqi. 2015. Pupilware: Towards cognitive and context-aware framework. PhD Thesis. Southern Methodist University.[79] Dhanesh Ramachandram and Graham W. Taylor. 2017. Deep Multimodal Learning: A Survey on Recent Advances and Trends. IEEE
Signal Processing Magazine 34 (2017), 96–108. https://doi.org/10.1109/MSP.2017.2738401[80] Yvonne Rogers. 2006. Moving on from weiser’s vision of calm computing: Engaging ubicomp experiences. In International conference
on Ubiquitous computing. Springer, 404–421.[81] AH Roscoe. 1975. Heart rate monitoring of pilots during steep-gradient approaches. Aviation, space, and environmental medicine 46, 11
(1975), 1410–1413.[82] AH Roscoe. 1976. Use of pilot heart rate measurement in flight evaluation. Aviation, space, and environmental medicine 47, 1 (1976),
86–90.[83] A. H. Roscoe and G. A. Ellis. 1990. A Subjective Rating Scale for Assessing Pilot Workload in Flight: A decade of Practical Use. Technical
Report RAE-TR-90019. ROYAL AEROSPACE ESTABLISHMENT FARNBOROUGH (UNITED KINGDOM). https://apps.dtic.mil/docs/
Proc. ACM Interact. Mob. Wearable Ubiquitous Technol., Vol. 5, No. 1, Article 40. Publication date: March 2021.

Objective Measures of Cognitive Load Using Deep Multi-Modal Learning — A Use-Case in Aviation • 40:35
citations/ADA227864[84] William B Rouse. 1988. Adaptive aiding for human/computer control. Human factors 30, 4 (1988), 431–443. Publisher: SAGE Publications
Sage CA: Los Angeles, CA.[85] Sebastian Ruder. 2017. An Overview of Multi-Task Learning in Deep Neural Networks. arXiv:1706.05098 [cs, stat] (June 2017).
http://arxiv.org/abs/1706.05098 arXiv: 1706.05098.[86] Ron JCM Salden, Fred Paas, Nick J Broers, and Jeroen JG Van Merrienboer. 2004. Mental effort and performance as determinants for
the dynamic selection of learning tasks in air traffic control training. Instructional science 32, 1-2 (2004), 153–172. Publisher: Springer.[87] Timothy A Salthouse. 1991. Mediation of adult age differences in cognition by reductions in working memory and speed of processing.
Psychological Science 2, 3 (1991), 179–183. Publisher: SAGE Publications Sage CA: Los Angeles, CA.[88] Abraham Savitzky and Marcel JE Golay. 1964. Smoothing and differentiation of data by simplified least squares procedures. Analytical
chemistry 36, 8 (1964), 1627–1639.[89] DD Schmorrow and Amy A Kruse. 2002. DARPA’s Augmented Cognition Program-tomorrow’s human computer interaction from
vision to reality: building cognitively aware computational systems. In Proceedings of the IEEE 7th Conference on Human Factors andPower Plants. IEEE, 7–7.
[90] Tom Schnell, Rich Cornwall, Melissa Walwanis, and Jeff Grubb. 2009. The quality of training effectiveness assessment (QTEA) toolapplied to the naval aviation training context. In International Conference on Foundations of Augmented Cognition. Springer, 640–649.
[91] Tom Schnell, Mike Keller, and Pieter Poolman. 2008. Neurophysiological workload assessment in flight. In 2008 IEEE/AIAA 27th DigitalAvionics Systems Conference. 4.B.2–1–4.B.2–14. https://doi.org/10.1109/DASC.2008.4702827 ISSN: 2155-7209.
[92] Tom Schnell, Todd Macuda, Pieter Poolman, and Mike Keller. 2006. Workload assessment in flight using dense array eeg. In 2006ieee/aiaa 25TH Digital Avionics Systems Conference. IEEE, 1–11.
[93] Thomas Schnell, James E Melzer, and Steve J Robbins. 2009. The cognitive pilot helmet: enabling pilot-aware smart avionics. InHead-and Helmet-Mounted Displays XIV: Design and Applications, Vol. 7326. International Society for Optics and Photonics, 73260A.
[94] Fred Shaffer and JP Ginsberg. 2017. An overview of heart rate variability metrics and norms. Frontiers in public health 5 (2017), 258.Publisher: Frontiers.
[95] Samuel Sanford Shapiro and Martin B Wilk. 1965. An analysis of variance test for normality (complete samples). Biometrika 52, 3/4(1965), 591–611. Publisher: JSTOR.
[96] June J Skelly, B Purvis, and GWilson. 1988. Fighter pilot performance during airborne and simulator missions: physiological comparisons.Electric and Magnetic Activity of the Central Nervous System: Research and Clinical Applications in Aerospace 23 (1988), 2.
[97] HP Smith. 1967. Heart rate of pilots flying aircraft on scheduled airline routes. Aerospace medicine 38, 11 (1967), 1117.[98] David Snyder, Daniel Garcia-Romero, Daniel Povey, and Sanjeev Khudanpur. 2017. Deep Neural Network Embeddings for Text-
Independent Speaker Verification.. In Interspeech. 999–1003.[99] David Snyder, Daniel Garcia-Romero, Gregory Sell, Daniel Povey, and Sanjeev Khudanpur. 2018. X-vectors: Robust dnn embeddings
for speaker recognition. In 2018 IEEE International Conference on Acoustics, Speech and Signal Processing (ICASSP). IEEE, 5329–5333.[100] Nitish Srivastava, Geofirey Hinton, Alex Krizhevsky, Ilya Sutskever, and Ruslan Salakhutdinov. 2014. Dropout: A Simple Way to
Prevent Neural Networks from Overfitting. The journal of machine learning research 15, 1 (June 2014), 1929–1958.[101] John Stemberger, Robert S Allison, and Thomas Schnell. 2010. Thermal imaging as a way to classify cognitive workload. In 2010
Canadian Conference on Computer and Robot Vision. IEEE, 231–238.[102] John A Stern, Larry C Walrath, and Robert Goldstein. 1984. The endogenous eyeblink. Psychophysiology 21, 1 (1984), 22–33. Publisher:
Wiley Online Library.[103] John Sweller, Jeroen JG Van Merrienboer, and Fred GWC Paas. 1998. Cognitive architecture and instructional design. Educational
psychology review 10, 3 (1998), 251–296. Publisher: Springer.[104] Nash Unsworth and Randall W Engle. 2007. On the division of short-term and working memory: an examination of simple and
complex span and their relation to higher order abilities. Psychological bulletin 133, 6 (2007), 1038. Publisher: American PsychologicalAssociation.
[105] Holger Ursin and Reidun Ursin. 1979. Physiological indicators of mental workload. In Mental workload. Springer, 349–365.[106] ChatchaiWangwiwattana, Xinyi Ding, and Eric C. Larson. 2018. PupilNet, Measuring Task Evoked Pupillary Response Using Commodity
RGB Tablet Cameras: Comparison to Mobile, Infrared Gaze Trackers for Inferring Cognitive Load. Proc. ACM Interact. Mob. WearableUbiquitous Technol. 1, 4 (Jan. 2018), 171:1–171:26. https://doi.org/10.1145/3161164
[107] Frank Wilcoxon. 1992. Individual comparisons by ranking methods. In Breakthroughs in statistics. Springer, 196–202.[108] Glenn F Wilson and Robert D O’Donnell. 1988. Measurement of operator workload with the neuropsychological workload test battery.
In Advances in Psychology. Vol. 52. Elsevier, 63–100.[109] Zhaohua Wu, Norden E Huang, Steven R Long, and Chung-Kang Peng. 2007. On the trend, detrending, and variability of nonlinear and
nonstationary time series. Proceedings of the National Academy of Sciences 104, 38 (2007), 14889–14894. Publisher: National AcadSciences.
Proc. ACM Interact. Mob. Wearable Ubiquitous Technol., Vol. 5, No. 1, Article 40. Publication date: March 2021.