Embed Size (px)
Citation preview
Objective Evaluation of Aviation Related Variables during 2010
Hazardous Weather Testbed (HWT) Spring Experiment
Tara Jensen1*, Steve Weiss2, Jason J. Levit3, Michelle Harrold1, Lisa Coco1, Patrick Marsh4, Adam Clark4, Fanyou Kong5, Kevin Thomas5, Ming Xue5, Jack
Kain4, Russell Schneider2, Mike Coniglio4 , and Barbara Brown1
1 NCAR/Research Applications Laboratory (RAL), Boulder, Colorado2 NOAA/Storm Prediction Center (SPC), Norman, Oklahoma3 NOAA/Aviation Weather Center (AWC), Kansas City, Missouri 4 NOAA/National Severe Storms Laboratory (NSSL), Norman, Oklahoma5 Center for Analysis and Prediction of Storms (CAPS), University of Oklahoma, Norman, Oklahoma
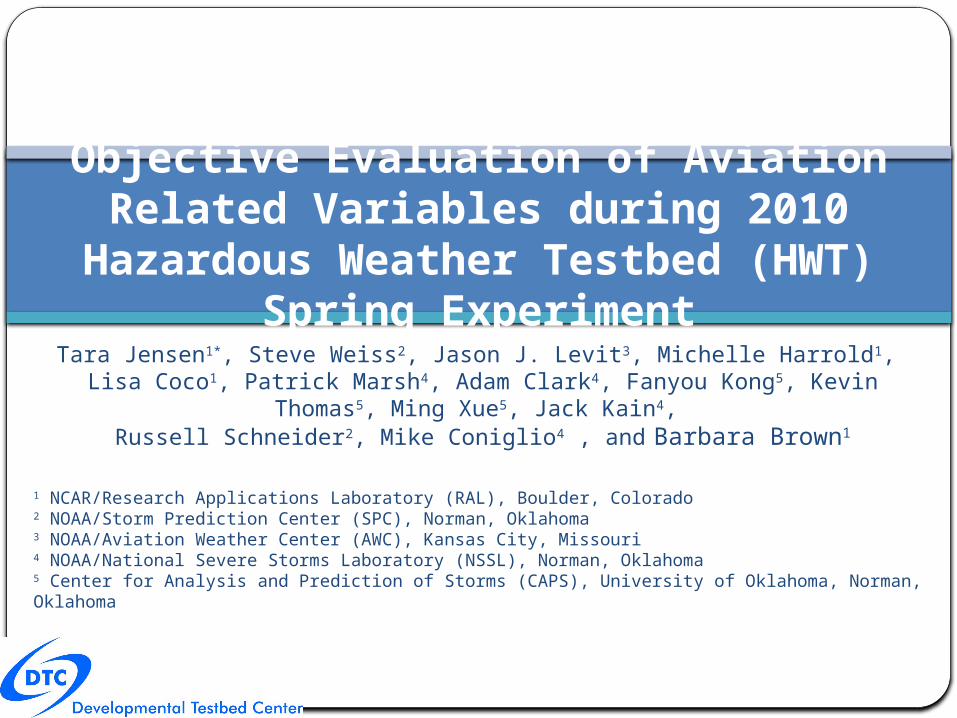
NOAATestbeds
Funded by:NOAA, USWRP, AFWA, NCAR
Bridge between ResearchAnd OperationsCommunity Code SupportTesting and EvaluationVerification Research
NOAA/ESRL/GSD
NCAR/RAL/JNT
Distributed Facilitywith 23 staff membersat either NOAA/ESRLand NCAR/RALand 2 staff at NOAA/NCEP
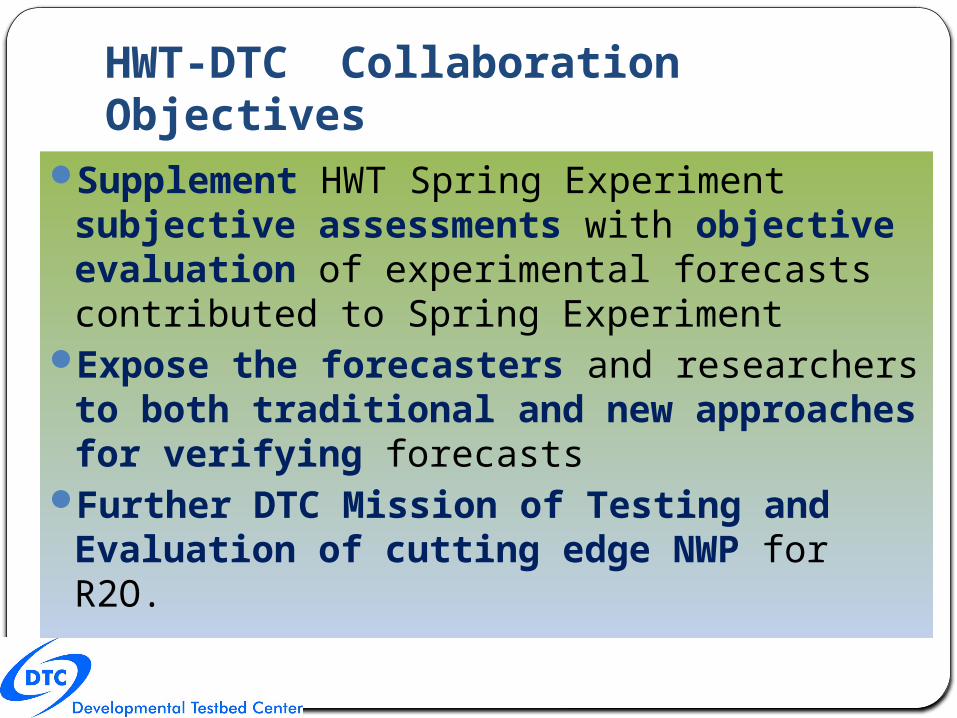
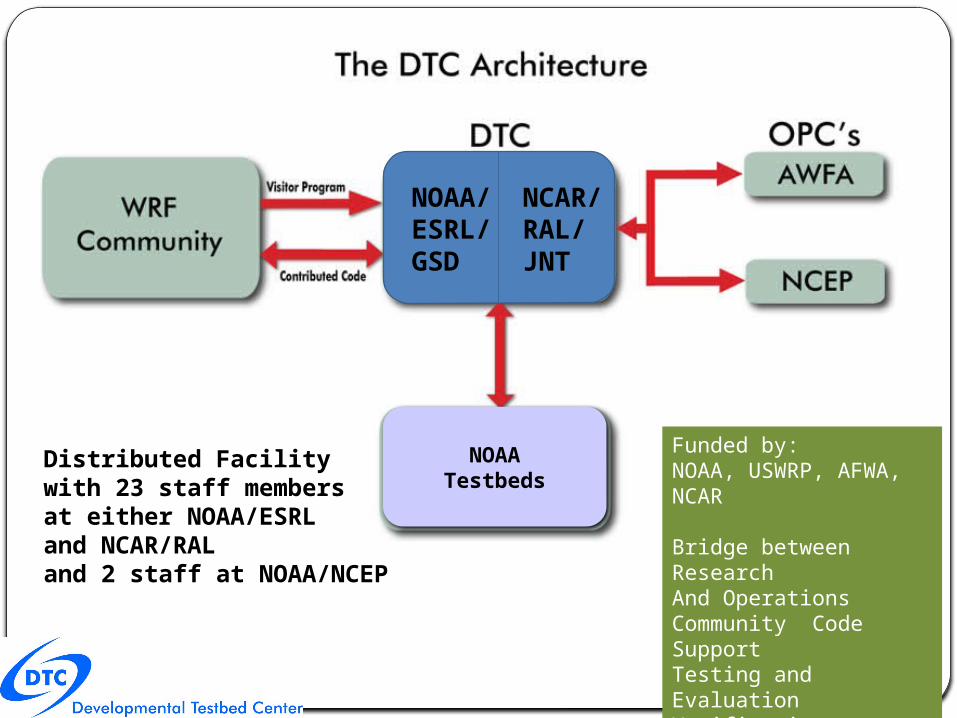
HWT-DTC Collaboration Objectives
Supplement HWT Spring Experiment subjective assessments with objective evaluation of experimental forecasts contributed to Spring Experiment
Expose the forecasters and researchers to both traditional and new approaches for verifying forecasts
Further DTC Mission of Testing and Evaluation of cutting edge NWP for R2O.
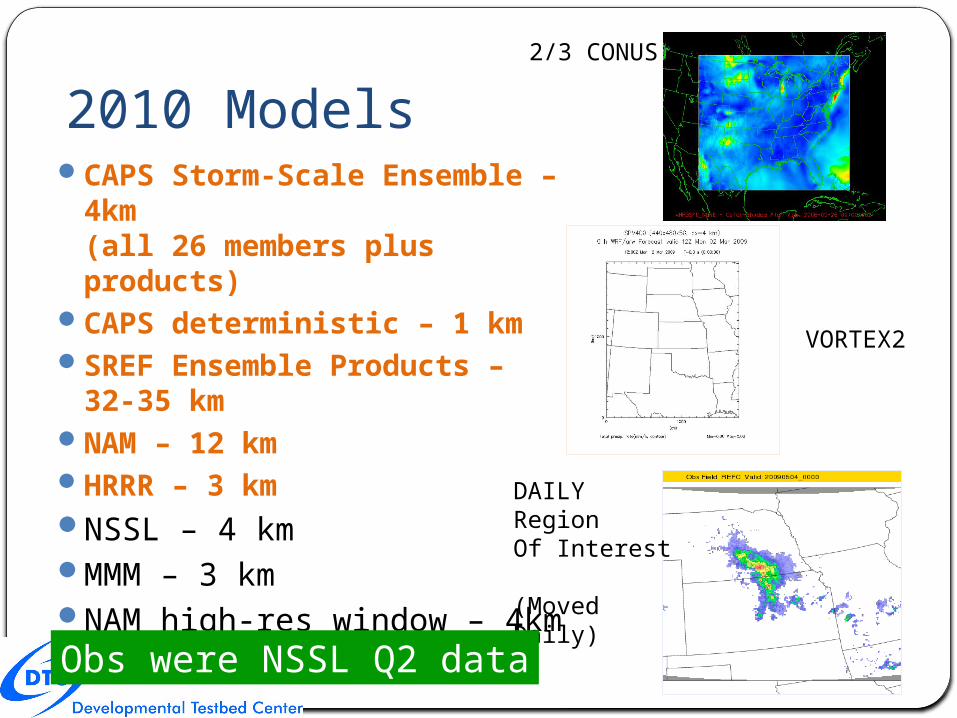
2010 ModelsCAPS Storm-Scale
Ensemble – 4km (all 26 members plus products)
CAPS deterministic – 1 km SREF Ensemble Products –
32-35 kmNAM – 12 kmHRRR – 3 kmNSSL – 4 kmMMM – 3 kmNAM high-res window – 4km
2/3 CONUS
VORTEX2
DAILYRegionOf Interest
(MovedDaily)
Obs were NSSL Q2 data
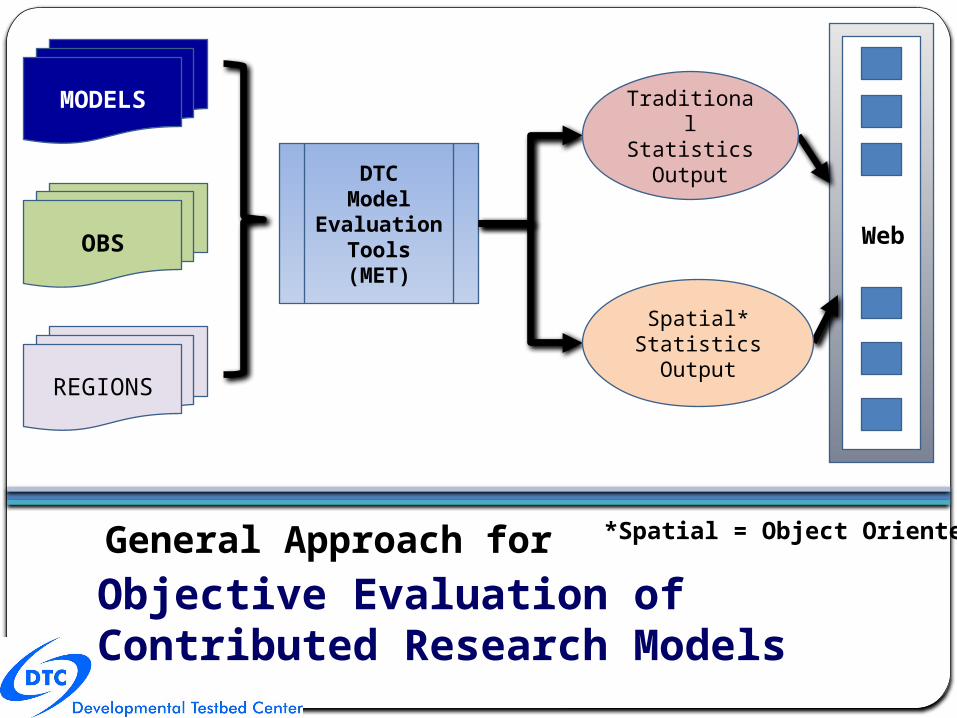
General Approach for
Objective Evaluation of Contributed Research Models
MODELS
OBS
REGIONS
DTCModel
EvaluationTools(MET)
Web
Spatial*StatisticsOutput
TraditionalStatisticsOutput
*Spatial = Object Oriented

Statistics and Attributes calculated using MET
Traditional (Categorical)
Object-Oriented from MODE
Gilbert Skill Score (GSS - aka ETS)
Critical Success Index (CSI - aka Threat Score)
Frequency BiasProb. of Detection
(POD)False Alarm Ratio
(FAR)
Centroid DistanceArea RatioAngle DifferenceIntensity
PercentilesIntersection AreaBoundary Distance
between matched forecast and observed object pairs
Etc…
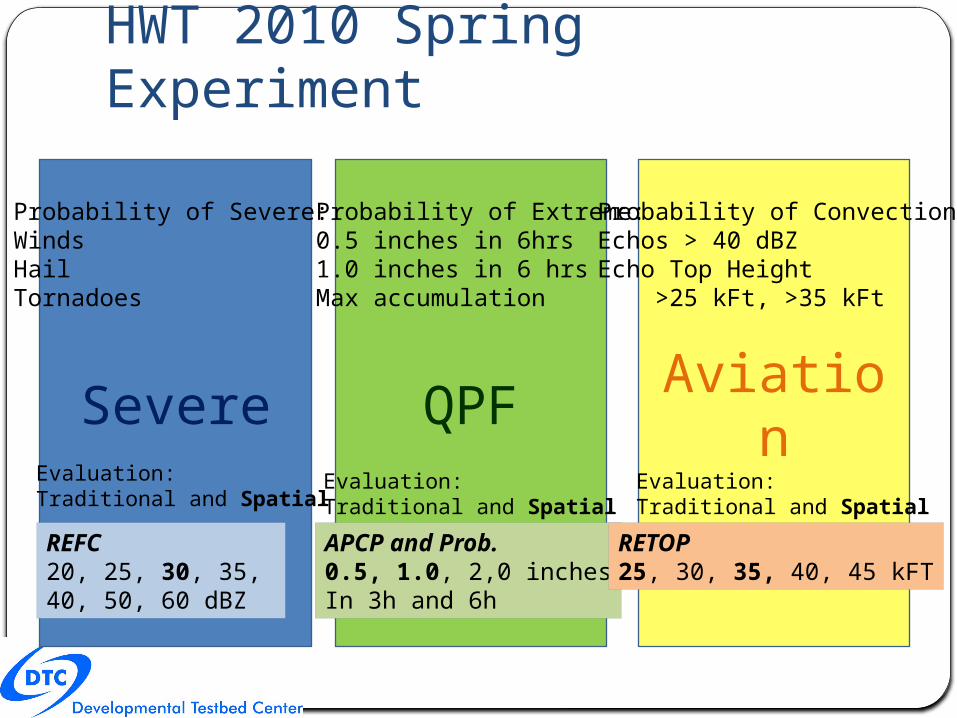
HWT 2010 Spring Experiment
AviationQPFSevere
Probability of Severe:WindsHailTornadoes
Probability of Extreme:0.5 inches in 6hrs1.0 inches in 6 hrsMax accumulation
Probability of Convection:Echos > 40 dBZEcho Top Height >25 kFt, >35 kFt
REFC20, 25, 30, 35, 40, 50, 60 dBZ
APCP and Prob.0.5, 1.0, 2,0 inchesIn 3h and 6h
RETOP25, 30, 35, 40, 45 kFT
Evaluation:Traditional and Spatial
Evaluation:Traditional and Spatial
Evaluation:Traditional and Spatial

Preliminary Results
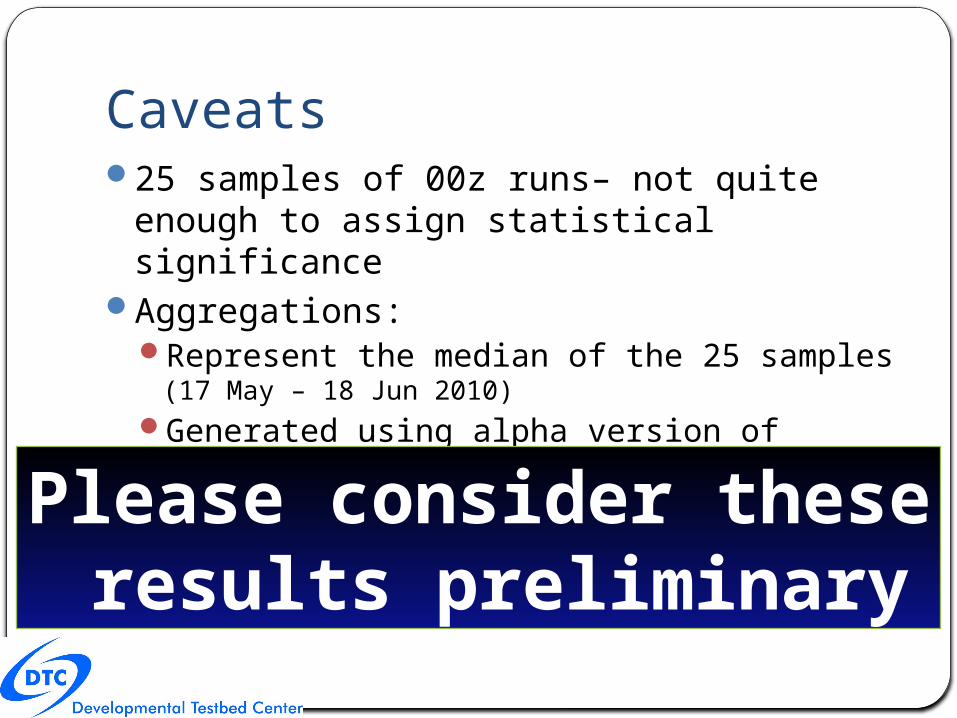
Caveats25 samples of 00z runs– not quite enough
to assign statistical significanceAggregations:
Represent the median of the 25 samples (17 May – 18 Jun 2010)
Generated using alpha version of METviewer database and display system
Please consider these results preliminary
5/14/2010
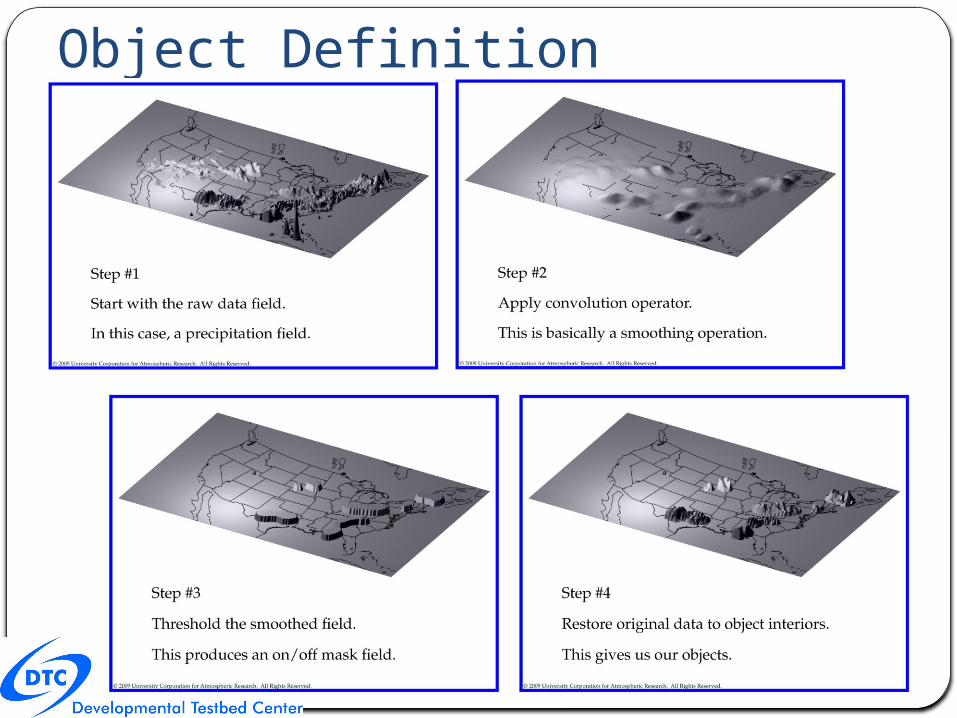
Object Definition
5/14/2010
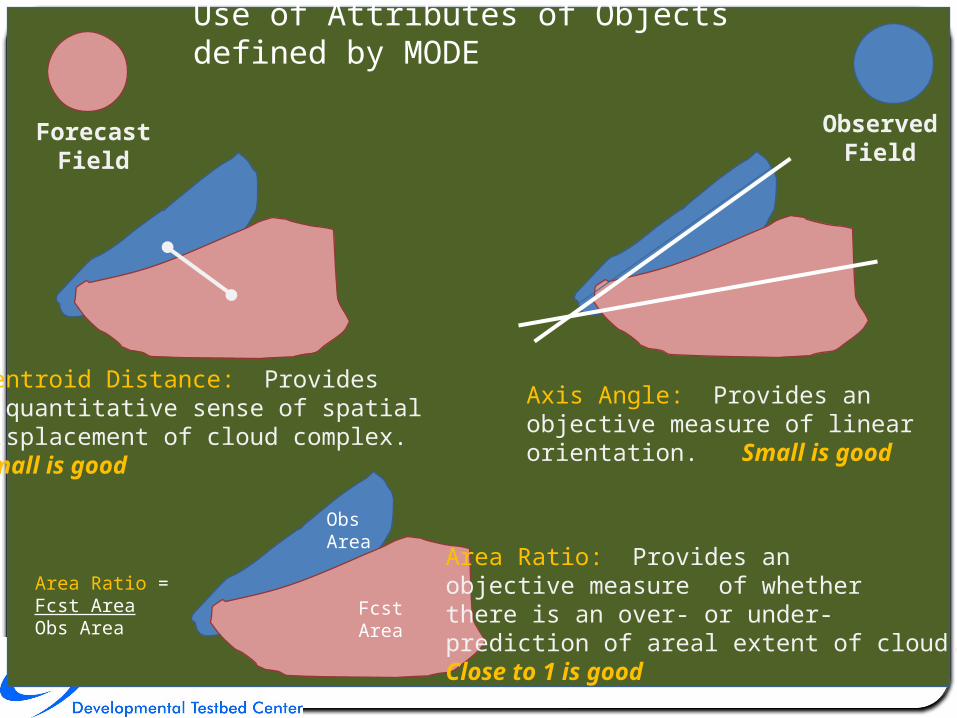
Use of Attributes of Objects defined by MODE
Centroid Distance: Providesa quantitative sense of spatialdisplacement of cloud complex.Small is good
ForecastField
ObservedField
Axis Angle: Provides anobjective measure of linearorientation. Small is good
Area Ratio: Provides anobjective measure of whetherthere is an over- or under-prediction of areal extent of cloud.Close to 1 is good
ObsArea
FcstArea
Area Ratio =Fcst AreaObs Area

5/14/2010
Symmetric Diff: May be a goodsummary statistic for how wellForecast and Observed objectsmatch. Small is good
ForecastField
ObservedField
P50/P90 Int: Providesobjective measures ofMedian (50th percentile) and near-Peak (90th percentile)intensities found in objects.Ratio close To 1 is good
Total Interest: Summary statistic derived from fuzzy logic engine with user-defined InterestMaps for all these attributes plus some others.Close to 1 is good
Symmetric Difference:Non-Intersecting Area
FcstP50 = 29.0P90 = 33.4
ObsP50 = 26.6P90 = 31.5
Total Interest0.75
Use of Attributes of Objects defined by MODE

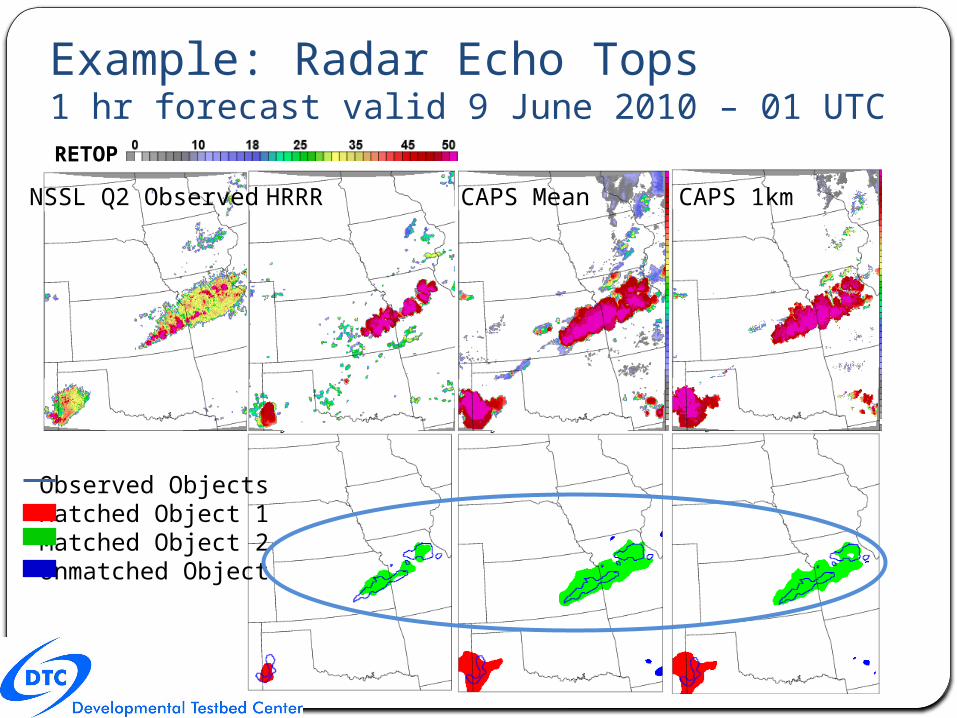
Example: Radar Echo Tops1 hr forecast valid 9 June 2010 – 01 UTC
NSSL Q2 Observed HRRR CAPS Mean CAPS 1km
RETOP
Observed ObjectsMatched Object 1Matched Object 2Unmatched Object
Example: Radar Echo Tops1 hr forecast valid 9 June 2010 – 01 UTC
NSSL Q2 Observed HRRR CAPS Mean CAPS 1km
RETOP
Observed ObjectsMatched Object 1Matched Object 2Unmatched Object
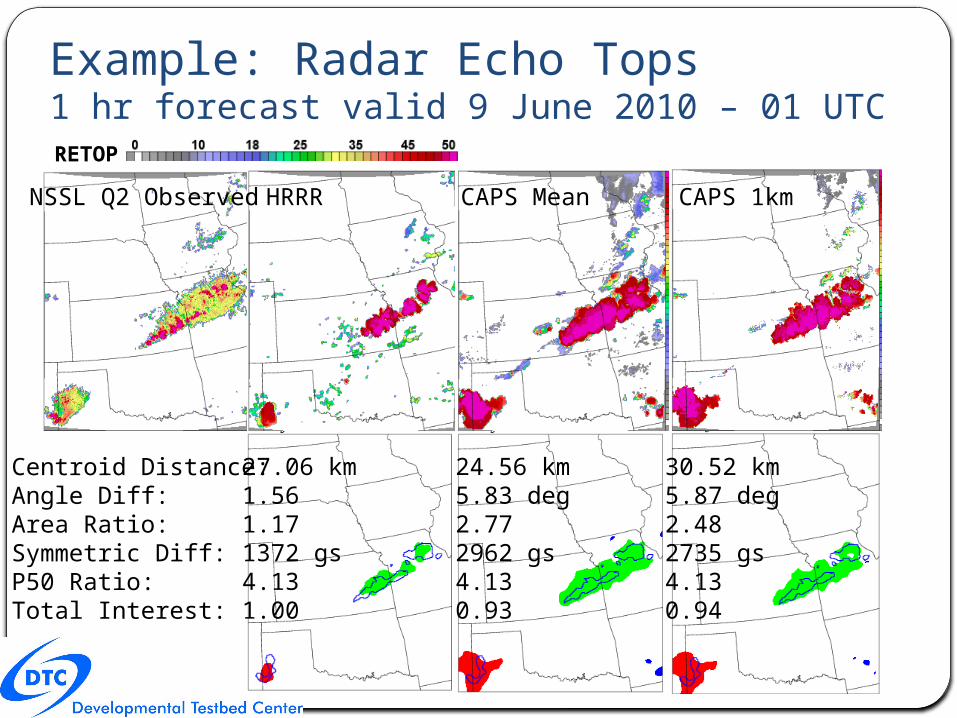
Example: Radar Echo Tops1 hr forecast valid 9 June 2010 – 01 UTC
NSSL Q2 Observed HRRR CAPS Mean CAPS 1km
RETOP
Centroid Distance:Angle Diff:Area Ratio:Symmetric Diff:P50 Ratio:Total Interest:
27.06 km1.561.171372 gs4.131.00
24.56 km5.83 deg2.772962 gs4.130.93
30.52 km5.87 deg2.482735 gs4.130.94

Example: Radar Echo TopsEnsemble Mean not always so useful
RETOP
Observed CAPS MeanThompson WSM6 WDM6 Morrison
CAPS Ensemble
Mean
CAPS 1 km Model
CAPS SSEF
ARW-CN (control w/ radar
assimilation)
3 km HRRR
12km NAM
CAPS SSEF ARW-C0
(control w/o radar
assimilation)
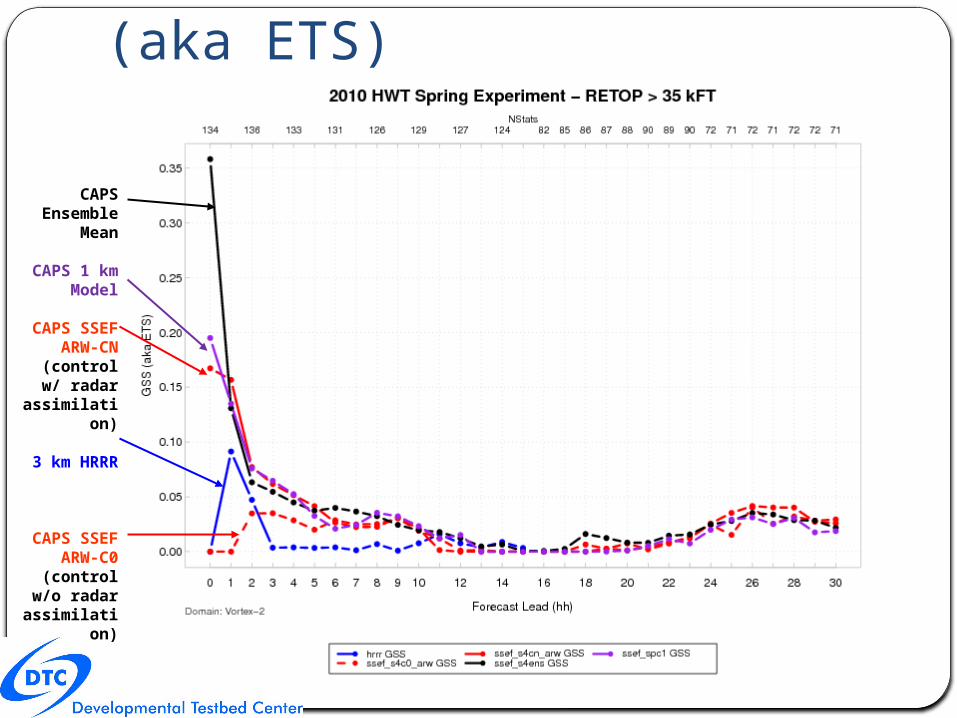
Traditional Stats – GSS (aka ETS)

CAPS Ensemble
Mean
CAPS 1 km Model
CAPS SSEF
ARW-CN (control w/ radar
assimilation)
3 km HRRR
12km NAM
CAPS SSEF ARW-C0
(control w/o radar
assimilation)
Traditional Stats – Freq. Bias
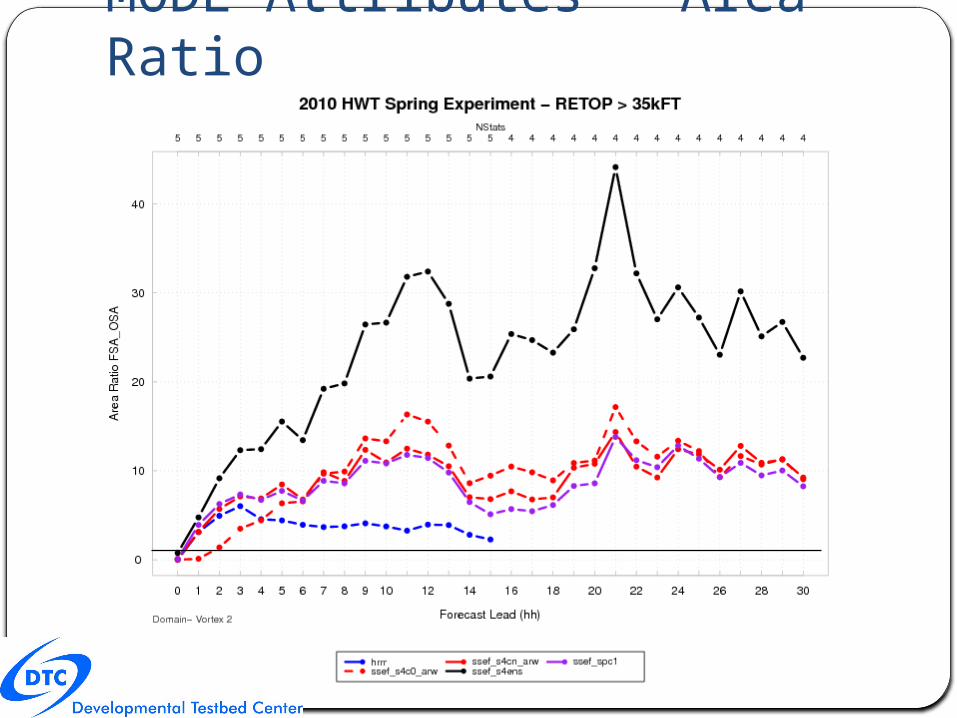
MODE Attributes – Area Ratio
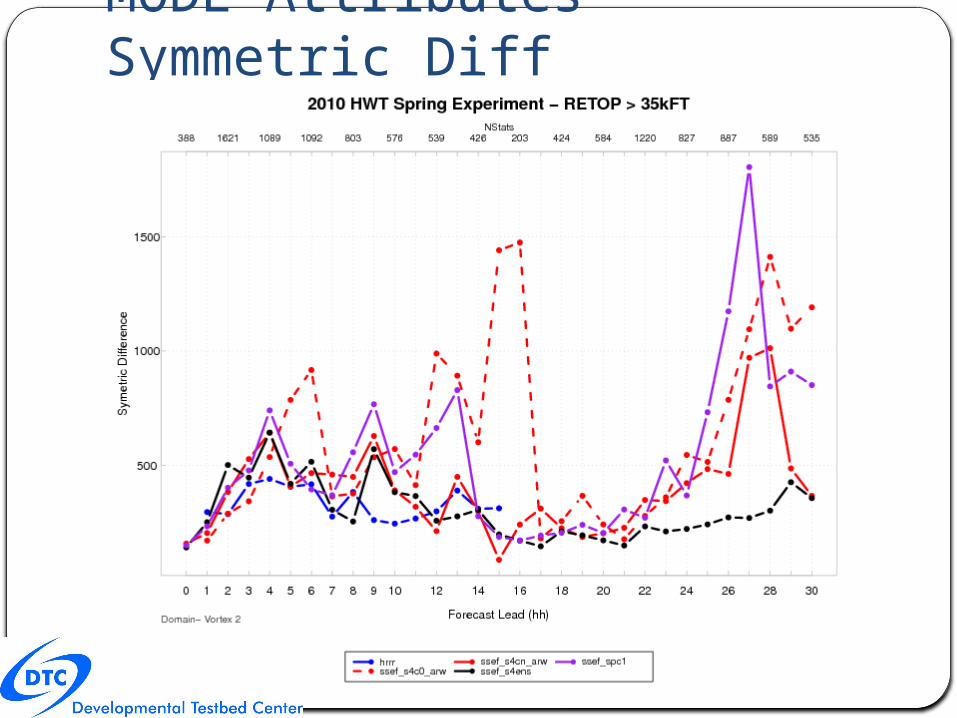
MODE Attributes – Symmetric Diff
Summary30 models and 4 ensemble products evaluated during HWT
2010Most models had reflectivity as a variable3 models had Radar Echo Top as a variable (HRRR, CAPS
Ensemble, CAPS 1km)All models appears to over predict RETOP areal coverage by at
least a factor of 2-5 based on FBIAS and a factor of 5-10 based on MODE Area Ratio
Based on some Traditional and Object-Oriented Metrics: HRRR appears to have a slight edge over CAPS simulations for RETOP during the 2010 Spring Experiment but the differences are not statistically significant
The Ensemble post-processing technique (seen in Ensemble Mean) seems to inflate the over-prediction of areal extent of cloud shield to a non-useful level.
Additional Evaluation of Probability of Exceeding 40 dBZ is planned for later this winter.
Thank Yous… Questions?
Support for the Developmental Testbed Center (DTC),
is provided by
NOAA, AFWA
NCAR and NSF
Evaluation: http://verif.rap.ucar.edu/hwt/2010
MET: http://www.dtcenter.org/met
Email: [email protected]
DTC would like to thank all of the AWC participants who helped improveour evaluation through their comments and suggestions.