Embed Size (px)
Citation preview

Objective:describe the structure of red blood cells, phagocytes and lymphocytes and the role of haemoglobin

Composition of bloodWhole blood
55% plasma 45% cells
90% water10% solutes red white platelets
granulocytesagranulocytes
eosinophils
basophils
neutrophils
lymphocytesmonocytes
nutrients
salts (electrolytes)
plasma proteins
hormones
albumens
globulins (antibodies)
clotting factors
T cells B cells
killer T cells
helper T cells

Blood cells
False colour scanning electron micrograph of cells in arterial blood
Red blood cell
Monocyte
Neutrophil
T-lymphocyte
Platelets

Red blood cells (erythrocytes)• 5 000 000 per mm3
• biconcave discs – maximises surface area for gas exchange
• approx. 7 m diameter, 2 m thick
• nucleus lost on maturation (more space for haemoglobin)
• no mitochondria, very few organelles
• short-lived (100-120 days)
• made in bone marrow of ribs and vertebrae; broken down in liver and spleen (1-2 million/s)

Objectives:
* describe the role of haemoglobin in carrying oxygen and carbon dioxide
** describe and explain the significance of the dissociation curves of adult oxyhaemoglobin at different carbon dioxide levels (the Bohr effect)

Haemoglobin and oxygen transport• Haemoglobin is a conjugated protein
showing quaternary structure
• One haemoglobin molecule is formed of two -globin and two -globin chains, each bonded to a haem group with an iron atom at its centre
-globin
-globin
haem

Haemoglobin and oxygen transport• Each haem group can bind one oxygen
molecule (O2) to its iron atom: one haemoglobin molecule can therefore carry four oxygen molecules
• Unbound haemoglobin has quite a low affinity for oxygen, and at low oxygen concentrations (as in respiring tissues) very little is bound
• But the binding of an oxygen molecule to one haem group alters the shape of the whole molecule, making it easier for a second to bind; this alters the shape making it easier for a third to bind, and so on: this gives the characteristic oxygen dissociation curve of haemoglobin

Oxygen dissociation curve of haemoglobin
Percentage saturation of haemoglobin with oxygen
0
50
100
Partial pressure of oxygen (pO2) / kPa
An oxygen dissociation curve plots the percentage saturation of haemoglobin with oxygen against the partial pressure of oxygen in its surroundings.
Percentage saturation is a measure of how ‘full up’ the haemoglobin is with oxygen: if none of the haem groups are bound to oxygen, saturation = 0%; if all of them are bound, saturation = 100%; if on average each haemoglobin molecule has two oxygen molecules bound to it, saturation = 50%, and so on.

Oxygen dissociation curve of haemoglobin
Percentage saturation of haemoglobin with oxygen
0
50
100
Partial pressure of oxygen (pO2) / kPa
Partial pressure of oxygen is a measure of oxygen concentration that allows direct comparison between, for example, oxygen concentration in the air, oxygen concentration when dissolved in water, or oxygen concentration when bound to haemoglobin.
Other concentration measures (e.g. %, or mg per dm3, or whatever) would not allow such comparison.
Oxygen dissociation curve of haemoglobin
Percentage saturation of haemoglobin with oxygen
0
50
100
Partial pressure of oxygen (pO2) / kPa
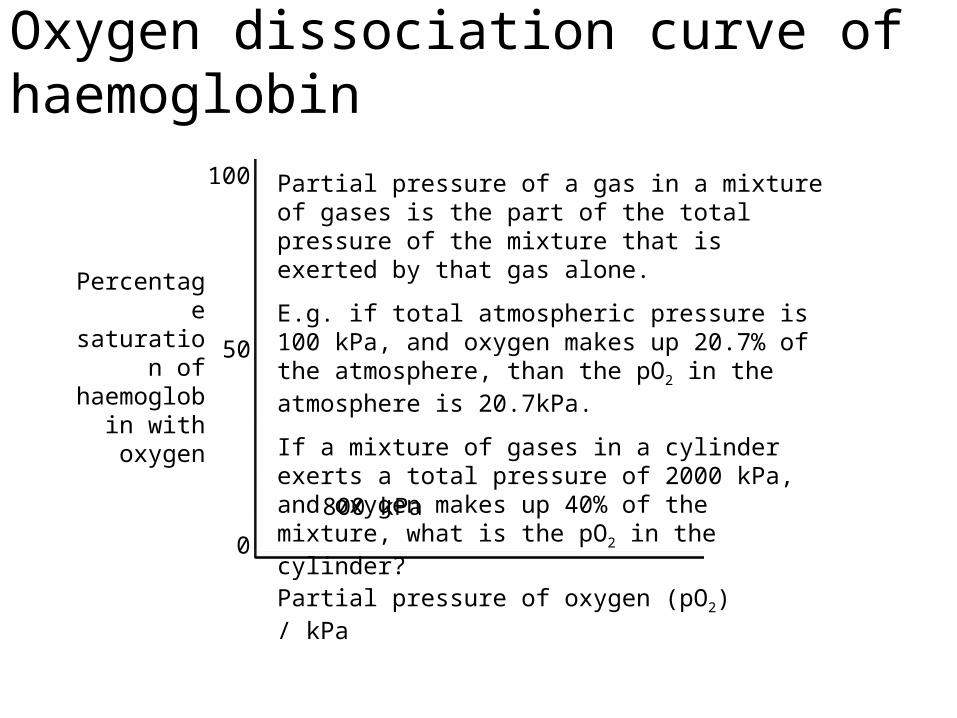
Partial pressure of a gas in a mixture of gases is the part of the total pressure of the mixture that is exerted by that gas alone.
E.g. if total atmospheric pressure is 100 kPa, and oxygen makes up 20.7% of the atmosphere, than the pO2 in the atmosphere is 20.7kPa.
If a mixture of gases in a cylinder exerts a total pressure of 2000 kPa, and oxygen makes up 40% of the mixture, what is the pO2 in the cylinder?
800 kPa

Oxygen dissociation curve of haemoglobin
Percentage saturation of haemoglobin with oxygen
0
50
100
Partial pressure of oxygen (pO2) / kPa
Partial pressure of a gas in a solution or bound state is equal to the partial pressure of that gas in an atmosphere in equilibrium with that solution.
E.g. if a body of water is in equilibrium with an atmosphere of pO2 20.7 kPa, so that oxygen is being neither gained nor lost by the water, then the pO2 of the water is also 20.7 kPa.
If a test-tube full of blood is in equilibrium with an atmosphere of pO2 12.5 kPa, then the pO2 of the blood is also……….
12.5 kPa

Oxygen dissociation curve of haemoglobin
Percentage saturation of haemoglobin with oxygen
0
50
100
Partial pressure of oxygen (pO2) / kPa0 142 4 6 8 10 12
At pO2 0 kPa (no oxygen present) percent saturation is of course 0
As pO2 rises from 0, so does percent saturation: but because of the increasing affinity of haemoglobin for oxygen as each O2 molecule binds, the curve is not linear but increases in gradient
As pO2 continues to rise, percent saturation rises increasingly steeply as the haemoglobin’s affinity for oxygen increases
Above a pO2 of about 8 kPa most of the haem groups are bound to oxygen, and the curve flattens out.
Alveolar pO2Tissue pO2
pO2 of exercising muscle

Oxygen dissociation curve of haemoglobin: why is it important?
Percentage saturation of haemoglobin with oxygen
0
50
100
Partial pressure of oxygen (pO2) / kPa0 142 4 6 8 10 12
Alveolar pO2Tissue pO2
pO2 of exercising muscle
Compare the oxygen dissociation curve to the curve we would see if haemoglobin reached saturation at the same pO2 but without the increasing affinity.
The sigmoid dissociation curve means that at low pO2 haemoglobin binds oxygen less readily than expected – i.e. lets it go more readily than expected.
The extra oxygen delivered is shown by

Oxygen dissociation curve of haemoglobin: fetal haemoglobin
Percentage saturation of haemoglobin with oxygen
0
50
100
Partial pressure of oxygen (pO2) / kPa0 142 4 6 8 10 12
Alveolar pO2Placental pO2
At the placenta, fetal haemoglobin must load
(take up oxygen) at a pO2 at which maternal
haemoglobin unloads.
This means that fetal haemoglobin must have a higher affinity for oxygen
than maternal haemoglobin: its dissociation curve is
therefore to the left of maternal haemoglobin’s
curve.
Maternal haemoglobin
Fetal haemoglobin
Oxygen delivered from maternal to fetal haemoglobin
Fetal haemoglobin is made in the liver.
Why not in bone marrow, like adult haemoglobin?

Oxygen dissociation curve of myoglobin
Percentage saturation of haemoglobin with oxygen
0
50
100
Partial pressure of oxygen (pO2) / kPa0 142 4 6 8 10 12
Alveolar pO2Tissue pO2
pO2 of exercising muscle
Myoglobin is a dark red pigment found only in muscle. It acts as a ‘last-ditch’ oxygen reserve in severe exertion: its oxygen dissociation curve is a long way to the left of haemoglobin’s.
Adult haemoglobin
Myoglobin
As the curve shows, myoglobin gives up most of its oxygen only when muscle pO2 falls well below 1 kPa – only in conditions of severe exertion.
Next stop, anaerobic respiration …

Transport of carbon dioxide• About 5% of the carbon dioxide released
from respiring cells is carried as CO2 molecules in solution in blood plasma
• About 25% attaches to the protein in haemoglobin and is carried as carbaminohaemoglobin

Transport of carbon dioxide• The remaining 70% enters red blood cells
and is converted by the enzyme carbonic anhydrase into carbonic acid
• The carbonic acid immediately dissociates into hydrogen ions and hydrogencarbonate ions:
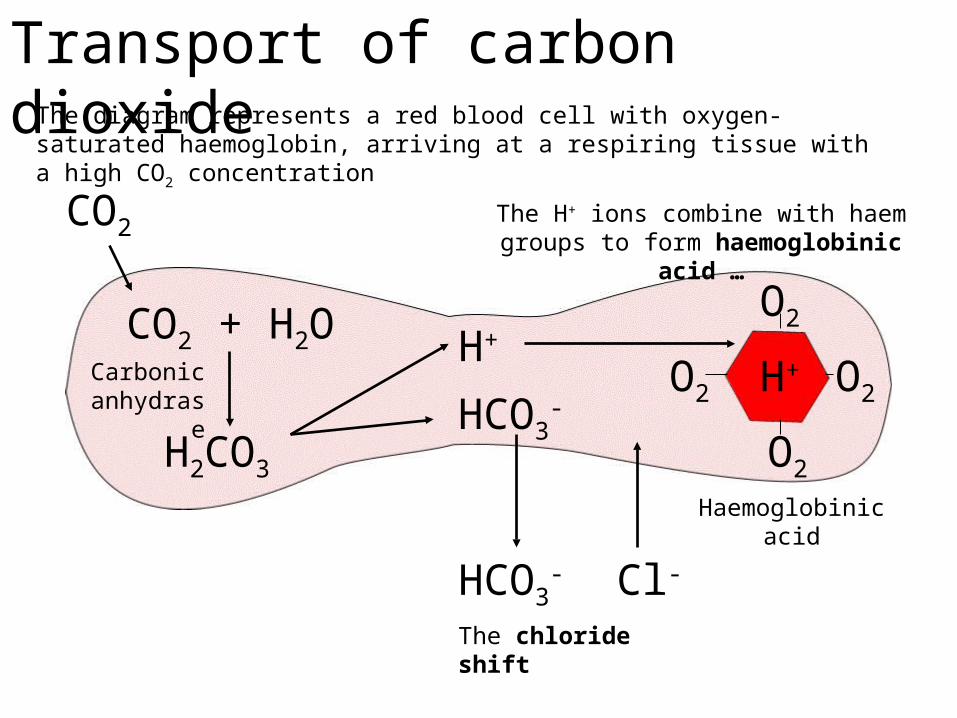
CO2 + H2O H2CO3 H+ + HCO3-
• The hydrogencarbonate ions diffuse out into the plasma: the loss of negative ions is balanced by a corresponding uptake of chloride ions, Cl- (the chloride shift)

• Describe and explain the significance of the increase in the red blood cell count of humans at high altitude;
• Describe how smoking can affect oxygen dissociation curve
CO2 + H2O
CO2
H2CO3
H+
HCO3-
Transport of carbon dioxide
O2
O2
O2
O2
HCO3- Cl-
The chloride shift
H+
Haemoglobinic acid
The diagram represents a red blood cell with oxygen-saturated haemoglobin, arriving at a respiring tissue with a high CO2 concentration
Carbonic anhydrase
The H+ ions combine with haem groups to form haemoglobinic acid …

CO2 + H2O
CO2
H2CO3
H+
HCO3-
Transport of carbon dioxide
HCO3- Cl-
The chloride shift
H+
Haemoglobinic acid
4O2
The diagram represents a red blood cell with oxygen-saturated haemoglobin, arriving at a respiring tissue with a high CO2 concentration
Haemoglobinic acid not only buffers the excess H+ ions, but its lower affinity for
oxygen causes O2 to be released
In the alveolar capillaries the opposite happens: the high O2 concentration displaces H+ from haemoglobin; the H+ ions combine with HCO3
- to form carbonic acid, which decomposes to CO2 and water.
Carbonic anhydrase

The Bohr effect
Percentage saturation of haemoglobin with oxygen
0
50
100
Partial pressure of oxygen (pO2) / kPa0 142 4 6 8 10 12
Medium CO2 level
The formation of haemoglobinic acid means that in the presence of high CO2 concentrations the dissociation curve shifts to the right (a reduction in affinity for oxygen): this is called the Bohr effect.
Low CO2 level
High CO2 level
The Bohr effect means that haemoglobin will load more easily in the pulmonary capillaries (low CO2 = high O2 affinity), and unload more easily in the tissue capillaries (high CO2 = lower O2 affinity).
Loading occurs here
Unloading occurs here

Oxygen dissociation curves: practice questions
% s
atur
atio
n
Partial pressure of oxygen (pO2) / kPa
Loading tension is defined as the partial pressure of oxygen (pO2) at which haemoglobin becomes 95% saturated; unloading tension is the pO2 at which haemoglobin becomes 50% saturated.
State the loading and unloading tensions of the haemoglobin in the red curve.
1

Oxygen dissociation curves: practice questions
% s
atur
atio
n
Partial pressure of oxygen (pO2) / kPa
1 dm3 of human blood can carry 200 cm3 of oxygen when fully saturated.
Calculate the volume of oxygen delivered by 1 dm3 of blood when travelling from the alveoli (pO2 12 kPa) to the liver (pO2 4.6 kPa).
2

Oxygen dissociation curves: practice questions
% s
atur
atio
n
Partial pressure of oxygen (pO2) / kPa
The red line shows the oxygen dissociation curve of adult human haemoglobin.
Llamas are herbivorous mammals living high in the Andes, where the atmospheric pO2 is much lower than at sea level. Where would the oxygen dissociation curve of llama haemoglobin appear on this graph? Explain your answer.
3
Human haemoglobin
Llama haemoglobin

Oxygen dissociation curves: practice questions
% s
atur
atio
n
Partial pressure of oxygen (pO2) / kPa
The red line shows the oxygen dissociation curve of adult human haemoglobin at pCO2 of 0.1 kPa.
Where on this graph would you expect to see (a) the oxygen dissociation curve of human fetal haemo-globin at pCO2 0.1 kPa, (b) the oxygen dissociation curve of adult haemoglobin at pCO2 of 0.2 kPa? Explain your answers.
4
Adult haemoglobin at pCO2 0.2 kPa
Fetal haemoglobin at pCO2 0.1
kPa