Embed Size (px)
DESCRIPTION
Obesity Status and Body Satisfaction of African American College Women. Delores C. S. James, PhD, RD, LD, FASHA Associate Professor Jennifer R. Bonds Undergraduate Researcher University of Florida Gainesville, FL. Obesity Prevalence. Obesity has doubled among American adults since 1980 - PowerPoint PPT Presentation
Citation preview
Obesity Status and Body Satisfaction of African
American College Women
Delores C. S. James, PhD, RD, LD, FASHAAssociate Professor
Jennifer R. BondsUndergraduate Researcher
University of Florida Gainesville, FL
Obesity Prevalence Obesity has doubled among
American adults since 1980 African Americans have
higher rates of obesity and weight related diseases
African American women have a higher rate of overweight and obesity than African American men
Obesity PrevalenceIn 1999, the greatest increase was among young adults ages 18 to 29In 1997, one in five college students was overweight One third of African American college students were overweight in 1995African American female students were more likely to be overweight than their White and Hispanic counterparts
Goals To assess obesity status and
body satisfaction among African American college females
To examine differences in these variables between a predominately white university and a historically black college and university (HBCU)
Methods and ProceduresConvenient sample
402 undergraduate women of African descentTwo public universities in Florida
University of FloridaFlorida A&M University (HBCU)
Self-administered surveyIRB approval from both campusesRecruited from sororities, campus organizations, and various places frequented by studentsStudents received a cup as an incentive
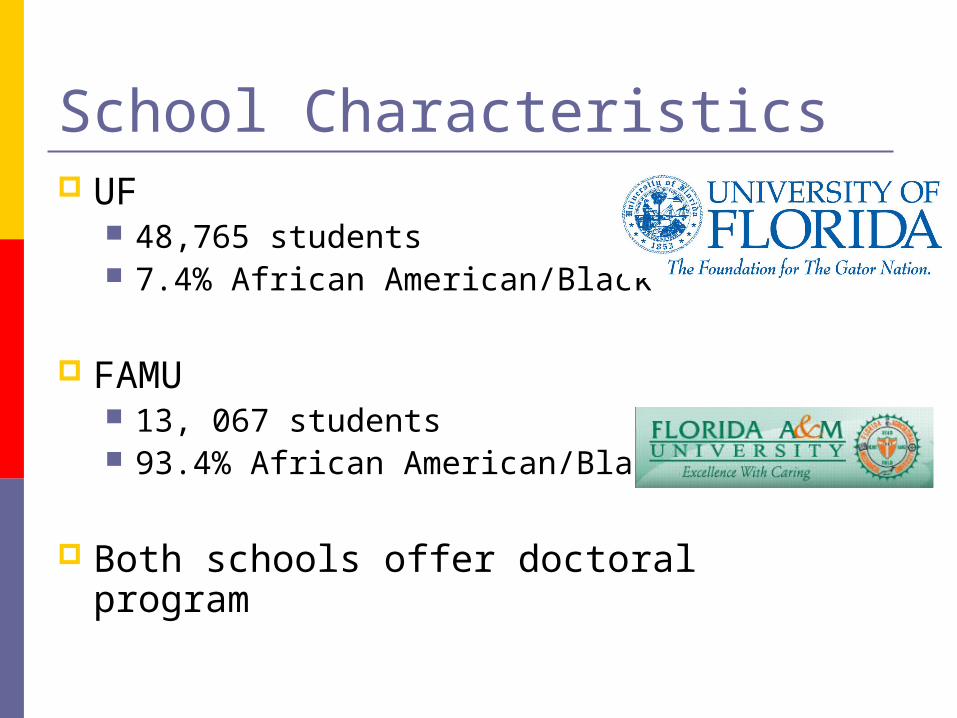
School Characteristics UF
48,765 students 7.4% African American/Black
FAMU 13, 067 students 93.4% African American/Black
Both schools offer doctoral program
Historically Black Colleges and Universities (HBCUs) 135 typically small
undergraduate institutions Produce 40 percent of this
country’s Black graduates Most located in the South
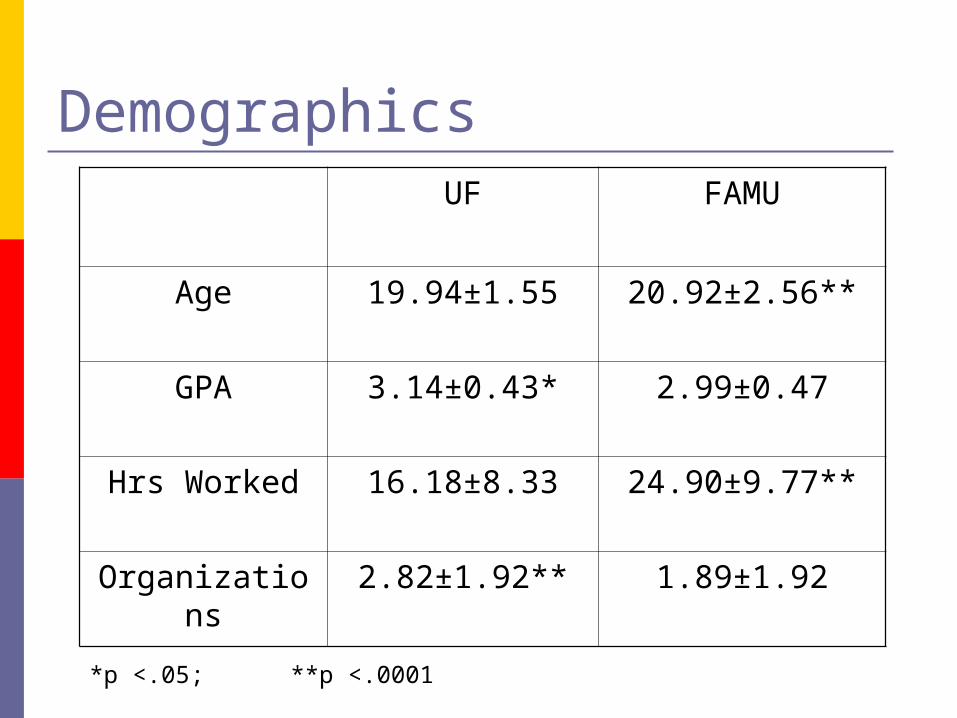
DemographicsUF FAMU
Age 19.94±1.55 20.92±2.56**
GPA 3.14±0.43* 2.99±0.47
Hrs Worked 16.18±8.33 24.90±9.77**
Organizations 2.82±1.92** 1.89±1.92
*p <.05; **p <.0001
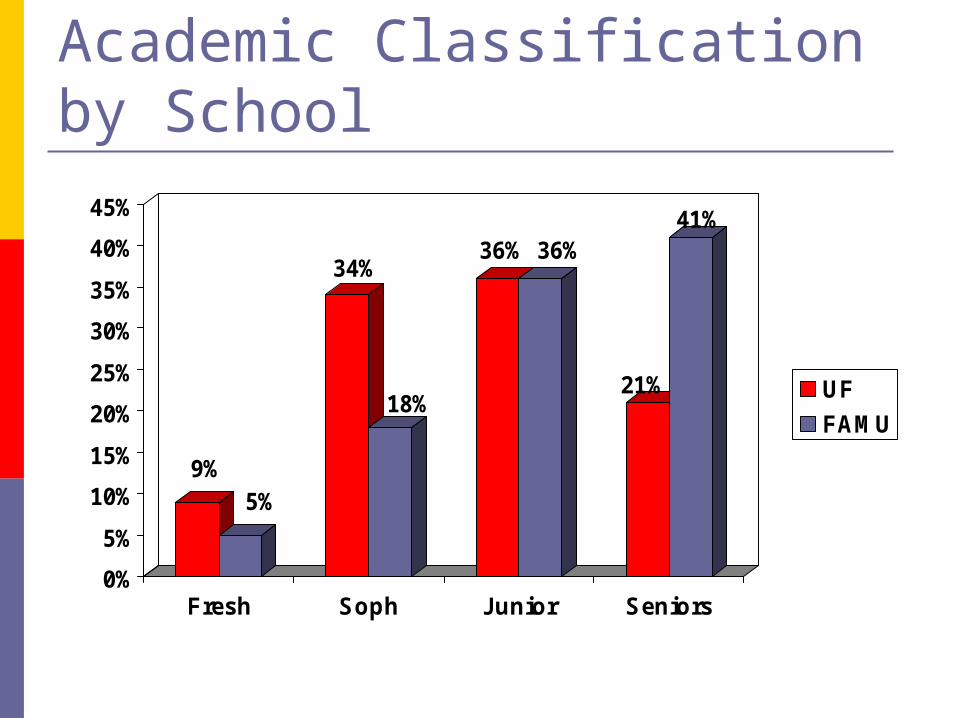
Academic Classification by School
9%5%
34%
18%
36% 36%
21%
41%
0%5%
10%15%20%25%30%35%40%45%
Fresh Soph Junior Seniors
UFFAMU
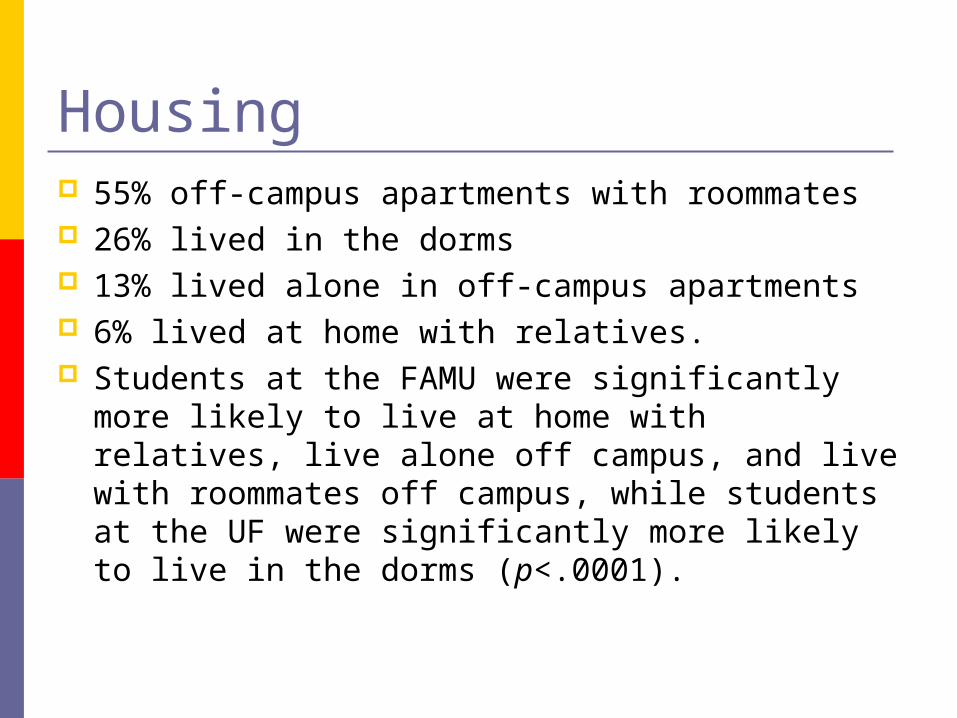
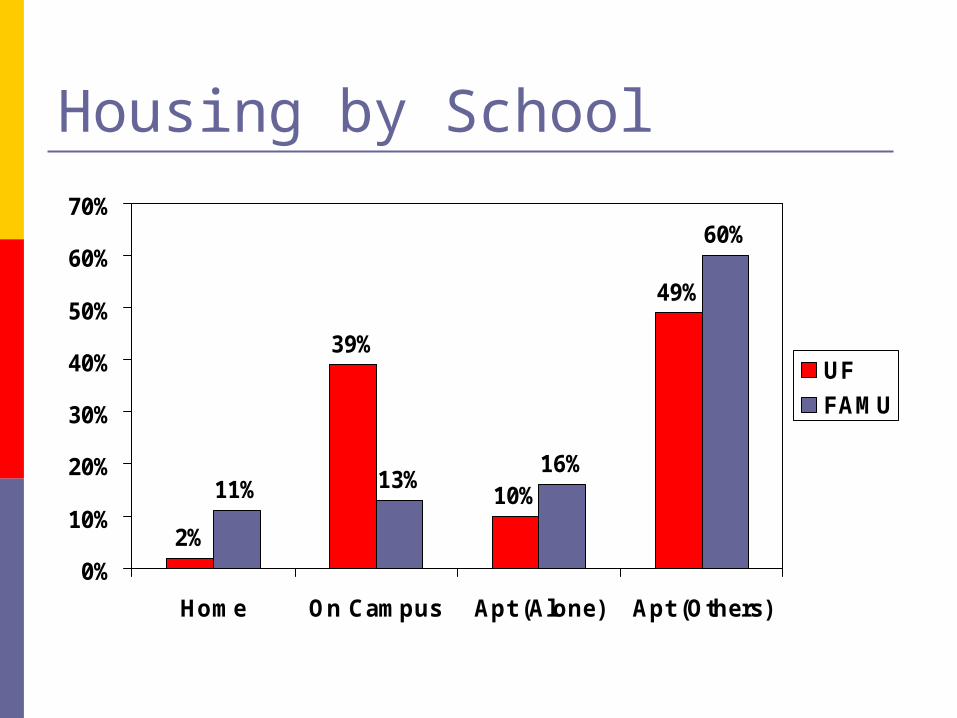
Housing 55% off-campus apartments with roommates 26% lived in the dorms 13% lived alone in off-campus apartments 6% lived at home with relatives. Students at the FAMU were significantly more
likely to live at home with relatives, live alone off campus, and live with roommates off campus, while students at the UF were significantly more likely to live in the dorms (p<.0001).
Housing by School
2%
39%
10%
49%
11% 13% 16%
60%
0%
10%
20%
30%
40%
50%
60%
70%
Home On Campus Apt (Alone) Apt (Others)
UFFAMU
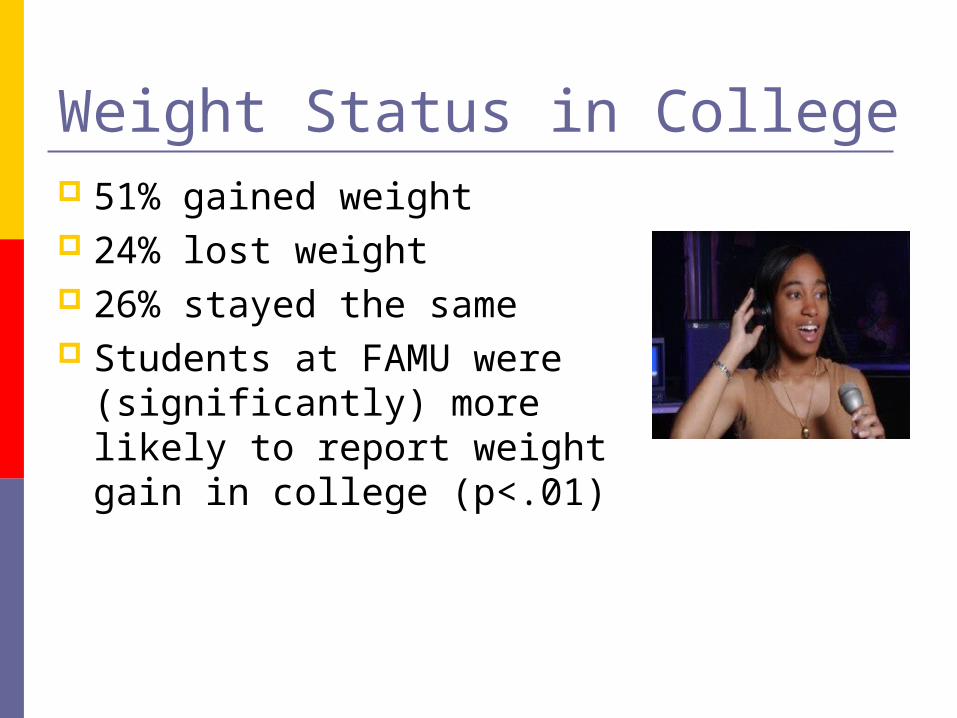
Weight Status in College 51% gained weight 24% lost weight 26% stayed the same Students at FAMU were
(significantly) more likely to report weight gain in college (p<.01)
BMIBMI were calculated based on self-reported weight and height
Everyone 25.24±5.56 (overweight)FAMU 25.62±6.00 (overweight)UF 24.89±5.10 (normal, high end)
There was no significant difference between schools on BMI
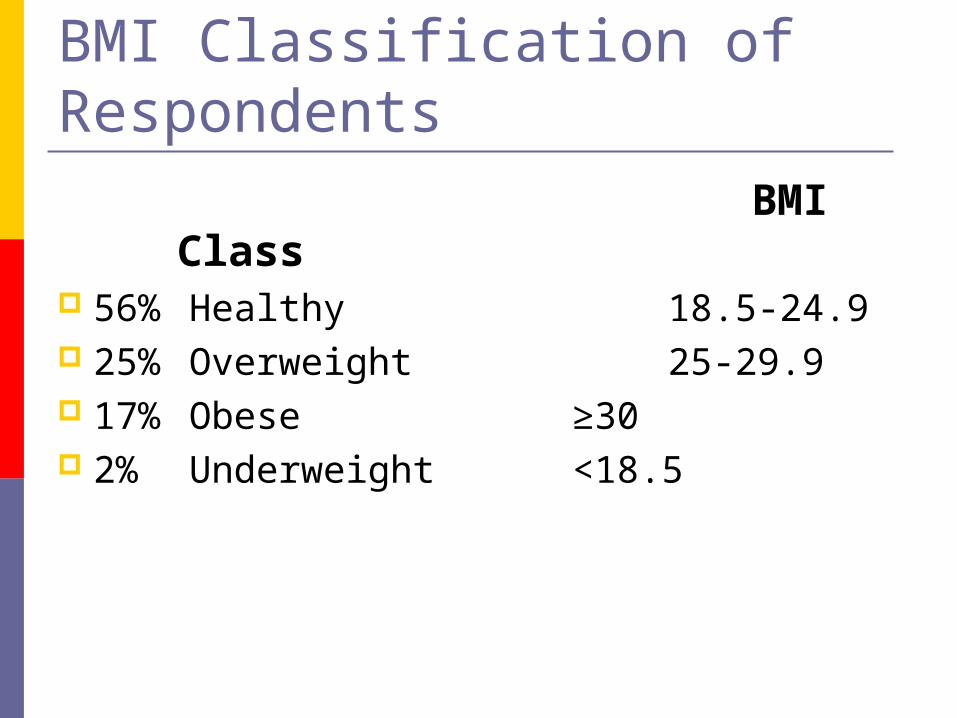
BMI Classification of Respondents
BMI Class
56% Healthy 18.5-24.9 25% Overweight 25-29.9 17% Obese ≥30 2% Underweight <18.5
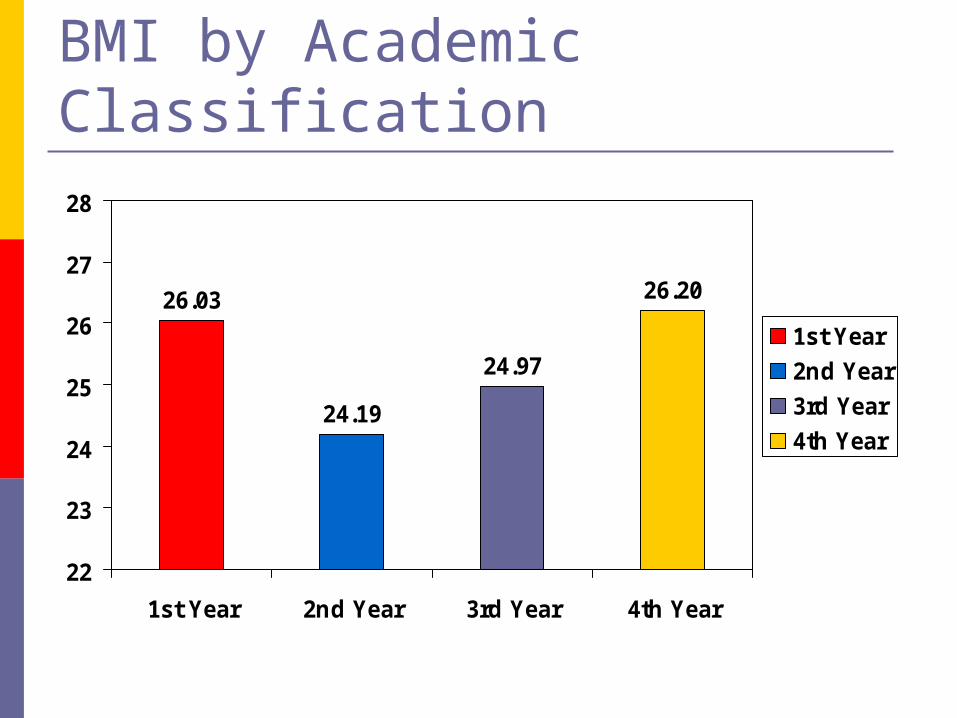
BMI by Academic Classification
26.03
24.19
24.97
26.20
22
23
24
25
26
27
28
1st Year 2nd Year 3rd Year 4th Year
1st Year2nd Year3rd Year4th Year
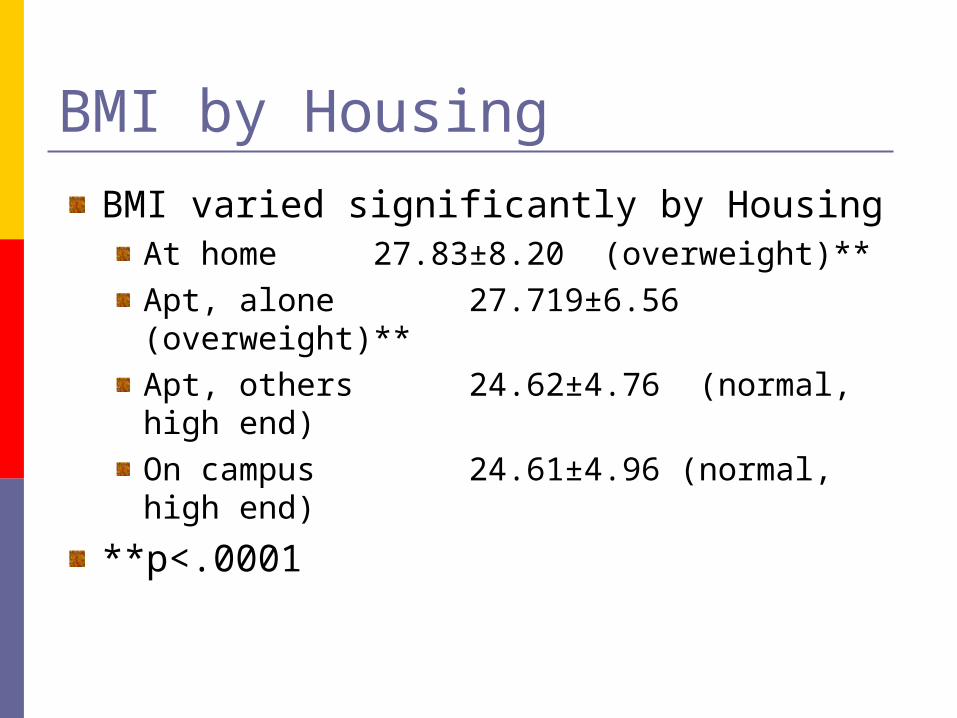
BMI by HousingBMI varied significantly by Housing
At home 27.83±8.20 (overweight)**Apt, alone 27.719±6.56 (overweight)**Apt, others 24.62±4.76 (normal, high end)On campus 24.61±4.96 (normal, high end)
**p<.0001
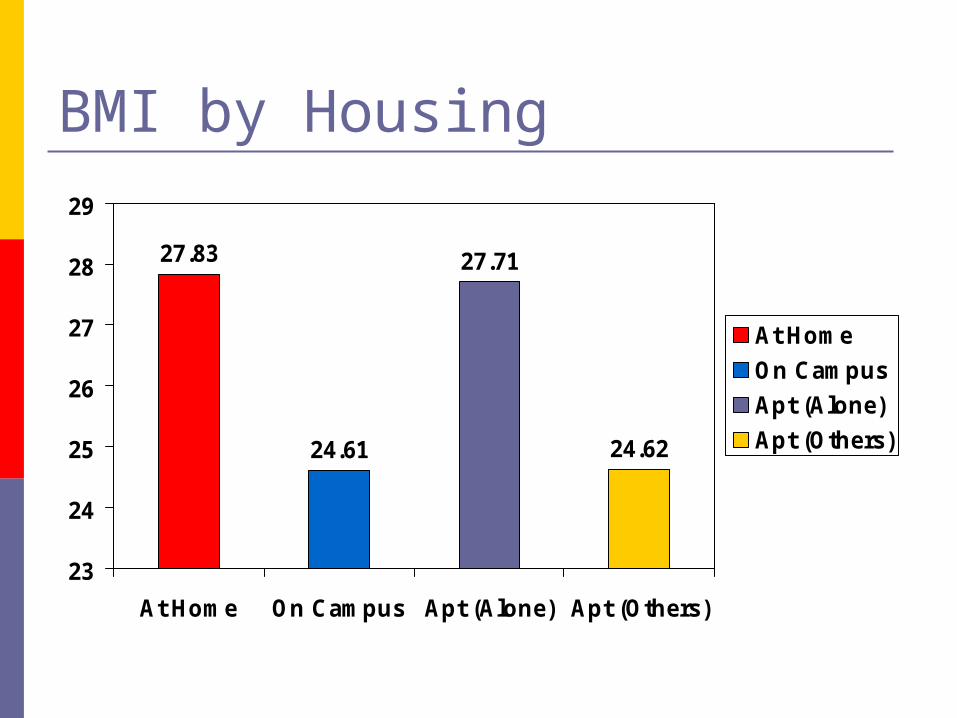
BMI by Housing
27.83
24.61
27.71
24.62
23
24
25
26
27
28
29
At Home On Campus Apt (Alone) Apt (Others)
At HomeOn CampusApt (Alone)Apt (Others)
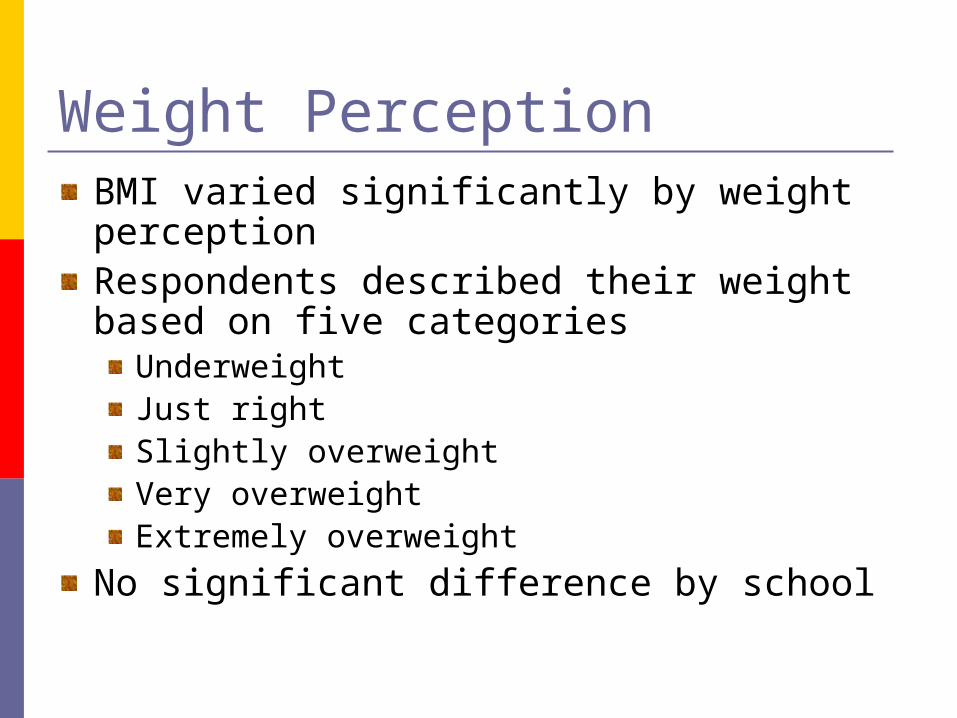
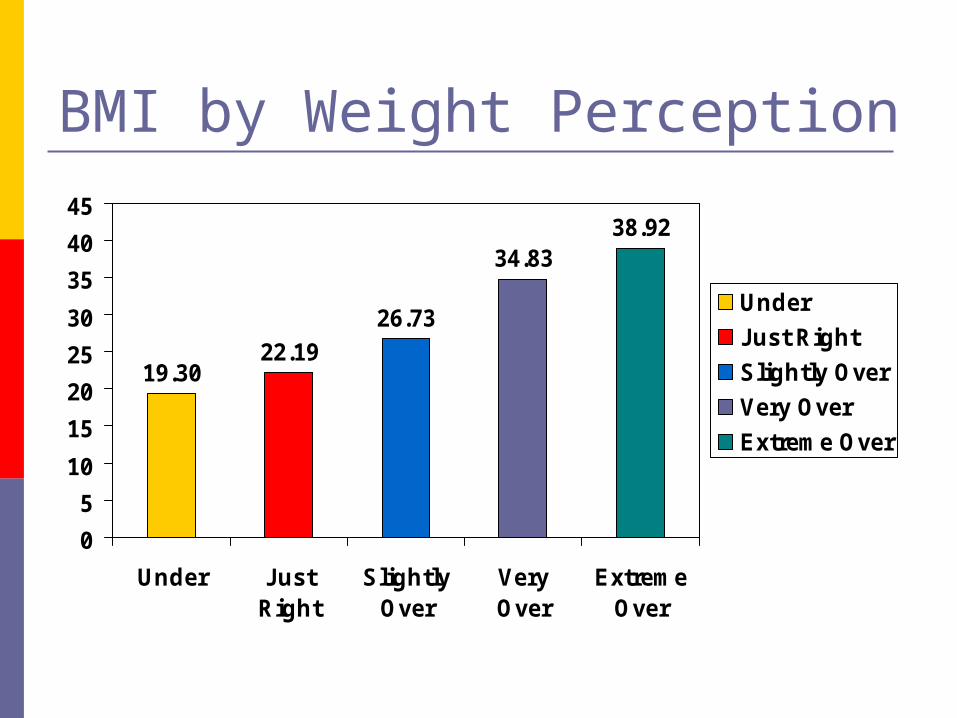
Weight PerceptionBMI varied significantly by weight perception Respondents described their weight based on five categories
UnderweightJust rightSlightly overweightVery overweightExtremely overweight
No significant difference by school
BMI by Weight Perception
19.3022.19
26.73
34.8338.92
05
1015202530354045
Under JustRight
SlightlyOver
VeryOver
ExtremeOver
UnderJust RightSlightly OverVery OverExtreme Over
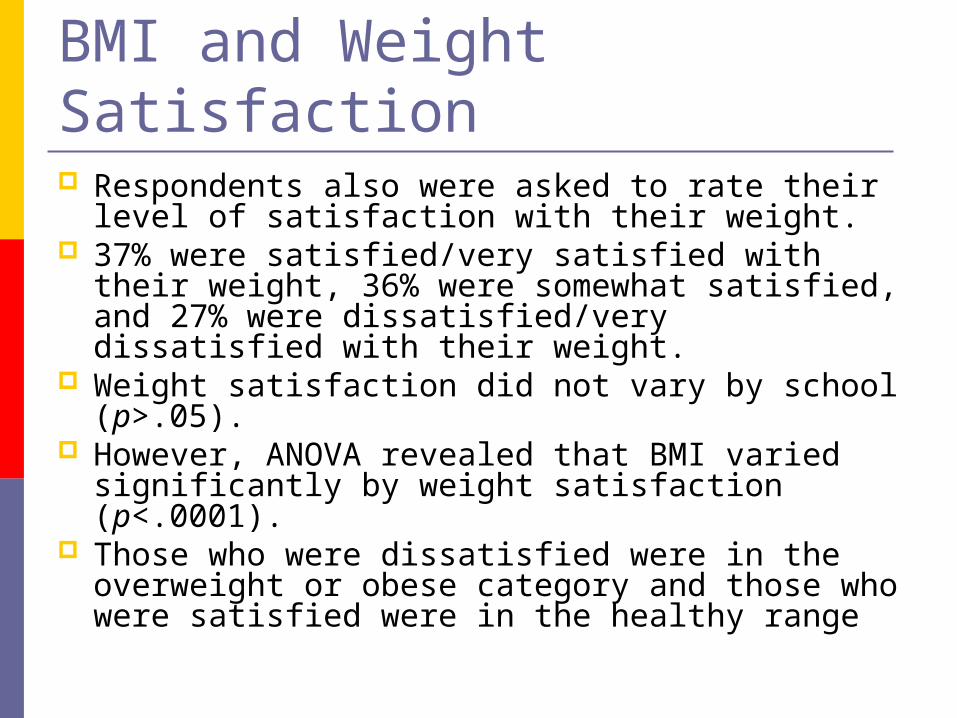
BMI and Weight Satisfaction Respondents also were asked to rate their level of
satisfaction with their weight. 37% were satisfied/very satisfied with their
weight, 36% were somewhat satisfied, and 27% were dissatisfied/very dissatisfied with their weight.
Weight satisfaction did not vary by school (p>.05).
However, ANOVA revealed that BMI varied significantly by weight satisfaction (p<.0001).
Those who were dissatisfied were in the overweight or obese category and those who were satisfied were in the healthy range
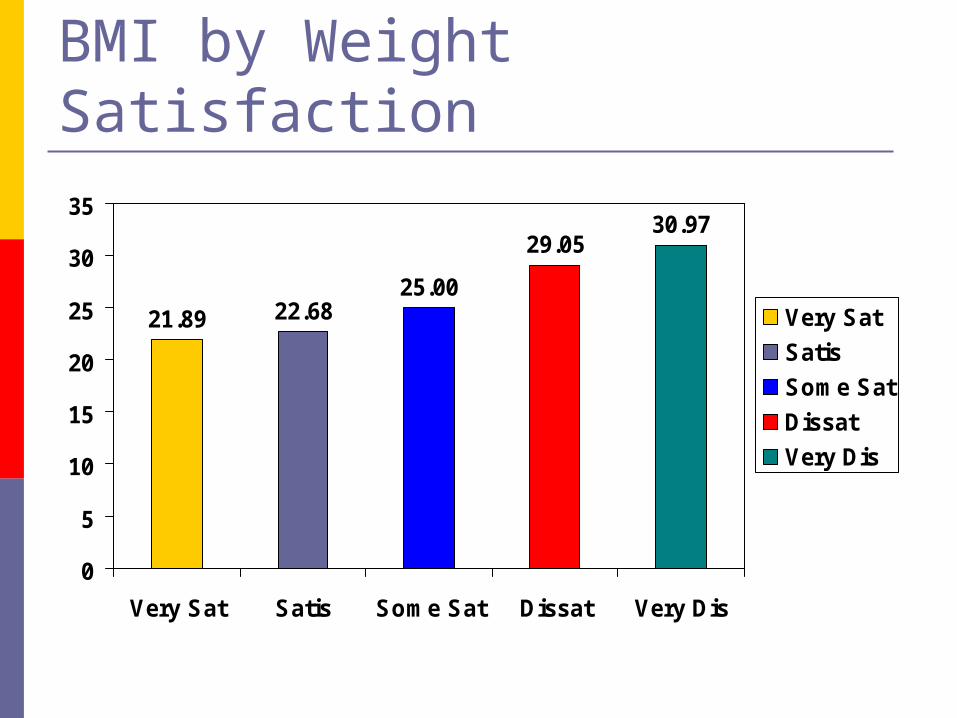
BMI by Weight Satisfaction
21.89 22.6825.00
29.0530.97
0
5
10
15
20
25
30
35
Very Sat Satis Some Sat Dissat Very Dis
Very SatSatisSome SatDissatVery Dis
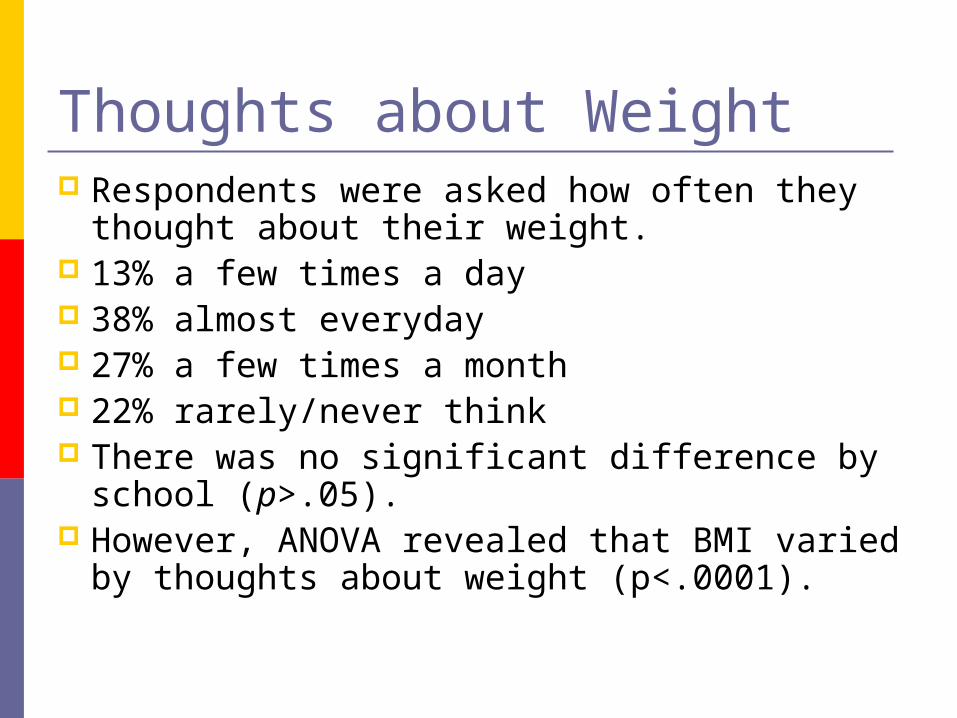
Thoughts about Weight Respondents were asked how often they
thought about their weight. 13% a few times a day 38% almost everyday 27% a few times a month 22% rarely/never think There was no significant difference by
school (p>.05). However, ANOVA revealed that BMI varied
by thoughts about weight (p<.0001).
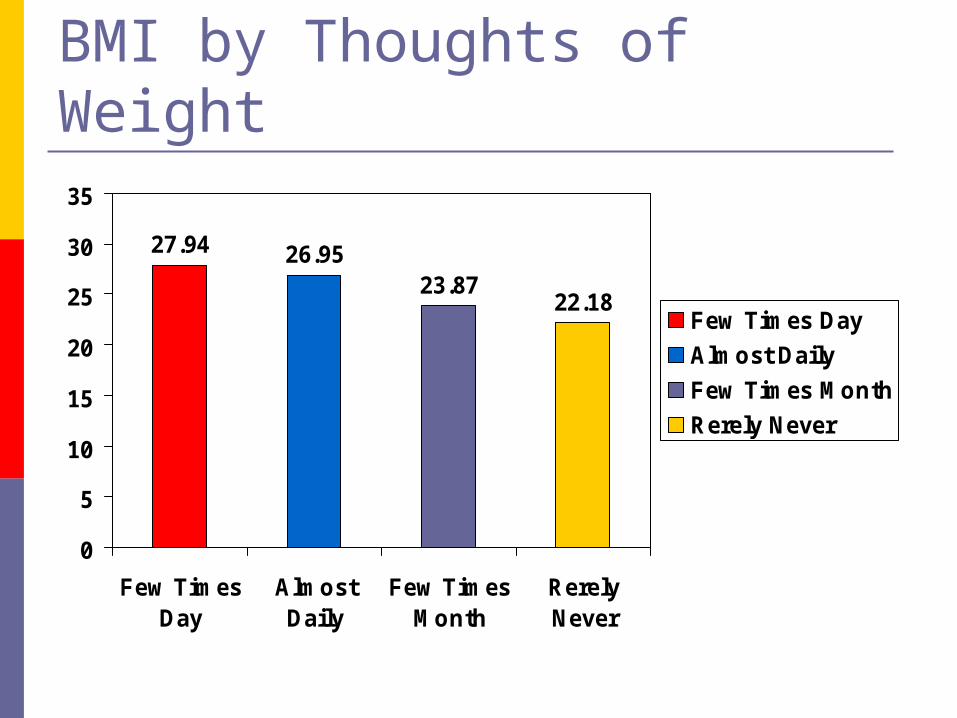
BMI by Thoughts of Weight
27.94 26.9523.87
22.18
0
5
10
15
20
25
30
35
Few TimesDay
AlmostDaily
Few TimesMonth
RerelyNever
Few Times DayAlmost DailyFew Times MonthRerely Never
Conclusion This study found few significant
differences in weight status and body satisfaction between African American college females attending a HBCU and a PWU.
Differences were due mainly to the demographic characteristics of the samples, particularly housing location.
Conclusion Mean BMI for participants was 25.24±5.56,
thus classifying them as being overweight.
However, further analysis by BMI category showed the majority (55%) had BMI in the healthy range. But, 25% of the respondent could be classified as overweight and 17% could be classified as obese
27% were very dissatisfied/dissatisfied and this was correlated with high BMI
Implications for College Health Consider the housing
arrangements, i.e. whether the off-campus students live alone, at home with relatives, or with roommates.
Need to specifically target students who live off campus
Implications for College Health Weight management programs
should focus on maintaining a healthy weight throughout the entire college career, not just during the freshmen year.
Study Limitations Convenient sample Self-selection bias Self reported weight and height BMI was used as the sole measure to
classify participants’ weight Small sample size. Larger sample may
have found more differences between schools