Embed Size (px)
Citation preview
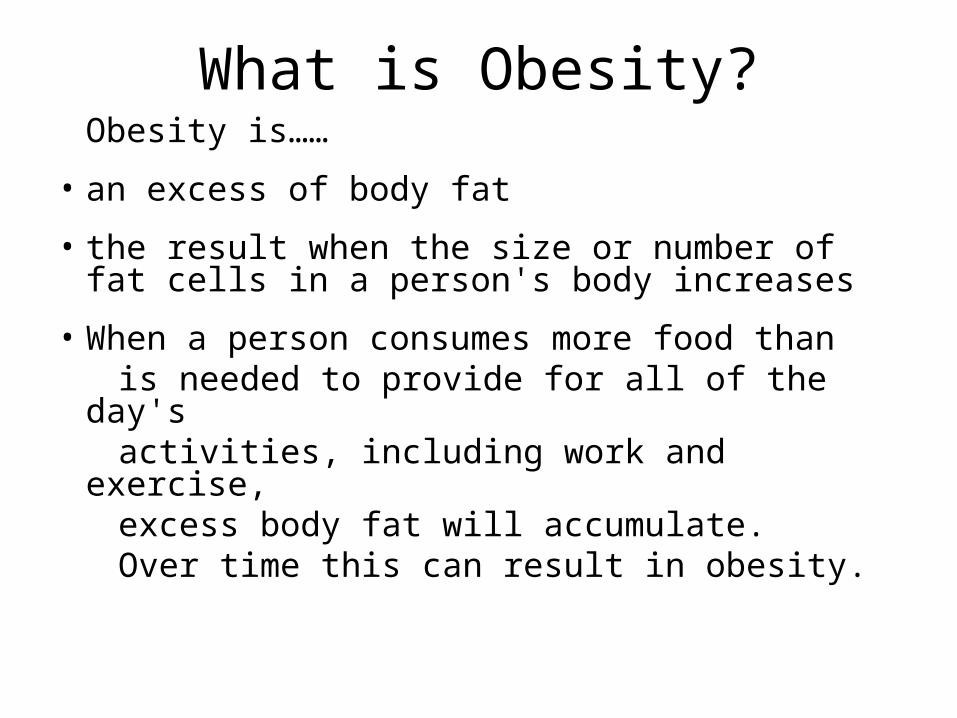
What is Obesity?Obesity is……
• an excess of body fat
• the result when the size or number of fat cells in a person's body increases
• When a person consumes more food than is needed to provide for all of the day's activities, including work and exercise, excess body fat will accumulate. Over time this can result in obesity.
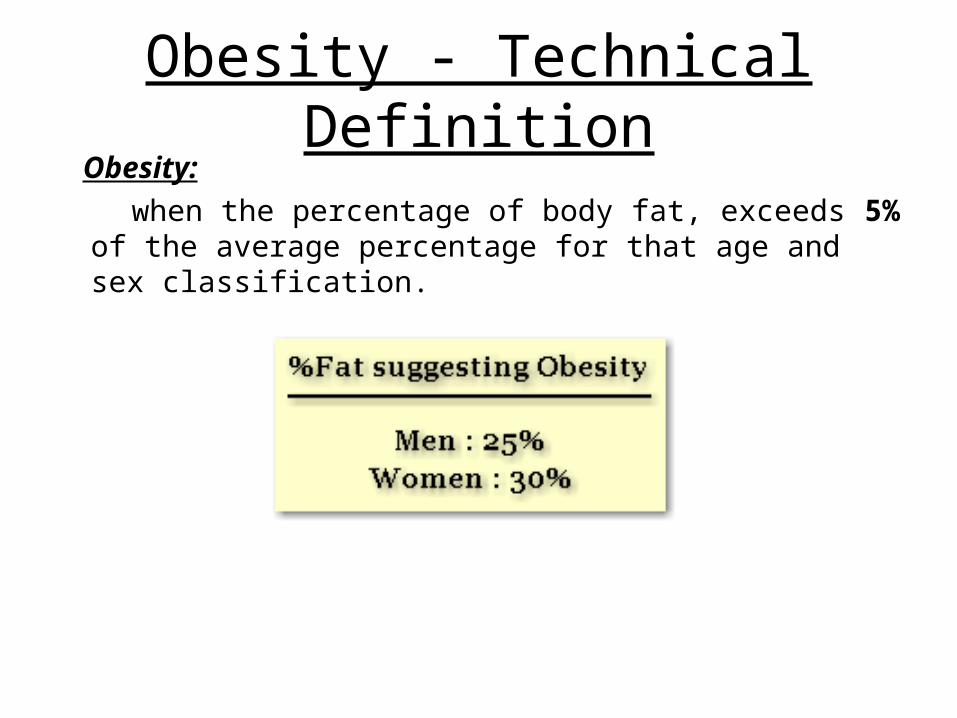
Obesity - Technical Definition Obesity:
when the percentage of body fat, exceeds 5% of the average percentage for that age and sex classification.
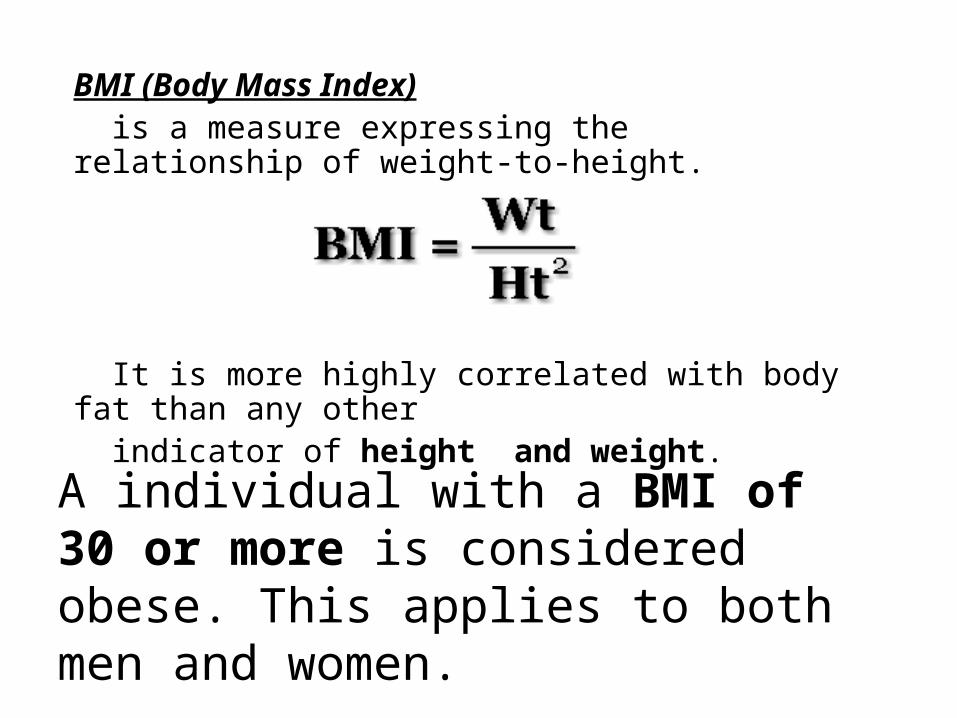
A individual with a BMI of 30 or more is considered obese. This applies to both men and women.
BMI (Body Mass Index)
is a measure expressing the relationship of weight-to-height.
It is more highly correlated with body fat than any other indicator of height and weight.
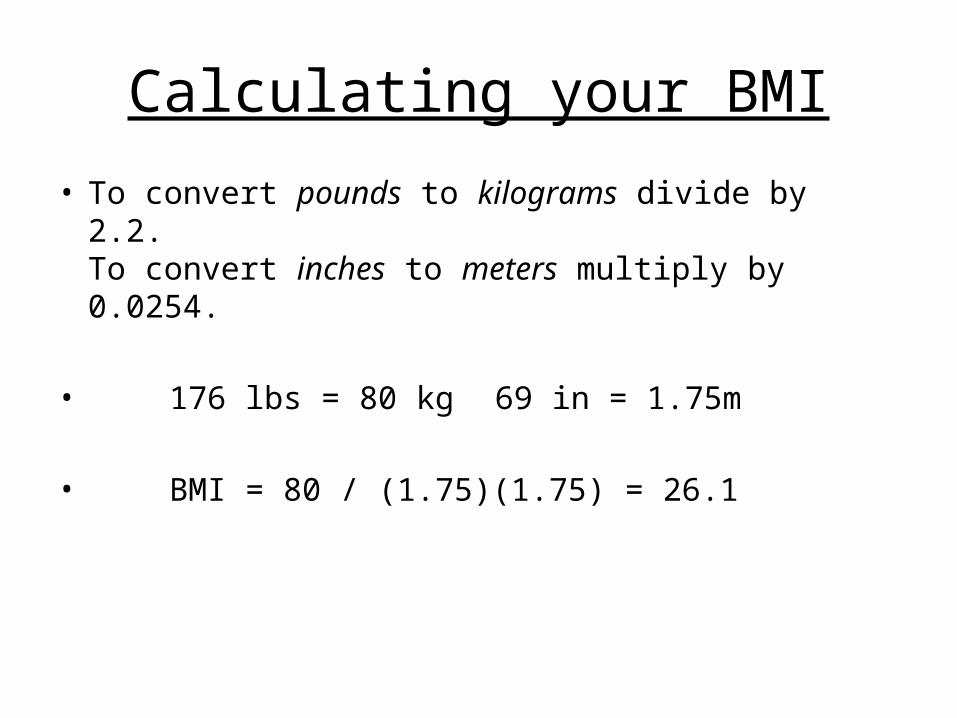
Calculating your BMI
• To convert pounds to kilograms divide by 2.2.To convert inches to meters multiply by 0.0254.
• 176 lbs = 80 kg 69 in = 1.75m
• BMI = 80 / (1.75)(1.75) = 26.1
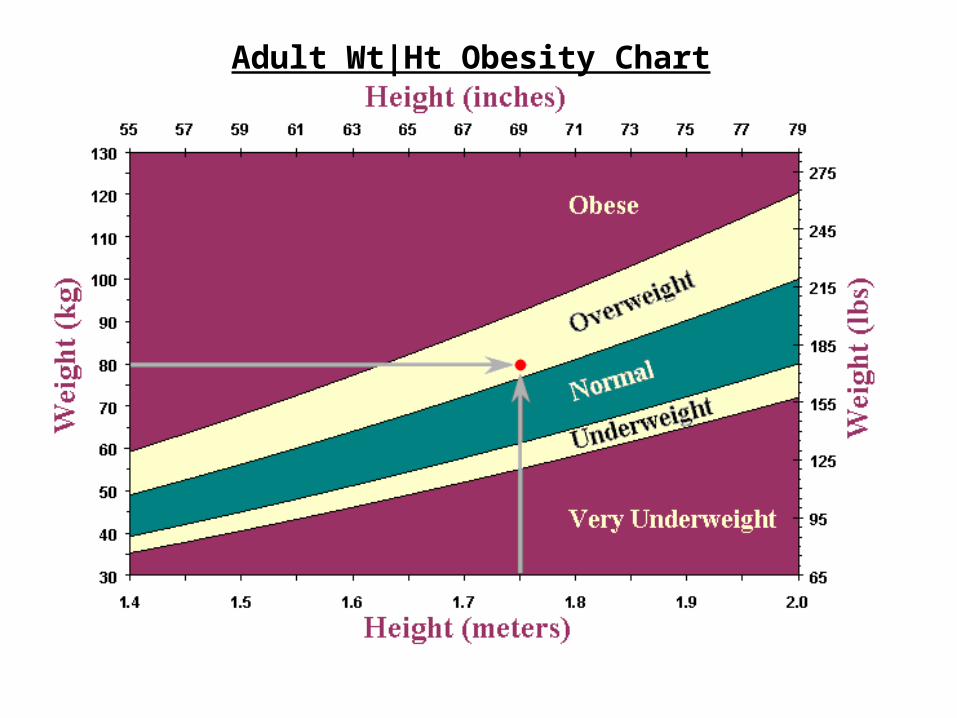
Adult Wt|Ht Obesity Chart
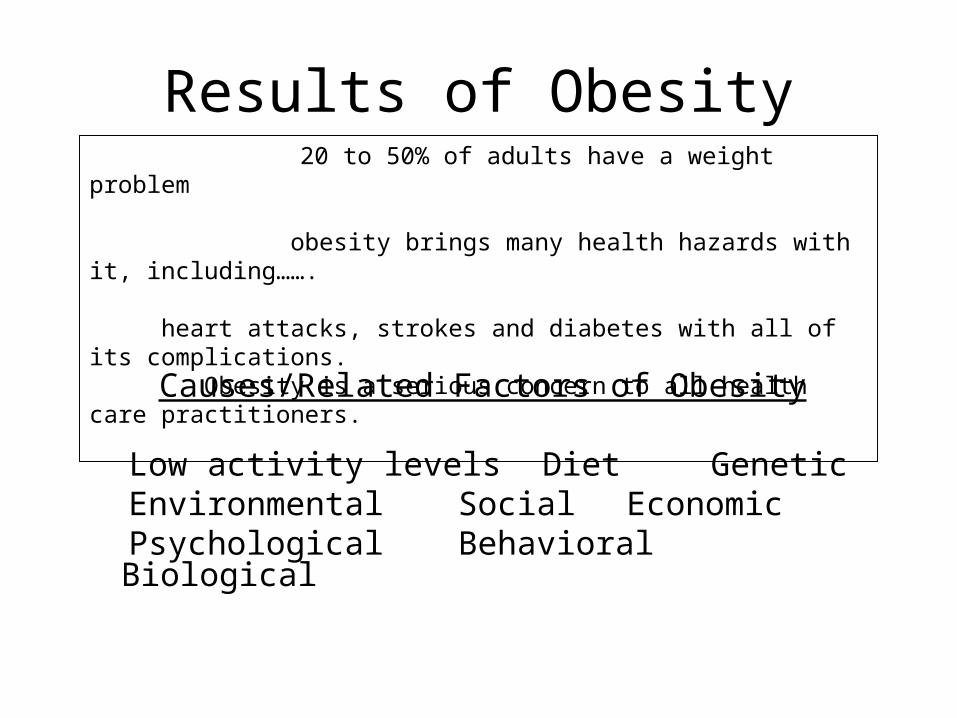
Results of Obesity
Causes/Related Factors of Obesity
Low activity levels Diet Genetic Environmental Social Economic Psychological Behavioral Biological
20 to 50% of adults have a weight problem
obesity brings many health hazards with it, including…….
heart attacks, strokes and diabetes with all of its complications. Obesity is a serious concern to all health care practitioners.
Hypotheses:• Obesity is on the rise in Canada in recent years
• Obesity is more prevalent in cities with a higher amount of fast food joints per capita
• Cities with a higher average income will have a lower percentage of obesity
• Cities whose population eats healthier will have a smaller percentage of obesity
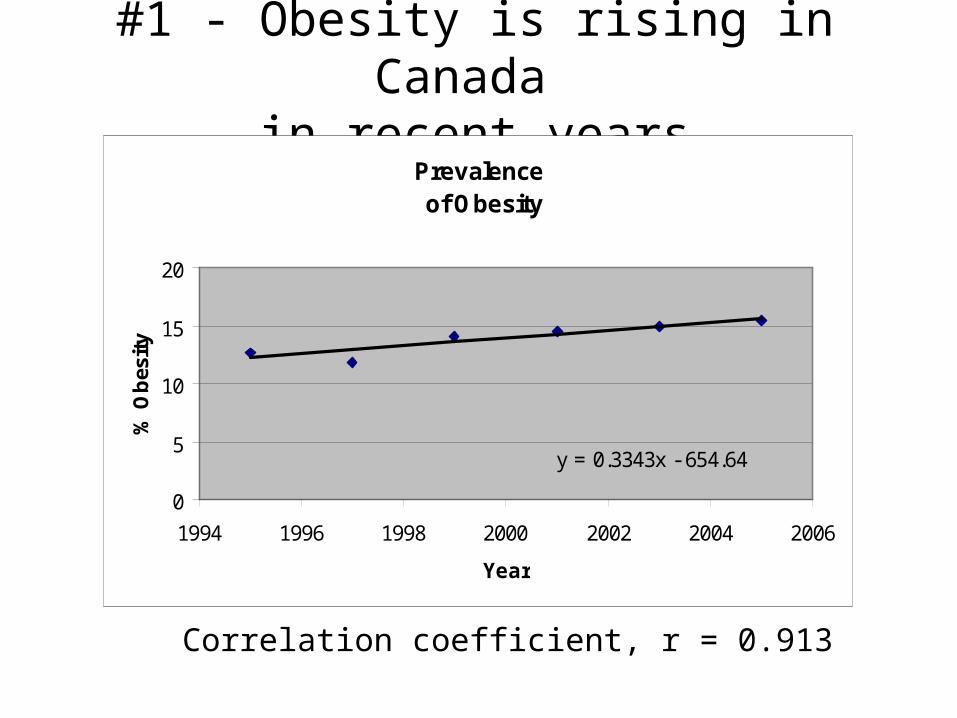
#1 - Obesity is rising in Canada in recent years
Prevalence of Obesity
y = 0.3343x - 654.64
0
5
10
15
20
1994 1996 1998 2000 2002 2004 2006
Year
% O
bes
ity
Correlation coefficient, r = 0.913
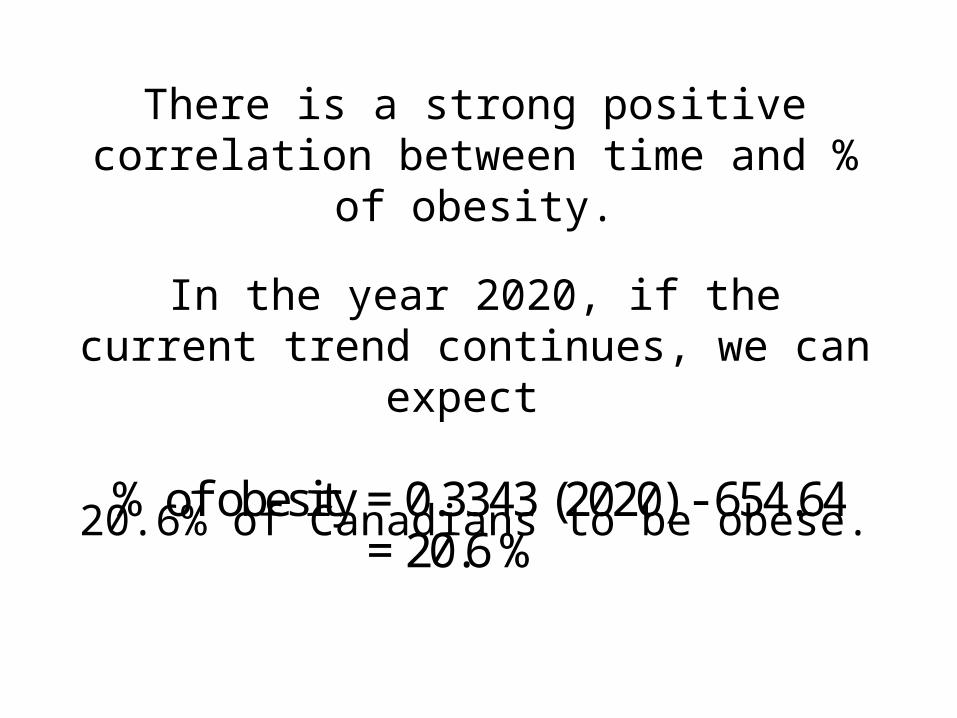
There is a strong positive correlation between time and % of obesity.
In the year 2020, if the current trend continues, we can expect
20.6% of Canadians to be obese.
% of obesity = 0.3343 (2020) - 654.64 = 20.6 %
#2 - Obesity is more prevalent in cities with a higher # of fast food joints per capita
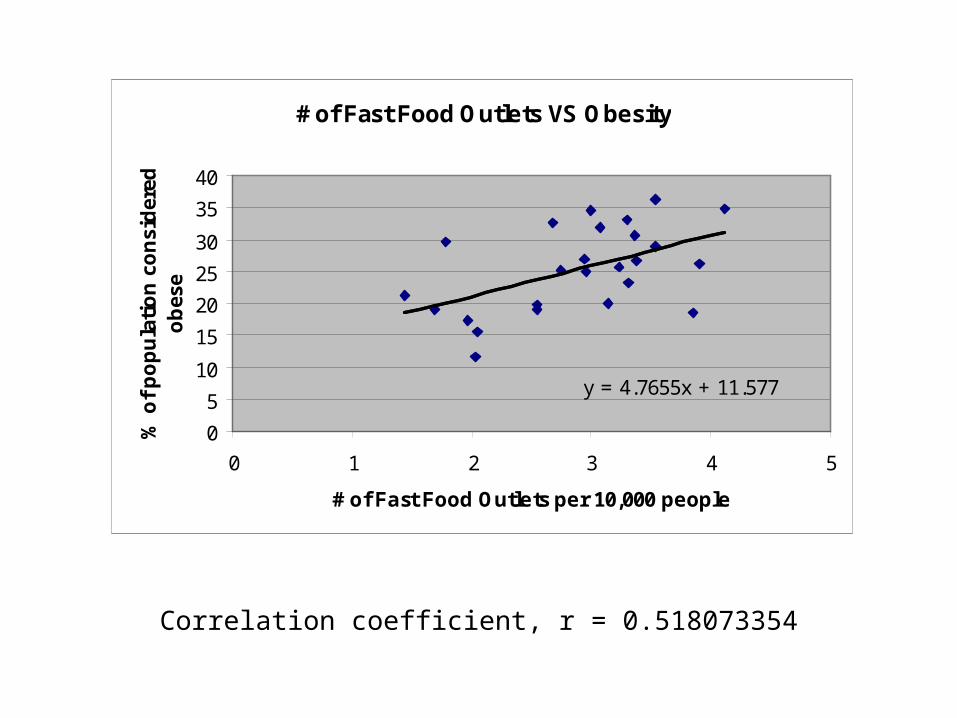
Correlation coefficient, r = 0.518073354
# of Fast Food Outlets VS Obesity
y = 4.7655x + 11.577
0
5
10
15
20
25
30
35
40
0 1 2 3 4 5
# of Fast Food Outlets per 10,000 people
% o
f p
op
ula
tio
n c
on
sid
ered
o
bes
e
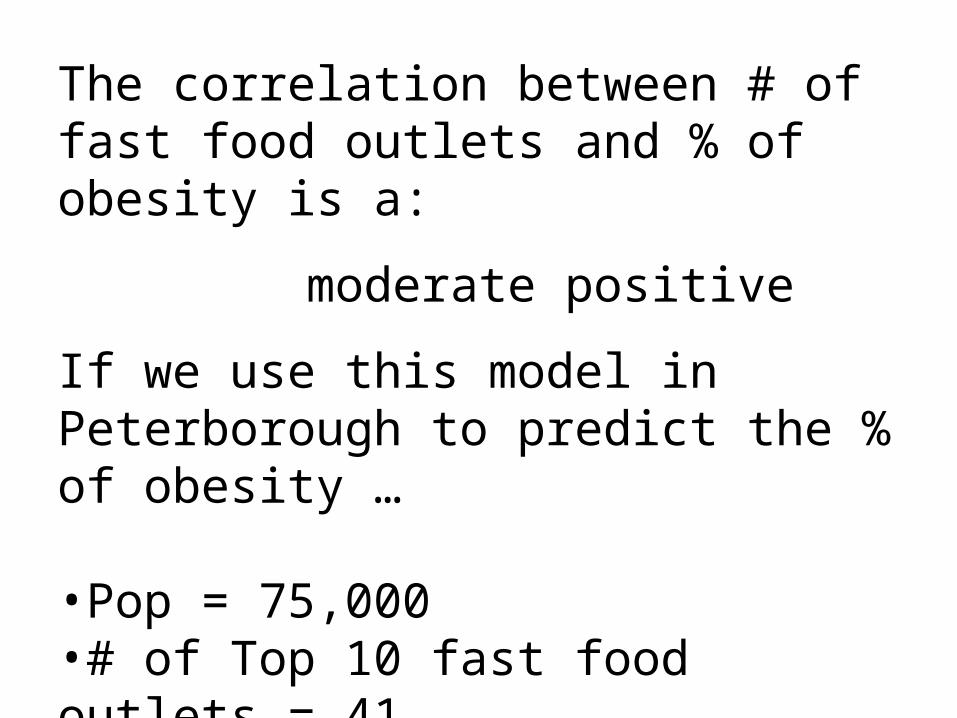
The correlation between # of fast food outlets and % of obesity is a:
moderate positive
If we use this model in Peterborough to predict the % of obesity …
•Pop = 75,000 •# of Top 10 fast food outlets = 41•So 5.47 ff outlets per 10,000 people
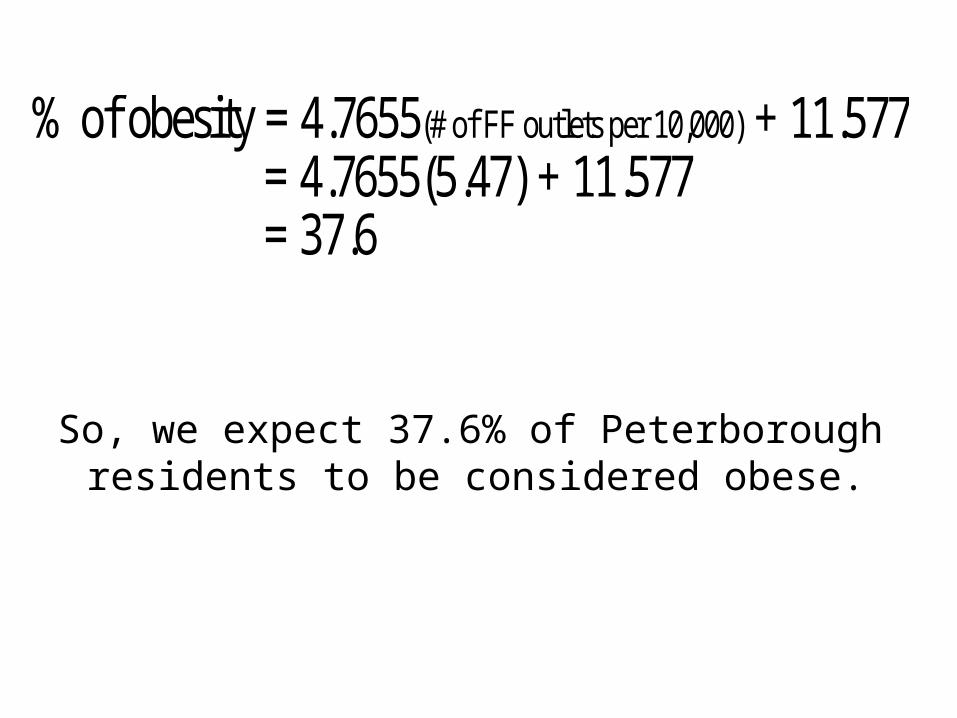
So, we expect 37.6% of Peterborough residents to be considered obese.
(# of FF outlets per 10,000)% of obesity = 4.7655 + 11.577 = 4.7655(5.47) + 11.577 = 37.6
#3 - Cities with a higher average income will have a lower
percentage of obesity
• I feel that most healthy foods are more expensive to buy, so those cities with a higher average income should be purchasing healthier foods and, as a result, have a lower percentage of obesity.
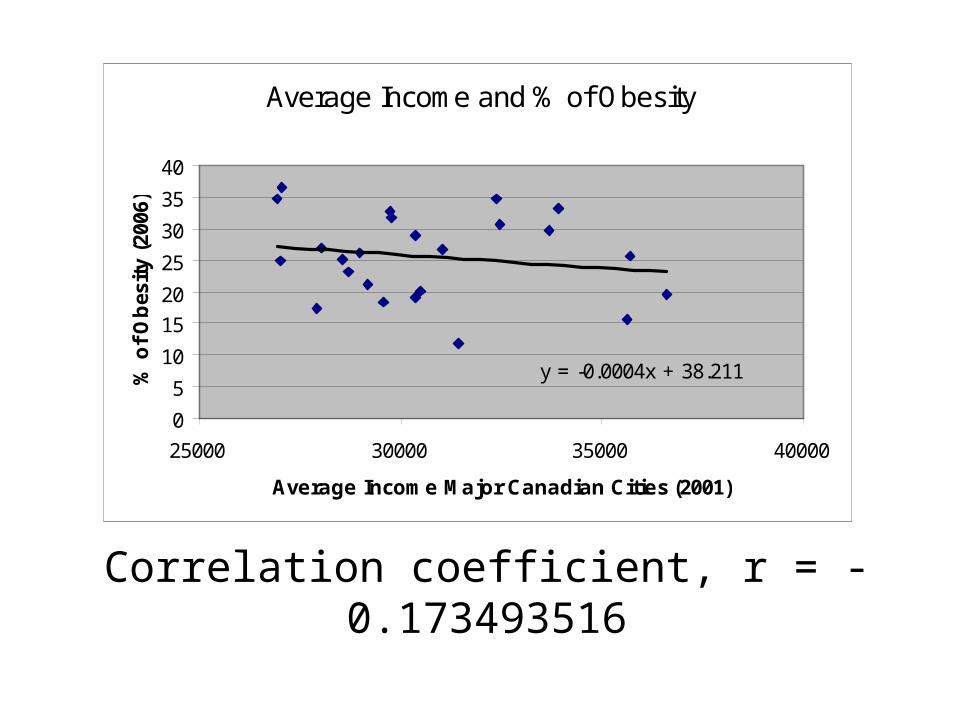
Correlation coefficient, r = -0.173493516
Average Income and % of Obesity
y = -0.0004x + 38.211
0
5
10
15
20
25
30
35
40
25000 30000 35000 40000
Average Income Major Canadian Cities (2001)
% o
f O
bes
ity
(200
6)
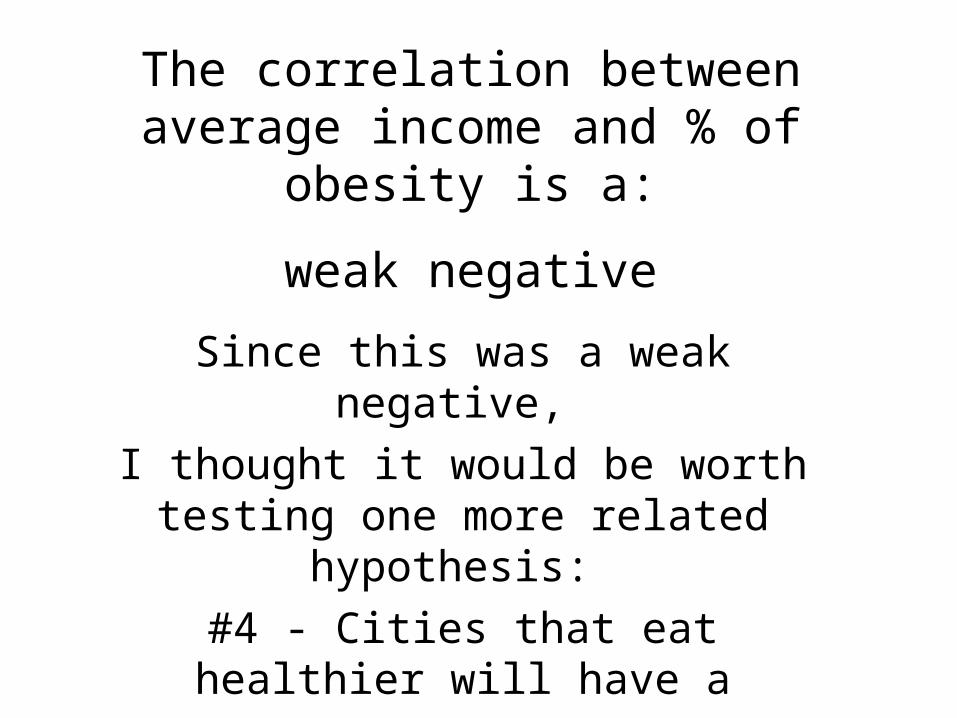
The correlation between average income and % of obesity is a:
weak negative
Since this was a weak negative,
I thought it would be worth testing one more related hypothesis:
#4 - Cities that eat healthier will have a
smaller percentage of obesity
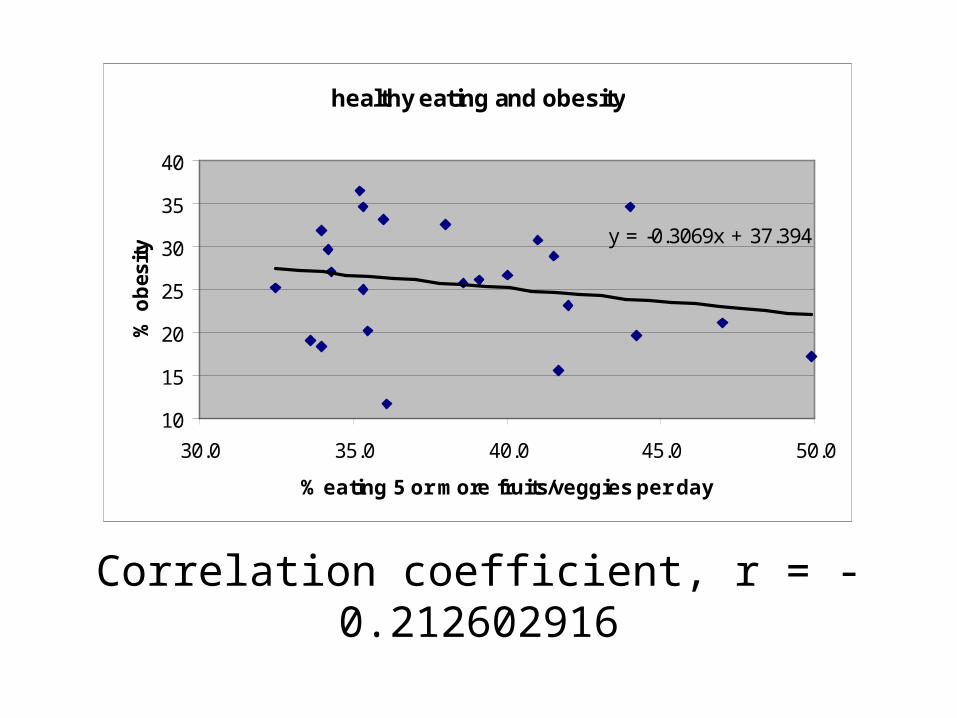
Correlation coefficient, r = -0.212602916
healthy eating and obesity
y = -0.3069x + 37.394
10
15
20
25
30
35
40
30.0 35.0 40.0 45.0 50.0
% eating 5 or more fruits/veggies per day
% o
bes
ity
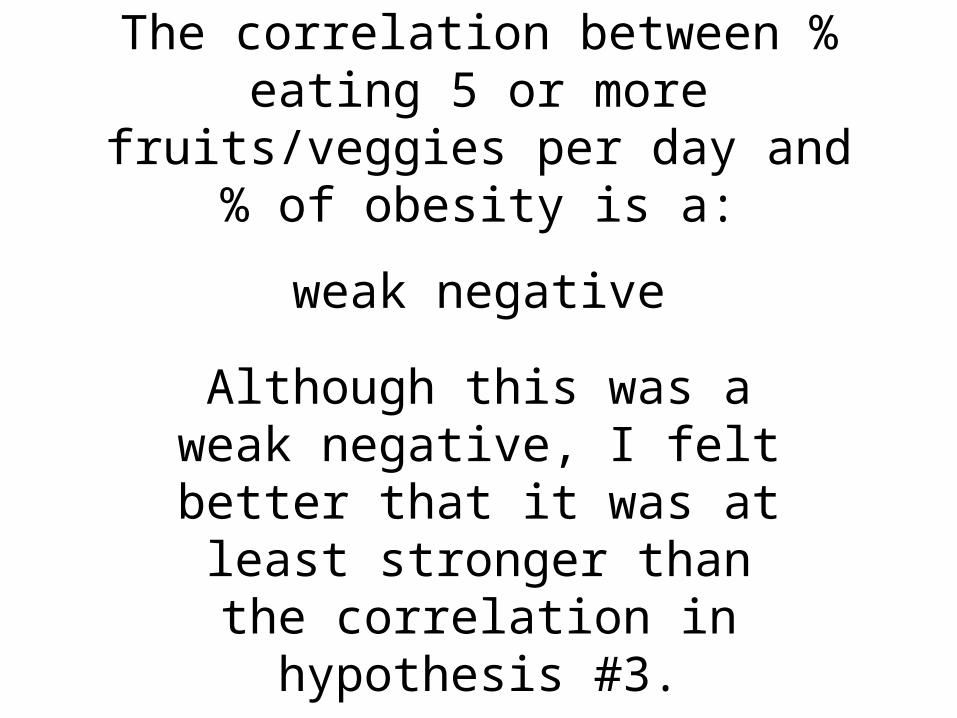
The correlation between % eating 5 or more fruits/veggies per day and %
of obesity is a:
weak negative
Although this was a weak negative, I felt better that it
was at least stronger than the correlation in hypothesis #3.
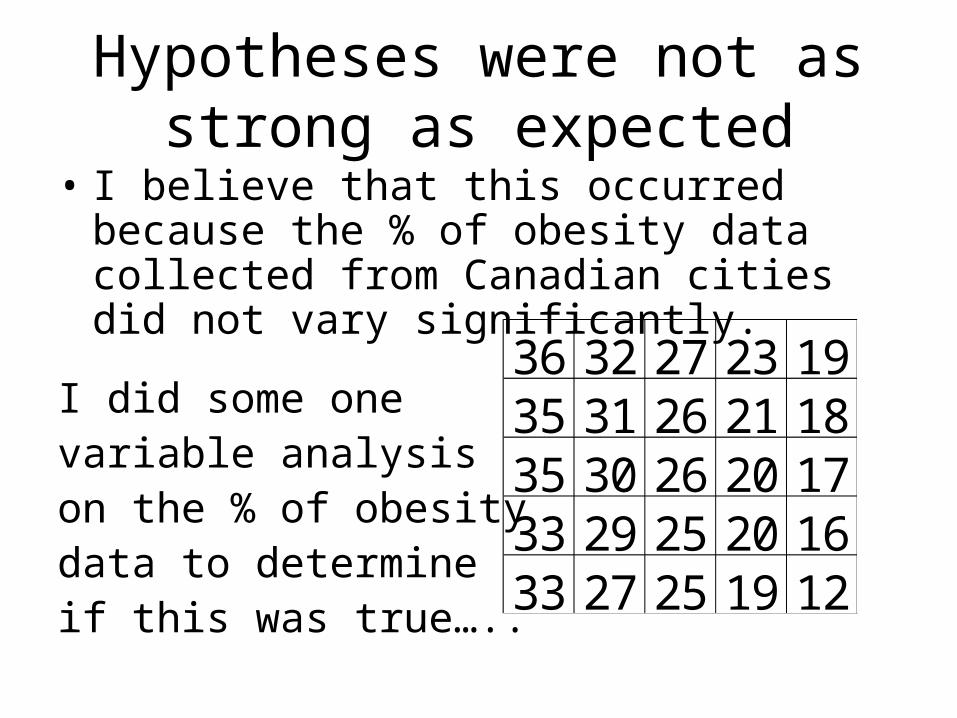
Hypotheses were not as strong as expected
• I believe that this occurred because the % of obesity data collected from Canadian cities did not vary significantly.
I did some one variable analysis on the % of obesity data to determine if this was true…..
36 32 27 23 1935 31 26 21 1835 30 26 20 1733 29 25 20 1633 27 25 19 12
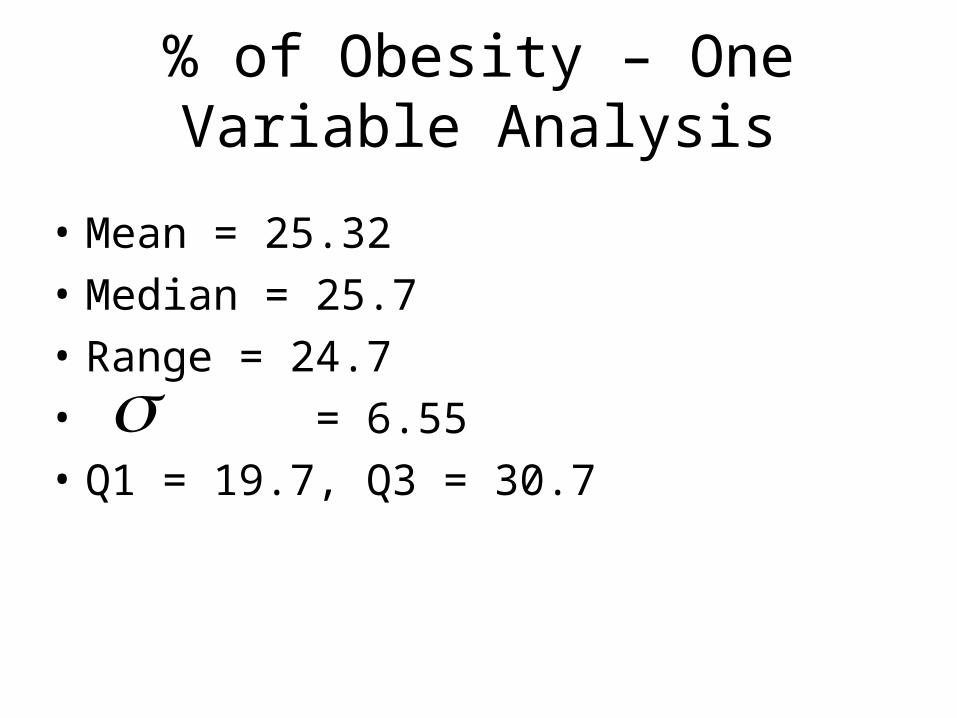
% of Obesity – One Variable Analysis
• Mean = 25.32
• Median = 25.7
• Range = 24.7
• = 6.55
• Q1 = 19.7, Q3 = 30.7
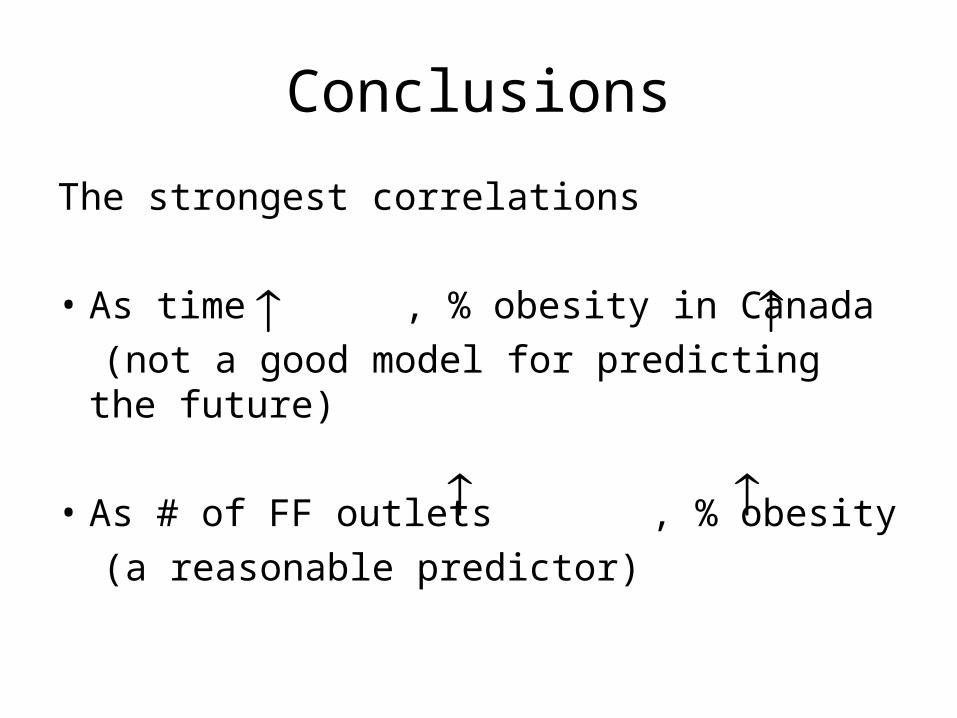
Conclusions
The strongest correlations
• As time , % obesity in Canada
(not a good model for predicting the future)
• As # of FF outlets , % obesity
(a reasonable predictor)
Conclusions (cont.)
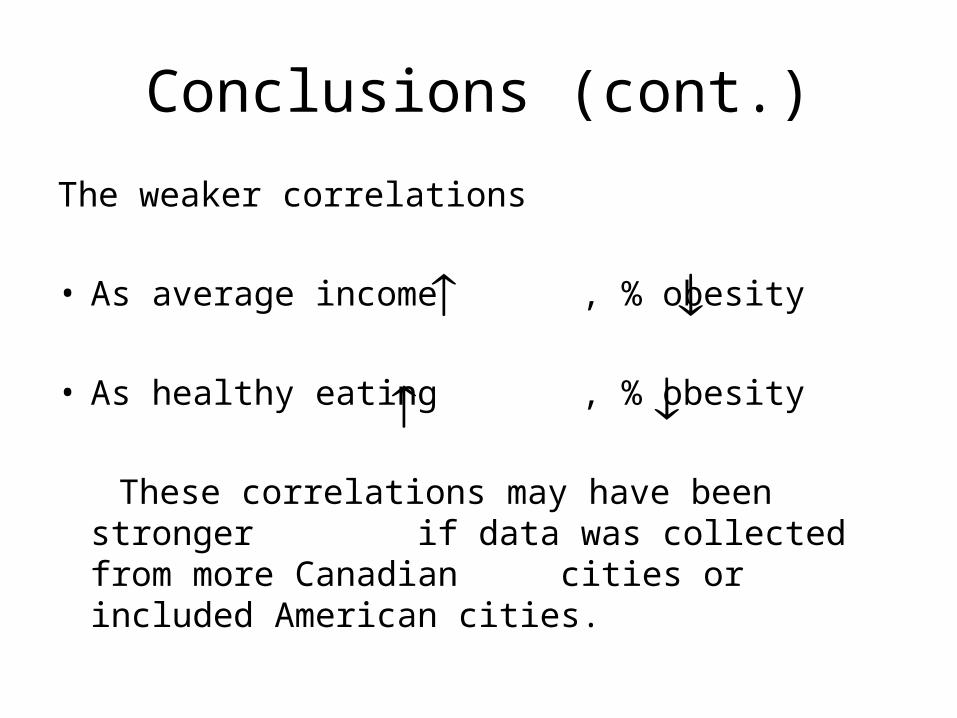
The weaker correlations
• As average income , % obesity
• As healthy eating , % obesity
These correlations may have been stronger if data was collected from more Canadian cities or included American cities.
References
• http://www.obesitycanada.com/
• http://www.statscan.com/

Questions ???