Embed Size (px)
Citation preview
Obesity and Socioeconomic Status: Do Causal Arrows Point in Both
Directions?
John CawleyCornell University, University of Sydney
and NBER
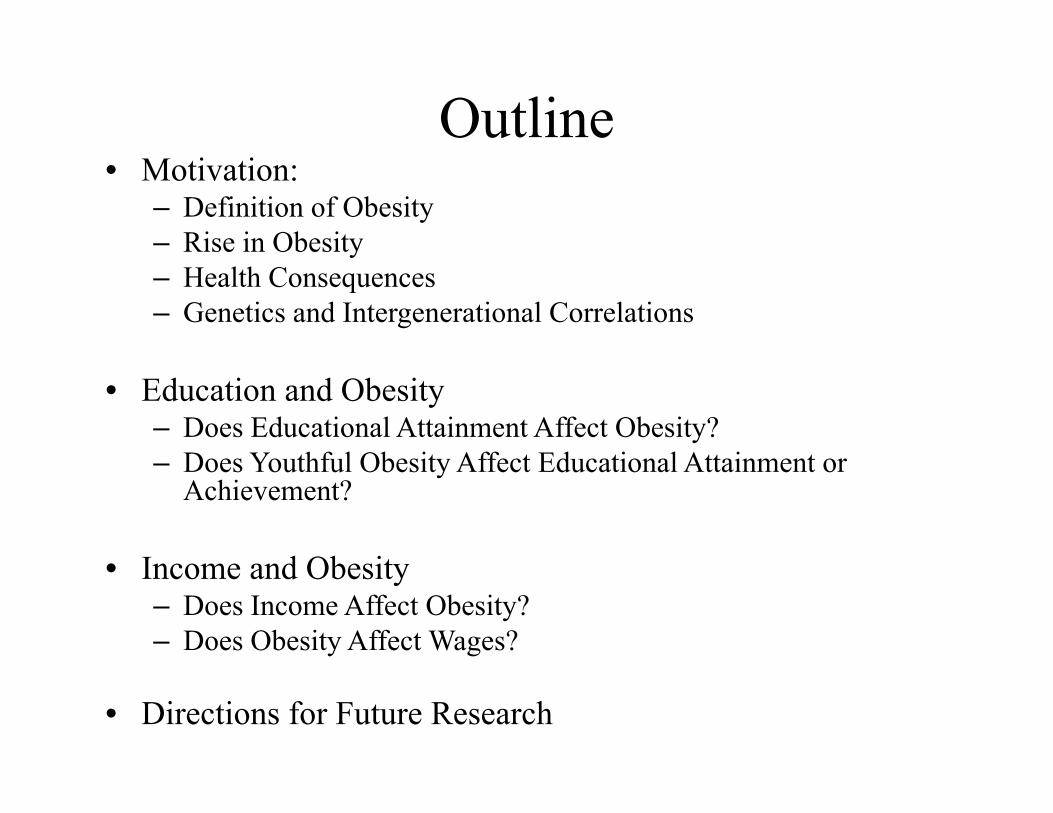
Outline• Motivation:
– Definition of Obesity– Rise in Obesity– Health Consequences– Genetics and Intergenerational Correlations
• Education and Obesity– Does Educational Attainment Affect Obesity?– Does Youthful Obesity Affect Educational Attainment or
Achievement?
• Income and Obesity– Does Income Affect Obesity?– Does Obesity Affect Wages?
• Directions for Future Research
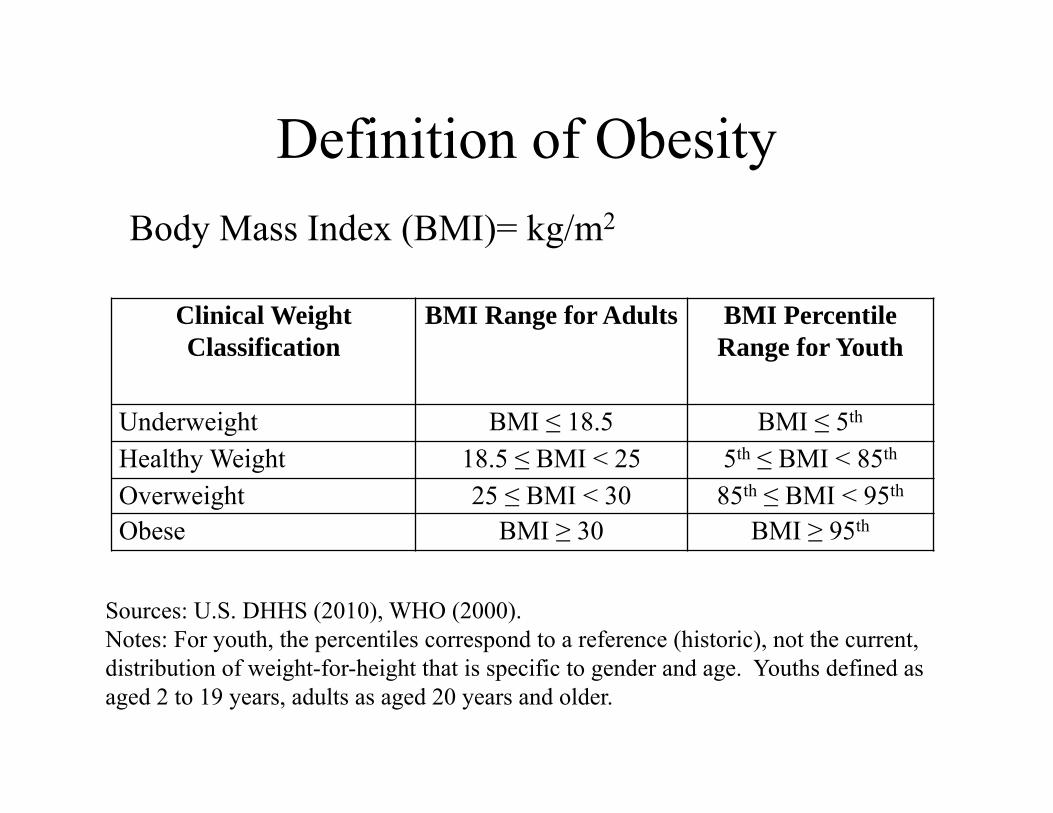
Definition of Obesity
Clinical Weight Classification
BMI Range for Adults BMI Percentile Range for Youth
Underweight BMI ≤ 18.5 BMI ≤ 5th
Healthy Weight 18.5 ≤ BMI < 25 5th ≤ BMI < 85th
Overweight 25 ≤ BMI < 30 85th ≤ BMI < 95th
Obese BMI ≥ 30 BMI ≥ 95th
Sources: U.S. DHHS (2010), WHO (2000).Notes: For youth, the percentiles correspond to a reference (historic), not the current, distribution of weight-for-height that is specific to gender and age. Youths defined as aged 2 to 19 years, adults as aged 20 years and older.
Body Mass Index (BMI)= kg/m2
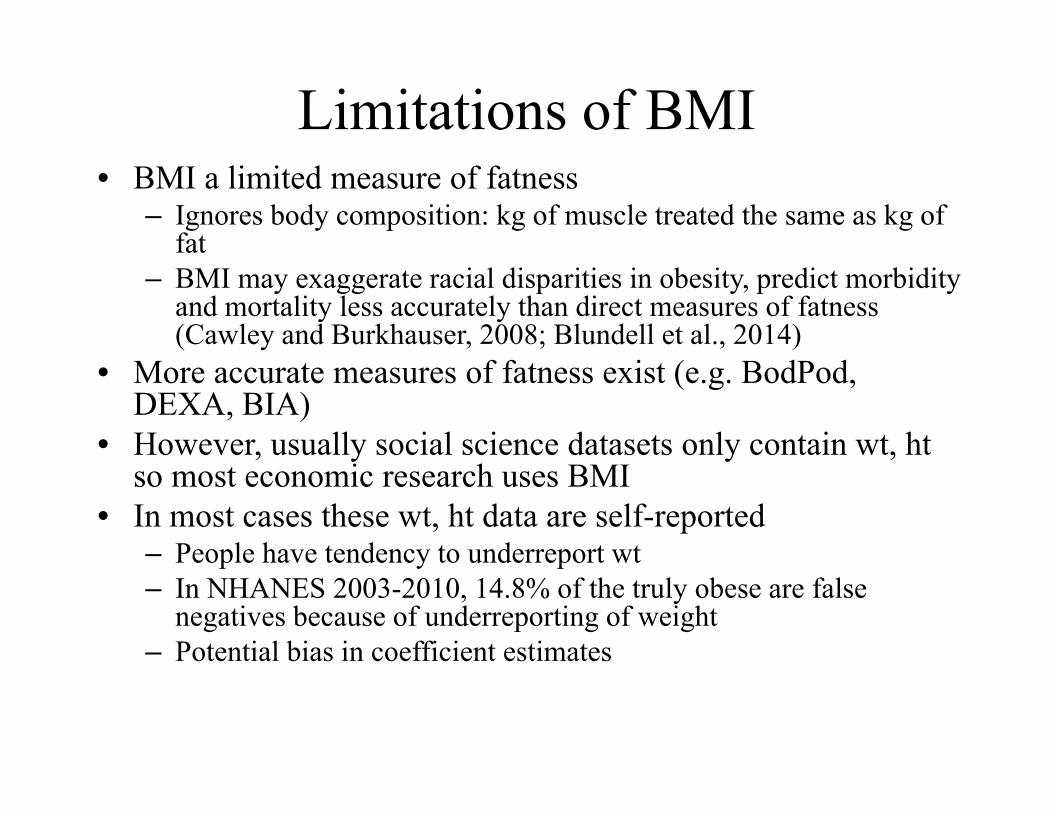
Limitations of BMI• BMI a limited measure of fatness
– Ignores body composition: kg of muscle treated the same as kg of fat
– BMI may exaggerate racial disparities in obesity, predict morbidity and mortality less accurately than direct measures of fatness (Cawley and Burkhauser, 2008; Blundell et al., 2014)
• More accurate measures of fatness exist (e.g. BodPod, DEXA, BIA)
• However, usually social science datasets only contain wt, htso most economic research uses BMI
• In most cases these wt, ht data are self-reported– People have tendency to underreport wt– In NHANES 2003-2010, 14.8% of the truly obese are false
negatives because of underreporting of weight– Potential bias in coefficient estimates
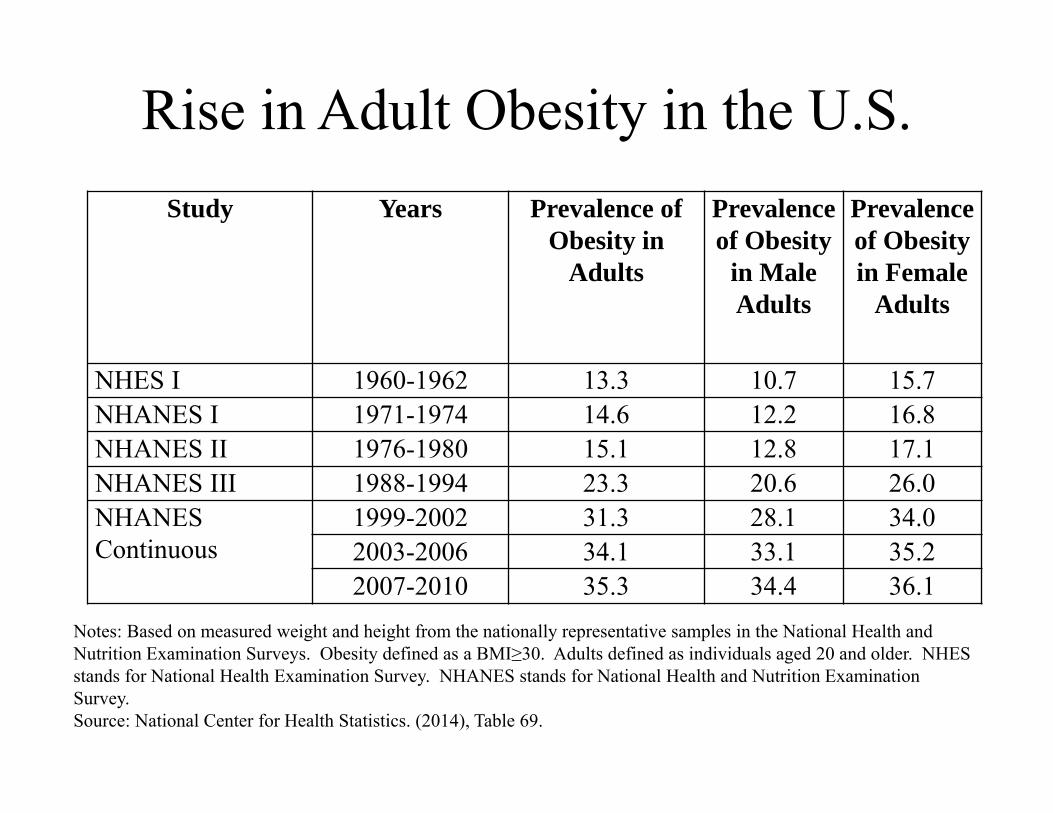
Rise in Adult Obesity in the U.S.Study Years Prevalence of
Obesity in Adults
Prevalence of Obesity
in Male Adults
Prevalence of Obesity in Female
Adults
NHES I 1960-1962 13.3 10.7 15.7NHANES I 1971-1974 14.6 12.2 16.8NHANES II 1976-1980 15.1 12.8 17.1NHANES III 1988-1994 23.3 20.6 26.0NHANES Continuous
1999-2002 31.3 28.1 34.02003-2006 34.1 33.1 35.22007-2010 35.3 34.4 36.1
Notes: Based on measured weight and height from the nationally representative samples in the National Health and Nutrition Examination Surveys. Obesity defined as a BMI≥30. Adults defined as individuals aged 20 and older. NHES stands for National Health Examination Survey. NHANES stands for National Health and Nutrition Examination Survey.Source: National Center for Health Statistics. (2014), Table 69.
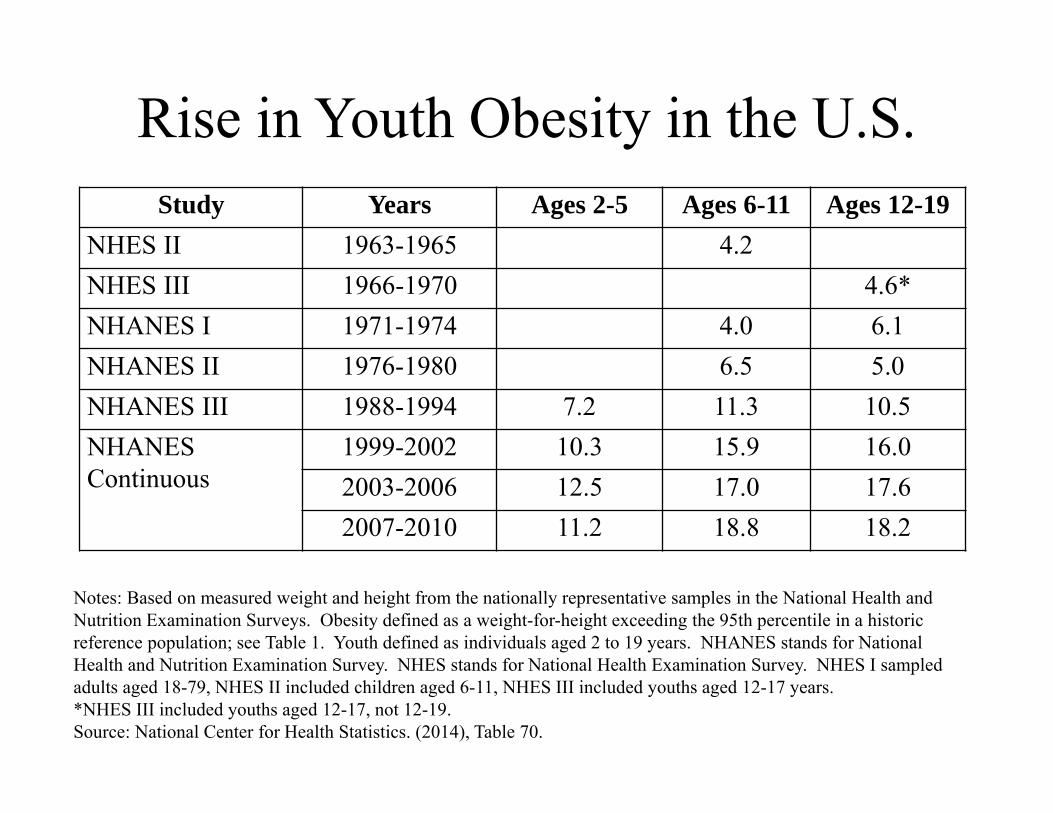
Rise in Youth Obesity in the U.S.
Notes: Based on measured weight and height from the nationally representative samples in the National Health and Nutrition Examination Surveys. Obesity defined as a weight-for-height exceeding the 95th percentile in a historic reference population; see Table 1. Youth defined as individuals aged 2 to 19 years. NHANES stands for National Health and Nutrition Examination Survey. NHES stands for National Health Examination Survey. NHES I sampled adults aged 18-79, NHES II included children aged 6-11, NHES III included youths aged 12-17 years.*NHES III included youths aged 12-17, not 12-19.Source: National Center for Health Statistics. (2014), Table 70.
Study Years Ages 2-5 Ages 6-11 Ages 12-19NHES II 1963-1965 4.2NHES III 1966-1970 4.6*NHANES I 1971-1974 4.0 6.1NHANES II 1976-1980 6.5 5.0NHANES III 1988-1994 7.2 11.3 10.5NHANES Continuous
1999-2002 10.3 15.9 16.02003-2006 12.5 17.0 17.62007-2010 11.2 18.8 18.2
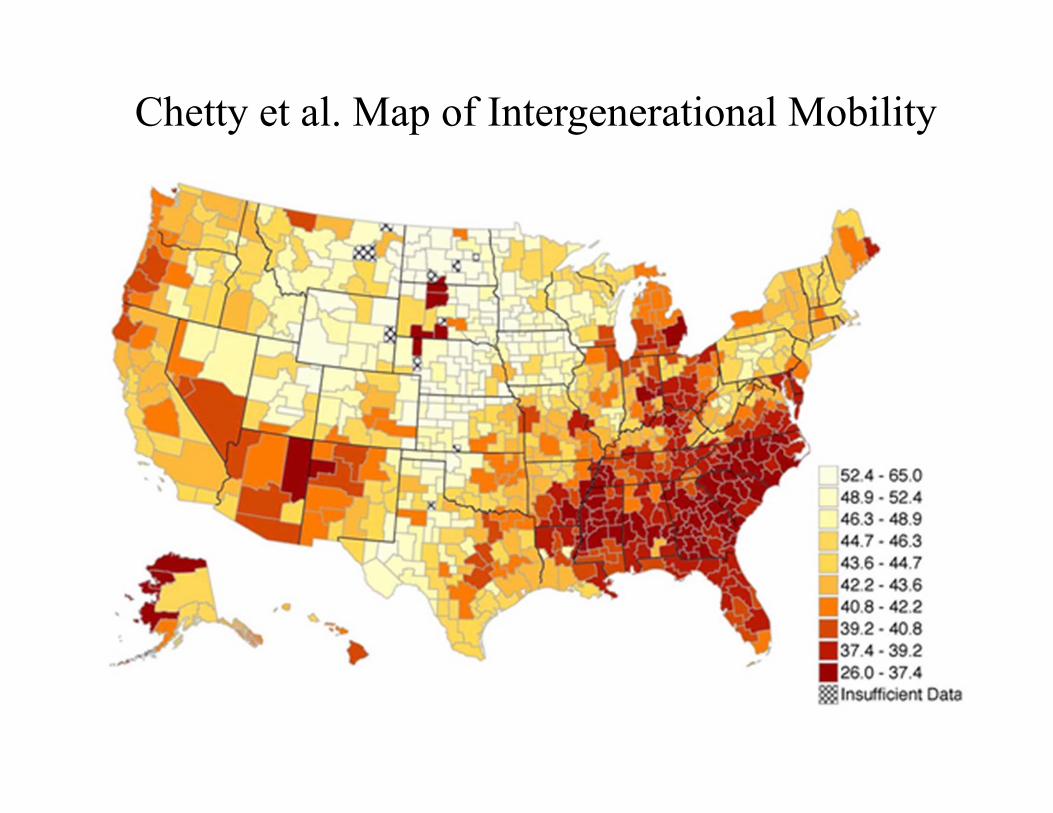
Chetty et al. Map of Intergenerational Mobility
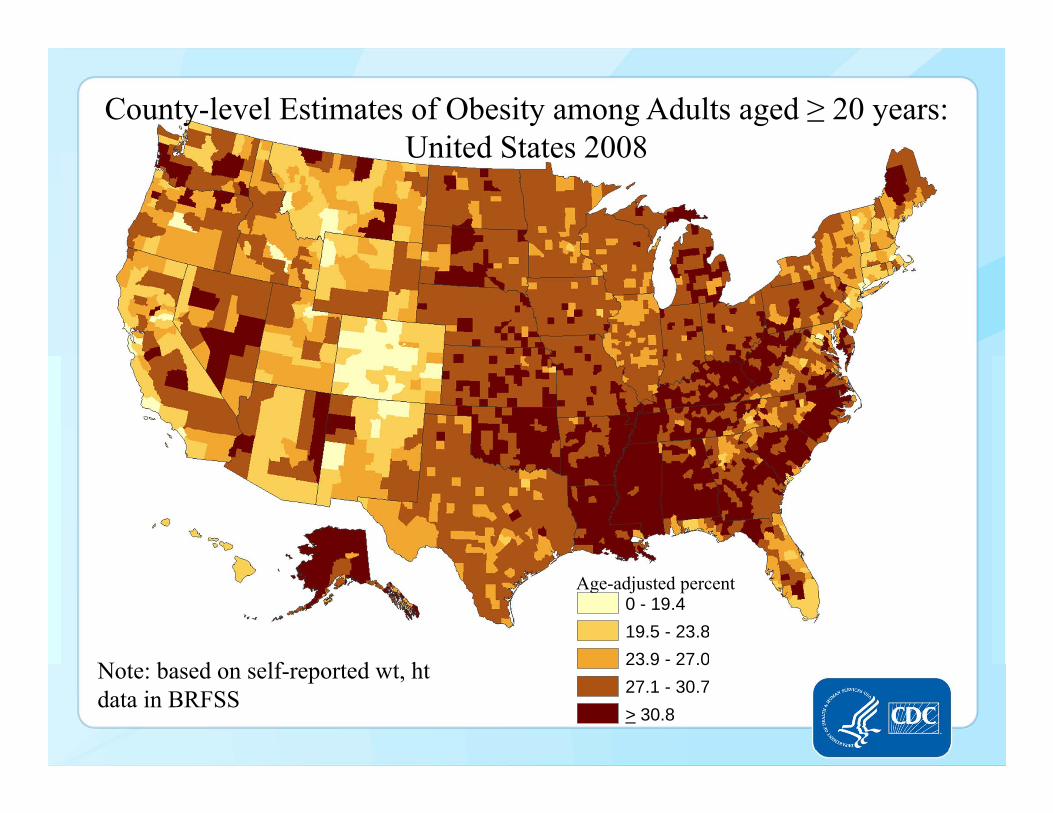
Age-adjusted percent0 - 19.419.5 - 23.823.9 - 27.027.1 - 30.7> 30.8
County-level Estimates of Obesity among Adults aged ≥ 20 years: United States 2008
Note: based on self-reported wt, htdata in BRFSS
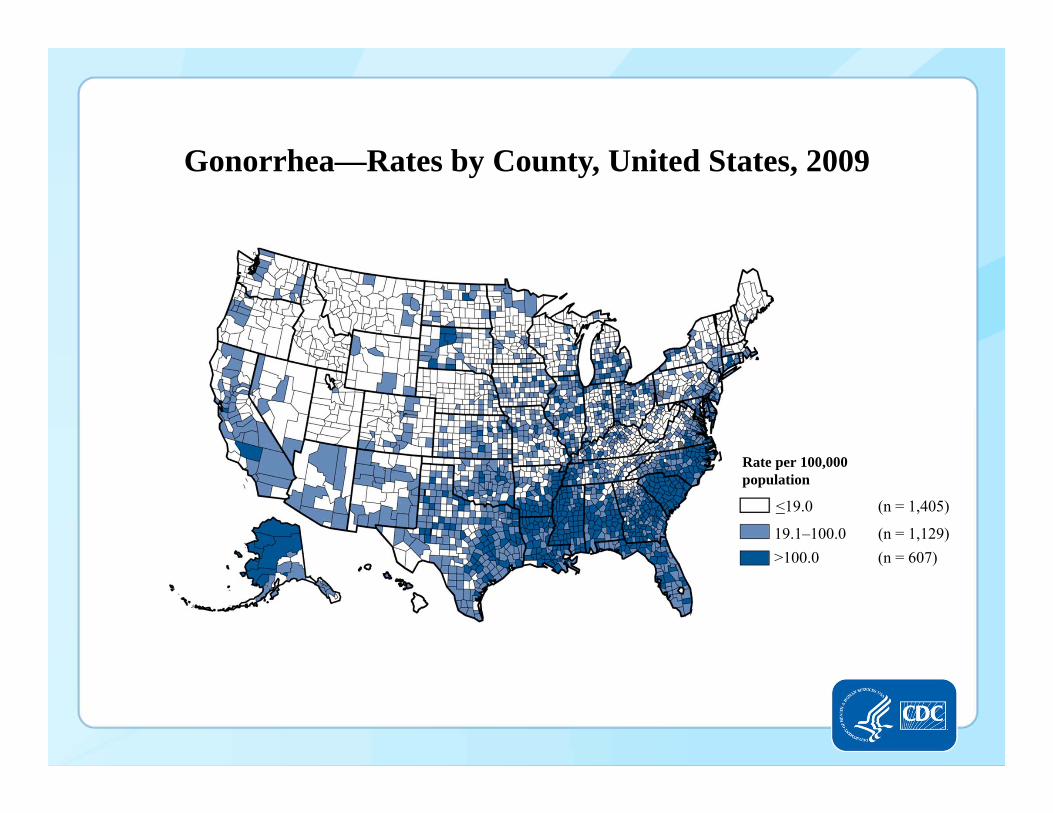
Gonorrhea—Rates by County, United States, 2009
<19.0 (n = 1,405)
Rate per 100,000population
19.1–100.0 (n = 1,129)>100.0 (n = 607)
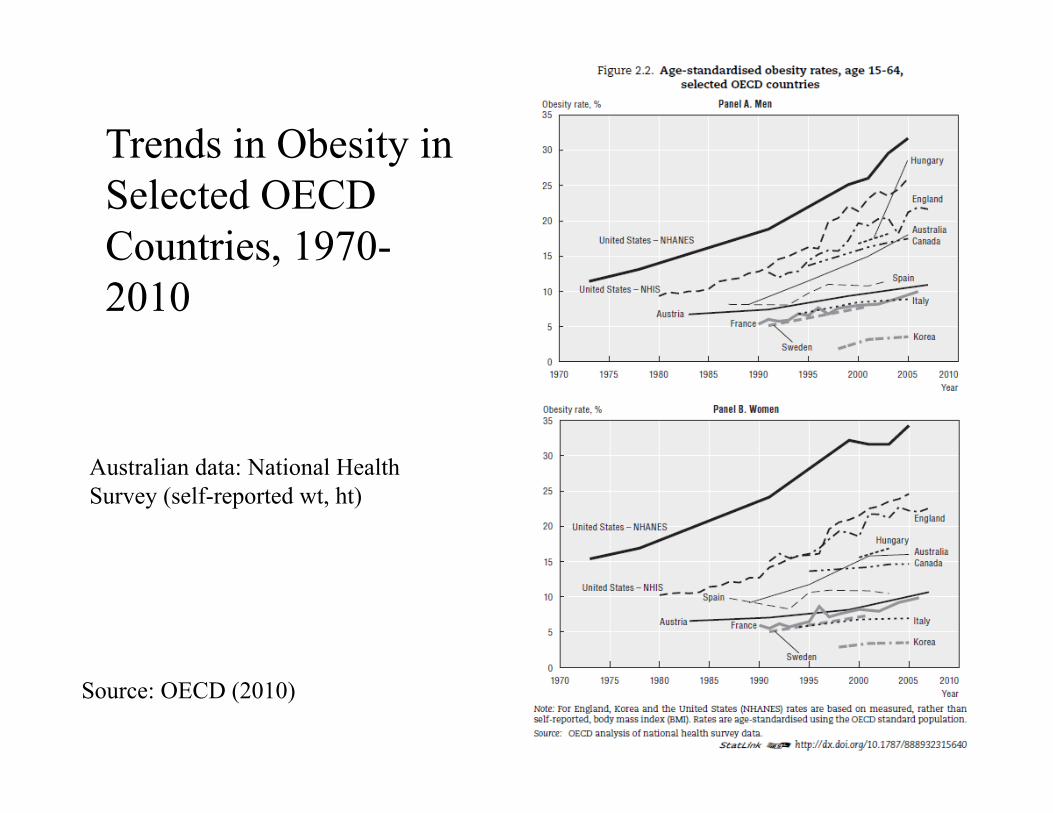
Trends in Obesity in Selected OECD Countries, 1970-2010
Source: OECD (2010)
Australian data: National Health Survey (self-reported wt, ht)
Health Consequences of Obesity
• Raises risk of Type II diabetes, cardiovascular disease, and cancer (Hu, 2008)– Obesity responsible for 61% of all Type II diabetes, 17.3%
of all CVD, 24% of all osteoarthritis, 42.5% of all kidney cancer…(Eckel, 2003; Calle and Kaaks, 2004)
• Obesity responsible for 2.8 million deaths/yrworldwide (WHO, 2010)
Genetics and Intergenerational Correlation
• Twin studies estimate that weight is 40-70% genetic (e.g. Stunkard et al., 1986)– But all discovered polymorphisms explain less than 2% of
variation in obesity (Winter et al., 2013)• Intergenerational correlation of obesity (Whitaker et al.
2009):– Two obese parents: OR=12.0 for child to be obese– Two severely obese parents: OR=22.3– Intergenerational correlation .27 for mothers, .23 for fathers
• Twin and adoption studies indicate that shared family environment has negligible effect on weight (Hewitt, 1997; Grilo and Pogue-Geile, 1991; Maes et al., 1997)
Does Education Affect Obesity?
• Basic correlations
• Possible mechanisms
• Evidence on causal effects
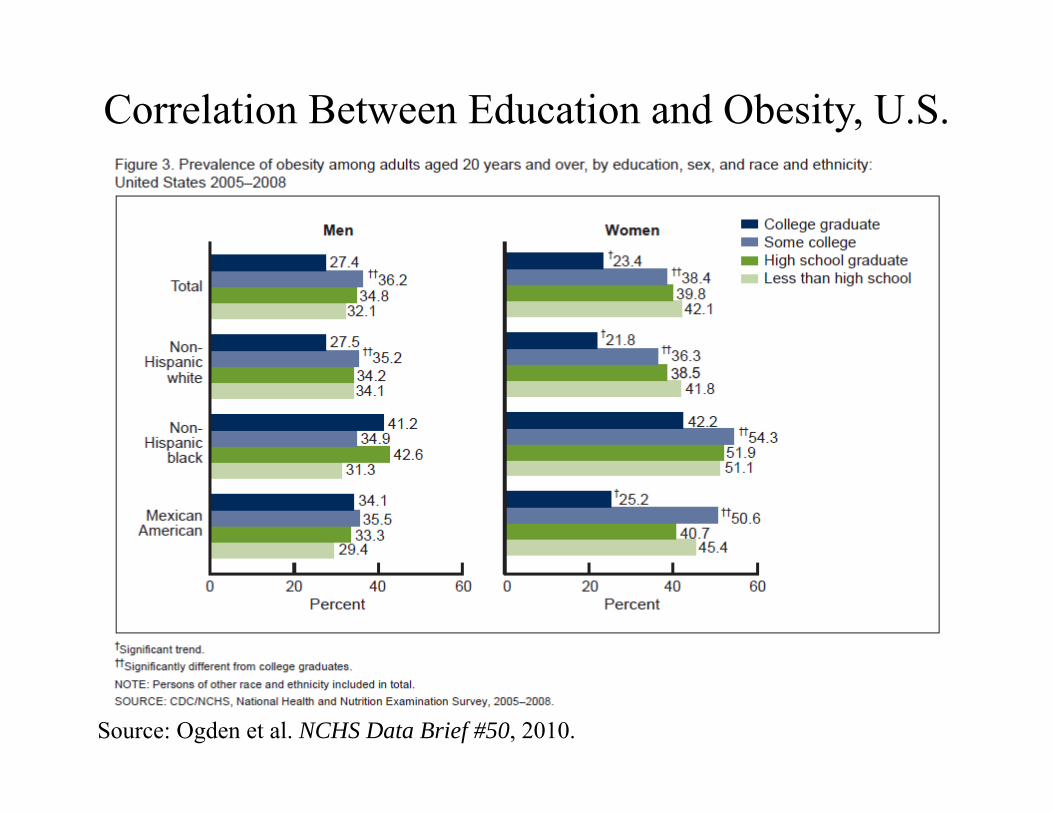
Correlation Between Education and Obesity, U.S.
Source: Ogden et al. NCHS Data Brief #50, 2010.
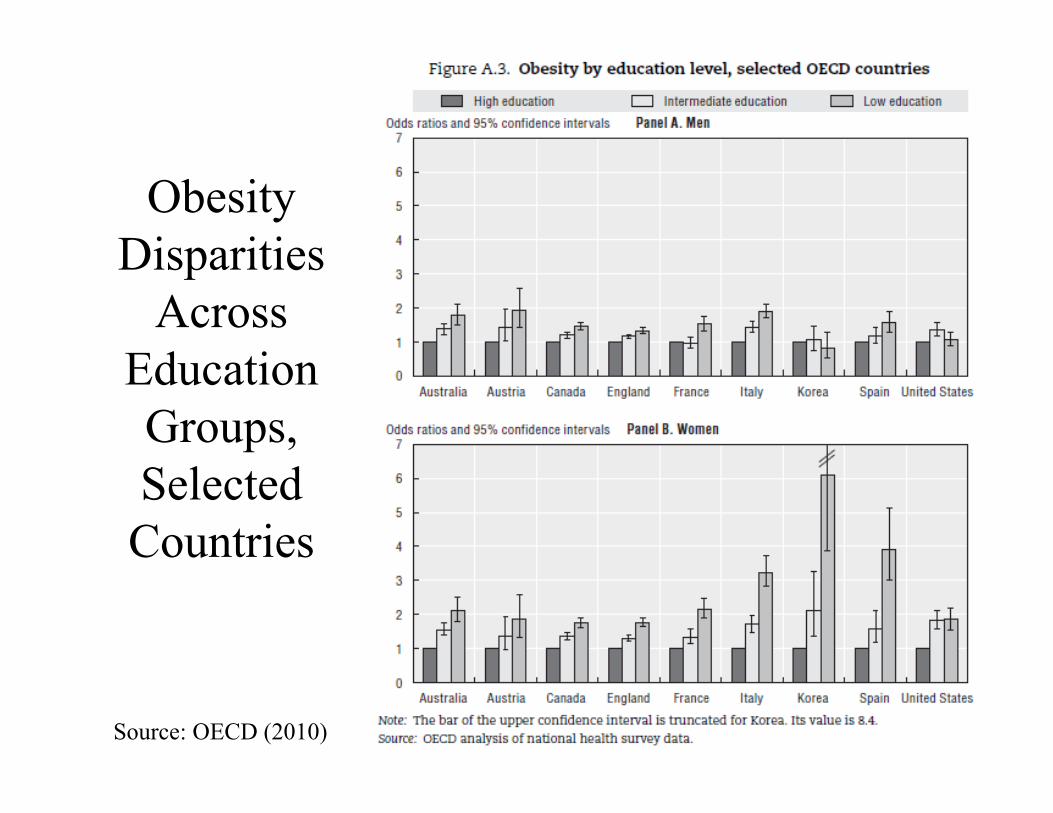
Obesity Disparities
Across Education Groups, Selected
Countries
Source: OECD (2010)
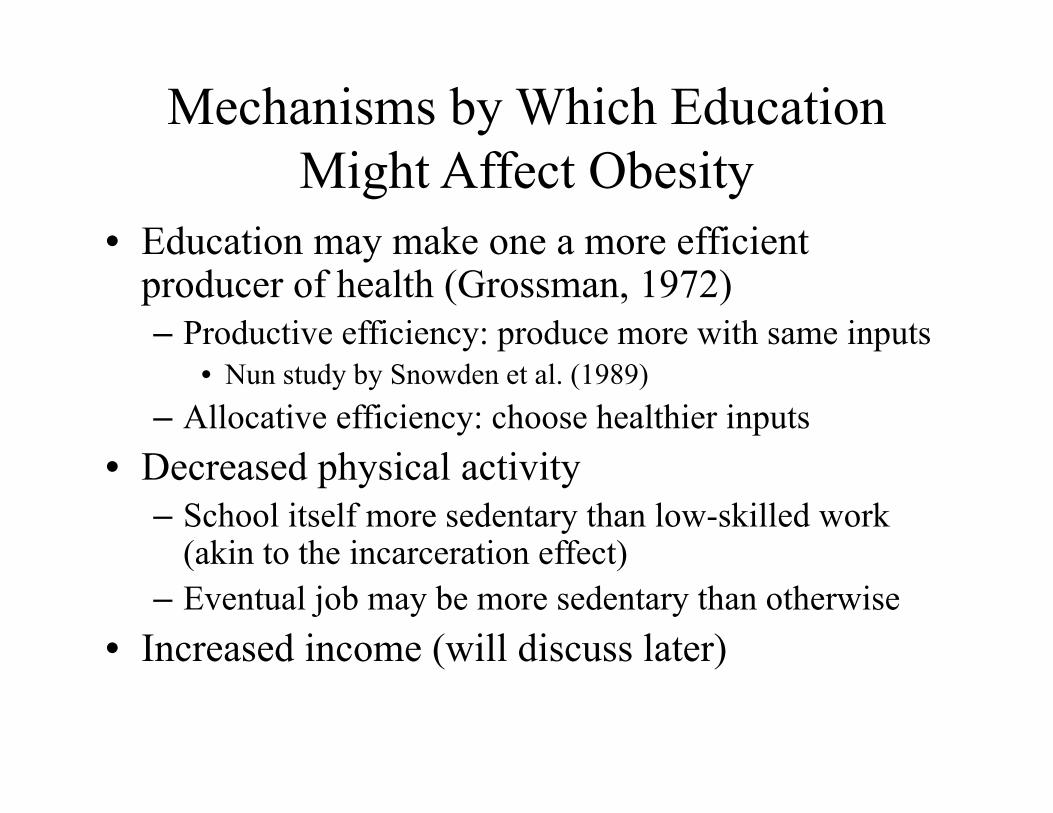
Mechanisms by Which Education Might Affect Obesity
• Education may make one a more efficient producer of health (Grossman, 1972)– Productive efficiency: produce more with same inputs
• Nun study by Snowden et al. (1989)– Allocative efficiency: choose healthier inputs
• Decreased physical activity– School itself more sedentary than low-skilled work
(akin to the incarceration effect)– Eventual job may be more sedentary than otherwise
• Increased income (will discuss later)
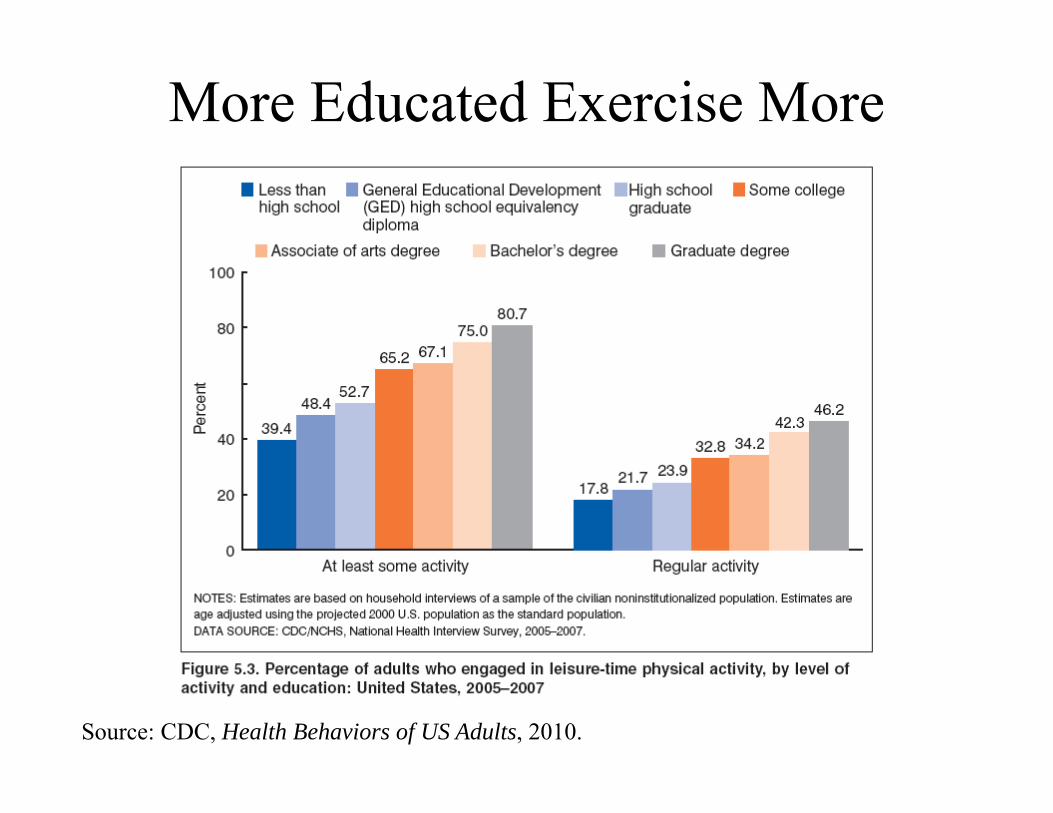
More Educated Exercise More
Source: CDC, Health Behaviors of US Adults, 2010.
Evidence on Causal Effects of Education on Adult Obesity
• Clark and Royer (2013)– Natural experiment: two changes to compulsory schooling laws in
England; affected majority of age cohort– Data: Health Survey for England, 1991-2004– RD approach indicates can’t reject null of no effect of education on
obesity, overweight or BMI but point estimates in some cases large (+) and imprecise
• Brunello et al. (2013)– Natural experiment: changes in compulsory schooling laws in 7-9
countries in Europe– Data: ECHP for 1998, SHARE for 2006-2007, ELSA for 2008-2009,
GSOEP, BHPS for 2003– IV models:
• Women: roughly 1 year of education reduces risk of obesity by 1.85 ppts (14.83%)• Men: can’t reject null of no effect
Evidence on Causal Effects of Early Childhood Education on Adult Obesity
• Muennig et al. (2009)– RCT of High/Scope Perry Preschool Program (two-year program
of 2.5 hrs academic instruction daily) at ages 3-4 years– Data: Follow-up at age 40; N=103– Estimated effect of program on obesity at age 40 is precise zero
• Campbell et al. (2014)– RCT of Abecedarian Program (intensive 8-year early education
program to enhance cognition and language development)– Data: follow-up in mid-30s; N=111– Find large effects of program on obesity in mid-30s, but many
estimates imprecise, not statistically significant
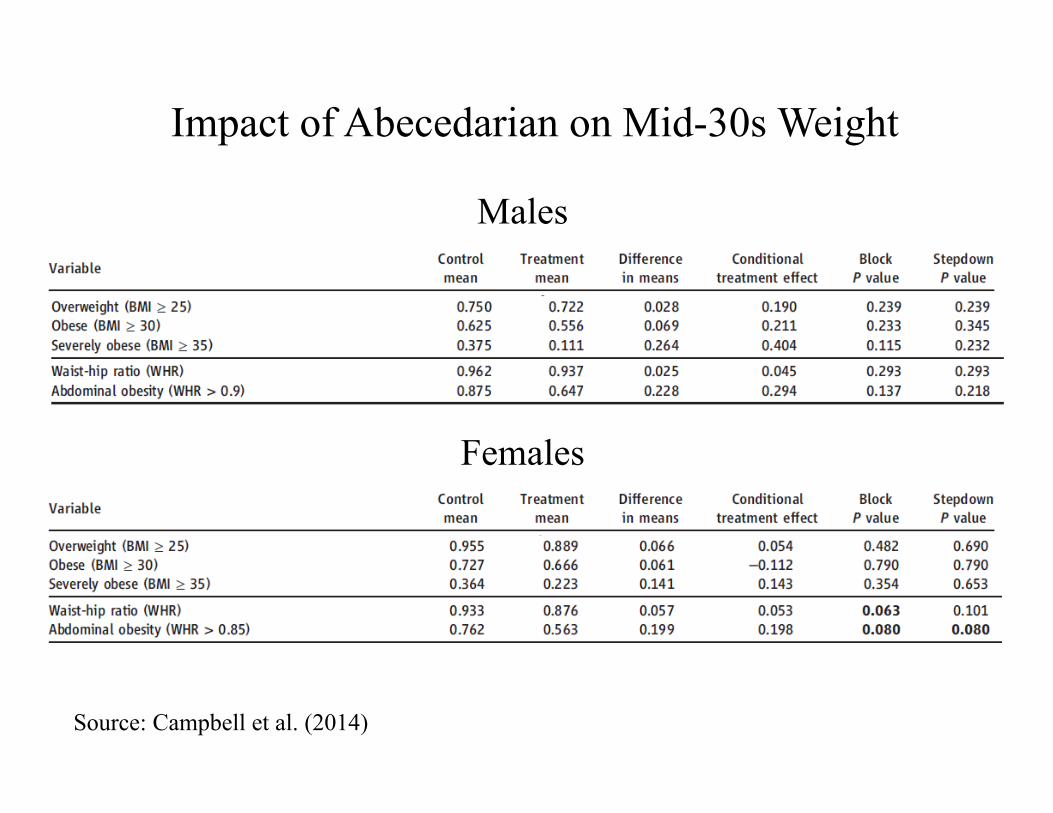
Males
Females
Source: Campbell et al. (2014)
Impact of Abecedarian on Mid-30s Weight
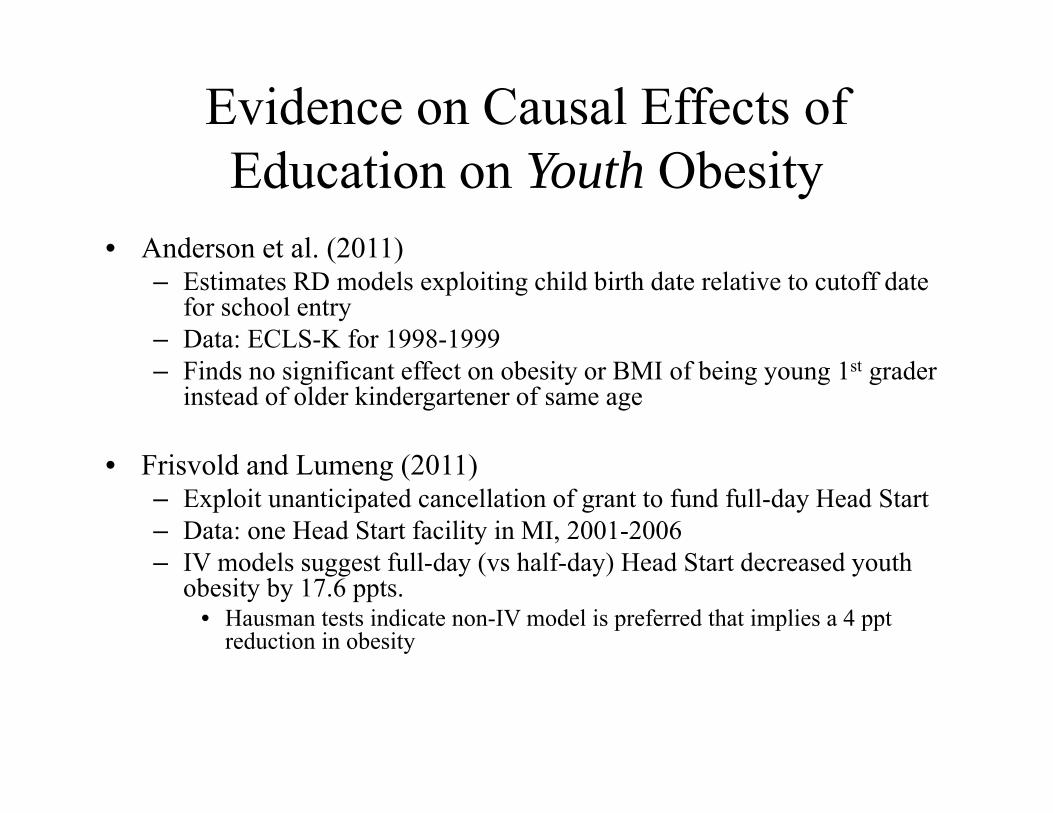
Evidence on Causal Effects of Education on Youth Obesity
• Anderson et al. (2011)– Estimates RD models exploiting child birth date relative to cutoff date
for school entry – Data: ECLS-K for 1998-1999– Finds no significant effect on obesity or BMI of being young 1st grader
instead of older kindergartener of same age
• Frisvold and Lumeng (2011)– Exploit unanticipated cancellation of grant to fund full-day Head Start– Data: one Head Start facility in MI, 2001-2006– IV models suggest full-day (vs half-day) Head Start decreased youth
obesity by 17.6 ppts. • Hausman tests indicate non-IV model is preferred that implies a 4 ppt
reduction in obesity
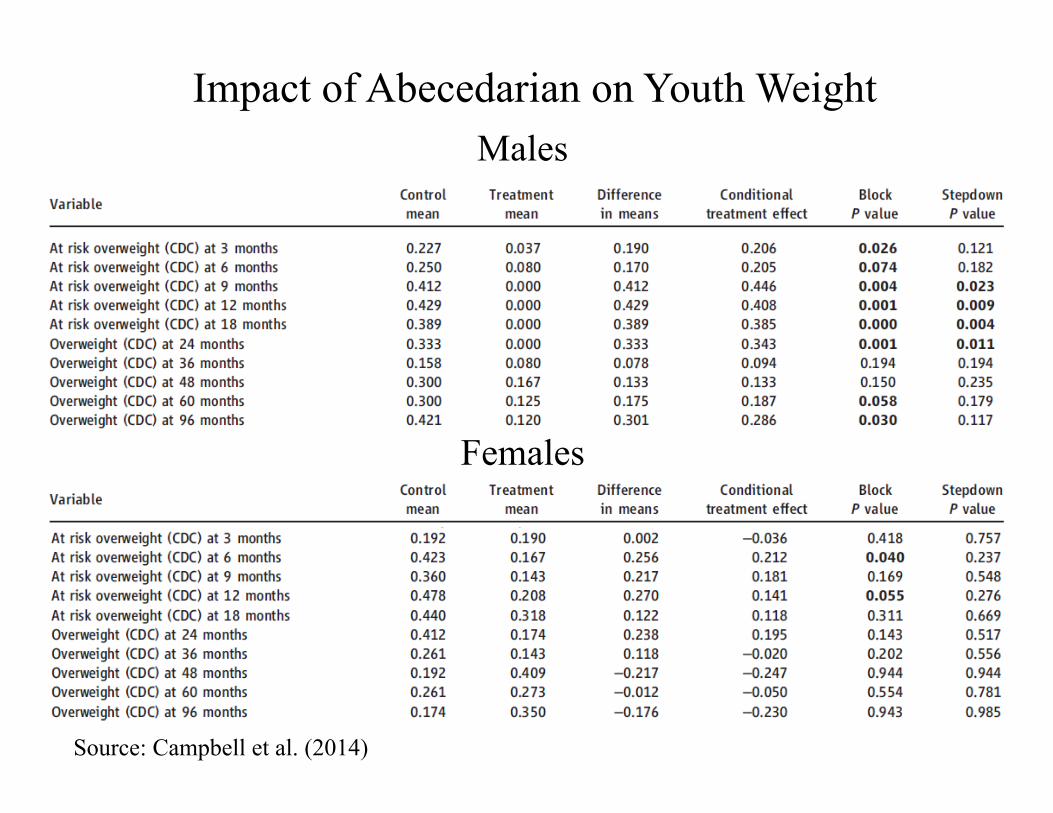
Males
Females
Source: Campbell et al. (2014)
Impact of Abecedarian on Youth Weight
Does Obesity Affect Education?• Basic correlations:
– Heavier youth tend to have lower test scores• Booth et al. (2014): in ALSPAC data, girls obese at age 11 scored worse on tests
at ages 11, 13, 16– Even among children as young as 2-3 years, the obese exhibit delayed
verbal skills (Cawley and Spiess, 2008)– Review of 29 studies classified the association as “weak” (Caird et al.,
2011)• Possible mechanisms:
– Worse health• Those with shorter expected lifespan will demand less education (Becker, 1975)• May demand same but be unable to complete education• Mental health / depression• Direct impact of fatness on cognition
– Discrimination by teachers or bullying by classmates (Puhl and Brownell, 2001)
• But delayed skill attainment visible in 2-3 year olds who spend no time in day care (Cawley and Spiess, 2008)
Does Obesity Affect Education?• Harder to find powerful and valid IVs for weight than for
things that affect weight (income, education, etc.)• Two papers instrument for overweight (and ADHD,
depression) using alleles for genetic markers associated with those conditions, controlling for family fixed effects:– Fletcher and Lehrer (2009): years of schooling completed in Add
Health– Ding et al. (2009): GPA in Georgetown Adolescent Tobacco Research
(GATOR)• Specific markers utilized relate to serotonin and dopamine• In epidemiology, this general approach called Mendelian
randomization• Results:
– Fletcher and Lehrer (2009): can’t reject null of no effect– Ding et al. (2009): obesity lowers girls’ GPA by 0.5 (~ 1 SD); can’t
reject null for boys
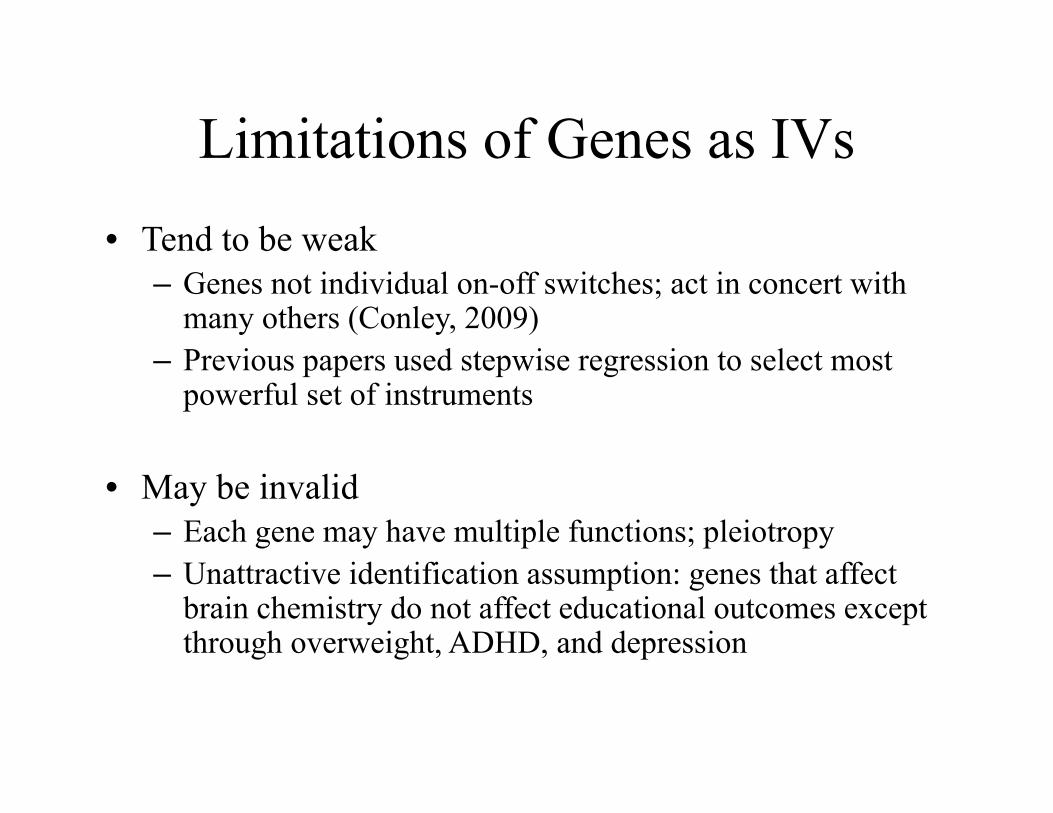
Limitations of Genes as IVs• Tend to be weak
– Genes not individual on-off switches; act in concert with many others (Conley, 2009)
– Previous papers used stepwise regression to select most powerful set of instruments
• May be invalid– Each gene may have multiple functions; pleiotropy– Unattractive identification assumption: genes that affect
brain chemistry do not affect educational outcomes except through overweight, ADHD, and depression
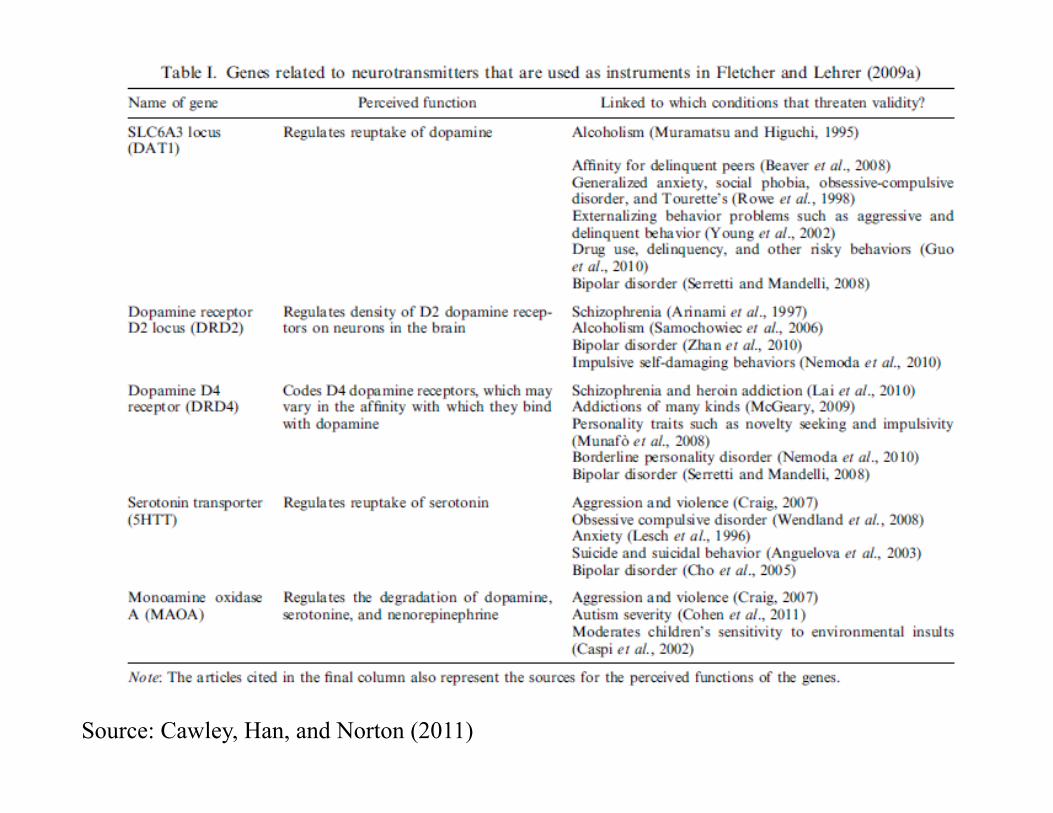
Source: Cawley, Han, and Norton (2011)
Stronger Example
• von Hinke Kessler Scholder et al. (2012)– Outcome: avg of exam scores at age 14– Endogenous regressor: fat mass as measured by DEXA– Genetic IVs: FTO, MC4R (F=19)– Both associated with obesity, little evidence associated with
other phenotypes– Cannot reject null of no effect– In general, more cautious in interpretation than previous
studies
Does Income Affect Obesity?
• Basic correlations
• Possible mechanisms
• Evidence on causal effects
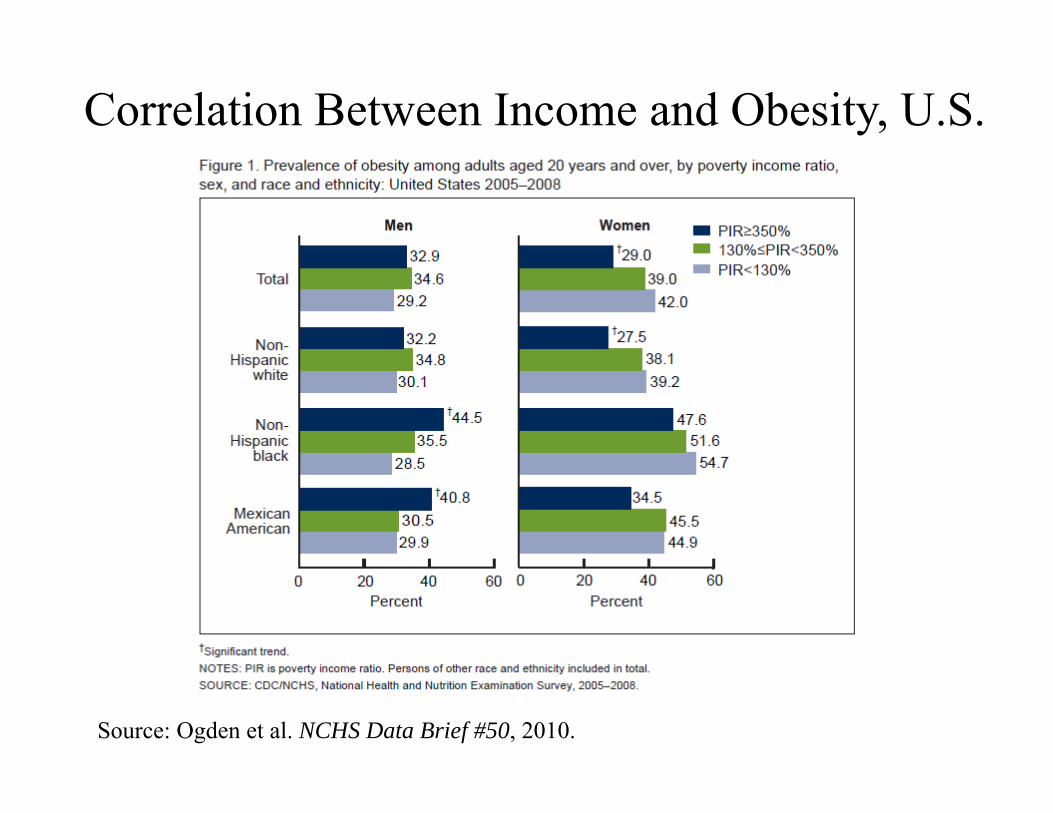
Correlation Between Income and Obesity, U.S.
Source: Ogden et al. NCHS Data Brief #50, 2010.
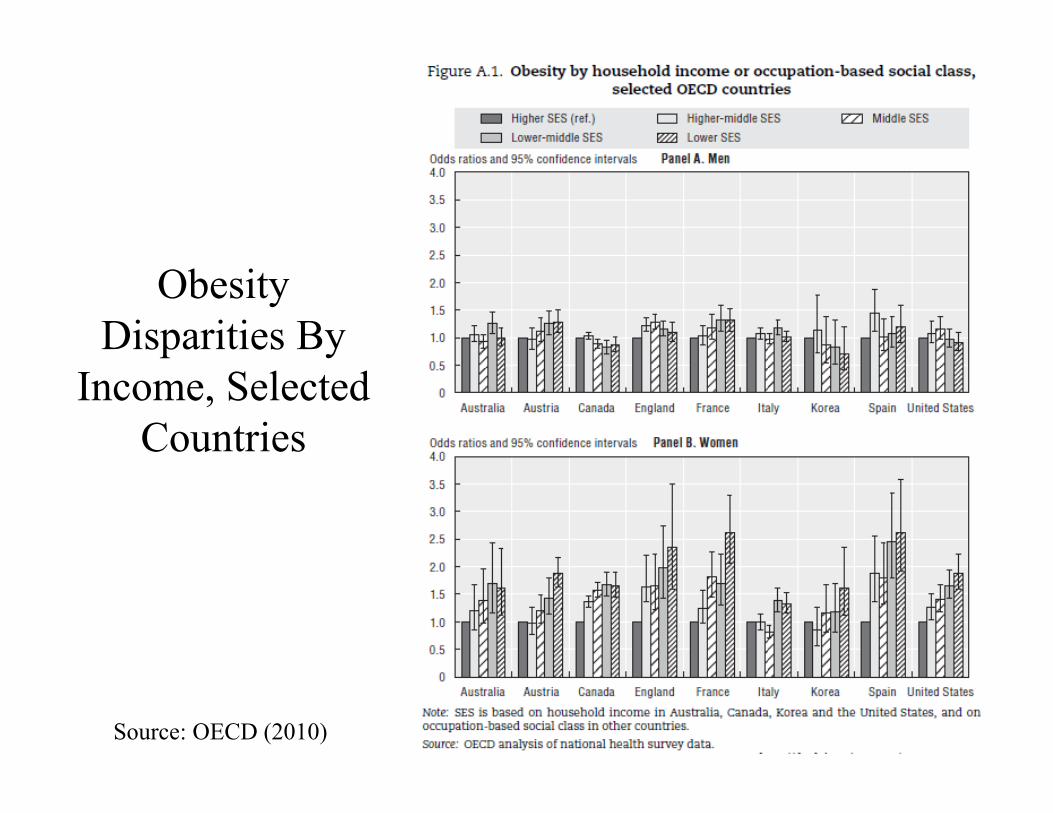
Obesity Disparities By
Income, Selected Countries
Source: OECD (2010)
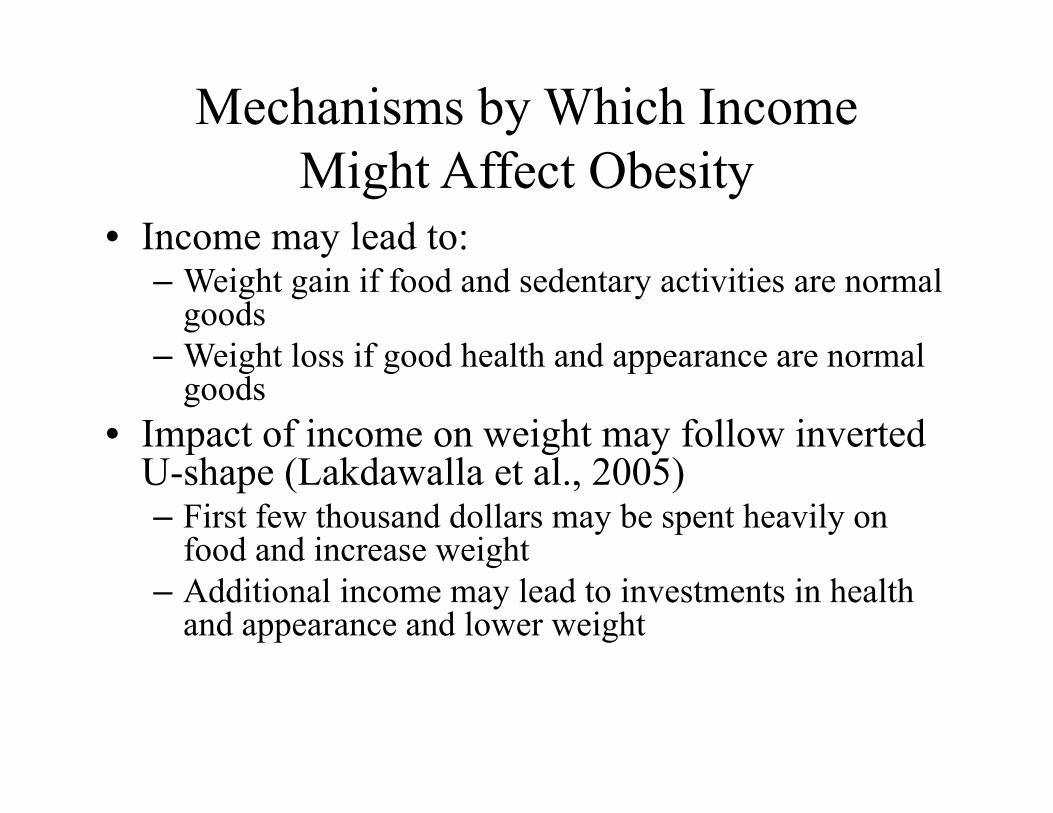
Mechanisms by Which Income Might Affect Obesity
• Income may lead to:– Weight gain if food and sedentary activities are normal
goods– Weight loss if good health and appearance are normal
goods• Impact of income on weight may follow inverted
U-shape (Lakdawalla et al., 2005)– First few thousand dollars may be spent heavily on
food and increase weight– Additional income may lead to investments in health
and appearance and lower weight
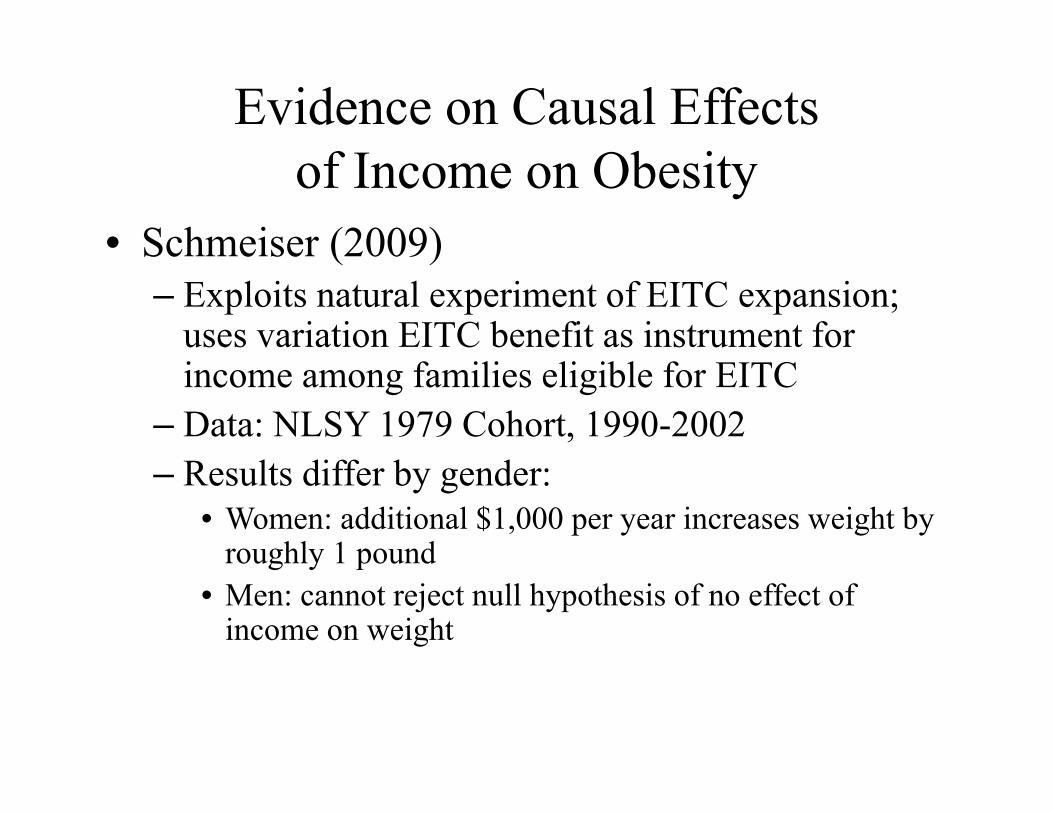
Evidence on Causal Effects of Income on Obesity
• Schmeiser (2009)– Exploits natural experiment of EITC expansion;
uses variation EITC benefit as instrument for income among families eligible for EITC
– Data: NLSY 1979 Cohort, 1990-2002– Results differ by gender:
• Women: additional $1,000 per year increases weight by roughly 1 pound
• Men: cannot reject null hypothesis of no effect of income on weight
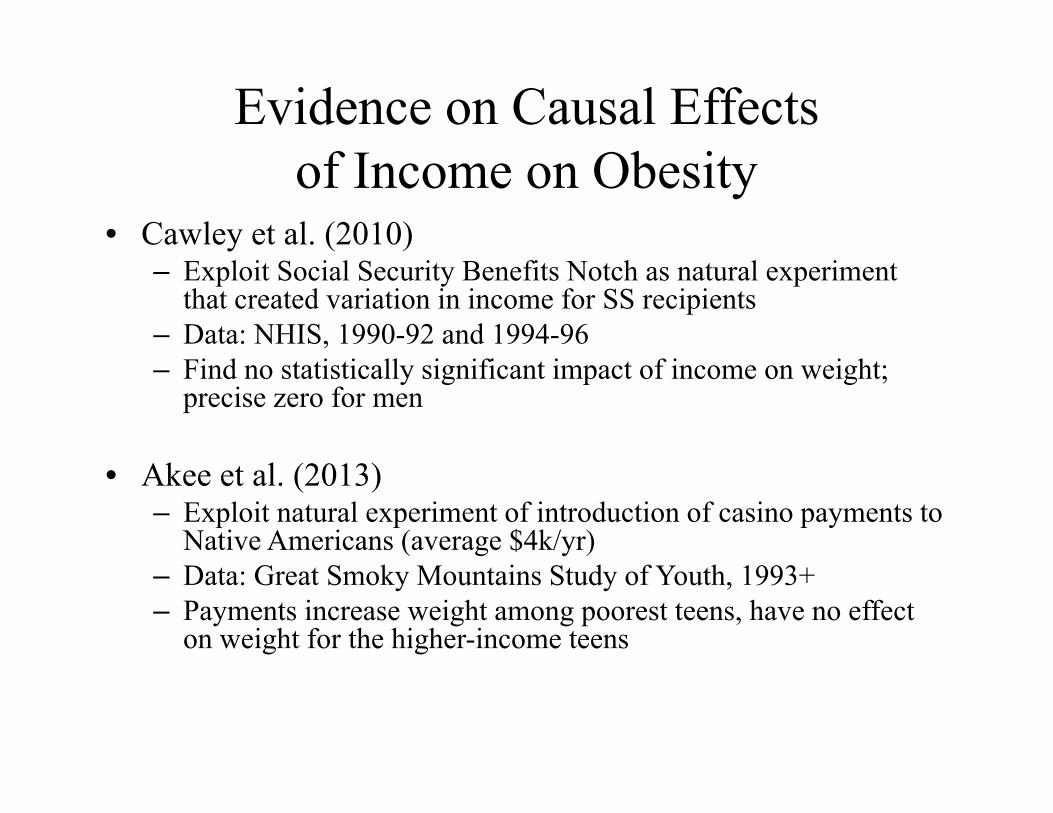
Evidence on Causal Effects of Income on Obesity
• Cawley et al. (2010)– Exploit Social Security Benefits Notch as natural experiment
that created variation in income for SS recipients– Data: NHIS, 1990-92 and 1994-96– Find no statistically significant impact of income on weight;
precise zero for men
• Akee et al. (2013)– Exploit natural experiment of introduction of casino payments to
Native Americans (average $4k/yr)– Data: Great Smoky Mountains Study of Youth, 1993+– Payments increase weight among poorest teens, have no effect
on weight for the higher-income teens
Does Obesity Affect Wages?
• Basic correlations
• Possible mechanisms:
• Evidence on causal effects
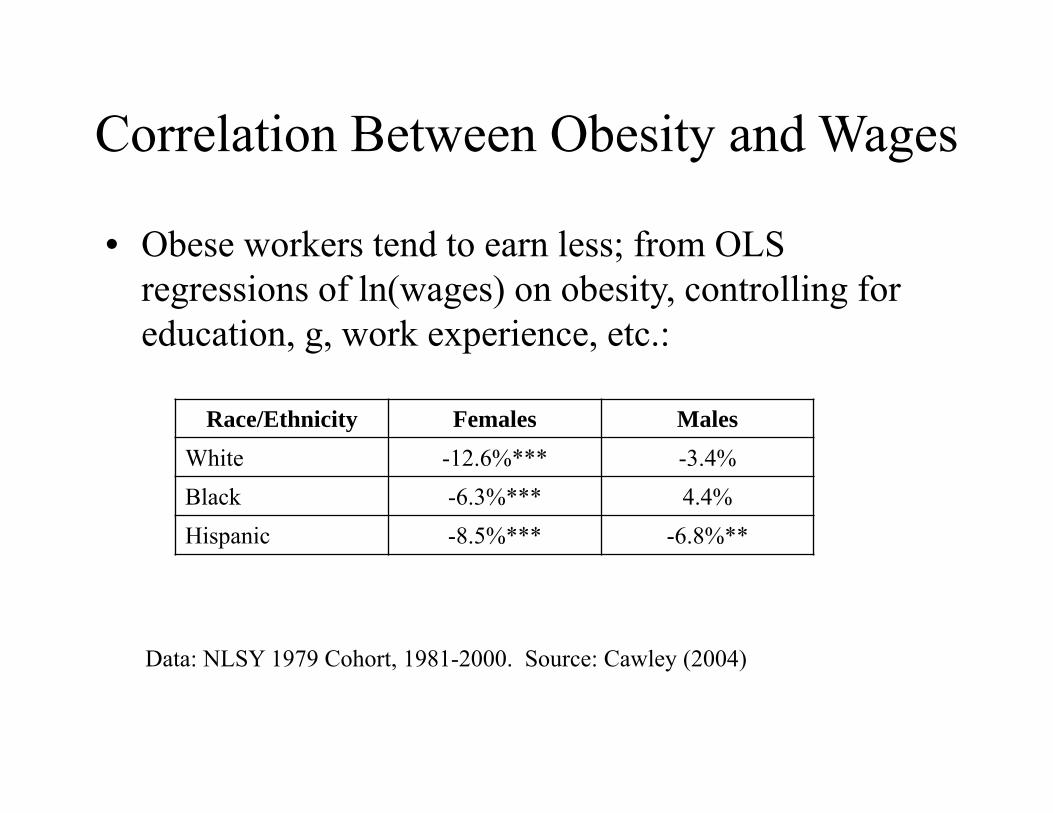
Correlation Between Obesity and Wages
• Obese workers tend to earn less; from OLS regressions of ln(wages) on obesity, controlling for education, g, work experience, etc.:
Race/Ethnicity Females MalesWhite -12.6%*** -3.4%Black -6.3%*** 4.4%Hispanic -8.5%*** -6.8%**
Data: NLSY 1979 Cohort, 1981-2000. Source: Cawley (2004)
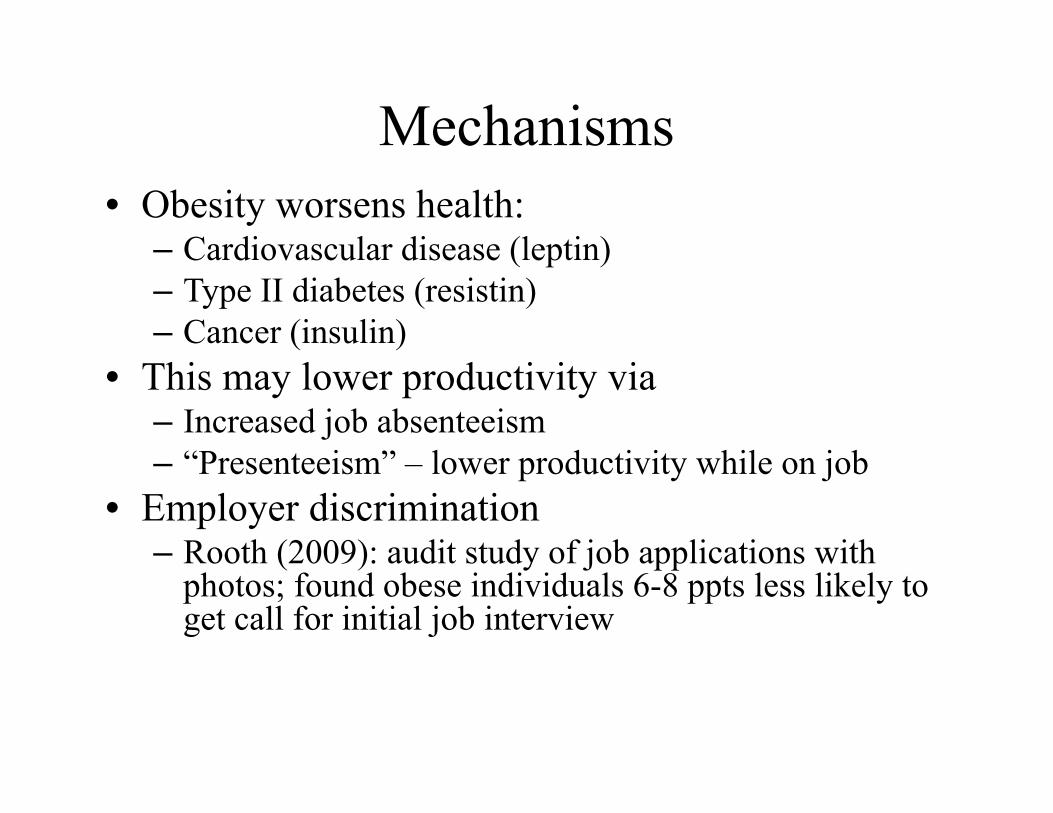
Mechanisms• Obesity worsens health:
– Cardiovascular disease (leptin)– Type II diabetes (resistin)– Cancer (insulin)
• This may lower productivity via– Increased job absenteeism – “Presenteeism” – lower productivity while on job
• Employer discrimination– Rooth (2009): audit study of job applications with
photos; found obese individuals 6-8 ppts less likely to get call for initial job interview
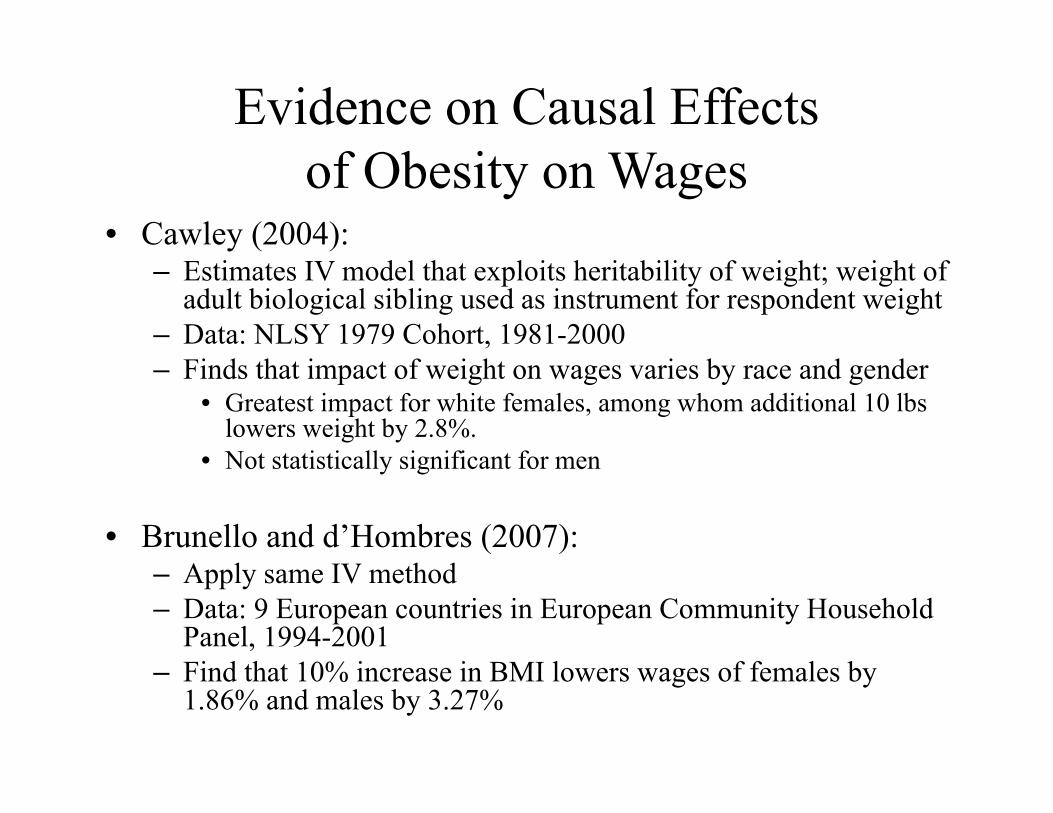
Evidence on Causal Effects of Obesity on Wages
• Cawley (2004):– Estimates IV model that exploits heritability of weight; weight of
adult biological sibling used as instrument for respondent weight– Data: NLSY 1979 Cohort, 1981-2000– Finds that impact of weight on wages varies by race and gender
• Greatest impact for white females, among whom additional 10 lbslowers weight by 2.8%.
• Not statistically significant for men
• Brunello and d’Hombres (2007):– Apply same IV method – Data: 9 European countries in European Community Household
Panel, 1994-2001– Find that 10% increase in BMI lowers wages of females by
1.86% and males by 3.27%
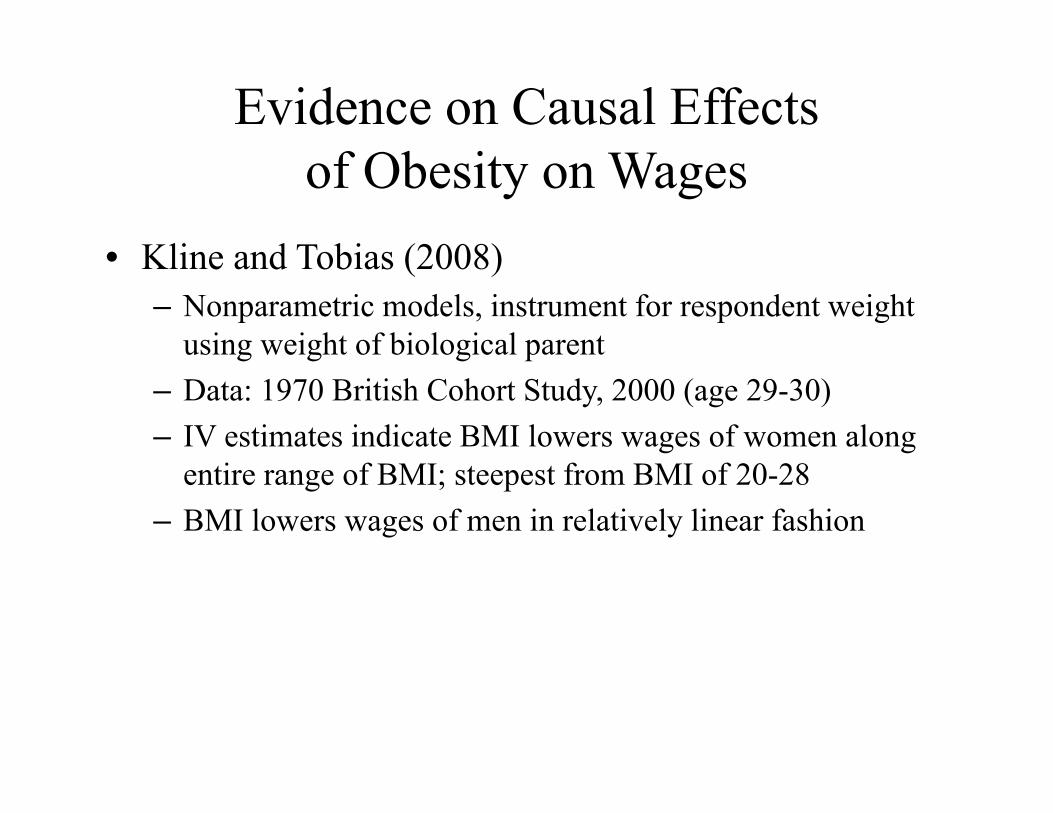
Evidence on Causal Effects of Obesity on Wages
• Kline and Tobias (2008)– Nonparametric models, instrument for respondent weight
using weight of biological parent– Data: 1970 British Cohort Study, 2000 (age 29-30)– IV estimates indicate BMI lowers wages of women along
entire range of BMI; steepest from BMI of 20-28– BMI lowers wages of men in relatively linear fashion
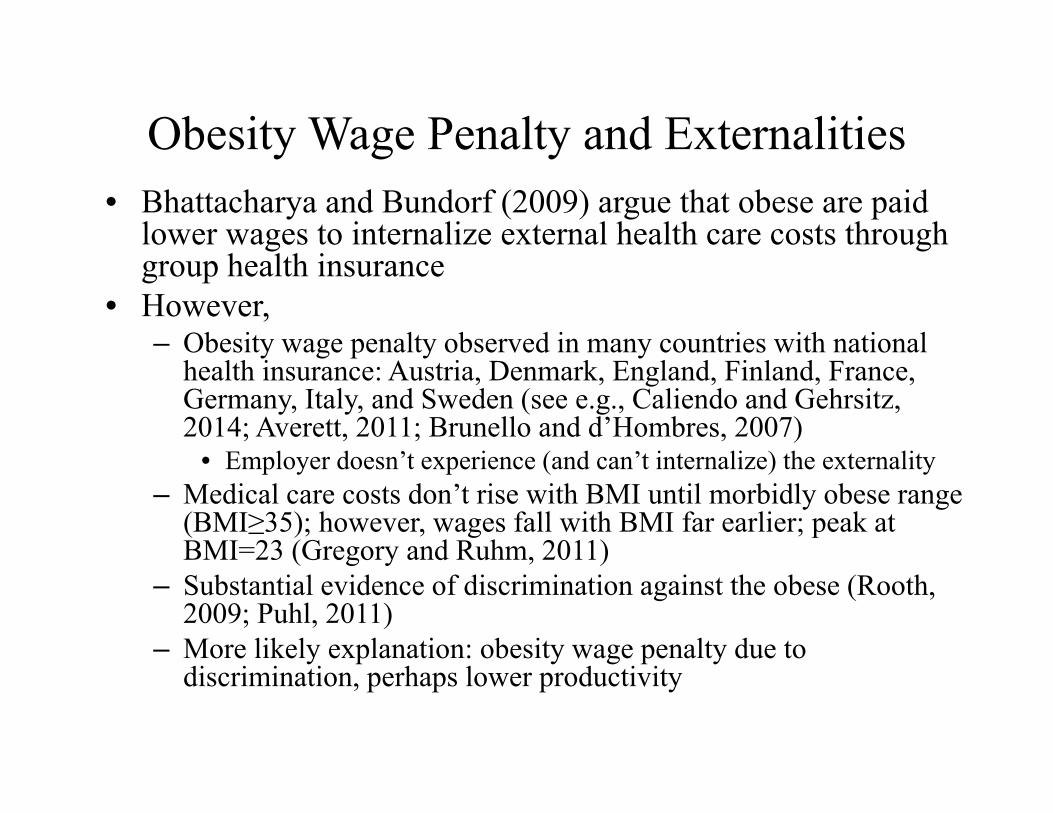
Obesity Wage Penalty and Externalities• Bhattacharya and Bundorf (2009) argue that obese are paid
lower wages to internalize external health care costs through group health insurance
• However,– Obesity wage penalty observed in many countries with national
health insurance: Austria, Denmark, England, Finland, France, Germany, Italy, and Sweden (see e.g., Caliendo and Gehrsitz, 2014; Averett, 2011; Brunello and d’Hombres, 2007)
• Employer doesn’t experience (and can’t internalize) the externality– Medical care costs don’t rise with BMI until morbidly obese range
(BMI≥35); however, wages fall with BMI far earlier; peak at BMI=23 (Gregory and Ruhm, 2011)
– Substantial evidence of discrimination against the obese (Rooth, 2009; Puhl, 2011)
– More likely explanation: obesity wage penalty due to discrimination, perhaps lower productivity
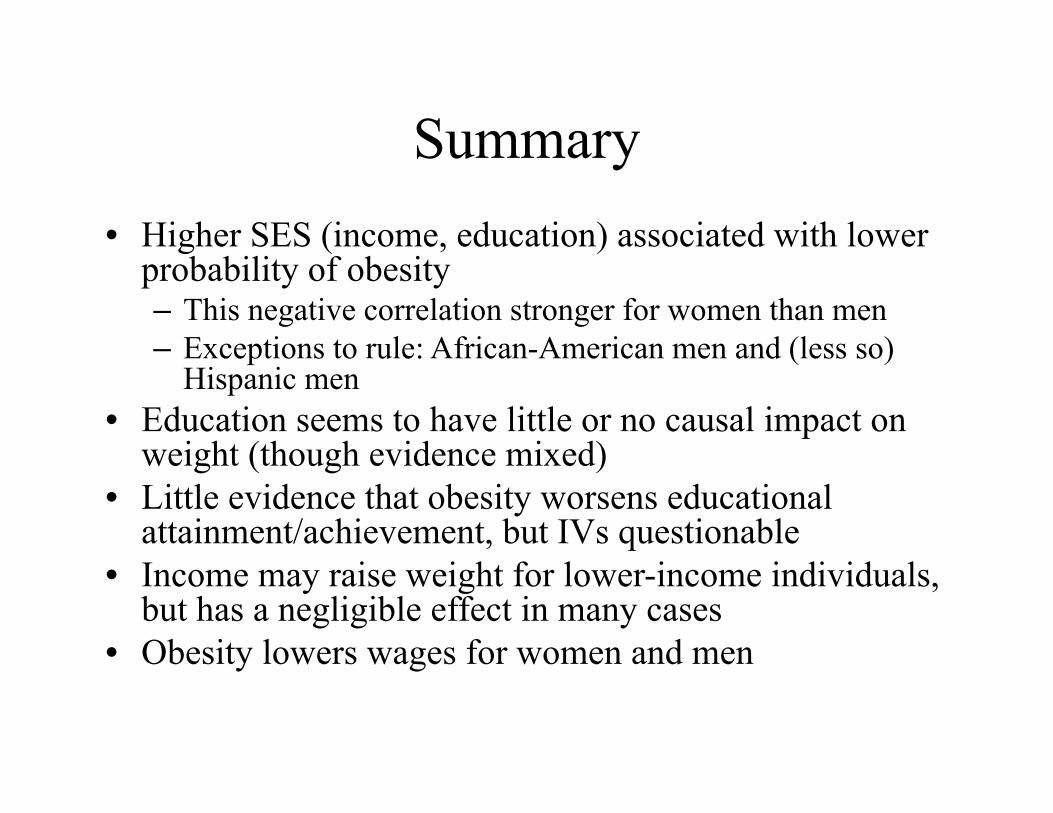
Summary• Higher SES (income, education) associated with lower
probability of obesity– This negative correlation stronger for women than men– Exceptions to rule: African-American men and (less so)
Hispanic men• Education seems to have little or no causal impact on
weight (though evidence mixed)• Little evidence that obesity worsens educational
attainment/achievement, but IVs questionable• Income may raise weight for lower-income individuals,
but has a negligible effect in many cases• Obesity lowers wages for women and men
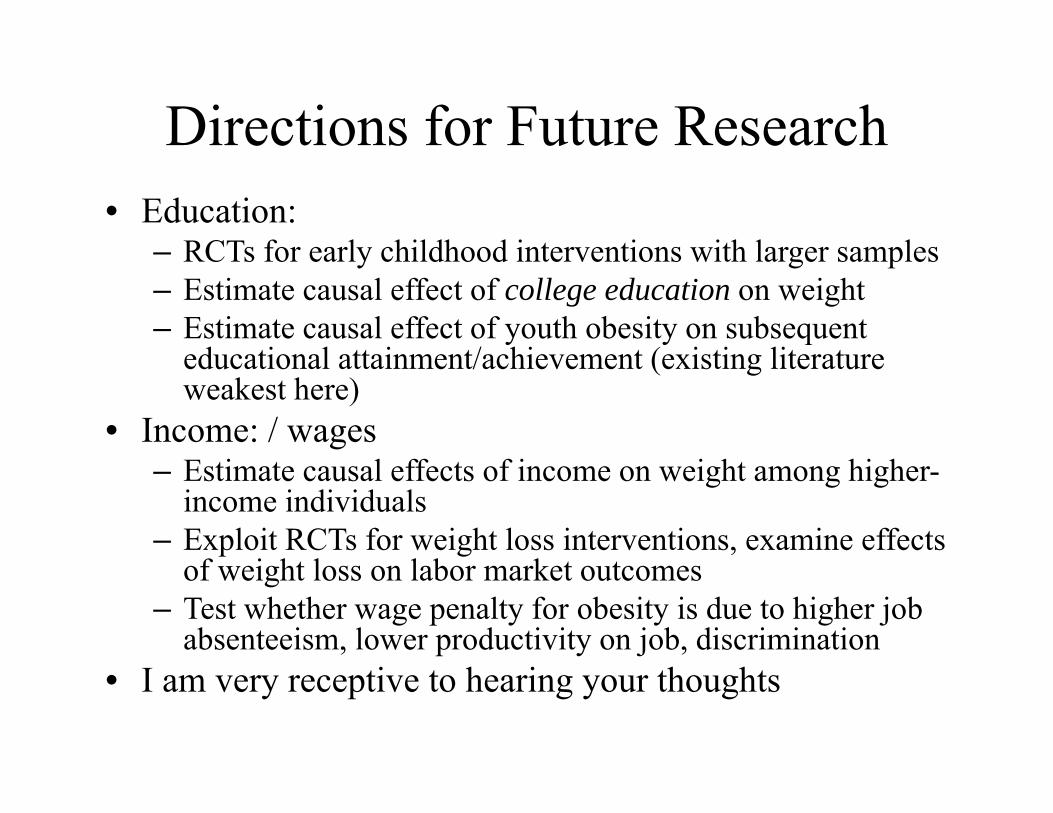
Directions for Future Research• Education:
– RCTs for early childhood interventions with larger samples– Estimate causal effect of college education on weight– Estimate causal effect of youth obesity on subsequent
educational attainment/achievement (existing literature weakest here)
• Income: / wages– Estimate causal effects of income on weight among higher-
income individuals– Exploit RCTs for weight loss interventions, examine effects
of weight loss on labor market outcomes– Test whether wage penalty for obesity is due to higher job
absenteeism, lower productivity on job, discrimination• I am very receptive to hearing your thoughts

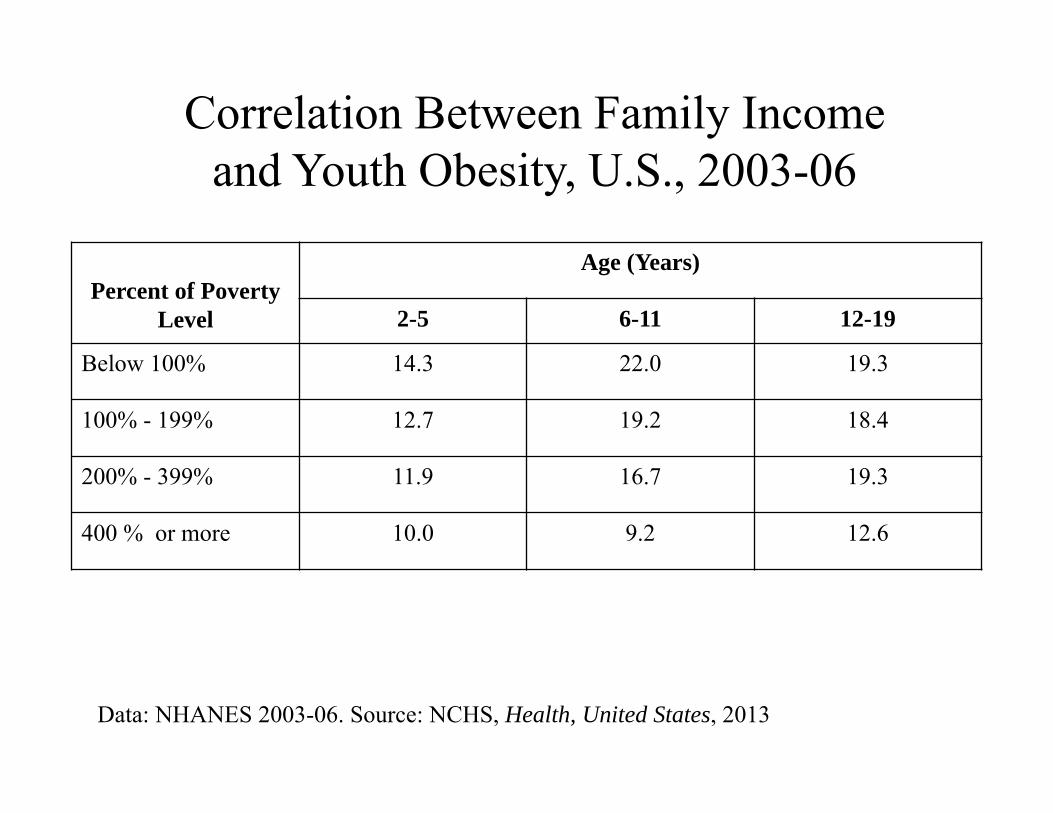
Correlation Between Family Income and Youth Obesity, U.S., 2003-06
Data: NHANES 2003-06. Source: NCHS, Health, United States, 2013
Percent of Poverty Level
Age (Years)
2-5 6-11 12-19
Below 100% 14.3 22.0 19.3
100% - 199% 12.7 19.2 18.4
200% - 399% 11.9 16.7 19.3
400 % or more 10.0 9.2 12.6