Embed Size (px)
Citation preview
Mesh Quality Tutorial
Figure 1: The MeshQuality model. See Figure 2 for close-up of bottom-right area This tutorial will illustrate the importance of Mesh Quality in PHASE2. This tutorial will also show how to identify a poor quality mesh, and explain how to improve the quality. “Mesh Refinement” is a new feature and is only available in PHASE2 version 5.0. “Mesh Quality” locates and indicates the poor quality elements with blue rectangular boxes and red hatching (see Figure 2). Poor quality elements are undesirable because they negatively affect the results. A poor quality mesh can display results that are more mesh dependant than model dependent. This will be shown in the third section. In extreme cases, when the elements are of very poor quality, the computation may not converge and no results will be available. This tutorial is divided into three parts:
• Identifying poor quality elements • Improving the mesh quality
• Results: before and after improving the mesh quality
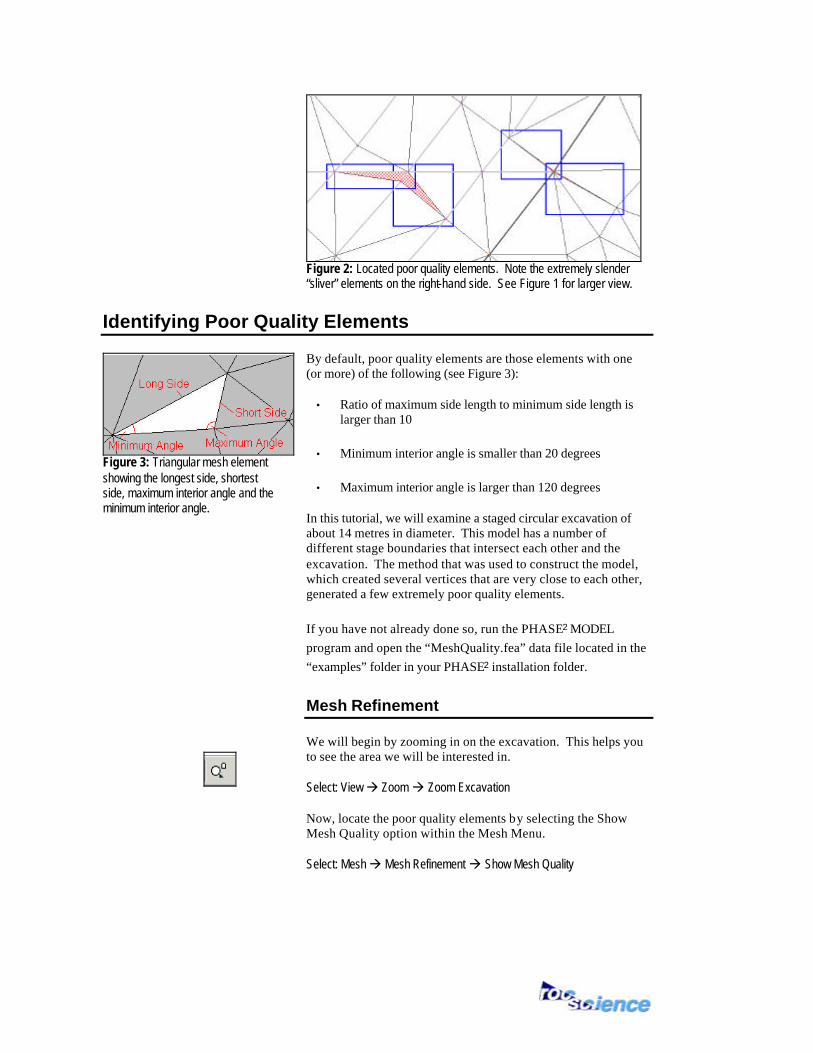
Figure 2: Located poor quality elements. Note the extremely slender “sliver” elements on the right-hand side. See Figure 1 for larger view.
Identifying Poor Quality Elements
Figure 3: Triangular mesh element showing the longest side, shortest side, maximum interior angle and the minimum interior angle.
By default, poor quality elements are those elements with one (or more) of the following (see Figure 3):
• Ratio of maximum side length to minimum side length is larger than 10
• Minimum interior angle is smaller than 20 degrees
• Maximum interior angle is larger than 120 degrees
In this tutorial, we will examine a staged circular excavation of about 14 metres in diameter. This model has a number of different stage boundaries that intersect each other and the excavation. The method that was used to construct the model, which created several vertices that are very close to each other, generated a few extremely poor quality elements.
If you have not already done so, run the PHASE2 MODEL program and open the “MeshQuality.fea” data file located in the “examples” folder in your PHASE2 installation folder.
Mesh Refinement We will begin by zooming in on the excavation. This helps you to see the area we will be interested in. Select: View à Zoom à Zoom Excavation Now, locate the poor quality elements by selecting the Show Mesh Quality option within the Mesh Menu. Select: Mesh à Mesh Refinement à Show Mesh Quality
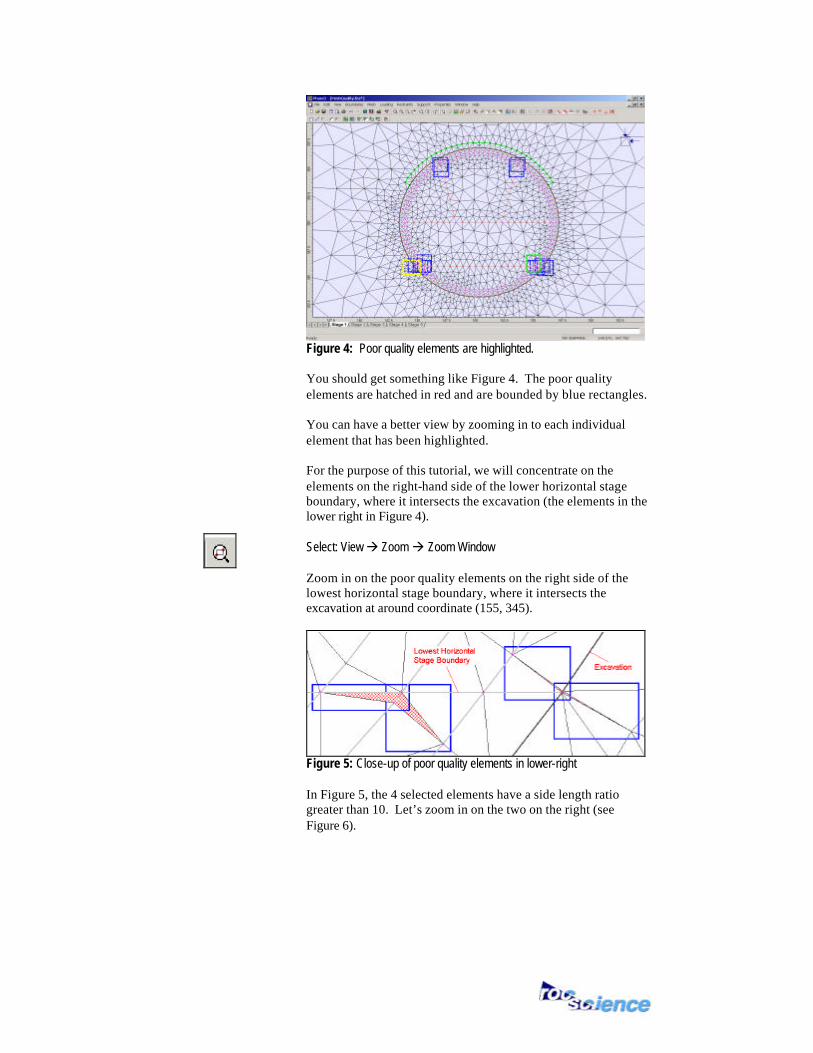
Figure 4: Poor quality elements are highlighted. You should get something like Figure 4. The poor quality elements are hatched in red and are bounded by blue rectangles. You can have a better view by zooming in to each individual element that has been highlighted. For the purpose of this tutorial, we will concentrate on the elements on the right-hand side of the lower horizontal stage boundary, where it intersects the excavation (the elements in the lower right in Figure 4). Select: View à Zoom à Zoom Window Zoom in on the poor quality elements on the right side of the lowest horizontal stage boundary, where it intersects the excavation at around coordinate (155, 345).
Figure 5: Close-up of poor quality elements in lower-right In Figure 5, the 4 selected elements have a side length ratio greater than 10. Let’s zoom in on the two on the right (see Figure 6).
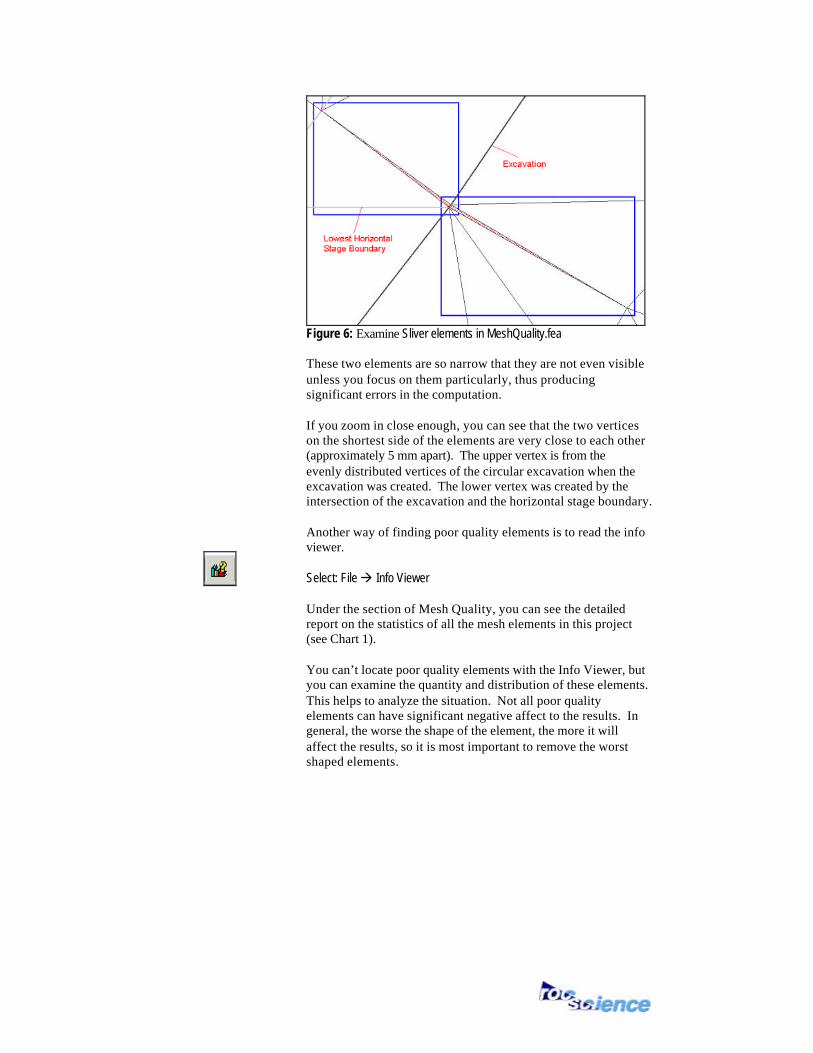
Figure 6: Examine Sliver elements in MeshQuality.fea These two elements are so narrow that they are not even visible unless you focus on them particularly, thus producing significant errors in the computation. If you zoom in close enough, you can see that the two vertices on the shortest side of the elements are very close to each other (approximately 5 mm apart). The upper vertex is from the evenly distributed vertices of the circular excavation when the excavation was created. The lower vertex was created by the intersection of the excavation and the horizontal stage boundary. Another way of finding poor quality elements is to read the info viewer. Select: File à Info Viewer Under the section of Mesh Quality, you can see the detailed report on the statistics of all the mesh elements in this project (see Chart 1). You can’t locate poor quality elements with the Info Viewer, but you can examine the quantity and distribution of these elements. This helps to analyze the situation. Not all poor quality elements can have significant negative affect to the results. In general, the worse the shape of the element, the more it will affect the results, so it is most important to remove the worst shaped elements.
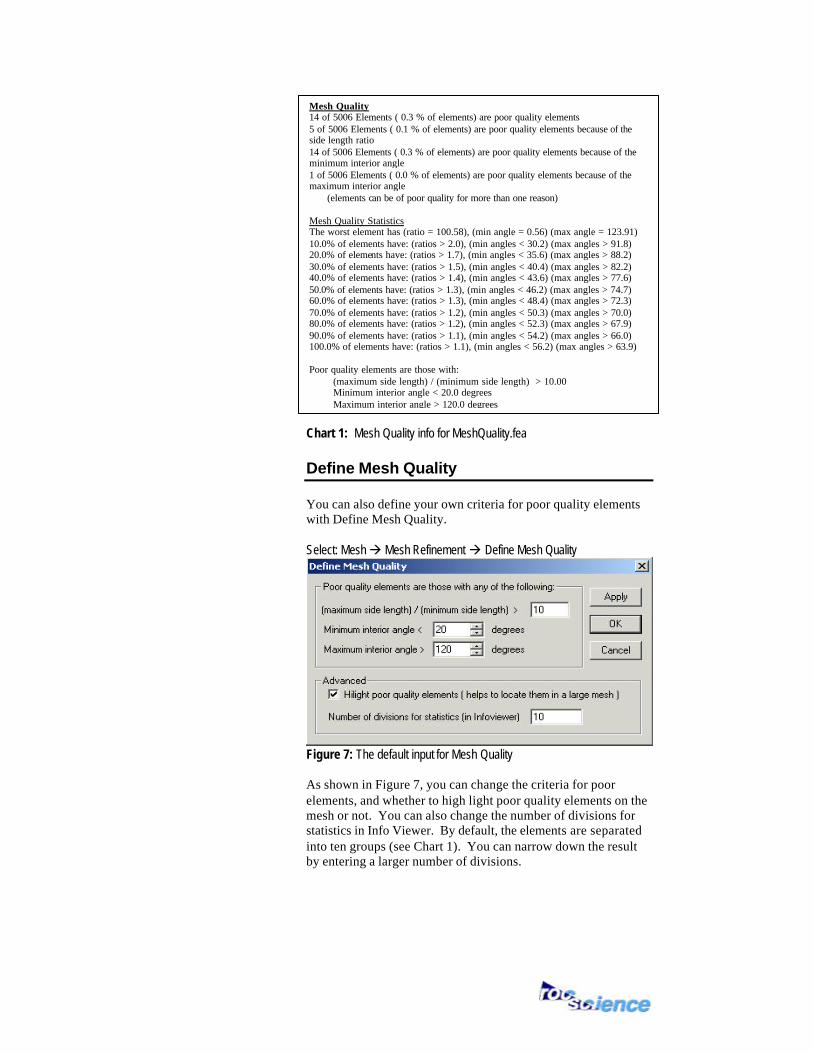
Chart 1: Mesh Quality info for MeshQuality.fea Define Mesh Quality You can also define your own criteria for poor quality elements with Define Mesh Quality. Select: Mesh à Mesh Refinement à Define Mesh Quality
Figure 7: The default input for Mesh Quality As shown in Figure 7, you can change the criteria for poor elements, and whether to high light poor quality elements on the mesh or not. You can also change the number of divisions for statistics in Info Viewer. By default, the elements are separated into ten groups (see Chart 1). You can narrow down the result by entering a larger number of divisions.
Mesh Quality 14 of 5006 Elements ( 0.3 % of elements) are poor quality elements 5 of 5006 Elements ( 0.1 % of elements) are poor quality elements because of the side length ratio 14 of 5006 Elements ( 0.3 % of elements) are poor quality elements because of the minimum interior angle 1 of 5006 Elements ( 0.0 % of elements) are poor quality elements because of the maximum interior angle (elements can be of poor quality for more than one reason) Mesh Quality Statistics The worst element has (ratio = 100.58), (min angle = 0.56) (max angle = 123.91) 10.0% of elements have: (ratios > 2.0), (min angles < 30.2) (max angles > 91.8) 20.0% of elements have: (ratios > 1.7), (min angles < 35.6) (max angles > 88.2) 30.0% of elements have: (ratios > 1.5), (min angles < 40.4) (max angles > 82.2) 40.0% of elements have: (ratios > 1.4), (min angles < 43.6) (max angles > 77.6) 50.0% of elements have: (ratios > 1.3), (min angles < 46.2) (max angles > 74.7) 60.0% of elements have: (ratios > 1.3), (min angles < 48.4) (max angles > 72.3) 70.0% of elements have: (ratios > 1.2), (min angles < 50.3) (max angles > 70.0) 80.0% of elements have: (ratios > 1.2), (min angles < 52.3) (max angles > 67.9) 90.0% of elements have: (ratios > 1.1), (min angles < 54.2) (max angles > 66.0) 100.0% of elements have: (ratios > 1.1), (min angles < 56.2) (max angles > 63.9) Poor quality elements are those with: (maximum side length) / (minimum side length) > 10.00 Minimum interior angle < 20.0 degrees Maximum interior angle > 120.0 degrees
Improving Mesh Quality
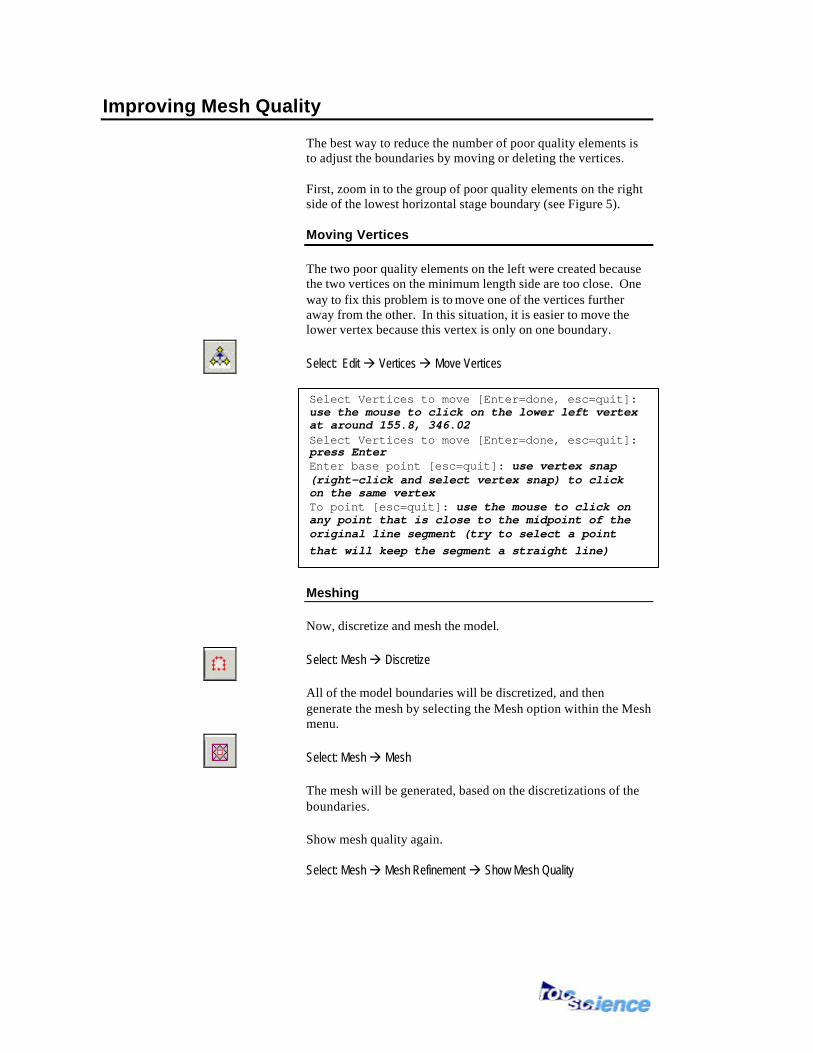
The best way to reduce the number of poor quality elements is to adjust the boundaries by moving or deleting the vertices. First, zoom in to the group of poor quality elements on the right side of the lowest horizontal stage boundary (see Figure 5). Moving Vertices The two poor quality elements on the left were created because the two vertices on the minimum length side are too close. One way to fix this problem is to move one of the vertices further away from the other. In this situation, it is easier to move the lower vertex because this vertex is only on one boundary. Select: Edit à Vertices à Move Vertices Meshing Now, discretize and mesh the model. Select: Mesh à Discretize All of the model boundaries will be discretized, and then generate the mesh by selecting the Mesh option within the Mesh menu. Select: Mesh à Mesh The mesh will be generated, based on the discretizations of the boundaries. Show mesh quality again. Select: Mesh à Mesh Refinement à Show Mesh Quality
Select Vertices to move [Enter=done, esc=quit]: use the mouse to click on the lower left vertex at around 155.8, 346.02 Select Vertices to move [Enter=done, esc=quit]: press Enter Enter base point [esc=quit]: use vertex snap (right-click and select vertex snap) to click on the same vertex To point [esc=quit]: use the mouse to click on any point that is close to the midpoint of the original line segment (try to select a point that will keep the segment a straight line)
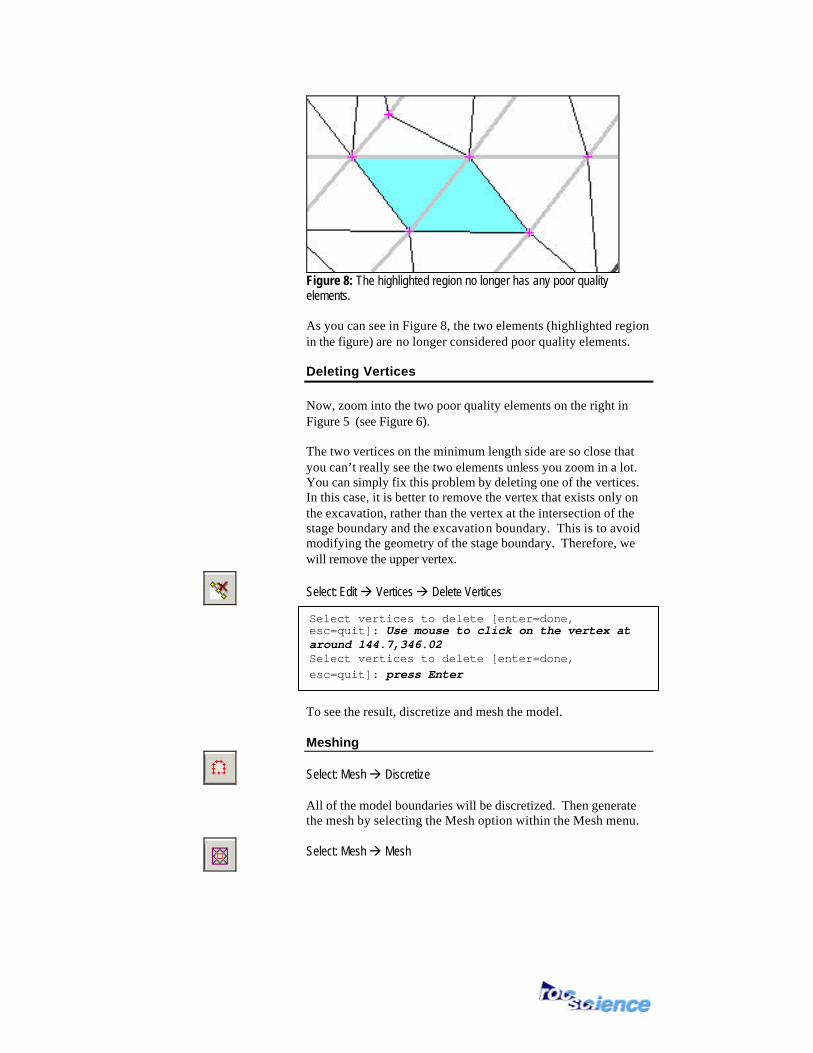
Figure 8: The highlighted region no longer has any poor quality elements. As you can see in Figure 8, the two elements (highlighted region in the figure) are no longer considered poor quality elements. Deleting Vertices Now, zoom into the two poor quality elements on the right in Figure 5 (see Figure 6). The two vertices on the minimum length side are so close that you can’t really see the two elements unless you zoom in a lot. You can simply fix this problem by deleting one of the vertices. In this case, it is better to remove the vertex that exists only on the excavation, rather than the vertex at the intersection of the stage boundary and the excavation boundary. This is to avoid modifying the geometry of the stage boundary. Therefore, we will remove the upper vertex. Select: Edit à Vertices à Delete Vertices To see the result, discretize and mesh the model. Meshing Select: Mesh à Discretize All of the model boundaries will be discretized. Then generate the mesh by selecting the Mesh option within the Mesh menu. Select: Mesh à Mesh
Select vertices to delete [enter=done, esc=quit]: Use mouse to click on the vertex at around 144.7,346.02 Select vertices to delete [enter=done, esc=quit]: press Enter
Show mesh quality again. Select: Mesh à Mesh Refinement à Show Mesh Quality The two poor quality elements are not there anymore. Repeat the steps of moving or deleting vertices to fix all the poor quality elements. Save the file as “MeshQualityFixed.fea”
Results: Before and After Improving the Mesh Quality
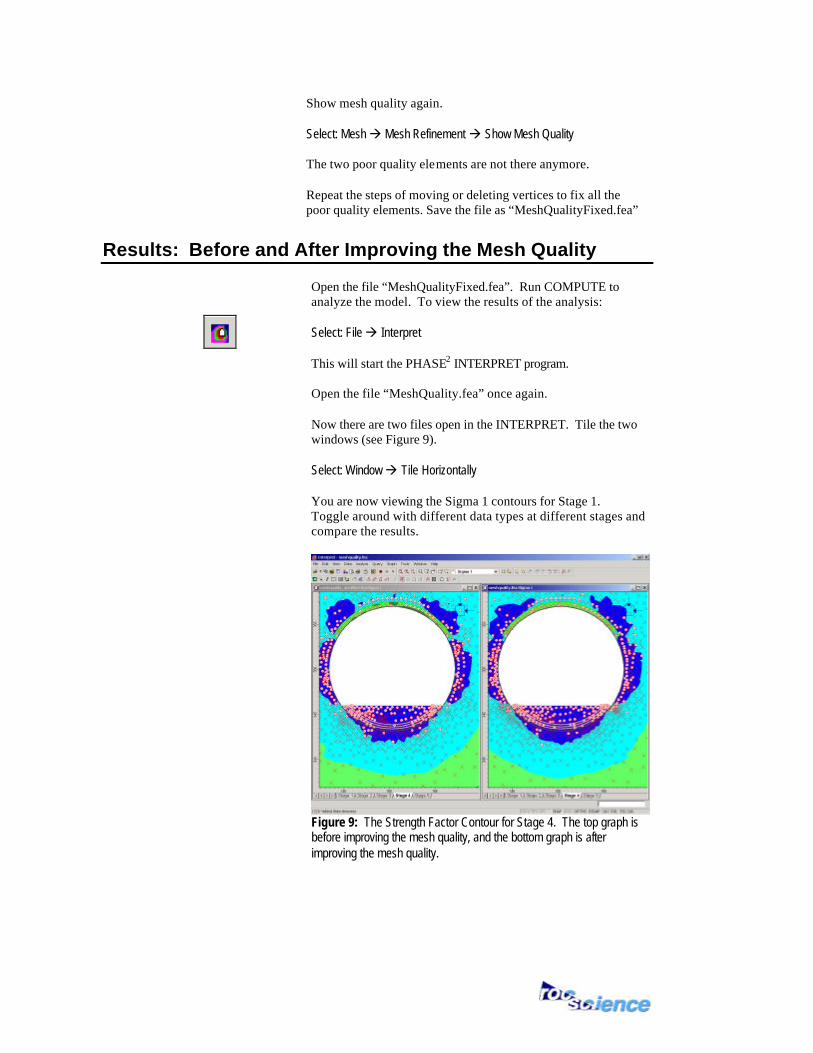
Open the file “MeshQualityFixed.fea”. Run COMPUTE to analyze the model. To view the results of the analysis: Select: File à Interpret This will start the PHASE2 INTERPRET program. Open the file “MeshQuality.fea” once again. Now there are two files open in the INTERPRET. Tile the two windows (see Figure 9). Select: Window à Tile Horizontally You are now viewing the Sigma 1 contours for Stage 1. Toggle around with different data types at different stages and compare the results.
Figure 9: The Strength Factor Contour for Stage 4. The top graph is before improving the mesh quality, and the bottom graph is after improving the mesh quality.
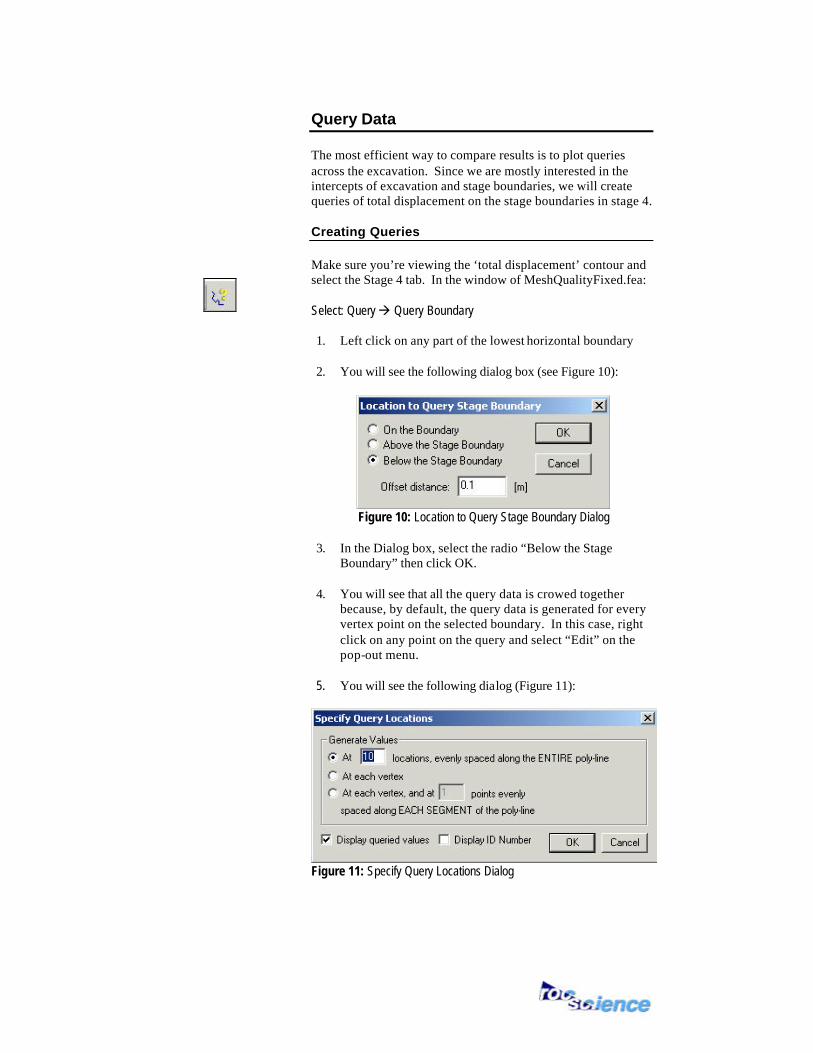
Query Data The most efficient way to compare results is to plot queries across the excavation. Since we are mostly interested in the intercepts of excavation and stage boundaries, we will create queries of total displacement on the stage boundaries in stage 4. Creating Queries Make sure you’re viewing the ‘total displacement’ contour and select the Stage 4 tab. In the window of MeshQualityFixed.fea: Select: Query à Query Boundary 1. Left click on any part of the lowest horizontal boundary
2. You will see the following dialog box (see Figure 10):
Figure 10: Location to Query Stage Boundary Dialog
3. In the Dialog box, select the radio “Below the Stage
Boundary” then click OK. 4. You will see that all the query data is crowed together
because, by default, the query data is generated for every vertex point on the selected boundary. In this case, right click on any point on the query and select “Edit” on the pop-out menu.
5. You will see the following dialog (Figure 11):
Figure 11: Specify Query Locations Dialog
6. Click on the first radio button and select OK on the dialog
box. 7. The values correspond to the stage and the data type you
are viewing. Select the stage tabs, and observe the change in the values.
8. Click on the window MeshQuality.fea and repeat the
above steps to create another query for the data before mesh refinement.
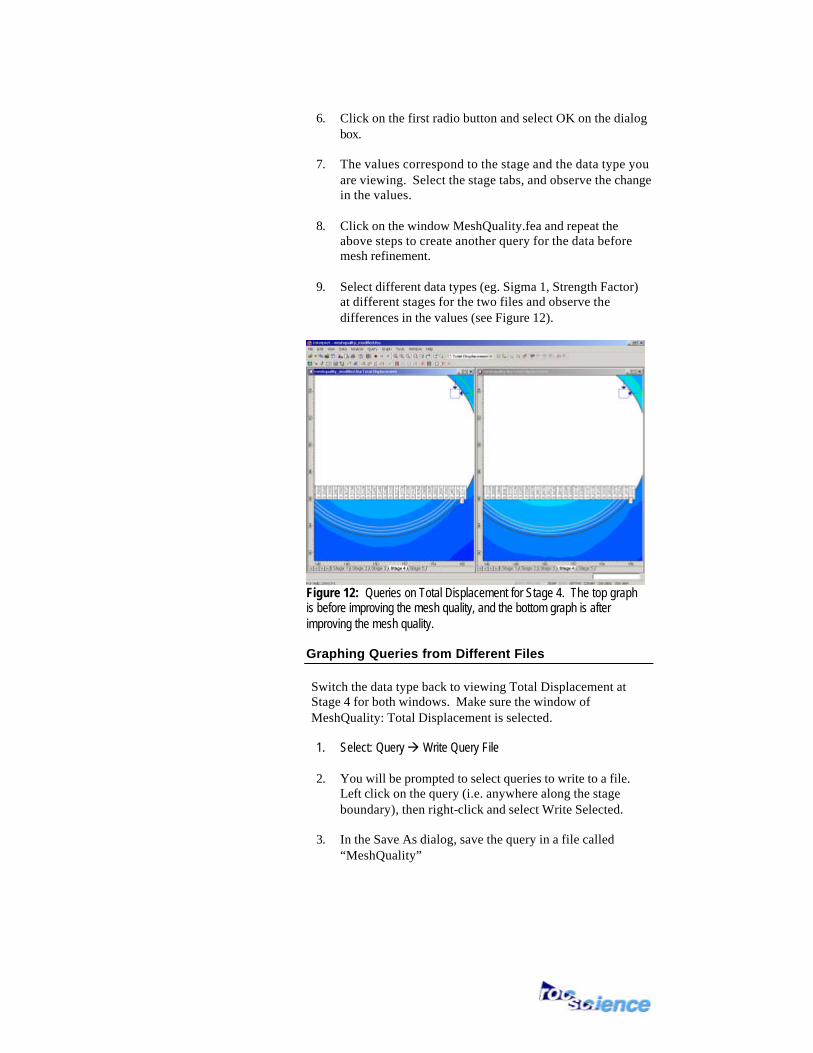
9. Select different data types (eg. Sigma 1, Strength Factor)
at different stages for the two files and observe the differences in the values (see Figure 12).
Figure 12: Queries on Total Displacement for Stage 4. The top graph is before improving the mesh quality, and the bottom graph is after improving the mesh quality. Graphing Queries from Different Files Switch the data type back to viewing Total Displacement at Stage 4 for both windows. Make sure the window of MeshQuality: Total Displacement is selected. 1. Select: Query à Write Query File
2. You will be prompted to select queries to write to a file.
Left click on the query (i.e. anywhere along the stage boundary), then right-click and select Write Selected.
3. In the Save As dialog, save the query in a file called
“MeshQuality”
4. You will see another dialog, allowing you to add a comment which identifies the file. This is optional, but you can put in “Before Mesh Refinement”, and select Add Comment.
5. Now select the window of MeshQualityFixed.fea: Total
Displacement. 6. Select: Graph à Graph Material Queries.
7. You will be prompted to select queries. Select the query
with a left mouse click. 8. Right-click the mouse and select Add From File.
9. In the Open file dialog, open the “MeshQuality” file that
you saved in step 3. 10. You should see an information dialog, informing you that
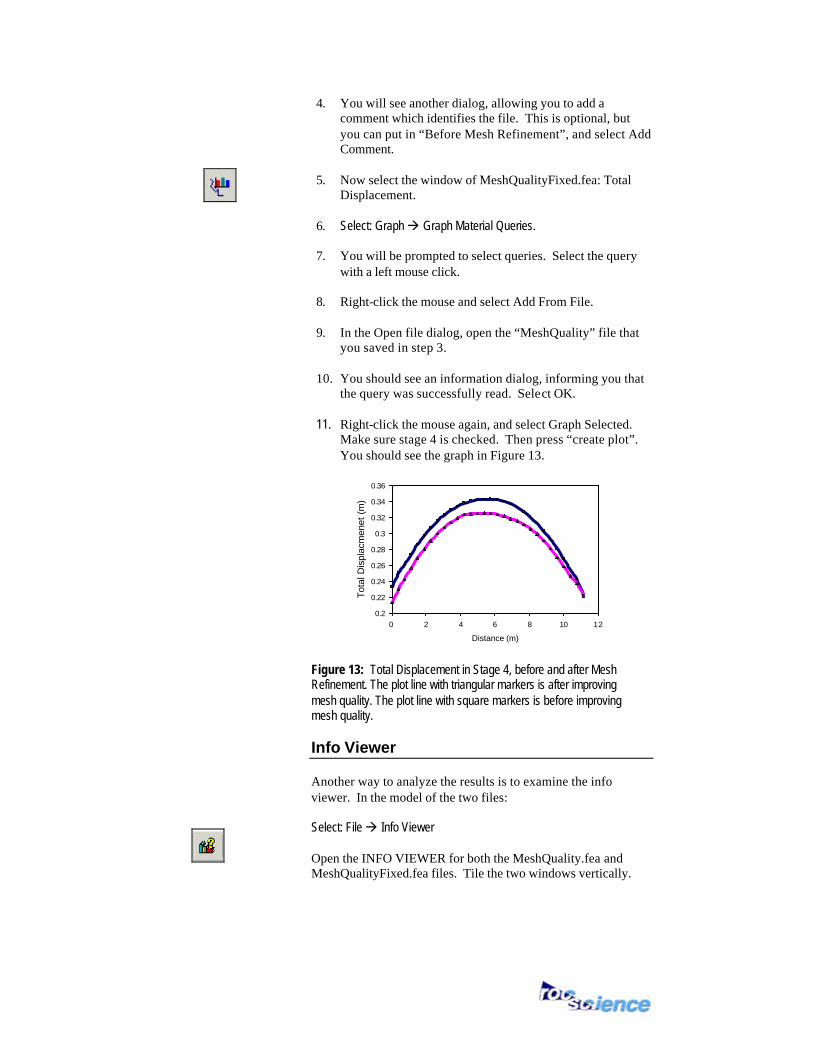
the query was successfully read. Select OK. 11. Right-click the mouse again, and select Graph Selected.
Make sure stage 4 is checked. Then press “create plot”. You should see the graph in Figure 13.
0.2
0.22
0.24
0.26
0.28
0.3
0.32
0.34
0.36
0 2 4 6 8 10 12
Distance (m)
Tota
l Dis
plac
men
et (
m)
Figure 13: Total Displacement in Stage 4, before and after Mesh Refinement. The plot line with triangular markers is after improving mesh quality. The plot line with square markers is before improving mesh quality. Info Viewer Another way to analyze the results is to examine the info viewer. In the model of the two files: Select: File à Info Viewer
Open the INFO VIEWER for both the MeshQuality.fea and MeshQualityFixed.fea files. Tile the two windows vertically.
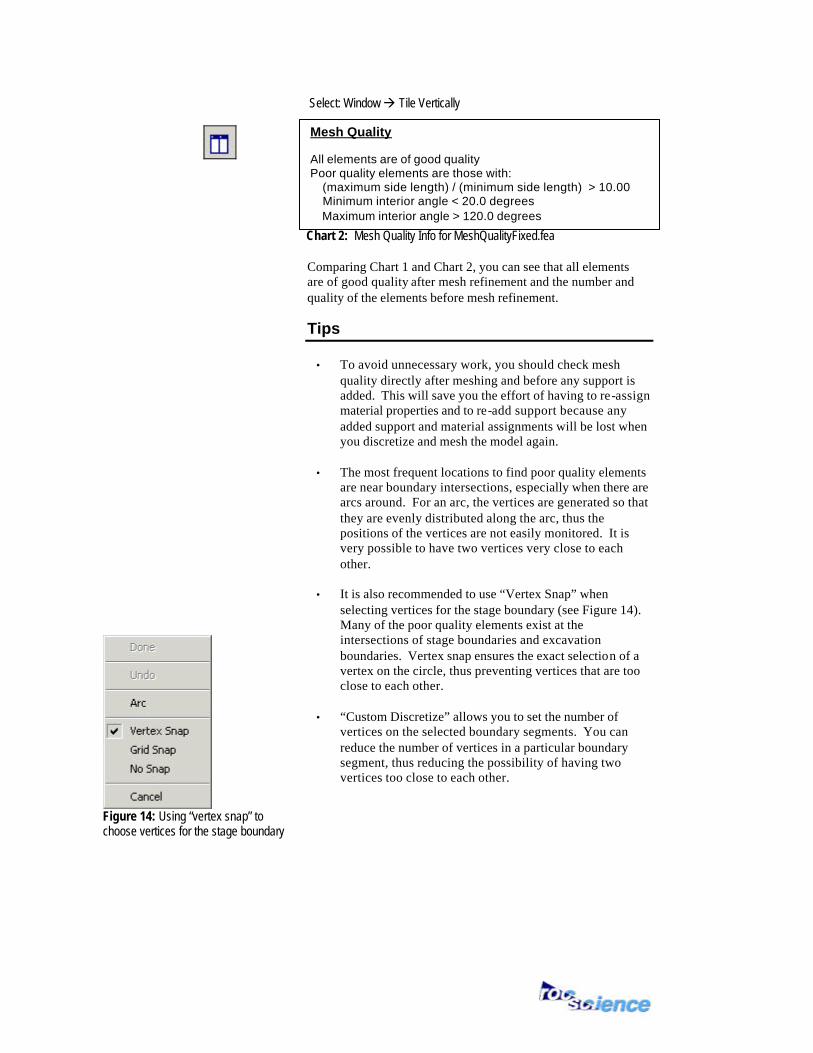
Figure 14: Using “vertex snap” to choose vertices for the stage boundary
Select: Window à Tile Vertically
Chart 2: Mesh Quality Info for MeshQualityFixed.fea
Comparing Chart 1 and Chart 2, you can see that all elements are of good quality after mesh refinement and the number and quality of the elements before mesh refinement. Tips
• To avoid unnecessary work, you should check mesh quality directly after meshing and before any support is added. This will save you the effort of having to re-assign material properties and to re-add support because any added support and material assignments will be lost when you discretize and mesh the model again.
• The most frequent locations to find poor quality elements
are near boundary intersections, especially when there are arcs around. For an arc, the vertices are generated so that they are evenly distributed along the arc, thus the positions of the vertices are not easily monitored. It is very possible to have two vertices very close to each other.
• It is also recommended to use “Vertex Snap” when
selecting vertices for the stage boundary (see Figure 14). Many of the poor quality elements exist at the intersections of stage boundaries and excavation boundaries. Vertex snap ensures the exact selection of a vertex on the circle, thus preventing vertices that are too close to each other.
• “Custom Discretize” allows you to set the number of
vertices on the selected boundary segments. You can reduce the number of vertices in a particular boundary segment, thus reducing the possibility of having two vertices too close to each other.
Mesh Quality All elements are of good quality Poor quality elements are those with: (maximum side length) / (minimum side length) > 10.00 Minimum interior angle < 20.0 degrees Maximum interior angle > 120.0 degrees