Embed Size (px)
Citation preview

WIND ENERGY FEASIBILITY STUDY
OAKLAND UNIVERSITY FACILITIES MANAGEMENT
Prepared by:
ALTERNATE ENERGY SOLUTIONS, INC. Gratiot Office Plaza – 2nd Floor
23801 Gratiot Ave. Eastpointe, Michigan 48021
Phone: (586) 498-8840 Facsimile: (586) 498-8858
March 30, 2008
IMPORTANT NOTICE
This study has been prepared by Alternate Energy Solutions, Inc. (“AESI”) for presentation
to the Facilities Management Department of Oakland University (“Oakland”) per the
requirements of the Agreement between Oakland and AESI. The staff of AESI and our
retained engineering associates used their collective best efforts to compile the information
in this feasibility study for the benefit of Oakland using a conservative mindset.
This Study has been prepared from information gathered by AESI, which makes no promises,
guarantees, or representations as to the accuracy or completeness of this document,
including, without restriction, economic and financial projection, and risk evaluation. No
part of this Study should be construed as legal, financial, or tax advice.
This document shall be considered confidential and proprietary, and is intended for the
internal use of Oakland only, unless otherwise specifically authorized by Oakland in writing.
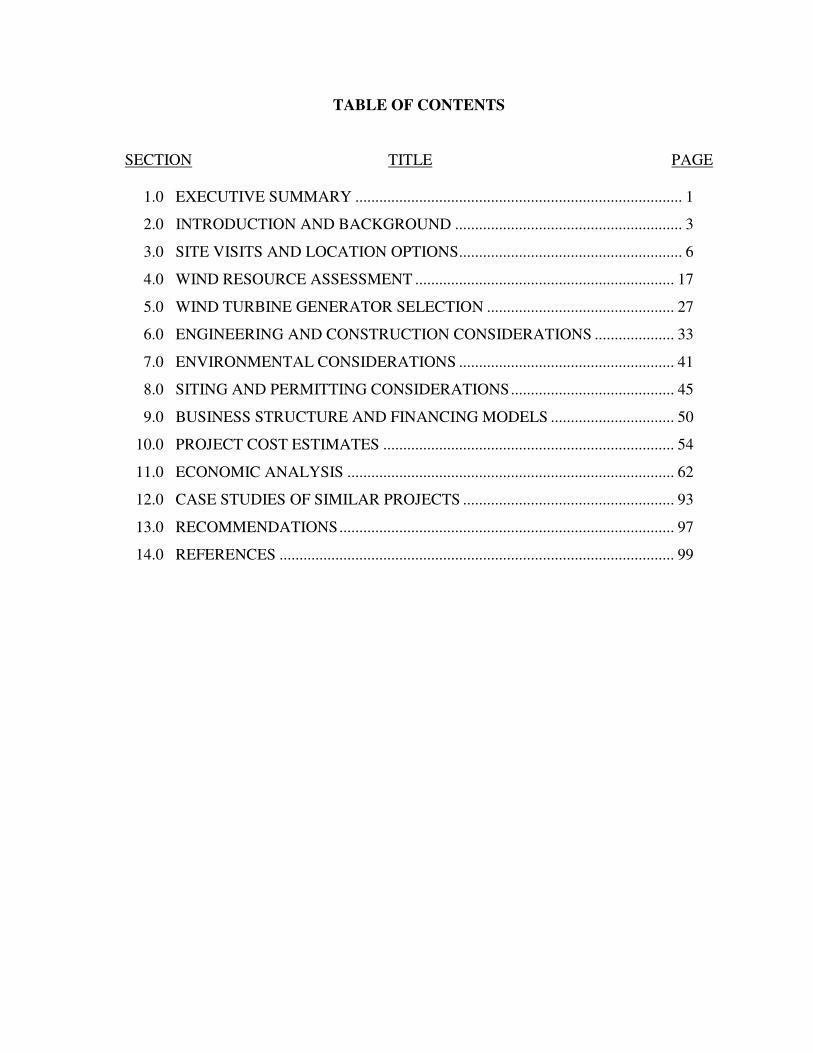
TABLE OF CONTENTS
SECTION TITLE PAGE
1.0 EXECUTIVE SUMMARY .................................................................................. 1
2.0 INTRODUCTION AND BACKGROUND ......................................................... 3
3.0 SITE VISITS AND LOCATION OPTIONS........................................................ 6
4.0 WIND RESOURCE ASSESSMENT ................................................................. 17
5.0 WIND TURBINE GENERATOR SELECTION ............................................... 27
6.0 ENGINEERING AND CONSTRUCTION CONSIDERATIONS .................... 33
7.0 ENVIRONMENTAL CONSIDERATIONS ...................................................... 41
8.0 SITING AND PERMITTING CONSIDERATIONS......................................... 45
9.0 BUSINESS STRUCTURE AND FINANCING MODELS ............................... 50
10.0 PROJECT COST ESTIMATES ......................................................................... 54
11.0 ECONOMIC ANALYSIS .................................................................................. 62
12.0 CASE STUDIES OF SIMILAR PROJECTS ..................................................... 93
13.0 RECOMMENDATIONS.................................................................................... 97
14.0 REFERENCES ................................................................................................... 99
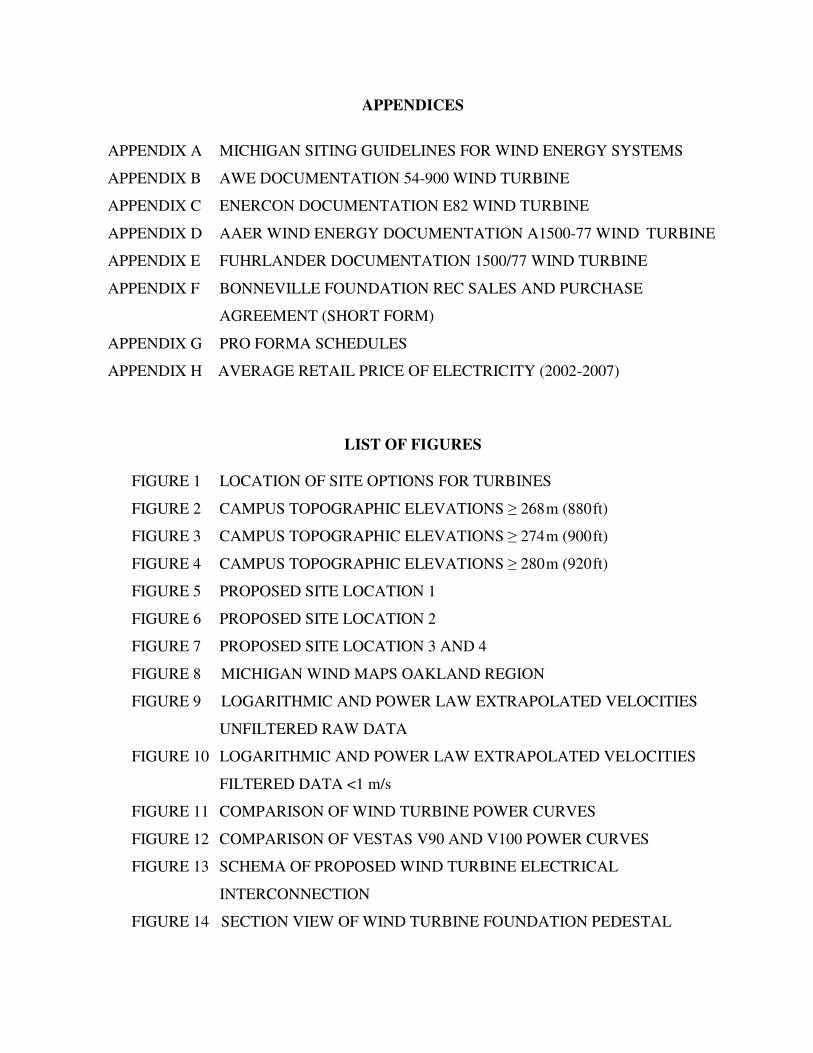
APPENDICES
APPENDIX A MICHIGAN SITING GUIDELINES FOR WIND ENERGY SYSTEMS
APPENDIX B AWE DOCUMENTATION 54-900 WIND TURBINE
APPENDIX C ENERCON DOCUMENTATION E82 WIND TURBINE
APPENDIX D AAER WIND ENERGY DOCUMENTATION A1500-77 WIND TURBINE
APPENDIX E FUHRLANDER DOCUMENTATION 1500/77 WIND TURBINE
APPENDIX F BONNEVILLE FOUNDATION REC SALES AND PURCHASE
AGREEMENT (SHORT FORM)
APPENDIX G PRO FORMA SCHEDULES
APPENDIX H AVERAGE RETAIL PRICE OF ELECTRICITY (2002-2007)
LIST OF FIGURES
FIGURE 1 LOCATION OF SITE OPTIONS FOR TURBINES
FIGURE 2 CAMPUS TOPOGRAPHIC ELEVATIONS � 268 m (880 ft)
FIGURE 3 CAMPUS TOPOGRAPHIC ELEVATIONS � 274 m (900 ft)
FIGURE 4 CAMPUS TOPOGRAPHIC ELEVATIONS � 280 m (920 ft)
FIGURE 5 PROPOSED SITE LOCATION 1
FIGURE 6 PROPOSED SITE LOCATION 2
FIGURE 7 PROPOSED SITE LOCATION 3 AND 4
FIGURE 8 MICHIGAN WIND MAPS OAKLAND REGION
FIGURE 9 LOGARITHMIC AND POWER LAW EXTRAPOLATED VELOCITIES
UNFILTERED RAW DATA
FIGURE 10 LOGARITHMIC AND POWER LAW EXTRAPOLATED VELOCITIES
FILTERED DATA <1 m/s
FIGURE 11 COMPARISON OF WIND TURBINE POWER CURVES
FIGURE 12 COMPARISON OF VESTAS V90 AND V100 POWER CURVES
FIGURE 13 SCHEMA OF PROPOSED WIND TURBINE ELECTRICAL
INTERCONNECTION
FIGURE 14 SECTION VIEW OF WIND TURBINE FOUNDATION PEDESTAL
LIST OF FIGURES (CONT’D)
FIGURE 15 THREADED ROD ASSEMBLY IN EXCAVATION HOLE
FIGURE 16 REINFORCING STEEL ROD MATRIX AND THREADED ASSEMBLY
FIGURE 17 FINISHED CONCRETE FOUNDATION PEDISTAL
FIGURE 18 SATELLITE PHOTO SOUTHEASTERN MICHIGAN
FIGURE 19 SATELLITE PHOTO OAKLAND UNIVERSITY
FIGURE 20 FOREST CITY SCHOOL’S WIND TURBINE
LIST OF TABLES TABLE 1 SITE ELEVATIONS AND DESCRIPTIONS
TABLE 2 MICHIGAN WIND MAP VELOCITY PROJECTIONS
TABLE 3 SURFACE ROUGHNESS VALUES VARIOUS TERRAINS
TABLE 4 POWER LAW EXPONENTS FOR VARIOUS TERRAINS
TABLE 5 COMPARISION OF MEAN WIND SPEEDS USING UNFILTERED AND
FILTERED DATA
TABLE 6 MEAN WIND SPEEDS USED FOR WIND TURBINE EVALUATION
TABLE 7 ENERGY CAPTURE FOR AAER/FUHRLANDER A-1500-77 AT 80 m
TABLE 8 ENERGY CAPTURE FOR AAER/FUHRLANDER A-1500-77 AT 100 m
TABLE 9 ENERGY CAPTURE FOR AMERICAS WIND ENERGY AWE 54-900
AT 75 m
TABLE 10 ENERGY CAPTURE FOR ENERCON E82 AT 80 m
TABLE 11 ENERGY CAPTURE FOR NORDEX S77 AT 100 m
TABLE 12 ENERGY CAPTURE FOR VESTAS V90 AT 100 m
TABLE 13 DETAIL DETROIT EDISON PRIMARY SUPPLY RATE (D6)
TABLE 14 AVIAN SPECIES WATCH LIST OAKLAND UNIVERSITY AREA
TABLE 15 VERTICAL DIMENSIONS FOR WIND TURBINES
TABLE 16 HORIZONTAL DISTANCES FROM POINTS OF REFERENCE
TABLE 17 ESTIMATED NOISE LEVELS BASED ON 104 db(A) AT NACELLE
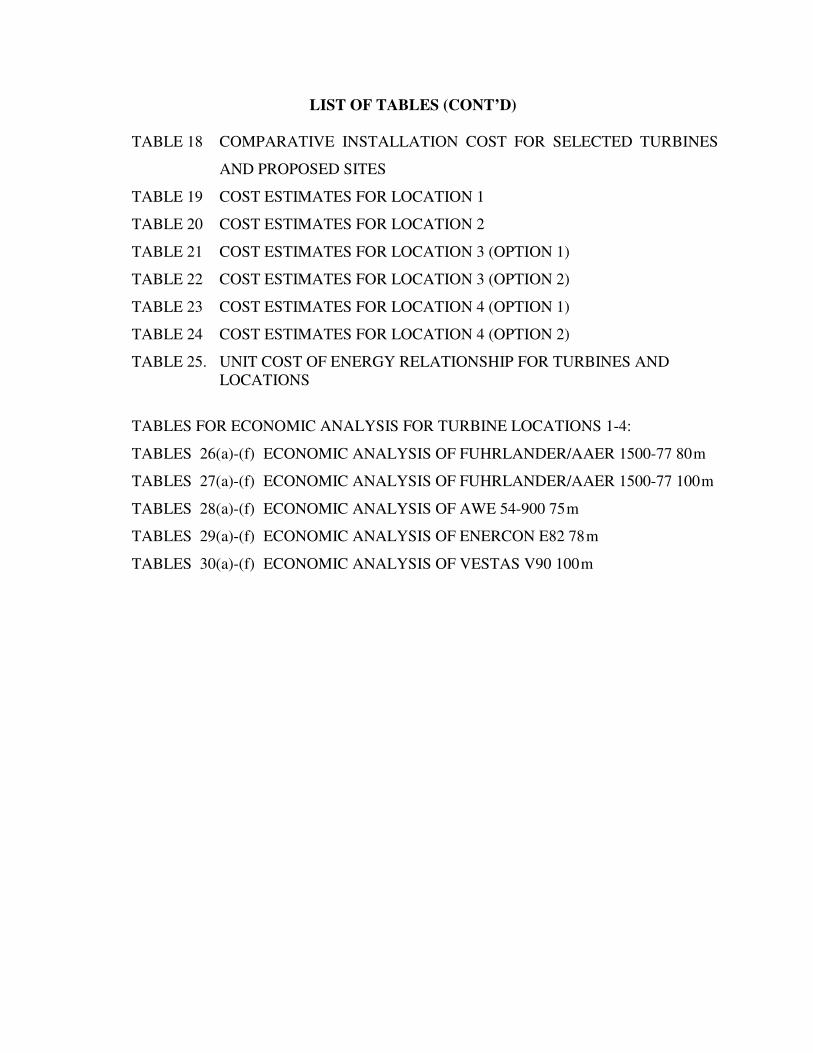
LIST OF TABLES (CONT’D) TABLE 18 COMPARATIVE INSTALLATION COST FOR SELECTED TURBINES
AND PROPOSED SITES
TABLE 19 COST ESTIMATES FOR LOCATION 1
TABLE 20 COST ESTIMATES FOR LOCATION 2
TABLE 21 COST ESTIMATES FOR LOCATION 3 (OPTION 1)
TABLE 22 COST ESTIMATES FOR LOCATION 3 (OPTION 2)
TABLE 23 COST ESTIMATES FOR LOCATION 4 (OPTION 1)
TABLE 24 COST ESTIMATES FOR LOCATION 4 (OPTION 2)
TABLE 25. UNIT COST OF ENERGY RELATIONSHIP FOR TURBINES AND LOCATIONS
TABLES FOR ECONOMIC ANALYSIS FOR TURBINE LOCATIONS 1-4:
TABLES 26(a)-(f) ECONOMIC ANALYSIS OF FUHRLANDER/AAER 1500-77 80 m
TABLES 27(a)-(f) ECONOMIC ANALYSIS OF FUHRLANDER/AAER 1500-77 100 m
TABLES 28(a)-(f) ECONOMIC ANALYSIS OF AWE 54-900 75 m
TABLES 29(a)-(f) ECONOMIC ANALYSIS OF ENERCON E82 78 m
TABLES 30(a)-(f) ECONOMIC ANALYSIS OF VESTAS V90 100 m
1
1.0 Executive Summary
The Oakland University Wind Energy Feasibility Study has determined that the wind resource at
Oakland’s Main Campus holds the potential to support wind turbine development for the primary
purpose of offsetting electrical energy consumption. The scope of study focused on select wind
turbine generators having nameplate ratings between 900 kW and 3,000 kW. Wind turbines with
rotor hub heights of 75 m, 80 m and 100 m were evaluated. Taller towers were available
depending on manufacturer, but were not part of the scope of this document.
The Study determined that the Unit Cost of Energy (UCE) for a wind turbine generator installed
on main campus would likely fall into the $0.085/kW-h to $0.101/kW-h range. UCE is cost that
would be incurred for the generation of each kilowatt-hour of energy if a facility were to be built.
UCE and cost/kW installed are standard industry measures. Both were calculated using
conservative estimates for wind speed, energy capture and initial capital cost expenditures,
applied over the expected 25-year life-cycle for the project provided the wind turbine generators
are placed at elevations of 80 m and 100 m as discussed herein.
The Study had, as an initial scope of work, the evaluation of three wind turbines at one installed
location. The Energy Manager requested that the Study be expanded to include the four proposed
locations identified in this document as Locations 1, 2, 3, and 4. Furthermore, Locations 3 and 4
were further evaluated with two feeder interconnect options identified as Option 1 and Option 2.
More detail on locations which were reviewed can be found in Section 3 - Site Visits and
Location Options. Of the four locations, we found that Locations 1 and 2 have the most
economic promise for development based on construction costs, disruption to campus grounds,
and the wind data collected and analyzed. Wind turbines having nameplate ratings of 1.5 MW
could be developed at either Location 1 or 2 for approximately $3,500,000 per turbine.
We recommend that the administration of Oakland University carefully consider the installation
of two 1.5 MW wind turbines manufactured by AAER of Canada. Total initial capital cost for
the project is estimated at $7,100,000 with a projected average annual electrical generation of
6,075,838 kW-h of energy.
2
The unit cost of energy from two turbines is estimated at $0.0887/kW-h with project payback
conservatively estimated over 16 years, using a 3% escalation factor for inflation. We believe
that the historical inflation rate for the cost of electrical energy (traditionally given by economists
as 3%) will not hold and will increase to an estimated rate of 4.5-4.8%. The anticipated increase
is expected due to increased demand, fuels costs and inflation in the underlying materials and
labor used to construct new generating baseload facilities.
Additional inflation risk from increased emission controls, renewable portfolio standards, and
carbon taxes or carbon cap-and-trade allowances are complex and have not been factored into
our estimate. Over the past five years the inflation rate for electrical energy prices encompassing
the residential, commercial and industrial sectors has averaged above 4.5%. The national average
cost of electricity ending December 2007 was $0.0914/kW-h compared to December 2002 price
of $0.0720/kW-h, according to the Department of Energy (see Appendix H).
It is important to emphasize that performance results will likely exceed the pro forma estimates
contained within this document, given the high degree of wind shear present in the data recorded
at main campus. Higher tower elevations will have improved energy capture operating results;
therefore, UCE could be reduced by a factor of 5-10%, depending on actual wind velocities
realized at the higher rotor hub elevations. Pro forma estimates and project payback may be
additionally bolstered by a higher than 3% inflation in the price of electricity.
A wind power density map should be commissioned for the main campus as part of the
engineering, normally prepared in the engineering phase of project development. This will
provide additional insight on wind power density at the elevations of 80 m and or 100 m. The
result from the mapping and micro-siting will be used to further refine economic pro forma
schedules. At such time, a definitive choice pertaining to tower height and how it will affect
system payback would be made.

3
2.0 Introduction and Background
Using the wind to generate electricity is not new technology; rather, it is the innovative
integration of existing technologies applied in a new way. From the small 10 kW wind turbines
first installed in California twenty years ago to the Enercon E-126 6,000 kW prototype recently
announced (126 m diameter rotor), wind power is rapidly growing in the United States and
internationally. The industry is posting a +20% annual growth rate for the past five years.
In recent years there has been increasing attention focused on understanding and quantifying the
impact of wind turbine development on numerous air pollutants and greenhouse gases (GHGs).
Global climate change is now widely recognized as fact, not fiction, and this increased awareness
by governments and concerned individuals across the world has placed additional focus on fossil
fuel emissions and improving the environment.
We need only look across the border to understand that renewable energy and wind power is at
our door. Last year the Province of Ontario, in an effort to bolster electrical supply and stem the
rising cost of electricity, announced the Ontario Power Authority Renewable Energy Standard
Offer Program (RESOP). The OPA’s RESOP is a feed-in tariff guarantee for electricity
generated by wind power and solar power. The price that the OPA guarantees to wind
generators is $110/MW-h ($0.11/Kw-h) and solar producers will receive $440/MW-h
($0.44/kW-h). Hundreds of proponent corporations and municipal entities have registered
projects with the OPA in the past year that the standard offer has been in effect. The contracts are
indexed to inflation.
Renewable generation has two inherent advantages. Once the resource is naturally replenished
and generating electrical energy from wind, the turbines produce zero direct emissions of air
pollutants. This positive attribute stands in vivid contrast to the emissions that are released each
day by fossil-fuel fired generators. In addition to zero direct emissions, wind power displaces an
equal amount of generation from fossil fuel generators which have direct emission of pollutants
into the environment.
4
The primary pollutants that are offset by wind generation include: sulfur dioxide, nitrogen oxides,
particulate matter, mercury, volatile organic compounds, trace heavy metals, and carbon dioxide.
The state of Michigan has over the years dealt with several notable pollution issues, from acid
rain and haze to mercury contamination which transfers from the air into the water of our Great
Lakes and farmlands, affecting the food chain. Eight counties in southeastern Michigan have
been designated by the federal government as Non-Attainment Counties for PM-2.5 and/or the 8-
hour Ozone Standard, namely, Lenawee, Livingston, Macomb, Monroe, Oakland, St. Clair,
Wayne and Washtenaw.
When wind energy is compared to fossil fuel-fired generation, it tends to have an economic
advantage and may be the preferred power source because operating costs to run wind turbines
are generally very low, i.e., no fuel cost. When turbines produce electrical energy, electric
generation supply from other sources will be reduced or not brought on-line. In most all cases,
the more expensive generators will have their output power reduced or “backed-down”. This is
the “avoided” cost to the utility generator. A number of investor-owned utilities are embracing
wind power over coal-fired generation and have made major investments into wind power
project development.
In Michigan, wind power has experienced a slow start. The investor-owned utilities have resisted
the implementation of renewable energy resources as part of diversifying their generation asset
portfolios. For many years considerable opposition has been encountered with enacting net-
metering rules so that consumers could receive an economic benefit for energy generated by on-
site resources and technology that would be sold back to the electrical infrastructure. Net-
metering did pass in Michigan; however, with a meager 30kw limit it has dubious value,
essentially being written for those who cannot effectively utilize the net-metering rule. A
Renewable Portfolio Standard (RPS) has been debated in Lansing over the past year. The RPS
was recently sidelined and is to be included in the state’s energy bill advocating that electric
choice be rescinded, having the potential to effectively remove new competition from the electric
utility sector.
5
With the profound economic downturn being experienced by the nation and our state, emphasis
is being placed on renewable energy technologies to diversify the state’s manufacturing base and
provide much needed employment to a displaced workforce. The falling U.S. dollar has created a
unique opportunity for manufacturers in our state to capitalize on the manufacturing wind turbine
components as foreign wind turbine manufacturers begin to take a serious look at Michigan.
Background
Alternate Energy Solutions, Inc. was commissioned by Oakland University to complete an
evaluation of the feasibility of integrating wind energy with the existing electrical distribution
and substation infrastructure on the main campus located in Rochester, Michigan. The work
completed as part of this undertaking included the collection of wind data for approximately two
years, review of the electrical substation and distribution feeder diagrams, several site visits to
inspect each of four possible turbine location options, investigating potential avian
environmental issues for the region, estimating construction costs for each of four proposed wind
turbine locations using two wind turbines having different generator nameplates and tower
heights, and developing a pro-forma for project’s cash flow respective of the options identified.
Upon the completion of the data collection presented in the document entitled Meteorological
Tower Data Compilation and Analysis – Oakland University, this report was prepared to discuss
the four sites considered on main campus, and to evaluate the feasibility of installing wind
turbines based on wind resource, initial capital cost, construction constraints, and operating cost.
The rationale for investigating electrical energy generation through the use of wind energy
conversion systems by Oakland is twofold. First and foremost is the offset current electrical
consumption providing a financial hedge against escalating energy costs; the second, equally
important consideration, was to set an example of environmental stewardship for the community.

6
3.0 Site Visits and Location Options
The first visit to main campus for evaluating prospective wind turbine installation locations was
conducted during the summer of 2007 with Terry Stollsteimer, Vice President for Facilities
Management, James Tallman, Director of Engineering, and James Leidel, Energy Manager. A
total of six possible sites were explored, each given careful consideration, before arriving at a
final site list for scrutiny under this feasibility study.
On January 2, 2008 the formal site visit and engineering meeting was held at Oakland for the
purpose of initiating this feasibility study. The final site list was trimmed to four options chosen
by Mr. Leidel and conveyed to AESI. Mr. Leidel directed AESI with regard to general project
scope envisioned by the university, wind turbine siting considerations, and recent discussions
held the Energy Manager’s office with DTE Energy regarding the introduction of wind turbine
generation on campus.
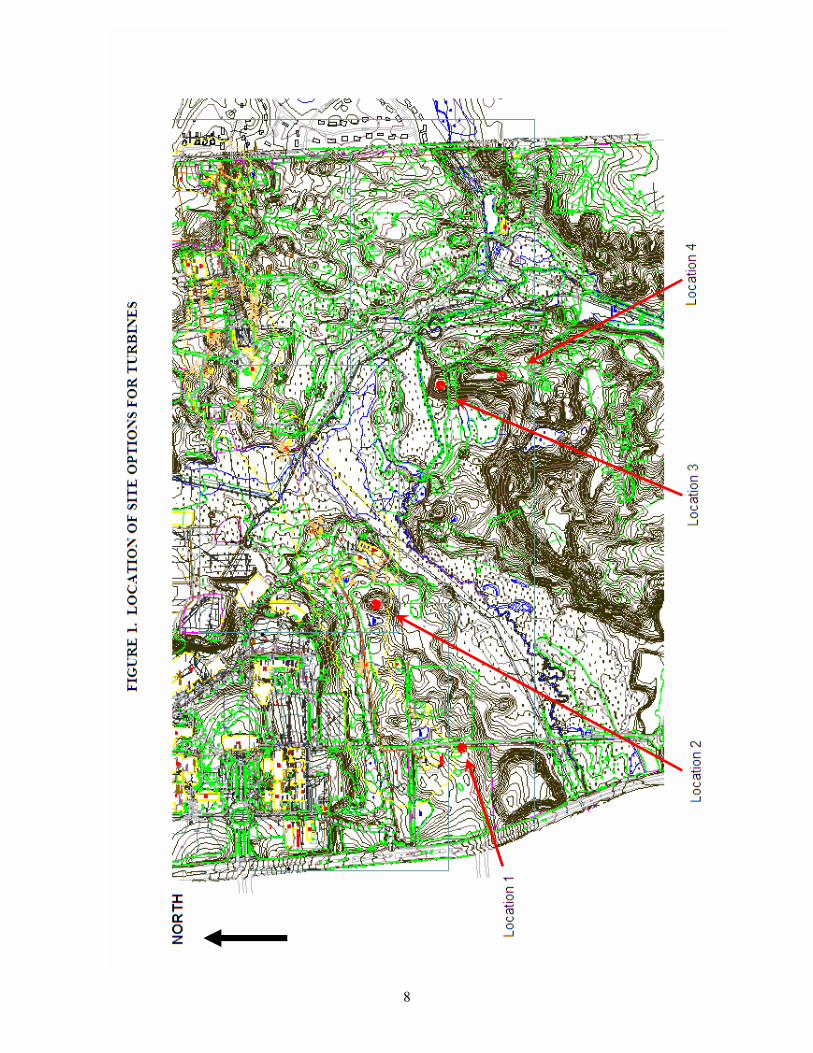
The four sites that were ultimately selected by the Energy Manager for this study were:
Location 1 Southeast of Spencer Substation;
Location 2 West of Grounds & Maintenance Building;
Location 3 South of Galloway Creek; and
Location 4 Minor Ridge South of Galloway Creek.
In this Study, sites were evaluated on various factors which included accessibility to electrical
infrastructure, roads and transportation, construction staging areas, crane access, elevation and
cost to restoring grounds disturbed by construction.
7
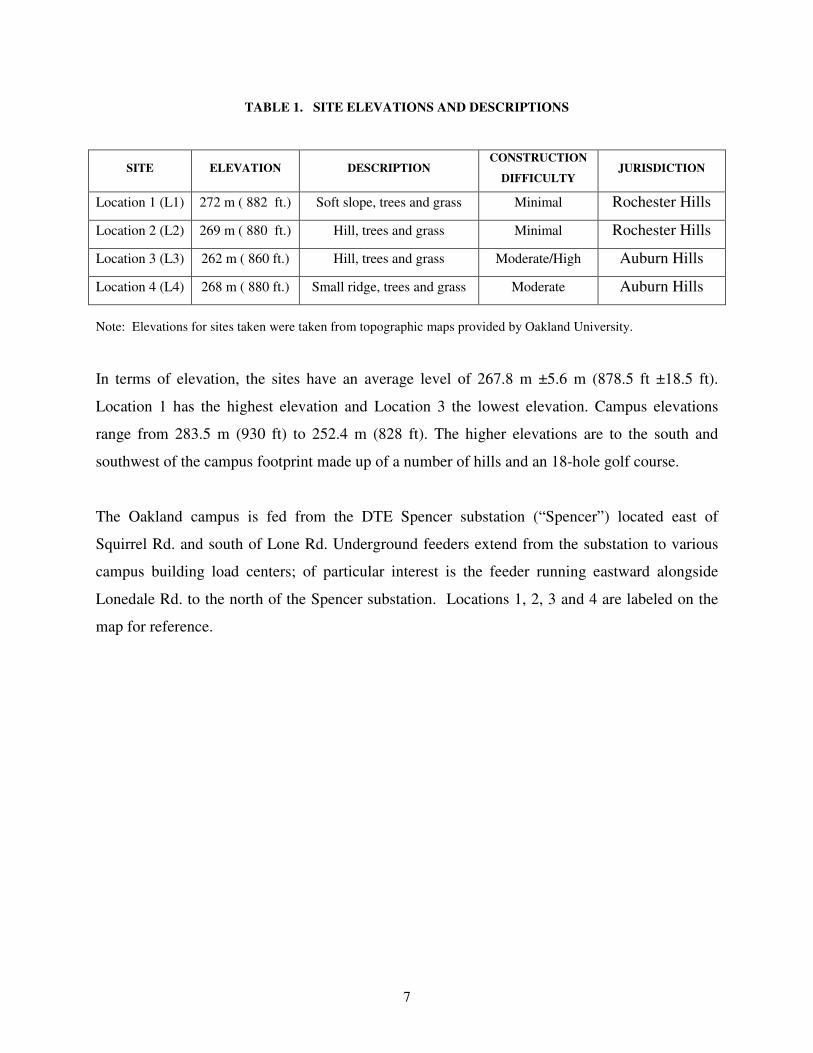
TABLE 1. SITE ELEVATIONS AND DESCRIPTIONS
SITE ELEVATION DESCRIPTION CONSTRUCTION
DIFFICULTY JURISDICTION
Location 1 (L1) 272 m ( 882 ft.) Soft slope, trees and grass Minimal Rochester Hills
Location 2 (L2) 269 m ( 880 ft.) Hill, trees and grass Minimal Rochester Hills
Location 3 (L3) 262 m ( 860 ft.) Hill, trees and grass Moderate/High Auburn Hills
Location 4 (L4) 268 m ( 880 ft.) Small ridge, trees and grass Moderate Auburn Hills
Note: Elevations for sites taken were taken from topographic maps provided by Oakland University.
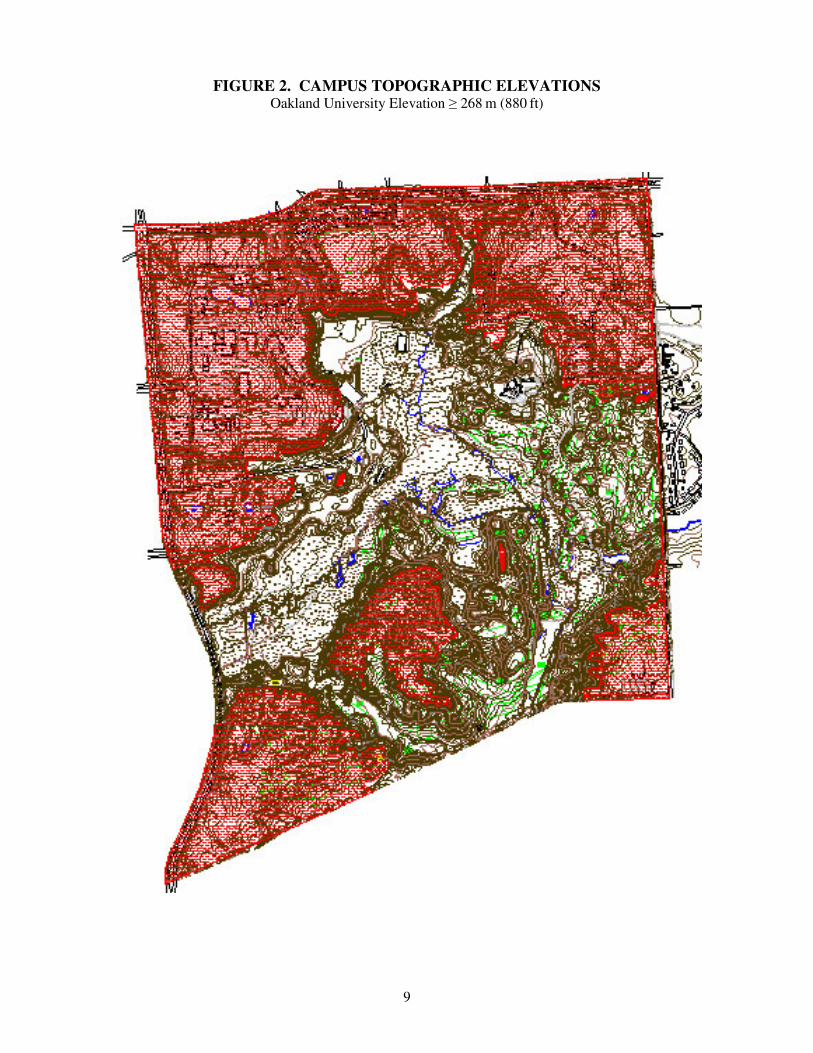
In terms of elevation, the sites have an average level of 267.8 m ±5.6 m (878.5 ft ±18.5 ft).
Location 1 has the highest elevation and Location 3 the lowest elevation. Campus elevations
range from 283.5 m (930 ft) to 252.4 m (828 ft). The higher elevations are to the south and
southwest of the campus footprint made up of a number of hills and an 18-hole golf course.
The Oakland campus is fed from the DTE Spencer substation (“Spencer”) located east of
Squirrel Rd. and south of Lone Rd. Underground feeders extend from the substation to various
campus building load centers; of particular interest is the feeder running eastward alongside
Lonedale Rd. to the north of the Spencer substation. Locations 1, 2, 3 and 4 are labeled on the
map for reference.
8
9
FIGURE 2. CAMPUS TOPOGRAPHIC ELEVATIONS Oakland University Elevation � 268 m (880 ft)

10
FIGURE 3. CAMPUS TOPOGRAPHIC ELEVATIONS Oakland University Elevation � 274 m (900 ft)

11
FIRGURE 4. CAMPUS TOPOGRAPHIC ELEVATIONS Oakland University Elevation � 280 m (920 ft)
12
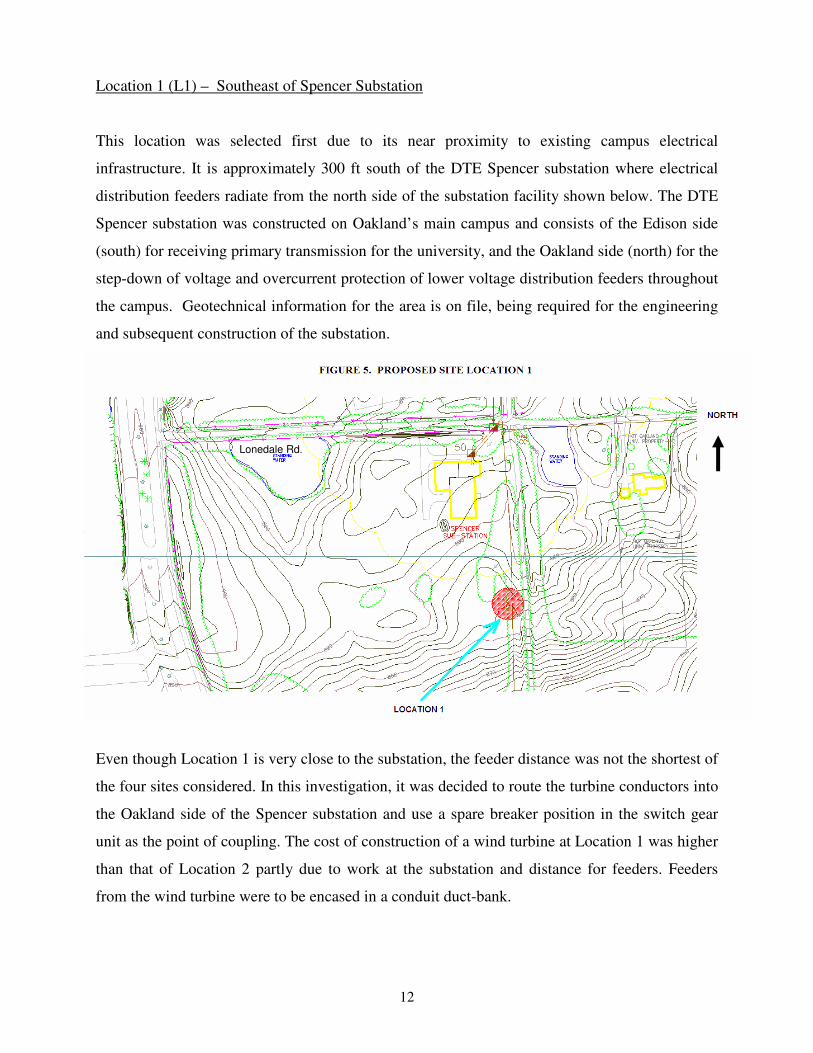
Location 1 (L1) – Southeast of Spencer Substation
This location was selected first due to its near proximity to existing campus electrical
infrastructure. It is approximately 300 ft south of the DTE Spencer substation where electrical
distribution feeders radiate from the north side of the substation facility shown below. The DTE
Spencer substation was constructed on Oakland’s main campus and consists of the Edison side
(south) for receiving primary transmission for the university, and the Oakland side (north) for the
step-down of voltage and overcurrent protection of lower voltage distribution feeders throughout
the campus. Geotechnical information for the area is on file, being required for the engineering
and subsequent construction of the substation.
Lonedale Rd.
Even though Location 1 is very close to the substation, the feeder distance was not the shortest of
the four sites considered. In this investigation, it was decided to route the turbine conductors into
the Oakland side of the Spencer substation and use a spare breaker position in the switch gear
unit as the point of coupling. The cost of construction of a wind turbine at Location 1 was higher
than that of Location 2 partly due to work at the substation and distance for feeders. Feeders
from the wind turbine were to be encased in a conduit duct-bank.
13
Heavy equipment maneuverability and the available area for staging wind turbine components
prior to assembly were deemed to be adequate. Minor clearing of trees and overgrowth would be
required before delivery of wind turbine components and commencing construction.
In our investigation of this location, we did not know whether Oakland would be open to
construction traffic through the south side of the campus along Pioneer Drive. Therefore, we
elected to incorporate in our cost estimate for L1 the construction of an access road off of North
Squirrel Rd. Access to location L1 from Lonedale Rd. does not afford sufficient turning radius
for equipment entrance and egress.
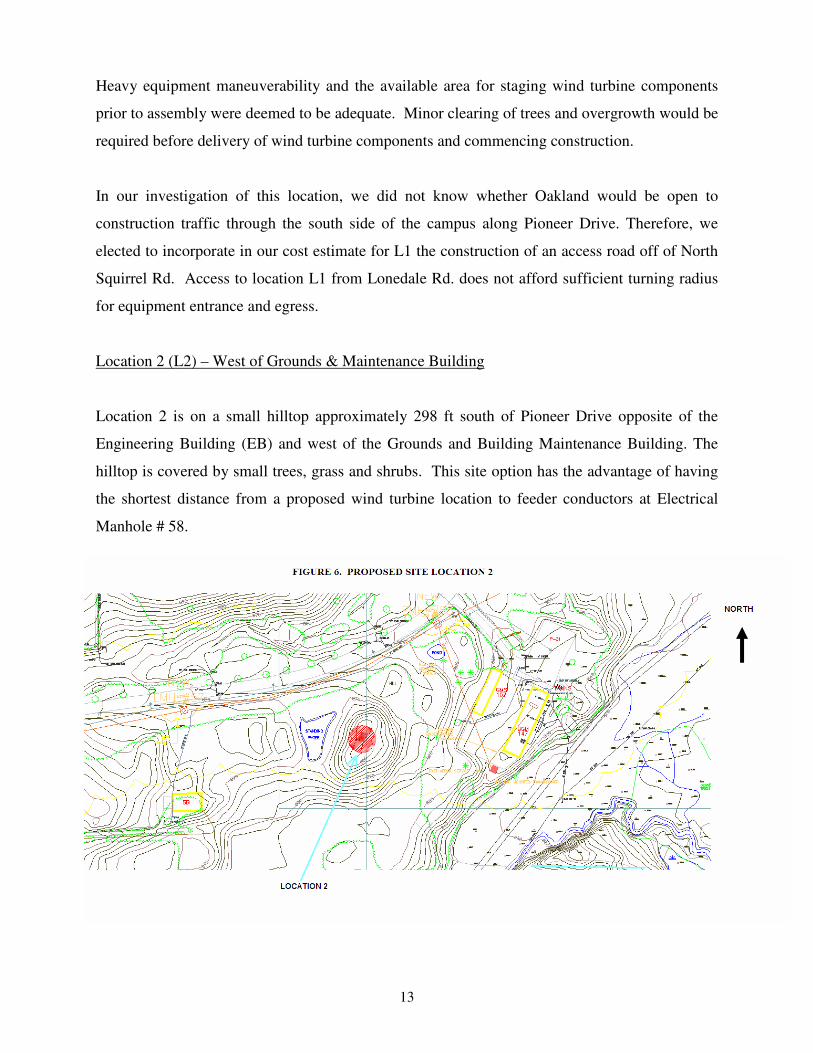
Location 2 (L2) – West of Grounds & Maintenance Building
Location 2 is on a small hilltop approximately 298 ft south of Pioneer Drive opposite of the
Engineering Building (EB) and west of the Grounds and Building Maintenance Building. The
hilltop is covered by small trees, grass and shrubs. This site option has the advantage of having
the shortest distance from a proposed wind turbine location to feeder conductors at Electrical
Manhole # 58.

14
Location 3 (L3) – South of Galloway Creek
This site is on a hilltop approximately 195 ft south of Galloway Creek which is approximately
5.5m (18 ft) wide. Galloway Creek generally runs east and west across the main campus. This
Site Option is identified in the Figure 5 below; roughly 2,430 ft west of Adams Rd. and 3,475 ft
north of River Oaks Blvd. The site is covered by grown trees and grass. This location would pose
staging difficulties for crane maneuverability and layout of components prior to construction of
the wind turbine.
Construction costs for Location 3 were estimated higher than the other three site options. This
location would require special access routes from the north side of the campus and crossing
Galloway Creek, which would cause problems and delays with encroachment into the wetlands,
and the costs of constructing an adequate bridge or culvert across Galloway Creek. To
accommodate the request of the Energy Manager, we elected to estimate the cost of an alternate
route necessitating the use of Butler Rd., along the southern fringe of the golf course, as the
primary access. We were not directed to estimate the cost of constructing a bridge or culvert in
order to cross Galloway Creek.
Lacking any detailed flow or dimensional data that would be relative to the existing bridge over
Galloway Creek, we have used the topographic map for the area to develop a general set of
design parameters for a new heavier duty crossing. We estimate the existing bridge clearance
span to be approximately 20 feet with a waterway clearance estimated at approximately 3 feet,
below the bottom side of the existing bridge deck. Our online research indicates that Galloway
Creek is not a USGS monitored stream and therefore flow data is not readily available. A check
of the Oakland County Drain Commission also did not provide any flow information.
In our judgment the construction of a new, heavy duty bridge to span this portion of Galloway
Creek would be simply too expensive for access to either Location 3 or 4. The anticipated axle
loads of the vehicles crossing this structure could range between 15,000 pounds to 26,000
pounds, with the higher end numbers considerably above nominal highway design loads.
15
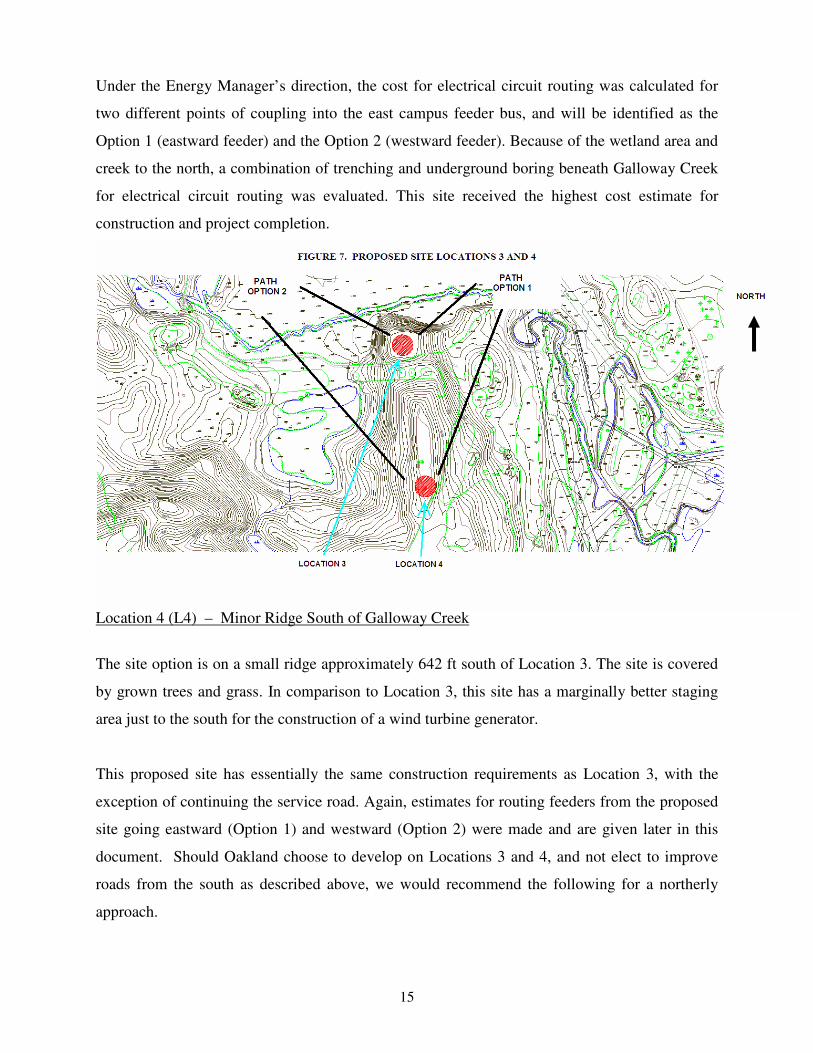
Under the Energy Manager’s direction, the cost for electrical circuit routing was calculated for
two different points of coupling into the east campus feeder bus, and will be identified as the
Option 1 (eastward feeder) and the Option 2 (westward feeder). Because of the wetland area and
creek to the north, a combination of trenching and underground boring beneath Galloway Creek
for electrical circuit routing was evaluated. This site received the highest cost estimate for
construction and project completion.
Location 4 (L4) – Minor Ridge South of Galloway Creek
The site option is on a small ridge approximately 642 ft south of Location 3. The site is covered
by grown trees and grass. In comparison to Location 3, this site has a marginally better staging
area just to the south for the construction of a wind turbine generator.
This proposed site has essentially the same construction requirements as Location 3, with the
exception of continuing the service road. Again, estimates for routing feeders from the proposed
site going eastward (Option 1) and westward (Option 2) were made and are given later in this
document. Should Oakland choose to develop on Locations 3 and 4, and not elect to improve
roads from the south as described above, we would recommend the following for a northerly
approach.
16
A pair of pre-cast reinforced concrete box culverts with an inside dimension of 8 ft x 5 ft could
be assembled to traverse Galloway Creek. Each culvert being 20 feet long, they would together
provide a total waterway crossing area of 800 square feet. We would recommend new soil
borings to determine the amount of undercut that would be required along with the amount of
stone bedding that would be needed to provide adequate support for the box culverts.
Permits may need to be obtained from the Army Corp of Engineers, the Oakland County Drain
Commission, the Michigan DNR and the Michigan DOT. Oakland’s property is identified as
state land and, therefore, under special jurisdiction and permitting regulations.
Improvements to Butler Rd would be required to handle the construction traffic. The
construction of a temporary road would also commence just east of the #15 Green and proceed
northward through the #4 and #16 Tees for a distance of approximately 500 ft. The road would
continue in a northwesterly heading for an additional 1,200 ft, crossing the #5 Fairway. At this
point the road would then progress in a northeasterly direction around the base of the hill, for
about 700 ft. to the top of the hill, the proposed worksite. An additional 400 ft. of roadway
crossing Fairway #14 would be required to reach Location 3. Geotechnical samples would be
required along the final roadway route to determine actual soil strength and road design.
17
4. Wind Resource Assessment
AESI has developed an initial wind resource assessment for Oakland from 22 months of wind
data collected by a 50 meter meteorological tower located on campus. We used the collected data
from the meteorological tower, the Michigan Wind Energy Map and the Canadian Wind Atlas to
develop this wind speed assessment. Energy capture computations were performed using
industry standard Mistaya Engineering, Windographer Analysis Version 1.12, under license to
AESI.
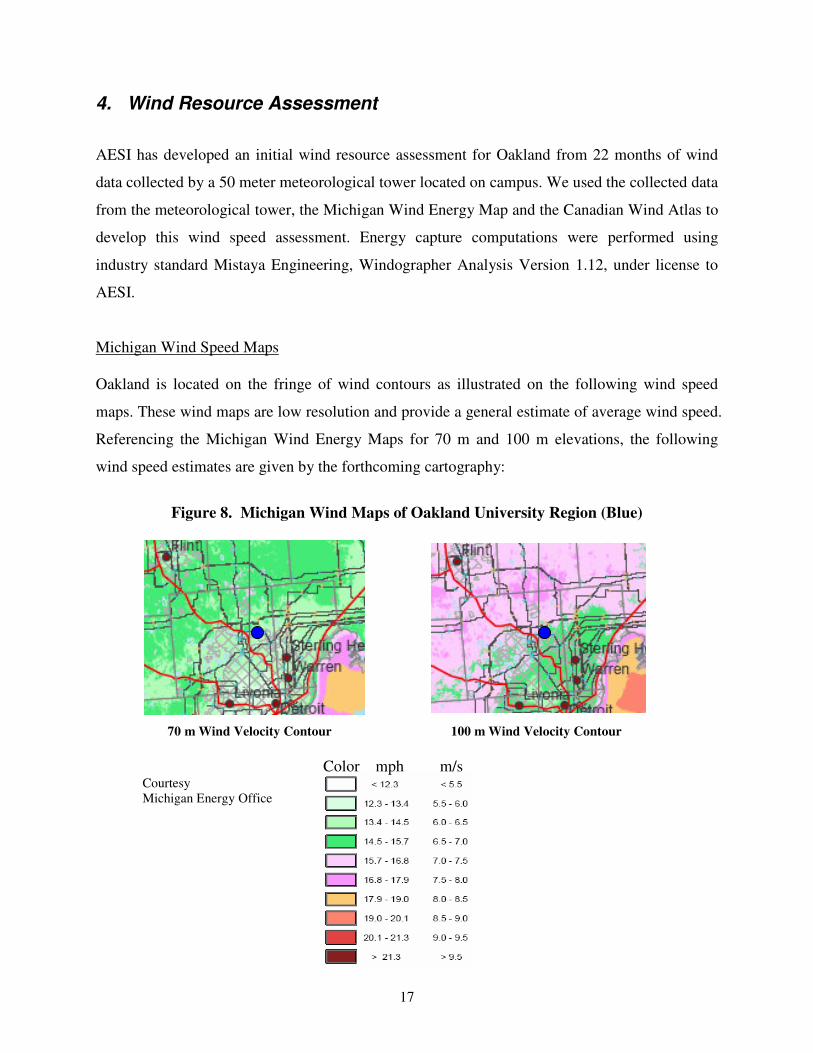
Michigan Wind Speed Maps Oakland is located on the fringe of wind contours as illustrated on the following wind speed
maps. These wind maps are low resolution and provide a general estimate of average wind speed.
Referencing the Michigan Wind Energy Maps for 70 m and 100 m elevations, the following
wind speed estimates are given by the forthcoming cartography:
Figure 8. Michigan Wind Maps of Oakland University Region (Blue)
70 m Wind Velocity Contour 100 m Wind Velocity Contour
Color mph m/s
Courtesy Michigan Energy Office

18
The mean annual wind speeds for Oakland’s main campus area inferred from the previous wind
maps are arrange in the following table by elevation and velocity.
TABLE 2. MICHIGAN WIND MAP VELOCITY PROJECTIONS
Michigan Wind Map Data
Mapped Elevation Projected Wind Velocity (m/s) Projected Wind Velocity (mph) 70 m 5.5 – 6.0 12.3 – 13.4
100 m 6.5 – 7.0 14.5 – 15.7
Wind Shear Assessment
The importance of characterizing the wind shear at a given location under consideration for a
utility scale wind turbine cannot be overemphasized. Wind shear describes the change of wind
velocity as a function of elevation above ground. Understanding wind shear is important because
it has a direct impact on the mechanical wind power available for conversion at turbine hub
height. Wind shear also causes cyclic loading of the rotor blades. The wind speed tends to
increase with the height above ground and is affected by season, time of day, topography,
buildings, and ground cover.
In the white paper Analysis of Wind Shear Models and Trends in Different Terrains, Ray, Rogers
and McGowan, University of Massachusetts, Renewable Energy Research Laboratory(1) the
matter of error in extrapolating wind velocity in high wind shear areas was summarized by…
“Several U.S. tall towers wind data sets were used to determine the accuracies of different
wind shear methods, especially for sites having hills or heavy wooded forests. The results
showed that the most accurate predictions for hub height wind speed characterizations were
obtained when only wind speed data greater that 4 m/s (8.94 mph) were considered. Based on
a statistical analysis of the prediction errors, there was no significant difference between the
performance of the log and power laws; using either may result in inaccurate predictions of
hub height mean wind speeds.”
19
ln
lnU(z r)
U(z)=
zo
z
z r
zo
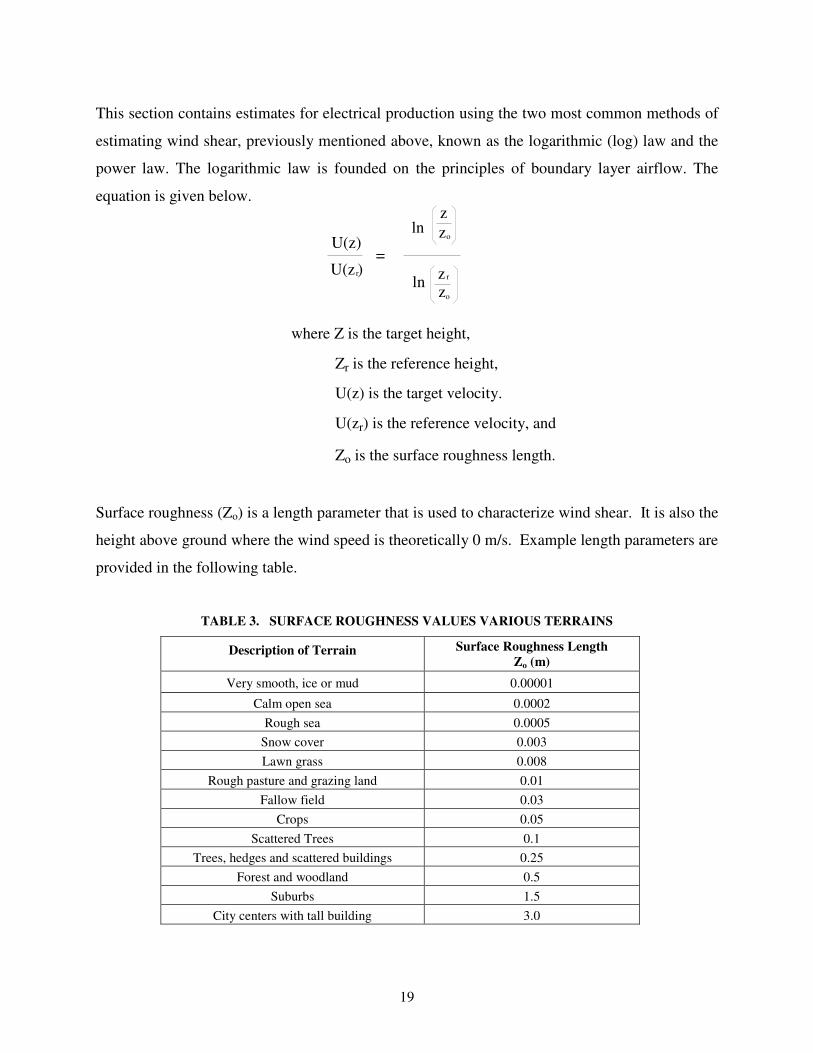
This section contains estimates for electrical production using the two most common methods of
estimating wind shear, previously mentioned above, known as the logarithmic (log) law and the
power law. The logarithmic law is founded on the principles of boundary layer airflow. The
equation is given below.
where Z is the target height,
Zr is the reference height,
U(z) is the target velocity.
U(zr) is the reference velocity, and
Zo is the surface roughness length.
Surface roughness (Zo) is a length parameter that is used to characterize wind shear. It is also the
height above ground where the wind speed is theoretically 0 m/s. Example length parameters are
provided in the following table.
TABLE 3. SURFACE ROUGHNESS VALUES VARIOUS TERRAINS
Description of Terrain Surface Roughness Length Zo (m)
Very smooth, ice or mud 0.00001
Calm open sea 0.0002 Rough sea 0.0005
Snow cover 0.003 Lawn grass 0.008
Rough pasture and grazing land 0.01 Fallow field 0.03
Crops 0.05 Scattered Trees 0.1
Trees, hedges and scattered buildings 0.25 Forest and woodland 0.5
Suburbs 1.5 City centers with tall building 3.0
20
�
=U(z )r
U(z) zz r
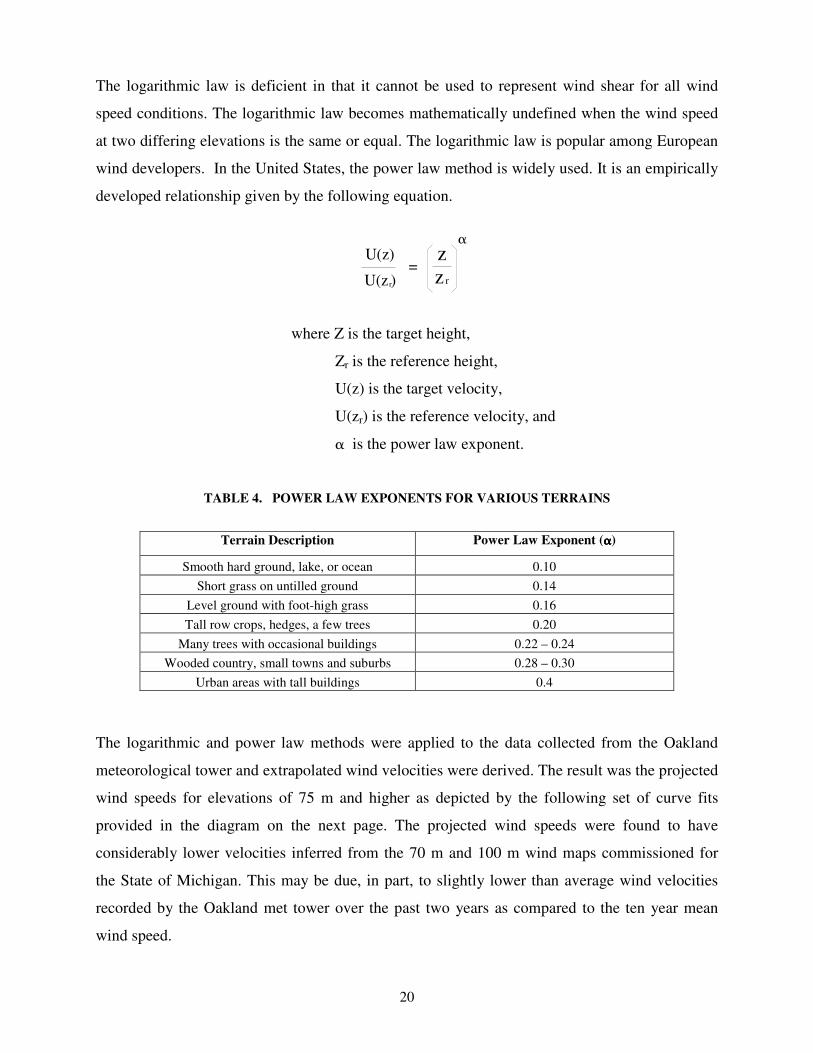
The logarithmic law is deficient in that it cannot be used to represent wind shear for all wind
speed conditions. The logarithmic law becomes mathematically undefined when the wind speed
at two differing elevations is the same or equal. The logarithmic law is popular among European
wind developers. In the United States, the power law method is widely used. It is an empirically
developed relationship given by the following equation.
where Z is the target height,
Zr is the reference height,
U(z) is the target velocity,
U(zr) is the reference velocity, and
�� is the power law exponent.
TABLE 4. POWER LAW EXPONENTS FOR VARIOUS TERRAINS
The logarithmic and power law methods were applied to the data collected from the Oakland
meteorological tower and extrapolated wind velocities were derived. The result was the projected
wind speeds for elevations of 75 m and higher as depicted by the following set of curve fits
provided in the diagram on the next page. The projected wind speeds were found to have
considerably lower velocities inferred from the 70 m and 100 m wind maps commissioned for
the State of Michigan. This may be due, in part, to slightly lower than average wind velocities
recorded by the Oakland met tower over the past two years as compared to the ten year mean
wind speed.
Terrain Description Power Law Exponent (����)
Smooth hard ground, lake, or ocean 0.10 Short grass on untilled ground 0.14
Level ground with foot-high grass 0.16 Tall row crops, hedges, a few trees 0.20
Many trees with occasional buildings 0.22 – 0.24 Wooded country, small towns and suburbs 0.28 – 0.30
Urban areas with tall buildings 0.4
21
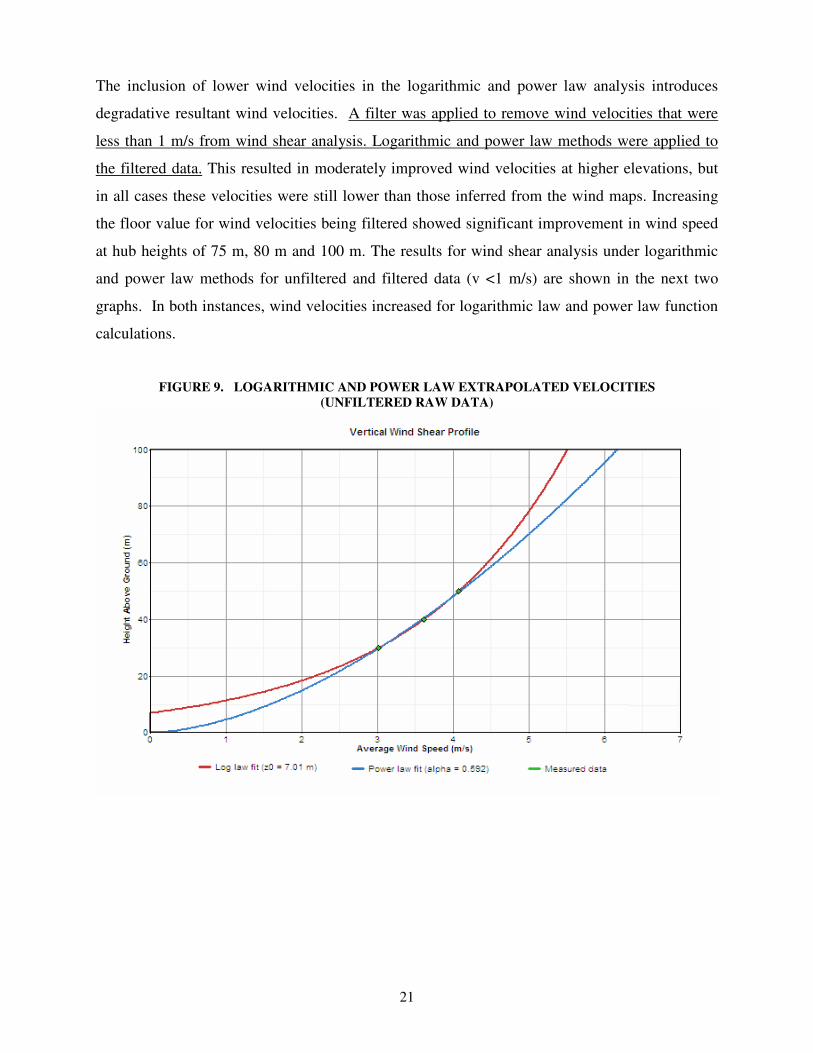
The inclusion of lower wind velocities in the logarithmic and power law analysis introduces
degradative resultant wind velocities. A filter was applied to remove wind velocities that were
less than 1 m/s from wind shear analysis. Logarithmic and power law methods were applied to
the filtered data. This resulted in moderately improved wind velocities at higher elevations, but
in all cases these velocities were still lower than those inferred from the wind maps. Increasing
the floor value for wind velocities being filtered showed significant improvement in wind speed
at hub heights of 75 m, 80 m and 100 m. The results for wind shear analysis under logarithmic
and power law methods for unfiltered and filtered data (v <1 m/s) are shown in the next two
graphs. In both instances, wind velocities increased for logarithmic law and power law function
calculations.
FIGURE 9. LOGARITHMIC AND POWER LAW EXTRAPOLATED VELOCITIES (UNFILTERED RAW DATA)
22
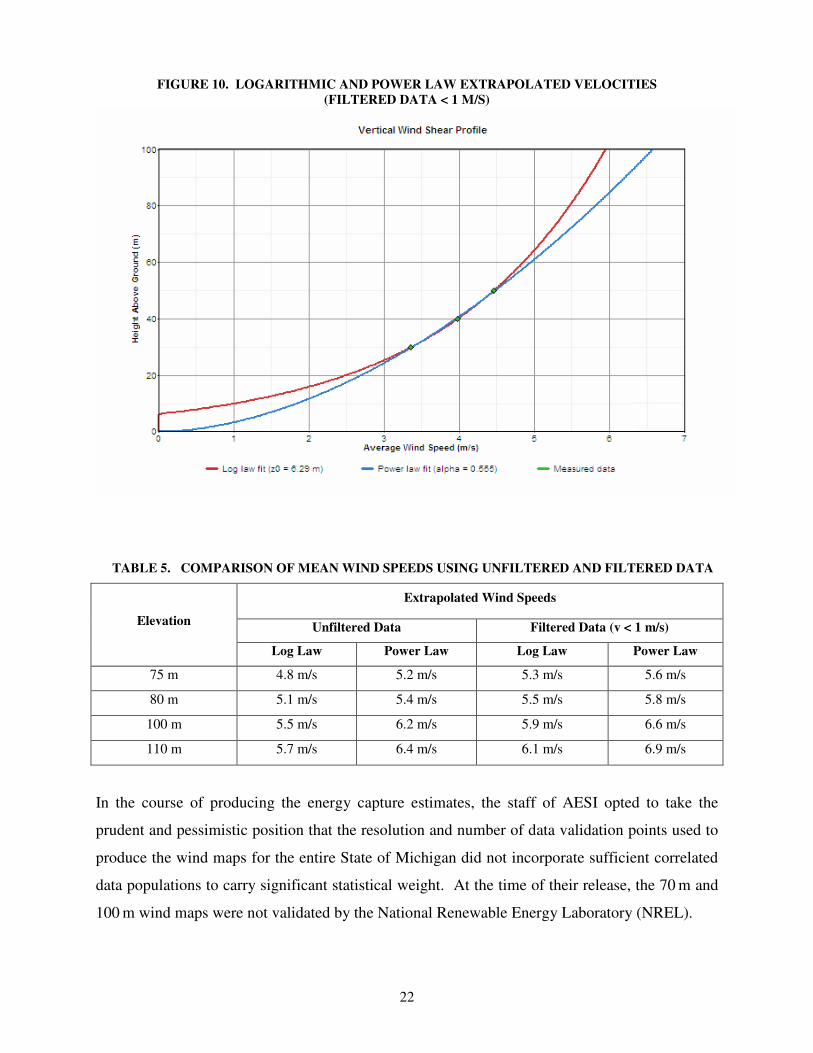
FIGURE 10. LOGARITHMIC AND POWER LAW EXTRAPOLATED VELOCITIES (FILTERED DATA < 1 M/S)
TABLE 5. COMPARISON OF MEAN WIND SPEEDS USING UNFILTERED AND FILTERED DATA
Extrapolated Wind Speeds
Unfiltered Data Filtered Data (v < 1 m/s) Elevation
Log Law Power Law Log Law Power Law
75 m 4.8 m/s 5.2 m/s 5.3 m/s 5.6 m/s
80 m 5.1 m/s 5.4 m/s 5.5 m/s 5.8 m/s
100 m 5.5 m/s 6.2 m/s 5.9 m/s 6.6 m/s
110 m 5.7 m/s 6.4 m/s 6.1 m/s 6.9 m/s
In the course of producing the energy capture estimates, the staff of AESI opted to take the
prudent and pessimistic position that the resolution and number of data validation points used to
produce the wind maps for the entire State of Michigan did not incorporate sufficient correlated
data populations to carry significant statistical weight. At the time of their release, the 70 m and
100 m wind maps were not validated by the National Renewable Energy Laboratory (NREL).
23
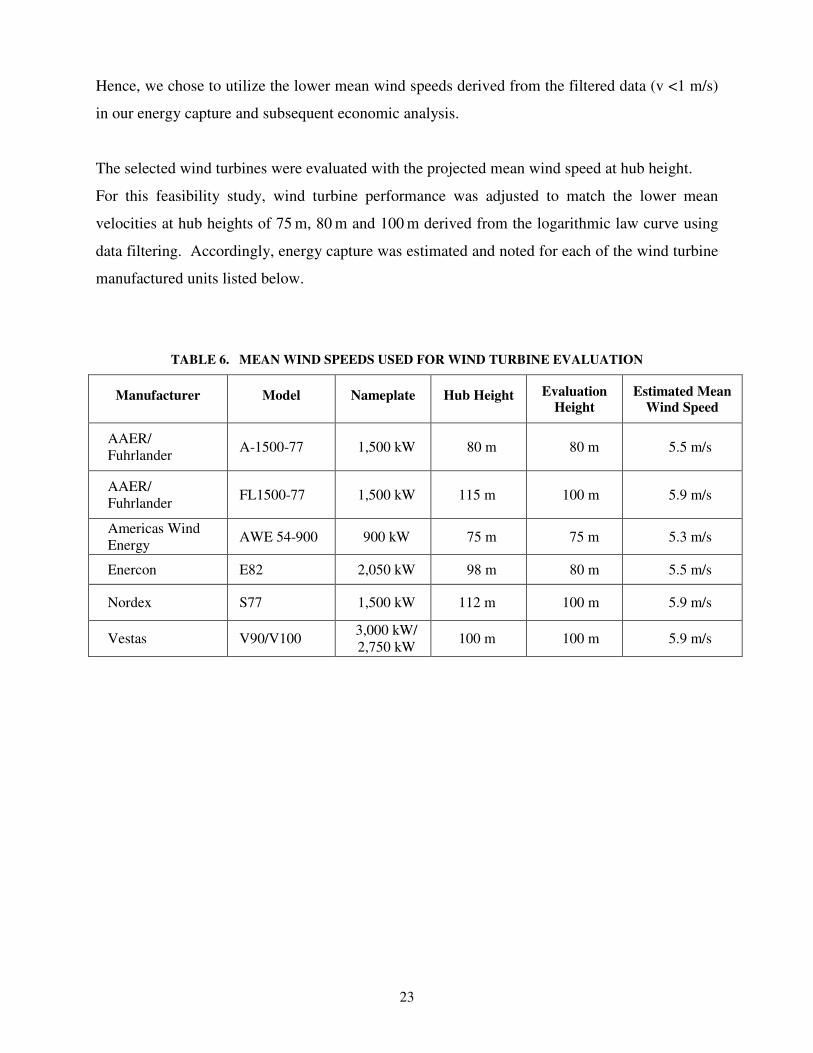
Hence, we chose to utilize the lower mean wind speeds derived from the filtered data (v <1 m/s)
in our energy capture and subsequent economic analysis.
The selected wind turbines were evaluated with the projected mean wind speed at hub height.
For this feasibility study, wind turbine performance was adjusted to match the lower mean
velocities at hub heights of 75 m, 80 m and 100 m derived from the logarithmic law curve using
data filtering. Accordingly, energy capture was estimated and noted for each of the wind turbine
manufactured units listed below.
TABLE 6. MEAN WIND SPEEDS USED FOR WIND TURBINE EVALUATION
Manufacturer Model Nameplate Hub Height Evaluation Height
Estimated Mean Wind Speed
AAER/ Fuhrlander A-1500-77 1,500 kW 80 m 80 m 5.5 m/s
AAER/ Fuhrlander FL1500-77 1,500 kW 115 m 100 m 5.9 m/s
Americas Wind Energy AWE 54-900 900 kW 75 m 75 m 5.3 m/s
Enercon E82 2,050 kW 98 m 80 m 5.5 m/s
Nordex S77 1,500 kW 112 m 100 m 5.9 m/s
Vestas V90/V100 3,000 kW/ 2,750 kW 100 m 100 m 5.9 m/s
24
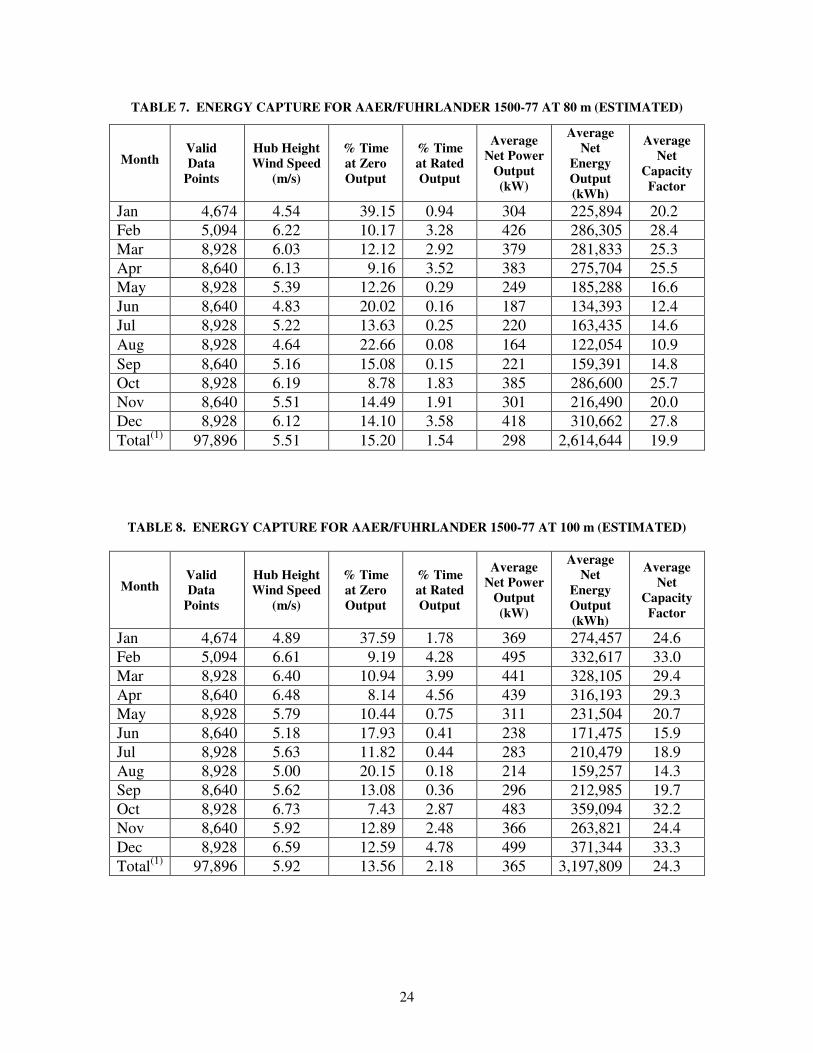
TABLE 7. ENERGY CAPTURE FOR AAER/FUHRLANDER 1500-77 AT 80 m (ESTIMATED)
TABLE 8. ENERGY CAPTURE FOR AAER/FUHRLANDER 1500-77 AT 100 m (ESTIMATED)
Month Valid Data
Points
Hub Height Wind Speed
(m/s)
% Time at Zero Output
% Time at Rated Output
Average Net Power
Output (kW)
Average Net
Energy Output (kWh)
Average Net
Capacity Factor
Jan 4,674 4.54 39.15 0.94 304 225,894 20.2 Feb 5,094 6.22 10.17 3.28 426 286,305 28.4 Mar 8,928 6.03 12.12 2.92 379 281,833 25.3 Apr 8,640 6.13 9.16 3.52 383 275,704 25.5 May 8,928 5.39 12.26 0.29 249 185,288 16.6 Jun 8,640 4.83 20.02 0.16 187 134,393 12.4 Jul 8,928 5.22 13.63 0.25 220 163,435 14.6 Aug 8,928 4.64 22.66 0.08 164 122,054 10.9 Sep 8,640 5.16 15.08 0.15 221 159,391 14.8 Oct 8,928 6.19 8.78 1.83 385 286,600 25.7 Nov 8,640 5.51 14.49 1.91 301 216,490 20.0 Dec 8,928 6.12 14.10 3.58 418 310,662 27.8 Total(1) 97,896 5.51 15.20 1.54 298 2,614,644 19.9
Month Valid Data
Points
Hub Height Wind Speed
(m/s)
% Time at Zero Output
% Time at Rated Output
Average Net Power
Output (kW)
Average Net
Energy Output (kWh)
Average Net
Capacity Factor
Jan 4,674 4.89 37.59 1.78 369 274,457 24.6 Feb 5,094 6.61 9.19 4.28 495 332,617 33.0 Mar 8,928 6.40 10.94 3.99 441 328,105 29.4 Apr 8,640 6.48 8.14 4.56 439 316,193 29.3 May 8,928 5.79 10.44 0.75 311 231,504 20.7 Jun 8,640 5.18 17.93 0.41 238 171,475 15.9 Jul 8,928 5.63 11.82 0.44 283 210,479 18.9 Aug 8,928 5.00 20.15 0.18 214 159,257 14.3 Sep 8,640 5.62 13.08 0.36 296 212,985 19.7 Oct 8,928 6.73 7.43 2.87 483 359,094 32.2 Nov 8,640 5.92 12.89 2.48 366 263,821 24.4 Dec 8,928 6.59 12.59 4.78 499 371,344 33.3 Total(1) 97,896 5.92 13.56 2.18 365 3,197,809 24.3
25
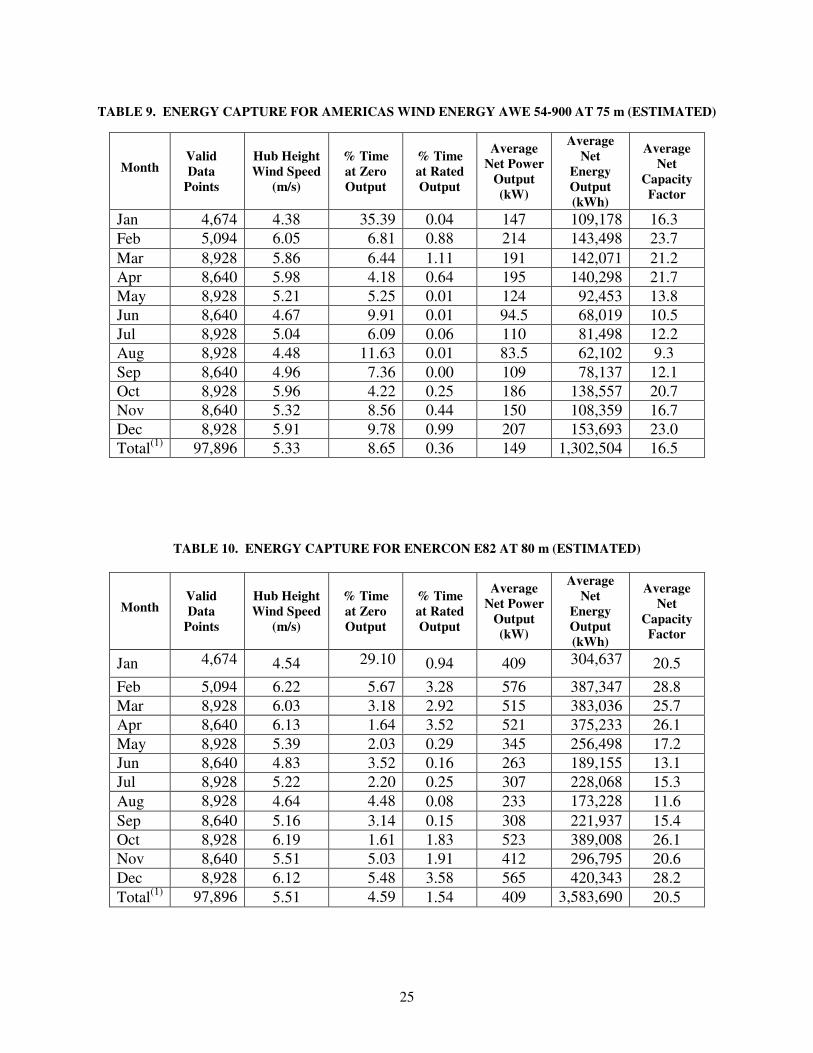
TABLE 9. ENERGY CAPTURE FOR AMERICAS WIND ENERGY AWE 54-900 AT 75 m (ESTIMATED)
TABLE 10. ENERGY CAPTURE FOR ENERCON E82 AT 80 m (ESTIMATED)
Month Valid Data
Points
Hub Height Wind Speed
(m/s)
% Time at Zero Output
% Time at Rated Output
Average Net Power
Output (kW)
Average Net
Energy Output (kWh)
Average Net
Capacity Factor
Jan 4,674 4.38 35.39 0.04 147 109,178 16.3 Feb 5,094 6.05 6.81 0.88 214 143,498 23.7 Mar 8,928 5.86 6.44 1.11 191 142,071 21.2 Apr 8,640 5.98 4.18 0.64 195 140,298 21.7 May 8,928 5.21 5.25 0.01 124 92,453 13.8 Jun 8,640 4.67 9.91 0.01 94.5 68,019 10.5 Jul 8,928 5.04 6.09 0.06 110 81,498 12.2 Aug 8,928 4.48 11.63 0.01 83.5 62,102 9.3 Sep 8,640 4.96 7.36 0.00 109 78,137 12.1 Oct 8,928 5.96 4.22 0.25 186 138,557 20.7 Nov 8,640 5.32 8.56 0.44 150 108,359 16.7 Dec 8,928 5.91 9.78 0.99 207 153,693 23.0 Total(1) 97,896 5.33 8.65 0.36 149 1,302,504 16.5
Month Valid Data
Points
Hub Height Wind Speed
(m/s)
% Time at Zero Output
% Time at Rated Output
Average Net Power
Output (kW)
Average Net
Energy Output (kWh)
Average Net
Capacity Factor
Jan 4,674 4.54 29.10 0.94 409 304,637 20.5 Feb 5,094 6.22 5.67 3.28 576 387,347 28.8 Mar 8,928 6.03 3.18 2.92 515 383,036 25.7 Apr 8,640 6.13 1.64 3.52 521 375,233 26.1 May 8,928 5.39 2.03 0.29 345 256,498 17.2 Jun 8,640 4.83 3.52 0.16 263 189,155 13.1 Jul 8,928 5.22 2.20 0.25 307 228,068 15.3 Aug 8,928 4.64 4.48 0.08 233 173,228 11.6 Sep 8,640 5.16 3.14 0.15 308 221,937 15.4 Oct 8,928 6.19 1.61 1.83 523 389,008 26.1 Nov 8,640 5.51 5.03 1.91 412 296,795 20.6 Dec 8,928 6.12 5.48 3.58 565 420,343 28.2 Total(1) 97,896 5.51 4.59 1.54 409 3,583,690 20.5
26
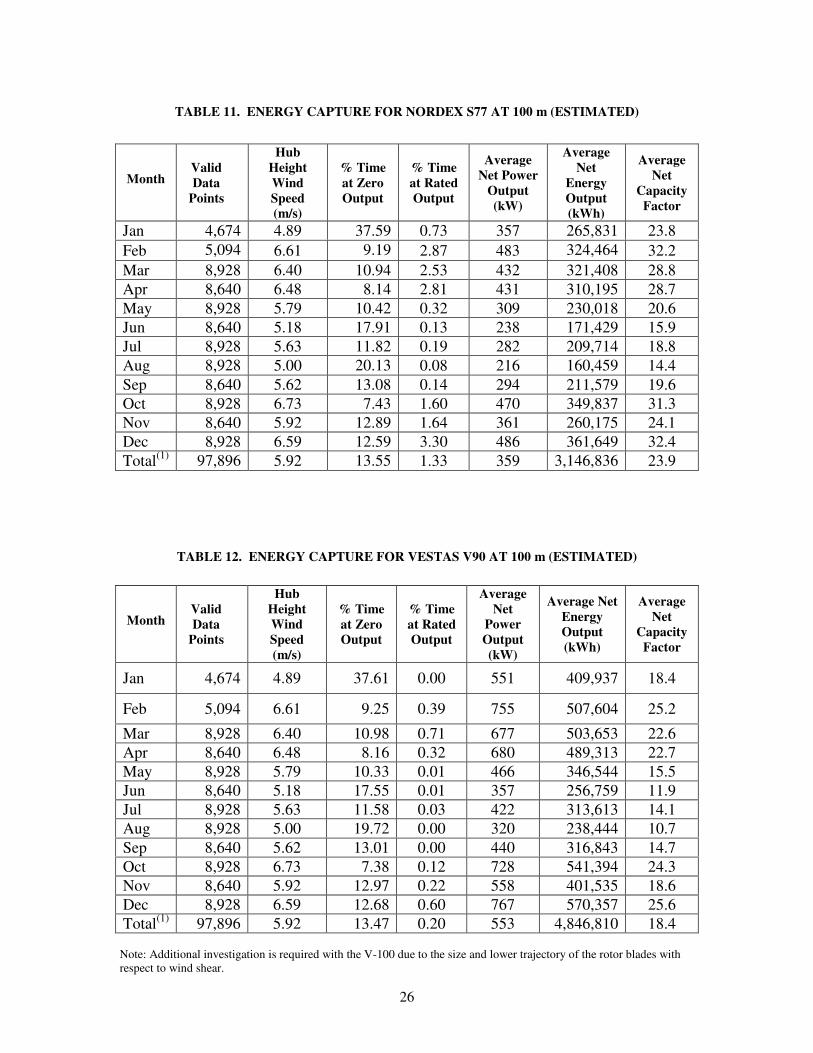
TABLE 11. ENERGY CAPTURE FOR NORDEX S77 AT 100 m (ESTIMATED)
TABLE 12. ENERGY CAPTURE FOR VESTAS V90 AT 100 m (ESTIMATED)
Note: Additional investigation is required with the V-100 due to the size and lower trajectory of the rotor blades with respect to wind shear.
Month Valid Data
Points
Hub Height Wind Speed (m/s)
% Time at Zero Output
% Time at Rated Output
Average Net Power
Output (kW)
Average Net
Energy Output (kWh)
Average Net
Capacity Factor
Jan 4,674 4.89 37.59 0.73 357 265,831 23.8 Feb 5,094 6.61 9.19 2.87 483 324,464 32.2 Mar 8,928 6.40 10.94 2.53 432 321,408 28.8 Apr 8,640 6.48 8.14 2.81 431 310,195 28.7 May 8,928 5.79 10.42 0.32 309 230,018 20.6 Jun 8,640 5.18 17.91 0.13 238 171,429 15.9 Jul 8,928 5.63 11.82 0.19 282 209,714 18.8 Aug 8,928 5.00 20.13 0.08 216 160,459 14.4 Sep 8,640 5.62 13.08 0.14 294 211,579 19.6 Oct 8,928 6.73 7.43 1.60 470 349,837 31.3 Nov 8,640 5.92 12.89 1.64 361 260,175 24.1 Dec 8,928 6.59 12.59 3.30 486 361,649 32.4 Total(1) 97,896 5.92 13.55 1.33 359 3,146,836 23.9
Month Valid Data
Points
Hub Height Wind Speed (m/s)
% Time at Zero Output
% Time at Rated Output
Average Net
Power Output (kW)
Average Net Energy Output (kWh)
Average Net
Capacity Factor
Jan 4,674 4.89 37.61 0.00 551 409,937 18.4
Feb 5,094 6.61 9.25 0.39 755 507,604 25.2
Mar 8,928 6.40 10.98 0.71 677 503,653 22.6 Apr 8,640 6.48 8.16 0.32 680 489,313 22.7 May 8,928 5.79 10.33 0.01 466 346,544 15.5 Jun 8,640 5.18 17.55 0.01 357 256,759 11.9 Jul 8,928 5.63 11.58 0.03 422 313,613 14.1 Aug 8,928 5.00 19.72 0.00 320 238,444 10.7 Sep 8,640 5.62 13.01 0.00 440 316,843 14.7 Oct 8,928 6.73 7.38 0.12 728 541,394 24.3 Nov 8,640 5.92 12.97 0.22 558 401,535 18.6 Dec 8,928 6.59 12.68 0.60 767 570,357 25.6 Total(1) 97,896 5.92 13.47 0.20 553 4,846,810 18.4
27
5.0 Wind Turbine Generator Selection
Wind turbine models selected for the feasibility study were limited to units that had technology
representing direct drive (synchronous) and gear driven (asynchronous) modes of operation,
tower hub heights equal to or greater than 75 m (246 ft), and higher rotor and system efficiencies
to maximize energy capture from the wind. Turbine availability was an important consideration
for the feasibility study.
Selected Manufacturers A total of fifteen wind turbines were analyzed by the Energy Manager and AESI staff. After
careful consideration, the final list for consideration became:
• AAER/Fuhrlander A/FL 1500-77
• American Wind Energy AWE 54-900
• Enercon E82
• Nordex S77
• Vestas V90/V100
AAER/Fuhrlander
Fuhrlander (Germany) is the Intellectual Property (IP) patent holder of wind turbine design
technology. Fuhrlander products are well recognized in the wind industry and are specifically
noted for high quality and performance dependability. Fuhrlander licensed the manufacturing
rights for their wind turbine product line to a Canadian firm called AAER, headquartered in
Montreal, Provincial Quebec. Many of the components under the AAER label are manufactured
in North America and now enjoy a small price advantage over EOM materials manufactured in
Europe, due primarily to a weak U.S. dollar. Fuhrlander turbines are of the gearbox design. Unit
availability is good with delivery dates in late 2008 and early 2009 available at the time of this
writing.
28
American Wind Energy (AWE)
AWE is a Canadian wind turbine manufacturer headquartered in Toronto, Ontario, Canada. The
company is headed by Mr. Hal Dickout, former chief executive officer of General Electric Power
Division. AWE holds a license to manufacture direct drive wind turbines. The Intellectual
Property holder is the firm European Wind Turbine (EWT). The root of the direct drive
technology design was fostered by Lagerwey Wind. In the mid-1990s, Lagerwey entered into a
business contract with an Indian firm for the purchase of wind turbine units without the tower.
The towers were manufactured in India and after being installed, the inferior towers collapsed.
A suit was filed by the Indian company against Lagerwey Wind as they were pursuing capital
funding to expand manufacturing capabilities. The suit was dismissed by the courts because over
200 turbines were installed worldwide with company manufactured towers without incident.
Unfortunately, the capital drive failed and Lagerwey was acquired by EWT. There are several
AWE turbines installed in North America. The longest running unit is located in Pincher Creek,
Provincial Alberta. We researched the maintenance history of this unit in Alberta, and found that
it has been performing flawlessly since being fully commissioned into the electrical grid. Four
additional units have been recently installed in North America; no meaningful operational history
is available on these units to date. Unit availability is good with delivery in 12-13 months.
Enercon
Enercon is a family held company with headquarters in Bremen, Germany. Enercon is
considered the “Cadillac” of wind turbine manufacturers. Extremely high quality and
engineering detail are the company’s trademarks. Enercon recently won a patent infringement
law suit which was brought against the company by General Electric. While the patent
infringement suit was pending, a trade ban was leveled by the Department of Commerce,
preventing Enercon from delivering products into the United States. The trade ban was
rescinded; however, due to the suit and what was perceived as a bad business environment,
delivery of Enercon wind turbines to the U.S. market are 4-5 years out, according to recent
conversations with senior management.

29
Nordex
Nordex is a Dutch enterprise headquartered in Kolding, Denmark. The Nordex line of wind
turbines are well known in the wind industry. Nordex manufactures an extensive product line of
wind turbines and range of nameplate ratings. Manufactured quality is considered good, though
the company has had minor difficulties with gearbox failure. Turbine availability is 24 months
out. Economic analysis was not performed on this unit because the power curve was reasonably
close to that of other manufactured units having similar nameplate ratings.
Vestas
Vestas is the largest manufacturer of wind turbines headquartered in Randers, Denmark. Vestas
dominates the industry in installed capacity, having 35,000 wind turbines installed and
generating electricity making-up 23% of market share. Vestas has led the industry with
innovative design and power control techniques, making their turbines a highly sought
commodity. Vestas experienced difficulties with gearbox design and manufacture during the
period 2000 to 2003 as the manufacturer expanded its product line to multi-megawatt nameplates.
The mechanical engineering and manufacturing issues have been resolved and are supported
with standard and extended product warranty programs. In fairness to all wind turbine
manufacturers, as product nameplates were increased several encountered problems with drive-
train operation owing to significantly higher mechanical stress load placed on the gearbox from
varying electrical and rotor forces. The Vestas V90 and V100 wind turbines have sufficient
capacity to deliver power for the Oakland campus as they are rated 3,000 kW and 2,750 kW,
respectively. The Vestas V100 is an especially attractive unit because it was designed for
optimized performance in lower speed wind regimes. With regard to turbine availability, Vestas
USA tends to entertain minimum orders of 30 WM. AESI has contacts with Vestas Europe and a
European municipal wind authority which could afford access to the turbines in smaller
quantities with improved delivery timelines. Company guidance on unit availability is 18-26
months from date of order.
30
Towers
Wind speed generally increases with elevation in almost every instance; the capital spent on
obtaining a higher tower is justified by comparing the increased cost of the higher tower with the
net present value of future revenues gained by the use of the higher tower. Towers are
manufactured using rolled steel pieces that are seam welded to form cylindrical sections or
constructed with steel reinforced concrete. Larger wind turbine generators, which are seated
higher in elevation, are mounted on steel and concrete tower sections. Towers as high as 112 m
(367 ft) are available for some of the units discussed in this Study; however, the scope of study
was limited to 100 m (328 ft) structures.
Special Notes: The AWE 54-900 is shipped with a 75 m steel tower as part of the purchase
contract with the manufacturer. Senior management recently asked AESI if we would be willing
to assist in the design and delivery of a 90 m or 100 m tower to be used in high wind shear
regions. The manufacturer has provided a separate quote for the price of the AWE 54-900 wind
turbine without the tower; we have identified a U.S. based manufacturer that would be interested
in designing and building a 100 m tower for the AWE 54-900 turbine. The price differential
between the company supplied 75 m tower and the U.S. designed and manufactured 100 m tower
is estimated at $28,000 to $57,000 depending on specified design criteria that may be required
prior to certification. In addition, the unit can be purchased with a 58 m diameter rotor, yielding
an additional 15% swept rotor area and energy capture.
31
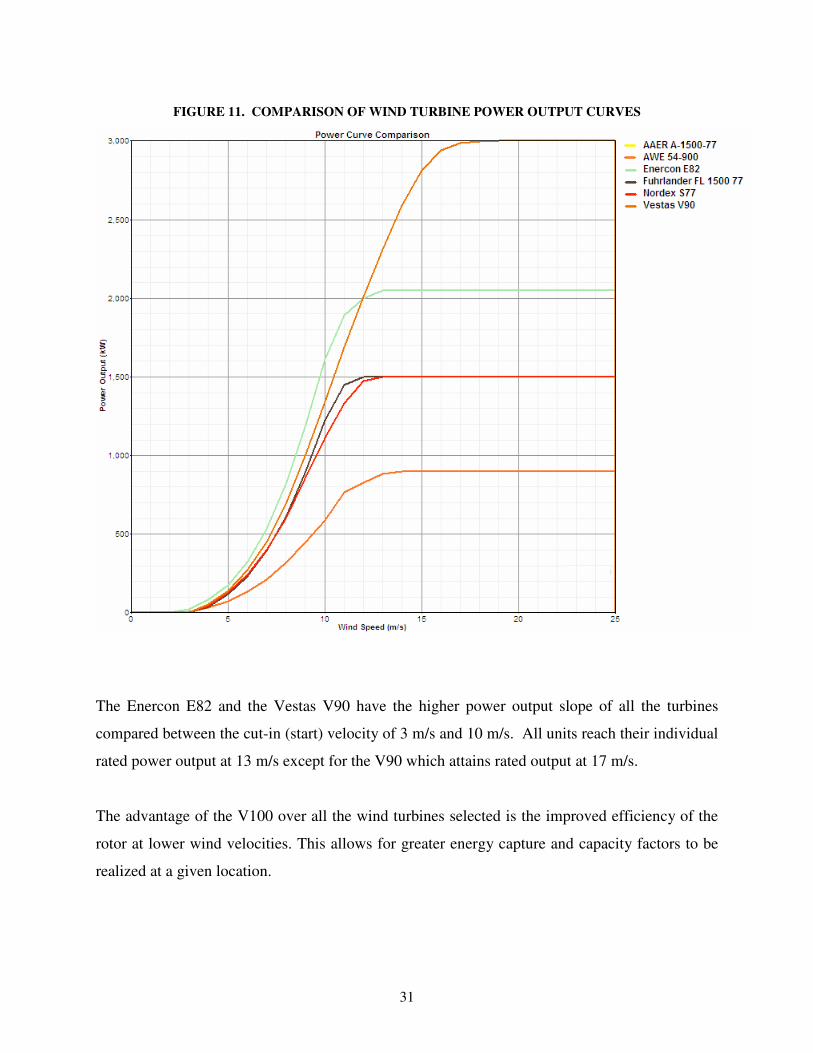
FIGURE 11. COMPARISON OF WIND TURBINE POWER OUTPUT CURVES
The Enercon E82 and the Vestas V90 have the higher power output slope of all the turbines
compared between the cut-in (start) velocity of 3 m/s and 10 m/s. All units reach their individual
rated power output at 13 m/s except for the V90 which attains rated output at 17 m/s.
The advantage of the V100 over all the wind turbines selected is the improved efficiency of the
rotor at lower wind velocities. This allows for greater energy capture and capacity factors to be
realized at a given location.
32
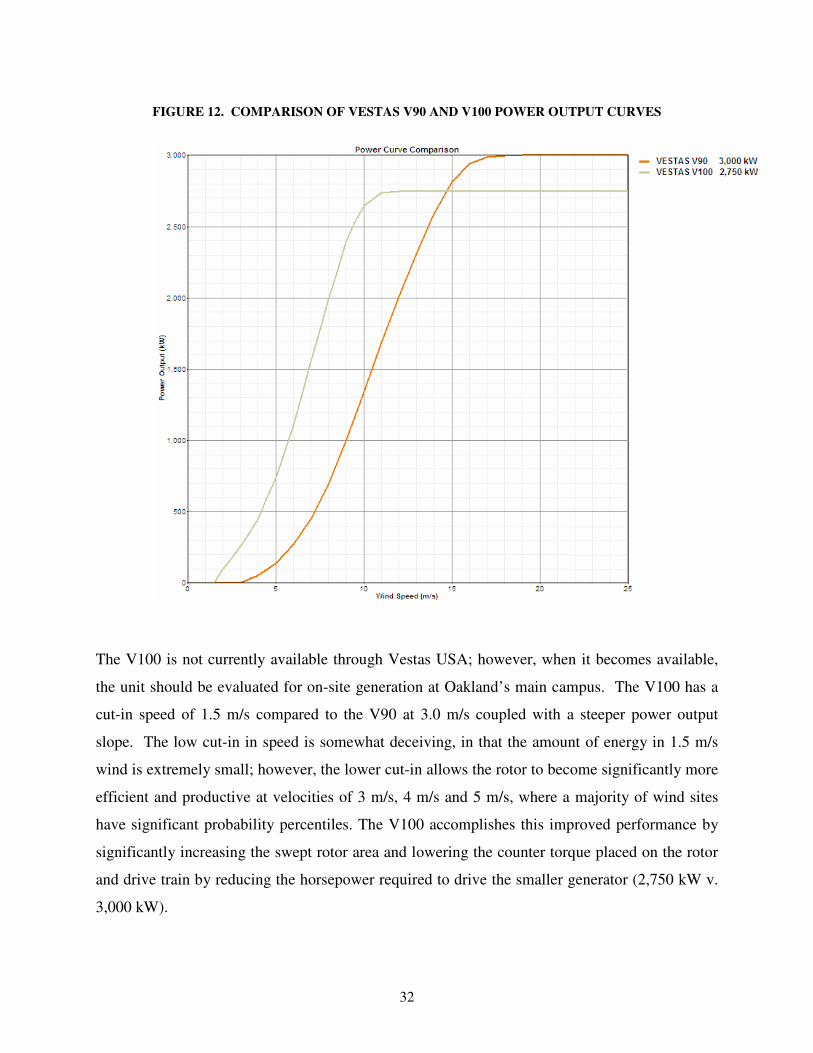
FIGURE 12. COMPARISON OF VESTAS V90 AND V100 POWER OUTPUT CURVES
The V100 is not currently available through Vestas USA; however, when it becomes available,
the unit should be evaluated for on-site generation at Oakland’s main campus. The V100 has a
cut-in speed of 1.5 m/s compared to the V90 at 3.0 m/s coupled with a steeper power output
slope. The low cut-in in speed is somewhat deceiving, in that the amount of energy in 1.5 m/s
wind is extremely small; however, the lower cut-in allows the rotor to become significantly more
efficient and productive at velocities of 3 m/s, 4 m/s and 5 m/s, where a majority of wind sites
have significant probability percentiles. The V100 accomplishes this improved performance by
significantly increasing the swept rotor area and lowering the counter torque placed on the rotor
and drive train by reducing the horsepower required to drive the smaller generator (2,750 kW v.
3,000 kW).
33
6.0 Engineering and Construction Considerations
Four possible wind turbine sites were selected by the Energy Manager and evaluated for
electrical interconnection requirements, construction issues, access and staging for heavy
equipment, and disruption to campus activities.
Electrical
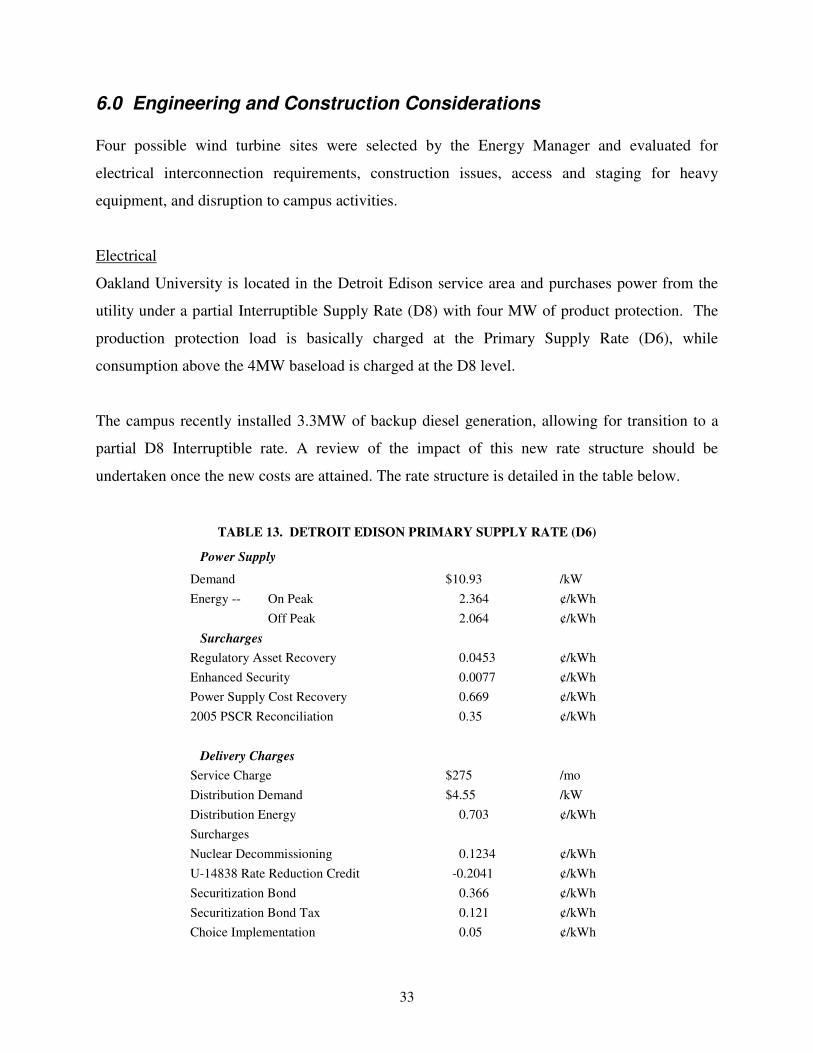
Oakland University is located in the Detroit Edison service area and purchases power from the
utility under a partial Interruptible Supply Rate (D8) with four MW of product protection. The
production protection load is basically charged at the Primary Supply Rate (D6), while
consumption above the 4MW baseload is charged at the D8 level.
The campus recently installed 3.3MW of backup diesel generation, allowing for transition to a
partial D8 Interruptible rate. A review of the impact of this new rate structure should be
undertaken once the new costs are attained. The rate structure is detailed in the table below.
TABLE 13. DETROIT EDISON PRIMARY SUPPLY RATE (D6)
Power Supply
Demand $10.93 /kW Energy -- On Peak 2.364 ¢/kWh Off Peak 2.064 ¢/kWh Surcharges Regulatory Asset Recovery 0.0453 ¢/kWh Enhanced Security 0.0077 ¢/kWh Power Supply Cost Recovery 0.669 ¢/kWh 2005 PSCR Reconciliation 0.35 ¢/kWh Delivery Charges Service Charge $275 /mo Distribution Demand $4.55 /kW Distribution Energy 0.703 ¢/kWh Surcharges Nuclear Decommissioning 0.1234 ¢/kWh U-14838 Rate Reduction Credit -0.2041 ¢/kWh Securitization Bond 0.366 ¢/kWh Securitization Bond Tax 0.121 ¢/kWh Choice Implementation 0.05 ¢/kWh

34
As applied to the university’s projected electric loads for Fiscal Year 2008, this tariff produces
electric energy costs of 12.26¢/kWh for On Peak power (11:00am-7:00pm weekdays), and
5.31¢/kWh during Off Peak hours. Current and detailed descriptions of both D6 and D8 are
available on the Detroit Edison Company web page:
http://my.dteenergy.com/otherInformation/pdfs/detroitEdisonTariff.pdf
Primary power is received at the Detroit Edison owned & operated general service Spencer
substation by two 120 kV underground laterals running north on Squirrel Rd. The conductors
feed two 40 MVA transformers internal to the substation. Additionally, the university has 3.3
MW of standby diesel generation which was recently installed directly to the south of Spencer
substation. These generators may be used for system back-up or peak-shaving when deemed
appropriate.
In reviewing the electrical requirements for the university and discussion with the Energy
Manager, it was mutually agreed that the introduction of wind turbine generation could possibly
push electrical energy back into the Edison power grid. Operational situations resulting in back-
feeding would be most likely to occur under these conditions:
• Holiday vacations for Thanksgiving Day, Christmas and New Years when electrical
demand would be very low with the probability of strong seasonal winds and high
wind turbine output.
• Utility power grid, substation or generator plant failure.
Discussions were held with representatives from Detroit Edison on the wind turbine project. The
representatives did not take a negative position towards the venture, but there was minor
disagreement on whether or not a rider contract would be required. It is the option of AESI staff
and the Energy Manager that a rider would not be required. The University has initiated an
interconnect application for this project based upon two wind turbine generators.

35
Should the utility may not wish to accept power back into their system, appropriate power flow
relaying controls would need to be integrated into the point of coupling between the wind
turbine(s) on the distribution side of Oakland’s feeder circuit. Schweitzer 751A relays or their
functional equivalent would be employed to prevent back-feed. The utility and project engineers
would need to have a meeting of minds with regard to relay set-points.
Feeder conductors from the wind turbine(s) would be encased in concrete duct ways for
Location 1 and Location 2, underground laterals would be used should Oakland choose to
construct wind turbines at Location 3 or Location 4. The latter locations would need to be
trenched and underground boring would be used to cause the least disturbance to Galloway
Creek and the adjacent wetland areas to the north of Location 3 and Location 4.
Conductor ampacity and voltage drop requirements would be met by appropriate sizing. At the
higher feeder voltages, voltage drop is not expected to be a problem for the nameplate rating of
wind turbines being considered.
Transformer pads would need to be constructed for all wind turbines with the exception of the
Enercon E82. In many European countries, transformers are required to be mounted internal to
the tower for esthetic reasons. Preliminary interconnection schemes for the wind turbine(s) were
discussed with the Energy Manager and are illustrated herein.

36
FIGURE 13. SCHEMA OF PROPOSED WIND TURBINE ELECTRICAL INTERCONNECTION
Connection to the feeder Bus A and Bus B would be underground and access to each coupling
point would be through a manhole cover. Appropriately sized and rated disconnecting means
would be employed according to prevailing electrical codes.
Radio Communication and Radar System Impact Investigations have shown that the rotating blades and support structures can impact amplitude
modulated (AM) radio frequency (RF) signals. Frequency modulated (FM) signals are more
immune to rotating blade interference, having greatest effect when a receiver is in near proximity
to the wind turbine. Doppler and conventional radar interference has been recorded by wind
turbines and structure within the radar envelope.
OAKLAND UNIVERSITY One-Line Diagram
7,500 kW Peak Demand
37
As part of system engineering for the wind project, an electromagnetic and RF interference
intrusion study should be performed.
The following systems could be affected by the proximity of one or more wind turbines:
� Satellite up-link transmitters and down-link receivers
� Direct to Home (DTH) receiver systems
� Radar
� Airport communication and guidance
� Public broadcast
� Point to point communication links
� Point to multipoint communication links
� Cellular networks
� Seismological and infrasound monitoring equipment
Accessibility Recommendations
Location 1 and Location 2 afford easy access for the staging of wind turbine components and
maneuverability of the main crane and auxiliary crane. These two locations would not require an
extensive amount of work to clear the areas prior to receiving the equipment and construction of
the main crane. Ample turning radius for the rotor blade transport vehicles for Location 1 would
be achieved by entry from the north on Pioneer Dr. Access to Location 2 would be from the
service road to the grounds and building maintenance complex. In each case, minor road
improvements would need to be made to accommodate the transport and construction equipment.
Trees and shrubs would need to be either trimmed and or removed to a limited extent.
Access to Location 1 could also be achieved by building a roadway from Squirrel Rd. directly
across the field where the meteorological is currently positioned. However, this would add
appreciable cost to the overall construction estimate given for Location 1. Location 3 and
Location 4 will have unique staging challenges for the work crews. The ground is not as level,
there are more trees and less room to maneuver in. More extensive clearing will need to be made
with regard to trees. Significant damage to one or more fairways will be done to accommodate
equipment movement and not exceed maximum transportation slope levels.
38
Access to Location 3 and 4 will need to be from the north across Galloway Creek or from the
south from Butler Rd. Road upgrades will be required from whatever direction is chosen. In
each case there will be added cost to the project because of transport load bearing requirements
for Butler Rd., campus roads, and concrete box culverts.
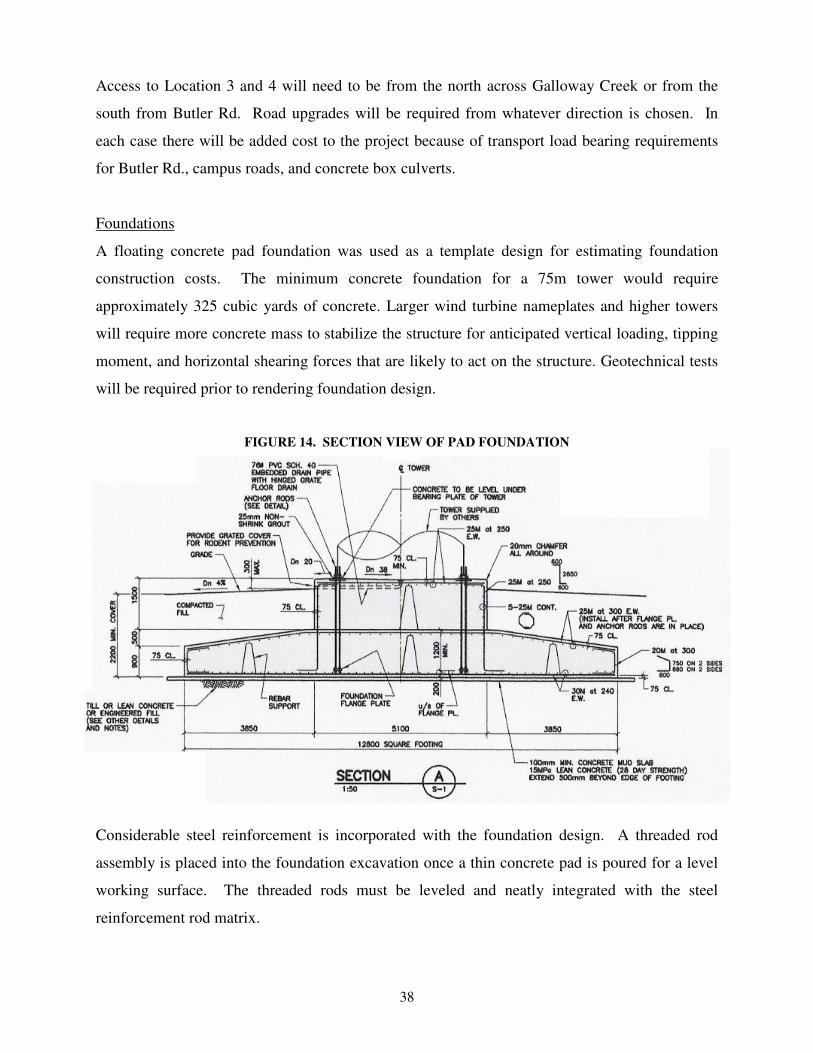
Foundations
A floating concrete pad foundation was used as a template design for estimating foundation
construction costs. The minimum concrete foundation for a 75m tower would require
approximately 325 cubic yards of concrete. Larger wind turbine nameplates and higher towers
will require more concrete mass to stabilize the structure for anticipated vertical loading, tipping
moment, and horizontal shearing forces that are likely to act on the structure. Geotechnical tests
will be required prior to rendering foundation design.
FIGURE 14. SECTION VIEW OF PAD FOUNDATION
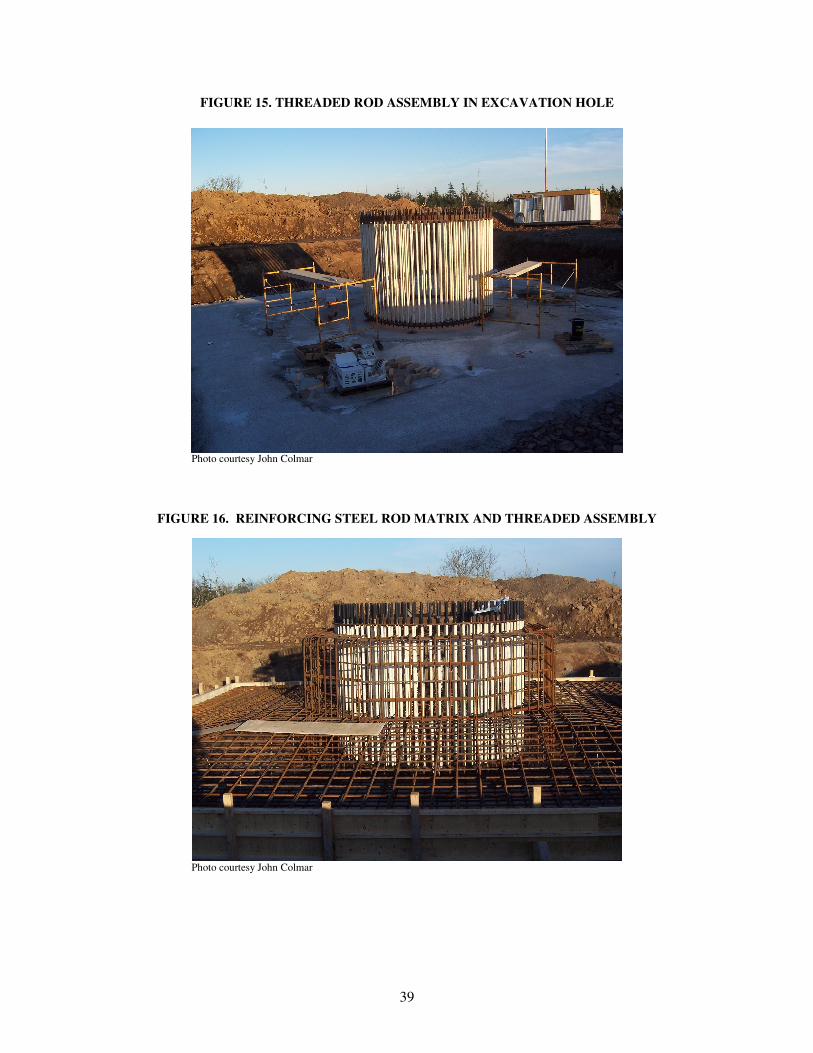
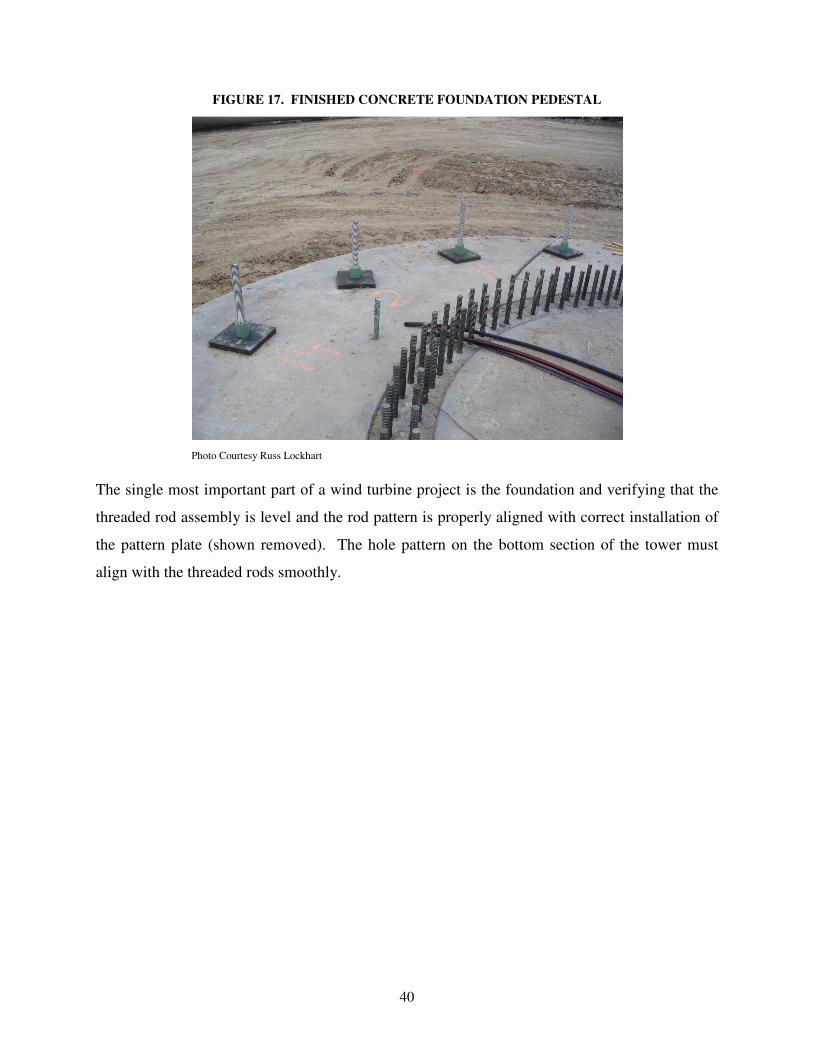
Considerable steel reinforcement is incorporated with the foundation design. A threaded rod
assembly is placed into the foundation excavation once a thin concrete pad is poured for a level
working surface. The threaded rods must be leveled and neatly integrated with the steel
reinforcement rod matrix.
39
FIGURE 15. THREADED ROD ASSEMBLY IN EXCAVATION HOLE
Photo courtesy John Colmar
FIGURE 16. REINFORCING STEEL ROD MATRIX AND THREADED ASSEMBLY
Photo courtesy John Colmar
40
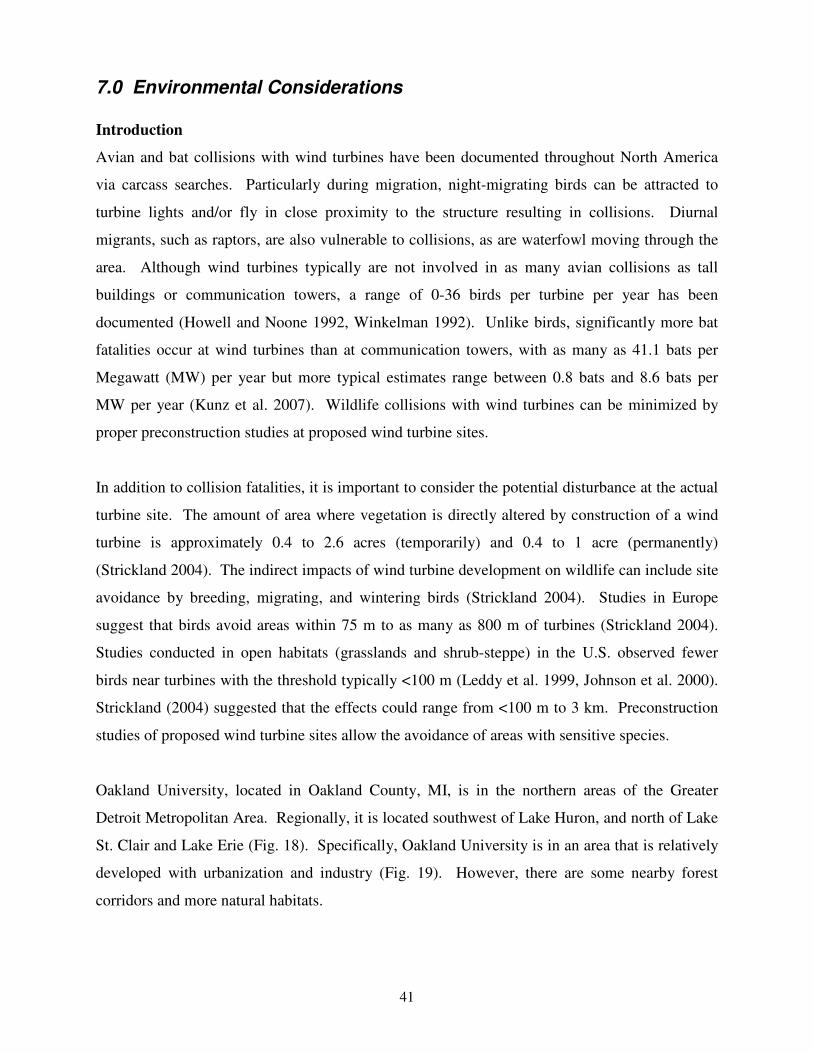
FIGURE 17. FINISHED CONCRETE FOUNDATION PEDESTAL
Photo Courtesy Russ Lockhart
The single most important part of a wind turbine project is the foundation and verifying that the
threaded rod assembly is level and the rod pattern is properly aligned with correct installation of
the pattern plate (shown removed). The hole pattern on the bottom section of the tower must
align with the threaded rods smoothly.
41
7.0 Environmental Considerations
Introduction
Avian and bat collisions with wind turbines have been documented throughout North America
via carcass searches. Particularly during migration, night-migrating birds can be attracted to
turbine lights and/or fly in close proximity to the structure resulting in collisions. Diurnal
migrants, such as raptors, are also vulnerable to collisions, as are waterfowl moving through the
area. Although wind turbines typically are not involved in as many avian collisions as tall
buildings or communication towers, a range of 0-36 birds per turbine per year has been
documented (Howell and Noone 1992, Winkelman 1992). Unlike birds, significantly more bat
fatalities occur at wind turbines than at communication towers, with as many as 41.1 bats per
Megawatt (MW) per year but more typical estimates range between 0.8 bats and 8.6 bats per
MW per year (Kunz et al. 2007). Wildlife collisions with wind turbines can be minimized by
proper preconstruction studies at proposed wind turbine sites.
In addition to collision fatalities, it is important to consider the potential disturbance at the actual
turbine site. The amount of area where vegetation is directly altered by construction of a wind
turbine is approximately 0.4 to 2.6 acres (temporarily) and 0.4 to 1 acre (permanently)
(Strickland 2004). The indirect impacts of wind turbine development on wildlife can include site
avoidance by breeding, migrating, and wintering birds (Strickland 2004). Studies in Europe
suggest that birds avoid areas within 75 m to as many as 800 m of turbines (Strickland 2004).
Studies conducted in open habitats (grasslands and shrub-steppe) in the U.S. observed fewer
birds near turbines with the threshold typically <100 m (Leddy et al. 1999, Johnson et al. 2000).
Strickland (2004) suggested that the effects could range from <100 m to 3 km. Preconstruction
studies of proposed wind turbine sites allow the avoidance of areas with sensitive species.
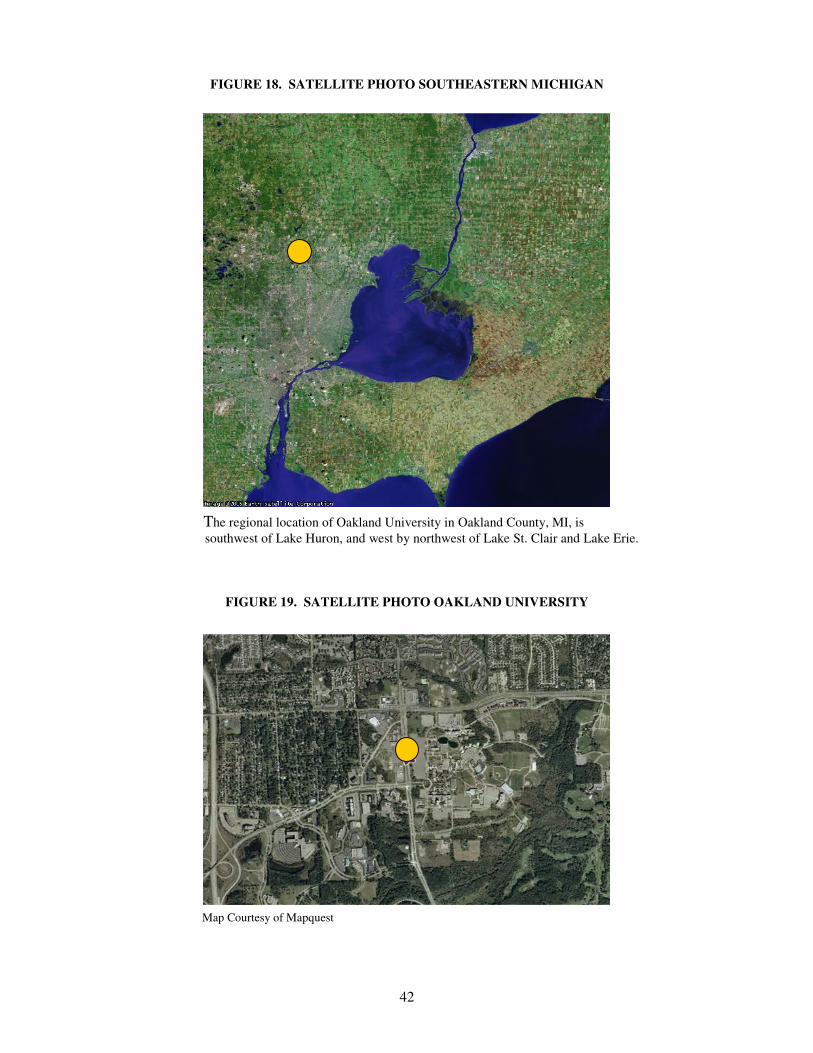
Oakland University, located in Oakland County, MI, is in the northern areas of the Greater
Detroit Metropolitan Area. Regionally, it is located southwest of Lake Huron, and north of Lake
St. Clair and Lake Erie (Fig. 18). Specifically, Oakland University is in an area that is relatively
developed with urbanization and industry (Fig. 19). However, there are some nearby forest
corridors and more natural habitats.
42
FIGURE 18. SATELLITE PHOTO SOUTHEASTERN MICHIGAN
The regional location of Oakland University in Oakland County, MI, is southwest of Lake Huron, and west by northwest of Lake St. Clair and Lake Erie.
FIGURE 19. SATELLITE PHOTO OAKLAND UNIVERSITY
Map Courtesy of Mapquest
43
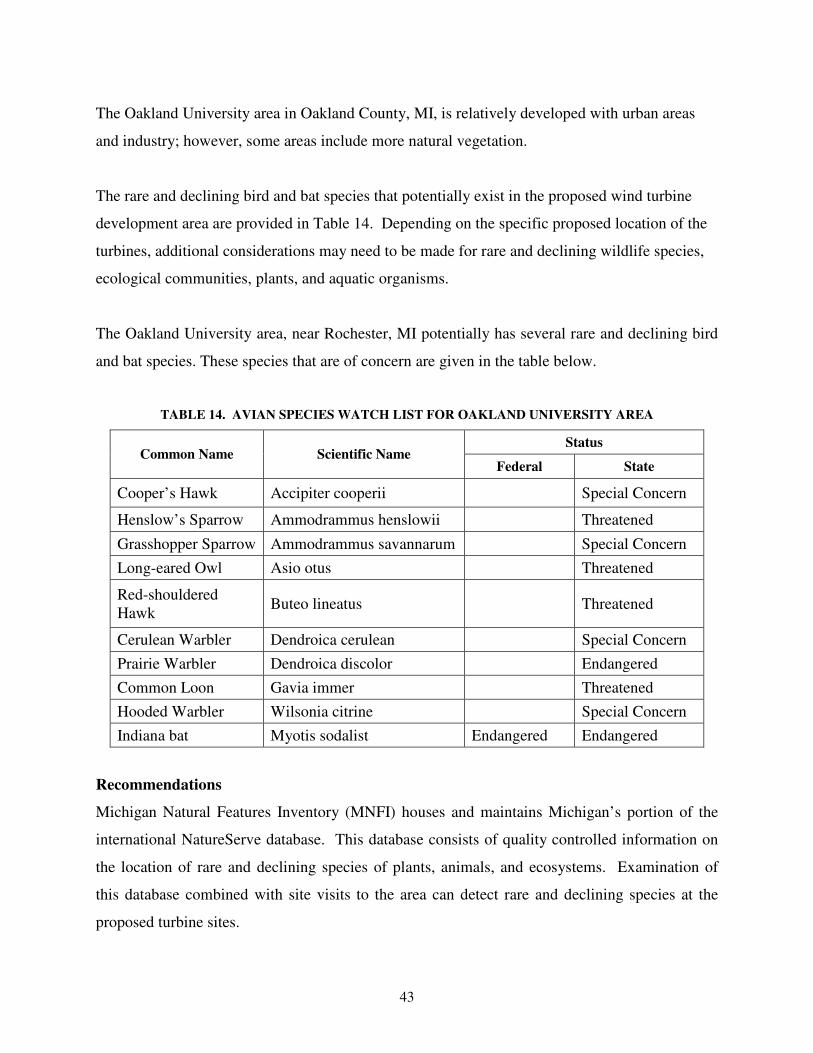
The Oakland University area in Oakland County, MI, is relatively developed with urban areas
and industry; however, some areas include more natural vegetation.
The rare and declining bird and bat species that potentially exist in the proposed wind turbine
development area are provided in Table 14. Depending on the specific proposed location of the
turbines, additional considerations may need to be made for rare and declining wildlife species,
ecological communities, plants, and aquatic organisms.
The Oakland University area, near Rochester, MI potentially has several rare and declining bird
and bat species. These species that are of concern are given in the table below.
TABLE 14. AVIAN SPECIES WATCH LIST FOR OAKLAND UNIVERSITY AREA
Status Common Name Scientific Name
Federal State
Cooper’s Hawk Accipiter cooperii Special Concern
Henslow’s Sparrow Ammodrammus henslowii Threatened
Grasshopper Sparrow Ammodrammus savannarum Special Concern Long-eared Owl Asio otus Threatened
Red-shouldered Hawk Buteo lineatus Threatened
Cerulean Warbler Dendroica cerulean Special Concern Prairie Warbler Dendroica discolor Endangered Common Loon Gavia immer Threatened Hooded Warbler Wilsonia citrine Special Concern Indiana bat Myotis sodalist Endangered Endangered
Recommendations
Michigan Natural Features Inventory (MNFI) houses and maintains Michigan’s portion of the
international NatureServe database. This database consists of quality controlled information on
the location of rare and declining species of plants, animals, and ecosystems. Examination of
this database combined with site visits to the area can detect rare and declining species at the
proposed turbine sites.

44
Avian use surveys are also important to estimate the temporal and spatial use by birds within the
area proposed for wind energy development and some adjacent areas. Given the size of the
proposed project one raptor/large bird viewing station with a good viewshed of the project site
and located within the area proposed for wind development should be established. Observations
should be made at this station following methods similar to those employed by Hawkwatch
International. Approximately 4 surveys per week should be conducted beginning approximately
April 1st and continuing through May 31st and once again for fall migration beginning August 1st
through September 30th. Some flexibility in scheduling is needed and some surveys may be
missed due to inclement weather. On each survey day, surveys should be conducted for
approximately 6-8 hours. The longer time duration is applicable for areas where waterfowl
collisions are of particular concern, as it allows for the inclusion of hours when waterfowl may
be moving to and from local feeding areas and/or water sources.
All raptors, other large birds, and sensitive status species seen during each survey are recorded.
Observers should estimate distance from the observer to each bird, and record each bird’s flight
path and flight height. Bird behavior and their use of the habitat needs to be recorded. Weather
data, such as temperature, wind speed, wind direction, and cloud cover, need to be recorded in
concert with bird flight variables.
Given the potential for rare songbird species this project would also benefit from studies of the
small bird use of the area. Point counts should be established within the proposed project area
and the surrounding area. These points should be visited several times and surveyed using
standardized protocol between April and the end of June.
Prepared by: Joelle Gehring, Ph.D. Office: 517-241-4912 Senior Conservation Scientist Michigan Natural Features Inventory Michigan State University Extension Stevens T. Mason Building P.O. Box 30444 Lansing, MI 48909-7944
45
8.0 Siting and Permitting Considerations
Wind energy projects commonly receive positive marks for being environmentally friendly and
carbon neutral. However, these projects generally do not receive preferential treatment with
regulatory zoning authorities. Enormous variations in zoning requirements are seen from state to
state and municipality to municipality.
Substantive Issues for Consideration
Avian Impact
Wind turbine impact on avian mortality has been the single largest concern that has
appeared to contest the construction of facilities. The Altamont Pass, California wind
turbine project has been sited continuously by groups objecting to wind power
development. The United States Government Accounting Office and the State of
California have separately studied the avian issue at wind turbine projects across the
country and have concluded that avian mortality is traditionally very low at wind
turbine sites. Altamont Pass, bluntly stated, was the worst possible place to site a
wind turbine development and should not be used to develop arguments either for or
against wind turbine facilities. Turbines at Altamont are of an older technology using
high speed rotor blades.
Furthermore, technological improvement in wind turbine design (slower rotor speeds)
and better siting decisions have led to a dramatic improvement in avian mortality
statistics. At least one year’s worth of avian data or study should be obtained as
evidence that the project proponent has investigated the potential of avian impacts
and received the appropriate permitting from state or federal agencies having
dominion over endangered and threatened species.
46
Non-Avian Wildlife
Wind turbine projects during construction and after commissioning have the potential
to disturb wildlife and vegetation. A thorough investigation of plant life and wildlife,
that may be indigenous to the area being considered for development, should be
conducted.
Visual and Noise Impact
Wind turbine projects will result in a noticeable and dramatic change for the local
view shed. The wind turbines being discussed in this study will have a high profile
with the height range for the rotor center hub being at 75m (246 ft) for the AWE 54-
900 wind turbine and at 108m ( 354 ft) for the Enercon E82.
TABLE 15. VERTICAL DIMENSIONS FOR WIND TURBINES
Manufacturer Rotor (diameter) Rotor Hub Blade Apogee
AWE 54-900 54 m (177 ft.) 75 m (246 ft.) 102 m (334 ft.)
Enercon E82 82 m (269 ft.) 108 m (354 ft.) 149 m (480 ft.)
The amount of noise that will be generated by the wind turbine generators will be a
function of the unit’s individual mechanical design and the then present wind velocity
acting on the rotor blades. A visual model should be generated to better assess the
potential impact of the proposed wind turbines.
TABLE 16. HORIZONTAL DISTANCE FROM POINTS OF REFERENCE
Proposed Site Building Nearest Building Road Public Road Residential
Location 1 Spencer 82.3 m (270 ft.) Squirrel 277.4 m (910 ft.) 100.3 m (329 ft.)
Location 2 BGM 119.5 m (392 ft.) Squirrel 913.7 m (2,997 ft.) 378.0 m (1,240 ft.)
Location 3 Golf Club 532.6 m (1,747 ft.) Butler 770.7 m (2,528 ft.) 793.6 m (2,603 ft.)
Location 4 Golf Club 607.3 m (1,992 ft.) Butler 997.5 m (3,272 ft.) 1020.4 m (3,347 ft.)
47
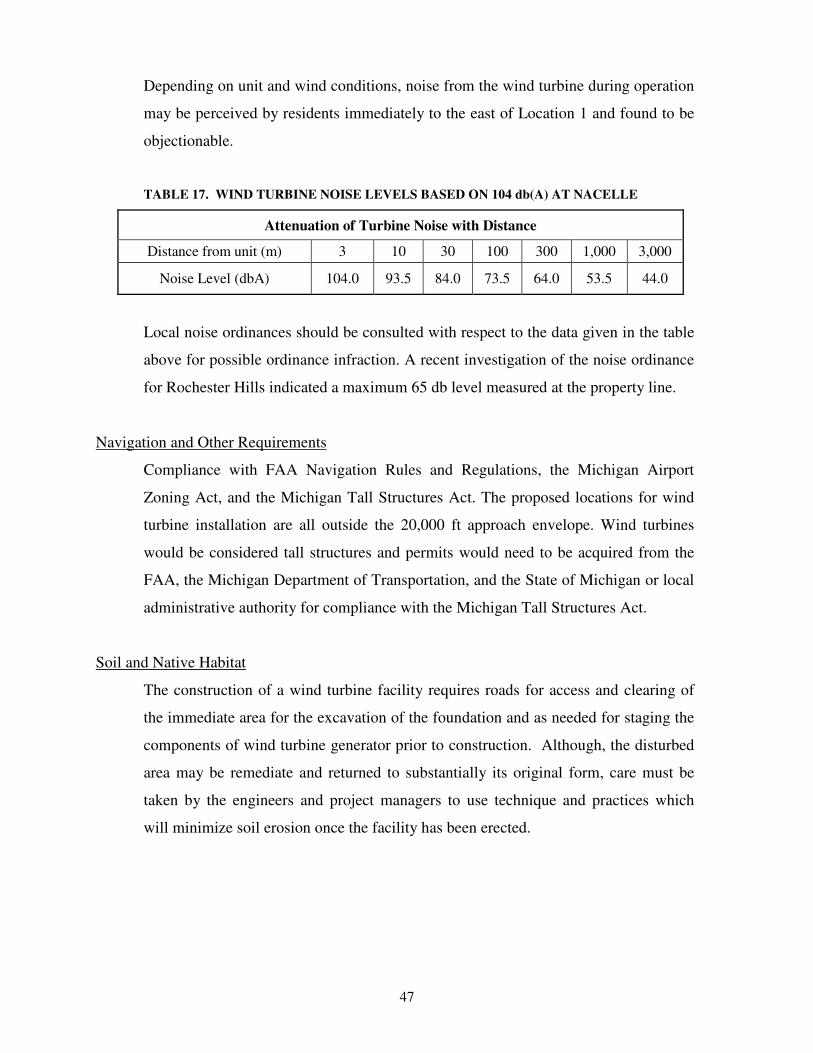
Depending on unit and wind conditions, noise from the wind turbine during operation
may be perceived by residents immediately to the east of Location 1 and found to be
objectionable.
TABLE 17. WIND TURBINE NOISE LEVELS BASED ON 104 db(A) AT NACELLE
Attenuation of Turbine Noise with Distance
Distance from unit (m) 3 10 30 100 300 1,000 3,000
Noise Level (dbA) 104.0 93.5 84.0 73.5 64.0 53.5 44.0
Local noise ordinances should be consulted with respect to the data given in the table
above for possible ordinance infraction. A recent investigation of the noise ordinance
for Rochester Hills indicated a maximum 65 db level measured at the property line.
Navigation and Other Requirements
Compliance with FAA Navigation Rules and Regulations, the Michigan Airport
Zoning Act, and the Michigan Tall Structures Act. The proposed locations for wind
turbine installation are all outside the 20,000 ft approach envelope. Wind turbines
would be considered tall structures and permits would need to be acquired from the
FAA, the Michigan Department of Transportation, and the State of Michigan or local
administrative authority for compliance with the Michigan Tall Structures Act.
Soil and Native Habitat
The construction of a wind turbine facility requires roads for access and clearing of
the immediate area for the excavation of the foundation and as needed for staging the
components of wind turbine generator prior to construction. Although, the disturbed
area may be remediate and returned to substantially its original form, care must be
taken by the engineers and project managers to use technique and practices which
will minimize soil erosion once the facility has been erected.
48
Cultural Resource
Often fossils and native artifacts of significance are recovered during the excavation
of soil for the turbine foundations and trenching of underground electrical feeders.
Project planning typically includes a thorough site evaluation before and during the
construction phase. Proponents of wind turbine facilities working near cultural sites
of Native American significance should engage the input of local Native American
tribes. Oakland County is considered the traditional territory of the Bkejwanong
Walpole Island First Nation and Member Nations to the Three Fires Confederacy.
Storm Water
Three of the locations that are proposed as possible turbine locations are on hills and
in close proximity to wetlands and the Galloway Creek. Construction of turbines and
access roads near the wetland areas will evoke concern for natural habitats and
possible storm water regulations under state and federal jurisdiction. It may also
trigger the Endangered Species Act through any required state or federal consultation
under Sec. 404 of the Clean Water Act.
Special Michigan Guideline and Property Line Setback for On-Site Use
Michigan siting guidelines for wind energy systems with a tower height greater than
20m shall be considered a Special Land Use. Property set-back shall be 1 ½ times the
height of the tower. A maximum of 55 db(A) noise limit is set at the nearest property
line. A provision allows for the 55 db(A) level to be exceeded for short term events
such as utility system power outages and severe windstorms. The Rochester Hills
noise ordinance exceeds the state guideline of this type of installation.
Timing
Community meetings should be held to inform the public of Oakland’s intention to
construct and operate one or more wind turbine generators and to educate local
citizens on wind power technology, proposed timelines, studies that are being done to
protect and assess the impact on avian and other wildlife. Oakland should also
emphasize the environmental and fiscal stewardship that has motivated the university
to investigate on-site renewable energy generation.
49
With regard to general construction permitting issues for a wind turbine installation at Oakland,
we do not envision a great degree of difficulty, as the university is situated on state land and not
directly under the jurisdiction control of local zoning authorities. The State of Michigan has
compiled a Wind Turbine Zoning Reference for local governments that do not have zoning
ordinances in place. A copy of the Michigan Siting Guidelines for Wind Energy Systems is
provided in the Appendix.
50
9.0 Business Structure and Financing Models
The business of financing of utility-scale wind power projects in the United States has evolved
significantly in the last fifteen years, reflecting a widening and deepening of the capital markets
and appetite for wind power generating asset investments. In the period prior to 1998, investment
in wind power was perceived to be exotic and very risky. Financial institutions were turned off
from wind power due to problems with a still developing technology, relatively small and poorly
capitalized manufacturers for wind turbines dominated the original equipment sector, no
standardized metric for evaluating wind regimes and turbine performance in terms of equipment
availability and performance. Hence, there was a shortage of monies for project development.
The funds that were available were made expensive with difficult terms.
The strategic investors entered the wind power financial arena in 1998 when Enron, General
Electric, Enercon and Nordex began development of wind energy conversion systems larger than
500 kW. This marked the beginning of the current sustainable era of wind turbine industry
growth in the U.S. wind power energy sector. Institutional investment became active in 2003 and
remains strong today. Debt financing for project development is also more available. The entry
of commercial banks, at the arranging and participant levels, facilitated new transactions and
loan facilities, pushed interest rate margins down for wind project developers and proponents.
There are several models that are used to structure the financing of wind turbine projects. The
structures can be best characterized by these five basic principal points: tax appetite, capital
strength, debt leverage, timing of funding, and management.
• Tax Appetite - the ability of the project to make efficient use of tax laws and benefits
• Capital Strength - the ability of project proponent to fund initial construction costs
• Debt Leverage – project oriented limited recourse debt financing availability
• Timing of Funds – whether funds are available at outset or on installment basis
• Management – delegation of management responsibilities amongst several investors
Note: Tax benefits include accelerated depreciation under Section 168 of the Internal Revenue Code provides a Modified Accelerated Cost
Recovery System (“MACRS”) and Production Tax Credits (PTCs), the latter being reviewed by the U.S. Congress for extension after December
31, 2008.

51
Description of select structures that may be used for financing wind turbine projects: 1) Corporate The Corporate structure is characterized by a single proponent developer/investor with the
financial strength to fund all of the project costs and sufficient tax appetite to use all of the
project’s tax benefits. The corporate proponent developer/investor typically establishes a special
purpose entity to house the assets of the project. This structure is the most widely legal form used
in the wind sector. The structure represents the simplest way to own, manage and operate a wind
turbine project. The initial capital costs in entirety are funded by the parent company using
internally generated funds from other operations, and all of the project’s net cash flows and tax
benefits flow back to the corporation. The corporation provides the funds in the form of equity to
the project company. No additional investors or limited-recourse debt financing are involved (at
least initially) at the project level. For issues regarding legal liability, the corporation may create
a subsidiary or limited liability company to mitigate exposure concerns.
2) Strategic Investor Flip This was one of the first structures developed to attract third-party equity able to utilize the tax
benefits (accelerated depreciation and production tax credits), while allowing the developer to
retain an interest in the project. The virtue of this structure is its relative simplicity. The project
developer negotiates a percentage ownership share by the strategic investor. Under this structure,
the initial funding of project costs and allocations of project cash flows and tax benefits are
shared on the same percentage basis, or pro rata, as the respective ownership of the parties.
All financial flows prior to the “Flip Point”, both in and out of the project company, are on the
same pro rata basis as ownership. This structure is useful for those project developers lacking
both the financial strength to fund initial capital costs and the appetite for the tax benefits, but
who are nonetheless unwilling to simply sell the project outright. In effect, the tax investor buys
the majority of the project and gets the lion’s share of the aggregate tax benefits during roughly
the first decade of operation, when most of the tax benefits are generated.

52
The project developer receives most of the cash and the remaining tax benefits generated
thereafter; the developer also typically has an option to repurchase the shares held by the tax
investor at that point. The investor is made comfortable that the project developer has the
incentive to manage the project capably during this first period, as the project’s success is key to
the Flip Point occurring on schedule and the developer realizing the long-term value thereafter.
The Flip Point historically has been designed to occur near the end of the ten-year period during
which the PTCs are generated. The rise in turbine and other capital costs may be leading the Flip
Point for some transactions to be extended by a few years to enable the tax investor to reach its
negotiated target return.
3) Pre-tax/After Tax Partnership Structure (PAPS) The Pre-tax, After-tax Partnership Structure is also known as the Institutional Investor Flip, the
“A/B” structure (because there are generally two classes of investors in the partnership
agreement for this transaction), or the “Babcock & Brown” structure (utilized by the investment
firm for many financial transactions). It is similar to the strategic investor flip structure, in that
the project developer brings in a separate tax investor to use the tax benefits, and there again is a
Flip Point where allocations of cash and tax benefits change hands.
Beyond these similarities, there are several important differences.
a) It is designed to bring in less-active, more-passive equity capital from institutional
investors.
b) Cash and tax benefits are initially allocated in different percentages than each investor’s
respective equity contributions.
c) The tax investor is allocated 100% of the tax benefits from the outset of project operations
which may be legally passed through the partnership.

53
4) Municipal Model
In the municipal model a governing body is the sole owner of the project. Initial capital cost
financing is accomplished by direct cash payment, preferential rate bank financing programs, or
municipal bond underwritings.
A number of municipal utilities and city governments have installed wind turbines. These
projects are popular with the local community and can help facilitate the way for additional wind
power development in the area. Generally, these projects do not qualify for the federal
Production Tax Credits (PTC) but may be eligible for Clean Renewable Energy Bond (CREB)
allocations by the U.S. Department of Treasury, a parallel investment incentive and tax credit
program subject to Congressional appropriations. CREB financing allows the borrower to
receive interest free capital for the purpose of developing a renewable energy project.
Amortization will be taken and recorded over a 10- to 15-year period. The CREB was designed
to allow municipal entities a way to realize the benefits of the Production Tax Credit awarded by
Congress and then repealed.
Municipal projects also cannot take advantage of favorable depreciation rules for wind turbines
because municipalities are not tax paying entities. Under the Modified Asset Cost Recovery
Schedule (MACRs) the entire cost of a wind project may be depreciated over a 5-year period.
However, one major advantage that municipal projects do have is their access to lower-cost
public financing, having the result of lowering development costs dramatically. As public entities,
municipalities and municipal utilities tend to have lower financial return requirements.
5) Private Public Partnerships (PPPs)
The public private partnership is a legal structure formed by and between a public institution and
a private institution for the purpose of allowing the private institution the benefit of realizing
depreciation and tax credits that are normally of no meaningful value to a public institution.
Under the terms of a public private partnership, the private entity is allowed to claim
depreciation for a portion of the project’s development cost and to utilize production tax credits
against income tax due the government. The PPP may be able to integrate features of the above
mentioned structures to maximize the overall return to the project proponent.
54
10.0 Project Cost Estimates
Project cost estimates were developed with the assistance of the engineering staff at SSOE in
Toledo, OH. The following staff personnel were involved with assisting AESI compile cost
estimates based on prior industry knowledge. Together, we believe that these estimates are fairly
representative for the work anticipated. A contingency factor of 10% was included in the cost
estimates represented in this section of the feasibility study. A preliminary engineering review
was done on the turbines sizes being contemplated for installation. The decision was made to
confine the estimating work to the smallest and largest wind turbine specified in the Request for
Quotations issued by Oakland to select wind turbine manufacturers. The confidence level on the
attached estimates for the locations and turbine installations does not exceed 80%.
The process of estimating was broken down into several categories of work generic to installing
a 900 kW turbine on a 75 m tower, a 1,500 kW turbine on a 100 m tower, a 1,500 kW turbine on
an 80 m tower, and a 2,000 kW turbine on a 98 m tower (identified as 100m).
• Wind Turbine Site Work (All Locations)
• Construction of Foundation for a 75m Wind Turbine
• Construction of Foundation for a 100m Wind Turbine
• Power and Ductbank for Location No.1
• Power and Ductbank for Location No.2
• Power and Ductbank for Location No.3 – Feeder Routing Option 1 (east-tie)
• Power and Ductbank for Location No.3 – Feeder Routing Option 2 (west-tie)
• Power and Ductbank for Location No.4 – Feeder Routing Option 1 (east-tie)
• Power and Ductbank for Location No.4 – Feeder Routing Option 2 (west-tie)
Cost estimate calculations were generated from a number of sources, which included job
estimating software (Timerland), consultation with numerous engineers and contractors in the
areas of electrical construction, crane rental and operation, trenching and underground boring,
and other project specific disciplines to arrive at what is believed to be current pricing levels for
projects of this nature.

55
It is important to note and emphasize that large crane rentals are in high demand nationwide
primarilyy due to the rapid growth of the wind turbine industry in the U.S. and Canada. There is
virtually no room for price negotiation with crane owners at this time. Mobilization and
demobilization rates are carrying historic rental premiums with reservations required 9 to 12
months in advance of the project. We believe that the timeline for crane and operator
procurement will tighten in the months to come. The cost for cranes is highly variable from one
provider to the next and subject to project timing. The price actually paid for the rental and
mobilization of required cranes could be understated by as much as 50%. Careful planning and
coordination with crane providers will be important for project and construction managers.
There would be an economic advantage to Oakland under the scenario of having two wind
turbines installed in the same project undertaking. The economic advantage is estimated to net a
cost savings of approximately 25-35% compared to installing two turbines in separate
construction projects. Notwithstanding the previously mentioned concerns with crane
procurement; installation cost could easily escalate should wind turbine components, contracted
work or weather cause unnecessary work delays. Contracts for work will need to have specific
performance clauses for work delays. Project management will need to allow sufficient timing
buffers between key project tasks. AESI staff has been working with one turbine manufacturer
and has had first-hand observation with component delivery delays from horizontally integrated
manufacturers, issues causing delays with customs and immigration, and importation duties and
tariffs.
TABLE 18. COMPARATIVE INSTALLATION COST ($/KW) FOR SELECTED TURBINES
AND PROPOSED LOCATIONS
Turbine Manufacturer & Model ($/kW) AAER/Fuhrlander 1500-77 Position AWE 54-900 75 m
80 m 100 m Enercon E82
80 m
Location 1 2,357 2,088 2,353 2,436
Location 2 2,333 2,073 2,338 2,426
Location 3 - Opt 1 (East) 3,378 2,700 2,965 2,896
Location 3 - Opt 2 (West) 3,347 2,682 2,946 2,882
Location 4 - Opt 1 (East) 3,566 2,813 3,078 2,980
Location 4 - Opt 2 (West) 3,541 2,798 3,062 2,969

56
TABLE 19. COST ESTIMATES FOR LOCATION 1
L1 Power and
Ductbank w/80m Turbine 2MW Enercon
L1 Power and Ductbank
w/100m Turbine 1500-77
L1 Power and Ductbank
w/80m Turbine 1500-77
L1 Power and Ductbank
w/75m Turbine 900kW AWE
Turbine and Tower (1)
AAER/FL 1500-77 (80m) 2,120,000
AAER/FL 1500-77 (100m) 2,295,000
AWE 54-900 (75m) 1,400,000
Enercon E82 (80m) 3,665,670
Transportation 130,000 155,000 130,000
FAA Navigation Beacons 10,000 14,000 10,000 10,000
Total Turbine and Tower 3,805,670 2,464,000 2,260,000 1,410,000
Structural
75m Foundation and Rebar 90,000
80m Foundation and Rebar 225,000 130,000
100m Foundation and Rebar 185,000
Civil
Site Work 17,400 17,400 17,400 17,400
Access Roadways 20,000 20,000 20,000 20,000
Horizontal Drilling
Electrical
Concrete 6,000 6,000 6,000 6,000
Wiring Methods 55,303 55,303 55,303 55,303
Raceway & Boxes 27,000 27,000 27,000 27,000
Electrical Power 48,000 36,000 36,000 28,000
Crane (2)
Rental Primary Crane 115,000 220,000 115,000 60,000
Rental Auxiliary Crane 30,000 30,000 30,000 30,000 Transportation (Mob/Demob) (3) 25,000 25,000 25,000 25,000
Labor 35,000 35,000 35,000 35,000
Erection of Tower and Setting Turbine (4)
Labor 15,000 18,000 15,000 15,000
Contractor Misc. (5) 1,300 16,000 13,000 9,000
Contingencies (7%) 43,309 47,229 35,819 28,609
Project Developer/Manager (3%) (6) 134,069 96,058 84,616 55,689
Design Engineering 75,000 75,000 75,000 75,000
Geotechincal 15,000 15,000 15,000 15,000
Avain/EIS 70,000 70,000 70,000 70,000
Micro-Siting 21,500 21,500 21,500 21,500
Total $4,784,552 $3,479,490 $3,086,638 $2,093,502
Cost/kW $2,392 $2,320 $2,058 $2,326
NOTES:
1. Turbine cost was calculated in US Dollars after conversion from Euro Dollars and Canadian Dollars as required.
Currency conversion factors used: 1 USD = 1.54 Euro; 1 USD = 1.02 CND
2. Crane rental fees based on 14 day commitment. Prices vary widely based on size and advance reservations.
3. Crane Mob, Demob, Rental and labor is based on one turbine installation with rental for one month. 4. Erection Labor is per turbine installation
5. Contractor miscellaneous fees provide a margin for minor equipment rental, scaffolding and spent supplies.
6. Project Developer/Manager fee based on 3% of total cost of project less Design Engineering cost.
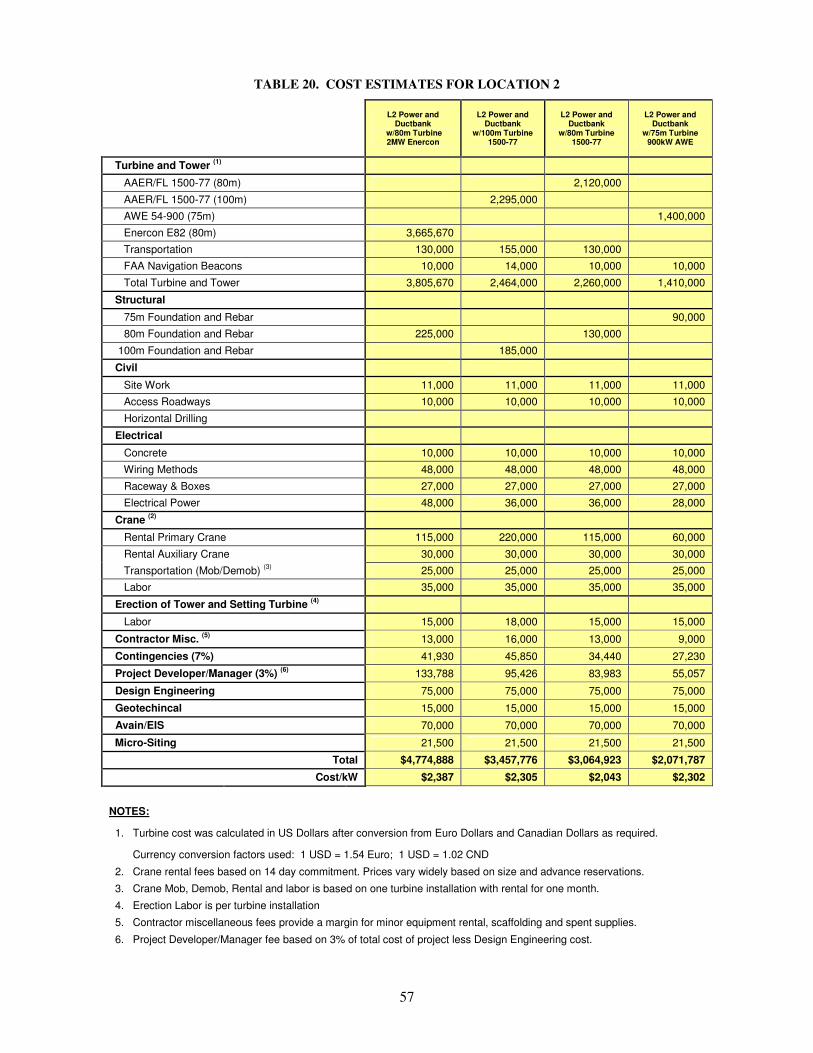
57
TABLE 20. COST ESTIMATES FOR LOCATION 2
L2 Power and
Ductbank w/80m Turbine 2MW Enercon
L2 Power and Ductbank
w/100m Turbine 1500-77
L2 Power and Ductbank
w/80m Turbine 1500-77
L2 Power and Ductbank
w/75m Turbine 900kW AWE
Turbine and Tower (1)
AAER/FL 1500-77 (80m) 2,120,000
AAER/FL 1500-77 (100m) 2,295,000
AWE 54-900 (75m) 1,400,000
Enercon E82 (80m) 3,665,670
Transportation 130,000 155,000 130,000
FAA Navigation Beacons 10,000 14,000 10,000 10,000
Total Turbine and Tower 3,805,670 2,464,000 2,260,000 1,410,000
Structural
75m Foundation and Rebar 90,000
80m Foundation and Rebar 225,000 130,000
100m Foundation and Rebar 185,000
Civil
Site Work 11,000 11,000 11,000 11,000
Access Roadways 10,000 10,000 10,000 10,000
Horizontal Drilling
Electrical
Concrete 10,000 10,000 10,000 10,000
Wiring Methods 48,000 48,000 48,000 48,000
Raceway & Boxes 27,000 27,000 27,000 27,000
Electrical Power 48,000 36,000 36,000 28,000
Crane (2)
Rental Primary Crane 115,000 220,000 115,000 60,000
Rental Auxiliary Crane 30,000 30,000 30,000 30,000
Transportation (Mob/Demob) (3) 25,000 25,000 25,000 25,000
Labor 35,000 35,000 35,000 35,000
Erection of Tower and Setting Turbine (4)
Labor 15,000 18,000 15,000 15,000
Contractor Misc. (5) 13,000 16,000 13,000 9,000
Contingencies (7%) 41,930 45,850 34,440 27,230
Project Developer/Manager (3%) (6) 133,788 95,426 83,983 55,057
Design Engineering 75,000 75,000 75,000 75,000
Geotechincal 15,000 15,000 15,000 15,000
Avain/EIS 70,000 70,000 70,000 70,000
Micro-Siting 21,500 21,500 21,500 21,500
Total $4,774,888 $3,457,776 $3,064,923 $2,071,787
Cost/kW $2,387 $2,305 $2,043 $2,302
NOTES:
1. Turbine cost was calculated in US Dollars after conversion from Euro Dollars and Canadian Dollars as required.
Currency conversion factors used: 1 USD = 1.54 Euro; 1 USD = 1.02 CND
2. Crane rental fees based on 14 day commitment. Prices vary widely based on size and advance reservations.
3. Crane Mob, Demob, Rental and labor is based on one turbine installation with rental for one month.
4. Erection Labor is per turbine installation
5. Contractor miscellaneous fees provide a margin for minor equipment rental, scaffolding and spent supplies.
6. Project Developer/Manager fee based on 3% of total cost of project less Design Engineering cost.

58
TABLE 21. COST ESTIMATES FOR LOCATION 3 (OPTION 1)
L3 Power and Horizontal Drilling
Option 1 w/80m Turbine 2MW Enercon
L3 Power and Horizontal Drilling
Option 1 w/100m Turbine
1500-77
L3 Power and Horizontal Drilling
Option 1 w/80m Turbine
1500-77
L3 Power and Horizontal Drilling
Option 1 w/75m Turbine
900kW AWE
Turbine and Tower (1)
AAER/FL 1500-77 (80m) 2,120,000
AAER/FL 1500-77 (100m) 2,295,000
AWE 54-900 (75m) 1,400,000
Enercon E82 (80m) 3,665,670
Transportation 130,000 155,000 130,000
FAA Navigation Beacons 10,000 14,000 10,000 10,000
Total Turbine and Tower 3,805,670 2,464,000 2,260,000 1,410,000
Structural
75m Foundation and Rebar 90,000
80m Foundation and Rebar 225,000 130,000
100m Foundation and Rebar 185,000
Civil
Site Work 36,000 36,000 36,000 36,000
Access Roadways 400,000 400,000 400,000 400,000
Horizontal Drilling 175,000 175,000 175,000 175,000
Electrical
Concrete 33,000 33,000 33,000 33,000
Wiring Methods 235,000 235,000 235,000 235,000
Raceway & Boxes 80,000 80,000 80,000 80,000
Electrical Power 48,000 36,000 36,000 28,000
Crane (2)
Rental Primary Crane 115,000 220,000 115,000 60,000
Rental Auxiliary Crane 30,000 30,000 30,000 30,000
Transportation (Mob/Demob) (3) 25,000 25,000 25,000 25,000
Labor 35,000 35,000 35,000 35,000
Erection of Tower and Setting Turbine (4)
Labor 15,000 18,000 15,000 15,000
Contractor Misc. (5) 13,000 16,000 13,000 9,000
Contingencies (7%) 101,640 105,560 94,150 86,940
Project Developer/Manager (3%) (6) 161,169 122,807 111,365 82,438
Design Engineering 75,000 75,000 75,000 75,000
Geotechincal 15,000 15,000 15,000 15,000
Avain/EIS 70,000 70,000 70,000 70,000
Micro-Siting 21,500 21,500 21,500 21,500
Total $5,714,979 $4,397,867 $4,005,015 $3,011,878
Cost/kW $2,857 $2,932 $2,670 $3,347
NOTES:
1. Turbine cost was calculated in US Dollars after conversion from Euro Dollars and Canadian Dollars as required.
Currency conversion factors used: 1 USD = 1.54 Euro; 1 USD = 1.02 CND
2. Crane rental fees based on 14 day commitment. Prices vary widely based on size and advance reservations.
3. Crane Mob, Demob, Rental and labor is based on one turbine installation with rental for one month.
4. Erection Labor is per turbine installation
5. Contractor miscellaneous fees provide a margin for minor equipment rental, scaffolding and spent supplies. 6. Project Developer/Manager fee based on 3% of total cost of project less Design Engineering cost.
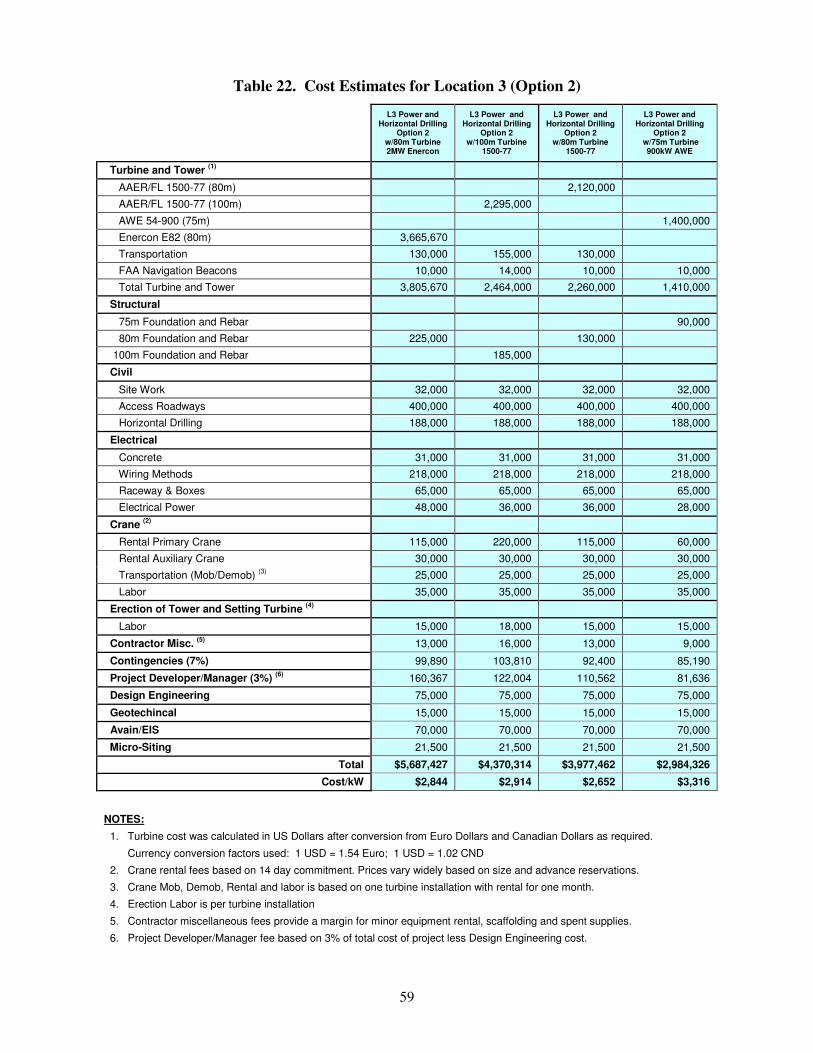
59
Table 22. Cost Estimates for Location 3 (Option 2)
L3 Power and Horizontal Drilling
Option 2 w/80m Turbine 2MW Enercon
L3 Power and Horizontal Drilling
Option 2 w/100m Turbine
1500-77
L3 Power and Horizontal Drilling
Option 2 w/80m Turbine
1500-77
L3 Power and Horizontal Drilling
Option 2 w/75m Turbine
900kW AWE
Turbine and Tower (1)
AAER/FL 1500-77 (80m) 2,120,000
AAER/FL 1500-77 (100m) 2,295,000
AWE 54-900 (75m) 1,400,000
Enercon E82 (80m) 3,665,670
Transportation 130,000 155,000 130,000
FAA Navigation Beacons 10,000 14,000 10,000 10,000
Total Turbine and Tower 3,805,670 2,464,000 2,260,000 1,410,000
Structural
75m Foundation and Rebar 90,000
80m Foundation and Rebar 225,000 130,000
100m Foundation and Rebar 185,000
Civil
Site Work 32,000 32,000 32,000 32,000
Access Roadways 400,000 400,000 400,000 400,000
Horizontal Drilling 188,000 188,000 188,000 188,000
Electrical
Concrete 31,000 31,000 31,000 31,000
Wiring Methods 218,000 218,000 218,000 218,000
Raceway & Boxes 65,000 65,000 65,000 65,000
Electrical Power 48,000 36,000 36,000 28,000
Crane (2)
Rental Primary Crane 115,000 220,000 115,000 60,000
Rental Auxiliary Crane 30,000 30,000 30,000 30,000
Transportation (Mob/Demob) (3) 25,000 25,000 25,000 25,000
Labor 35,000 35,000 35,000 35,000
Erection of Tower and Setting Turbine (4)
Labor 15,000 18,000 15,000 15,000
Contractor Misc. (5) 13,000 16,000 13,000 9,000
Contingencies (7%) 99,890 103,810 92,400 85,190
Project Developer/Manager (3%) (6) 160,367 122,004 110,562 81,636
Design Engineering 75,000 75,000 75,000 75,000
Geotechincal 15,000 15,000 15,000 15,000
Avain/EIS 70,000 70,000 70,000 70,000
Micro-Siting 21,500 21,500 21,500 21,500
Total $5,687,427 $4,370,314 $3,977,462 $2,984,326
Cost/kW $2,844 $2,914 $2,652 $3,316
NOTES:
1. Turbine cost was calculated in US Dollars after conversion from Euro Dollars and Canadian Dollars as required.
Currency conversion factors used: 1 USD = 1.54 Euro; 1 USD = 1.02 CND
2. Crane rental fees based on 14 day commitment. Prices vary widely based on size and advance reservations.
3. Crane Mob, Demob, Rental and labor is based on one turbine installation with rental for one month.
4. Erection Labor is per turbine installation
5. Contractor miscellaneous fees provide a margin for minor equipment rental, scaffolding and spent supplies.
6. Project Developer/Manager fee based on 3% of total cost of project less Design Engineering cost.

60
TABLE 23. COST ESTIMATES FOR LOCATION 4 (OPTION 1)
L4 Power and Horizontal Drilling
Option 1 w/80m Turbine 2MW Enercon
L4 Power and Horizontal Drilling
Option 1 w/100m Turbine
1500-77
L4 Power and Horizontal Drilling
Option 1 w/80m Turbine
1500-77
L4 Power and Horizontal Drilling
Option 1 w/75m Turbine
900kW AWE
Turbine and Tower (1)
AAER/FL 1500-77 (80m) 2,120,000
AAER/FL 1500-77 (100m) 2,295,000
AWE 54-900 (75m) 1,400,000
Enercon E82 (80m) 3,665,670
Transportation 130,000 155,000 130,000
FAA Navigation Beacons 10,000 14,000 10,000 10,000
Total Turbine and Tower 3,805,670 2,464,000 2,260,000 1,410,000
Structural
75m Foundation and Rebar 90,000
80m Foundation and Rebar 225,000 130,000
100m Foundation and Rebar 185,000
Civil
Site Work 41,000 41,000 41,000 41,000
Access Roadways 450,000 450,000 450,000 450,000
Horizontal Drilling 200,000 200,000 200,000 200,000
Electrical
Concrete 37,000 37,000 37,000 37,000
Wiring Methods 283,000 283,000 283,000 283,000
Raceway & Boxes 102,000 102,000 102,000 102,000
Electrical Power 48,000 36,000 36,000 28,000
Crane (2)
Rental Primary Crane 115,000 220,000 115,000 60,000
Rental Auxiliary Crane 30,000 30,000 30,000 30,000
Transportation (Mob/Demob) (3) 25,000 25,000 25,000 25,000
Labor 35,000 35,000 35,000 35,000
Erection of Tower and Setting Turbine (4)
Labor 15,000 18,000 15,000 15,000
Contractor Misc. (5) 13,000 16,000 13,000 9,000
Contingencies (7%) 112,420 116,340 104,930 97,720
Project Developer/Manager (3%) (6) 166,113 127,750 116,308 87,382
Design Engineering 75,000 75,000 75,000 75,000
Geotechincal 15,000 15,000 15,000 15,000
Avain/EIS 70,000 70,000 70,000 70,000
Micro-Siting 21,500 21,500 21,500 21,500
Total $5,884,703 $4,567,590 $4,174,738 $3,181,602
Cost/kW $2,942 $3,045 $2,783 $3,535
NOTES:
1. Turbine cost was calculated in US Dollars after conversion from Euro Dollars and Canadian Dollars as required.
Currency conversion factors used: 1 USD = 1.54 Euro; 1 USD = 1.02 CND
2. Crane rental fees based on 14 day commitment. Prices vary widely based on size and advance reservations.
3. Crane Mob, Demob, Rental and labor is based on one turbine installation with rental for one month.
4. Erection Labor is per turbine installation
5. Contractor miscellaneous fees provide a margin for minor equipment rental, scaffolding and spent supplies.
6. Project Developer/Manager fee based on 3% of total cost of project less Design Engineering cost.
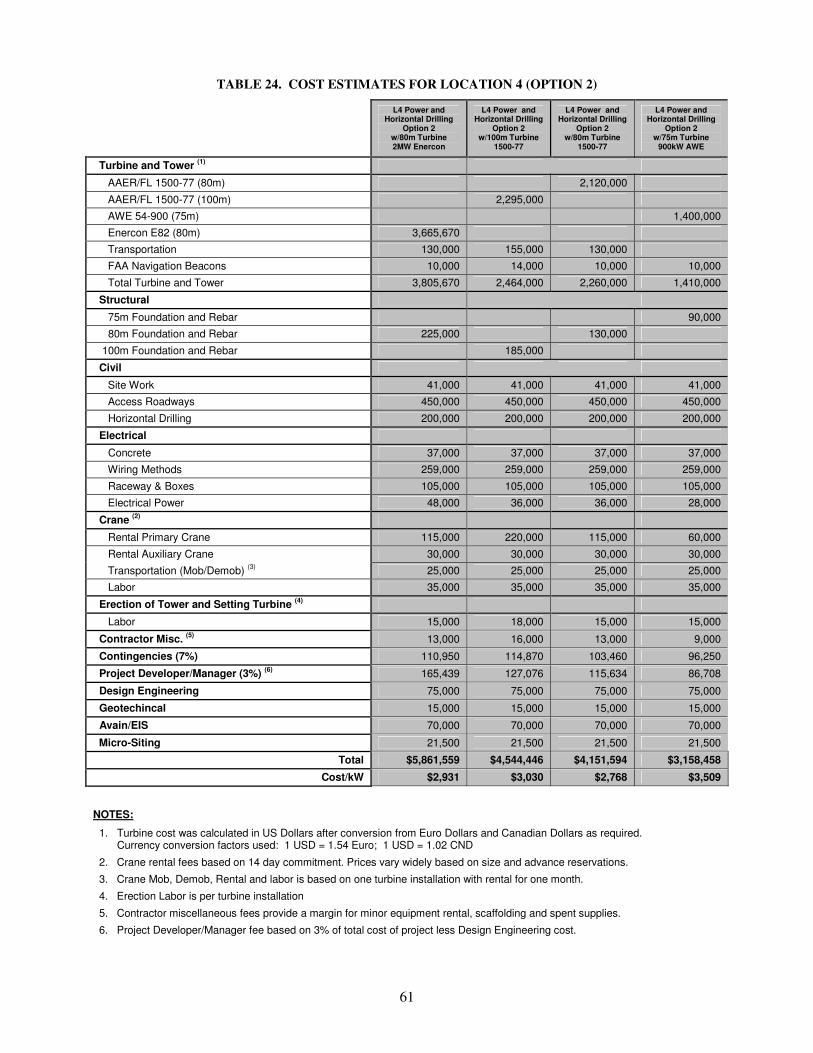
61
TABLE 24. COST ESTIMATES FOR LOCATION 4 (OPTION 2)
L4 Power and Horizontal Drilling
Option 2 w/80m Turbine 2MW Enercon
L4 Power and Horizontal Drilling
Option 2 w/100m Turbine
1500-77
L4 Power and Horizontal Drilling
Option 2 w/80m Turbine
1500-77
L4 Power and Horizontal Drilling
Option 2 w/75m Turbine
900kW AWE
Turbine and Tower (1)
AAER/FL 1500-77 (80m) 2,120,000
AAER/FL 1500-77 (100m) 2,295,000
AWE 54-900 (75m) 1,400,000
Enercon E82 (80m) 3,665,670
Transportation 130,000 155,000 130,000
FAA Navigation Beacons 10,000 14,000 10,000 10,000
Total Turbine and Tower 3,805,670 2,464,000 2,260,000 1,410,000
Structural
75m Foundation and Rebar 90,000
80m Foundation and Rebar 225,000 130,000
100m Foundation and Rebar 185,000
Civil
Site Work 41,000 41,000 41,000 41,000
Access Roadways 450,000 450,000 450,000 450,000
Horizontal Drilling 200,000 200,000 200,000 200,000
Electrical
Concrete 37,000 37,000 37,000 37,000
Wiring Methods 259,000 259,000 259,000 259,000
Raceway & Boxes 105,000 105,000 105,000 105,000
Electrical Power 48,000 36,000 36,000 28,000
Crane (2)
Rental Primary Crane 115,000 220,000 115,000 60,000
Rental Auxiliary Crane 30,000 30,000 30,000 30,000
Transportation (Mob/Demob) (3) 25,000 25,000 25,000 25,000
Labor 35,000 35,000 35,000 35,000
Erection of Tower and Setting Turbine (4)
Labor 15,000 18,000 15,000 15,000
Contractor Misc. (5) 13,000 16,000 13,000 9,000
Contingencies (7%) 110,950 114,870 103,460 96,250
Project Developer/Manager (3%) (6) 165,439 127,076 115,634 86,708
Design Engineering 75,000 75,000 75,000 75,000
Geotechincal 15,000 15,000 15,000 15,000
Avain/EIS 70,000 70,000 70,000 70,000
Micro-Siting 21,500 21,500 21,500 21,500
Total $5,861,559 $4,544,446 $4,151,594 $3,158,458
Cost/kW $2,931 $3,030 $2,768 $3,509
NOTES:
1. Turbine cost was calculated in US Dollars after conversion from Euro Dollars and Canadian Dollars as required. Currency conversion factors used: 1 USD = 1.54 Euro; 1 USD = 1.02 CND
2. Crane rental fees based on 14 day commitment. Prices vary widely based on size and advance reservations.
3. Crane Mob, Demob, Rental and labor is based on one turbine installation with rental for one month.
4. Erection Labor is per turbine installation
5. Contractor miscellaneous fees provide a margin for minor equipment rental, scaffolding and spent supplies.
6. Project Developer/Manager fee based on 3% of total cost of project less Design Engineering cost.
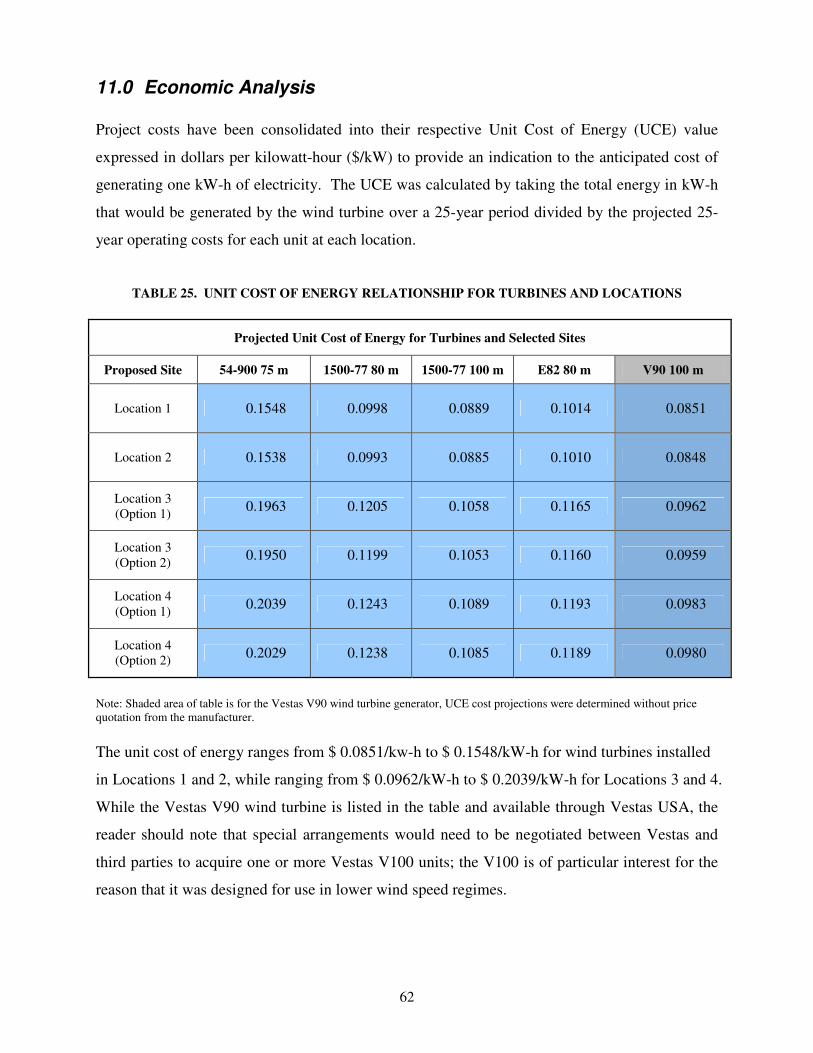
62
11.0 Economic Analysis
Project costs have been consolidated into their respective Unit Cost of Energy (UCE) value
expressed in dollars per kilowatt-hour ($/kW) to provide an indication to the anticipated cost of
generating one kW-h of electricity. The UCE was calculated by taking the total energy in kW-h
that would be generated by the wind turbine over a 25-year period divided by the projected 25-
year operating costs for each unit at each location.
TABLE 25. UNIT COST OF ENERGY RELATIONSHIP FOR TURBINES AND LOCATIONS
Projected Unit Cost of Energy for Turbines and Selected Sites
Proposed Site 54-900 75 m 1500-77 80 m 1500-77 100 m E82 80 m V90 100 m
Location 1 0.1548 0.0998 0.0889 0.1014 0.0851
Location 2 0.1538 0.0993 0.0885 0.1010 0.0848
Location 3 (Option 1) 0.1963 0.1205 0.1058 0.1165 0.0962
Location 3 (Option 2) 0.1950 0.1199 0.1053 0.1160 0.0959
Location 4 (Option 1) 0.2039 0.1243 0.1089 0.1193 0.0983
Location 4 (Option 2) 0.2029 0.1238 0.1085 0.1189 0.0980
Note: Shaded area of table is for the Vestas V90 wind turbine generator, UCE cost projections were determined without price quotation from the manufacturer.
The unit cost of energy ranges from $ 0.0851/kw-h to $ 0.1548/kW-h for wind turbines installed
in Locations 1 and 2, while ranging from $ 0.0962/kW-h to $ 0.2039/kW-h for Locations 3 and 4.
While the Vestas V90 wind turbine is listed in the table and available through Vestas USA, the
reader should note that special arrangements would need to be negotiated between Vestas and
third parties to acquire one or more Vestas V100 units; the V100 is of particular interest for the
reason that it was designed for use in lower wind speed regimes.

63
TABLE 26(A). ECONOMIC ANALYSIS OF FUHRLANDER/AAER 1500-77 W/80M TOWER
Project Data Schedule Turbine Manufacturer and Model Fuhrlander FL1500-77/AAER A-1500-77 Nameplate 1500 kW Turbine Hub Height 80m Position Location 1 Estimate Energy Capture 2,614,644 kW-h Estimate Capacity Factor 19.9 % Less Availability and System Losses (5%) 2,483,912 kW-h Energy Delivery Factor 18.9 % Current Electrical Energy Cost 0.0780 /kW-h REC Price 1st Contract Term 0.0150 /kW-h REC Price 2nd Contract Term 0.0150 /kW-h Expected Life of Equipment 25 years Inflation Escalation Energy 3.000 % Inflation Escalation Insurance and Services 3.000 % Bank Note Rate 4.500 % Bank Note Term 15 years Initial Capital Cost (ICC) Turbine and Tower 2,260,000 Installation 826,638 Tariffs 45,200 Total ICC 3,131,838 Source of Capital Funding CREB Underwriting ( 0%, 15 years) 1,500,000 Amount Financed by Bank 1,631,838 Total Capital Funding 3,131,838 Balance Capital by Endowment or PPP Funding 0 Net Present and Future Value Discount Rate 5.000 % Number of Periods 5 years Net Present Value 470,976 Future Value (at the end of 25 years) 2,008,033 Unit Cost of Energy (UCE) Total Projected Expenditures over Life-Cycle 6,199,153 Total Projected Energy Generated 62,097,795 kW-h Anticipated UCE - Levelized 0.0998 /kW-h Capacity Installation Cost (USD) 2,088 /kW

64
TABLE 26(B). ECONOMIC ANALYSIS OF FUHRLANDER/AAER 1500-77 W/80M TOWER
Project Data Schedule Turbine Manufacturer and Model Fuhrlander FL1500-77/AAER A-1500-77 Nameplate 1500 kW Turbine Hub Height 80m Position Location 2 Estimate Energy Capture 2,614,644 kW-h Estimate Capacity Factor 19.9 % Less Availability and System Losses (5%) 2,483,912 kW-h Energy Delivery Factor 18.9 % Current Electrical Energy Cost 0.0780 /kW-h REC Price 1st Contract Term 0.0150 /kW-h REC Price 2nd Contract Term 0.0150 /kW-h Expected Life of Equipment 25 years Inflation Escalation Energy 3.000 % Inflation Escalation Insurance and Services 3.000 % Bank Note Rate 4.500 % Bank Note Term 15 years Initial Capital Cost (ICC) Turbine and Tower 2,260,000 Installation 804,923 Tariffs 45,200 Total ICC 3,110,123 Source of Capital Funding CREB Underwriting ( 0%, 15 years) 1,500,000 Amount Financed by Bank 1,610,123 Total Capital Funding 3,110,123 Balance Capital by Endowment or PPP Funding 0 Net Present and Future Value Discount Rate 5.000 % Number of Periods 25 years Net Present Value 381,034 Future Value (at the end of 25 years) 1,832,713 Unit Cost of Energy (UCE) Total Projected Expenditures over Life-Cycle 6,168,823 Total Projected Energy Generated 62,097,795 kW-h Anticipated UCE - Levelized 0.0993 /kW-h Capacity Installation Cost (USD) 2,073 /kW

65
TABLE 26(C). ECONOMIC ANALYSIS OF FUHRLANDER/AAER 1500-77 W/80M TOWER
Project Data Schedule Turbine Manufacturer and Model Fuhrlander FL1500-77/AAER A-1500-77 Nameplate 1500 kW Turbine Hub Height 80m Position Location 3 (Option 1) Estimate Energy Capture 2,614,644 kW-h Estimate Capacity Factor 19.9 % Less Availability and System Losses (5%) 2,483,912 kW-h Energy Delivery Factor 18.9 % Current Electrical Energy Cost 0.0780 /kW-h REC Price 1st Contract Term 0.0150 /kW-h REC Price 2nd Contract Term 0.0150 /kW-h Expected Life of Equipment 25 years Inflation Escalation Energy 3.000 % Inflation Escalation Insurance and Services 3.000 % Bank Note Rate 4.500 % Bank Note Term 15 years Initial Capital Cost (ICC) Turbine and Tower 2,260,000 Installation 1,745,015 Tariffs 45,200 Total ICC 4,050,215 Source of Capital Funding CREB Underwriting ( 0%, 15 years) 1,500,000 Amount Financed by Bank 2,550,215 Total Capital Funding 4,050,215 Balance Capital by Endowment or PPP Funding 0 Net Present and Future Value Discount Rate 5.000 % Number of Periods 25 years Net Present Value -416,626 Future Value (at the end of 25 years) 2,291,648 Unit Cost of Energy (UCE) Total Projected Expenditures over Life-Cycle 7,481,856 Total Projected Energy Generated 62,097,795 kW-h Anticipated UCE – Levelized 0.1205 /kW-h Capacity Installation Cost (USD) 2,700 /kW

66
TABLE 26(D). ECONOMIC ANALYSIS OF FUHRLANDER/AAER 1500-77 W/80M TOWER
Project Data Schedule Turbine Manufacturer and Model Fuhrlander FL1500-77/AAER A-1500-77 Nameplate 1500 kW Turbine Hub Height 80m Position Location 3 (Option 2) Estimate Energy Capture 2,614,644 kW-h Estimate Capacity Factor 19.9 % Less Availability and System Losses (5%) 2,483,912 kW-h Energy Delivery Factor 18.9 % Current Electrical Energy Cost 0.0780 /kW-h REC Price 1st Contract Term 0.0150 /kW-h REC Price 2nd Contract Term 0.0150 /kW-h Expected Life of Equipment 25 years Inflation Escalation Energy 3.000 % Inflation Escalation Insurance and Services 3.000 % Bank Note Rate 4.500 % Bank Note Term 15 years Initial Capital Cost (ICC) Turbine and Tower 2,260,000 Installation 1,717,462 Tariffs 45,200 Total ICC 4,022,662 Source of Capital Funding CREB Underwriting ( 0%, 15 years) 1,500,000 Amount Financed by Bank 2,522,662 Total Capital Funding 4,022,662 Balance Capital by Endowment or PPP Funding 0 Net Present and Future Value Discount Rate 5.000 % Number of Periods 25 years Net Present Value 59,939 Future Value (at the end of 25 years) 870,293 Unit Cost of Energy (UCE) Total Projected Expenditures over Life-Cycle 7,443,373 Total Projected Energy Generated 62,097,795 Anticipated UCE - Levelized 0.1199 Capacity Installation Cost (USD) 2,682 /kW
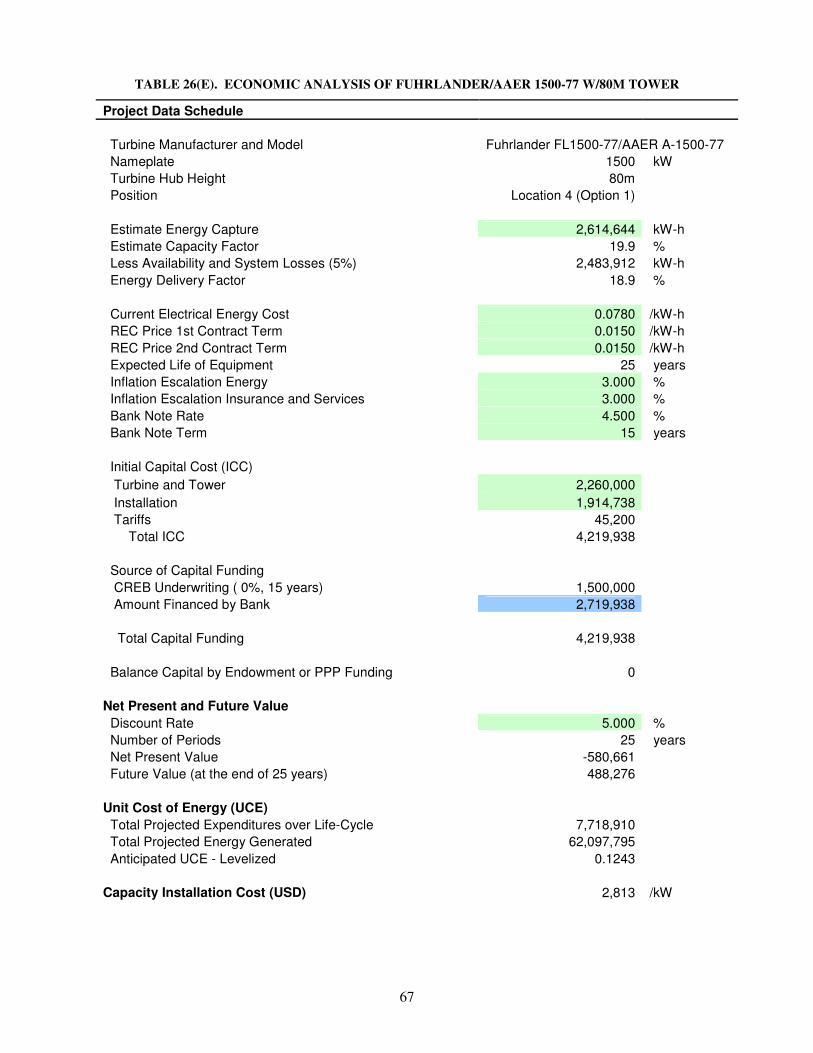
67
TABLE 26(E). ECONOMIC ANALYSIS OF FUHRLANDER/AAER 1500-77 W/80M TOWER
Project Data Schedule Turbine Manufacturer and Model Fuhrlander FL1500-77/AAER A-1500-77 Nameplate 1500 kW Turbine Hub Height 80m Position Location 4 (Option 1) Estimate Energy Capture 2,614,644 kW-h Estimate Capacity Factor 19.9 % Less Availability and System Losses (5%) 2,483,912 kW-h Energy Delivery Factor 18.9 % Current Electrical Energy Cost 0.0780 /kW-h REC Price 1st Contract Term 0.0150 /kW-h REC Price 2nd Contract Term 0.0150 /kW-h Expected Life of Equipment 25 years Inflation Escalation Energy 3.000 % Inflation Escalation Insurance and Services 3.000 % Bank Note Rate 4.500 % Bank Note Term 15 years Initial Capital Cost (ICC) Turbine and Tower 2,260,000 Installation 1,914,738 Tariffs 45,200 Total ICC 4,219,938 Source of Capital Funding CREB Underwriting ( 0%, 15 years) 1,500,000 Amount Financed by Bank 2,719,938 Total Capital Funding 4,219,938 Balance Capital by Endowment or PPP Funding 0 Net Present and Future Value Discount Rate 5.000 % Number of Periods 25 years Net Present Value -580,661 Future Value (at the end of 25 years) 488,276 Unit Cost of Energy (UCE) Total Projected Expenditures over Life-Cycle 7,718,910 Total Projected Energy Generated 62,097,795 Anticipated UCE - Levelized 0.1243 Capacity Installation Cost (USD) 2,813 /kW

68
TABLE 26(F). ECONOMIC ANALYSIS OF FUHRLANDER/AAER 1500-77 W/80M TOWER
Project Data Schedule Turbine Manufacturer and Model Fuhrlander FL1500-77/AAER A-1500-77 Nameplate 1500 kW Turbine Hub Height 80m Position Location 4 Option 2 Estimate Energy Capture 2,614,644 kW-h Estimate Capacity Factor 19.9 % Less Availability and System Losses (5%) 2,483,912 kW-h Energy Delivery Factor 18.9 % Current Electrical Energy Cost 0.0780 /kW-h REC Price 1st Contract Term 0.0150 /kW-h REC Price 2nd Contract Term 0.0150 /kW-h Expected Life of Equipment 25 years Inflation Escalation Energy 3.000 % Inflation Escalation Insurance and Services 3.000 % Bank Note Rate 4.500 % Bank Note Term 15 years Initial Capital Cost (ICC) Turbine and Tower 2,260,000 Installation 1,891,594 Tariffs 45,200 Total ICC 4,196,794 Source of Capital Funding CREB Underwriting ( 0%, 15 years) 1,500,000 Amount Financed by Bank 2,696,794 Total Capital Funding 4,196,794 Balance Capital by Endowment or PPP Funding 0 Net Present and Future Value Discount Rate 5.000 % Number of Periods 25 years Net Present Value -558,293 Future Value (at the end of 25 years) 520,601 Unit Cost of Energy (UCE) Total Projected Expenditures over Life-Cycle 7,686,584 Total Projected Energy Generated 62,097,795 Anticipated UCE - Levelized 0.1238 Capacity Installation Cost (USD) 2,798 /kW

69
TABLE 27(A). ECONOMIC ANALYSIS OF FUHRLANDER/AAER 1500-77 W/100M TOWER
Project Data Schedule Turbine Manufacturer and Model Fuhrlander FL1500-77/AAER A-1500-77 Nameplate 1500 kW Turbine Hub Height 100m Position Location 1 Estimate Energy Capture 3,197,809 kW-h Estimate Capacity Factor 24.3 % Less Availability and System Losses (5%) 3,037,919 kW-h Energy Delivery Factor 23.1 % Current Electrical Energy Cost 0.0780 /kW-h REC Price 1st Contract Term 0.0150 /kW-h REC Price 2nd Contract Term 0.0150 /kW-h Expected Life of Equipment 25 years Inflation Escalation Energy 3.000 % Inflation Escalation Insurance and Services 3.000 % Bank Note Rate 4.500 % Bank Note Term 15 years Initial Capital Cost (ICC) Turbine and Tower 2,464,000 Installation 1,015,490 Tariffs 49,280 Total ICC 3,528,770 Source of Capital Funding CREB Underwriting ( 0%, 15 years) 1,500,000 Amount Financed by Bank 2,028,770 Total Capital Funding 3,528,770 Balance Capital by Endowment or PPP Funding 0 Net Present and Future Value Discount Rate 5.000 % Number of Periods 5 years Net Present Value 1,053,923 Future Value (at the end of 25 years) 3,284,150 Unit Cost of Energy (UCE) Total Projected Expenditures over Life-Cycle 6,753,550 Total Projected Energy Generated 75,947,964 kW-h Anticipated UCE - Levelized 0.0889 /kW-h Capacity Installation Cost (USD) 2,353 /kW
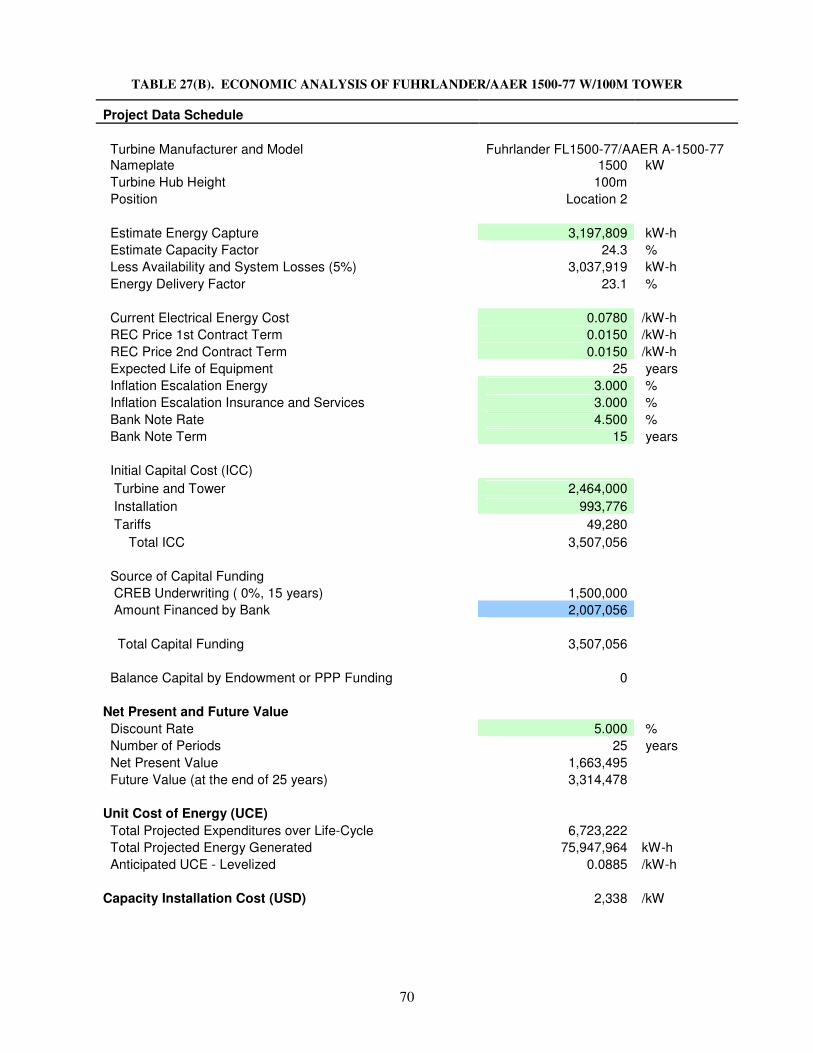
70
TABLE 27(B). ECONOMIC ANALYSIS OF FUHRLANDER/AAER 1500-77 W/100M TOWER
Project Data Schedule Turbine Manufacturer and Model Fuhrlander FL1500-77/AAER A-1500-77 Nameplate 1500 kW Turbine Hub Height 100m Position Location 2 Estimate Energy Capture 3,197,809 kW-h Estimate Capacity Factor 24.3 % Less Availability and System Losses (5%) 3,037,919 kW-h Energy Delivery Factor 23.1 % Current Electrical Energy Cost 0.0780 /kW-h REC Price 1st Contract Term 0.0150 /kW-h REC Price 2nd Contract Term 0.0150 /kW-h Expected Life of Equipment 25 years Inflation Escalation Energy 3.000 % Inflation Escalation Insurance and Services 3.000 % Bank Note Rate 4.500 % Bank Note Term 15 years Initial Capital Cost (ICC) Turbine and Tower 2,464,000 Installation 993,776 Tariffs 49,280 Total ICC 3,507,056 Source of Capital Funding CREB Underwriting ( 0%, 15 years) 1,500,000 Amount Financed by Bank 2,007,056 Total Capital Funding 3,507,056 Balance Capital by Endowment or PPP Funding 0 Net Present and Future Value Discount Rate 5.000 % Number of Periods 25 years Net Present Value 1,663,495 Future Value (at the end of 25 years) 3,314,478 Unit Cost of Energy (UCE) Total Projected Expenditures over Life-Cycle 6,723,222 Total Projected Energy Generated 75,947,964 kW-h Anticipated UCE - Levelized 0.0885 /kW-h Capacity Installation Cost (USD) 2,338 /kW
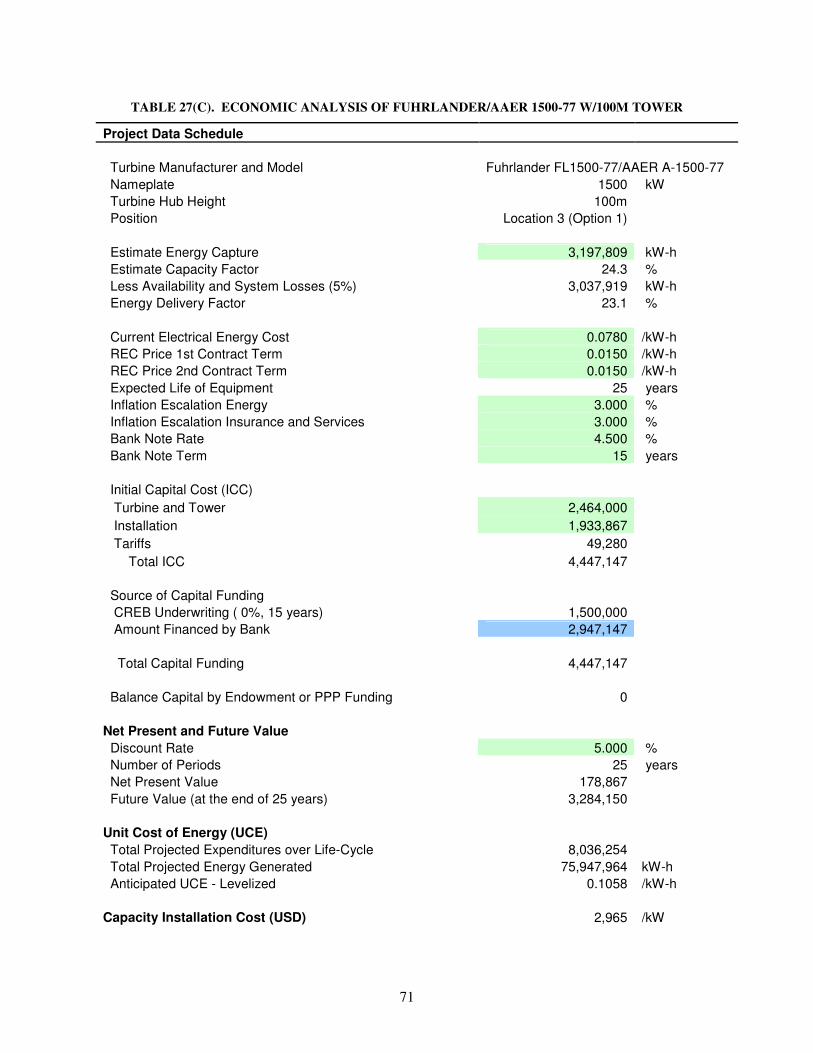
71
TABLE 27(C). ECONOMIC ANALYSIS OF FUHRLANDER/AAER 1500-77 W/100M TOWER
Project Data Schedule Turbine Manufacturer and Model Fuhrlander FL1500-77/AAER A-1500-77 Nameplate 1500 kW Turbine Hub Height 100m Position Location 3 (Option 1) Estimate Energy Capture 3,197,809 kW-h Estimate Capacity Factor 24.3 % Less Availability and System Losses (5%) 3,037,919 kW-h Energy Delivery Factor 23.1 % Current Electrical Energy Cost 0.0780 /kW-h REC Price 1st Contract Term 0.0150 /kW-h REC Price 2nd Contract Term 0.0150 /kW-h Expected Life of Equipment 25 years Inflation Escalation Energy 3.000 % Inflation Escalation Insurance and Services 3.000 % Bank Note Rate 4.500 % Bank Note Term 15 years Initial Capital Cost (ICC) Turbine and Tower 2,464,000 Installation 1,933,867 Tariffs 49,280 Total ICC 4,447,147 Source of Capital Funding CREB Underwriting ( 0%, 15 years) 1,500,000 Amount Financed by Bank 2,947,147 Total Capital Funding 4,447,147 Balance Capital by Endowment or PPP Funding 0 Net Present and Future Value Discount Rate 5.000 % Number of Periods 25 years Net Present Value 178,867 Future Value (at the end of 25 years) 3,284,150 Unit Cost of Energy (UCE) Total Projected Expenditures over Life-Cycle 8,036,254 Total Projected Energy Generated 75,947,964 kW-h Anticipated UCE - Levelized 0.1058 /kW-h Capacity Installation Cost (USD) 2,965 /kW
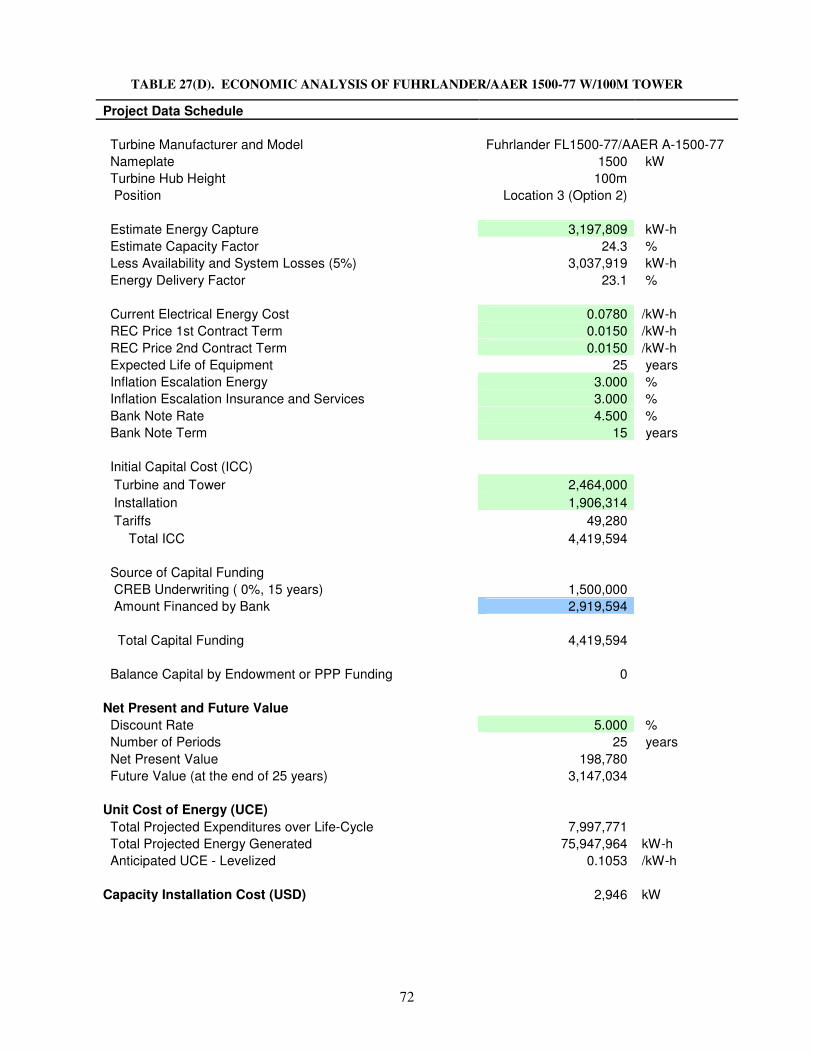
72
TABLE 27(D). ECONOMIC ANALYSIS OF FUHRLANDER/AAER 1500-77 W/100M TOWER
Project Data Schedule Turbine Manufacturer and Model Fuhrlander FL1500-77/AAER A-1500-77 Nameplate 1500 kW Turbine Hub Height 100m Position Location 3 (Option 2) Estimate Energy Capture 3,197,809 kW-h Estimate Capacity Factor 24.3 % Less Availability and System Losses (5%) 3,037,919 kW-h Energy Delivery Factor 23.1 % Current Electrical Energy Cost 0.0780 /kW-h REC Price 1st Contract Term 0.0150 /kW-h REC Price 2nd Contract Term 0.0150 /kW-h Expected Life of Equipment 25 years Inflation Escalation Energy 3.000 % Inflation Escalation Insurance and Services 3.000 % Bank Note Rate 4.500 % Bank Note Term 15 years Initial Capital Cost (ICC) Turbine and Tower 2,464,000 Installation 1,906,314 Tariffs 49,280 Total ICC 4,419,594 Source of Capital Funding CREB Underwriting ( 0%, 15 years) 1,500,000 Amount Financed by Bank 2,919,594 Total Capital Funding 4,419,594 Balance Capital by Endowment or PPP Funding 0 Net Present and Future Value Discount Rate 5.000 % Number of Periods 25 years Net Present Value 198,780 Future Value (at the end of 25 years) 3,147,034 Unit Cost of Energy (UCE) Total Projected Expenditures over Life-Cycle 7,997,771 Total Projected Energy Generated 75,947,964 kW-h Anticipated UCE - Levelized 0.1053 /kW-h Capacity Installation Cost (USD) 2,946 kW

73
TABLE 27(E). ECONOMIC ANALYSIS OF FUHRLANDER/AAER 1500-77 W/100M TOWER
Project Data Schedule Turbine Manufacturer and Model Fuhrlander FL1500-77/AAER A-1500-77 Nameplate 1500 kW Turbine Hub Height 100m Position Location 4 (Option 1) Estimate Energy Capture 3,197,809 kW-h Estimate Capacity Factor 24.3 % Less Availability and System Losses (5%) 3,037,919 kW-h Energy Delivery Factor 23.1 % Current Electrical Energy Cost 0.0780 /kW-h REC Price 1st Contract Term 0.0150 /kW-h REC Price 2nd Contract Term 0.0150 /kW-h Expected Life of Equipment 25 years Inflation Escalation Energy 3.000 % Inflation Escalation Insurance and Services 3.000 % Bank Note Rate 4.500 % Bank Note Term 15 years Initial Capital Cost (ICC) Turbine and Tower 2,464,000 Installation 2,103,590 Tariffs 49,280 Total ICC 4,616,870 Source of Capital Funding CREB Underwriting ( 0%, 15 years) 1,500,000 Amount Financed by Bank 3,116,870 Total Capital Funding 4,616,870 Balance Capital by Endowment or PPP Funding 0 Net Present and Future Value Discount Rate 5.000 % Number of Periods 25 years Net Present Value -6,322 Future Value (at the end of 25 years) 3,011,377 Unit Cost of Energy (UCE) Total Projected Expenditures over Life-Cycle 8,273,307 Total Projected Energy Generated 75,947,964 kW-h Anticipated UCE - Levelized 0.1089 /kW-h Capacity Installation Cost (USD) 3,078 /kW

74
TABLE 27(F). ECONOMIC ANALYSIS OF FUHRLANDER/AAER 1500-77 W/100M TOWER
Project Data Schedule Turbine Manufacturer and Model Fuhrlander FL1500-77/AAER A-1500-77 Nameplate 1500 kW Turbine Hub Height 100m Position Location 4 Option 2 Estimate Energy Capture 3,197,809 kW-h Estimate Capacity Factor 24.3 % Less Availability and System Losses (5%) 3,037,919 kW-h Energy Delivery Factor 23.1 % Current Electrical Energy Cost 0.0780 /kW-h REC Price 1st Contract Term 0.0150 /kW-h REC Price 2nd Contract Term 0.0150 /kW-h Expected Life of Equipment 25 years Inflation Escalation Energy 3.000 % Inflation Escalation Insurance and Services 3.000 % Bank Note Rate 4.500 % Bank Note Term 15 years Initial Capital Cost (ICC) Turbine and Tower 2,464,000 Installation 2,080,446 Tariffs 49,280 Total ICC 4,593,726 Source of Capital Funding CREB Underwriting ( 0%, 15 years) 1,500,000 Amount Financed by Bank 3,093,726 Total Capital Funding 4,593,726 Balance Capital by Endowment or PPP Funding 0 Net Present and Future Value Discount Rate 5.000 % Number of Periods 25 years Net Present Value 375,356 Future Value (at the end of 25 years) 1,827,897 Unit Cost of Energy (UCE) Total Projected Expenditures over Life-Cycle 8,240,982 Total Projected Energy Generated 75,947,964 kW-h Anticipated UCE - Levelized 0.1085 /kW-h Capacity Installation Cost (USD) 3,062 /kW

75
TABLE 28(A). ECONOMIC ANALYSIS OF AWE 54-900 W/75M TOWER
Project Data Schedule Turbine Manufacturer and Model AWE 54-900 Nameplate 900 kW Turbine Hub Height 75m Position Location 1 Estimate Energy Capture 1,302,504 kW-h Estimate Capacity Factor 16.5 % Less Availability and System Losses (5%) 1,237,379 kW-h Energy Delivery Factor 15.7 % Current Electrical Energy Cost 0.0780 /kW-h REC Price 1st Contract Term 0.0150 /kW-h REC Price 2nd Contract Term 0.0150 /kW-h Expected Life of Equipment 25 years Inflation Escalation Energy 3.000 % Inflation Escalation Insurance and Services 3.000 % Bank Note Rate 4.500 % Bank Note Term 15 years Initial Capital Cost (ICC) Turbine and Tower 1,410,000 Installation 683,502 Tariffs 28,200 Total ICC 2,121,702 Source of Capital Funding CREB Underwriting ( 0%, 15 years) 1,500,000 Amount Financed by Bank 621,702 Total Capital Funding 2,121,702 Balance Capital by Endowment or PPP Funding 0 Net Present and Future Value Discount Rate 5.000 % Number of Periods 25 years Net Present Value -727,570 Future Value (at the end of 25 years) -699,819 Unit Cost of Energy (UCE) Total Projected Expenditures over Life-Cycle 4,788,289 Total Projected Energy Generated 30,934,470 kW-h Anticipated UCE – Levelized 0.1548 /kW-h Capacity Installation Cost (USD) 2,357 /kW

76
TABLE 28(B). ECONOMIC ANALYSIS OF AWE 54-900 W/75M TOWER
Project Data Schedule Turbine Manufacturer and Model AWE 54-900 Nameplate 900 kW Turbine Hub Height 75m Position Location 2 Estimate Energy Capture 1,302,504 kW-h Estimate Capacity Factor 16.5 % Less Availability and System Losses (5%) 1,237,379 kW-h Energy Delivery Factor 15.7 % Current Electrical Energy Cost 0.0780 /kW-h REC Price 1st Contract Term 0.0150 /kW-h REC Price 2nd Contract Term 0.0150 /kW-h Expected Life of Equipment 25 years Inflation Escalation Energy 3.000 % Inflation Escalation Insurance and Services 3.000 % Bank Note Rate 4.500 % Bank Note Term 15 years Initial Capital Cost (ICC) Turbine and Tower 1,410,000 Installation 661,787 Tariffs 28,200 Total ICC 2,099,987 Source of Capital Funding CREB Underwriting ( 0%, 15 years) 1,500,000 Amount Financed by Bank 599,987 Total Capital Funding 2,099,987 Balance Capital by Endowment or PPP Funding 0 Net Present and Future Value Discount Rate 5.000 % Number of Periods 25 years Net Present Value -706,583 Future Value (at the end of 25 years) -669,490 Unit Cost of Energy (UCE) Total Projected Expenditures over Life-Cycle 4,757,959 Total Projected Energy Generated 30,934,470 kW-h Anticipated UCE – Levelized 0.1538 /kW-h Capacity Installation Cost (USD) 2,333 /kW

77
TABLE 28(C). ECONOMIC ANALYSIS OF AWE 54-900 W/75M TOWER
Project Data Schedule Turbine Manufacturer and Model AWE 54-900 Nameplate 900 kW Turbine Hub Height 75m Position Location 3 (Option 1) Estimate Energy Capture 1,302,504 kW-h Estimate Capacity Factor 16.5 % Less Availability and System Losses (5%) 1,237,379 kW-h Energy Delivery Factor 15.7 % Current Electrical Energy Cost 0.0780 /kW-h REC Price 1st Contract Term 0.0150 /kW-h REC Price 2nd Contract Term 0.0150 /kW-h Expected Life of Equipment 25 years Inflation Escalation Energy 3.000 % Inflation Escalation Insurance and Services 3.000 % Bank Note Rate 4.500 % Bank Note Term 15 years Initial Capital Cost (ICC) Turbine and Tower 1,410,000 Installation 1,601,878 Tariffs 28,200 Total ICC 3,040,078 Source of Capital Funding CREB Underwriting ( 0%, 15 years) 1,500,000 Amount Financed by Bank 1,540,078 Total Capital Funding 3,040,078 Balance Capital by Endowment or PPP Funding 0 Net Present and Future Value Discount Rate 5.000 % Number of Periods 25 years Net Present Value -1,622,168 Future Value (at the end of 25 years) -1,982,521 Unit Cost of Energy (UCE) Total Projected Expenditures over Life-Cycle 6,070,991 Total Projected Energy Generated 30,934,470 kW-h Anticipated UCE - Levelized 0.1963 /kW-h Capacity Installation Cost (USD) 3,378 /kW
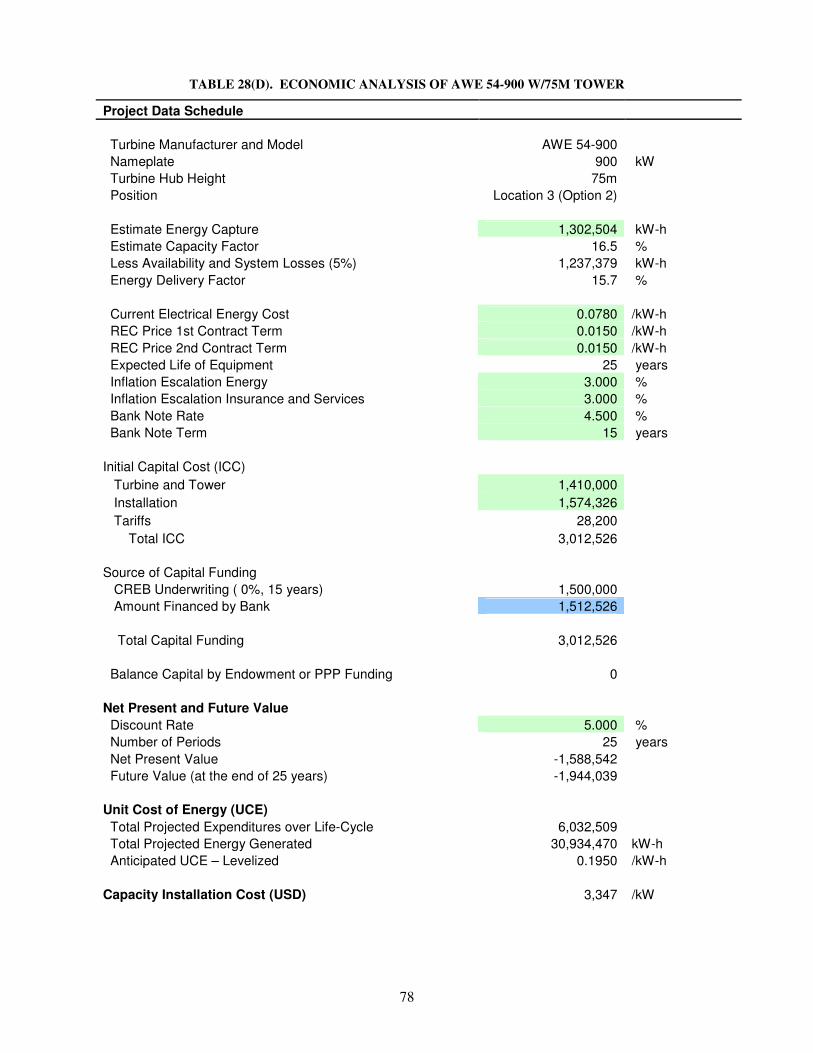
78
TABLE 28(D). ECONOMIC ANALYSIS OF AWE 54-900 W/75M TOWER
Project Data Schedule Turbine Manufacturer and Model AWE 54-900 Nameplate 900 kW Turbine Hub Height 75m Position Location 3 (Option 2) Estimate Energy Capture 1,302,504 kW-h Estimate Capacity Factor 16.5 % Less Availability and System Losses (5%) 1,237,379 kW-h Energy Delivery Factor 15.7 % Current Electrical Energy Cost 0.0780 /kW-h REC Price 1st Contract Term 0.0150 /kW-h REC Price 2nd Contract Term 0.0150 /kW-h Expected Life of Equipment 25 years Inflation Escalation Energy 3.000 % Inflation Escalation Insurance and Services 3.000 % Bank Note Rate 4.500 % Bank Note Term 15 years Initial Capital Cost (ICC) Turbine and Tower 1,410,000 Installation 1,574,326 Tariffs 28,200 Total ICC 3,012,526 Source of Capital Funding CREB Underwriting ( 0%, 15 years) 1,500,000 Amount Financed by Bank 1,512,526 Total Capital Funding 3,012,526 Balance Capital by Endowment or PPP Funding 0 Net Present and Future Value Discount Rate 5.000 % Number of Periods 25 years Net Present Value -1,588,542 Future Value (at the end of 25 years) -1,944,039 Unit Cost of Energy (UCE) Total Projected Expenditures over Life-Cycle 6,032,509 Total Projected Energy Generated 30,934,470 kW-h Anticipated UCE – Levelized 0.1950 /kW-h Capacity Installation Cost (USD) 3,347 /kW
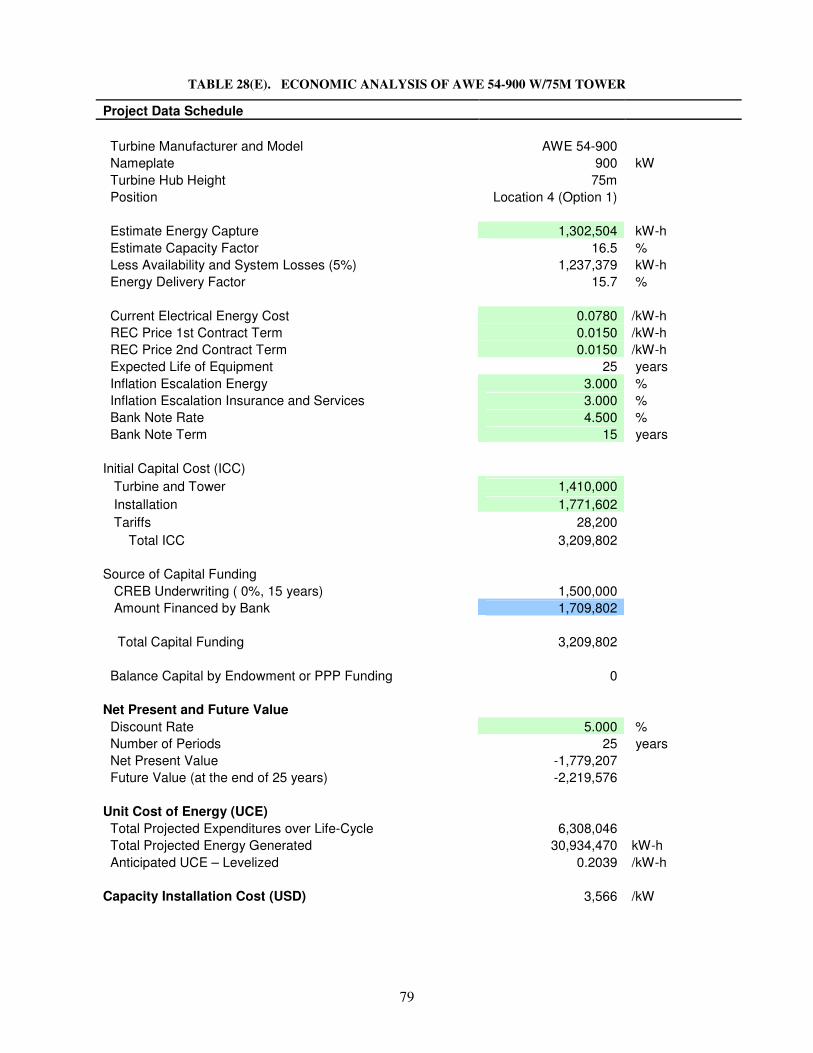
79
TABLE 28(E). ECONOMIC ANALYSIS OF AWE 54-900 W/75M TOWER
Project Data Schedule Turbine Manufacturer and Model AWE 54-900 Nameplate 900 kW Turbine Hub Height 75m Position Location 4 (Option 1) Estimate Energy Capture 1,302,504 kW-h Estimate Capacity Factor 16.5 % Less Availability and System Losses (5%) 1,237,379 kW-h Energy Delivery Factor 15.7 % Current Electrical Energy Cost 0.0780 /kW-h REC Price 1st Contract Term 0.0150 /kW-h REC Price 2nd Contract Term 0.0150 /kW-h Expected Life of Equipment 25 years Inflation Escalation Energy 3.000 % Inflation Escalation Insurance and Services 3.000 % Bank Note Rate 4.500 % Bank Note Term 15 years Initial Capital Cost (ICC) Turbine and Tower 1,410,000 Installation 1,771,602 Tariffs 28,200 Total ICC 3,209,802 Source of Capital Funding CREB Underwriting ( 0%, 15 years) 1,500,000 Amount Financed by Bank 1,709,802 Total Capital Funding 3,209,802 Balance Capital by Endowment or PPP Funding 0 Net Present and Future Value Discount Rate 5.000 % Number of Periods 25 years Net Present Value -1,779,207 Future Value (at the end of 25 years) -2,219,576 Unit Cost of Energy (UCE) Total Projected Expenditures over Life-Cycle 6,308,046 Total Projected Energy Generated 30,934,470 kW-h Anticipated UCE – Levelized 0.2039 /kW-h Capacity Installation Cost (USD) 3,566 /kW

80
TABLE 28(F). ECONOMIC ANALYSIS OF AWE 54-900 W/75M TOWER
Project Data Schedule Turbine Manufacturer and Model AWE 54-900 Nameplate 900 kW Turbine Hub Height 75m Position Location 4 (Option 2) Estimate Energy Capture 1,302,504 kW-h Estimate Capacity Factor 16.5 % Less Availability and System Losses (5%) 1,237,379 kW-h Energy Delivery Factor 15.7 % Current Electrical Energy Cost 0.0780 /kW-h REC Price 1st Contract Term 0.0150 /kW-h REC Price 2nd Contract Term 0.0150 /kW-h Expected Life of Equipment 25 years Inflation Escalation Energy 3.000 % Inflation Escalation Insurance and Services 3.000 % Bank Note Rate 4.500 % Bank Note Term 15 years Initial Capital Cost (ICC) Turbine and Tower 1,410,000 Installation 1,748,458 Tariffs 28,200 Total ICC 3,186,658 Source of Capital Funding CREB Underwriting ( 0%, 15 years) 1,500,000 Amount Financed by Bank 1,686,658 Total Capital Funding 3,186,658 Balance Capital by Endowment or PPP Funding 0 Net Present and Future Value Discount Rate 5.000 % Number of Periods 25 years Net Present Value -1,756,839 Future Value (at the end of 25 years) -2,187,251 Unit Cost of Energy (UCE) Total Projected Expenditures over Life-Cycle 6,275,720 Total Projected Energy Generated 30,934,470 kW-h Anticipated UCE – Levelized 0.2029 /kW-h Capacity Installation Cost (USD) 3,541 /kW
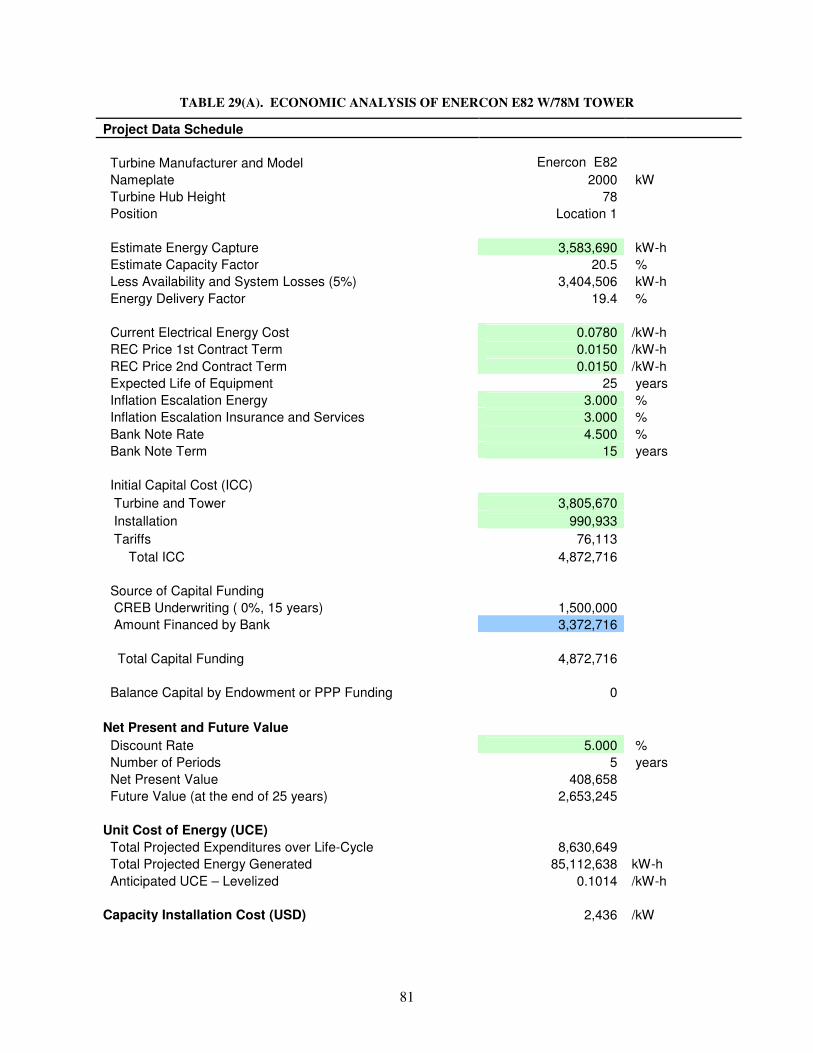
81
TABLE 29(A). ECONOMIC ANALYSIS OF ENERCON E82 W/78M TOWER
Project Data Schedule Turbine Manufacturer and Model Enercon E82 Nameplate 2000 kW Turbine Hub Height 78 Position Location 1 Estimate Energy Capture 3,583,690 kW-h Estimate Capacity Factor 20.5 % Less Availability and System Losses (5%) 3,404,506 kW-h Energy Delivery Factor 19.4 % Current Electrical Energy Cost 0.0780 /kW-h REC Price 1st Contract Term 0.0150 /kW-h REC Price 2nd Contract Term 0.0150 /kW-h Expected Life of Equipment 25 years Inflation Escalation Energy 3.000 % Inflation Escalation Insurance and Services 3.000 % Bank Note Rate 4.500 % Bank Note Term 15 years Initial Capital Cost (ICC) Turbine and Tower 3,805,670 Installation 990,933 Tariffs 76,113 Total ICC 4,872,716 Source of Capital Funding CREB Underwriting ( 0%, 15 years) 1,500,000 Amount Financed by Bank 3,372,716 Total Capital Funding 4,872,716 Balance Capital by Endowment or PPP Funding 0 Net Present and Future Value Discount Rate 5.000 % Number of Periods 5 years Net Present Value 408,658 Future Value (at the end of 25 years) 2,653,245 Unit Cost of Energy (UCE) Total Projected Expenditures over Life-Cycle 8,630,649 Total Projected Energy Generated 85,112,638 kW-h Anticipated UCE – Levelized 0.1014 /kW-h Capacity Installation Cost (USD) 2,436 /kW
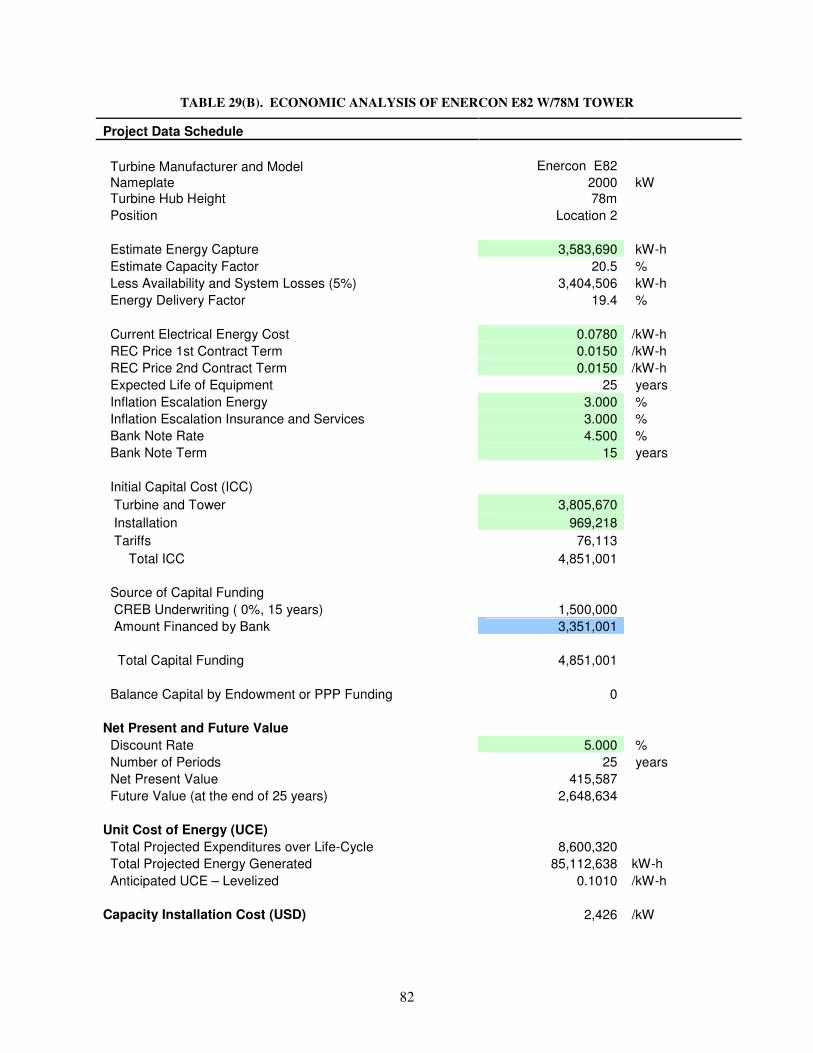
82
TABLE 29(B). ECONOMIC ANALYSIS OF ENERCON E82 W/78M TOWER
Project Data Schedule Turbine Manufacturer and Model Enercon E82 Nameplate 2000 kW Turbine Hub Height 78m Position Location 2 Estimate Energy Capture 3,583,690 kW-h Estimate Capacity Factor 20.5 % Less Availability and System Losses (5%) 3,404,506 kW-h Energy Delivery Factor 19.4 % Current Electrical Energy Cost 0.0780 /kW-h REC Price 1st Contract Term 0.0150 /kW-h REC Price 2nd Contract Term 0.0150 /kW-h Expected Life of Equipment 25 years Inflation Escalation Energy 3.000 % Inflation Escalation Insurance and Services 3.000 % Bank Note Rate 4.500 % Bank Note Term 15 years Initial Capital Cost (ICC) Turbine and Tower 3,805,670 Installation 969,218 Tariffs 76,113 Total ICC 4,851,001 Source of Capital Funding CREB Underwriting ( 0%, 15 years) 1,500,000 Amount Financed by Bank 3,351,001 Total Capital Funding 4,851,001 Balance Capital by Endowment or PPP Funding 0 Net Present and Future Value Discount Rate 5.000 % Number of Periods 25 years Net Present Value 415,587 Future Value (at the end of 25 years) 2,648,634 Unit Cost of Energy (UCE) Total Projected Expenditures over Life-Cycle 8,600,320 Total Projected Energy Generated 85,112,638 kW-h Anticipated UCE – Levelized 0.1010 /kW-h Capacity Installation Cost (USD) 2,426 /kW

83
TABLE 29(C). ECONOMIC ANALYSIS OF ENERCON E82 W/78M TOWER
Project Data Schedule Turbine Manufacturer and Model Enercon E82 Nameplate 2000 kW Turbine Hub Height 78m Position Location 3 (Option 1) Estimate Energy Capture 3,583,690 kW-h Estimate Capacity Factor 20.5 % Less Availability and System Losses (5%) 3,404,506 kW-h Energy Delivery Factor 19.4 % Current Electrical Energy Cost 0.0780 /kW-h REC Price 1st Contract Term 0.0150 /kW-h REC Price 2nd Contract Term 0.0150 /kW-h Expected Life of Equipment 25 years Inflation Escalation Energy 3.000 % Inflation Escalation Insurance and Services 3.000 % Bank Note Rate 4.500 % Bank Note Term 15 years Initial Capital Cost (ICC) Turbine and Tower 3,805,670 Installation 1,909,309 Tariffs 76,113 Total ICC 5,791,092 Source of Capital Funding CREB Underwriting ( 0%, 15 years) 1,500,000 Amount Financed by Bank 4,291,092 Total Capital Funding 5,791,092 Balance Capital by Endowment or PPP Funding 0 Net Present and Future Value Discount Rate 5.000 % Number of Periods 25 years Net Present Value -493,001 Future Value (at the end of 25 years) 2,361,764 Unit Cost of Energy (UCE) Total Projected Expenditures over Life-Cycle 9,913,352 Total Projected Energy Generated 85,112,638 kW-h Anticipated UCE – Levelized 0.1165 /kW-h Capacity Installation Cost (USD) 2,896 /kW
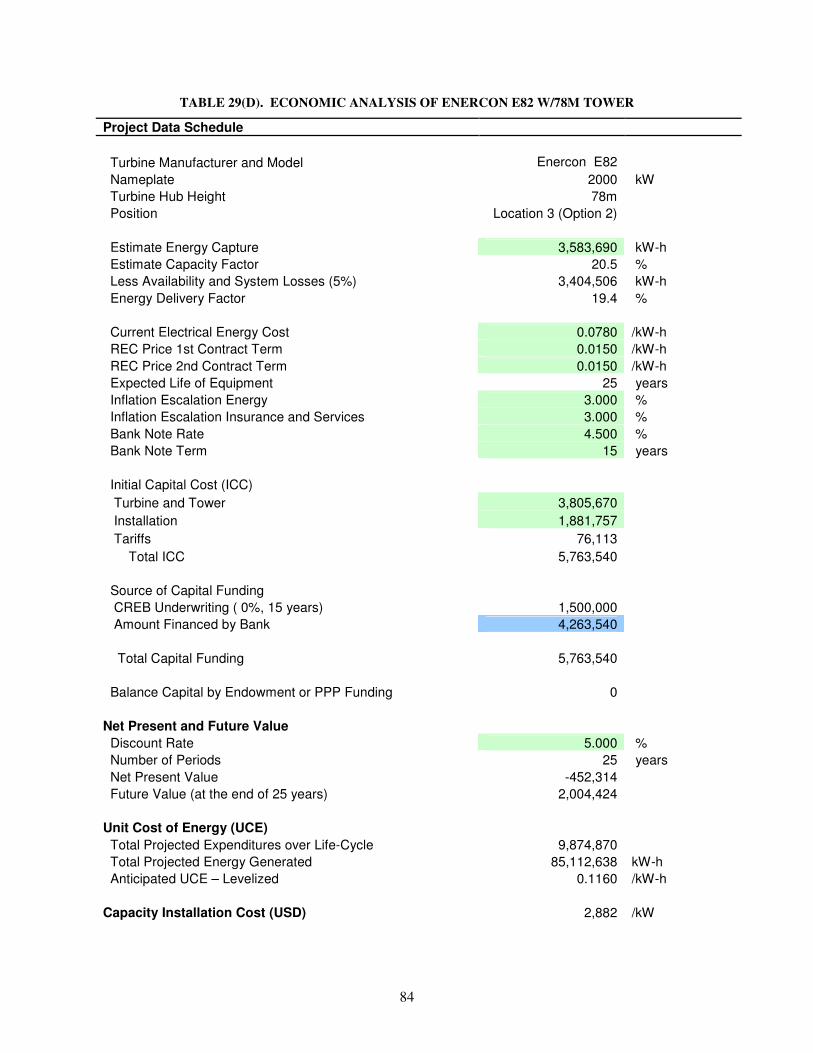
84
TABLE 29(D). ECONOMIC ANALYSIS OF ENERCON E82 W/78M TOWER
Project Data Schedule Turbine Manufacturer and Model Enercon E82 Nameplate 2000 kW Turbine Hub Height 78m Position Location 3 (Option 2) Estimate Energy Capture 3,583,690 kW-h Estimate Capacity Factor 20.5 % Less Availability and System Losses (5%) 3,404,506 kW-h Energy Delivery Factor 19.4 % Current Electrical Energy Cost 0.0780 /kW-h REC Price 1st Contract Term 0.0150 /kW-h REC Price 2nd Contract Term 0.0150 /kW-h Expected Life of Equipment 25 years Inflation Escalation Energy 3.000 % Inflation Escalation Insurance and Services 3.000 % Bank Note Rate 4.500 % Bank Note Term 15 years Initial Capital Cost (ICC) Turbine and Tower 3,805,670 Installation 1,881,757 Tariffs 76,113 Total ICC 5,763,540 Source of Capital Funding CREB Underwriting ( 0%, 15 years) 1,500,000 Amount Financed by Bank 4,263,540 Total Capital Funding 5,763,540 Balance Capital by Endowment or PPP Funding 0 Net Present and Future Value Discount Rate 5.000 % Number of Periods 25 years Net Present Value -452,314 Future Value (at the end of 25 years) 2,004,424 Unit Cost of Energy (UCE) Total Projected Expenditures over Life-Cycle 9,874,870 Total Projected Energy Generated 85,112,638 kW-h Anticipated UCE – Levelized 0.1160 /kW-h Capacity Installation Cost (USD) 2,882 /kW
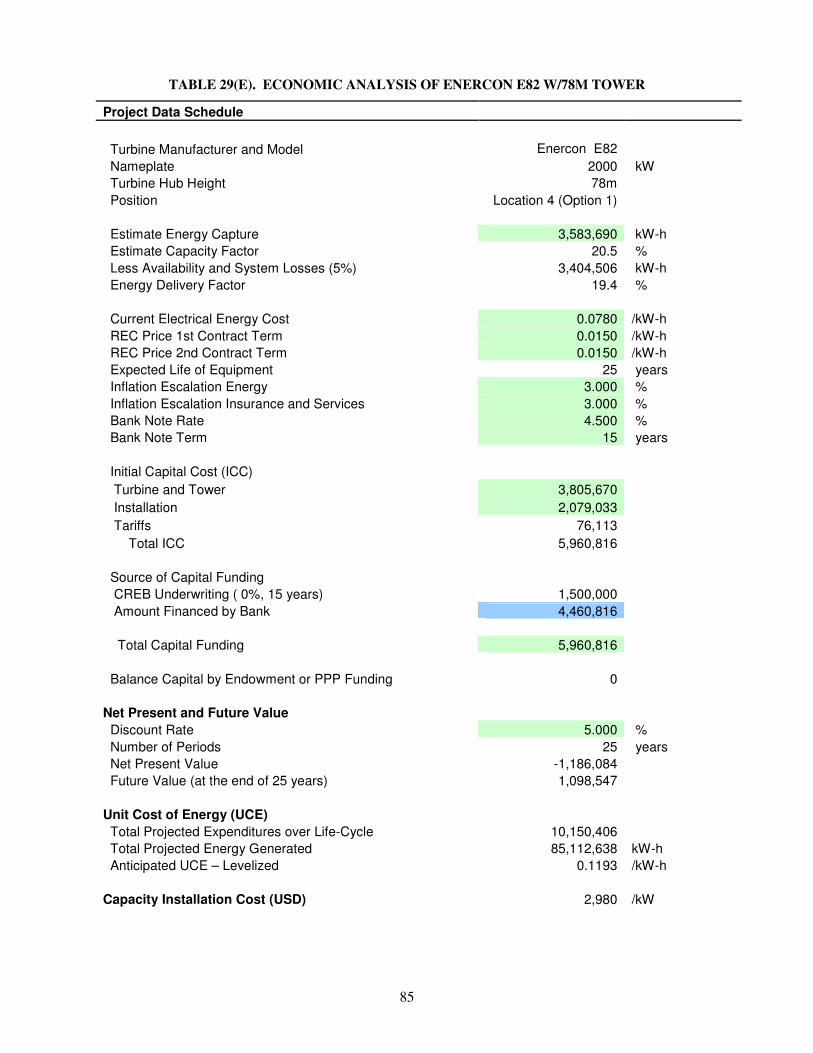
85
TABLE 29(E). ECONOMIC ANALYSIS OF ENERCON E82 W/78M TOWER
Project Data Schedule Turbine Manufacturer and Model Enercon E82 Nameplate 2000 kW Turbine Hub Height 78m Position Location 4 (Option 1) Estimate Energy Capture 3,583,690 kW-h Estimate Capacity Factor 20.5 % Less Availability and System Losses (5%) 3,404,506 kW-h Energy Delivery Factor 19.4 % Current Electrical Energy Cost 0.0780 /kW-h REC Price 1st Contract Term 0.0150 /kW-h REC Price 2nd Contract Term 0.0150 /kW-h Expected Life of Equipment 25 years Inflation Escalation Energy 3.000 % Inflation Escalation Insurance and Services 3.000 % Bank Note Rate 4.500 % Bank Note Term 15 years Initial Capital Cost (ICC) Turbine and Tower 3,805,670 Installation 2,079,033 Tariffs 76,113 Total ICC 5,960,816 Source of Capital Funding CREB Underwriting ( 0%, 15 years) 1,500,000 Amount Financed by Bank 4,460,816 Total Capital Funding 5,960,816 Balance Capital by Endowment or PPP Funding 0 Net Present and Future Value Discount Rate 5.000 % Number of Periods 25 years Net Present Value -1,186,084 Future Value (at the end of 25 years) 1,098,547 Unit Cost of Energy (UCE) Total Projected Expenditures over Life-Cycle 10,150,406 Total Projected Energy Generated 85,112,638 kW-h Anticipated UCE – Levelized 0.1193 /kW-h Capacity Installation Cost (USD) 2,980 /kW

86
TABLE 29(F). ECONOMIC ANALYSIS OF ENERCON E82 W/78M TOWER
Project Data Schedule Turbine Manufacturer and Model Enercon E82 Nameplate 2000 kW Turbine Hub Height 78m Position Location 4 (Option 2) Estimate Energy Capture 3,583,690 kW-h Estimate Capacity Factor 20.5 % Less Availability and System Losses (5%) 3,404,506 kW-h Energy Delivery Factor 19.4 % Current Electrical Energy Cost 0.0780 /kW-h REC Price 1st Contract Term 0.0150 /kW-h REC Price 2nd Contract Term 0.0150 /kW-h Expected Life of Equipment 25 years Inflation Escalation Energy 3.000 % Inflation Escalation Insurance and Services 3.000 % Bank Note Rate 4.500 % Bank Note Term 15 years Initial Capital Cost (ICC) Turbine and Tower 3,805,670 Installation 2,055,889 Tariffs 76,113 Total ICC 5,937,672 Source of Capital Funding CREB Underwriting ( 0%, 15 years) 1,500,000 Amount Financed by Bank 4,437,672 Total Capital Funding 5,937,672 Balance Capital by Endowment or PPP Funding 0 Net Present and Future Value Discount Rate 5.000 % Number of Periods 25 years Net Present Value Future Value (at the end of 25 years) 2,355,759 Unit Cost of Energy (UCE) Total Projected Expenditures over Life-Cycle 10,118,081 Total Projected Energy Generated 85,112,638 kW-h Anticipated UCE – Levelized 0.1189 /kW-h Capacity Installation Cost (USD) 2,969 /kW
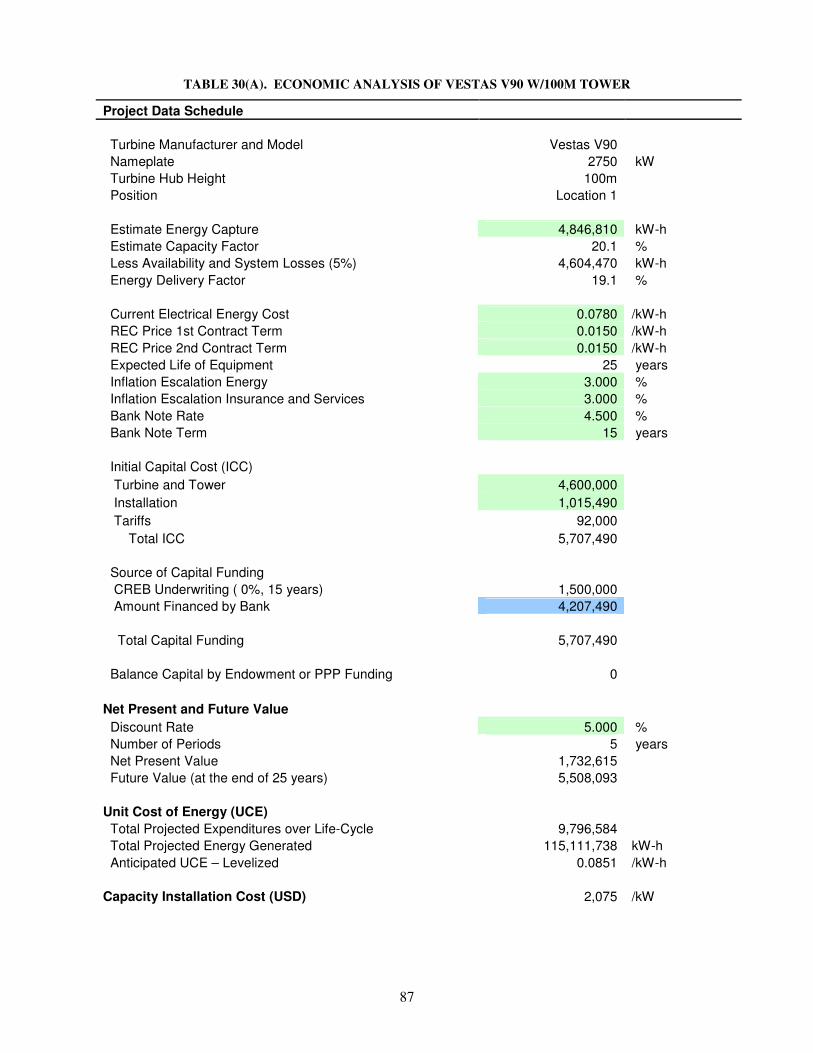
87
TABLE 30(A). ECONOMIC ANALYSIS OF VESTAS V90 W/100M TOWER
Project Data Schedule Turbine Manufacturer and Model Vestas V90 Nameplate 2750 kW Turbine Hub Height 100m Position Location 1 Estimate Energy Capture 4,846,810 kW-h Estimate Capacity Factor 20.1 % Less Availability and System Losses (5%) 4,604,470 kW-h Energy Delivery Factor 19.1 % Current Electrical Energy Cost 0.0780 /kW-h REC Price 1st Contract Term 0.0150 /kW-h REC Price 2nd Contract Term 0.0150 /kW-h Expected Life of Equipment 25 years Inflation Escalation Energy 3.000 % Inflation Escalation Insurance and Services 3.000 % Bank Note Rate 4.500 % Bank Note Term 15 years Initial Capital Cost (ICC) Turbine and Tower 4,600,000 Installation 1,015,490 Tariffs 92,000 Total ICC 5,707,490 Source of Capital Funding CREB Underwriting ( 0%, 15 years) 1,500,000 Amount Financed by Bank 4,207,490 Total Capital Funding 5,707,490 Balance Capital by Endowment or PPP Funding 0 Net Present and Future Value Discount Rate 5.000 % Number of Periods 5 years Net Present Value 1,732,615 Future Value (at the end of 25 years) 5,508,093 Unit Cost of Energy (UCE) Total Projected Expenditures over Life-Cycle 9,796,584 Total Projected Energy Generated 115,111,738 kW-h Anticipated UCE – Levelized 0.0851 /kW-h Capacity Installation Cost (USD) 2,075 /kW

88
TABLE 30(B). ECONOMIC ANALYSIS OF VESTAS V90 W/100M TOWER
Project Data Schedule
Turbine Manufacturer and Model Vestas V90 Nameplate 2750 kW Turbine Hub Height 100m Position Location 2 Estimate Energy Capture 4,846,810 kW-h Estimate Capacity Factor 20.1 % Less Availability and System Losses (5%) 4,604,470 kW-h Energy Delivery Factor 19.1 % Current Electrical Energy Cost 0.0780 /kW-h REC Price 1st Contract Term 0.0150 /kW-h REC Price 2nd Contract Term 0.0150 /kW-h Expected Life of Equipment 25 years Inflation Escalation Energy 3.000 % Inflation Escalation Insurance and Services 3.000 % Bank Note Rate 4.500 % Bank Note Term 15 years Initial Capital Cost (ICC) Turbine and Tower 4,600,000 Installation 993,776 Tariffs 92,000 Total ICC 5,685,776 Source of Capital Funding CREB Underwriting ( 0%, 15 years) 1,500,000 Amount Financed by Bank 4,185,776 Total Capital Funding 5,685,776 Balance Capital by Endowment or PPP Funding 0 Net Present and Future Value Discount Rate 5.000 % Number of Periods 25 years Net Present Value 2,681,305 Future Value (at the end of 25 years) 5,514,159 Unit Cost of Energy (UCE) Total Projected Expenditures over Life-Cycle 9,766,256 Total Projected Energy Generated 115,111,738 kW-h Anticipated UCE – Levelized 0.0848 /kW-h Capacity Installation Cost (USD) 2,068 /kW

89
TABLE 30(C). ECONOMIC ANALYSIS OF VESTAS V90 W/100M TOWER
Project Data Schedule Turbine Manufacturer and Model Vestas V90 Nameplate 2750 kW Turbine Hub Height 100m Position Location 3 (Option 1) Estimate Energy Capture 4,846,810 kW-h Estimate Capacity Factor 20.1 % Less Availability and System Losses (5%) 4,604,470 kW-h Energy Delivery Factor 19.1 % Current Electrical Energy Cost 0.0780 /kW-h REC Price 1st Contract Term 0.0150 /kW-h REC Price 2nd Contract Term 0.0150 /kW-h Expected Life of Equipment 25 years Inflation Escalation Energy 3.000 % Inflation Escalation Insurance and Services 3.000 % Bank Note Rate 4.500 % Bank Note Term 15 years Initial Capital Cost (ICC) Turbine and Tower 4,600,000 Installation 1,933,867 Tariffs 92,000 Total ICC 6,625,867 Source of Capital Funding CREB Underwriting ( 0%, 15 years) 1,500,000 Amount Financed by Bank 5,125,867 Total Capital Funding 6,625,867 Balance Capital by Endowment or PPP Funding 0 Net Present and Future Value Discount Rate 5.000 % Number of Periods 25 years Net Present Value 3,941,941 Future Value (at the end of 25 years) 5,508,093 Unit Cost of Energy (UCE) Total Projected Expenditures over Life-Cycle 11,079,288 Total Projected Energy Generated 115,111,738 kW-h Anticipated UCE – Levelized 0.0962 /kW-h Capacity Installation Cost (USD) 2,409 /kW

90
TABLE 30(D). ECONOMIC ANALYSIS OF VESTAS V90 W/100M TOWER
Project Data Schedule
Turbine Manufacturer and Model Vestas V90 Nameplate 2750 kW Turbine Hub Height 100m Position Location 3 (Option 2) Estimate Energy Capture 4,846,810 kW-h Estimate Capacity Factor 20.1 % Less Availability and System Losses (5%) 4,604,470 kW-h Energy Delivery Factor 19.1 % Current Electrical Energy Cost 0.0780 /kW-h REC Price 1st Contract Term 0.0150 /kW-h REC Price 2nd Contract Term 0.0150 /kW-h Expected Life of Equipment 25 years Inflation Escalation Energy 3.000 % Inflation Escalation Insurance and Services 3.000 % Bank Note Rate 4.500 % Bank Note Term 15 years Initial Capital Cost (ICC) Turbine and Tower 4,600,000 Installation 1,906,314 Tariffs 92,000 Total ICC 6,598,314 Source of Capital Funding CREB Underwriting ( 0%, 15 years) 1,500,000 Amount Financed by Bank 5,098,314 Total Capital Funding 6,598,314 Balance Capital by Endowment or PPP Funding 0 Net Present and Future Value Discount Rate 5.000 % Number of Periods 25 years Net Present Value 1,617,425 Future Value (at the end of 25 years) 5,868,201 Unit Cost of Energy (UCE) Total Projected Expenditures over Life-Cycle 11,040,804 Total Projected Energy Generated 115,111,738 kW-h Anticipated UCE – Levelized 0.0959 /kW-h Capacity Installation Cost (USD) 2,399 /kW
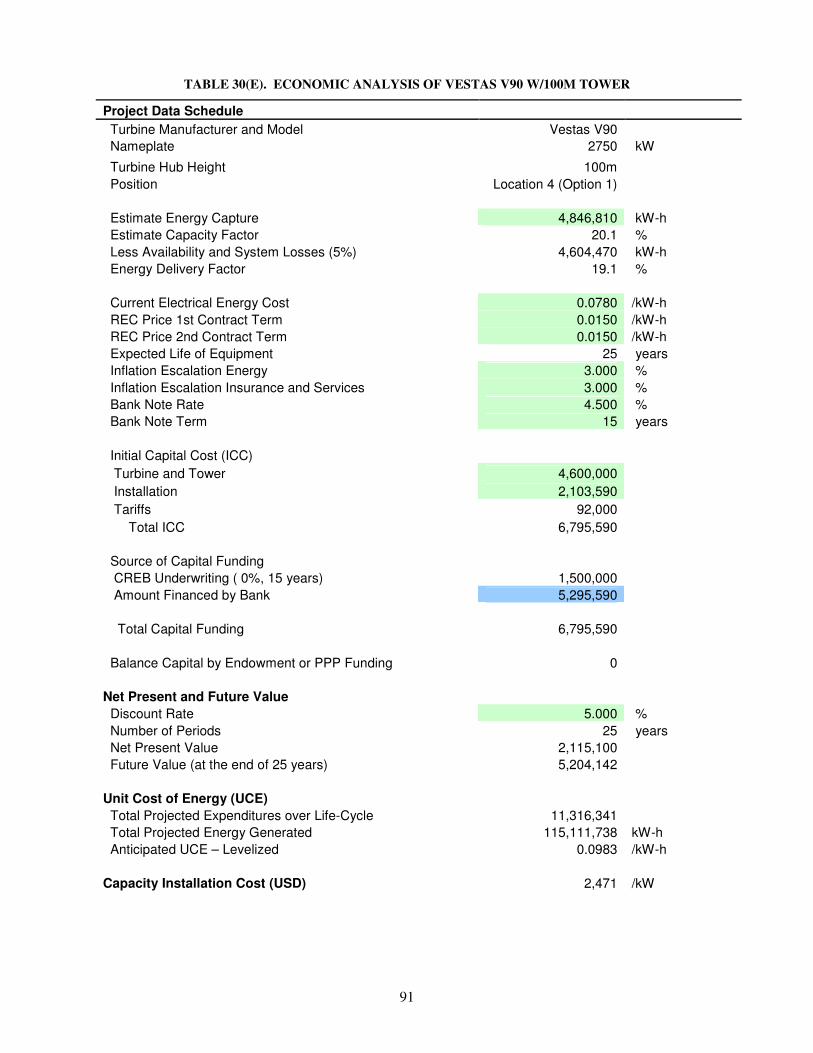
91
TABLE 30(E). ECONOMIC ANALYSIS OF VESTAS V90 W/100M TOWER
Project Data Schedule Turbine Manufacturer and Model Vestas V90 Nameplate 2750 kW
Turbine Hub Height 100m Position Location 4 (Option 1) Estimate Energy Capture 4,846,810 kW-h Estimate Capacity Factor 20.1 % Less Availability and System Losses (5%) 4,604,470 kW-h Energy Delivery Factor 19.1 % Current Electrical Energy Cost 0.0780 /kW-h REC Price 1st Contract Term 0.0150 /kW-h REC Price 2nd Contract Term 0.0150 /kW-h Expected Life of Equipment 25 years Inflation Escalation Energy 3.000 % Inflation Escalation Insurance and Services 3.000 % Bank Note Rate 4.500 % Bank Note Term 15 years Initial Capital Cost (ICC) Turbine and Tower 4,600,000 Installation 2,103,590 Tariffs 92,000 Total ICC 6,795,590 Source of Capital Funding CREB Underwriting ( 0%, 15 years) 1,500,000 Amount Financed by Bank 5,295,590 Total Capital Funding 6,795,590 Balance Capital by Endowment or PPP Funding 0 Net Present and Future Value Discount Rate 5.000 % Number of Periods 25 years Net Present Value 2,115,100 Future Value (at the end of 25 years) 5,204,142 Unit Cost of Energy (UCE) Total Projected Expenditures over Life-Cycle 11,316,341 Total Projected Energy Generated 115,111,738 kW-h Anticipated UCE – Levelized 0.0983 /kW-h Capacity Installation Cost (USD) 2,471 /kW

92
TABLE 30(F). ECONOMIC ANALYSIS OF VESTAS V90 W/100M TOWER
Project Data Schedule Turbine Manufacturer and Model Vestas V90 Nameplate 2750 kW Turbine Hub Height 100m Position Location 4 (Option 2) Estimate Energy Capture 4,846,810 kW-h Estimate Capacity Factor 20.1 % Less Availability and System Losses (5%) 4,604,470 kW-h Energy Delivery Factor 19.1 % Current Electrical Energy Cost 0.0780 /kW-h REC Price 1st Contract Term 0.0150 /kW-h REC Price 2nd Contract Term 0.0150 /kW-h Expected Life of Equipment 25 years Inflation Escalation Energy 3.000 % Inflation Escalation Insurance and Services 3.000 % Bank Note Rate 4.500 % Bank Note Term 15 years Initial Capital Cost (ICC) Turbine and Tower 4,600,000 Installation 2,080,446 Tariffs 92,000 Total ICC 6,772,446 Source of Capital Funding CREB Underwriting ( 0%, 15 years) 1,500,000 Amount Financed by Bank 5,272,446 Total Capital Funding 6,772,446 Balance Capital by Endowment or PPP Funding 0 Net Present and Future Value Discount Rate 5.000 % Number of Periods 25 years Net Present Value -133,465 Future Value (at the end of 25 years) 5,210,607 Unit Cost of Energy (UCE) Total Projected Expenditures over Life-Cycle 11,284,016 Total Projected Energy Generated 115,111,738 kW-h Anticipated UCE – Levelized 0.0980 /kW-h Capacity Installation Cost (USD) 2,463 /kW
93
12.0 Case Studies of Similar Projects
There are several renewable energy wind projects that have been constructed by educational
institutions and municipal entities across the United States. The first educational proponents of
wind energy looked at the technology as an effective hedge to rising electric utility rates. School
districts in the state of Iowa were amongst the first to develop wind power. Forest City Schools,
led by superintendent Mr. Dwight Pierson, and Spirit Lake Schools, lead by superintendent Dr.
Tim Graves, are the most noteworthy. These gentlemen have both given presentations with AESI
in 2004 for Michigan educators interested in wind energy development. Institutions for higher
learning, like Carleton College and the University of Pennsylvania have also taken lead
embracing renewable energy projects in their respective communities.
The following wind turbine generation projects will be reviewed to the extent of available
information:
• Spirit Lake Schools
• Forest City Schools
• Carleton College
• University of Pennsylvania
Spirit Lake Community Schools, Iowa
Spirit Lake began their investigation into the use of wind power in September of 1991 in
partnership with the Iowa Department of Natural Resources. After verifying that there was a
suitable wind resource for such a project, the district’s administrators submitted a grant
application to the U.S. Department of Energy for three wind turbines for energy offset at the
district’s high school, middle school and elementary school. The grant requests for the high
school and middle school rejected by the DoE because the high school would require an
electrical phase change-over and the middle school was a “new construction” project that was
not fundable by the DoE under the grant. Spirit Lake did receive $119,000 in grant funding from
the DoE to fund a wind turbine at the elementary school.

94
Bids were submitted in the Spring of 1993 for the construction of a 250 kW wind turbine. The
project was constructed for $239,500 ($958/kW) and began producing electricity July 22, 1993.
To date the wind turbine has produced 3,911,676 kWh of energy and has a poor energy capture
percentile. Nevertheless, due to the good financing terms and use of grant moneys available from
the Iowa DNR, the project has saved the school district approximately $26,000/year in electrical
energy costs according to the state authorities, and has long since paid for itself.
The school’s administrators were placed with the performance of the wind turbine and the
financial and environmental benefits; they decided to install a second wind turbine having
750kW nameplate capacity. The NEG Micron 750 was installed October 29, 2001 and funded
with a $250,000 no-interest loan from the Iowa Department of Energy and a $580,000 loan from
the Iowa DNR at 5.1%. To date, the second turbine has produced in excess of 9,524,940 kWh of
electrical generation. It is our understanding that both units have paid back the initial capital
costs, respectively.
Forest City Schools, Iowa
Forest City Schools began generating electricity from their Nordex N43 600kw wind turbine in
the winter of 1999. The project began as a science investigation by a high school student and his
science instructor. The installation of the wind turbine was plagued by difficulties with the
electrical and construction contractors’ limited knowledge of wind turbines, installation
requirements for a large scale project and poor timing with regard to seasonal (winter) weather
conditions.
Dwight Pierson, then superintendent for Forest City Schools, indicated at our conference that the
district was pleased with the turbine, considering that it was generating less than 65% of the
predicted energy capture that was made by the project’s engineering consultants. It should be
noted that the anemometer was placed at the top of a water tower and that acceleration caused by
the water tower surface was not properly factoring into the capture estimates for the existing test
conditions.
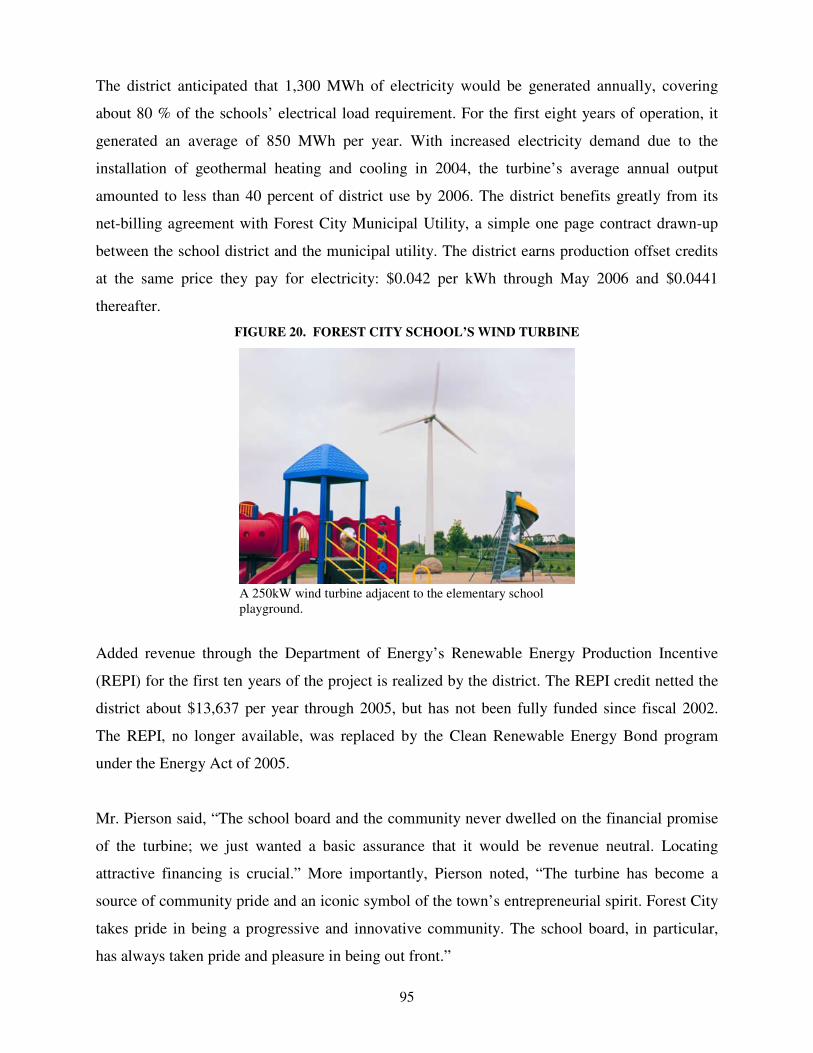
95
The district anticipated that 1,300 MWh of electricity would be generated annually, covering
about 80 % of the schools’ electrical load requirement. For the first eight years of operation, it
generated an average of 850 MWh per year. With increased electricity demand due to the
installation of geothermal heating and cooling in 2004, the turbine’s average annual output
amounted to less than 40 percent of district use by 2006. The district benefits greatly from its
net-billing agreement with Forest City Municipal Utility, a simple one page contract drawn-up
between the school district and the municipal utility. The district earns production offset credits
at the same price they pay for electricity: $0.042 per kWh through May 2006 and $0.0441
thereafter.
FIGURE 20. FOREST CITY SCHOOL’S WIND TURBINE
A 250kW wind turbine adjacent to the elementary school playground.
Added revenue through the Department of Energy’s Renewable Energy Production Incentive
(REPI) for the first ten years of the project is realized by the district. The REPI credit netted the
district about $13,637 per year through 2005, but has not been fully funded since fiscal 2002.
The REPI, no longer available, was replaced by the Clean Renewable Energy Bond program
under the Energy Act of 2005.
Mr. Pierson said, “The school board and the community never dwelled on the financial promise
of the turbine; we just wanted a basic assurance that it would be revenue neutral. Locating
attractive financing is crucial.” More importantly, Pierson noted, “The turbine has become a
source of community pride and an iconic symbol of the town’s entrepreneurial spirit. Forest City
takes pride in being a progressive and innovative community. The school board, in particular,
has always taken pride and pleasure in being out front.”
96
Carleton College
The turbine is located approximately one mile from Carleton’s Northfield, Minnesota, campus.
The entire electrical output of the wind turbine generator, approximately 5,200,000 kWh/yr is
sold to the local utility at $0.033/kW-h. The Vestas wind turbine has a nameplate of 1.65 MW
and based on the energy capture figures provided above, the wind turbine has a 35% capacity
factor. An additional $0.015/kW-h is received by Carleton through a special state incentive
program. The college is using the wind turbine to offset roughly 40% of their electrical energy
usage from the local utility. The college is charged $0.053/kW-h by the utility, hence, the
difference in price between the unit cost of energy (UCE) generated by the wind turbine and
what the college would normally have paid to the utility results in a cash offset in the benefit of
the college. The power purchase agreement with the local utility was written for 20 years. A
non-competitive construction contract was issued for the installation of the unit. The college was
required to sign a utility interconnection agreement.
Initial capital cost, reported by Carleton College, for the project was $1.8 million. Insurance was
approximately $18,000 annually; the administrators noted that there were variations with the
manufacturer’s warranty period. Operation and maintenance costs were estimated at $15,000
annually.
University of Pennsylvania
In April of 2003, the University of Pennsylvania entered into a ten-year agreement to purchase
10 percent of its energy needs from wind turbine power generation, doubling its nation-leading
wind-energy purchase. The purchase of 40 million kilowatt hours annually from Community
Energy Inc. of Wayne, Pa. represented the largest single retail purchase of wind-generated
energy in the nation as of the date the agreement was entered into. As a result, the 10-year
commitment will also lead to the construction of a new wind farm in Somerset, Pennsylvania,
hosting ten 1.5 MW turbines.
In a press interview university president Judith Rodin said, “We at Penn are pleased to be a
national leader in the choice for clean energy and the development of the wind-generated power
industry in Pennsylvania. Through this example of environmental stewardship, we can continue
to raise the awareness of our students and the community about alternative fuel options.”

97
13.0 Recommendations
AESI offers the following recommendations to administration of Facilities Management at Oakland University. 1) Micro-siting/Wind Map Commission the modeling of a high resolution wind map for the main campus of
Oakland University for elevations of 80 m and 100 m, using historical databases and
with wind data provided from the on-site meteorological tower as a validation point.
Wind mapping would be handled by Windlogic, Inc. The economic analysis contained in
the previous section of this study was a conservative estimate of energy capture. It is
probable that the energy capture and capacity factors for the selected wind turbine will be
considerably higher than indicated, using the logarithmic and power law methods for
estimating wind speed at higher elevations and incorporated by this study.
The wind map would also provide added insight to areas that may have better wind
resources and allow for additional discussion if the relocation of a turbine would provide
increased capacity factors.
We estimate that this will cost approximately $15,000 for one micro-siting evaluation and
up to $23,000 for all locations to be micro-sited. The process will take approximately 6 to
10 weeks to complete, depending on stated requirements.
2) Validation of Financial Model.
After receiving the micro-siting report and energy capture figures, the pro forma
schedules can be re-evaluated to develop a high-end “optimistic” economic model for the
project. The actual economic performance will be between our economic projections
“pessimistic” and the micro-siting projections. AESI will work with the head of finance
for Oakland together to reach mutual agreement on the final projections for project
economic performance.
98
The Energy Manager and Facility Management personnel will then be able to make a
reasonable investment decision with regard to whether or not the anticipated project
performance and risk exposure is suitable for the university’s governing board to accept.
3) The finance department of the university may wish to consider writing call contracts on
the Eurodollar and or the Canadian dollar to lock-in equipment price points prior to
signing an equipment purchase agreement with a wind turbine manufacturer.
4) Renewable Energy Certificates (RECs) could be sold with ten year contract terms directly
with entities interested in acquiring certificates. The buyers of certificates include tag
aggregators, municipal entities, and corporations seeking to achieve a carbon neutral
footprint.
Renewable Energy Certificate (RECs) aggregators include the following entities:
• Bonneville Power
• Sterling Planet
• Community Energy
• Native Energy
Other markets for the sale of certificates are:
• PJM Compliance Market
• Chicago Climate Exchange
• NYSE (announced and under development)
5) Oakland should consider the forward sale of RECs and tax benefits on a net present cash
value to offset initial capital costs.
6) Oakland should consider the sale of sponsorship rights for the wind project to further
minimize initial capital costs.
7) Making application for federal grants and loans under the Energy Act of 2007 to further
decrease cost of financing and lowering the unit cost of energy.
99
14.0 References Electrical and System:
Patel, Mukund R., Ph.D., P.E. 1999. Wind and Solar Power Systems.
Chapter 4 pp. 35-57 Wind Speed and Energy Distributions
Chapter 15 pp. 273-282 Plant Economy
Putman, A., and Philips, M. 2006. The Business Case for Renewable Energy. A Guide for
Colleges and Universities.
Chapter 4 pp. 45-70 Financing a Renewable Energy Project
Harrison, R., Hau, E., and Herman, S. 2000. Large Wind Turbines Design and Economics.
Chapter 2 pp. 40-45 Mechanical Drive Train and Nacelle Support Structure
Chapter 2 pp. 76-85 Speed Control and Power Limitation Strategies
Chapter 6 pp. 155-166 Economics of Large Wind Turbine Systems
Fink, D., and Beaty, H.W., 1978 Standard Handbook for Electrical Engineers
Section 16 pp. pp. 16.79-16.89 Relaying and Protection
Avian and Environmental:
Howell, J. A., and J. Noon. 1992. Examination of avian use and mortality at a U.S. Windpower
wind energy development site, Solano County, California. Final Report to Solano
County Department of Environmental Management, Fairfield, CA. 41 pp.
Johnson G. D., W. P. Erickson, M. D. Strickland, M. F. Shepherd and D. A. Shepherd. 2000.
Avian Monitoring Studies At The Buffalo Ridge, Minnesota Windresource Area: Results
Of A 4-Year Study. Technical report prepared for Northern States Power Company, 414
Nicollet Mall, 8th Floor Minneapolis, Minnesota 55401.
100
Kunz, T., E. Arnett, B. Cooper, W. Erickson, R. Larkin, T. Mabee, M. Morrison, M. D.
Strickland, and J. Szewczak. 2007. Assessing impacts of wind-energy development
on nocturnally active birds and bats: a guidance document. Journal of Wildlife
Management 71(8): 2449-2486.
Leddy, K.L., K.F. Higgins, and D.E. Naugle. 1999. Effects of wind turbines on upland nesting
birds in Conservation Reserve Program grasslands. Wilson Bull. 111:100- 104.
Strickland, D. 2004. Overview of non-collision related impacts from wind projects.
Pages 34-38 Proceedings of the Wind Energy and Birds/Bats Workshop:
understanding and resolving bird and bat impacts. Washington, D.C. May 18-19, 2004.
Prepared by RESOLVE, Inc. Washington, D.C., Susan Savitt Schwartz,
ed. September 2004.
Winkelman, J. 1992. The impact of the SEP wind park near Oosterbierum (Fr.), the
Netherlands, on birds, 2: nocturnal collision risks (Dutch, English Summary).
RIN-report 92/3, DLO-Institute for Forestry and Natural Research, Arnhem.