Embed Size (px)
Citation preview

?
NASA-CR-197155
NASw-4435
//v -S_S _,,Cfe_
_2s/s£Io4 _,,"_
!
No'mz D,_,m
NASA/USRA 'UNIVERSITYADVANCED DESIGN PROGRAM
1993-1994
PROJECT CENTER MENTOR:NASA-AMES DRYDEN FLIGHT RESEARCH FACILITY
oa us @wax®d
A HIGH SPEED, LOW-COST GENERALAVIATION AIRCRAFT FOR "AEROWORLD"
April 1994
Department of Aerospace and Mechanical EngineeringUniversity of Notre Dame
Notre Dame, IN 46556
(NASA-CR-197155) ICARUS REWAXED: A
HIGH SPEED, LOW-COST GENERAL
AVIATION AIRCRAFT FOR AEROWORLD
(Notre Dame Univ.) 159 p
N95-12609
Unclas
G3/05 0026134
https://ntrs.nasa.gov/search.jsp?R=19950006196 2018-06-30T17:44:50+00:00Z

presents
Team Leader: Bryan FarrensChief Engineer: Macy Hueckel
Director of Manufacturing: Dan FulkersonPropulsions Analyst: Matt Barents
Control Systems Analyst: Brian CapozziStructures Analyst: Keri Ramsey

Section 1:
Section 2:
Section 3:
Section 4:
Section 5:
Section 6:
Section 7:
TABLE OF CONTENTS
Executive Summary
Mission Definition
2.1 Summary of DR&O
2.2 Requirements
2.3 Objectives
Concept Selection3.1 Introduction
3.2 High Wing Design
3.3 Low Wing Design
3.4 Canard Design
3.5 Pusher Prop Design3.6 Icarus Rewaxed
Aerodynamic Design4.1 Introduction
4.2 Airfoil Selection
4.3 Wing Sizing
4.4 Complete Configuration Aerodynamics4.4.1 Lift Considerations
4.4.2 Drag Considerations
4.4.3 Efficiency and Cost Considerations
Propulsion
5.1: Requirements & Objectives
5.2: Propeller Selection5.3: Motor Selection
5.4: Battery Choice5.5: Motor Control & Installation
5.6: Propulsion System Summary
Weight & Balance
6.1 Weight Estimate
6.2 Center of Gravity
Stability & Control Systems
7.1 Longitudinal Stability
7.2 Longitudinal Control - Elevator Sizing7.2.1 Takeoff Considerations
7.2.2 Trim Considerations at Landing
7.3 Lateral Stability
7.4 Lateral Control - Rudder Sizing
7.5 Roll Stability
PAGE
1-1
2-1
2-2
2-2
2-4
3-1
3-1
3-1
3-1
3-2
3-3
3-4
4-1
4-1
4-1
4-5
4-6
4-6
4-8
4-11
5-1
5-1
5-2
5-6
5-6
5-8
5-9
6-16-1
6-4
7-1
7-1
7-6
7-6
7-8
7-10
7-11
7-12

7.6 Roll Control7.6.1 General - Control Selection7.6.2 Sizing and Placementof Ailerons7.7 Control Mechanisms
Section 8" Performance8.1 Requirements and Objectives8.2 Cruise Velocity8.3 Take-off Estimates8.4 Rateof Climb8.5 Level Turns8.6 Rangeand Endurance8.7 Rangevs. Payload
Section 9' Structural Design9.1 Materials9.2 Load Conditions9.3 Flight & Ground Loads9.4 Fuselage9.5 Wing9.6 Tail Sections9.7 Landing Gear
Section 10: Economic Analysis
10.1 Economic Goals
10.2 Cost Estimates
10.3 Direct Operating Costs
Appendices
Appendix A: Critical Data Summary
Appendix B: Data Base
Appendix C: Structure Theory
C.1 Wing Spar Deflection&
Stress Analysis
C.2 V-n Diagram Curves
Appendix D: Deliverables - Figures & Tables
Appendix E" Propulsion
Appendix F: Stability and Control
Appendix G: Manufacturing Plan
A-1
B-1
C-1
C-1
C-3
D-1
E-1
F-1
G-1
7-12
7-12
7-13
7-17
8-1
8-1
8-3
8-3
8-4
8-6
8-6
8-8
9-1
9-i
9-3
9-5
9-8
9-11
9-17
9-19
10-1
10-1
10-1
10-3

LIST OF FIGURES
Section 1
Figure 1.1:
Figure 1.2:
Figure 1.3:
External View - isometric
Internal View - two-view
External View - three-view
1-4
1-6
1-7
Section 2
Figure 2.1: Layout of Aeroworld 2-1
Section 3
Figure 3.1:
Figure 3.2:
Figure 3.3:
Figure 3.4:
High Wing Individual Concept
Low Wing Individual Concept
Canard Individual Concept
Pusher Propeller Individual Concept
3-6
3-7
3-8
3-9
Section 4
Figure
Figure
Figure
Figure
Figure
Figure
Figure
Figure
4.1:DF101 Profile
4.2: Flat Plate Drag Curves as Compared to
SD8020 Drag Curves
4.3: Spanwise Wing Loading
4.4: Aircraft Lift Curve Slope
4.5: Complete Aircraft Configuration Drag
4.6: Component Drag Breakdown
4.7: Comparison of High and Low Speed
Cruise Efficiency
4.8: Effect of Increased Cruise Speed on Cost
per Flight
'4-3
4-5
4-7
4-8
4-9
4-11
4-12
4-13
Section 5
Figure 5.1:
Figure 5.2:
Figure 5.3:
Figure 5.4:
Most Efficient Two-Bladed Propeller
Most Efficient Three-Bladed Propeller2 Bladed Thrust Coefficient
3 Bladed Thrust Coefficeint
5-4
5-4
5-5
5-5
Section 6
Figure 6.1:
Figure 6.2:
Weight Fractions
Weight & Balance Diagram
6-4
6-6
Section 7
Figure 7.1:
Figure 7.2:
Figure 7.3:
Figure 7.3:
Figure 7.4:
Effect of Aspect Ratio (Longitudinal Stability)
Design Pitching Moment Curve
Sensitivity of Longitudinal Stability to CG Pos
Velocity of Icarus During Ground RollTrim Condition with Elevator Deflection
7-3
7-4
7-5
7-8
7-10

Figure 7.5: Variation of Roll Rate- Aileron Configuration 7-14Figure 7.6: Constraints on BankAngle and Angle of Attack 7-15Figure 7.7: Elevator/Rudder Control Mechanism 7-17Figure 7.8: Rudder/Tail Wheel Linkage and Control 7-18Figure 7.9: Aileron Control Mechanism 7-19
Section 8
Figure 8.1: Power Requred & Available 8-5
Figure 8.2: Speed at Max Rate of Climb 8-5
Figure 8.3: Max Range vs. Range at Cruise Speed 8-7
Figure 8.4: Max Endurance vs. Endurance at Cruise Speed 8-8
Figure 8.5: Effects of Payload on Range 8-9
Section 9
Figure 9.1:
Figure 9.2:
Figure 9.3:
Figure 9.4:
Figure 9.5:
Figure 9.6:
Figure 9.7:
Figure 9.8:
Figure 9.9:
Figure 9.10:
Figure 9.11:
Figure 9.12:
Figure 9.13:
Figure 9.14:
Figure 9.15:
Figure 9.16:
Figure 9.17:
V-n Diagram 9-4
Weight Distribution Nose to Tail 9-5
Shear &Bending Moment Diagrams(Ground) 9-6
Shear &Bending Moment Diagrams(Flight) 9-7
Airplane Fuselage Sections 9-8
Wing Spar Design 9-12
Wing Tip Deflection 9-13
Spanwise Lift Distribution on Wing 9-14
Comparison of Steel Shaft & Wooden Spar 9-15
Tail Section Weight Analysis 9-17Stress in Horizontal tail 9-18
Main Gear Geometry 9-20
Analysis of Strut Diameter and Theta 9-21
Turnover Geometry, 9-22
Front View of Gear Geometry 9-23
Gear Attachment to Fuselage 9-23
Wing Attachment to Fuselage 9-24
Section 10
Figure 10.1:
Figure 10.2:
Cost Breakdown
Cost Per Flight, Fuel Cost Per Flight
vs. Cruise Speed
10-3
10-4

LIST OF TABLES
Section 1
Table 1.1: Specifications and Performance Estimates
Section 2
Table 2.1: Information of Aeroworld Cities
Section 3
Table 3.1: Summary of Individual Concepts
Section 4
Table 4.1:
Table 4.2:
Airfoil Characteristics
Component Drag Contribution
Section 5
Table 5.1:
Table 5.2:
Table 5.3:
Table 5.4:
Summary of Propulsion SystemMotor Characteristics
Current Drain of Flight Phases
Propulsion System Components
Section 6
Table 6.1: Component Weight Summary
Section 7
Table 7.1:
Table 7.2:Summary of Longitudinal Stability & Control
Summary of Lateral/Roll Stability & Control
Section 8
Table 8.1: Performance Characteristics
Section 9
Table 9.1: Material Properties
Table 9.2: Fuselage Structural Safety Margins
Table 9.3: Fuselage Component Design
Section 10
Table 10.1: Cost Estimation
Table 10.2: Cost Per Flight Summary
2-1
3-5
4-4
4-10
5-1
5-6
5-7
5-9
6-3
7-10
7-16
8-2
9-2
9-10
9-11
10-2
10-5
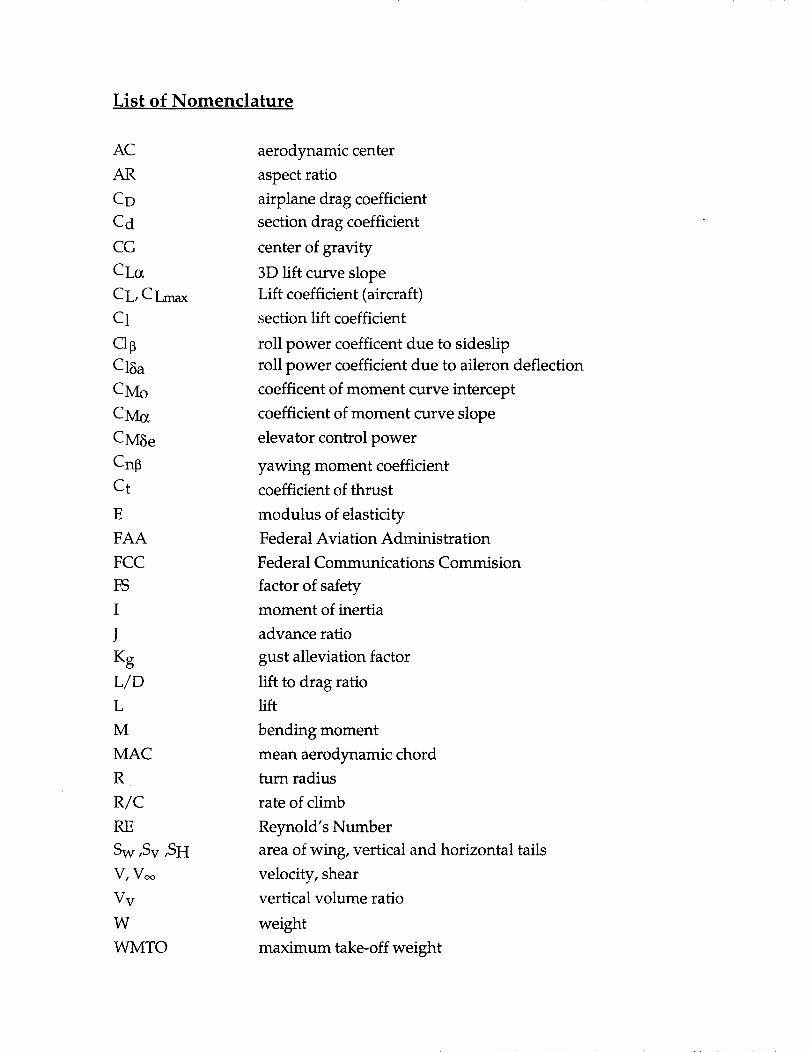
List of Nomenclature
AC
AR
CD
Cd
CG
CL_
CL, CLmax
C1
Clp
C15a
CMo
CM0_
CM3e
Cnp
Ct
E
FAA
FCC
FS
I
J
Kg
L/D
L
M
MAC
R
R/C
RE
Sw ,Sv ,SH
V,V_
Vv
W
WMTO
aerodynamic center
aspect ratio
airplane drag coefficient
section drag coefficient
center of gravity
3D lift curve slope
Lift coefficient (aircraft)
section lift coefficient
roll power coefficent due to sideslip
roll power coefficient due to aileron deflection
coefficent of moment curve intercept
coefficient of moment curve slope
elevator control power
yawing moment coefficient
coefficient of thrust
modulus of elasticity
Federal Aviation Administration
Federal Communications Commision
factor of safety
moment of inertia
advance ratio
gust alleviation factor
lift to drag ratio
lift
bending moment
mean aerodynamic chord
turn radius
rate of climb
Reynold's Number
area of wing, vertical and horizontal tails
velocity, shear
vertical volume ratio
weight
maximum take-off weight

b
C
e
iw,t
g
lt,v
mo
m
n
P
q
t/c
span
chord
Oswald efficiency
incidence angle of wing/tail
gravitational constant
moment arm from cg to 1/4 chord of tail
section lift curve slope
lift curve slope corrected for finite wing
load factor
roll rate
dynamic pressure
airfoil thickness ratio
F
¢
8
8a
5e
5r
¢
n
@
CY
P
dihedral angle
bank angle
angle of attack
tip deflection
aileron deflection
elevator delection
rudder deflection
angle made by CG and tire
ratio of dynamic pressures
angle made by AC and tire
stress
density
flap effectiveness factor

1.0 EXECUTIVE SUMMARY
Icarus Rewaxed is a single engine, 6 passenger, general aviation airplane.
With a cruise velocity of 72 ft/s, the Icarus can compete with the performance of
any other airplane in its class with an eye on economics and safety. It has a very
competitive initial price ($3498.00) and cost per flight ($6.36 - 8.40). Icarus can
serve all airports in Aeroworld with a takeoff distance of 25.4 feet and maximum
range of 38000 feet. It is capable of taking off from an unprepared field with a
grass depth of 3 inches.
Icarus has a low wing configuration and uses dihedral, rudder, and ailerons
for roll control. A rudder/elevator combination provides yaw and pitch control.
The "tail-dragger" landing gear incorporates a steerable tail wheel to facilitate
ground control. The propulsion system uses an Astro-15 electric motor mounted
at the nose of the aircraft. It incorporates the Zingali 10-8, 3 bladed propeller, and
thirteen Panasonic batteries (1.2V, 1400 mah) for fuel.
With the two main design objectives of high speed and takeoff distance
compatible with the Aeroworld airports, the wing design was of primary
importance. A large wing was needed to satisfy the relatively short takeoff
distance (28 feet), yet too large a wing hinders the other objective of high speed by
creating drag. The current wing design balances these two considerations. This
rectangular wing uses a DF-101 airfoil, has an area of 7.5 ft 2, and an Aspect Ratio
of 7.2. High lift devices were considered for the wing design, but the increased
manufacturing time and cost outweighed the potential benefits.
Structurally, the Icarus optimizes passenger safety while minimizing weight.
All load bearing components are designed with a factor of safety of 1.4. Weight
minimization came from finding the most extreme loading condition and
calculating the margin of safety. By designing the aircraft for this extreme
1-1

condition without over-designing, Recent Future, Inc. determined the smallest
amount of structure needed for any expected flight condition or any reasonable
extreme loading. The driving design objective of high cruise speed motivates this
search for weight savings.
This need to supply strength with minimal weight was the motivating
factor to explore materials that have not been previously used in Aeroworld. New
materials include advanced graphite composites and high strength steel. Although
the graphite outperformed all other materials in strength and stiffness for its
weight, its high cost drove it out of consideration. Steel gave virtually the same
performance as graphite at 25% of the cost. Thus, a thin-walled steel shaft is used
as the main load bearing component: the wing spar. This new material represents
a tremendous gain in structural strength over previous Aeroworld wooden
designs. It also provides a slight savings in weight. The increased strength is of
primary importance for this high speed aircraft, for potential gusts or maneuvers
at cruise can dramatically increase the load factor.
The Icarus has the ability to take off from an unprepared field with three
inch grass. This design requirement put a premium on the tail-dragger landing
gear design. This gear must provide adequate clearance for the propeller, yet still
be able to handle the stresses inherent in landing impact. The landing gear
contributes over 35% of the total drag for the aircraft. With this in mind, the
landing gear of the Icarus is designed to be structurally sound with a minimum
amount cross-sectional area. Steel piano wire struts are used for the main gear.
These struts are then attached to the steel wing spar to provide adequate strength,
yet still cushion the plane on impact.
Another facet that sets the Icarus apart from existing airplanes in the
Aeroworld market is the use of airfoil sections for the horizontal tail. Other
companies have cited weight savings as a primary motivator for a flat plate design.
1-2

However, RecentFuture's analysis shows that the structural and aerodynamic
gains from airfoil shapesfar outweigh the relatively minor (lessthan one ounce at
the extreme) weight savings. The drag benefit from the aerodynamic horizontal
tail shapehelps maximize cruise velocity, and the structural benefits with the
thicker spar allows the tail to handle the large load factors at the extremeof the
flight envelope.
The main weakness in this designstems from the competing objectivesof
minimum takeoff distance and maximum flight speed. Maximum cruise velocity
is the prime figure of merit for RecentFuture, Inc., but this parameter could not be
completely optimized becauseof the basicneed for servicing the existing airports.
Thus the large wing needed for takeoff hinders the performance in flight by
creating excessdrag. The long landing gear also lessensperformance by exposing
bluff body struts into the airflow.
Another potential weaknesscomesfrom the risk involved with trying anew
wing spar design. Without a data baseor previous examples, the wing design
representsa break from the security of experience. There are technical hurdles
inherent in using a steel shaft. The first possible problem comes from the fact that
this shaft is tapered 1. While this taper does not weaken the shaft, it doespresent a
problem of positioning the airfoils. In order to maintain the desired shapeof the
wing, each airfoil will have to be individually fashioned and attached to the spar.
This will increasemanufacturing costsand may lessenwing effectiveness. The
secondpotential weaknesscomes from the fact that the steel spar will not traverse
the entire span of the wing. It is imperative, therefore, that the wood structure
used to extend the wing to its desired length is capable of supporting all possible
1 The shaft was purchased from a subcontractor -- The Golf Pro in Mishawaka, IN - and its design is
geared toward the needs of a good one wood.
1-3

loads. This design runs the risk of have a "weak link" position that would negate
the strength benefits of the steel shaft.
Overall, Icarus Rewaxed fills the market need for a high-speed, low cost
aircraft. It provides customers with a general aviation craft that can compete in the
existing performance market with the added security of an advanced structure.
With the use of advanced materials, the maneuvering capability of the Icarus is
increased, as it can withstand greater load factors than previous aircraft. With the
ability to service and reach all existing airports in Aeroworld, only the sky limits
the Icarus owner.
Figure 1.1: Isometric View of Icarus Rewaxed
1-4
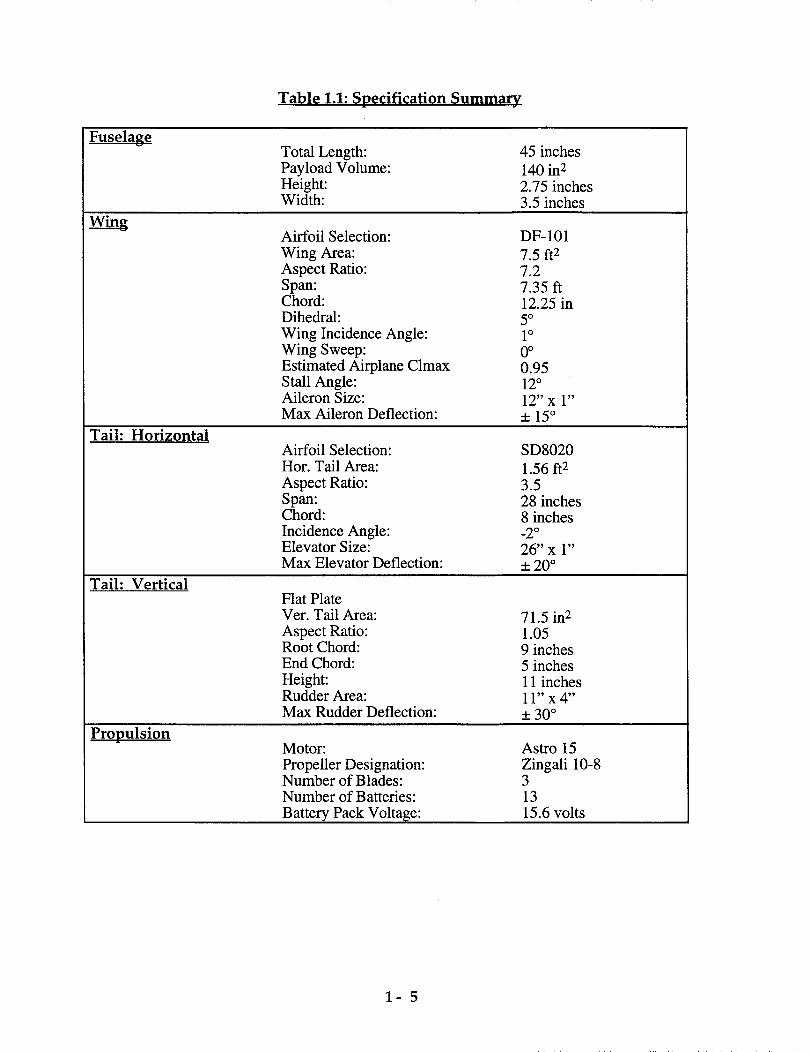
Table 1.1: Specification Summary
FuselageTotal Length:Payload Volume:Height:Width:
45 inches
140 in 2
2.75 inches3.5 inches
Airfoil Selection:
Wing Area:Aspect Ratio:
Span:Chord:Dihedral:
Wing Incidence Angle:Wing Sweep:Estimated Airplane ClmaxStall Angle:Aileron Size:
Max Aileron Deflection:
DF-101
7.5 ft 2
7.27.35 ft
12.25 in5 °1°0 o0.9512°
12" x 1"_+15 °
Tail: HorizontalAirfoil Selection:Hor. Tail Area:
Aspect Ratio:Span:Chord:
Incidence Angle:Elevator Size:Max Elevator Deflection:
SD8020
1.56 ft 23.528 inches8 inches
_2 °
26"x 1"
_ 20 °
Tail: VerticalFlat PlateVer. Tail Area:
Aspect Ratio:Root Chord:End Chord:
Height:Rudder Area:Max Rudder Deflection:
71.5 in 21.059 inches5 inches11 inches11" x 4"
_+30 °
PropulsionMotor:
Propeller Designation:Number of Blades:Number of Batteries:
Battery Pack Voltase:
Astro 15
Zingali 10-831315.6 volts
1-5
¢%
.Q
I t%_:r
_'_ II01
t'3
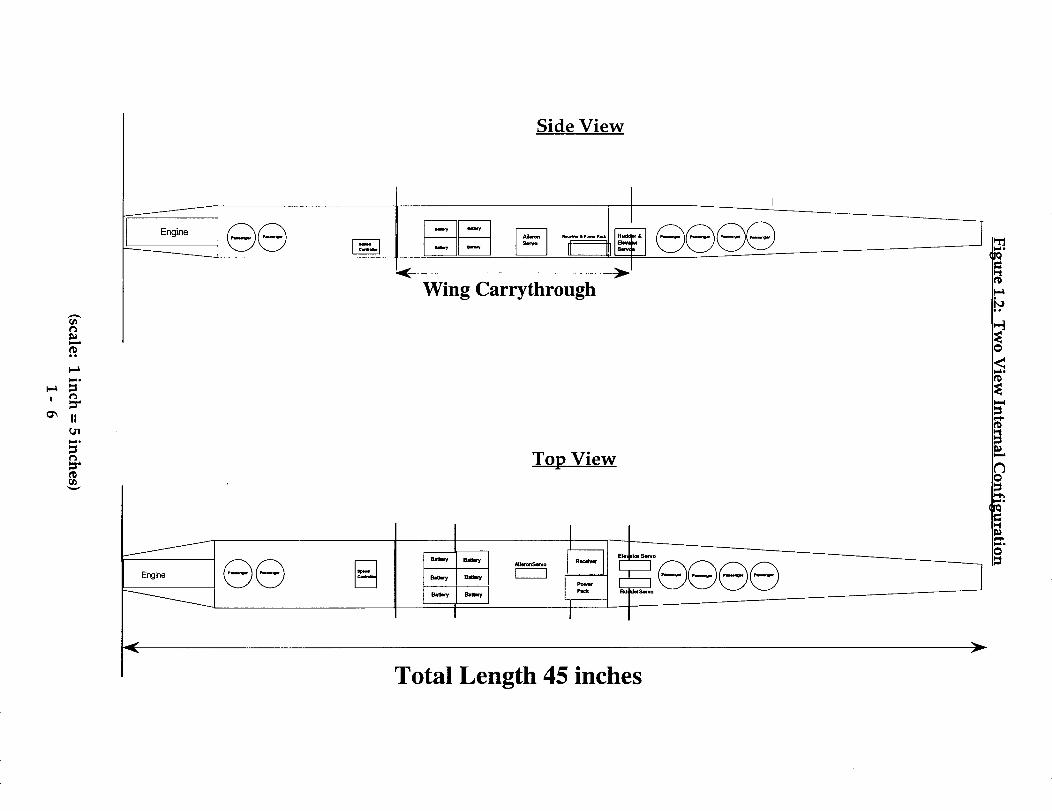
Side View
J
Engine LWing Carrythrough
i I
Top View
Jdl.coa._a_o
7---3
Total Length 45 inches
m
?
d.

c_
-- m m
C_C_
H
!
•_ _

2.0 MISSION DEFINITION
The mission of the project undertaken by Recent Future, Incorporated is to
design a low-cost, high-speed, general aviation aircraft to augment the current
commercial fleet in Aeroworld (see Figure 2.1 & Table 2.1). The airplane is
expected to minimize cost while demonstrating improved cruise speed over thecurrent fleet.
Figure 2.1: Layout of Aeroworld Cities and Airports
__30 °
Tabh
LONGITUDE
2.1: Information of Aeroworld Cities
I30 °
City
A
B
C
D
E
F
G
H
I
lK
L
M
N
O
Longitude
-21
-15
-10
-1
9
4
-5
-1
8
5
9
20
20
24
20
Latitude
6
12
-5
-10
-1
10
17
12
7
15
17
15
5
10
Runway
LengthFactor
1
0.8
0.7
1
1
1
1
1
1
1
1
1
-9 0.7
2-1
2.1 SUMMARY OF DESIGN REQUIREMENTS & OBJECTIVES
The following is a summary of the primary requirements and objectives
imposed us by various external and internal agents. The requirements are
imposed by three groups in particular Management [MI], Government [GI], and
the Design Group [DI]. The objectives are set forth by the group as "performance
guarantees" for the ultimate product of the design, the technology demonstrator.
2.2 REQUIREMENTS
• Takeoff and Landing
The aircraft must be able to takeoff and land under its own power as well
as takeoff from an "unmowed" grass/weed field with a grass depth of 3
inches and then climb to a height of 50 feet in a distance of 200 feet. The
landing gear must be configured with respect to the center of gravity such
that it has no tendency to tip over during the takeoff roll. In addition, the
spacing of the main and rear gear must be such that neither the tail nor the
propeller strikes during the ground roll. [MI]
• Propeller/Engine
The aircraft must be designed to provide at least a 3.5 inch propeller
ground clearance to allow for ground roll on the aforementioned
unprepared surfaces. [DI]
• Stability and Control
The center of gravity must be placed such that the aircraft is statically
stable. [DI] Control will be achieved through the use of no more than 4
$28 servos. [MI]
• Performance
The aircraft must be capable of performing a steady, level, 60 foot radius
turn at a velocity of 25 ft/s. In addition, the aircraft load factor can have a
maximum value of at least 2.0 during any maneuver. [MI]
• Loiter time and Range
The aircraft must be capable of servicing every airport in Aeroworld, loiter
for one minute, and still be capable of reaching the closest secondary
airport for each destination.[MI]
2-2

• Altitude Restriction
During the indoor portion of the design validation, the altitude of the
technology demonstrator must not exceed 25 feet. [MI]
• Survivability
The vital components of the radio control system, propulsion system, and
other flight systems should be able to withstand a crash from any flight
condition.[MI]
• Factor of safety
The material/construction of the aircraft will have a minimum factor of
safety of 1.4. [DI]
• Wings
Two separate, complete wings must be constructed - one will be used on
the technology demonstrator, the second will be subjected to a load test to
determine its point of failure.[MI]
• Regulation responsibility
All FAA and FCC regulations for operation of remotely piloted vehicles
and others imposed by the course instructor must be observed.[GI]
• Passengers
The aircraft must be capable of carrying 4 passengers as well as 2 crew
members requiring 8 cubic inches for each passenger and crew member as
well as an additional 4 cubic inches of baggage space per person.[MI]
• Note: This differs from the original DR&O. Originally the design team
believed the requirement to be 6 passengers plus two crew members.
They were later informed that the six passengers included the two crewmembers.
• System Installation/Maintenance time
The radio control system and complete propulsion system must be
removable and positioned in the airframe such that a complete system
installation can be performed in 20 minutes. [MI]
2-3
• Fuel/batteries
The fuel/batteries must be placed in the wing carry-through structure to
simulate actual industry practice of wing fuel storage. [MI]
• Cost
• Size
The raw materials used to construct the aircraft will have a maximum cost of
200 dollars. [MI]
All components of the airframe and supporting structure must be
designed to allow for transportation from the design lab to the validation
sites. In particular, the aircraft sections must be able to pass through the
openings having dimensions of 7 feet in height and 3 feet in width. [DI]
2.3 OBJECTIVES
• Handling qualities
The aircraft will be designed such that it has relatively benign handling
qualities to allow it to be flown by novice pilots.
• Cruise velocity
As this aircraft is to fill a distinctly new mission as compared to the
existing fleet of larger commercial aircraft, it will demonstrate an
improved cruise speed of 60 ft/s.
• Takeoff distance
The aircraft will be capable of taking off within 28 feet to allow service to all
airports in Aeroworld.
• Range
The aircraft will have an effective range of 30000 feet or greater allowing
for the required non-stop service between all existing airports in
Aeroworld as well as the required loiter time and alternate routing.
2-4

• Wind allowance
Throughout all phases of flight, the aircraft will be capable of
withstanding a gust of up to 10 mph.
• Weight
The weight of the aircraft is not to exceed 4.5 pounds.
• Throttle
The aircraft will perform at variable throttle settings allowing for
controlled flight during both the indoor and outdoor phases of thevalidation.
• Landing gear/Taxiing
The landing gear will be configured to allow for adequate ground control
on both prepared and unprepared surfaces enabling the aircraft to turn in
a 10 foot radius during taxi.
2-5

3.0 CONCEPT SELECTION
3.1 INTRODUCTION
The first step in devising the individual concepts was to list the major
goals for the aircraft. The key factors came down to the aircraft having a high
cruise velocity and a low cost. A third, yet not as important, factor in devising
the individual concepts was innovation. The individual concepts presented four
possibilities for the final concept: a high wing design, a low wing design, a
canard design, and a pusher propeller design.
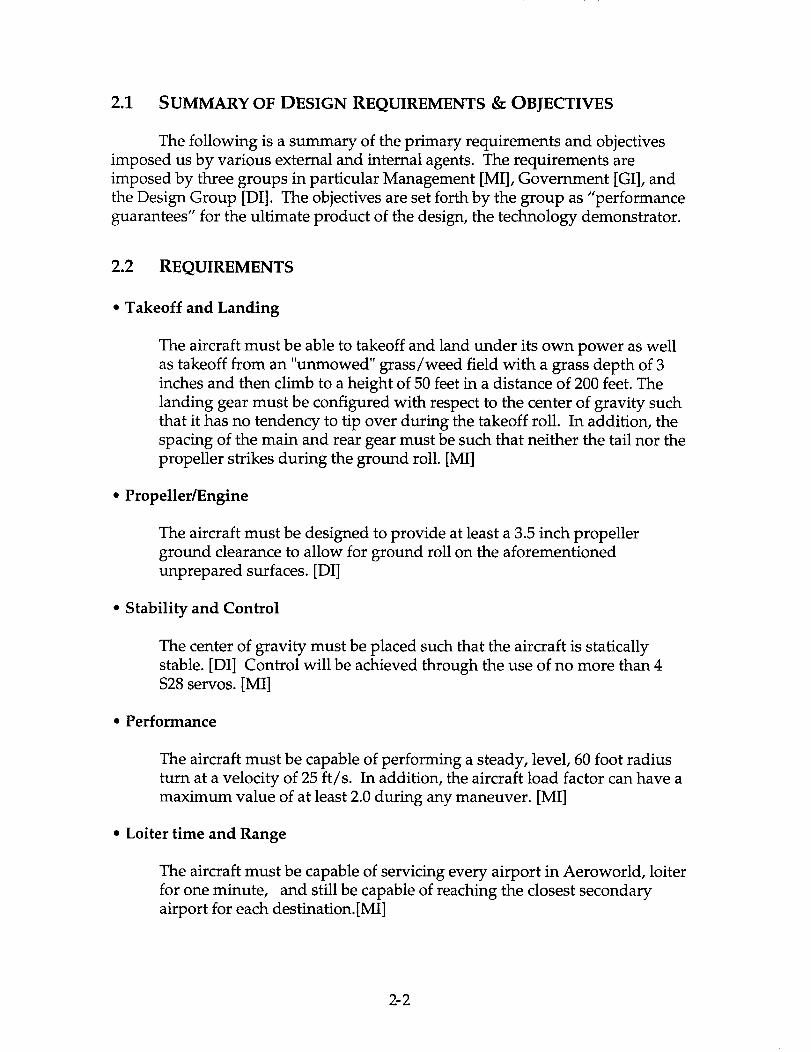
3.2 HIGH WING DESIGN
Two out of the six individual concepts featured a high wing design
(Figure 3.1). This design has the advantage of being inherently stable with
regard to roll. Because of the restoring moment caused by the fuselage, little or
no dihedral would be needed for roll stability. The high wing design also had
the advantage of a large data base of past experience.
Since (according to the design requirements) the fuel must be located in
the wing carry through, access to internal components would be a problem.
Adjusting the battery pack would involve removing the entire wing. This
accessibility problem was the primary reason for choosing another concept.
3.3 LOW WING DESIGN
Three out of the six individual concepts were low wing planes. These
designs featured the passengers seated two abreast, with two levels (illustrated
in Figure 3.2). The main advantage of the design was the accessibility to the
interior through the top of the plane. Another advantage was the relatively large
data base. This documentation of past experience greatly aided the initial
3-1

iteration of size,weight, and performance parameters. This concept also featured
ailerons coupled with dihedral for better roll control. Theseadvantageswere
incorporated into Icarus.
The disadvantage of the individual designs was the fuselage shape.
Sitting the passengers in the two abreast fashion increased the frontal area and
hence increased the overall drag of the aircraft. The primary design objective for
Recent Future, Inc. was to maximize cruise speed. Large drag is an obvious
detriment to4his objective.
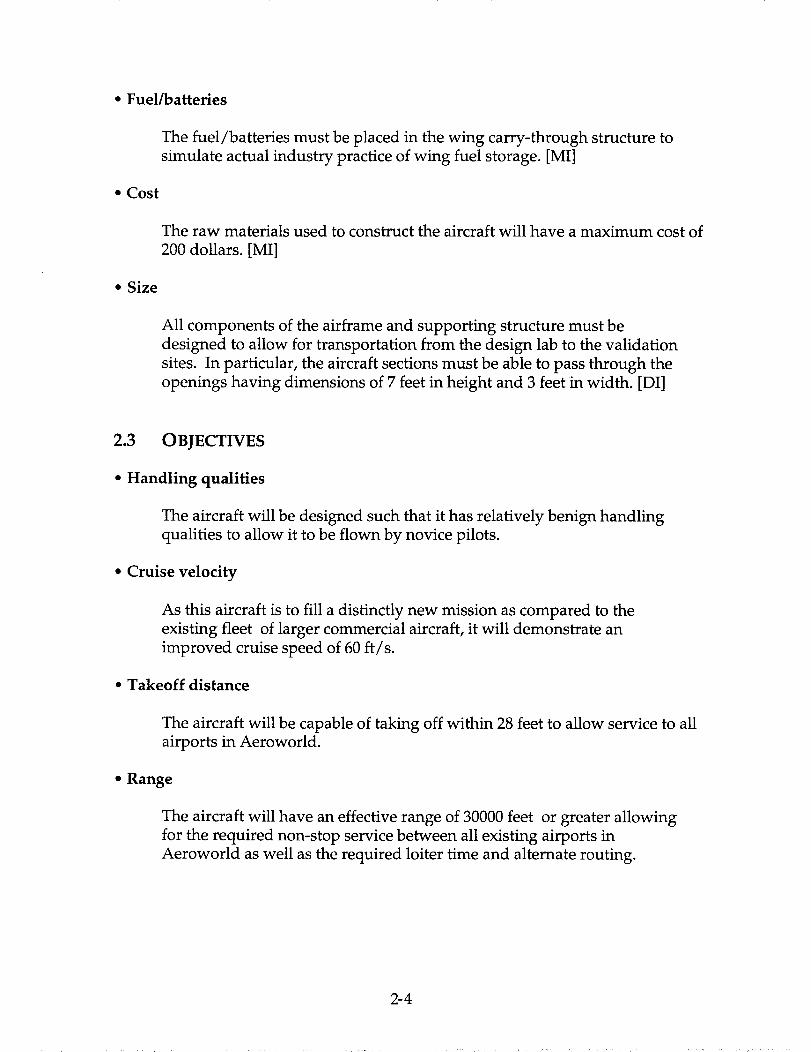
3.4 CANARD DESIGN
The next individual concept entailed a canard design, shown in Figure 3.3.
The canard was placed high on the fuselage, while the wing was mounted low.
The remaining structure is comparable to the high and low wing designs.
There are a few advantages of the canard. One advantage is that the
canard will stall before the wing during flight. This makes for a safer aircraft.
Even if a small amount of lift is lost as a result of the canard surface being stalled,
the larger main wing is still producing a significant amount Of lift, because the
main wing has not yet stalled. Another advantage of the canard design is that
unlike an aft tail, the canard produces positive lift. This adds to the lift of the
wing, instead of decreasing it as an aft tail does.
The main disadvantage of the canard came about due to the proposed
design of a large main wing and a very short fuselage. The fuselage was kept
small in order to minimize drag. Because of the short fuselage, the moment arm
to the canard would be quite small, thus forcing the canard surface to be quite
large to obtain the desired control. When the canard surface is made this large,
the airplane obtained is in effect one with two large main wings, as opposed to
one with a main wing and a smaller control surface.
3-2

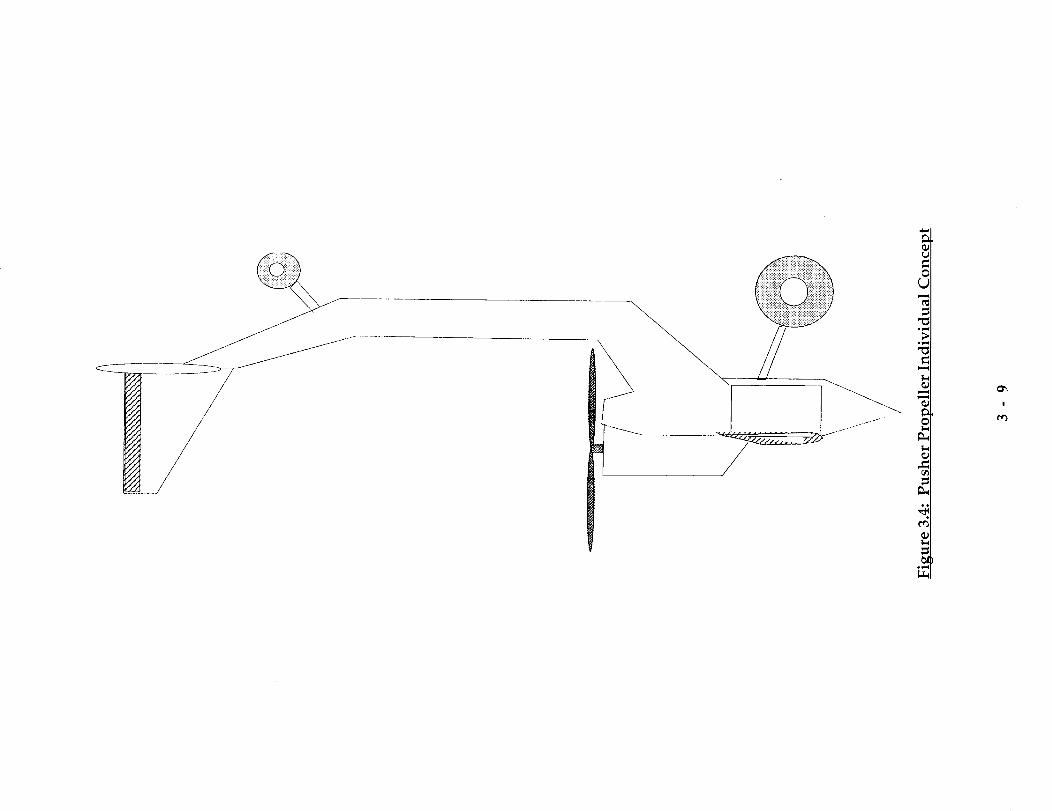
3.5 PUSHER PROPELLER DESIGN
The final individual concept featured a pusher propeller configuration
(illustrated in Figure 3.4). This concept included a radically shaped fuselage
designed to minimize space and cross-sectional area. The motor would be
attached above the main fuselage and would lock down a removable high wing.
The main advantage of this design was innovation. The radically different
profile would set this plane aesthetically apart from other designs, past and
present. Aerodynamically, this design optimizes the efficiency of the wing by
exposing it to a clean airflow. Theoretically, the small fuselage cross section
would reduce drag and minimize weight. The last advantage concerned the
placement of the propeller. In this elevated position, this design could shorten
the landing gear and still meet the tip clearance requirements set by the design
requirements. Since the landing gear represents a significant fraction of the total
drag (25-40% in past aircraft), reducing the size of the gear should increase high
speed performance.
This design had disadvantages as well. The main disadvantage came
from the fact that the pusher propeller configuration had not been tried before
with the same class of motor. Thus with no data base, this option brought a large
amount of risk. The main technical disadvantage of this design comes from the
placement of many of the internal components. With the motor in the middle of
the fuselage, the two heaviest pieces of equipment (motor and fuel) are located
near or aft of the desired center of gravity position. This would make balancing
the airplane and achieving the desired control power very difficult. Finally,
while the wing efficiency would increase, the propeller efficiency would drop.
This loss would come from the fact that the propeller no longer would experience
clean flow.
3-3

While this design had much sentimental support and innovative appeal,
its technological risks proved too great. Given the limited experience of the
members of Recent Future, Inc. and the lack of a past data base, this design
seemed too radical.
3.6 ICARUS REWAXED
The final concept chosen incorporated many of the strengths of the
individual concepts, while eliminating the weaknesses. A summary of strengths
and weaknesses is shown in Table 3.1. Icarus Rewaxed is a low wing aircraft
using dihedral, rudder, and ailerons for roll control. This low wing also allows
easv access to internal components. The minimal fuselage concept of the pusher
propeller design was chosen to minimize frontal area, thus minimizing drag.
This fuselage design involves seating the passengers in a single row.
In order to maximize cruise speed, the Icarus features low drag airfoil
sections in the horizontal tail section. This subtle departure from many past
designs provides better drag performance than the usual flat plate. The Icarus is
also equipped with a three-bladed propeller to maximize thrust, therefore
increasing the cruise velocity and decreasing the takeoff distance.
The overall design remained simple so to keep cost to a minimum. The
decision was made that innovation was secondary to cost, and thus the
appearance of the aircraft remained contemporary and simple to minimize the
man hours necessary for construction.
Diagrams of the external and internal configurations are shown in Figures
1.1 and 1.2.
3-4

Table 3.1: Summary of Concepts7 C ¸ ) 7
: :_WEAKNESSES
High Wing • better roll stability
large database from
past designs
lack of accessibility to
internal components
Low Wing • accessibility
• large database from
past designs
• ailerons/dihedral
large frontal area
Canard • canard free from wing
interference
• stalls before wing
• positive lift
• large size of canard
Pusher Propeller • innovation
• wing sees clean flow
• shorter landing gear -
less drag
• small fuselage cross
section
• lack of database/high
risk
• difficult to achieve
stable CG location
• reduced propeller
efficiency
3-5
/
/!
//
/
/
!
/
.jJ
©© IS
Figure 3.1: High Wing Individual Concept
3-6

Q
Q0
Figure 3.2: Low Wing Individual Concept
3-7
i
I r_
000
,' ¢'X,"_,C/
, _.¢_,,;'
: i
i
I
7////////////_
m_,\\\\\\\\\\\\\'_
Figure 3.3: Canard - Individual Concept
3-8
/
!J
iI
_J
o_
J.o_
!
!

4.0 AERODYNAMICS
4.1 INTRODUCTION
The two main design drivers for the aerodynamics group were the low-
speed takeoff requirement and the high-speed cruise objective. These factors
influenced every major decision made, in particular the choice of airfoil and the
dimensions of the wing planform.
4.2 AIRFOIL SELECTION
Icarus will fly at Reynolds numbers ranging from 150000 to 300000. The
selection of an airfoil section designed for operation at these low Reynolds
numbers is an important part of the wing design. Thus, the first major
responsibility of the aerodynamics group was to select an airfoil section for the
wing. A trade study was performed, comparing several different airfoil sections.
All airfoil data was obtained from Reference 4.7. The initial cursory screening
was based on two objectives: low Cd value at the estimated values for cruise C1
and takeoff C 1 for the estimated Reynolds number, and a C1 max of at least 1.0. A
low cruise Cd is necessary in order to achieve the goal stated in the Design
Requirements and Objectives (DR&O) of a 60 feet/second cruise speed. A low
takeoff Cd and a high C 1 max are important for meeting the DR&O objective of
taking off within 28 feet to allow service to all Aeroworld airports. Nine airfoils
survived this initial screening to advance for further study, namely: the DF101,
E205, $2091, $3010, $4061, SD6080, SD7084, RG15, and the CLARK-Y. The
primary airfoil characteristics such as: C1 max, cruise Cd, takeoff Cd, Cd min,
thickness, and camber, were rated in order of importance, with C1 max and
minimum cruise Cd being the two most important parameters, again based on
mission and DR&O requirements.
4-1

The mission of RecentFuture, Inc. is to produce a high-speed, low-cost
airplane that is manufacturable by the current work force. Because this high-
speed craft will spend much of its flight time in cruise, a minimum cruise drag is
essential for good fuel economy. Thus, the selection of an airfoil section with a
low cruise Cd was vital.
In addition to the high-speed cruise requirement, the airplane had to meet
a fairly stringent group-imposed objective of taking off in under 28 feet; hence
takeoff performance could not be neglected. Icarus was designed to take off at a
relatively low speed of 29 feet/second (VTo = 1.2*Vstall), hence a large C 1 was
required, given this low speed. This high C1 could be accomplished two ways:
by increasing the aspect ratio of the wing thus increasing the 3-D lift curve slope,
and by increasing section C 1 max. Section C 1 max could be controlled through
choice of an appropriate airfoil. Since L=CI*0.5*q*S, increasing C1 with all other
things constant would obviously increase lift. Hence, Recent Future, Inc. made
an effort to choose an airfoil section with a fairly high C 1 max, in order to meet
the takeoff requirement of 28 feet at the chosen low takeoff speed.
Another option for meeting the takeoff distance requirement was to use
high-lift devices. Full-span high-lift flaps were considered at some length, but
eventually were not incorporated into the design, primarily based on the
experiences of prior Aeroworld airplanes. It seemed from past years that a
simple hinged flap added extra weight, manufacturing complexity, and cost,
without a radical improvement in takeoff performance. This was because the
effect of the additional drag and moment created by the deflection of the flaps
outweighed the small amount of additional lift created.
Although low C d and high C 1 max were the two primary parameters used
to guide the airfoil selection process, other factors were considered, including:
stall behavior, thickness, camber, and the general shape of the airfoil. The stall
4-2

behavior was judged basedon the appearance of the lift curve slope: it was
desired that the region near C1 max be relatively flat and that the curve not show
a precipitious drop after stall, meaning that the stall would be gradual. The
thickness of the airfoil was important, for integrity of the internal spar support
structure. Also, because Recent Future, Inc. decided to use ailerons for roll
control, the thickness and shape of the airfoil trailing edge were critically
evaluated, as this is where the ailerons were cut out.
Based on all these factors, plus the advice of the authors of Reference 4.7
concerning the various airfoils in question, the DF101 was selected as the airfoil
for Icarus. As can be seen in Table 4.1, the DF101 presents the most desirable
combination of important characteristics. With a cruise Cd of approximately
0.0082, the DF101 has the second lowest cruise Cd of all nine airfoils considered.
The C1 max of 1.14 was adequate for meeting the 28 feet takeoff roll requirement.
Also, the stall characteristics are acceptable according to the above-mentioned
criteria. The thickness of 11% was deemed acceptable for production purposes
by our structures experts. Finally, the overall shape of the airfoil (see Figure 4.1)
seems to be conducive to ease of balsa wood/Monokote construction, because
there is no complex curvature involved (such as a reflexed trailing edge) which
might present construction problems, such as difficulty in maintaining the true
airfoil shape along the span.
The moment coefficient for the DF101 section has a value of -0.0582,
obtained from the data (Ref. 4.7). Treatment of Cmo appears later in Section 7,
Stability and Control Systems.
Figure 4.1:DF101 profile
4-3

Table 4.1: Airfoil Characteristics
Airfoil Cruise Cd C1 max Stall Thickness
$2091 0.011 1.4 14 ° 10.1%
$3010 0.009 1.18 12 ° 10.3%
DF101 0.0085 1.15 12 ° 11.0%
RG15 0.0078 1.07 12 ° 8.9%
A similar airfoil selection process, based on similar selection criteria, was
performed for the horizontal tail section. The horizontal tail was constructed as
an airfoil section, as opposed to the flat plate designs of previous years. A trade
study on this subject was performed, and it was found that the use of a
symmetric airfoil section for the horizontal tail caused a significant savings in
drag. For the same planform area, a horizontal tail constructed of airfoil sections
created 50% less drag than a flat plate design. This drag savings can be
accomplished with a minimum increase in design weight, as shown in Section
9.6.
The airfoil section chosen for the horizontal tail was the SD8020. In Figure
4.2, the aerodynamic benefit of using the symmetric SD8020 section as opposed
to a flat plate is most clearly seen. The tail operates at a Reynolds number of
approximately 150000. At this Reynolds number, the minimum Cd of 0.008 for
the SD8020 is considerably lower than 0.014, the Cd min for the flat plate.
4-4

Figure 4.2: Flat Plate Drag Curves as Compared to SD8020 Drag Curves
FLAT PLATE-PT (Fraser;
m Rn = 100,000
Rn = 200,000
v Rn-- 300,000
iii:li_liliz:.iiiliiii
""F"i'"]"T'T"I"T"i'"!'-F"_'"F"!'"!7"7"'F'T'T"F'T'T"F"
...I.-.7..F..F-T..7-T-F-_-...F..TT.._.-_---,..._...i-.7.T..7.T.-!...F.
"rr__r___r"r_r_-_=rrrrrr_r_3...!...!...!...r..r..!...!..!..!.T..!...!...!...;...FT.!...!...!..T..!...!...!...!..
::::::::::::::::::::::::::::::::::::::::::::::::::::::::::::::::::::::::::::::::::::::::::::::::::::::::::::::::::::::
_ iiii iiii]iiiili:_;...iiiiSi..L..L..L..!......!_L..L..i.._: ...L..L..L..L.
_°}i__..i...;...;..;--...-i.,.i.._._.._......................_..........i.-i.4.4..
0.o0 0,01 o,o2 c.03 0._ 0.05
%
o
,!.o
SDS020--PT (Wogner/Olsen)
e Rn = 60,000
o Rn -- 100,000
*' Rn : 150,000
Rn = 200,000
V Rn -- 300,000
!)!!i!!!!!!!!!!!!!!!!!ii{iii!!!!!!!!!!!!!!!!i!ii{!{!!!!!i{!!{i{!!!!!!i!ii...
c_
4.3 WING SIZING
The primary driver in sizing the wing was the tradeoff between low and
high-speed performance. At a takeoff velocity of 29 ft/s, Icarus could meet the
takeoff distance requirement of 28 feet. Because of the low takeoff velocity, in
order to obtain a reasonable value for CL, a large wing area was required at the
takeoff condition. At cruise, however, the minimum wing area possible was
desired. This area would be lower than that required for takeoff. At the desired
cruise attitude, the cruise C L was lower than the takeoff C L. However, the
design cruise speed is twice that reached during takeoff and landing. Because of
the dramatic increase in speed, less wing area would be necessary to support the
same weight. Less wing area results in less cruise drag, which translates into
better fuel economy. Clearly, a compromise between these two conflicting
factors had to be reached. The design wing area of 7.5 ft 2 represents the
minimum wing area required to get off the ground in 28 feet and thus meet the
takeoff requirement.
4-5

The 7.5ft 2 of wing areawas distributed asfollows: span = 7.35feet, and
chord = 12.25inches. It was desired to keep the chord over 12 inchesin order to
keep the lowest estimated Reynolds number (REat takeoff) greater than 150000,
becausethe drag polars of all the airfoils considered showed somewhat erratic
and unpredictable behavior at RE< 150000.Also, due to structural
considerations, a thick airfoil was desirable to allow adequate spacefor the main
wing spar and wing box structure. Hence,a larger chord meant greater thickness
(t/c=11%), thus meeting the specifications of the structures group.
The wing is of simple rectangular planform. It was decided not to
incorporate taper or sweep, due to increasedconstruction complexity and
resulting cost. As pointed out in Reference4.5,page 192,incorporating taper into
a wing would increasemanufacturing cost. For a tapered planform, each airfoil
section would have to becut individually, becausethe sizeof the sectionswould
change from root to tip. It is estimated that this would take twice as long asthe
procedure for a rectangular planform, that of cutting all the same-size airfoils at
once. Given the current tools and manufacturing techniques available,
incorporating sweep into the wing would also require a more complicated
manufacturing process than that of a rectangular section. Thus, because the
mission statement specifically states that Icarus is to be a low-cost airplane,
neither taper nor sweep was included in the design of the main wing.
4.4 COMPLETE CONFIGURATION AERODYNAMICS
4.4.1 LIFT CONSIDERATIONS
A modified lifting-line code (Ref. 4.3) was used to predict the wing loading as the
wing approached stall. Stall prediction was accomplished by varying the angle
of attack and scanning for sections along the span which exhibited predicted
section lift coefficients in excess of that entered as the maximum lift coefficient of
4-6
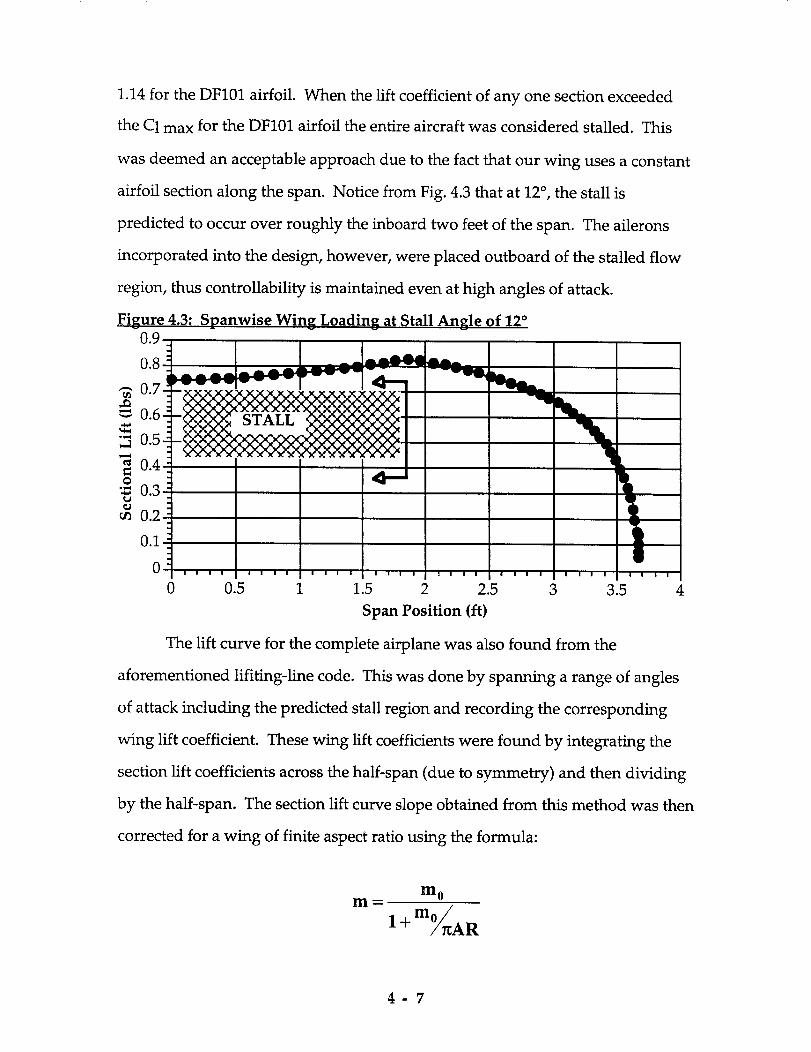
1.14for the DF101 airfoil. When the lift coefficient of any one section exceeded
the C1max for the DF101airfoil the entire aircraft was considered stalled. This
was deemed an acceptableapproach due to the fact that our wing usesa constant
airfoil section along the span. Notice from Fig. 4.3that at 12°, the stall is
predicted to occur over roughly the inboard two feet of the span. The ailerons
incorporated into the design, however, were placed outboard of the stalled flow
region, thus controllability is maintained even at high angles of attack.
Figure 4.3: Spanwise Wing Loading at Stall Angle of 12 °
r_
o
o
0.5-
0.1- |=
0 0.5 1 1.5 2 2.5 3 3.5 4
Span Position (ft)
The lift curve for the complete airplane was also found from the
aforementioned lifiting-line code. This was done by spanning a range of angles
of attack including the predicted stall region and recording the corresponding
wing lift coefficient. These wing lift coefficients were found by integrating the
section lift coefficients across the half-span (due to symmetry) and then dividing
by the half-span. The section lift curve slope obtained from this method was then
corrected for a wing of finite aspect ratio using the formula:
m m
m 0
1 + m°0_xAR
4-7

The lift curve slope was thus computed to be4.55 / radian. The predicted lift-
curve slope for the complete configuration is shown in Figure 4.4.
Figure 4.4: Lift Curve Slope for Complete Configuration Aircraft
1.2-
-_ 0.8
.h 0.6r_
_,1
¢J 0.4
0.2
0 __
#
0 2 4
/ ,¢'
6 8 10 12 14
Alpha (deg)
4.4.2 DRAG CONSIDERATIONS
Once the lift coefficients at various angles of attack for the complete aircraft
configuration were determined, the corresponding drag polar could be found by
assuming a polar of the form:
CL 2
CD -- CD° q- _rA Re
where CDo and e, the efficiency factor of the airplane, were computed using the
component breakdown method presented in Reference 4.6. The drag polar thus
obtained for the entire aircraft is shown in Figure 4.5.
4-8

Figure 4.5
Complete Aircraft Configuration Drag Polar
1.2
takeof
0.8 - ""_ a "_
: 7--f._ 0.6
/o O.4
cruise _
0.2 _'N
0
0 0.01 0.02 0.03 0.04 0.05 0.06
CD (aircraft)
0.07 0.08 0.09 0.1
The parasite drag coefficient was computed using the formula:
CD St:
CDo =£ _ref
The present study used empirical estimates of the component drag coefficients
(C DK) as given in Ref. 4.6, for all components except the landing gear. A detailed
estimate of landing gear drag was computed separately, based on the size and
configuration of the landing gear designed specifically for Icarus, and modeling
the struts and tires as cylinders. The CDK for a cylinder was obtained from
Reference 4.5. Finally, an additional 15 percent was included to account for
interference effects. Table 4.2 shows the component breakdown. The relative
contribution of each component is shown graphically in Fig. 4.9.
4-9

Table 4.2: Contribution of Each Component
Component CD_ S= (sq. in.) Data Source
Wing 0.0070 1080.5 Reference 4.6
Fuselage 0.110 9.625 Reference 4.6
Horizontal Tail 0.0080 224.0 Reference 4.6
Vertical Tail 0.0080 71.5 Reference 4.6
Landing Gear- 1.1 1.875 Reference 4.5
Tires (Main)
Landing Gear- 1.1 1.125 Reference 4.5
Struts (Main)
Landing Gear- 1.1 0.9375 Reference 4.5
Tire (Tail)
Landing Gear- 1.1 0.5 Reference 4.5
Strut (Tail)
Interference 15% Reference 4.6
4- 10

Figure 4.9: Component Drag Breakdown
2.6 %
8.1%
4.8 %
37 %
34 %
15 %
[] Wing
[] Fuselage
[] Horizontal Tail
[] Vertical Tail
[] Landing Gear
[] Interference/Roughness
Note the large percentage of the drag which is due to the landing gear.
Because of the requirement in the DR&O of 3.5 inches of tip clearance on
unprepared surfaces, the size of the landing gear must be fairly large relative to
the rest of the airplane, hence causing a significant portion of the total drag.
Recent Future, Inc. has investigated the possibility of including fairings around
the gear to reduce the drag. Several methods have been considered. The method
to be used for the prototype involves attaching Monokote to the struts, in an
attempt to provide the effect of a splitter plate.
4.4.3 EFFICIENCY AND COST CONSIDERATIONS
From Figure 4.7, one can see that at the design cruise velocity, L/D cruise
is not equal to L/D max. This was due to the conflicting requirements of low-
speed and high-speed performance. In order to cruise at L/D max, the cruise
speed would have been approximately 33 if/s, which is no improvement over
4 - 11
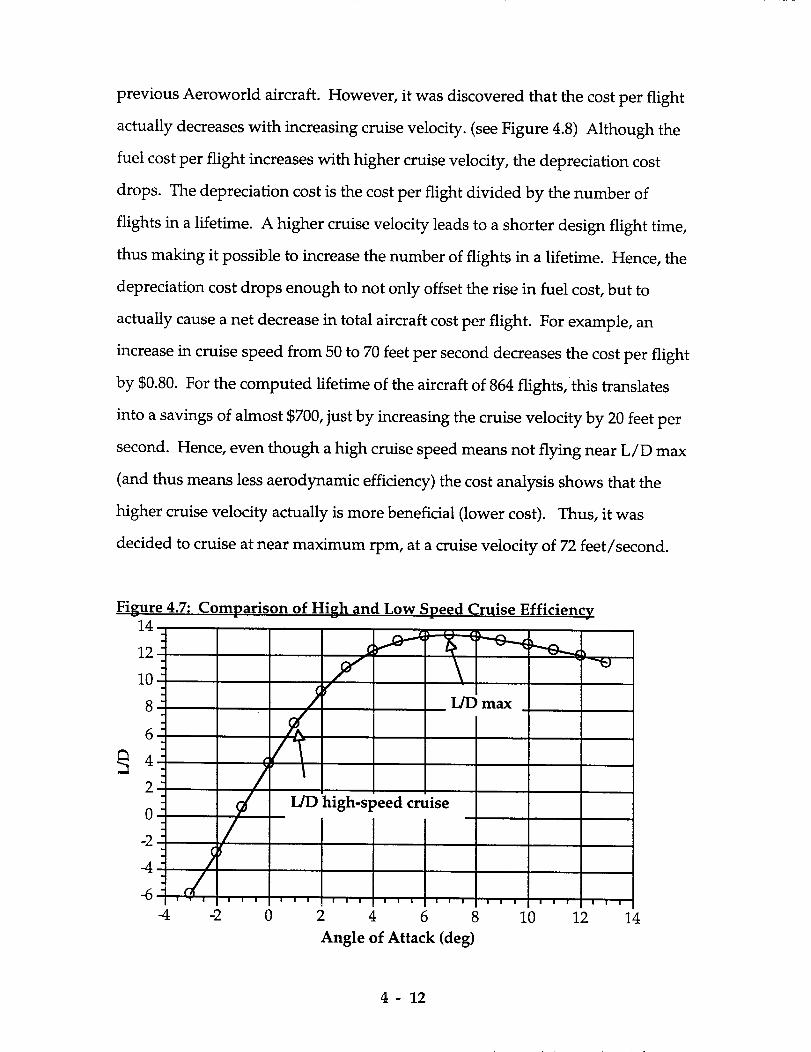
previous Aeroworld aircraft. However, it was discovered that the costper flight
actually decreaseswith increasing cruise velocity. (seeFigure 4.8) Although the
fuel cost per flight increaseswith higher cruise velocity, the depreciation cost
drops. The depreciation cost is the cost per flight divided by the number of
flights in a lifetime. A higher cruise velocity leadsto a shorter design flight time,
thus making it possible to increasethe number of flights in a lifetime. Hence, the
depreciation cost drops enough to not only offset the rise in fuel cost, but to
actually causea net decreasein total aircraft costper flight. For example, an
increasein cruise speedfrom 50 to 70feet per seconddecreasesthe cost per flight
by $0.80.For the computed lifetime of the aircraft of 864 flights, this translates
into asavings of almost $700,just by increasing the cruise velocity by 20 feet per
second. Hence, even though a high cruise speedmeansnot flying near L/D max
(and thus means lessaerodynamic efficiency) the cost analysis shows that the
higher cruise velocity actually is more beneficial (lower cost). Thus, it was
decided to cruise at near maximum rpm, at a cruise velocity of 72 feet/second.
Figure 4.7:14
10
8
2
0 high-speed cruise _
4 JJ
Comparison of High and Low Speed Cruise Efficiency
-4 4 0 2 4 6 8 10 12 14
Angle of Attack (deg)
4- 12

Figure 4.8:
8-
7.9-
7.8-
CY3
O
° ,..._
©
G;
Effect of Increased Cruise Speed on Cost Per Flight
7.7"
7.6-
7.5-
7.4-
7.3-
7.2-
7.1-
7-
6.9-
6.8-
6.7-
6.6-
6.5- , , , ,
45
\
I i i !! ! ! ! ! ! i i ! ! i i
50 55 60 65 70
Design Cruise Speed (ft/s)
4- 13

References
4.1. Anderson, John D., Jr. Fundamentals of Aerodynamics, 2nd edition. New York:
Mc-Graw Hill, Incorporated, 1991.
4.2. Anderson, John D., Jr. Introduction to Flight, 3rd edition. New York: McGraw-
Hill, Incorporated, 1989.
4.3 Capozzi, Brian and Fay, Jonathan. Lifting Line Code, written for AE350 Fall
1992, modified by J. Fay for AE441 Spring 1994.
4.4. Kuethe, Arnold M. and Chow, Chuen-Yen. Foundations of Aerodynamics: Bases
of Aerodynamic Design, 4th edition. New York: John Wilev and Sons, 1986.
4.5. McCormick, Barnes W. Aerodynamics, Aeronautics, and Flight Mechanics. New
York: John Wiley and Sons, 1979.
4.6. Nelson, Robert C. "Subsonic Drag Estimation: Component Build-up
Method." Department of Aerospace and Mechanical Engineering, University
of Notre Dame, 1993.
4.7. Selig, Michael S., Donovan, John F., and Fraser, David B. Airfoils at Low Speeds.
Virginia Beach: H.A. Stokely, publisher, 1989.
4 - 14

5.0 PROPULSION
5.1 REQUIREMENTS AND OBJECTIVES
The key objectives which set the expectations for the propulsion system
were high cruise velocity (at least 60 feet/second), a takeoff distance of less than
28 feet, and a range of at least 30,000 ft. Other contributing factors to the choice
of propulsion system were weight and cost minimization, and a target time of no
more than 20 minutes for motor installation and removal. The prototype must
have a variable throttle control in order to fly at a maximum speed of 30
feet/second inside Loftus and reach its cruising speed of 72 ft/s outside. Since
noise abatement and pollution control were of concern to Recent Future, Inc.,
electric propulsion was chosen to protect the immediate community and
environment. Table 5.1 breaks down the propulsion system of Icarus Rewaxed.
Table 5.1: Summary of Propulsion System
Type of Motor Astro 15 (Gear Ratio = 2.21)
Propeller Designation Zingali 10-8
Number of Blades 3
Number of Batteries 13
Battery Pack Capacity 1400 milliamp hours
15.6 voltsBattery Pack Voltage
5-1
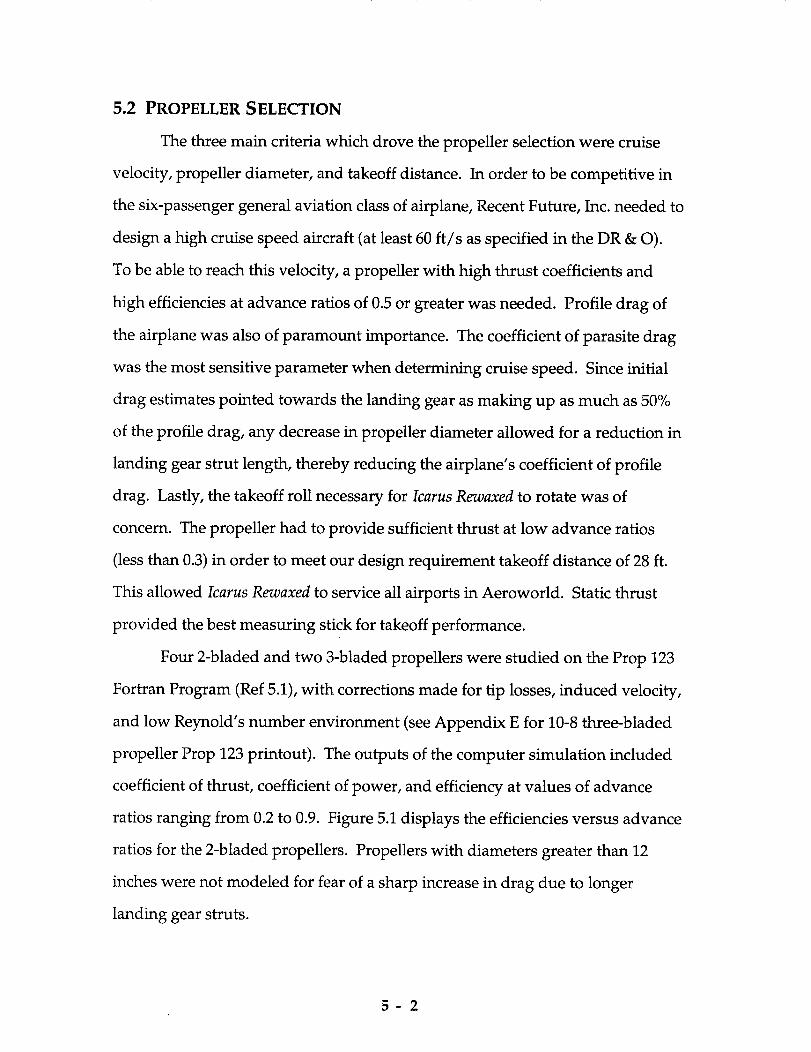
5.2 PROPELLER SELECTION
The three main criteria which drove the propeller selection were cruise
velocity, propeller diameter, and takeoff distance. In order to be competitive in
the six-passenger general aviation class of airplane, Recent Future, Inc. needed to
design a high cruise speed aircraft (at least 60 ft/s as specified in the DR & O).
To be able to reach this velocity, a propeller with high thrust coefficients and
high efficiencies at advance ratios of 0.5 or greater was needed. Profile drag of
the airplane was also of paramount importance. The coefficient of parasite drag
was the most sensitive parameter when determining cruise speed. Since initial
drag estimates pointed towards the landing gear as making up as much as 50%
of the profile drag, any decrease in propeller diameter allowed for a reduction in
landing gear strut length, thereby reducing the airplane's coefficient of profile
drag. Lastly, the takeoff roll necessary for Icarus Rewaxed to rotate was of
concern. The propeller had to provide sufficient thrust at low advance ratios
(less than 0.3) in order to meet our design requirement takeoff distance of 28 ft.
This allowed Icarus Rewaxed to service all airports in Aeroworld. Static thrust
provided the best measuring stick for takeoff performance.
Four 2-bladed and two 3-bladed propellers were studied on the Prop 123
Fortran Program (Ref 5.1), with corrections made for tip losses, induced velocity,
and low Reynold's number environment (see Appendix E for 10-8 three-bladed
propeller Prop 123 printout). The outputs of the computer simulation included
coefficient of thrust, coefficient of power, and efficiency at values of advance
ratios ranging from 0.2 to 0.9. Figure 5.1 displays the efficiencies versus advance
ratios for the 2-bladed propellers. Propellers with diameters greater than 12
inches were not modeled for fear of a sharp increase in drag due to longer
landing gear struts.
5-2

As shown in Figure 5.1, the 10-7 and 11-7 propellers had the highest
efficiencies at advance ratios of 0.5 and up (Icarus Rewaxed cruising speed
advance ratios) with the 10-7 having a peak efficiency of .795 at a .650 advance
ratio. Figure 5.2 illustrates the two 3-bladed propellers' efficiencies versus
advance ratio. The 10-8 is more efficient than the 11-7 in all phases of the flight
regime, peaking at a .840 efficiency at an advance ratio of .830. Figure 5.2 is
labeled with the advance ratio and corresponding efficiency that the Icarus
Rewaxed equipped with the 10-8 propeller cruises at. Figures 5.3 and 5.4, which
depict the relationship between coefficient of thrust and advance ratio for the 2-
bladed and 3-bladed propellers respectively, provided the final measure of merit
for propeller selection. Both 3-bladed props had much higher thrust coefficients
at low advance ratios (important for takeoff) and high advance ratios (important
for cruise) than all the 2-bladed propellers. Although the 3-bladed 11-7
performed better than the 10-8 at low advance ratios, the 10-8 bested the 11-7
handily at high advance ratios in both efficiency and thrust coefficient.
The only tradeoff for using the 10-8 propeller was cost. At $15.00, it was
$10.00 more expensive than any of the 2-bladed propellers. Recent Future, Inc.
decided it was worth the increase in cost because its high efficiencies and thrust
coefficients were needed in order for Icarus Rewaxed to meet its takeoff distance
requirement and cruise velocity objective.
5-3

Figure 5.1: Determining the Most Efficient Two-Bladed Propeller
0.9
0.8 I0.7 _,,_ f_---- _ _,,_ 10 -
o _, 11"7\= 0.6
\\ VE=0.5 t,,, '_ ,,
• 0.4. _k8-0.3-
n
0.2.
0_ "-_/\\ '_-60-
0.2 0.3 0.4 0.5 0.6 0.7 0.8 0.9
Advance Ratio (J)
Figure 5.2: Determining the Most Efficient Three-Bladed Propeller
0.9
0.8 f ._
0.7 J "_
o_- 0.6
"-_o /_f_= 0.5W
0.4O
o 0.3n
0.2
0.1
0
0.2 0.3 0.4 . 0.5 0.6 0.7
Advance Ratio (J)
--"" 10-8
Efficiency (Cruise) = .82
\ 11 -7
0.8 0.9
5-4

Figure 5.3: Two-Bladed Propeller Thrust Coefficient across Flight
Advance Ratio Range
0.14
0.12 _"
*" 010 .
"5 0.08 _
0
_= 0.04-
0.02."k
o "\0.2 0.3 0.4 0.5 0.6 0.7 0.8 0.9
Advance Ratio (J)
10-7
11 -5
11 -7
12-6
Figure 5.4: Three-Bladed Propeller Thrust Coefficient across Flight
Advance Ratio Range
0.2
0.18 _-_
-,q _ Rotation (at Takeoff)
°0.14
(,-• 0.12
- _._
0.1 1
o0 0.08
\'_,'- 0.06c-
0.04
0.02
0
0.2 0.3 0.4 0.5 0.6 0.7
Advance Ratio (J)
J = .295
JD J 10-8|
I_ 11-7| !
Cruise J .738
\
\0.8 0.9
5-5

5.3 MOTOR S ELECTION
The driving forces in selecting the motor were maximum Revolutions Per
Minute and power output. We limited our options to the Astro 15 and the Astro
25 in that the next smallest motor could not supply enough power for our 144
Watt takeoff requirement and anything larger than the Astro 25 would result in
excessive weight. High propeller RPM's were essential to reach our 60 ft/s cruise
objective. The Astro 15, which has a maximum motor RPM of 16500, was able to
spin the propeller much faster than the more powerful yet slower Astro 25. As it
turned out, using a gear box with a 2.21 ratio of motor RPM to propeller RPM,
15500 motor RPM were needed to drive the 10-8 propeller for Icarus Rewaxed to
cruise at 72 ft/s. In addition, the motor has to be able to supply enough torque to
spin the propeller at maximum takeoff voltage. If it cannot, Icarus Rewaxed
cannot takeoff in 28 ft. Rated at 200 Watts, the Astro 15 produces enough power
to both meet our takeoff roll and our cruise speed objectives. Since the Astro 15
is $61.00 cheaper, 4.5 oz. lighter, and capable of rotating the propeller at a higher
rpm than the Astro 25 (rated at 300 W) while still providing the required power,
it became the obvious choice of motor for the propulsion system. Table 5.2
compares the weights (which include a gear box), costs, maximum motor power,
and maximum motor RPM.
Table 5.2: Motor Characteristics
Motor Weight (oz) Cost Max Motor Power Max Motor RPM
Astro 15 25 $107.00 200 W 16500
Astro 25 38 $174.00 300 W 10000
5.4 BATTERY CHOICE
The power pack's purpose was twofold. It must supply the motor with
enough voltage to produce sufficient thrust to meet the 28 ft takeoff roll
5-6

requirement and enough battery capacity to reach the design requirement range
of 30000 ft at a design objective cruise speed of 60 ft/s. The 30000 ft range
requirement allowed Icarus Rewaxed to transit non-stop between any two airports
in Aeroworld, loiter for one minute at its cruise velocity and, if necessary, access
a secondary airport in the case of complications with the original destination.
This range took into consideration a possible diversion to an alternate airport
with a subsequent two minute loiter.
Since RPM of the propeller is directly related to the voltage applied across
the motor, the number of batteries needed was dictated by takeoff. Using the
Takeoff Program (Ref 5.3), Icarus Rewaxed, equipped with a 10-8 three-bladed
propeller and an Astro 15 motor, necessitated 15.6 volts to takeoff in 28 ft (see
Appendix E for Takeoff Program printout). At 1.2 volts per cell, 13 batteries were
linked in series to achieve 15.6 volts. The static thrust that the propulsion system
produced at takeoff was 3.64 lbs. The value of the rolling friction coefficient
between rubber and hard astroturf used for the study was .05. Since the motor
had to sustain this high voltage, high RPM condition for a short duration during
takeoff and subsequent climb to an altitude of 25 ft, only 11 mah of current was
drained from the batteries. Table 5.3 gives a breakdown of the flight phases, the
voltage needed to maintain the speeds, the current draw of the motor, the time of
each phase, and the resultant current drain on the batteries.
Table 5.3: Current Drain of Flight Phases
Takeoff
Climb (25 ft)
Voltage15.6 V
15.6 V
Current
15.0 A
15.0 A
Time Current Drain
1.7 s 7mah
1.0 s 4 mah
Cruise (72ft/s) 14.9 V 11.8 A 417 s 1361 mah
Total 1372 mah
5-7

With a maximum voltage of 15.6 volts, the maximum straight and level
speed which Icarus Rewaxed flies at is 75 ft/s. The motor RPM at this speed is
16150 with a power draw of 115 W, still within the 16500 RPM maximum motor
speed of the Astro 15 motor. The addition of another battery was not used
efficiently because motor speed limitations preventedlcarus Rewaxed from
increasing its maximum velocity. Since takeoff parameters were met with 15.6
volts, another battery would only be a cost and weight liability. The battery
drain for cruise velocities ranging from the takeoff velocity of 29 ft/s to the
maximum velocity of 75 ft/s were compared for a 30000 ft range using the RPV
program. To take advantage of the 15.6 volts available, Recent Future, Inc.
wanted to cruise at as high a velocity as was practical. Recent Future, Inc.'s
initial cruise speed objective of 60 ft/s only required 1300 mah batteries.
However, an increase in cruise speed was worth the cost to upgrade to 1400 mah
batteries ($4.00 per cell - 1300 mah vs. $4.50 per cell - 1400 mah). With 1400 mah
batteries, Icarus Rewaxed cruises at a speed of 72 ft/s, 12 ft/s above the 60 ft/s
design objective, for the design range of 30000 ft. This required a voltage of 14.9
volts and a current draw of 11.7 amps, resulting in a battery drain of 1361 mah
(see Appendix E for RPV printout at cruise speed). Icarus Rewaxed has 25 mah in
reserve for taxi and landing.
5.5 MOTOR CONTROL AND INSTALLATION
The propulsion system allows the pilot to change the power available
from the motor and hence the velocity of the aircraft by incorporating a speed
control. The pilot uses 100% throttle to takeoff and climb. Once achieving
altitude, the pilot then throttles back to approximately 45% throttle to maintain
an indoor flight speed of 30 ft/s. When outdoors, the pilot throttles back to 95%
5-8

throttle to maintain a design cruise speed of 72 ft/s. During a turn or an increase
in altitude, the pilot will slightly increase throttle.
The motor was installed in the nose of the aircraft and the batteries were
housed in the wing carry-through structure. The speed controller, avionics
battery pack, and receiver were fixed in the fuselage above the wing.
5.6 PROPULSION AND CONTROL SYSTEMS SUMMARY
Table5.4 gives a breakdown of the components of the propulsion and
control systems for the aircraft.
Table 5.4: Propulsion and Control System Components
Component
Motor
Propeller
Batter Pack
Speed Controller
Servos
Type Weight (oz) Cost
Astro 15 7.5 $107.00
Zingali 10-8 1.552 $15.00Panasonic 1400
(13 batteries)
Tekin
Futuba
1.70 oz per battery
22.1 oz in pack1.80
2.223
$59.00
$50.00
$105.00
Receiver Futuba .95 $35.00
Futuba 2.0 $10.00
Futuba N/A $75.00
Total Weight = Total Cost =
38.13 oz $456.00
Avionics BatteryPack
Transmitter
The current propulsion system provides adequate performance for Icarus
Rewaxed to cruise at 72 ft/s for a 30000 ft range. 13 Panasonic 1400 mah batteries,
at 1.2 volts per battery, provides the necessary power to takeoff in 28 ft and
allows access to any airport in Aeroworld. At full throttle, Icarus Rewaxed can
takeoff at 29 ft/s and climb at a rate of 11.7 ft/s.
5-9

References:
5 - 1. Batill, Stephen F., "Prop 123," Fortran Computer Code, Department of
Aerospace and Mechanical Engineering, University of Notre Dame, 1993.
5-2. Dunn, Patrick F., "RPV Spreadsheet," Excel Computer Code, AE454
Propulsion, Department of Aerospace and Mechanical Engineering,
University of Notre Dame, 1993.
5 - 3. Batill, Stephen M., "Takeoff Performance," Computer Code, Department of
Aerospace and Mechanical Engineering, University of Notre Dame, 1993.
5 - 4. Dunn, Patrick F., "AE 454 - Lecture No. 18," Department of Aerospace and
Mechanical Engineering, University of Notre Dame, 1993.
5- 10

6.0 WEIGHT & BALANCE
6.1 WEIGHT ESTIMATE
The initial weight estimate as set in the DR&O was 4.5 lbs., but as the
design progressed it was soon found that this was much less than could be
achieved. Although the aircraft was required to carry only six passengers, as
opposed to 100 in previous aircraft, the payload contributes a very small
percentage of the total weight. The greatest percentage of the weight is due to
the engine and batteries. Because these components are the same as those used
in previous Aeroworld models, the proposed aircraft did not weight
substantially less than previous models. Because this aircraft was required to
take off from an unprepared surface with 3 inches of grass, larger landing gear
was needed, therefore increasing the weight. Initial estimates of some
components (such as servos, receiver, engine) remained constant throughout the
design, since they could be measured by the design team. The structural
components and propulsion system provided the greatest variation in aircraft
weight. Throughout the design phase, the number and type of batteries used
varied, thereby varying the weight. Initial estimates of the wing, fuselage, and
empennage structure were made based on data from previous airplanes, plotting
weight of component versus total weight of aircraft. As the structural design
became more specific, better estimates were achieved. Many components were
slightly overestimated since it was difficult to predict the weight contributed by
such things as glue. It was believed that a predicted weight greater than the
actual weight would be better than an underestimated weight, since an
underestimated weight could jeopardize the performance of the aircraft. K the
actual weight were less than the predicted weight, the airplane would perform
better than predicted, having a higher maximum cruise speed, longer range, and
6-1

shorter take off distance. The most difficult components to predict were the
structural components, such as the wing, empennage, and fuselage. In order to
predict these components more accurately, the materials which they consisted of
were first determined. Then a detailed structural analysis was performed to
determine how the structure was to be constructed (ie., truss, airfoil). Once this
was known, the size of the various materials was determined. Knowing the
density of each material, and the volume needed, the weight was computed.
Table 6.1 and Figure 6.1 show a breakdown of component weights.
6-2

Table 6.1: Detailed Weight Breakdown
Component Weight (oz) Location
(inches from nose)
Propulsion:
engine (incl mount &
gearbox)
propellerbatteries
avionics battery pack
speed controller
Structure:
Wing
Fuselage sections
enginefront
middle
tail
Vertical Tail
Horizontal Tail
Avionics:
elevator servo
rudder servo
aileron servo
receiver
Landing Gear:.
Main gear tires
Main gear struts
Tail gear tire
tail gear strut
Empty Total
Payload (passengers)
Total
10.30 (known)
1.552 (known)
22.10 (known)
2.00 (known)
1.80 (known)
17.02 (est.)
1.97 (est.)
3.95 (est.)
4.24 (est.)
6.67 (est.)
1.31 (est.)
2.76 (est.)
0.74 (known)
0.74 (known)
0.74 (known)
0.95 (known)
1.16 (est.)
3.20 (est.)
0.14 (est.)
0.23 (est.)
83.57
0.53 (known)
84.10
3.00
0.0
17.35
24.25
12.75
17.93
4.19
9.63
20.00
35.38
39.40
39.40
26.50
26.50
21.25
24.25
15.42
16.37
41.60
41.42
6-3

Figure 6.1: Weight Fractions
4/z__,,,,,,,_/b 34_ 0_6 % [] Wing
,S, ",i ,"!,"!",,"",,"",ii ,"",_i____ii_ii__ 3.8% [] Fuselage
5.3 % [] Empennage[] Propulsion
5.1 • Payload
[] Avionics
% [] Landing Gear
20.2 %
6.2 CENTER OF GRAVITY
The calculation of the center of gravity was crucial to the design because
many of the stability and control calculations were based on the center of gravity
location. Based on previous models in this class of airplanes, the center of
gravity should be located between 25% and 30% of the mean aerodynamic chord
of the wing. The final estimate of CG for this design was 29% MAC. The Y-
location of the CG was 9.11 inches from the ground, located in the wing. A
weight and balance diagram is shown in Figure 6.2. The CG location was greatly
influenced by the internal layout. The engine and batteries had a great impact on
the CG location due to their large weight fractions of 45%. The batteries were
required to be placed in the wing carrythrough, and the engine was placed at the
front of the aircraft. In addition, many parts come with a fixed length of wire.
While additional wire could be ordered, this would increase the aircraft cost.
Because the DR&O includes an objective on low cost, it was decided not to order
additional wire. This caused difficulty in varying the internal configuration, so
6-4

to attain a CG location within 25-30% MAC. The center of gravity did not travel
a significant amount since the only payload was the six passengers. The
maximum CG travel was 0.33% MAC. This occurred when five passengers were
removed. The sixth, the pilot, was assumed to remain on the aircraft at all times
during flight.
6-5

!
ct_
oe
_.ao
=rii
l_ae
_t Speed,I E_Ln_ine°° ° Co_ier _ oa_to___)BaiLegiesA_uer°n Receiver / IRudder/ Passengers o Q _o
CG located at 29% MAC
_o-] indicates component center of gravity
(exact component locations shown in table 6.1)

7.0 STABILITY AND CONTROL SYSTEM: DESIGN DETAIL
The primary objective of the stability and controls group was to perform
analysis to ensure the stability of the aircraft. This analysis, coupled closely with
the center of gravity position, consisted primarily of the sizing and placement of
the various aerodynamic and control surfaces used to stabilize, trim, and
maneuver the aircraft. The goal of the analysis was to provide an aircraft that is
statically stable and exhibits benign handling qualities such that it can be flown
not only bya professional, but a novice as well.
7.1 LONGITUDINAL STABILITY
The primary figure of merit for longitudinal stability was the slope and
intercept of the curve depicting the linear relationship between the pitching
moment about the center of gravity and angle of attack. In the case of the present
study, the relevant angle of attack is that of the wing (Xw, which can be defined as
the sum of the angle of attack of the fuselage reference line (O_FRL) and the
incidence angle of the wing (iw). For the aircraft to possess longitudinal static
stability, it is required that the slope of the curve (CMc_) must be negative and the
intercept (CMo) must be positive, thus allowing for the aircraft to be trimmed at
positive angles of attack. The methodology used in the development and
analysis of the relevant equations governing the static stability was modeled after
that given in Reference 7.1. It is noted that the contribution of the fuselage to the
longitudinal stability was neglected throughout the analysis as it was assumed to
be small in comparison to the contributions of the wing and tail.
Inherent in the analysis was the necessity of setting the incidence angles of
the main wing and horizontal tail such that the drag at the high-speed cruise
configuration was minimized. This minimum drag condition was taken to occur
when the angle of attack of the fuselage with respect to the relative wind was
7-1

zero. An additional constraint was imposed such that the elevator deflection
necessaryat high-speed cruise was essentially zero, again to minimize drag in
hopes of achieving the highest possible cruise speed. The method used to obtain
the necessaryincidence angles is described in the Appendix.
The first stagesof the analysisconsisted of a trade study aimed at
determining the relative sensitivity of the aircraft's longitudinal stability to
variations in volume ratio by varying the moment arm to the quarter chord of the
horizontal tail aswell asthe span and chord of the tail surface. This first
analysis, done with the incidence angleof both the wing and tail set at zero
degrees,showed that the longitudinal stability was affected more by variations in
span than by changes in the chord length. In light of this result, a chord of 8
inches was chosenfor aerodynamic reasonsasit kept the Reynolds number of
the horizontal tail larger than 130,000throughout the flight envelope. In doing
so, it was hoped that the rather unpredictable behavior seenat Reynolds
numbers lessthan 130,000(SeeReference7.2) could be avoided, alleviating
potential stability and control problems during critical stagesof flight such as
takeoff and landing. Thus, with the chord set at 8 inches the span of the
horizontal tail as well asthe moment arm to the tail surfacewere varied to
determine their relative effect on the aircraft's stability. Representativeresults
from this study areshown below in Figure 7.1with a moment arm of 23 inches
from the aircraft center of gravity to the quarter chord of the horizontal tail.
7-2

Figure 7.1: Variation of Longitudinal Stability with Span and Tail Incidence
I _ b=16in [ _____ b=22in !
b = 20 in 0.05 _ b = 24 in
0.05 . __ _ b=22in0 1 I + b=24in 0_
-0_0.51_L_..___b=28in _0.05__k_l __L---O- b=24i...._n
-0.1- "lk_ k_ _ it='3°
-0.2 ,, ...... _ -0.2- _=]Si_c_e ]
4-2 0 2 4 6 8 1012 4-2 0 2 4 6 8 1012
Wing Angle of Attack (deg) Wing Angle of Attack (deg)
From the figure on the left, it was noted that with the chord fixed at 8 inches, the
aircraft became increasingly stable as the span was lengthened. As can be seen,
each curve in the figure to the left has a negative slope and thus satisfies the static
stability requirements to some extent. The intercept of each of these curves,
however, is negative - implying that these configurations do not allow for
trimming of the aircraft at positive angles of attack. By varying the incidence
angle of the wing and tail, these curves can be altered such that their intercept is
changed while their slope remains the same. For the purposes of this study, the
wing incidence was left at a nominal value of zero degrees with respect to the
fuselage and the tail incidence was varied from zero to six degrees. It is noted
that it is the relative difference between wing and tail incidence that affects the
stability, not the value of each individually (i.e. a wing incidence of 1.5 ° and a tail
incidence of -1.5 ° would yield the same results). Through a series of plots like
those shown above, the set of possible solutions was narrowed to a region
starting with a minimum chord of 8 inches and a minimum span of 22 inches. At
this point, a buffer was inserted to account for the slightly destabilizing effect of
7-3

the fuselagewhich had previously been neglected. A parallel study was also
conducted to include the effect of the variation in moment arm to the
longitudinal stability. Through inspection of the results of these two studies, it
was determined that, for a moment arm of 23 inches,a solution which satisfies
the longitudinal stability requirements existswith achord and span of 8 inches
and 24 inchesrespectively for a rectangular horizontal tail. The pitching moment
equation for this configuration was thus found to be CM = 0.015- 0.01(zand the
resulting curve is shown in Figure 7.2below.
Figure 7.2" Pitching Moment Coefficient Curve for Design Condition (Be = 0 °)
0.08 -
0.06;
0.04 -(
-0.06 -"
-0.08 -"
-0.1 -"
-0.12 -"
-4
I I I I I ICM = .015 - 0.01_ m r.I t i i I I
"1)
-2 0 2 4 6 8 10 12 14
Wing Angle of Attack (deg)
Throughout the study, the strong coupling between the weight/balance and
stability of Icarus was readily apparent. Through several iterations, the suitable
configuration above was found which yielded a static margin of approximately
14 percent and a CG position of roughly 29 percent of the mean aerodynamic
chord from the leading edge of the main wing.
Having found an acceptable configuration, the design of Icarus seemed to
ensure a certain degree of longitudinal static stability. As the stability of the
aircraft depends heavily on the position of the center of gravity, however, it
could be significantly affected by variations from the design point which may
7-4

occur in the actual manufacturing stageof the design. As a checkon this, a
sensitivity to CG placement was performed by assuming a CG travel of several
inches fore and aft of the design point with all other parameters (tail area,overall
length, etc.) held fixed at their design locations and sizes. The results of this
study areshown below in Figure 7.3,which shows the impact of effectively
lengthening or shortening the moment arm to the quarter chord of the horizontal
tail surface.
Figure 7.3: Sensitivity of Longitudinal Stability to CG Position (_ie = 0 °)
0.15 -
0.1 _
-0.052_-0.I-
-0.15 --"
-0.2-
-0.25 -
-0.3-"-4 -2 0 2 4 6 8 10 12
Angle of Attack (deg)
Position of Center of Gravity
I) Neutral Point @
| xc.g. = 19.5" from nose
IDesign point @
xc.g. = 17.9" from nose
design-l"
design - 2"
design + 1"
design + 2"
NP (19.5"...@..
from nose)
design pt(17.9" from
nose)
From the figure, it can be seen that the stability of the aircraft is quite sensitive to
the location of the center of gravity and thus the effective length of the moment
arm. As the CG moves forward of the design CG location, the slope of the curve
is seen to become more negative thus making the aircraft more stable. A CG
location just two inches behind the design point, however, causes the slope of the
curve to be positive and causes the airplane to become statically unstable. Thus,
throughout the manufacturing process, careful management of the CG location
7-5

will be necessaryto ensurethe longitudinal stability of the aircraft through the
validation phase of Icarus.
7.2 LONGITUDINAL CONTROL - ELEVATOR SIZING
The elevator for Icarus was sized using consideration of takeoff
performance as well as the ability to trim the aircraft at landing. These two
requirements were weighed against one another to determine which was the
more stringent and vital to the design. It is also important to be able to trim the
aircraft at its cruise configurations. Since the indoor, low-speed cruise of Icarus is
quite close to its landing speed, however, it was felt that the requirement to trim
at landing would allow for trimming the aircraft at low speeds as well. The high
cruise speed objective of Icarus did not weigh heavily on the decision making
process since the incidence angles were set to alleviate the need for an elevator
deflection in the high-speed configuration.
7.2.1 TAKEOFF CONSIDERATIONS
The first consideration in sizing the elevator surface was the takeoff
performance of the aircraft. Since Icarus" configuration was that of a tail-
dragger, prior to taxiing, the fuselage (and thus, the wing) was at an angle of
attack relative to the ground. For the purposes of this study, the fuselage angle
was set such that the wing would be at an angle to allow it to provide sufficient
lift to meet the takeoff requirements imposed by the group.
It was proposed that as the aircraft began its takeoff roll, a force produced
by an elevator deflection would cause the aircraft to rotate about the contact
point of the main gear. As this occurs, the rear wheel rises off the ground and the
fuselage becomes parallel to the ground; this is done so as to accelerate down the
runway in a minimum drag or "cruise-like" configuration. It was believed that
7-6

this would allow Icarus to be able to takeoff within the ground roll requirement
of 28 feet as set by the group in the DR&O.
To determine the elevator size for this rotation to a level attitude, a free-
body diagram of the aircraft in a taxiing configuration was drawn. Through
consideration of the moments acting about the contact point of the main gear, it
was possible to determine the size of the elevator as well as the amount of
deflection required to accomplish the rotation. Once at the minimum drag
configuration, it was assumed that the elevator control power was adequate to
rotate the aircraft to the necessary takeoff orientation at the appropriate distance
down the runway. To assess how the velocity changes with distance along the
runway, data was taken from takeoff.f (Reference 7.3). By curve-fitting the
output of this code as shown in Figure 7.3, an empirical relationship between
velocity and distance was found. This relationship was used to model the
aircraft's velocity during the first 6 feet of ground roll (a distance arbitrarily set at
which the aircraft should be level, approximately 1/4 of the distance covered
prior to rotation and lift off). In doing so, the moment coefficient required to
rotate the aircraft to its minimum drag configuration was found to be 0.402. By
varying the size and deflection angle of the elevator, the control power was
adjusted such that it was able to overcome this moment. The design
configuration, consisting of a span of 26 inches and a chord of I inch, provided a
moment coefficient of 0.428, sufficient to achieve the rotation through an elevator
deflection of 20 ° .
7-7
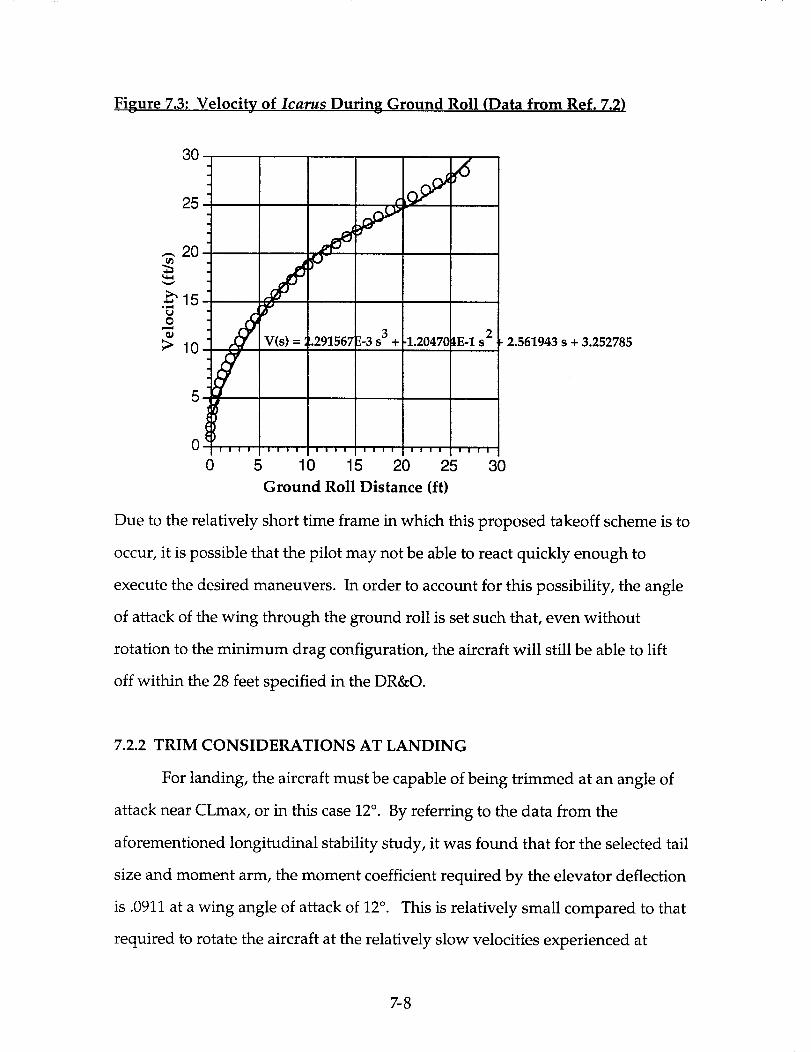
Figure 7.3: Velocity of Icarus During Ground Roll (Data from Ref. 7.2)
3O
25
... 20
._15
o
;_ 10
5
O,
/V(s) = !.291567_.-3 s 3 + ,1.20470tE-1 s 2
0 5 10 15 20 25 30
Ground Roll Distance (ft)
2.561943 s + 3.252785
Due to the relatively short time frame in which this proposed takeoff scheme is to
occur, it is possible that the pilot may not be able to react quickly enough to
execute the desired maneuvers. In order to account for this possibility, the angle
of attack of the wing through the ground roll is set such that, even without
rotation to the minimum drag configuration, the aircraft will still be able to lift
off within the 28 feet specified in the DR&O.
7.2.2 TRIM CONSIDERATIONS AT LANDING
For landing, the aircraft must be capable of being trimmed at an angle of
attack near CLmax, or in this case 12 °. By referring to the data from the
aforementioned longitudinal stability study, it was found that for the selected tail
size and moment arm, the moment coefficient required by the elevator deflection
is .0911 at a wing angle of attack of 12 °. This is relatively small compared to that
required to rotate the aircraft at the relatively slow velocities experienced at
7-8

takeoff - thus it appeared that the rotation requirement hasmore bearing on the
ultimate sizing of the elevator. Taking the design areaand moment arm to be
fixed by static stability considerations, the parameters to bevaried were thus the
ratio of the elevator chord to the chord of the horizontal tail (implicitly, "¢,the
flap effectiveness)and the maximum deflection of the aileron.
For the purposes of this design, I: was taken to be determined by the ratio
of chords through referenceto Figure 3.32of McCormick (Reference7.4)which is
based on results of thin-airfoil theory. Thus, for a given deflection, the chord of
the elevator was varied until the moment created by the down force on the tail
was sufficient to trim Icarus at its landing configuration. A combination of
parameters that satisfied this requirement was found with a maximum deflection
angle of _+20° (as set by the rotation requirements at takeoff) and an elevator
chord to I inch which corresponds to a flap effectiveness on the order of 45%.
The effect of the selected elevator configuration on the pitching moment curve,
shown below in Figure 7.4, verifies the ability of the elevator to trim the aircraft
at landing.
7-9

Figure 7.4: Variation of Trim Condition with Elevator Deflection
0.3
0.2 _
01
u [m pl -"-_,..._ i1:i"-0.2 ]_4{ s_ "_..._K din_
-0.3 ]"-f]
-0.4
4 -2 0
CZcruise
2 4 6 8 10_ 121,
°ttakeoff (Zstall
Wing Angle of Attack (deg)
8 e = -20 °
8 =-10 °8
8 e = 0°(DESIGN)
Be= 10 °
8 e = 20 °
Table 7.1 Summary of Longitudinal Stability and Control
TAIL AREA (in 2) MOMENT ARM (in) ELEVATOR AREA (in 2)
224.0 23.0 26.0
Ch/[ O Ch/[ (x Ch/[ 8e 8e @ CRUISE MAX 8e
(rad'l) (rad'l) (deg) (deg)
0.021 -0.659 -0.644 0 ° __.20
7.3 LATERAL STABILITY
The primary objective of the consideration of lateral stability was the
sizing of the vertical tail surface. The lateral stability for Icarus was determined
through the requirement that for directional or weathercock stability, Cn[3 for the
aircraft must be greater than zero. This implies that for a given sideslip angle,
the net force created is such that the airplane becomes aligned with the direction
7-10

of relative wind. As this requirement setsthe sign on the coefficient rather than a
distinct value, the desired magnitude is unknown. This deficiency was
reconciled through the compilation of a secondarydata baseof vertical volume
ratios for past RPV's. The vertical volume ratio is defined as V v - Svlv where
Swb
Sv is the area of the vertical tail surface, and b is the span of the wing. From this
data base, an average Vv was found to be in the range of 0.015 to 0.03. Thus, the
root and tip chords as well as the height were chosen such that the vertical
volume ratio fell within this range. At the same time, with this set of parameters,
the sign on Cn_ was verified to be greater than zero, having a value of 0.0474.
7.4 LATERAL CONTROL
The sizing of the rudder was accomplished through the consideration of a
possible landing in a cross wind (perpendicular to the intended flight path) of 10
ft/s or approximately 7 miles/hour in magnitude. A crosswind of this
magnitude would induce an effective sideslip angle of roughly 20 ° which
corresponds to a yaw moment coefficient, Cn, of 0.0163. This calculation
yielded precisely the yaw moment needed to be created through a rudder
deflection. Thus, in a fashion similar to that used for sizing the elevator, the
chord and deflection angle of the rudder were varied to find a suitable
combination which could counteract the aircraft's tendency to yaw, allowing
Icarus to land at a given sideslip angle. The rudder chosen for this design was of
rectangular planform having a chord of 4 inches and a span of 10.5 inches.
Through inspection of past generations of Aeroworld planes, it was noted that
our rudder size, in particular the chord, is somewhat larger than past designs.
The rather large rudder chord was justified through consideration of the dual
mission (high and low-speed cruise) of Icarus. Since the incidence angles of the
7-11

wing and tail areset for minimum drag at cruise,Icarus will be forced to land at a
considerably higher angle of attack than past generations of Aeroworld planes
which set their incidence angles for low-speed cruise. At this larger angle of
attack, it is possible, due to the relative position of the vertical tail with respect to
the main wing, that the effectiveness of the rudder be washed out by the wake off
the wing - a problem hoped to be prevented through our rudder sizing.
7.5 ROLL STABILITY
According to the objectives set forth by Recent Future, Inc., Icarus is to
have relatively benign handling characteristics. Inherent in this is that the
aircraft exhibit a certain degree of roll stability when subjected to gusts or other
forces causing the wings to be disturbed from a wings-level attitude. For the
aircraft to be stable in ro11, the coefficient C1_ (not to be confused with the lift-
curve slope) which is commonly denoted as the "dihedral effect," must be less
than zero. As the destabilizing effect of the fuselage to roll stability is difficult to
quantify, a dihedral angle of 5 ° was chosen for the main wing which led to a CI_
of -.099/radian. It was hoped that this was of sufficient magnitude to counter the
effect of the fuselage.
7.6 ROLL CONTROL
7.6.1 GENERAL CONSIDERATIONS: CONTROL SELECTION
The roll characteristics of Icarus were governed by two issues. First, it was
desired for the aircraft to be able to perform a coordinated turn, eliminating the
tendency seen in observation of previous designs to slide through turns. Second,
since Icarus is to have relatively benign handling characteristics, the roll rate as
well as the angle of attack necessary to complete the turn must be controlled such
7-12

that even inexperienced pilots canperform rolling maneuvers. To this end, a
decision was made to fit Icarus with aileron control surfaces rather than relying
on the coupled rudder-dihedral turning philosophy implemented on past
designs. In reaching this decision, consideration was given to the course that
must be flown during the indoor portion of the prototype validation. As
mentioned in section 7.3, due to the relative position of the vertical tail with
respect to the main wing and the angle of attack necessary for low-speed flight, it
was thought that the effectiveness of the rudder would be washed out by the
wake shed from the main wing. If this were to occur, Icarus' turning
performance would be seriously degraded if it relied on rudder-dihedral to turn.
With aileron control, however, the turn performance should not be affected by
the relatively high angle of attack required for turning as well as level flight at
the low speed cruise configuration.
7.6.2 SIZING AND PLACEMENT OF AILERONS
Sizing of the ailerons was accomplished assuming both steady roll rates
and turns through a trade study aimed at determining the sensitivity of the
roll/turn performance to the sizing and placement of the ailerons. A limitation
of the method used for estimating the effectiveness of the ailerons was the
assumption that a strip theory analysis is valid and that the lift distribution
across the aileron is uniform where in fact it is not. Despite these limitations,
however, the relative roll control for various aileron configurations was assessed
by varying the relative positions of the inboard and outboard edges of the aileron
surfaces as well as the ratio of aileron to wing chord and observing the
corresponding steady roll rates. The results of this study are shown in Figure 7.5
below.
7-13

Figure 7.5: Variation of Roll Rate with Aileron Sizing and Placement
70 Aileron Width, W (inches)End of Tempered Steel Rod
60 """"""'_ j__" _ W=5indE-
40 W- . in__,£3... d_ + W= 10in
_,lJ r--_4.d I
- r._.-..,.r ,,_ .,e,'_- De0"_ "_D"'_ " _"_s Band + W=12.5in30 ,,_,, ired Performance
20_aaa_a_a__ _ -c_ W=15in..... --O-- W = 17.5 in
10_ _ W= 20in
01 , , I , I , I ,10 15 20 25 30 35
Distance to Inboard Edge of Aileron From Centefline (in)
As specified in the DR&O, Icarus must be able to complete a 60 foot radius turn at a
speed of 25 feet per second. In doing so, Icarus must obtain a bank angle of
roughly 20 degrees. It was reasoned through consideration of the relative size of
Icarus and the speeds at which it will fly that the aircraft should be able to obtain
this required bank angle for a steady turn in approximately one second. This was
done mainly by deciding that a time of two seconds or more represented a slow
response, whereas a time less than one second seemed rather abrupt and was
assumed to cause aerodynamic loads higher than those allowable to be
experienced by the structure. The results of the sensitivity studies on roll rate
alone thus showed many acceptable sizing and placement combinations.
Further considerations however, led to the closer examination of the bank
angle required for the completion of a turn of a given radius. This bank angle
7-14
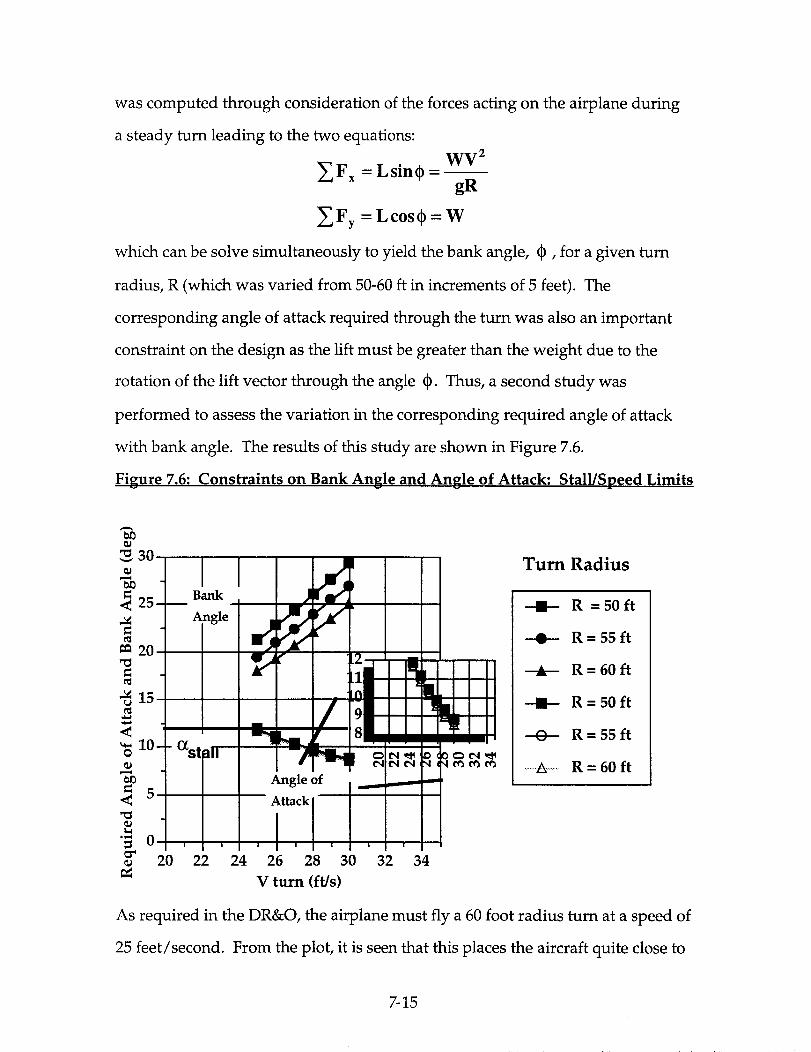
was computed through consideration of the forces acting on the airplane during
a steady turn leading to the two equations:
_F x : Lsinq_ -WV 2
gR
_Fy = Lcosq_ = W
which can be solve simultaneously to yield the bank angle, q_, for a given turn
radius, R (which was varied from 50-60 ft in increments of 5 feet). The
corresponding angle of attack required through the turn was also an important
constraint on the design as the lift must be greater than the weight due to the
rotation of the lift vector through the angle _. Thus, a second study was
performed to assess the variation in the corresponding required angle of attack
with bank angle. The results of this study are shown in Figure 7.6.
Figure 7.6: Constraints on Bank Angle and Angle of Attack: Stall/Speed Limits
.
20 22 24 26 28 30 32 34
V turn (ft/s)
Turn Radius
---II-- R =50ft
R=55ft
R=60ft
--l-- R= 50 ft
---O-- R= 55 ft
.......A ........R = 60 ft
As required in the DR&O, the airplane must fly a 60 foot radius turn at a speed of
25 feet/second. From the plot, it is seen that this places the aircraft quite close to
7-15

its stall angle. In order to avoid this, it was decided that the airplane will turn in
the range of 26-28feet per second. In doing so, Icarus will obtain a bank angle
between 19 and 25 degrees depending on the radius of the turn. Coupling these
two analyses, an acceptable aileron configuration was chosen such that the
desired bank angle was reached within approximately one second and the
required angle of attack through the turn was not in excess of the stall angle of
the wing at approximately 12.5 ° .
Table 7.2: Summary of Lateral/Roll Stability and Control
MOMENT ARM VERTICAL TAIL RUDDER AREA MAX 8r
(in) AREA (in 2) (in 2) (deg)
22.0 71.5 42.0 __.30
AILERON AILERON AILERON MAX 8a
INBOARD EDGE OUTBOARD EDGE CHORD (deg)(in) (in) (in)
24.0 36.0 1.0 __.15
7-16
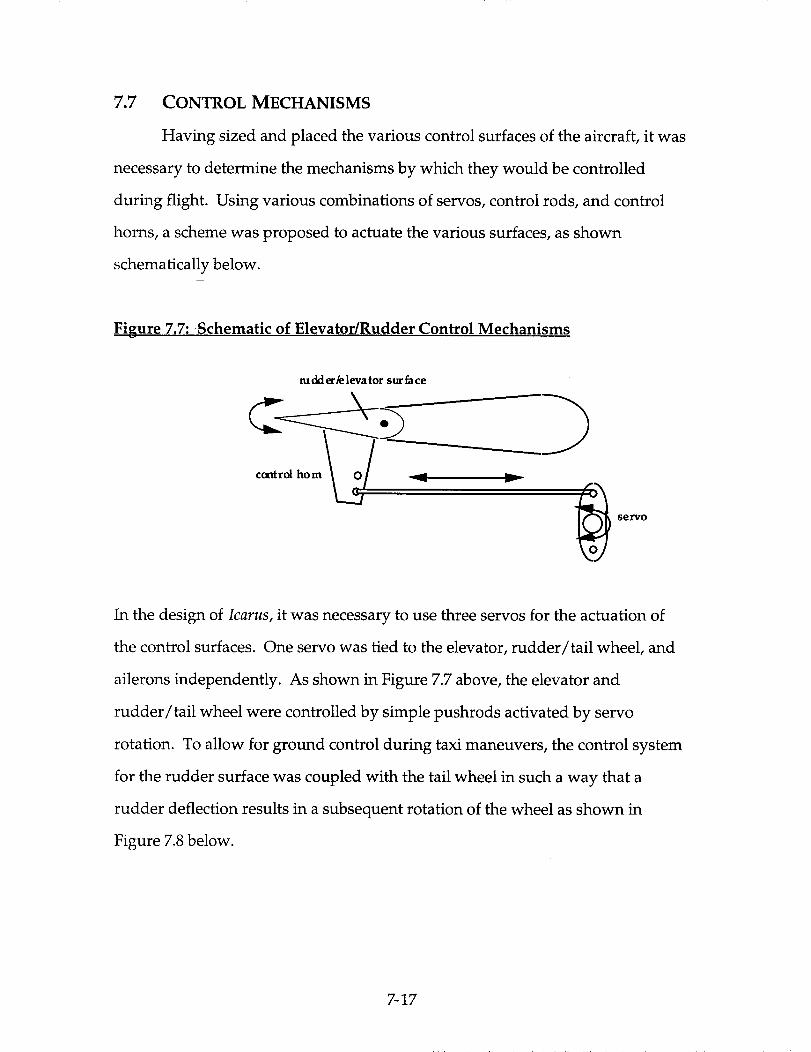
7.7 CONTROL MECHANISMS
Having sized and placed the various control surfaces of the aircraft, it was
necessary to determine the mechanisms by which they would be controlled
during flight. Using various combinations of servos, control rods, and control
horns, a scheme was proposed to actuate the various surfaces, as shown
schematically below.
Figure 7.7: Schematic of Elevator/Rudder Control Mechanisms
ru dd _/elevator surface
y
servo
In the design of Icarus, it was necessary to use three servos for the actuation of
the control surfaces. One servo was tied to the elevator, rudder/tail wheel, and
ailerons independently. As shown in Figure 7.7 above, the elevator and
rudder/tail wheel were controlled by simple pushrods activated by servo
rotation. To allow for ground control during taxi maneuvers, the control system
for the rudder surface was coupled with the tail wheel in such a way that a
rudder deflection results in a subsequent rotation of the wheel as shown in
Figure 7.8 below.
7-17

Figure 7.8: Schematic of Rudder/Tail Wheel Linkage and Control
to rudd_toservo
Thus, during the ground roll, an input from the pilot to the rudder servo would
be coupled through the linkage to the wheel and result in a turn in the direction
specified. The ailerons, however, were controlled in a different manner. Rather
than through the direct pushing or pulling of a control horn, the control of the
ailerons was accomplished through the use of a z-bend wire, the mechanism of
which is shown below in Figure 4.9.
7-18

Figure 7.9: Schematic of Aileron Control Mechanism
aileronsurface
,/,.
i
pivot point
!
The aileron surface used in this design is composed of a solid balsa trailing edge
piece which is roughly triangular in cross-section. By boring out a hole in the
aileron, it was possible to embed the z-bend wire directly in the aileron surface.
Epoxyed within the aileron, the wire was bent to run along the trailing edge spar
of the wing (not shown) and then, once within the wing carry-through, the wire
was subsequently bent upwards where, through a connection, it was tied to a
control rod. This control rod is linked to a servo placed slightly forward within
the fuselage. In this manner, motion of the control rod results in a rotation of the
wire about its pivot point and thus in a deflection of the aileron.
7-19
References:
7.1. Nelson, Robert C. Flight Stability and Automatic Control. New York: Mc-
Graw-Hill, Incorporated, 1989.
7.2. Selig, Michael S., Donovan, John F., and Fraser, David B. Airfoils at Low Speeds.
Virginia Beach: H.A. Stokely, publisher, 1989.
7.3. Takeoff Performance Code: takeoff.f. Coded by Dr. Stephen Batill and
Supplied for Use by AE441 Design Class.
7.4. McCormick, Barnes W. Aerodynamics, Aeronautics, and Flight Mechanics.
New York: John Wiley and Sons, 1979.
7-20
8.0 PERFORMANCE
8.1 REQUIREMENTS AND O BJECTIVES
Once the aerodynamic forces were calculated and the propulsion system
selected, performance estimates for the aircraft were made. The key sources for
these estimates were the computer programs PROP123, Takeoff Performance,
and Electric-Performance (Ref. 8.1, 8.2, and 8.3). The objectives had for the
performance results were a high cruise speed, a takeoff distance of no greater
than 28 feet, and a range of at least 30000 feet so that every airport in Aeroworld
can be reached non-stop. Table 8.1 gives a listing of the performance
characteristics of Icarus Rewaxed .
8-1

Table 8.1 Performance Characteristics
Takeoff Distance
Takeoff Thrust
Battery Drain @ Takeoff
Takeoff Velocity
Cruise Velocity
Minimum Velocity
Maximum Velocity
Stall Speed
Maximum Range
Endurance @ Max Range
Maximum Endurance
Range @ Max Endurance
Maximum Rate of Climb
Maximum (L/D)
Cruise (L/D)
Cruise Range
Cruise Endurance
Minimum Glide Angle
Minimum Radius of Turn
25.4 ft
2.734 lb
6.27 mahr
28.85 ft/s
72.0 ft/s
10.0 ft/s
75.0 ft/s
24.0 ft/s
38300 ft
890 s
1130 s
31700 ft
13.048 ft/s
13.94
7.02
30870
428.76 s
4.10 degrees
55.0 ft @ bank angle = 18 deg
8-2
8.2 CRUISE VELOCITY
The key part of performance from the design requirements and objectives
was the cruise velocity. The objectivewas to reach a cruise velocity of 60 ft/s for
a 30,000ft minimum range. When it was discovered that the cruise velocity
could be surpassedwhile still decreasingthe cost per flight, it was decided that
Icarus Rewaxed would fly at a higher throttle setting than that necessary to fly at
60 ft/s, with the number of batteries necessary for takeoff. This resulted in a
cruise velocity of 72 ft/s, which was the velocity from the throttle setting that
would not use up the battery capacity and still leave battery charge for takeoff
and turns. The addition of a fourteenth battery would have only pushed the
motor past its maximum rpm (our current cruise velocity rotates the motor at
15516 rpm, the maximum listed rpm is 16500).
8.3 TAKEOFF ESTIMATES
Takeoff distance was a key objective for this design. Since it was desired
to access every airport in Aeroworld, a 28 foot takeoff distance was required. In
order to takeoff in 28 feet, the number of batteries was determined in
combination with wing area and propeller. Since it was already determined that
the Zingali 10-8 propeller was the most efficient and put out the most thrust, it
was necessary to vary the wing planform area and number of batteries to find
which combination would be the most desirable while still allowing the aircraft
to takeoff in 28 feet. Using a conservative estimate for the friction coefficient
(0.15), it was found that with 13 batteries and a wing planform area of 7.5 ft 2
Icarus Rewaxed could takeoff in 27.99 feet. The same combination with a less
safe, yet more realistic, friction coefficient (0.05) allowed for takeoff in 25.39 ft.
8-3

The takeoff battery drain had little effecton battery capacity since only 0.5%of
our battery pack current (7.09mahr out of 1400mahr) was depleted.
In order to compute the performance characteristicsduring takeoff, a
program entitled Takeoff Performance (Ref 8.2) was used. Appendix E shows the
input and output for the program.
8.4 RATE OF CLIMB
Figure 8-1 shows the power available and power required as a function of
velocity for a range of power settings. From this graph it can be seen that using
the full voltage of the thirteen batteries (15.6 V), a maximum velocity of 75 ft/s
can be obtained. The minimum speed at this voltage is 10 ft/s. Figure 8-2 shows
the relationship between the maximum rate of climb and the cruise velocity. The
maximum rate of climb (13.048 ft/s) occurs at a velocity of 41 ft/s.
8-4

Figure 8.1 Power Required and Power Available Curves With Respect
140
120
100
toVelocity
!
A &80 _...-.4_
60 ]--4:]._ ,_ _,,,,
//_/t' ....k"t L40
0-
0 10 20 30 40 50 60 70 80
.-l--
0
---A--
Preq (W)
Pavail for 15.6 V (W)
Pavail for 14.85 V (W)
Pavail for 13.2 V (W)
Pavail for 12.0 V (W)
Pavail for 9.6 V (W)
Pavail for 7.2 V (W)
Figure 8.2 Determination of Speed Resulting in Maximum Rate of Climb
14 I_lax F:OC
12 f_
v
/o6-
4-
2/0-
0 10 20 30 40 50 60 70 80
Velocity (ft/s)
8-5

8.5 LEVEL TURN PERFORMANCE
The key to level turn performance is listed in the requirements, where it is
stated that the aircraft must be capable of performing a steady, level, 60 foot
radius turn at a velocity of 25 ft/s. The DR&O initially stated that our load factor
will not exceed 2. Examining the relation between the bank angle and the load
factor:
n = I/cos (_)
it could be seen that a bank angle greater than 60 degrees was not desirable. To
find the turn radius relationship:
R = V 2 / g * tan (_))
was used. In this relationship R and V were known, thus the required bank
angle was 18 degrees which corresponds to a load factor of 1.05, well below the
maximum load factor of 2.0. Substituting the stall speed of 24 ft/s for the aircraft
into this equation it was found that the minimum turn radius was 55 ft.
8.6 RANGE AND ENDURANCE
The range and endurance for the Icarus Rewaxed were compared against
velocity as shown in Figures 8-3 and 8-4. It is important to note that the values
for both endurance and range do not include the two minute allowance for
loitering. From these figures it can be seen that the maximum range of the
aircraft is 38,266.5 ft and occurs at a cruise velocity of 43 ft/s. The endurance for
this maximum range then is 889.92 s. The maximum endurance is 1132.06 s and
occurs at a cruise velocity of 28 ft/s. The range for the maximum endurance is
31697.02 ft. The values for the range and endurance came from an RPV program
in Excel which was modified to include the range and endurance (Ref. 8.3).
8-6
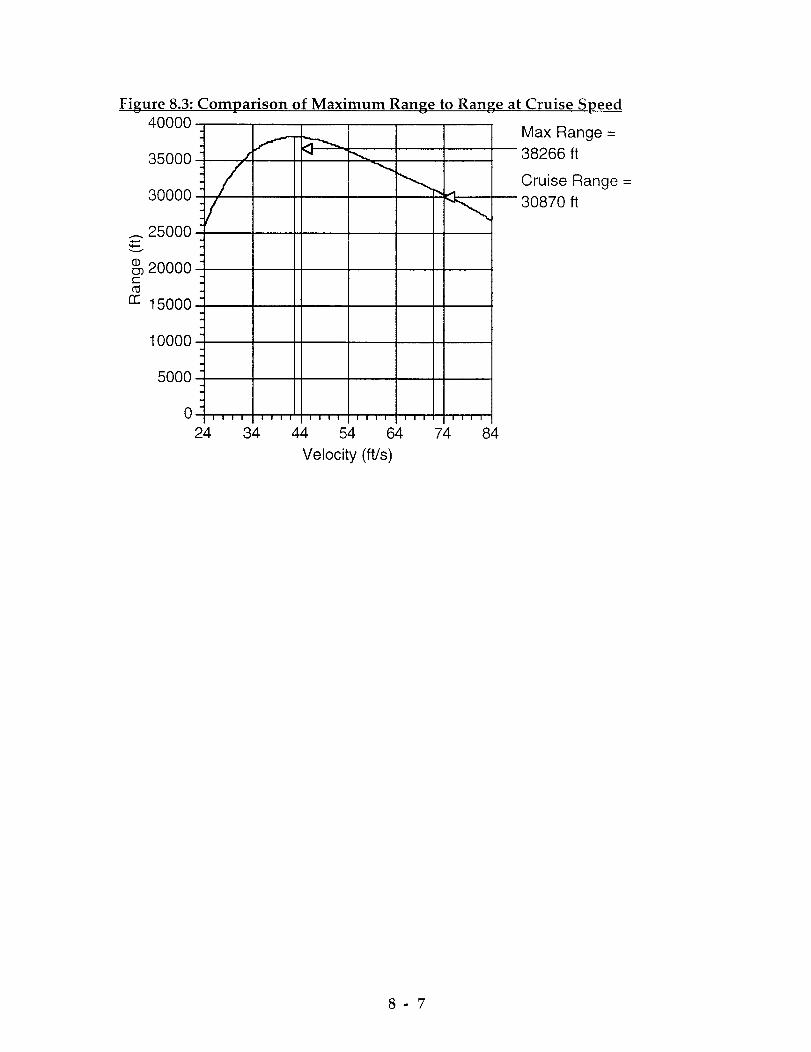
Figure 8.3: Comparison of Maximum Range to Range at Cruise Speed
40000 Max Range =
_ _ --38266 ft
35000 / -"" _ Cruise Range =30000 _ 30870 ft
.._.25000
20000c
15000
10000
5O00
.
24 34 44 54 64 74 84
Velocity(ft/s)
8- 7
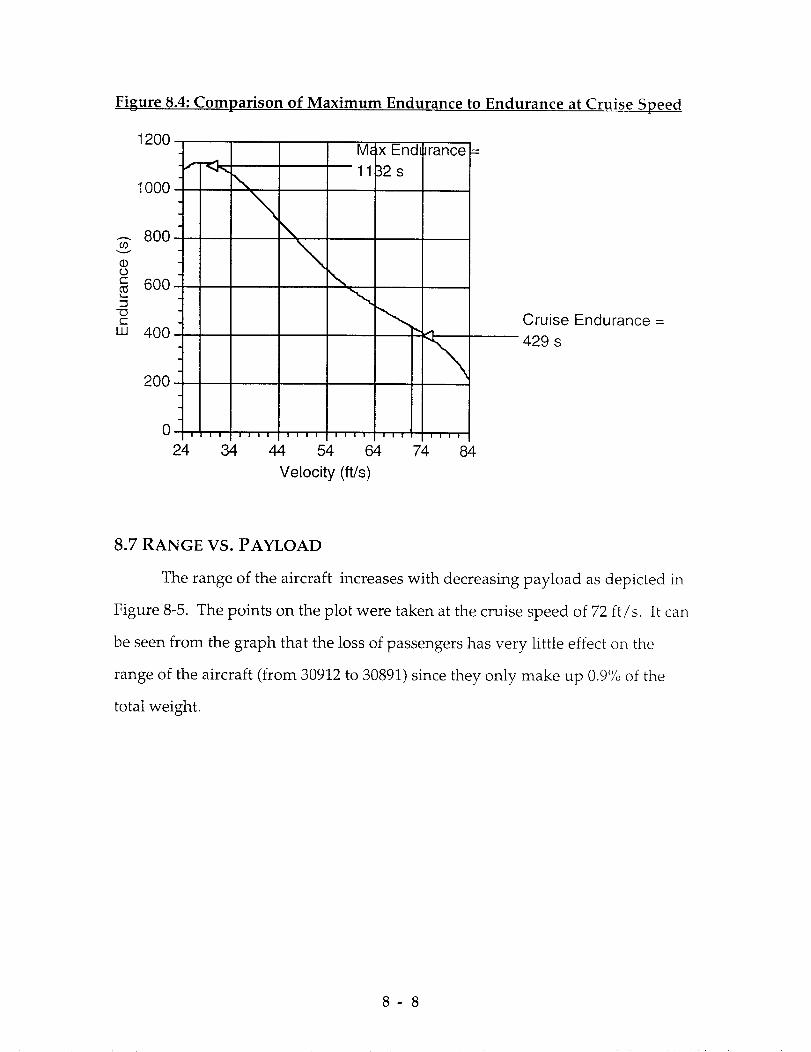
Figure 8.4: Comparison of Maximum Endurance to Endurance at Cruise Speed
(Dv
O90c-"C_k..
c'-W
1200 M_ x End_Jrance
f "<:F.. 11 32slooo ",
\800
600
\'""',.% Cruise Endurance
400
'X 429 s200
0
24 34 44 54 64 74 84
Velocity (ft/s)
8.7 RANGE VS. PAYLOAD
The range of the aircraft increases with decreasing payload as depicted in
Figure 8-5. The points on the plot were taken at the cruise speed of 72 ft/s. It can
be seen from the graph that the loss of passengers has very little effect on the
range of the aircraft (from 30912 to 30891) since they only make up 0.9% of the
total weight.
8-8
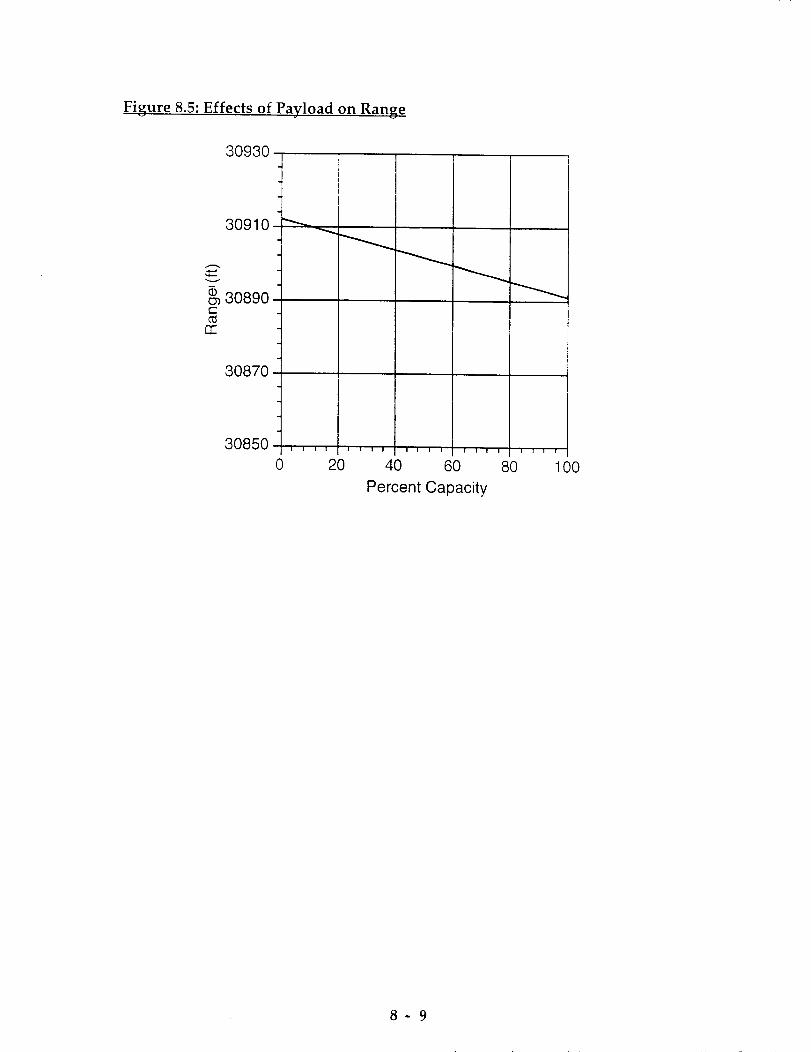
Figure 8.5: Effects of Payload on Range
30930
30910
30870q
308502 ....
0
d) 30890c
i i i i i i i i
2Oi i I i
40 6O
Percent Capacity
i i i i
80 1O0
8-9

References
8.1 Batill, S., "PROP123", Fortran computer Program, Universitv of Notre Dame
8.2 Batill, S., "Takeoff Performance", Fortran computer program, University ot
Notre Dame
8.3 Dunn, P., "RPV Performance" Excel computer program, AE 454 Propulsion
class, University of Notre Dame
8.4 Dunn, P.,"Ae 454-Lecture No. 18", Department of Aerospace and lVlechanical
Engineering, University of Notre Dame, 1993
8- 10

9.0 STRUCTURES AND WEIGHTS
The goal of the structures department was find a design that can safely
withstand the expected loading conditions, survive extreme flight conditions,
and accomplish the mission with a minimum weight. To meet this goal, the
following objectives were formulated in accordance with the Design
Requirements and Objectives (DR&O) established by Recent Future, Inc.:
Structures Group Objectives:
• Design the structure to maintain integrity under normal flightregimes. This flight envelope is defined to include takeoff and
landing impact loads, and flight load factor limits of 2.75 and -1.5.
• Provide adequate strength to withstand extreme loading
conditions without catastrophic failure. This includes loads caused
by a sharp-edged gust of 10 feet/second at cruise velocity(increasing the load factor to 4.5).
• Provide a factor of safety of at least 1.4 on all load bearingstructures.
• Provide the necessary space for four passengers and two crewmembers.
• Position the fuel/batteries in the wing carry through structure.
• Allow easy removal of the wing component
• Minimize the weight by not over-designing the aircraft. The
measure of this objective will be to have a margin of safety
approaching zero at the extreme recommended load condition (n =2.75).
• Provide at least 3.5 inches of propeller clearance in the landinggear design.
• Explore the use of new, advanced materials in the wing design.
9.1 MATERIALS SELECTION
Recent Future, Inc. studied many types of prospective materials for the.
With the goals of light weight and high strength, wood was the material of choice
for most of the aircraft. Wood is readily available, inexpensive, lightweight, and
easy to tool. Three types of wood were considered: balsa, spruce, and birch
plywood. Other types of wood were not considered because of a lack of
experience in past designs. Balsa has a very low density and thus will be used
9-1
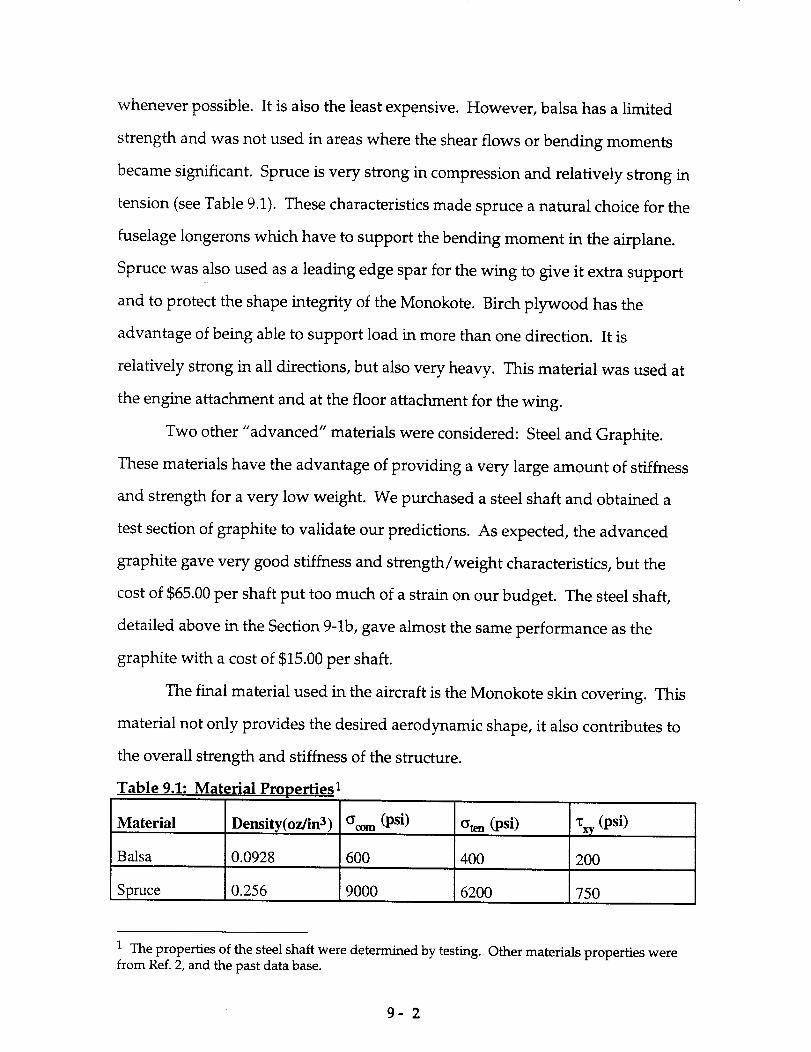
whenever possible. It is also the leastexpensive. However, balsa hasa limited
strength and was not used in areaswhere the shearflows or bending moments
becamesignificant. Spruce is very strong in compression and relatively strong in
tension (seeTable 9.1). Thesecharacteristicsmade spruce anatural choice for the
fuselage longerons which have to support the bending moment in the airplane.
Spruce was also used as a leading edge spar for the wing to give it extra support
and to protect the shapeintegrity of the Monokote. Birch plywood has the
advantage o_fbeing able to support load in more than one direction. It is
relatively strong in all directions, but alsovery heavy. This material was used at
the engine attachment and at the floor attachment for the wing.
Two other "advanced" materials were considered: Steeland Graphite.
Thesematerials have the advantage of providing a very large amount of stiffness
and strength for a very low weight. We purchased a steel shaft and obtained a
test section of graphite to validate our predictions. As expected, the advanced
graphite gave very good stiffness and strength/weight characteristics, but the
cost of $65.00per shaft put too much of a strain on our budget. The steel shaft,
detailed above in the Section9-1b,gave almost the sameperformance asthe
graphite with a cost of $15.00per shaft.
The final material used in the aircraft is the Monokote skin covering. This
material not only provides the desired aerodynamic shape,it also contributes to
the overall strength and stiffness of the structure.
Table 9.1: Material Pro_9_perties 1
Material Density(oz/in 3)
0.0928
_com (psi) Gten (psi)
Balsa 600 400 200
Spruce 0.256 9000 6200 750
1 The properties of the steel shaft were determined by testing. Other materials properties werefrom Ref. 2, and the past data base.
9-2
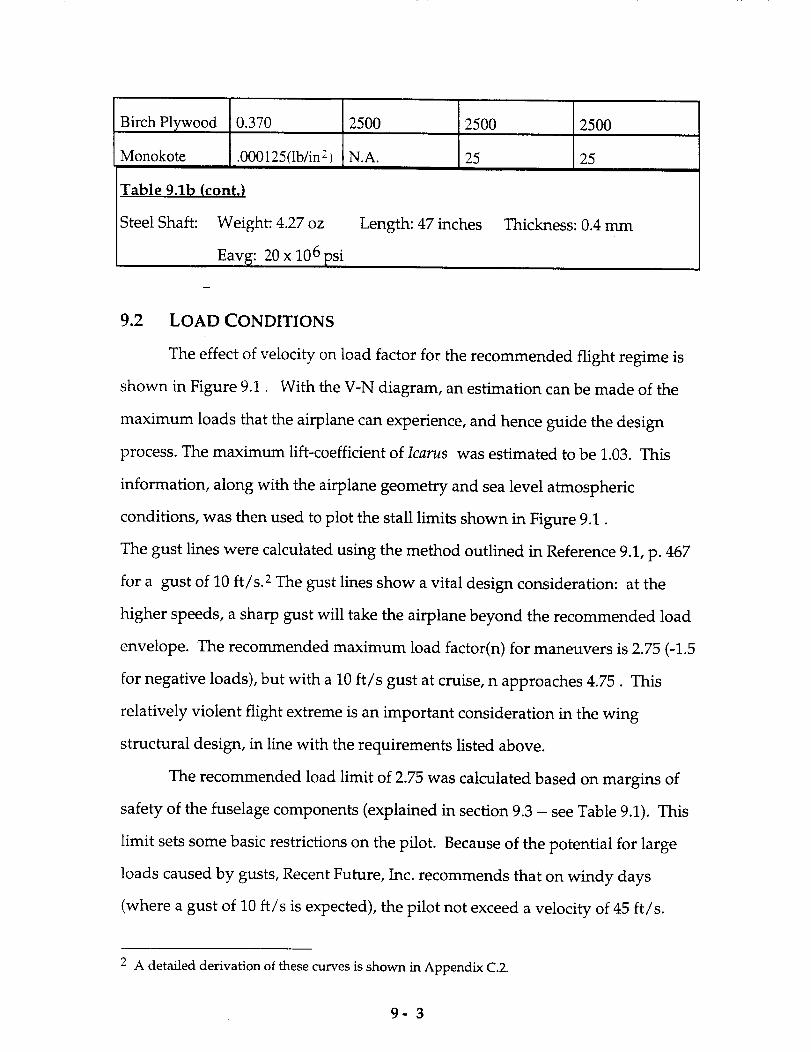
Birch Plywood 0.370
Monokote .000125 (lb/in 2)
Table 9.1b (cont.)
Steel Shaft: Weight:. 4.27 oz
Eavg: 20 x 10 6 psi
9.2 LOAD CONDITIONS
2500 2500 2500
N.A. 25 25
Length: 47 inches Thickness: 0.4 mm
The effect of velocity on load factor for the recommended flight regime is
shown in Figure 9.1. With the V-N diagram, an estimation can be made of the
maximum loads that the airplane can experience, and hence guide the design
process. The maximum lift-coefficient of Icarus was estimated to be 1.03. This
information, along with the airplane geometry and sea level atmospheric
conditions, was then used to plot the stall limits shown in Figure 9.1.
The gust lines were calculated using the method outlined in Reference 9.1, p. 467
for a gust of 10 ft/s. 2 The gust lines show a vital design consideration: at the
higher speeds, a sharp gust will take the airplane beyond the recommended load
envelope. The recommended maximum load factor(n) for maneuvers is 2.75 (-1.5
for negative loads), but with a 10 ft/s gust at cruise, n approaches 4.75. This
relatively violent flight extreme is an important consideration in the wing
structural design, in line with the requirements listed above.
The recommended load limit of 2.75 was calculated based on margins of
safety of the fuselage components (explained in section 9.3 -- see Table 9.1). This
limit sets some basic restrictions on the pilot. Because of the potential for large
loads caused by gusts, Recent Future, Inc. recommends that on windy days
(where a gust of 10 ft/s is expected), the pilot not exceed a velocity of 45 ft/s.
2 A detailed derivation of these curves is shown in Appendix C.2.
9-3

Figure 9.1: V-N Diagram
(+) n 3
(-)-1
n
-2
-3
Vstall
Velocity(f t/s)
= 4.75
n = 2.75
[]
o
n = -1.5
Vcruise
CLmax
-CLmax
gust line
gust line
9-4

Figure 9.2: Weight Distribution Nose to Tail
10
4
9.3 FLIGHT AND GROUND LOADS
The weight distribution of the airplane is shown in Figure 9.2. The
component loads in this graph were analyzed as distributed forces over their
respective lengths. These loads determined the shear and bending moment
diagram for the airplane as shown in Figures 9.3a and 9.3b. Figures 9.3a and 9.3b
were found by applying resultant point loads at the landing gear positions. This
modified weight distribution was then integrated from x=0 at the nose to x =45
at the end of the tail. The bending moment diagram (Fig. 9.3b) was found by
integrating the shear diagram from nose to tail. Figures 9.4a and 9.4b show the
shear and bending moment diagrams for the airplane in a steady, level flight
condition.
9-5
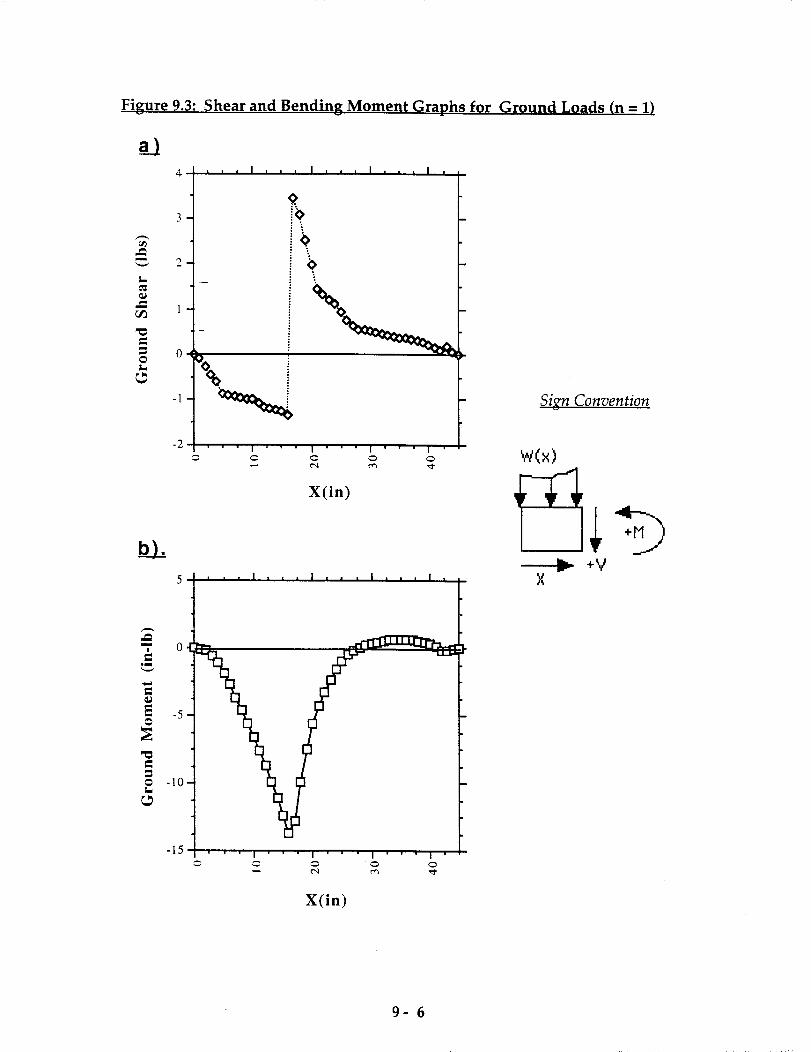
Figure 9.3: Shear and Bending Moment Graphs for Ground Loads (n = 1)
m_._ 2
0@z_.
-!
-2
"_ 0
oi
N -5
-10
-15
X(in)
, , , I , , , I , , , I . , _ [
I I I I
Sicn Convention
w(x)
+vX
X(in)
9-6

Figure 9.4: Shear and Bending Moment Diagrams for Steady, Level Flight
3 , , , I , t , , , , I , , , I ,
m u
-I
-2I I ! I
X(in)
m
!
=
=
@
• - -I0
1-12.5
-15 , , ,
o
5 I , , . I , , , I , , , I , . , I ,
2.5!0
-2.5
-5
-7.5
I I I ' " ' I0 0 0
X(in)
Sign Convention
W(x)
I×
I
9-7

9.4 FUSELAGE
The fuselage was designed to minimize weight yet still supply adequate
support. The structural performance of the fuselage was determined in a large
part by the bending and shear results shown in Figures 9.3 and 9.4. Since the
fuselage experiences varying degrees of shear forces and bending moments, the
design breaks the fuselage structure in four sections (see Figure 9.5). Each of the
four sections has the same cross-sectional area: Width = 3.5 in; Height = 2.75
inches.
Figure 9.5: Airplane Fuselage Sections
Eng_me Fr_ont _"Middle Back
The first section acts basically as an aerodynamic cover for the motor.
This 5 inch section was composed primarily of a balsa wood truss covered in
Monokote. This truss does not support any loads other than its own weight.
Included in this section is a plywood board that serves as the point of attachment
for the motor.
The second section was 11 inches long and composed of a wooden truss.
Due to the relatively large bending moments in this section caused by the weight
of the motor, spruce was used for the main longerons. Spruce provided the
highest tensile and compressive strength of the wooden materials considered (see
9-8

Section 9.1: Materials Selection) and thus was the material of choice for the
longerons. In order to minimize weight, the rest of the truss was made of balsa.
This structure houses the pilot, co-pilot and the speed controller.
The third section, 11.5 inches long, experienced the highest shear forces
and bending moments. For this reason, this section must be the most structurally
sound. All the forces from the landing gear and wing flow to this section first.
For this reason, single sheets were used for the walls in lieu of a truss design.
These boards were made of balsa. The resulting increase in thickness in the
vertical direction dramatically increases I in the formula:
My_max- I
because I is proportional to height cubed in this direction. Rearranging this
equation shows that a much larger moment can be supported using this design
over a truss. The obvious penalty for this design came in weight. However,
using balsa as the main material, and with a fuselage that has a fairly small cross-
section, the total weight of these boards was 2.4 ounces (see Table 9.3). The
batteries, aileron servo, receiver, and power pack were all located in this section.
The back section was 17.5 inches long and composed of a balsa wood truss
supported by spruce longerons. This design provided adequate structural
integrity by allowing the spruce to support the main load, while using the lighter
balsa whenever possible. This section housed the remaining four passengers and
connected the tail and rear landing gear to the rest of the structure.
The front and back sections of the fuselage will provide room for six
passengers. In these areas, a thin balsa sheet will provide the floor necessary to
support these passengers.
Table 9.2 shows the factors of safety for each fuselage load bearing
component on the ground and in a steady, level flight condition. It also shows
conservative estimates of the margins of safety for the fuselage under a 2.75g
9-9

load condition. The margins of safety here arevery closeto zero. This leadsto
the decision that the airplane should be flown within ann=2.75 envelope. These
margins of safety were calculated using afactor of safety of 1.4(asoutlined in the
DR&O) and they do not take the Monokote or other small load bearing devices
into account. But since there was also a chanceof flaws in the material that could
lead to early failure, a limit of 2.75gflight conditions is recommended.
The individual components and weight estimations of eachsection is
shown in Table 9.3.
Table 9.2: Fuselage Structural Safety Mar_ns
Ground Condition:
Section:
Front
Middle
Back
Steady Level
Load Bearing Component
Spruce Longerons
Balsa Boards
Spruce Longerons
Flight Condition:
Max Stress (psi)
3840
104
1920
Factor of Safety,
1.6
3.8
3.12
Section:
Front
Middle
Back
Load Bearing Component
Spruce Longerons
Balsa Boards
Spruce Longerons
Load Factor (n) = 2.75
Max Stress (psi)
1920
70
1920
Factor of Safety
3.12
5.7
3.12
Section:
Front
Middle
Back
Load Bearing Component
Spruce Longerons
Balsa Boards
Spruce Longerons
Ultimate Load fibs)
396
324
396
Margin of Safety,
0.023
0.043
0.023
9- 10

Table 9.3: Fuselage Component Design
Section: Component: Material: Weight(oz):
Engine Housing: Hardwood block Plywood 1.34Spars Balsa 0.52Monokote: 0.11
Front Truss:
Middle:
Back:
Monokote: 0.25
4xlongerons spruce 0.70Truss: balsa 3.30floor: balsa 0.45
Monokote: 0.26
Zxmam spar: balsa 2.40Plvwood floor: Plywood 1.11floor: balsa 0.47
Monokote: 0.39
4xmain spar: spruce 1.68Truss: balsa 2.462xControl Rods: 0.54floor: balsa 0.71
Total: 16.7
9.5 WING
The wing was designed to withstand the expected load conditions,
survive extreme load conditions, and be easily attached and removed. The wing
was manufactured as a separate entity to facilitate the component validation
test 3. A detailed drawing of the complete wing-fuselage connection is included
at the end of this section.
The recommended n = 2.75 was derived from structural considerations
about the wing spar and from the margins of safety in the fuselage showing in
Table 9.1. The pilot can exceed this load factor without structurally damaging
the airplane, but this recommendation ensures safety and structural integrity.
3 This test involves loading the wing to structural failure.
9- 11

The wing spar design is shown in Figure 9.6. This design used a steel rod as the
main load bearing component. This rod had a very high strength to weight ratio.
Figure 9.6: Wing Spar Design
balsa ai Moil sections
\
Mai n Wi ng
(steel)spar
Trailing Edge
(balsa) spar
It also had
stiffness
characteristics that
were comparable
to past wood
designs. The use
of the rod was
justified by the
fact that it can
support a much
higher load (then
wood) without
approaching
its maximum allowable stress. This minimizes the chance of component failure.
A test component was purchased from a subcontractor 4 to validate theoretical
results. The tests involved clamping the rod at one end and applying a point
loads at a fixed moment arm of I ft. We were able to sustain a force of 25 Ibs at
this distance without any residual plastic deformation.
The wing spar was then analyzed under a 3g load condition. This load
condition corresponds to a turn radius of 60 ft at cruise. This loading is extreme
yet conceivable with emergency or acrobatic maneuvers or strong gusts. The
spanwise lift distribution and subsequent shear and bending moment diagrams
4 The Club Doctorin Mishawaka, IN.
9- 12
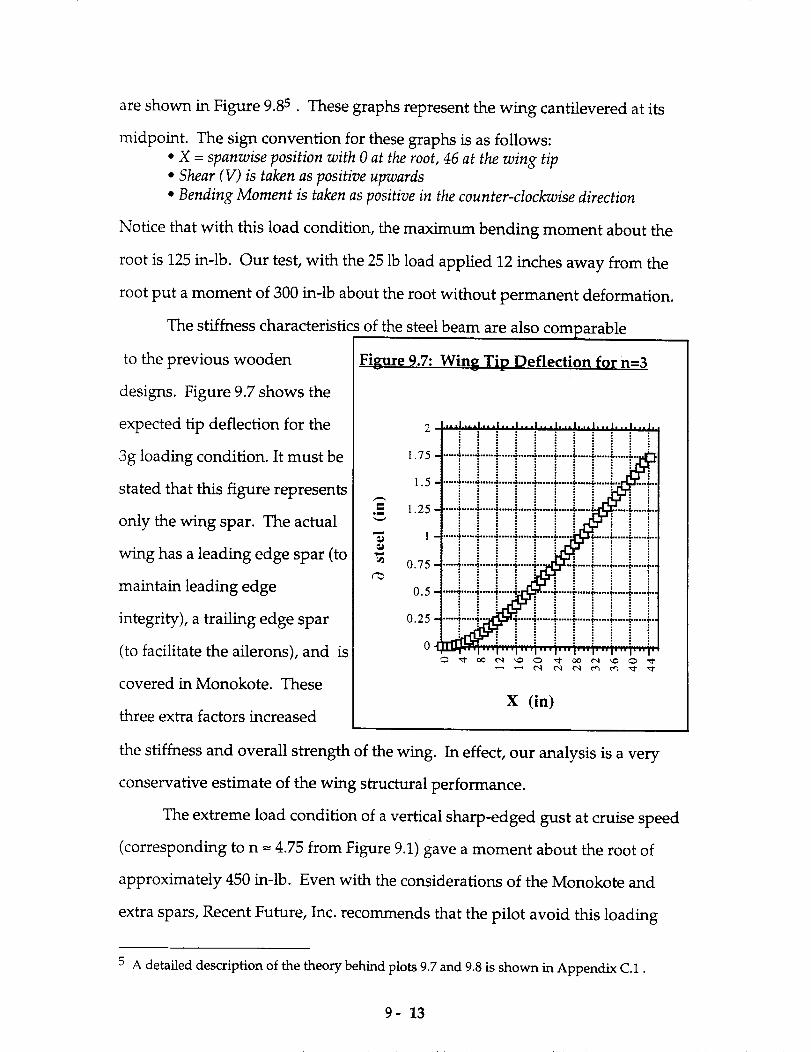
areshown in Figure 9.8s . Thesegraphs represent the wing cantilevered at its
midpoint. The sign convention for thesegraphs is asfollows:• X = spanwise position with 0 at the root, 46 at the wing tip
• Shear (V) is taken as positive upwards
• Bending Moment is taken as positive in the counter-clockwise direction
Notice that with this load condition, the maximum bending moment about the
root is 125 in-lb. Our test, with the 25 lb load applied 12 inches away from the
root put a moment of 300 in-lb about the root without permanent deformation.
of the steel beam are also comparable
Figure 9.7: Wing Tip Deflection for n=,_
The stiffness characteristic:
to the previous wooden
designs. Figure 9.7 shows the
expected tip deflection for the
3g loading condition. It must be
stated that this figure represents
only the wing spar. The actual
wing has a leading edge spar (to
maintain leading edge
integrity), a trailing edge spar
(to facilitate the ailerons), and is
covered in Monokote. These
three extra factors increased
on
Icaca
c'_
2
1.75
1.5
1.25
1
0.75
0.5
0.25
0
I..,I...I...I,..I...I...I..,I.,.l,..I...h,,h
iiiil iiiili..... _....._....._....._....._.....L....._.....L.....L........
.....&,.,,_.,,,,_,...._,.,.,_,,,.,_,...._,..,._...... ..... _.,
..... &..,._....._.,..,_....._....._.....L...... ..... L....._.,
..... _.....&...._,...._.,..._L.....'_..,.,L.,,..L.....L........
..... 4-....4.--,-4,--..4...,.4 ..... _,-..._....._....._....._.,
..... 4,.,.,4,,,,,4,.,,.4 ..... 6...,,_.,...6....,#,,,,,#...,.6.,
..... 4..,-.4..- 4..,.-4#-....6.-...6.....6.....6..-.-6.,......
X (in)
the stiffness and overall strength of the wing. In effect, our analysis is a very
conservative estimate of the wing structural performance.
The extreme load condition of a vertical sharp-edged gust at cruise speed
(corresponding to n = 4.75 from Figure 9.1) gave a moment about the root of
approximately 450 in-lb. Even with the considerations of the Monokote and
extra spars, Recent Future, Inc. recommends that the pilot avoid this loading
5 A detailed description of the theory behind plots 9.7 and 9.8 is shown in Appendix C.1.
9- 13

t:
¢.IN-,
o o o I o ro o
{u!/ql} (x)_
OZ8I9I
ElOl8917
0
{ql} (X)A
• I I I I
I I I I
{u!,ql} (x)BI
1717
--017
9E
O_8E9E
-0_:-81--91
--i51--0I
--8--9
0
|

condition to protect the fuselage integrity. Therefore, on a particularly windy
day, the pilot should not exceed a speed of 55 ft/s.
The one potential drawback of the steel shaft was a weight penalty.
However, the weight of the steel shaft was competitive with previous wooden
designs. Figure 9.9 shows the weights of two wooden designs (I-Beam and single
Beam) compared to the weight of the steel shaft. As the thickness of the beams
increases, the steel shaft actually
Figure 9.9: Steel Shaft Weight vs. Standard Wooden Spar Weight_
Beam and I-Beam indicate past wing spar designs. Thickness refers to the cross-section of
Beam and the flanges of the I-Beam.
11
10
"-' 7No
6
5,m
c_
thickness (in)
[] Beam Weight (oz)
[] I-Beam Weight (oz)
..... Steel
provided a weight advantage. The total estimate of the wing weight, including
all other components, was 1.1 lbs, a figure that is very similar to the weights of
past wings in our data base.
9- 15

There are other drawbacks to using the steel shaft. The first drawback
occurs in the challenge of affixing the wood to the steel itself. The subcontractor
assured us that a strong epoxy, will more than do the job. Because extremely
heavy wooden pieces are successfullv attached to similar shafts in the design of
golf clubs, he thought gluing balsa airfoil sections would not be a problem. The
second drawback was caused by the fact that the steel shaft does not traverse the
entire span of the wing. Wooden spars were called upon to support the wing for
18 inches at each wing tip. Since the resultant wing loading in flight occurs
approximately at 17 inches from the midpoint (well within the steel rod's
boundaries), these wooden spars do not have to support a significant amount of
weight. The last drawback occurs because the shaft is tapered at one end. While
this did not significantly affect the structural characteristics, it did shift the center
of gravity of the wing slightly off-center (0.62 inches). This was easily
counterbalanced by shifting the battery packs.
Balsa airfoil shapes were glued directly to the main shaft at intervals of 4
inches. These provided the framework for the Monokote, which gives the wing
its aerodynamic shape. The Monokote was also used to create hinges connecting
ailerons. The trailing edge spar shown in Figure 9.6 was used to support the
wing and provide the area for the ailerons. The ailerons were nothing more than
cut-out sections of this spar attached to rotating control rods. A single aileron
servo provided the necessary motion.
The wing was attached to the underside of the fuselage. Two plywood
"floor" sections provided support for screws affixing the wing to the fuselage.
Rubber bands also gave added support. With this design, the wing can be easily
removed and reattached. A detailed drawing of the wing/fuselage connection is
shown in Figure 9.17, included at the end of this section.
9- 16

9.6 TAIL SECTIONS
In many past designs in Aeroworld, the horizontal tail was composed of
flat plates. However, the Icarus uses airfoils to make the horizontal tail more like
a wing. This decision was made for three reasons: 1.) The aerodynamic
characteristics of an airfoil as opposed to a flat plate were much better; 2.) The
beams supporting the airfoils sections allowed greater loading than flat plate
designs; and 3.) The flat plate did not save the airplane a significant amount of
weight.
Past designs cited weight savings as a motivation for using flat plates.
However, our analysis of the tail section showed that a flat plate gave minimal -
Figure 9.10: Tail Section Weight Analysis
Note: "I-Beam" and "Single Beam" indicate designs that can support airfoil ribs. Thetotal weight of the horizontal tail is shown in this graph.
4
3
om
0
Thickness Increasingfrom 1/8 to 5/8"
[] Flat Plate
• Flat Plate
[] I-Beam
• Single Beam
w/spruce
if anv -- weight savings. This is shown in Figure 9.10. In this figure, the I-Beam
9- 17

and Single Beam are the two designs considered to support the airfoils. Figure
9.10 shows the total weight of the horizontal tail for each design. The graph
shows that as the thickness of the flat plate spars increase, the weight becomes
comparable to the airfoil design. Even at the very lowest thickness (a very flimsy
and structurally unsound design) the weight savings is on the order of only one
ounce.
An I-Beam was selected as the main spar based on the results shown in
Figure 9.11. This graph shows the predicted stresses in the tail components for
the maximum flight load conditions. There is a definite structural advantage in
using either of the beam designs (and hence airfoils). The greater thickness in the
beams reduced the stress caused by a given moment, thus allowing greater loads.
Figure 9.11: Stresses in Horizontal Tail Section
500 _
450 lilil'_ii_- _ [
4°°-H_!MIIiI[ ]• m I
300 l:i_i_ii[_l_l_ . 1 []
_ 25°-_i_iN-_i?_l_illl • 1 @ OOli ,,H1)Hli¢ll. l_!. 1[]
< ,_Ol_,l_ij-H-[t_.:_ •'°°1,, i +)tml)iN-ml)ini
Thickness
from 1/8Increasing
to 5/8"
Flat Plate
Flat Plate w/spruce
I-Beam
Single Beam
9- 18

The aerodynamic benefit of using airfoils instead of a flat plate came in the
drag breakdown. This topic is discussed more thoroughly in the Aerodynamics
section of this proposal. The thicker yet more aerodynamic shape of the airfoil
design gave more structural integrity and a better drag profile with only a
modest penalty in weight.
The vertical tail was swept and made from a balsa wood truss section.
Since the height of the vertical tail was less than half of the span of the horizontal
tail, the drag penalty for this flat plate was minimal compared to the rest of the
plane. The manufacturing time savings from a flat plat plate design 6 and the
inherent cost benefits outweighed the marginal performance benefit of using
airfoils.
9.7 LANDING GEAR
According to the DR&O, Icarus Rewaxed must be able to takeoff from
unprepared ground in 3.5 inches of grass. In order to give the propeller adequate
clearance for this condition, our landing gear struts were longer than those used
in past designs. This longer gear must be able to adequately support the stresses
involved in landing. The desired characteristics of the landing gear are that it
provided shock absorbance (through deflection) and did not allow either the
nose, tail, or wing tip to hit the ground. To design the main gear, a "worst case
scenario" of a 3g load placed on only one tire at landing (i.e., the airplane is
banked) was used. In order to determine the length of struts needed for the main
gear, the clearance requirement based on the DR&O was first calculated. This is
7.125 inches from the ground as shown in Figure 9.12.
6 With a swept design, each airfoil section would have to be individually cut. This process
would significantly increase manufacturing time.
9- 19
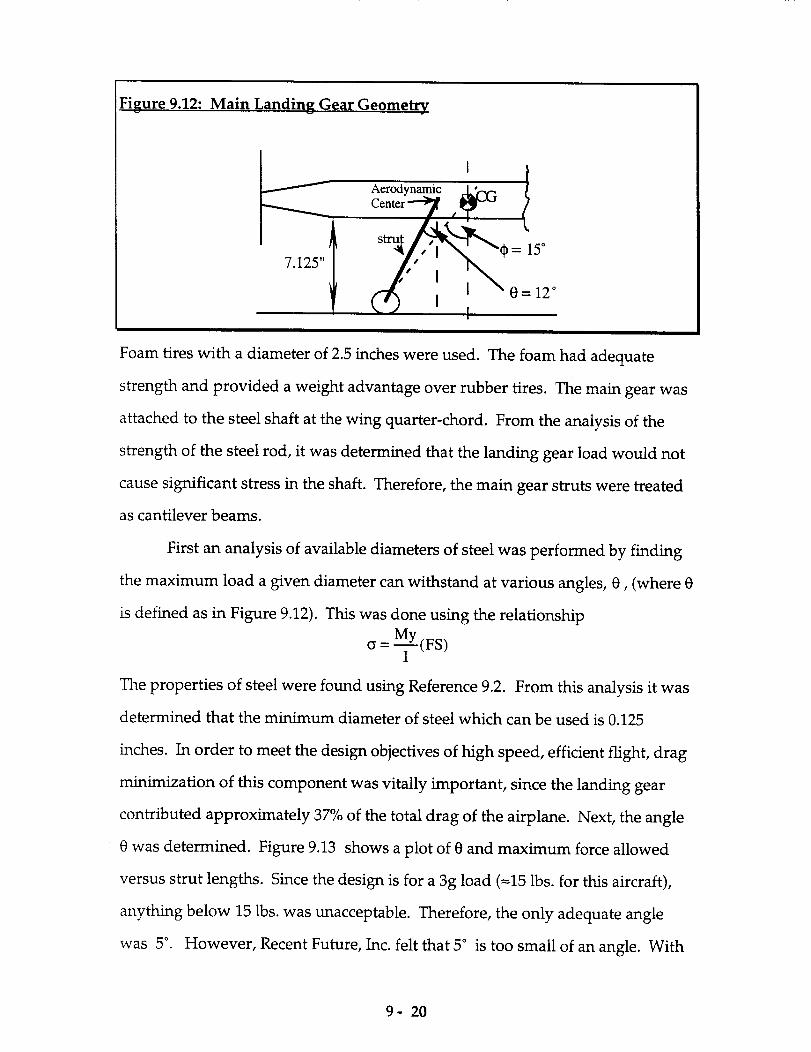
Figure 9.12: Main Landing Gear Geometry
Aerodynamic _k_t-, f
C°n=--7 ?
I I "0=12 °I
Foam tires with a diameter of 2.5 inches were used. The foam had adequate
strength and provided a weight advantage over rubber fires. The main gear was
attached to the steel shaft at the wing quarter-chord. From the analysis of the
strength of the steel rod, it was determined that the landing gear load would not
cause significant stress in the shaft. Therefore, the main gear struts were treated
as cantilever beams.
First an analysis of available diameters of steel was performed by finding
the maximum load a given diameter can withstand at various angles, 0, (where 0
is defined as in Figure 9.12). This was done using the relationship
(r = MY (FS)I
The properties of steel were found using Reference 9.2. From this analysis it was
determined that the minimum diameter of steel which can be used is 0.125
inches. In order to meet the design objectives of high speed, efficient flight, drag
minimization of this component was vitally important, since the landing gear
contributed approximately 37% of the total drag of the airplane. Next, the angle
0 was determined. Figure 9.13 shows a plot of 0 and maximum force allowed
versus strut lengths. Since the design is for a 3g load (=15 lbs. for this aircraft),
anything below 15 lbs. was unacceptable. Therefore, the only adequate angle
was 5 °. However, Recent Future, Inc. felt that 5 ° is too small of an angle. With
9- 20

such a small angle, the airplane could easily tip over. In Reference 9.3, a "rule of
thumb" for the angle _ is given as being between 13°-20 ° in order to prevent the
plane from tipping nose down upon landing. With 0 being only 5 °, q_ is only 8 °.
Assuming both tires hit the ground, a greater angle can be used. Based on this
relaxed requirement, qbwas chosen to be 15 °. This causes 0 to be 12 °.
To determine the length of the struts it was necessary to examine the
deflection at landing. Some deflection is desired in order to provide shock
absorbance, but the deflection could not be so great that the propeller hit the
ground. Due to the clearance requirement and the angles chosen, the minimum
length of the strut that can be used is approximately 9.4 inches. This allowed a
perpendicular distance of 8 inches. The 8 inch distance allowed tip clearance,
including some deflection.
Figure 9.13: Maximum Landing Force on Strut vs. Length of Strut
• Theta--5 degrees Theta=7
18- _ • Theta=6 * Theta--8
16.
i 14-
85 5.5 6 6.5 7 7.5
Length of Strut (inches)
9- 21
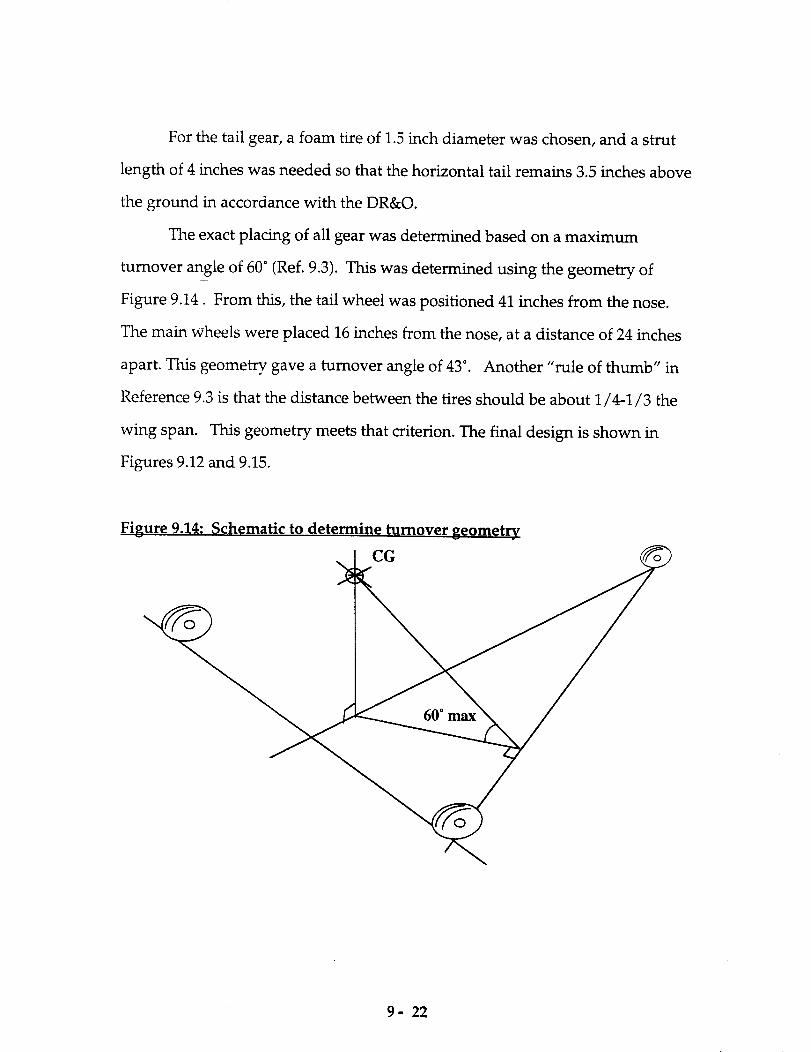
For the tail gear, a foam tire of 1.5 inch diameter was chosen, and a strut
length of 4 inches was needed so that the horizontal tail remains 3.5 inches above
the ground in accordance with the DR&O.
The exact placing of all gear was determined based on a maximum
turnover angle of 60 ° (Ref. 9.3). This was determined using the geometry of
Figure 9.14. From this, the tail wheel was positioned 41 inches from the nose.
The main wheels were placed 16 inches from the nose, at a distance of 24 inches
apart. This geometry, gave a turnover angle of 43 °. Another "rule of thumb" in
Reference 9.3 is that the distance between the tires should be about 1/4-1/3 the
wing span. This geometry meets that criterion. The final design is shown in
Figures 9.12 and 9.15.
Figure 9.14: Schematic to determine turnover geometry
CG
60 ° ma_
9- 22

Figure 9.15: Landing Gear Geometry
L=9.4 _ 5.
v IW=24"
The last important aspect of the landing gear design was the attachment it to the
fuselage. The method chosen is shown in Figure 9.16. The strut followed the
main wingspar for added support. It was attached to the wing carry-through 4
inches behind the main wing spar. This gave enough of a moment arm to
dissipate the forces of landing without damaging the fuselage or wing carry-
through.
Figure 9.16:
Side view
l
I
wing spar I
L
I
main strut II
I
Landing Gear Attachment to Fuselage
Top view
attachment of strut to wing carry-through
strut braced alon_ main win_ spar(steel shaft)I
point where strut slopes_........-_ -1
down toward ground
9- 23

Figure 9.17: Wing Attachment to Fuselage
1 _
/
./
i[
/
tk
9- 24
References:
1.) McCormick, Barnes W. Aerodynamics, Aeronautics, and Flight Mechanics.
New York: John Wiley & Sons, 1979.
2.) Beer, Ferdinand P. and E. Russell Johnston, Jr. Mechanics of Materials. New
York: McGraw-Hill Book Company, 1981.
3.) Stinton, Darrol. The Design of the Airplane. New York: Van Nostrand
Reinhold, 1983.
9- 25

10.0 ECONOMICS
10.1 ECONOMIC GOALS
Second only to cruise velocity, cost was the most important driving force
for Icarus Rewaxed. In a depressed market that is trying to make a comeback in
Aeroworld, it was essential for Recent Future, Inc. to design and produce a high-
speed, highly maneuverable general aviation airplane that is competitive yet
affordable. The goal of Recent Future, Inc. was to make its cost per flight as small
as possible. Areas of concern during the manufacturing stage were:
• increased efficiency during construction thus reducing man-hours, the
largest percentage of the overall cost.
• careful manufacturing planning ensuring near perfect ordering of raw
materials. This reduced excess material and the fee to dispose of it.
In order to enhance performance and durability, Recent Future, Inc.
incorporated ailerons, a steel shaft reinforced wing main spar, and airfoil section
horizontal tail. Major precautions were made to keep the cost of labor and
tooling in check.
10.2 C OST ESTIMATES
The total cost of Icarus Rewaxed represents the sum of the costs of the fixed
subsystems, raw materials, and manufacturing. A detailed breakdown of the
costs is presented in Table 10-1. The fixed subsystem subtotal is $463. Aside
from the cost of the Astro 15 motor, major contributors to the fixed subsystem
subtotal are the three-bladed Zingali propeller, the 13 cell battery pack ($4.50 per
10 - 1

Table 10.1: Cost EstimationI. Fixed Subsystem
Propulsion
motor
motor speed controlbatteries
propellerControls
radio receiver
radio transmitter
avionics battery packswitch harness
miniature servo (3)
wiring
Subtotal
II° Raw Materials
balsa
spruce
plywoodsteel shaft
monokote
glue
miscellaneous
landing gear strutsmain wheels
tail wheel
III.
Subtotal
Manufacturinglabor costs
(140 man-hours at $10/hr)
tooling costs
Subtotal
IV° Waste Disposal$10/oz.
Total
(overhead & profit) +
$107
$5O
$59
$15
$35
$75$10$5$105
$2
$463
$50
$20
$5$15$40$15$10
$3
$6
$4
$168
$1400
$100
$1500
$100
$2231
$1267
Total Cost Per Aircraft $3498
10 - 2
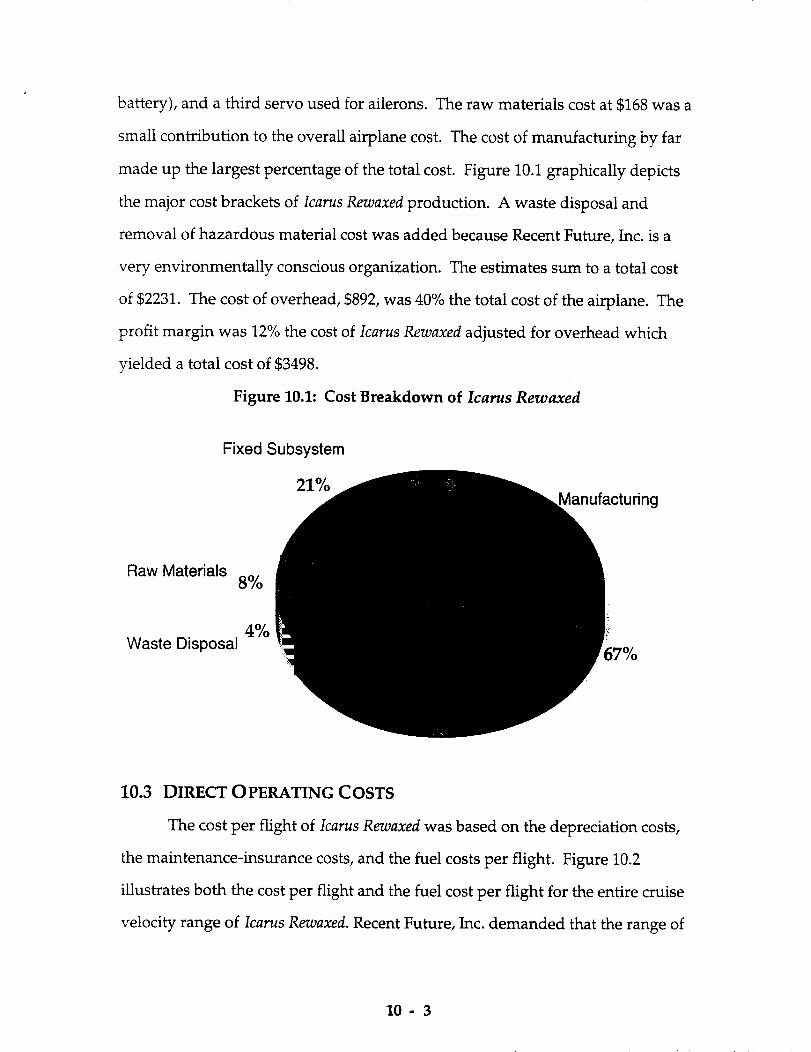
battery), and a third servo used for ailerons. The raw materials cost at $168 was a
small contribution to the overall airplane cost. The cost of manufacturing by far
made up the largest percentage of the total cost. Figure 10.1 graphically depicts
the major cost brackets of Icarus Rewaxed production. A waste disposal and
removal of hazardous material cost was added because Recent Future, Inc. is a
very environmentally conscious organization. The estimates sum to a total cost
of $2231. The cost of overhead, $892, was 40% the total cost of the airplane. The
profit margin was 12% the cost of Icarus Rewaxed adjusted for overhead which
yielded a total cost of $3498.
Figure 10.1: Cost Breakdown of Icarus Rewaxed
Fixed Subsystem
21%Manufacturing
Raw Materials8%
4%Waste Disposal
67%
10.3 DIRECT OPERATING COSTS
The cost per flight of Icarus Rewaxed was based on the depreciation costs,
the maintenance-insurance costs, and the fuel costs per flight. Figure 10.2
illustrates both the cost per flight and the fuel cost per flight for the entire cruise
velocity range of Icarus Rewaxed. Recent Future, Inc. demanded that the range of
10 - 3
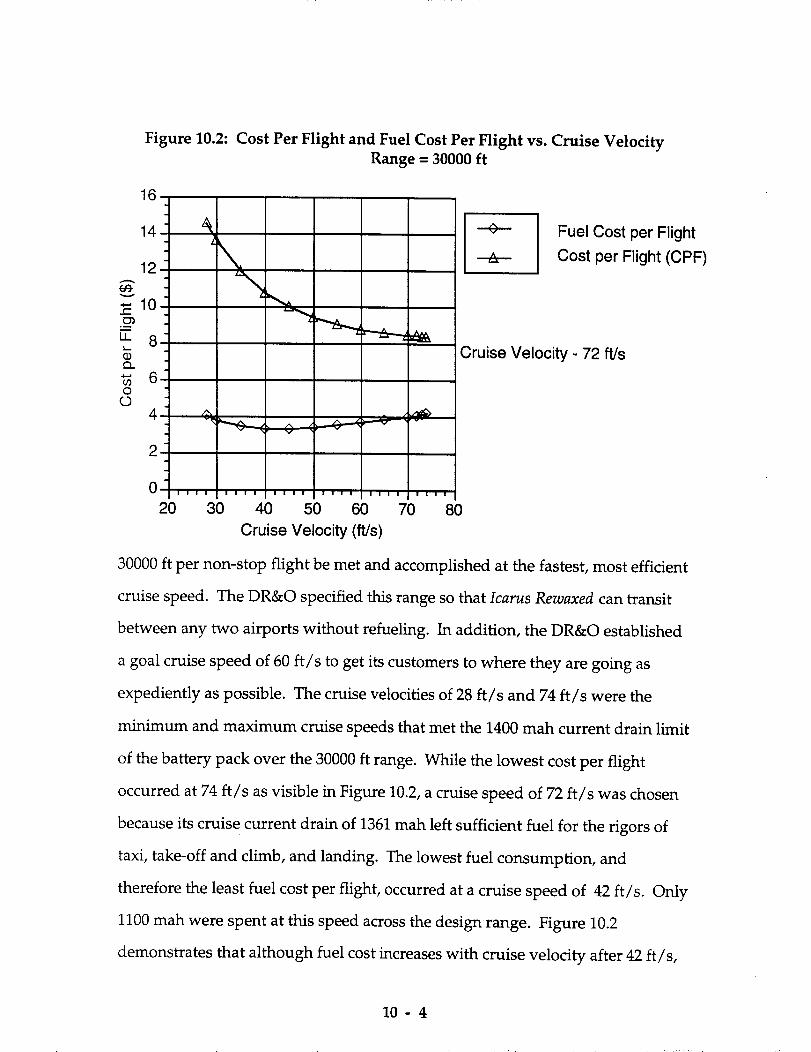
14-
12-
v
--10-c-O3
.m
U_ 8-$Q.
*" 6-
O(_3
Figure 10.2: Cost Per Flight and Fuel Cost Per Flight vs. Cruise Velocity
Range = 30000 ft
LFuel Cost per Flight
Cost per Flight (CPF)
Cruise Velocity - 72 ft/s
4- % _...@... _.._e__, ,..._ .... _
=
.
20 30 40 50 60 70 80
Cruise Velocity (ft/s)
30000 ft per non-stop flight be met and accomplished at the fastest, most efficient
cruise speed. The DR&O specified this range so that Icarus Rewaxed can transit
between any two airports without refueling. In addition, the DR&O established
a goal cruise speed of 60 ft/s to get its customers to where they are going as
expediently as possible. The cruise velocities of 28 ft/s and 74 ft/s were the
minimum and maximum cruise speeds that met the 1400 mah current drain limit
of the battery pack over the 30000 ft range. While the lowest cost per flight
occurred at 74 ft/s as visible in Figure 10.2, a cruise speed of 72 ft/s was chosen
because its cruise current drain of 1361 mah left sufficient fuel for the rigors of
taxi, take-off and climb, and landing. The lowest fuel consumption, and
therefore the least fuel cost per flight, occurred at a cruise speed of 42 ft/s. Only
1100 mah were spent at this speed across the design range. Figure 10.2
demonstrates that although fuel cost increases with cruise velocity after 42 ft/s,
10 - 4

cost per flight costs decrease with increasing velocity because of the marked
decrease in depreciation costs per flight. Since Icarus Rewaxed still had 300 mah
storage remaining in the batteries and the overall cost per flight dropped as
cruise speed increased, a cruise speed of 72 ft/s was settled upon. A fuel cost of
$3.00/amphour was used in the calculations because Icarus Rewaxed's batteries
were more expensive than those of the competition. Also, better grade fuel
promotes more responsive performance and increases the longevity of the
airplane. Since no cost penalty is incurred by flying at 72 ft/s, 12 ft/s faster than
our 60 ft/s design objective, in fact it actually saves the customer time and
money, Icarus Rewaxed uses up its fuel supply, 1400 mah of current drain, and
cruise at 72 ft/s.
Table 10.2: Cost Per Flight Summary
Cruise Velocity:
Range:
Flight Time:
72 ft/s
30000 ft
417 s (6.95 min)
I° Total Cost Per Aircraft
# Flights in Lifetime
Depreciation Cost Per Flight
II. Operation Costs Per Flight:Maintenance-Insurance Costs
Fuel ($1.50 - $3.00/amphour)
Operation Subtotal
$3498.00
864
$4.05
$0.27
$2.04 - $4.08
$2.31 - $4.35
III. Cost Per Flight $6.36 - $8.40
IV. Cost Per 1000 ft $0.21 - $0.28
The depreciation cost was added to the cost per flight of Icarus Rewaxed
because of the finite lifetime of the aircraft. With a design range of 30000 ft
(which allows for ample fuel to land at the nearest alternate airport with a two-
minute loiter capability) and a cruise velocity of 72 ft/s, the cruise flight time is
10 - 5

417 s. Assuming a 100 hour lifetime, each Icarus Rewaxed airplane can make 864
flights. The depreciation cost of $4.05 was found by dividing the total cost of the
airplane ($3498 after overhead and profit are tacked on) by the number of flights.
The operation cost per flight of Icarus Rewaxed added the maintenance-insurance
cost to the fuel cost. Although the maintenance-insurance cost increased with
increasing cruise design flight speed, the $0.27 levy hardly dented the direct
operating cost. The fuel cost was determined by multiplying the cruise current
drain in amphours by the fuel cost of $3/amphour for a total of $4.08. This
yielded a cost per flight of $8.40. If the economy grade fuel is used, the fuel cost
is chopped to $2.04, resulting in a mere $6.36 cost per flight. The cost per 1000
feet ranged from $0.21 - $0.28.
References:
10- 1. Batill, Stephen M., "Cost and Economic Analysis," AE 441 Handout,
Department of Aerospace and Mechanical Engineering, University ofNotre Dame, 1994.
10-2. Batill, Stephen M., "Manufacturing Plan and Costing Details," AE 441
Handout, Department of Aerospace and Mechanical Engineering,
University of Notre Dame, 1994.
10 - 6
APPENDIX A
CRITICAL DATA SUMMARY

ParameterDESIGN GOALS:V cru_e
No. of passengers/crewMax Range at WmaxMax Take-off distanceAltitude cruiseMinimum turn radius
Max Range at WminMaximum TO Weight-WMTOMinimum TO Weight - WminMax cost raw materials
BASIC CONFIG.
Wing Area
Maximum TO Weight - WMTOEmpty Flight WeightWing loading(WMTO)max length
max spanmax heightTotal Wetted Area
WING
Aspect Ratio
SpanArea
Root Chord
Tip Chordtaper RatioC mac - MAC
leading edge Sweep1/4 chord Sweep *Dihedral
Twist (washout)Airfoil section
Design Reynolds numbert/c
Incidence angle (root)Hor. pos of 1/4 MAC
Ver. pos of 1/4 MACe- Oswald efficiency
CDo -wingCLo - wingCLalpha -wing
FUSELAGE
LengthCross section shapeNominal Cross Section Area
Finess ratio
Payload volumePlanform area
Frontal area
CDo - fuselage
60 ft/s4/230,000 ft28 ft
25 ft (indoors)60 ft30,0004.54.45$ 2OO
7.5ft 25.3 lbs
5.24 lbs11 oz/ft 245 inches7.35 ft22 inches23_
7.2 ft7.35 ft7.5 ft212.25 inches12.25 Inches1.0-0.058200
5"0DF10137500011%0.7"17.9 inches9.11 inches0.830.0070.1594.55
45 inches
rectangle4in 212
140in 3157.5 in 2
9.625 in 2
0.00098
EMPENNAGEHorizontal tailArea
spanaspect ratioroot chordtip chord
average chordtaper ratioI.e. sweep1/4 chord sweepincidence anglehor. pos. of 1/4 MACver. pos. of 1/4 MACAirfoil section
e - Oswald efficiency (LLC)CDo -horizontalCLo-horizontal
CLalpha - horizontalCLde - horizontalCM mac - horizontal
Vertical TailArea
Aspect Ratioroot chord
tip chordaverage chordtaper ratio1.e. sweep1/4 chord sweep
hor. pos. of 1/4 MACvert. pos. of 1/4 MACAirfoil section
SUMMARY AERODYNAMICSC1 max (airfoil)Cmo (airfoil)CL max (aircraft)
lift curve slope (aircraft)CDo (aircraft)efficiency - e (aircraft)Alpha stall (aircraft)Alpha zero lift (aircraft)L/D max (aircraft)
Alpha L/D max (aircraft)
WEIGHTS
Weight total (empty)
C.G. most forward-x&y
C.G. most aft- x&y
Avionics
Payload-Pass.&lugg.-max
Engine & Engine ControlsPropellerFuel (battery)Structure
WingFuselage/emp.Landing gear
224 in2
28 inches3.5
8 inches8 inches8 inches100-2.0"40.5 Inches9.5 inchesSD80200.974
0.001660.03.7540.3430
71.5 in2
1.059 inches5 inches
6.5 inches0.62515"
11.6"
40 inches14.2 inches
fiat plate
1.141-0.0582
1.034.55/rad0.02350.768
12 degrees-2"
13.948.2
5.22 lbs17.78 inches, 9.06inches
17.83 inches, 9.11inches3.173 ounces0.529 ounces14.11.552 ounces22.1 ounces
17 ounces20.9 ounces4.73 ounces

PROPULSION
Type of enginesnumber
placementPavil max at cruise
Preq cruisemax. current draw at TOcruise current draw
Propeller typePropeller diameter
Propeller pitchNumber of blades
max. prop. rpmcruise prop. rpmmax. thrustcruise thrust
battery typenumber
individual capacity
individual voltagepack capacitypack voltage
STABILITY AND CONTROL
Neutral pointStatic margin %MACHor. tail volume ratioVert. tail volume ratioElevator area
Elevator max deflectionRudder Area
Rudder max deflectionAileron Area
Aileron max deflection
Cm alphaCn beta
C1 alpha tailCI delta e tail
PERFORMANCEVmin at WMTOVmax at WMTOVstall at WMTO
Range max at WMTOEndurance @ RmaxEndurance Max at WMTO
Range at @Emax
Range max at WminROC max at WMTO
Min Glide angleT/O distance at WMTO
Astm 151tractot101.6 Watts
101.6 Watts
34,51 amps11.755 ampsZingali 10-810 inches83
74667021.223.637 lbs1.4118 lbsP-140SCR
131400 mAh1.21400 mAh
15.6
13.6%
0.40.017356in 2
+-20"42in 2+30"
12in 2+20"/-15 °-0.659
0.04743.7540.343
10 ft/s75 ft/s24 ft/s38266.5 ft @43ft/s889.92 s1132.06 s @28ft/s31692.02 ft38266.5 ft
13.048 ft/s4.2"25.4 ft
SYSTEMS
Landing gear typeMain gear position
Main gear lengthMain gear tire sizenose/taft gear positionn/t gear lengthn/t gear tire sizeengine speed controlControl surfaces
TECH DEMO - Final
Max Take-Off WeightEmpty Operating WeightWing AreaHor. Tail AreaVert Tail Area
C.G. position at WMTO1/4 MAC positionStatic margin %MACV takeoffRange maxAirframe struct, weightPropulsion sys. weightAvionics weightLanding gear weight
ECONOMICS:raw materials cost
propulsion system costavionics system costproduction manhoursprofittooling coststotal cost per aircraft
tail dragger14.5 inches9.5 inches2.5 X 0.7541 inches4 inches1.75 X 0.5Tekin
aileron, elevator,rudder
$168$234$ 232140 hours
$ 374.80$100
$ 3498

APPENDIX B
DATABASE

dala.xcel
DATABASEArea S (ft^2) Span fit) Chord (in) Aspect Ratio Range (it) Her Tail Area (it^2) Elevator Area fit^2) Vert Tail Area (ft^2) Rudder Area (ft^2)
4.67 7 8 10.5 2609 1.04 0.917 0.37 0.361
5.46 8 8.2 11.7 5500 0.63 0.21 0.38 0.21
6 8,5 8.5 12 4831 1.05 03
4.38 5,84 9 7.8 12210 0.48 0.04 0.35 0.21
2.2 4 6.6 7.3 3000 0.688 0.375
7.33 8 11 8.7 17000 1.01 0.1 0.42 0.29
9.5 10 11.4 10.5 19966 1.57 0.72
6.94 8.33 10 10 33000 1.25 0.563 0.493 0.321
7 8 10.5 9.1 20000 0.97 0.46
9.93 9.17 13 8.5 13000 1.92 0.73
10 9.22 11.94 8.5 14355 2.98 1.18
10.94 8.75 15 7 16600 1.6 0.8 1 0 8
10 10 12 10 23170 1.61 0.32 0.68 0.37
5.83 7 9.996 8.4 8104 0.859 0.335 0.135 0.108
Penguin 90
Scream-J4D 90
Drag-n-Fly 90
FX-90 9O
Stealth Biplane 90
Hot Box 91
Arrow 227 92
[] Toro 91
Pale Horse 91
RTL-46 93
Bunny 93
Gold Rush 93
Blue Emu 93
Nood Rider 90
Weight fibs)
3.513
3
2.73
2.75
2.6
4.288
6
5
4.98
5.16
5.3
5.321
4.79
4.94
Win_ Area (ft^2) Win[_ Weight (oz) Wing Weight/Wing Area (oz/[t^2)
Plane 1
Plane 2
Plane 3
Plane 4
Plane 5
Plane 6
Plane 7
Plane 8
Plane 9
7.92 13.9 1.76
5.11 7.9 1.55
7.08 24.3 3.43
5.83 20.3 3.48
8.26 31.1 3.77
10 30.5 3.05
7.07 31.6 4.47
6.67 27.9 4.18
4.64 13.3 2.87
_ts and Sizes of various Hardware (From DataBook) DENSITIES OF MATERIALS
PART WEIGHT(oz) SIZE(inches) MATERIAL
Astm 18 7.5 Diameter=l.5, length(with gear box)=5.0
Engine mount 1.2
gearbox 1.6
Receiver 0.95 1.31xl.87x0.81
Power pack 2 2.18xl.18x0.56
Serve 0.6 1.0x0.75x1.5
Speed Controller 1.8 0.875xl.125xl.375
Monokote 1.8oz/100Oin^2
Anita 25 11 Diameter=l.62
Batteries: 1200mAh 1.7 Diameter--0.75, Length=l.5
1300mAh 1.7 Diameter=0.89, Length= 1.67
1400mAh 1.7 Diameter-089, I,ength.- 1.67
900 mAh 1.38 Diameter=0,75, Len_th=l.5 ----
Balsa 140
Plywood 545
Spruce 500
Page I
APPENDIX C
-WING SPAR DEFLECTION
AND STRESS THEORY
- V-N DIAGRAMCURVETHEORY

APPENDIX C: STRUCTURES THEORY
C.1: Wing Spar Deflection and Stress Analysis
In this analysis, the wing spar is assumed to be the only load carrying
component. The wing divided in half and cantilevered at the midpoint (the point
of attachme_nt to the fuselage). It was assumed that each half behaved the same,
and that each half of the wing supported exactly half of the total load.
The_ving flight load was assumed to be parabolic and of the form
w(x) = -Ax2 + Bx + C
with A, B, and C as constants and x the length in inches from the fuselage rootdw
(x=0) to the wing tip (x = L). With the boundary conditions that _-- @ (x=0)
equals 0, and w(L) = 0, and knowing that the total area under the curve must
equal the load factor (n) times the weight, the constants A, B, and C can be found.
By this analysis, B = 0 for all load conditions.
The shear, bending moment, and deflection graphs can be found using the
integration method found in Reference C.1, p. 415. This method begins with the
fourth order equation:
Integrating gives:
d35
EI_--_ = V(x) = -1/3 Ax 3 + Cx + D (Note: B = 0)
d25
EI_-_ = M(x) = -(1/4)(1/3)Ax 4 + (1/2)Cx 2 +Dx + E
d8
EI_ - - (1/5)(1/4)(1/3)Ax 5 + (1/3)(1/2)Cx 3 + (1/2)Dx 2 + Ex + F
EI8 = -(1/6)(1/5)(1/4)(1/3)Ax6 + (1/4)(1/3)(1/2)Cx 4 + (1/3)(1/2)Dx 3 + (1/2)Ex 2
+Fx+G
C-1

The following boundary conditions were used to solve for the constantsD, E,F,
and G:
@x=0:8=0
@x=0 : dS/dx=0
@x=L: V=0
@x=L : M=0
Given these, the following values were reached for the 3g loading condition:
A = 1.52 x 10 -4
B=0
C = 0.268
D = (1/3) A L 3 - CL
E = (1/4)(1/3)A L 4 - (1/2)C L 2- DL
F=0
G=0
The values for the Modulus of Elasticity (E) for the graphite and steel shafts were
found by testing the individual members. This test involved clamping the rod at
one end and applying a point load at a known moment arm. By applying
different loads, an estimation of E can be found by measuring the tip deflection.
With the solution to the deflection of the tip given by:
PL 3
8 = - 3EI (Ref. C.1, p. 598)
and knowing P(load), L, 8, and I, the Modulus can be estimated.
After finding the load, shear, and bending moment diagrams, the resultant
stresses in the wing spar can be found by:
My{_= I
C-2

Finding the maximum stressthen allows calculations for the margins and factors
of safeW for any flight loading condition.
C.2: V-N Diagram Curves
The stall limit lines of the V-N diagram (Figure 9.1) were found using the
following relation:
1 S
nmax/mi n = _p wC L V 2max/rain
where p = 3.3769x10 -3 lb sec2/ft 4 , C L = 1.03, C L = -0.5, S = 7.5 ft 2 andmax min
Weight = 5.1 lbs.
The gust lines were found by the analysis from Reference C.2, p. 466-7.
The vertical gust velocity was set at 10 ft/s in accordance with the DR&O of
Recent Future, Inc. The following relation was then used to find the load lines:
Kg Ugus t V a
n=l_+ 498(W/S)
Here, a = the slope of the airplane normal force coefficient (CL/rad) . Kg is a
gust alleviation factor designed to modify the assumption of a "sharp-edged"
gust. Kg is based on the airplane mass ratio in the following relation:
2(W/S)= airplane mass ratio -
pcag
(Ref. C.2, p. 467)
References:
C.1:
C.2:
Beer, Ferdinand P. and E. Russell Johnston, Jr. Mechanics of Materials.
New York: McGraw-Hill Book Company, 1981.
McCormick, Barnes W. Aerodynamic, Aeronautics, and Flight Mechanics.
New York: John Wiley & Sons, 1979.
C-3
APPENDIX D
PRIMARY DELIVERABLES
FIGURES _; TABLES

Side View
L =l=Wing Carrythrough
!
Top View
_.. @@ _ [------]
]--
z@@@@
f
Total Length 45 inches
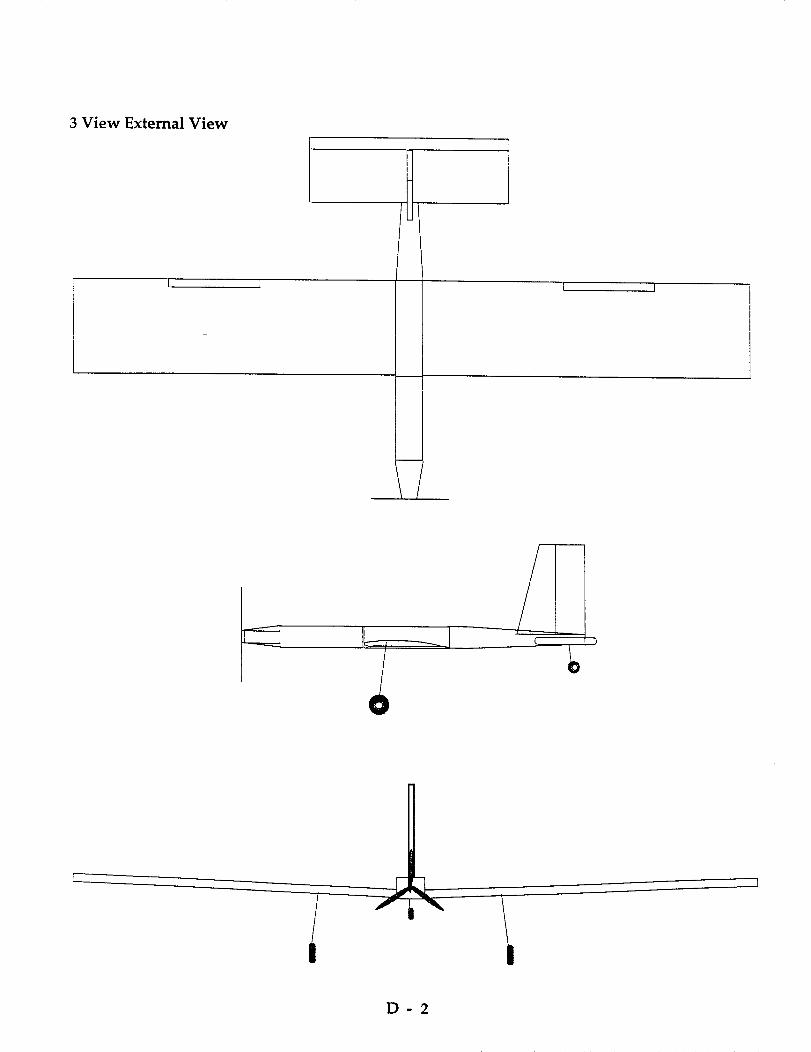
3 View External View
I J
D-2
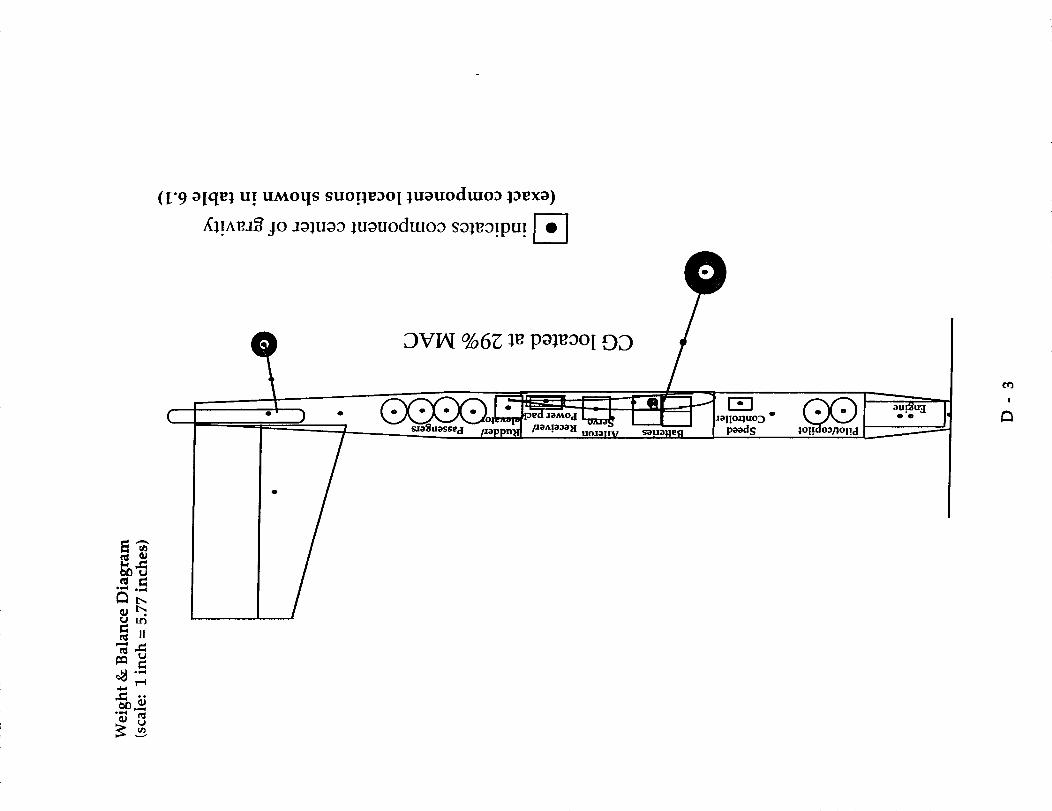
o_ o¢.,I
II
,el
._,_
(['9 alqel ui u_oqs SUOlleao I luauodmoa laexa)
,(I!AI_.I_ alO .IOlHO3 luouodtuo3 soleo!pu! I-_i i
DVIAI %6_ 1_poleooI DD
t _1__ _....,,._|" w "" "
/a sJsil uo_allV sauaHefl
JallO.qUOD ®
P_ds I . .
!

Table 6.1: Detailed Weight Breakdown
Component
Propulsion:
engine (incl mount &
gearbox)
propellerbatteries
avionics battery pack
speed controller
Structure:
Wing
Fuselage sections
enginefront
middle
tail
Vertical Tail
Horizontal Tail
Avionics:
elevator servo
rudder servo
aileron servo
receiver
Landing Gear:.
Main gear tires
Main gear struts
Tail gear tire
tail gear strut
Empty Total
Payload (passengers)
Weight (oz)
10.30 (known)
1.552 (known)
22.10 (known)
2.00 (known)
1.80 (known)
17.02 (_t.)
1.97(_t.)
3.95(_t.)
4.24(_t.)
6.67(_t.)
1.31(_t.)
2.76(_t.)
0.74 (known)
0.74 (known)
0.74 (known)
0.95 (known)
1.16(_t.)
3.20(_t.)
0.14(_)
0.23(_t.)
83.57
0.53 (known)
Total 84.10
Location
(inches from nose)
3.00
0.0
17.35
24.25
12.75
17.93
4.19
9.63
20.00
35.38
39.40
39.40
26.50
26.50
21.25
24.25
15.42
16.37
41.60
41.42
D-4

Figure 9.1: V-N Diagram
(+) n 3
(-)
5
0 "
Vstall
Velocity(f t/s)
n = 4.75
Vcruise
CLmax
-CLmax
gust line
gust line
D-5

Figure 5.2: Determining the Most Efficient Three-Bladed Propeller
0.9
0.8 ,.,.,._ ---- -_-_'-.,,,_ ---.._.
0.7 _.s ,.,,
j ",= 0.6
__ 0.5uJ /
0.4-
0.3},..
CL
0.2
0.1
0-
0.2 0.3 0.4 0.5 0.6 0.7 0.8
Advance Ratio (J)
10-8
Efficiency (Cruise) = .82
_, 11 -7
0.9
D-6
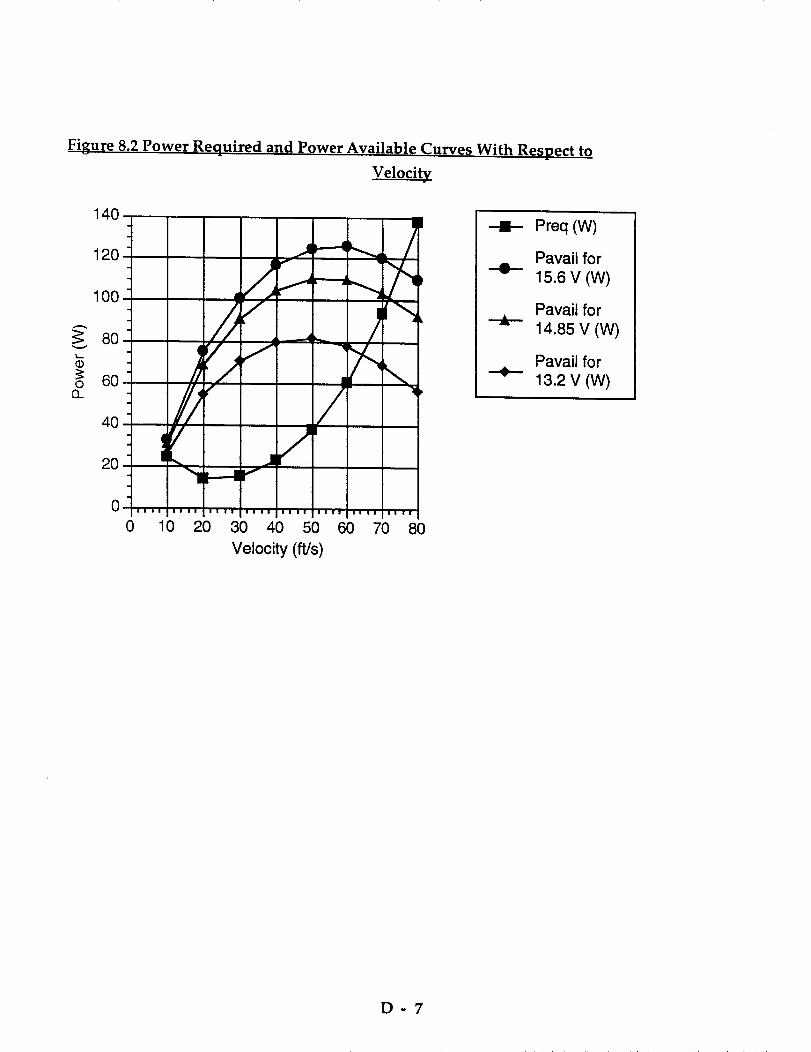
Figure 8.2 Power Required and Power Available Curves With Respect to
Velocity
140
120
--I!-- Preq (W)
Pavaii for..-0..
15.6 V (W)
Pavail for
14.85 V (W)
Pavail for
13.2 V (W)
0
0 10 20 30 40 50 60 70
Velocity (ft/s)
80
D-7
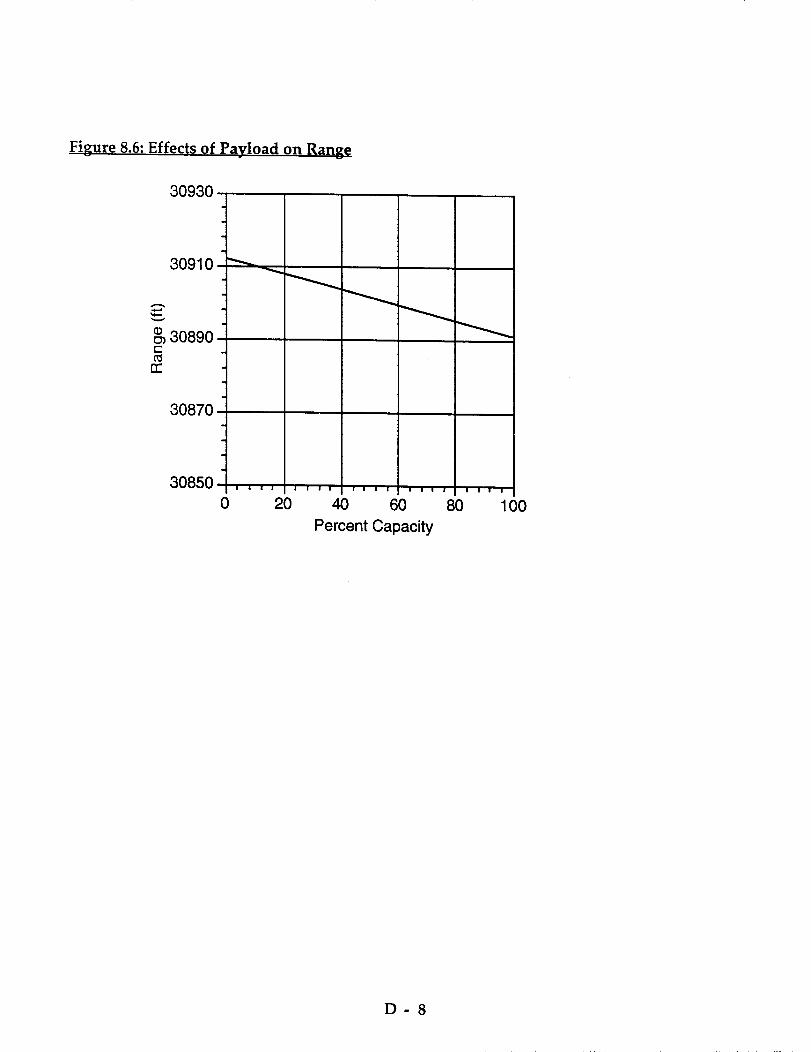
Figure 8.6: Effects of Payload on Range
30930
30910
30890c-
rr
30870
30850
0 20 40 60
Percent Capacity
80 100
D-8

Airfoil Lift Curve (DFI01)
D-9

Figure 4.4: Lift Curve Slope for Complete Configuration Aircraft
1,2-
1
= o.8; -__.
U 0.4- '_
0 2 4 6 8 10 12 14
Alpha (deg)
D - 10

Figure 4.5
Complete Aircraft Configuration Drag Polar
0.8-
t_
._ 0.6-
0.4-
0.2-
Oi
0
c ruise_
0.01 0.02 0.03
takeofE
0.04 0.05 0.06
CD (aircraft)
0.07 0.08 0.09 0.1
D - 11
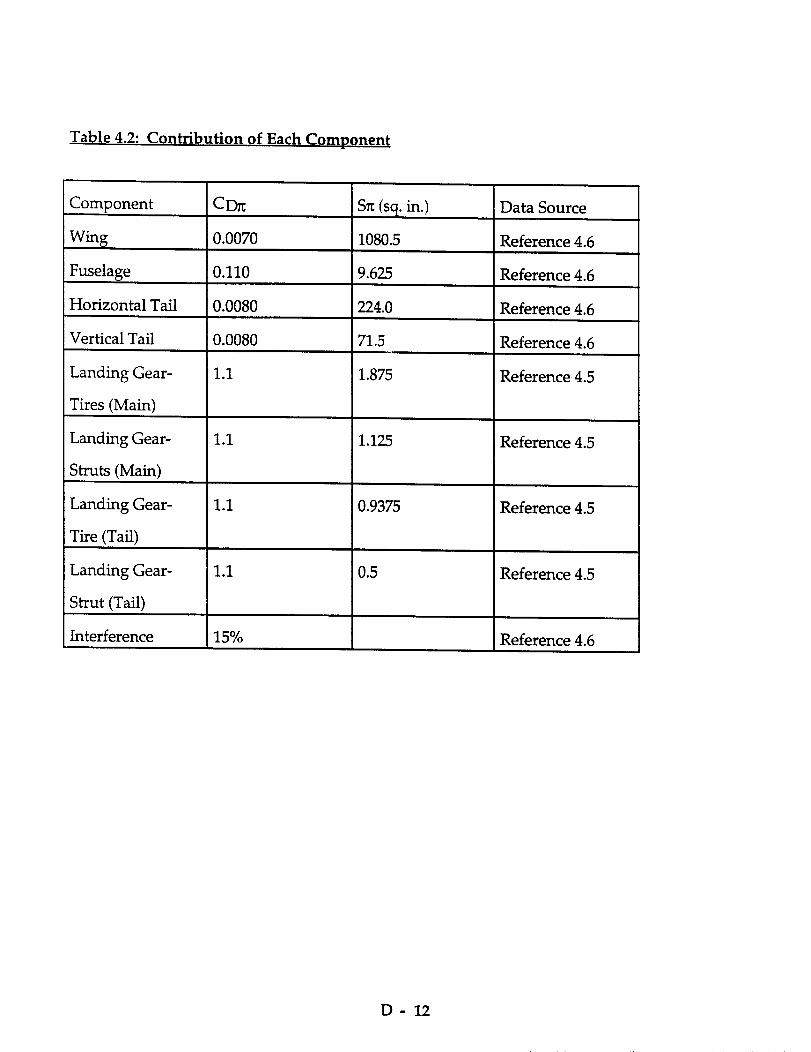
Table 4.2: Contribution of Each Component
Component
Wing
Fuselage
Horizontal Tail
Vertical Tail
Landing Gear-
Tires (Main)
Landing Gear-
Struts (Main)
Landing Gear-
Tire (Tail)
Landing Gear-
Strut (Tail)
CD_
0.0070
0.110
0.0080
0.0080
1.1
1.1
1.1
1.1
9.625
224.0
71.5
1.875
1.125
0.9375
0.5
Data Source
Reference 4.6
Reference 4.6
Reference 4.6
Reference 4.6
Reference 4.5
Reference 4.5
Reference 4.5
Reference 4.5
Interference 15% Reference 4.6
D- 12

Figure 4.7: Comparison of High and Low Speed Cruise Efficiency14
12
10
8
6
4
/)
-4 -2 0
2
0
-2
-4
-6
)f \
L/D max
L/D high-speed cruise
2 4 6 8
Angle of Attack (deg)
10 12 14
D - 13
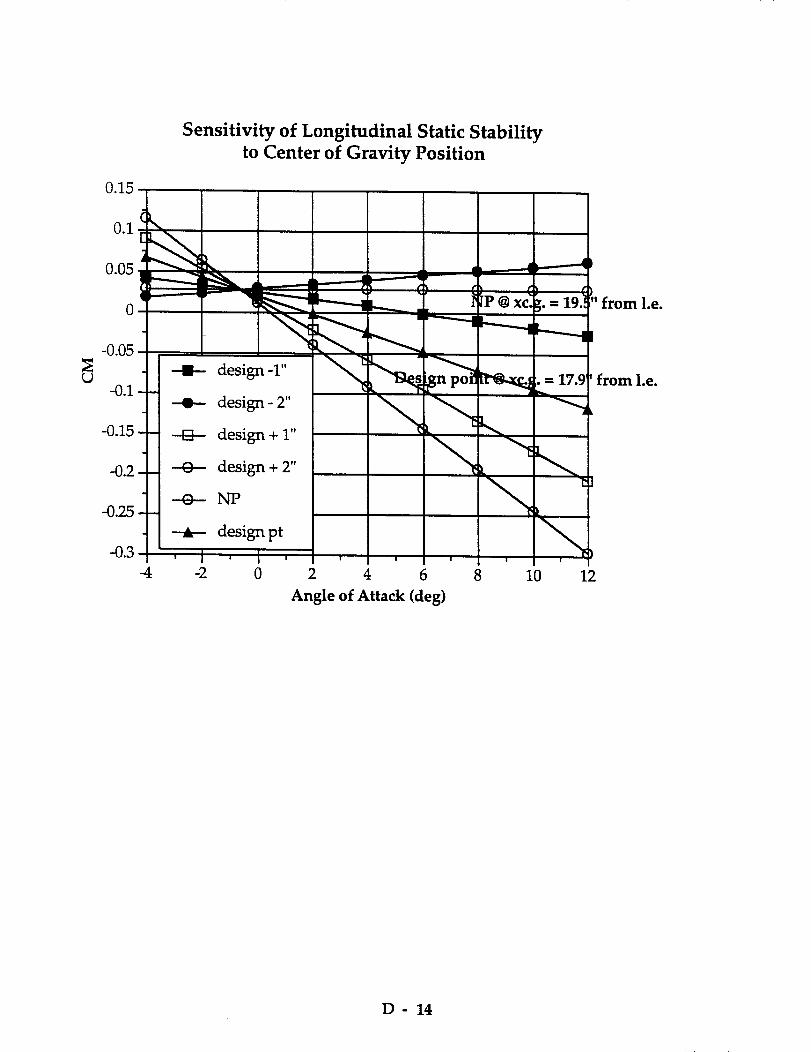
(.9
Sensitivity of Longitudinal Static Stabilityto Center of Gravity Position
0.15
4 -2 0 2 4 6
Angle of Attack (deg)
8 10 12
' from I.e.
from I.e.
D - 14
APPENDIX E
m PROP 123 PROGRAM
- TAKEOFF PERFORMANCE
PROGRAM
m RADIO PILOTEDVEHICLESPREADSHEET

ten
PERFORMANCE ESTIMATE
Fractional rad, X:
Radial position, r:
Blade chord, C:
Thickness, In:
Thickness ratio, T:
Blade Angle, Beta:
Geometric Pitch,GP:
Solidity, S:
0 30
1 5O
0 8O
0 i0
0 15
40 50
8 i0
0.154
0 45
2 3O
0 9O
0 I0
0 15
29 40
8 00
0.165
0.60 0.70
3.00 3.50
0.90 0.80
0.i0 0.i0
0.15 0.15
23.20 20.20
8.10 8.10
0.166 0.154
0 75
3 80
0 8O
0 i0
0 15
18 9O
8 i0
0.145
0 8O
4 00
0 70
0 i0
0 15
17 80
8 i0
0.134
0.85 0.90 0.9
4.30 4.50 4.8(
0.60 0.60 0.5(
0.i0 0.i0 0.i(
0.15 0.15 0.i!
16.80 15.90 15.1(
8.00 8.00 8.1(
0.124 0.113 0.09!
THRUST, POWER, EFFICIENCY, AND VELOCITIES
J: 0.320 0.380 0.430 0.490 0.540 0.600 0.660 0.710 0.770 0.820 0.880
Ct: 0.162 0.153 0.135 0.124 0.113 0.I01 0.088 0.073 0.058 0.042 0.035
Cp: 0.081 0.087 0.088 0.086 0.083 0.078 0.073 0.065 0.055 0.045 0.039
eta: 0.639 0.661 0.665 0.704 0.740 0.769 0.794 0.803 0.809 0.777 0.810
Mt: 0.962 0.497 0.311 0.270 0.253 0.238 0.227 0.217 0.208 0.200 0.207
RPM: 13500 11489 i0000 8852 7941 7200 6585 6067 5625 5242 4909
X
0 30
0 45
0 60
0 70
0 75
0 80
0 85
0 9O
0 95
X
0 3O
0 45
0 6O
0 70
0 75
0 8O
0 85
0 9O
0 95
X
0 3O
0 45
0 6O
0 70
0 75
0 8O
0 85
0 9O
0 95
X
0.30
Thrust Distribution: (dCt/dX vs. X and J)
J: 0.32
0.06
0.12
0.29
0.28
0.29
0.30
0.31
0.29
0.41
0 38
0 07
0 16
0 22
0 26
0 28
0 28
0 28
0 28
0 37
0 43
0 07
0 13
0 21
0 24
0 25
0 26
0.26
0.27
0.27
0 49
0 06
0 12
0 19
0 22
0 24
0 25
0 25
0 24
0 23
0.54
0 O5
0 i0
0 17
0 21
0 22
0 22
0 22
0.22
0.20
0.60
0.05
0.I0
0.15
0.18
0.19
0.20
0.20
0.20
0.18
0 66
0 04
0 O8
0 14
0 17
0 17
0 18
0 18
0 18
0 16
Torque Distribution: (dCq/dX vs. X and J)
J: 0.32
0 005
0 009
0 020
0 026
0 027
0 028
0 029
0 029
0 022
0.38
0 005
0 012
0 021
0 026
0 027
0 028
0 029
0 029
0 027
0.43
0 006
0 012
0 021
0 025
0 027
0 028
0 028
0 029
0 028
0.49
0.006
0 012
0 020
0 025
0 027
0 028
0 028
0 028
0 027
0.54
0 006
0 012
0 020
0 024
0 026
0 027
0 027
0 027
0 025
0.60
0.005
0 011
0 019
0 023
0 024
0 025
0 026
0 026
0 024
0.66
0 005
0 010
0 018
0 022
0 023
0 024
0 024
0 024
0 022
Angles of Attack (Degrees)
J: 0.32
17.40
18.50
13.40
7.30
6.60
6.50
6.10
5.50
11.70
0.38
15 80
15 60
7 i0
6 4O
6 00
5 5O
5 2O
4 70
8 6O
0 43
14 40
7 50
6 2O
5 3O
5 00
4 6O
4 3O
4 20
4 6O
0.49
8 30
6 30
5 00
4 3O
4 30
4 00
3 6O
3 30
3 00
0.54
6.20
4.80
4.10
3 50
3 30
3 i0
2 8O
2 6O
2 20
0.60
4 6O
3 5O
2 9O
2 60
2 4O
2 20
2 i0
1 8O
1.30
0.66
3 00
2 20
1 9O
1 60
1 5O
1 4O
1 20
1 i0
0 70
Reynolds Number (millions)
0 71
0 03
0 07
0 ii
0 14
0 14
0 15
0 15
0 15
0 13
0.71
0 004
0 009
0 015
0 019
0 020
0 021
0 022
0 022
0 020
0.71
1 50
0 9O
0 8O
0 70
0 6O
0 5O
0 4O
0 30
0 00
0 77
0 03
0 O5
0 09
0 ii
0 12
0 12
0 12
0 12
0 ii
0.77
0.003
0 007
0 013
0 016
0 017
0 018
0 019
0 019
0 018
0.77
0.00
-0.30
-0.20
-0.20
-0.20
-0.30
-0.30
-0.40
-0.60
0 82 0
0 02 -0
0 03 -0
0 06 0
0 08 0
0 09 0
0 09 0
0 09 0
0 09 0
0 09 0
0.82 0._
O. 002 0 O(
O. 005 -0 O(
O. 010 00:
O. 013 00[
O. 014 00[
0. 015 0 0:
0. 016 0 0:
0. 016 0 0:
0. 016 0 0:
0.82 0.
-i 40 -2
-I 50 -2
-i 20 -i
-I i0 -i
-i I0 -i
-i i0 -i
-i i0 -0
-i 20 -0
-I 20 -0
J: 0.32 0.38 0.43 0.49 0.54 0.60 0.66 0.71 0.77 0.82 0._
0.07 0.06 0.06 0.05 0.05 0.04 0.04 0.04 0.04 0.04 0.<
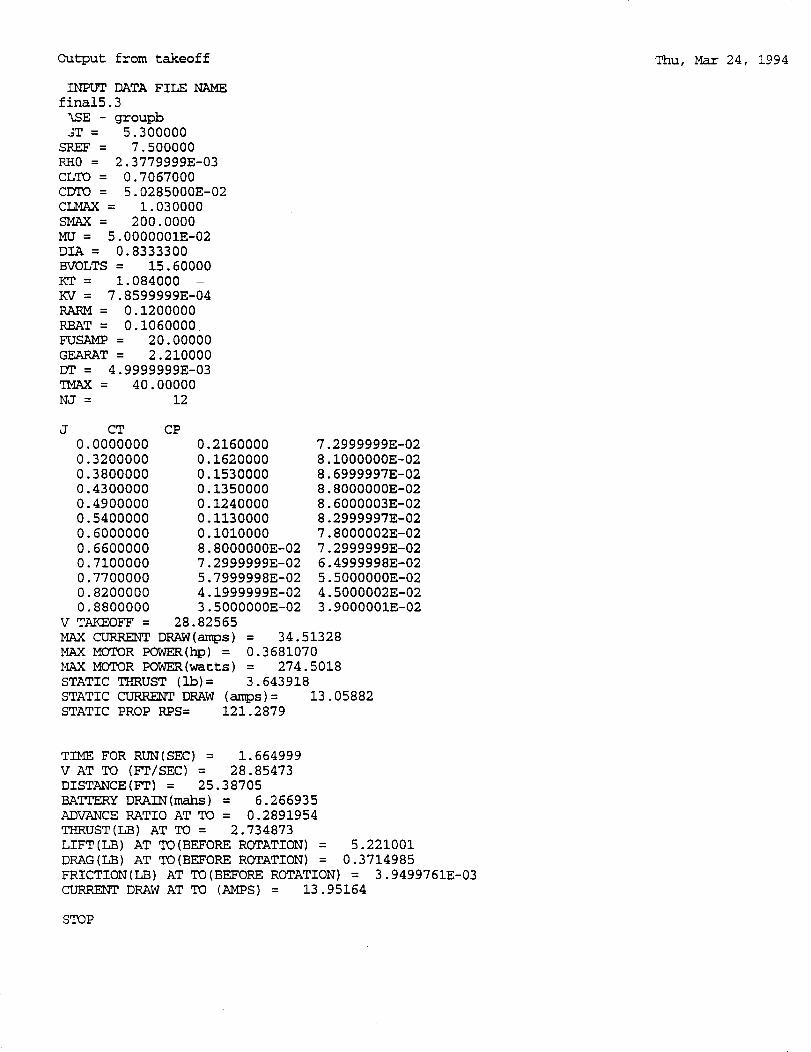
Output from takeoff Thu, Mar 24, 1994
INPUTDATAFILE NAMEfinal5.3ASE- groupb
3T = 5.300000
SREF = 7.500000
RH0 = 2.3779999E-03
CLTO = 0.7067000
CDTO = 5.0285000E-02
CLMAX = 1.030000
SMAX = 200.0000
MU = 5.0000001E-02
DIA = 0.8333300
BVOLTS = 15.60000
KT = 1.084000 -KV = 7.8599999E-04
RARM = 0.1200000
RBAT = 0.1060000_
FUSAMP = 20.00000
GEARAT = 2.210000
DT = 4.9999999E-03
TMAX = 4O.O0OOO
NJ = 12
J CT CP
0.0000000 0.2160000 7.2999999E-02
0.3200000 0.1620000 8.1000000E-02
0.3800000 0.1530000 8.6999997E-02
0.4300000 0.1350000 8.8000000E-02
0.4900000 0.1240000 8.6000003E-02
0.5400000 0.1130000 8.2999997E-02
0.6000000 0.1010000 7.8000002E-02
0.6600000 8.8000000E-02 7.2999999E-02
0.7100000 7.2999999E-02 6.4999998E-02
0.7700000 5.7999998E-02 5.5000000E-02
0.8200000 4.1999999E-02 4.5000002E-02
0.8800000 3.5000000E-02 3.9000001E-02
V TAKEOFF = 28.82565
MAX CURRENT DRAW(amps) = 34.51328
MAX MOTOR POWER(hp) = 0.3681070
MAX MOTOR POWER(watts) = 274.5018
STATIC THRUST (Ib)= 3.643918
STATIC CURRENT DRAW (amps)= 13.05882STATIC PROP RPS= 121.2879
TIME FOR RUN(SEC) = 1.664999
V AT TO (FT/SEC) = 28.85473
DISTANCE(FT) = 25.38705
BATYERY DRAIN(mahs) = 6.266935ADVANCE RATIO ATTO = 0.2891954
THRUST(LB) AT TO = 2.734873
LIFT(LB) AT TO(BEFORE ROTATION) =
DRAG(LB) AT TO(BEFORE ROTATION) =
FRICTION(LB) AT TO(BEFORE ROTATION) =
CURRENT DRAW AT TO (AMPS) = 13.95164
5.221001
0.3714985
3.9499761E-03
STOP
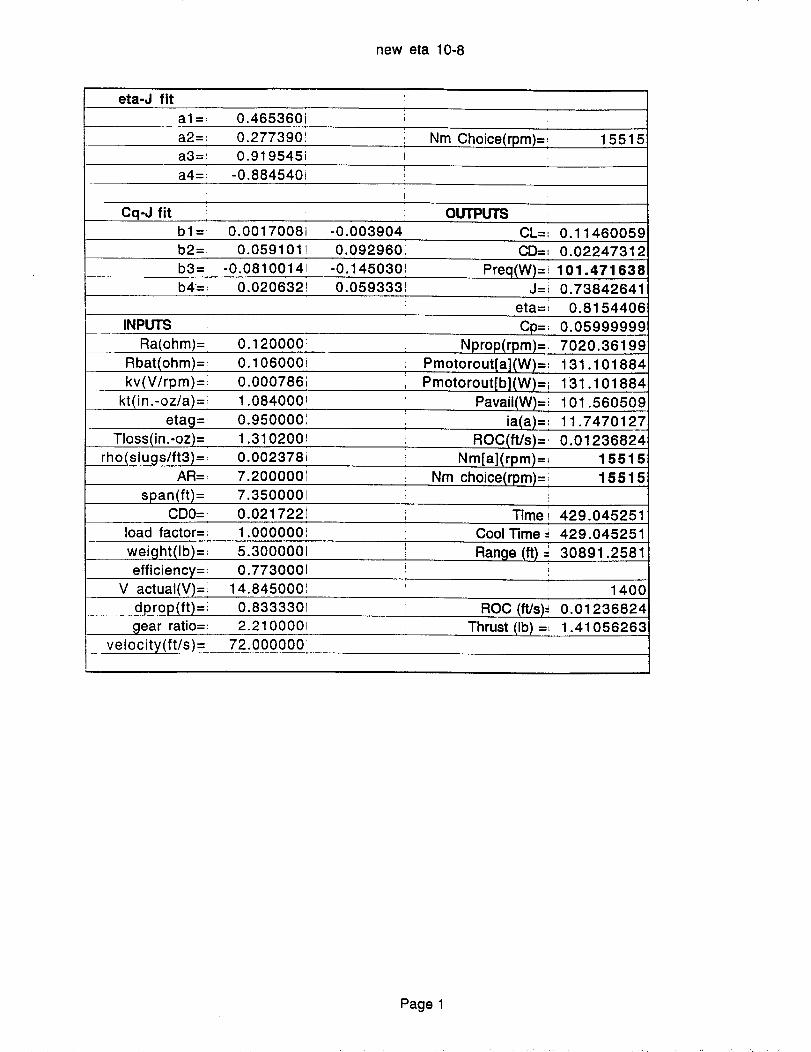
new eta 10-8
eta-J fit
al=_ 0.465360i
a2=: 0.277390'
a3== 0.919545iNm Choice(rpm)=, 15515
a4=: -0.8845401
Cq-J fit i OUTPUTSbl=i 0.00170081 -0.003904 _ CL=i 0.11460059
b2=i 0.059101! 0.092960' C_-i 0.02247312
b3='. -0.08100141 -0.145030 Preq(W)=i 101.471638
b_--* 0.020632! 0.059333! J=_ 0.73842641eta=i 0.8154406
INPUTS Cp== 0.05999999Ra(ohm)= 0.120000: Nprop(rpm)=:
Rbat(ohm)=_
kv(V/rpm)=i
0.106000_
0.0007861Pmotorout[a](W)=,
Pmotorout[b](W)=ikt(in.-oz/a)= 1.084000! Pavail(W)=i
etag= 0.9500001
Tloss(in.-oz)= 1.3102001
rho(slugs/ft3)= 0.002378iAR= 7.200000t
7020.36199131.1018841
131.1018841
101.560509
ia(a)=: 11.7470127
ROC(ft/s)=+ 0.01236824
Nm[a](rpm)=, 15515
Nm choice(rpm)= i 15515span(ft)= 7.3500001 +
CDO= 0.021722i Timel 429.045251
load factor= 1.000000! Cool Time .- 429.0452515.3000001
0.7730001 !weight(Ib)=
efficiency=Range (if) =
I
30891.2581
V actual(V)=; 14.845000
dprop(ft)=i
gear ratio=_
velocity(ft/s)=
0.833330
2.210000
72.000000
ROC (ft/s)=Thrust (Ib) =_
1400
0.01236824
1.41056263
Page 1

APPENDIX F
- INCIDENCE ANGLES AT HIGH-SPEED CRUISE
- STEADY ROLL RATE EQUATION

INCIDENCE ANGLES AT HIGH-SPEED CRUISE
Before solving the equations for the necessary coefficients, however, it was first
necessary to determine the incidence angles for the wing and the tail. This was
accomplished by writing the force and moment equations for the aircraft in flight at its
high-speed cruise configuration.
StCL _. CLow + __CL_t(Zt + CL_w(Z w + CLseSe _ 2W
- S [V2S
CM CMacw +CLow(X_g Xac __-- + CMc_w(_ w + CM¢zt(gt + CM_e_e = 0C
In doing so, one notices that these represent a system of two equations in the unknowns
iw and it expressed as functions of known aerodynamic coefficients by writing
(Z w = (ZFR L + i w
(Z t -- (ZFR L -- E + i t
These equations can be solved simultaneously to yield the incidence angles required for
the aircraft to be trimmed at zero angle of attack of the fuselage reference line, and thus
at a minimum drag configuration.
F-1

STEADY ROLL RATE EQUATION
The roll moment created by the ailerons stems from the incremental lift force produced
by the deflection of the control surface. Using strip theory, this incremental lift and
corresponding moment can be estimated assuming a constant lift distribution across the
span of the control surface and is given as the control power of the ailerons:
2CLctw X _;_cydyClsa- Swbw
This control power was subsequently used to determine the steady roll rate of the
aircraft, which can be estimated by considering equation 8.100 of Reference 7.2:
C1_8 a + Cl_p = 0
This equation effectively represents the balance that must exist between the roll moment
produced by the ailerons and that produced due to the damping term in order for the
aircraft to complete a steady rolling manuever. Solving the above equation for the
dimensionless roll rate, p,gives
- Pb Cl5 a
P- 2V- CI- _a
P
which can be subsequently solved for the dimensional roll rate, P, given the span and
velocity of the aircraft through the turn.
F-2

APPENDIX G
MANUFACTURING PLAN

Appendix G: MANUFACTURING PLAN
G.I: Introduction
With the concept and goals of Icarus established, it is imperative to actually
build a prototype that meets the theoretical specifications. Special attention will be
given to the weights of individual components and of the overall aircraft. In order
to meet the stated goal of high speed, minimization of weight is extremely
important. Organization, thoughtful planning, and efficiency are demanded by the
goal of producing a relatively low-cost aircraft. This plan will attempt to meet these
two goals. It will provide a detailed description of the methods and parts used in the
manufacturing process, and it will organize the work involved in the production of
the Icarus prototype.
G.2: Organization and Cost Accounting
Two main structural components -- wing and fuselage -- will be
manufactured separately. These two parts are designed to be easily attached and
removed; creating them separately will not create a problem in building the whole
prototype. A team of three will be assigned to the wing and a team of two will build
the fuselage. This division of labor will allow specialization and allow each team to
work at their own pace. The two teams will be given detailed suspense dates for
their component to ensure that steady progress is maintained. These suspense dates
are included at the end of this appendix.
Cost accounting will be accomplished through the use of team time cards. An
example of these cards is also included at the end of this section. Each team will
record the date, work time, and accomplishments made at each session. A running
total of the labor hours (hence the cost) will be kept.
G-1

Cost control will be facilitated by a detailed initial plan and layout of all wood
pieces. This plan will allow Recent Future, Inc. to cut a large volume of wood at one
sitting. Optimizing the use of the "Heavy Machinery" (Scroll Saw and Drill Press)
will minimize tooling costs, thus saving money in the overall cost of the aircraft.
Table I shows the projected use of each tool.
Table I: Projected Use of Heavy Machinery
Tool:
Scroll Saw
Drill Press
Use:
Cut (4) Airfoil templates
Cut Engine mount plywood firewall
Cut Middle sections of fuselage (balsa)
Cut (4) 3x3.5 inch plywood sections
Cut fuselage truss spars (balsa and
spruce)
Cut holes in airfoil ribs
Cut holes in fuselage mid-section
G.3: Special Construction Materials
Glue:
Two types of glue will be used in the construction of Icarus.
for wood to wood attachment is Super Jet Cyanoacrylate (CA) glue.
wood to steel will be formed with a two part Devcon 5 minute Epoxy. This glue,
specially made for metal and wood, will provide the high bond strength necessary
for structural integrity.
Covering:
Monokote will be used to cover the airplane. This heat shrink material will
maintain the aerodynamic shape and provide extra tensile strength. It will also
provide the distinctive coloring and design that will set Icarus apart in the
showroom. The Monokote will be applied by heat activation from an iron and the
steady hand of Recent Future, Inc.'s team leader.
The main glue
Attachments of
G-2

G.4: Primary Construction Components
Wing:
The wing is the single biggest and most complicated structure in the prototype
design. Therefore, the wing will be the limiting factor in the construction time.
Recent Future, Inc. will build two wings: one will be used for structural testing and
the other will be attached to the prototype. The test component wing will not have
ailerons and will not support landing gear.
The wing is composed has 24 airfoil ribs spaced at approximately four inches
intervals. These ribs will maintain the wing's aerodynamic shape. The ribs will be
cut from 1/8 inch balsa wood sheeting. Two templates will be made using the
desired airfoil shape and excess from the balsa boards. These templates will then be
used to trace the outline of the rest of the airfoils. The templates will also serve as
the inner two airfoil sections. The airfoils will be cut from the balsa sheeting with
scissors or a standard utility knife. They will be attached to either the main steel
shaft or to the tip spruce spars by CA glue.
The main load carrying component of the wing will be a thin-walled steel
shaft. This component was purchased from a subcontractor and thus has a set
geometry (48 inch span). Two templates will be joined by plywood sections and then
attached to the center of the shaft. This plywood will provide the attachment point
of the wing to the fuselage.
Since the entire length of the wing is 88 inches, spruce spars will be used to
extend the steel shaft. The ends of the shaft will be pressed to form a flat surface on
the top and bottom. 25 inch spruce spars will then be epoxied directly to the steel
shaft using Devcon two-part epoxy.
The wing will also have a curved leading edge spar, two thin upper spars, and
a trailing edge spar. The leading and trailing edge spar will help support the
13-3
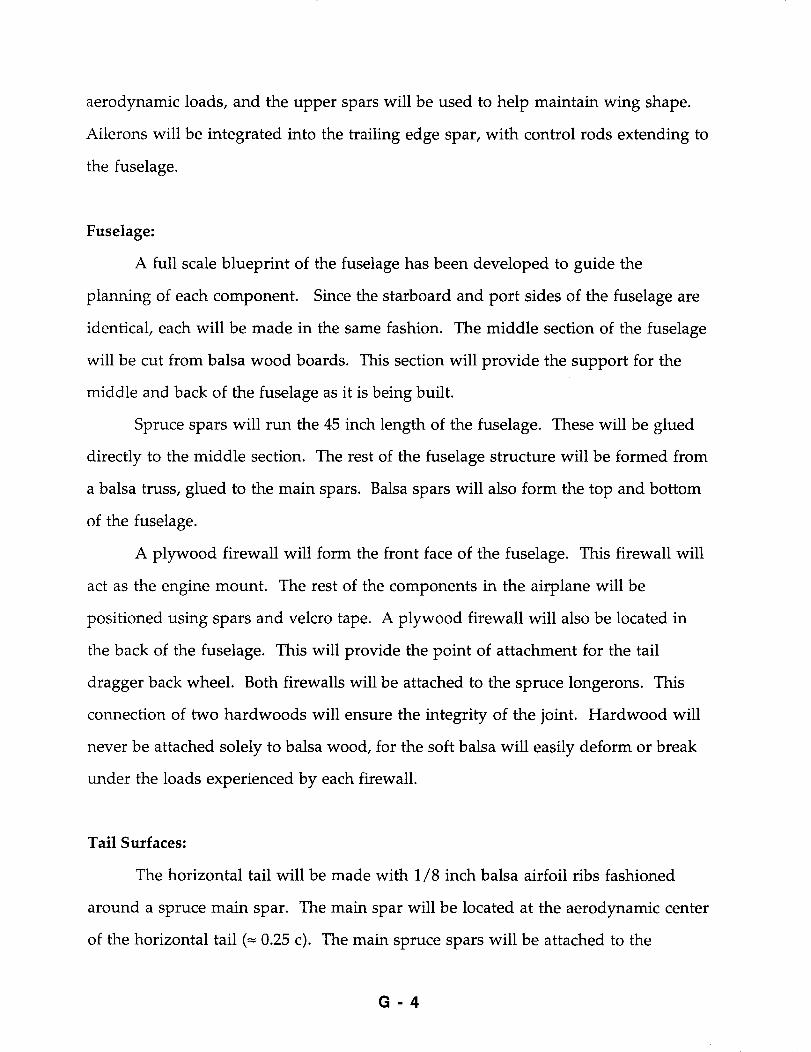
aerodynamic loads, and the upper spars will be used to help maintain wing shape.
Ailerons will be integrated into the trailing edge spar, with control rods extending to
the fuselage.
Fuselage:
A full scale blueprint of the fuselage has been developed to guide the
planning of each component. Since the starboard and port sides of the fuselage are
identical, each will be made in the same fashion. The middle section of the fuselage
will be cut from balsa wood boards. This section will provide the support for the
middle and back of the fuselage as it is being built.
Spruce spars will run the 45 inch length of the fuselage. These will be glued
directly to the middle section. The rest of the fuselage structure will be formed from
a balsa truss, glued to the main spars. Balsa spars will also form the top and bottom
of the fuselage.
A plywood firewall will form the front face of the fuselage. This firewall will
act as the engine mount. The rest of the components in the airplane will be
positioned using spars and velcro tape. A plywood firewall will also be located in
the back of the fuselage. This will provide the point of attachment for the tail
dragger back wheel. Both firewalls will be attached to the spruce longerons. This
connection of two hardwoods will ensure the integrity of the joint. Hardwood will
never be attached solely to balsa wood, for the soft balsa will easily deform or break
under the loads experienced by each firewall.
Tail Surfaces:
The horizontal tail will be made with 1/8 inch balsa airfoil ribs fashioned
around a spruce main spar. The main spar will be located at the aerodynamic center
of the horizontal tail (-- 0.25 c). The main spruce spars will be attached to the
G-4

plywood firewall in the rear of the airplane. This will connect the load bearing
component of the tail to the strongest component in the rear of the fuselage. The
trailing edge will be made from pre-formed, triangular balsa spars. This edge will be
connected to a control servo to allow elevator deflection. Monokote will provide
the hinge that connects this surface to the rest of the tail. This type of joint not only
minimizes weight, it also provides an airtight connection between surfaces; this
facet will reduce the drag of the horizontal tail.
The vertical tail will consist of a balsa wood truss. The trailing edge will be
made in the same fashion as the elevator in the horizontal tail. This surface will
provide the rudder control needed by the aircraft. The rudder will also be linked to
the rear tail wheel. This linkage will allow both surfaces to be controlled by one
servo motor.
G-5

Suspense Dates
Wing Group
9 April: All hardwood cut -- Use of Scroll Saw
All Airfoil Sections Cut, Middle Sections Drilled -- Use of Drill
Press
13 April: Center Structure finished for both Test and Wing component
14 April: Main landing gear shaped
Spruce Spars attached to Test Component
15 April: Spruce Spars attached to Wing component
17 April: All structure of Test Component completed
Ribs attached to Wing Component
Landing Gear attached to Wing component
18 April: Test Component Monokoted
Ailerons Integrated into Wing Component
19 April:
20 April:
21 April:
24 April:
25 April:
27 April:
Test Component Validation Test
Wing Component Completed: Monokote finished
RoUout
All external design finished
Taxi Test
Indoor Test Flight
G-6

Suspense Dates
Fuselage Group
9 April:
12 April:
15 April:
17 April:
Firewalls cut -- Use of Scroll Saw
Vertical and diagonal side spars cut -- Use of Scroll Saw
Holes in middle fuselage cut -- Use of Drill Press
Fuselage sides completed
Sides joined, firewalls installed
Horizontal Tail completed
All intemal components fixed
19 April:
20 April:
21 April:
24 April:
25 April:
27 April:
Vertical Tail completed
All control surfaces tested, All Monokote finished
Rollout
All external design finished
Taxi Test
Indoor Test Flight
G-7

Fuselage Team Time Card: Bryan FarrensMacy Hueckel
Date TotalHrs
Labor
(Hrs "10)Description Tooling Cost:
(TO+S/ran*ran)
TotalCost:
G-8

Appendix H
Flight Validation, Component Testand
Manufacturing Hours

Flight Validation Testing Review
April 21-27, 1994
The Icarus-Rewaxed
Summary;
The technology demonstrator was completed on schedule. Initial taxi
tests indicated flaws in the landing gear design and installation.
Modifications were made and the taxi performance improved. A
number of short flights were achieved but the handling and control
characteristics of the aircraft limited the ability to fly in theconstrained Loftus test environment.
Taxi Testing Results: April 2 I, 1994
Ground handling was severely limited by the flexibility of the
landing gear. It was discovered that a glue joint had failed where the
main gear was attached to the main wing spar.
Taxi Testin_ Results: Aoril 26. 1994
Ground handling of the aircraft was significantly improved with
modifications to the landing gear design. Steering was acceptable
although there appeared to be significant ground friction due to the
alignment of the gear. All the members of the design team were able
to control the aircraft. All the taxi tests were conducted well below
anticipated flight speeds.
Fli_ht Testin_ Results: Aoril 27, 1994
The final data sheet for the technology demonstrator is attached. A
number of take-off s, attempted take-offs and aborted flights were
conducted. The aircraft was impressive with respect to its robust
structure. It impacted the ground at a wide variety of orientations
and speeds. Initial problems appeared to be due to wing warp which
was reduced through reshrinking the wing covering. All the take-offs
were accomplished by accelerating to a speed at which the aircraft
lifted off from the on-ground attitude. Take-off distances appeared
to exceed the design goals.
In-flight the aircraft was very difficult to handle in the constrained
Loftus test environment. The ailerons were not effective and full
rudder control was needed to marginally complete an 180 ° turn. The
lack of wing dihedral and the physical limits on aileron deflection did
not allow for any "fixes" to improve this handling problem. Steady
level flight was acceptable and the aircraft was very responsive in
pitch.
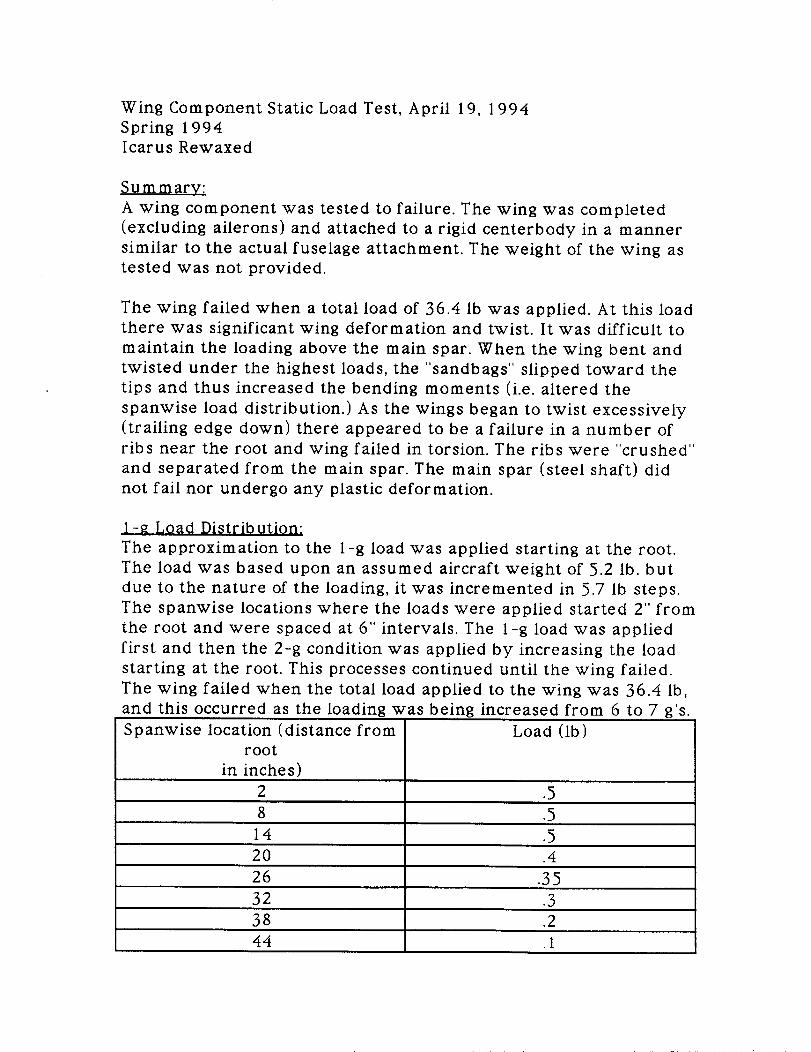
Wing Component Static Load Test, April 19, 1994Spring 1994Icarus Rewaxed
Su m mary:
A wing component was tested to failure. The wing was completed
(excluding ailerons) and attached to a rigid centerbody in a manner
similar to the actual fuselage attachment. The weight of the wing as
tested was not provided.
The wing failed when a total load of 36.4 Ib was applied. At this load
there was significant wing deformation and twist. It was difficult to
maintain the loading above the main spar. When the wing bent and
twisted under the highest loads, the "sandbags" slipped toward the
tips and thus increased the bending moments (i.e. altered the
spanwise load distribution.) As the wings began to twist excessively
(trailing edge down) there appeared to be a failure in a number of
ribs near the root and wing failed in torsion. The ribs were "crushed"
and separated from the main spar. The main spar (steel shaft) did
not fail nor undergo any plastic deformation.
I-_ Load Distribution:
The approximation to the 1=g load was applied starting at the root.
The load was based upon an assumed aircraft weight of 5.2 lb. but
due to the nature of the loading, it was incremented in 5.7 Ib steps.
The spanwise locations where the loads were applied started 2" from
the root and were spaced at 6" intervals. The l-g load was applied
first and then the 2-g condition was applied by increasing the load
starting at the root. This processes continued until the wing failed.
The wing failed when the total load applied to the wing was 36.4 Ib,
and this occurred as the loading was being increased from 6 to 7 g's.
Spanwise location (distance from Load (Ib)
root
in inche s)
2 .5
8 .5
14 .5
20 .4
26 .35
32 .3
38 .2
44 .I

Wing Tip Deflection:
The tip deflection was measured as the load was increased. The tip
deflection is presented for even increments in load factor and the
last data point taken before failure.
Total Load (Ib) - Both wings
5.7
Tip Deflection (in)
1.25
11.4 3.O
17.1 5.O
22.8 6.25
28.5
34.2
8.5
12.5
Additional Information:
Aircraft Weight = 5.2 Ib (estimate at this time)
Wing Weight = 17.5 oz

-t
Comparison Between Design and Actual Aircraft Data
Wing Span
Wing Area
Vertical Tail Area
Horizontal Tail Area
Wing Structural Weight
Wing Structural Weight
Design Value
Monokote)
no Monokote)
_._ _2
/'78.2 t_
22q ,_ 2
/7,1 o_
/3.0 "_
Actual Value
'7.'; (? a.
/7o_. 2-,, _
/_.3_
Fuselage Structural Weight (Monokote)
Fuselage Structural Weight (no Monokote)
Vertical Tail Weight (Monokote)
Vertical Tail Weight (no Monokote)
/q.% o_
/._/o_
L7
7
/.,// %
o ,_oe
Horizontal Tail Weight (Monokote) 2. _ o _ z. _3
Horizontal Tail Weight (no Monokote) /. ,_,o_
Landing Gear Weight _, _s _ _;_ _J . _;,__
Propeller Type
Propeller Weight /, r
Total Aircraft Weight (post-construction) _._, i_s _. _ 2A_
Total Aircraft Weight (post-flight) 5-.;z, /_s
CG Location (post-construction) /_. _ ,_ _,o,..,.o_
CG Location ipost-flight) /_._ ,, ;_o_,,o>.
Weight of Batteries __. / o_, z _. _v
Please list any other deviations of the technology demonstrater from the original
_'¢_ ,r ..,/ ('O'_f ' '
I -./ t I '
s-e ca_ _ Dr_ ca_
oF ImO_ _OAUl_
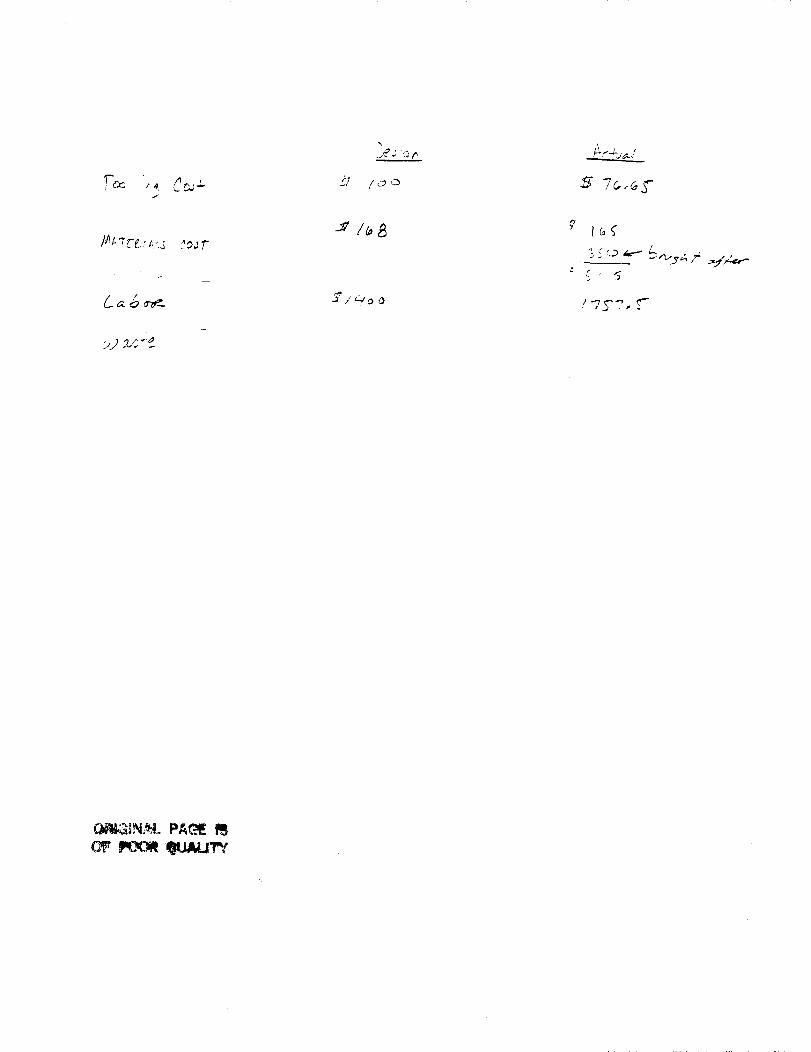
)/_t."TEE./_,:j
L._,5 ,,-__
:,J_z,:"£
C +_.1 l o o
J i'af. _o
_N_. PAC_ !_

Wing Team Time Card: Matt Barrents
B_4ii't Capozzi
Keri Ramsey
ON
r.- _t4.
:( - _.
..4-- _ _' 5
t
--.:L2L_.C. /
j/
o_/ 2._,,_" t._"
.f
!
//
/
Date Labor Description Tooling Cost: Total
(Hrs "10) (TO+$/mn*mn) Cost:
14
A .....
Total Hrs
GitK!
,. ,.., ,,_, ',,-_
):.2, .'_ ....
I
[
__,._w,_ _.,__¢_ _
_ ,r1_.,_,, _._,
j _ (_,.. t ",a _ ,'_
Jl_ ,"J" ;
_'_5 6,--_ "_''.::.',3.
:-'L;. 5e, '.o i_;,,_ #
a:go \Z:\:
C_,_oiqt_N/_d. PA_ lib

Z
I
C-F. _2
///
,I
i
./
. ,Jr"
/ _'-'c 7 .. ..,_--;
t _c,_t-.w,l f:.} _-,._l "--_..__._......__.....
\
i
/'
i
/
i
t
\
/i
,.."
C_ pOC_ _ulku'rY


![Fairy Tail - Volume 2 - Capitulo 9 [AnimaKong]](https://img.pdfslide.us/doc/110x75/587e77bd1a28abd6038b46f1/fairy-tail-volume-2-capitulo-9-animakong.jpg)