Embed Size (px)
Citation preview
OPECOrganization of the Petroleum Exporting Countries
Monthly Oil Market Report
Obere Donaustrasse 93, A-1020 Vienna, AustriaTel +43 1 21112 Fax +43 1 2164320 Telex 134474 E-mail: [email protected]
November 2003
Oil Market Highlights
Feature Article
Highlights of the world economy
Crude oil price movements
Product markets and refinery operations
The oil futures market
The tanker market
World oil demand
World oil supply
Rig count
Stock movements
Balance of supply and demand
1
3
5
9
12
14
15
17
22
25
26
29
Feature Article:The petroleum product market and oil price volatility
____________________________________________________________________Monthly Oil Market Report
November 2003 1
Oil Market Highlights
§ World GDP is forecast to grow by 3.5% in 2003, a rise of 0.3% over last month’s estimate. This increase reflects the
widening base of the economic recovery that began in the USA and has spread to South East Asia and Japan. The GDP of the US grew at higher than expected annual rate of 7.2% in the third quarter, supported by better employment data for October and September. Third quarter data for Japan also surpassed expectations with GDP rising by 2.2% at an annual rate. However, the Euro-zone continued to lag other advanced economies, growing by a meager 1.6% in the same period.
§ Asia saw the largest changes in growth estimates. The Chinese economy grew by about 9% in the third quarter while
the GDP growth forecast for 2003 as a whole was raised to 8.5%. India, which benefited from a very peaceful monsoon season, is expected to see economic growth of 6.8% this year. The 2003 estimate for the Asia Pacific region also increased to 3.9% from 3.6%. Projections for Latin America and Africa did not changed significantly as the 2003 growth estimate for developing countries as a whole rose 0.1% to 3.6%.
§ Forecasts for North America and Japan for 2004 were increased to take account of the better than expected
performance the global economy in the third quarter. The forecast for Europe in 2004 was unchanged but the Asia Pacific region showed an increase of 0.1%. The world economy as a whole is forecast to grow by 4.1% in 2004, a rapid annual pace that has been seen only once since 1990.
§ Following the slump in September, the OPEC Reference Basket surged by $2.32/b or 8.43% to average $28.54/b in
October. The strong recovery of the past month pushed the year-to-date average to approach the upper limit of the price band mechanism at $27.91/b, compared to $27.84/b at the end of September. Following a small decline of 1.73% in the first week of November, the Basket has made a sustained comeback, averaging $28.61/b for the week ending 13 November and approaching the $30/b mark on 19 November when it closed at $29.79/b.
§ Product price increases generally tracked crude gains in all three markets in October, with regional fundamentals
factored in the incremental rise of each product. Refining margins were good in the US Gulf and Singapore, but plunged into negative territory in Rotterdam.
§ Crude freight rates fluctuated considerably in October, especially the VLCC rates where high tonnage availability
during the first half of the month depressed rates to nearly WS 60s on both long-haul routes out of the Middle East. Increasing oil supply, together with tight vessel availability, in the last week of the month helped rates to move up to very high levels. OPEC area spot chartering regained most of the losses of the previous two month, increasing by 3.8 mb/d to 15.43 mb/d in October, a level not seen since June 2000.
§ Given higher prospects for economic growth in 2003 and 2004, world oil demand forecasts for these years have been
revised up by 0.15 mb/d and 0.31 mb/d to 78.33 mb/d and 79.56 mb/d respectively. China’s expected rise in apparent demand of 0.44 mb/d or 8.76% in 2003 places the country at the forefront of world oil demand growth. Despite a mere 7% share of world consumption, China’s share of the world demand increase should reach 33% in the current year.
§ OPEC crude oil production in October, based on secondary sources, is estimated at 27.41 mb/d, an increase of 0.25
mb over the September figure. Non-OPEC oil supply for 2003 is forecast at 48.64 mb/d, which is 0.88 mb/d more than the 47.76 mb/d estimated for 2002. Non-OPEC supply in 2004 is expected to reach 49.89 mb/d, an increase of 1.24 mb/d over the 2003 forecast. Net FSU exports for 2002 and 2003 are estimated at 5.56 mb/d and 6.34 mb/d respectively, and expected to rise to 6.85 mb/d in 2004.
§ US commercial onland oil stocks remained almost unchanged during the period of 3-31 October, while crude stocks
continued their upward trend, increasing 6.3 mb. In Eur-16, total oil stocks decreased by 6.3 mb, mainly due to a decline in middle distillates, as crude oil stocks rose 1.5 mb. In September, Japan’s commercial oil stocks displayed a slight build of 2.3 mb, mainly due to an increase in kerosene. At the end of the third quarter, OECD commercial oil stocks registered a strong 71 mb build over the previous quarter to now stand 23 mb above the same period last year.

Monthly Oil Market Report ___________________________________________________________________
November 2003 2
____________________________________________________________________Monthly Oil Market Report
November 2003 3
The Petroleum Product Market and Oil Price Volatility
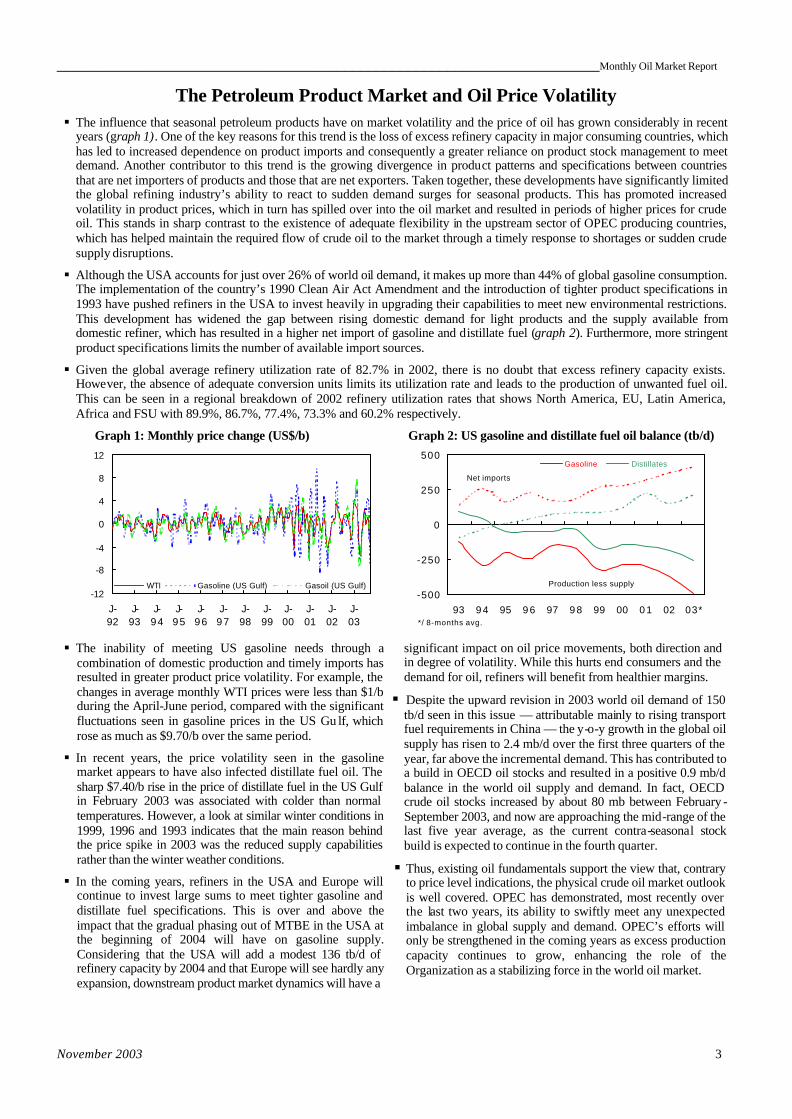
§ The influence that seasonal petroleum products have on market volatility and the price of oil has grown considerably in recent years (graph 1). One of the key reasons for this trend is the loss of excess refinery capacity in major consuming countries, which has led to increased dependence on product imports and consequently a greater reliance on product stock management to meet demand. Another contributor to this trend is the growing divergence in product patterns and specifications between countries that are net importers of products and those that are net exporters. Taken together, these developments have significantly limited the global refining industry’s ability to react to sudden demand surges for seasonal products. This has promoted increased volatility in product prices, which in turn has spilled over into the oil market and resulted in periods of higher prices for crude oil. This stands in sharp contrast to the existence of adequate flexibility in the upstream sector of OPEC producing countries, which has helped maintain the required flow of crude oil to the market through a timely response to shortages or sudden crude supply disruptions.
§ Although the USA accounts for just over 26% of world oil demand, it makes up more than 44% of global gasoline consumption.
The implementation of the country’s 1990 Clean Air Act Amendment and the introduction of tighter product specifications in 1993 have pushed refiners in the USA to invest heavily in upgrading their capabilities to meet new environmental restrictions. This development has widened the gap between rising domestic demand for light products and the supply available from domestic refiner, which has resulted in a higher net import of gasoline and distillate fuel (graph 2). Furthermore, more stringent product specifications limits the number of available import sources.
§ Given the global average refinery utilization rate of 82.7% in 2002, there is no doubt that excess refinery capacity exists. However, the absence of adequate conversion units limits its utilization rate and leads to the production of unwanted fuel oil. This can be seen in a regional breakdown of 2002 refinery utilization rates that shows North America, EU, Latin America, Africa and FSU with 89.9%, 86.7%, 77.4%, 73.3% and 60.2% respectively.
Graph 1: Monthly price change (US$/b) Graph 2: US gasoline and distillate fuel oil balance (tb/d)
-12
-8
-4
0
4
8
12
J-92
J-93
J-94
J-95
J-96
J-97
J-98
J-99
J-00
J-01
J-02
J-03
WTI Gasoline (US Gulf) Gasoil (US Gulf)
-500
-250
0
250
500
93 9 4 95 9 6 97 9 8 99 00 0 1 02 03*
Gasoline Distillates
Net imports
Production less supply
*/ 8-months avg.
§ The inability of meeting US gasoline needs through a combination of domestic production and timely imports has resulted in greater product price volatility. For example, the changes in average monthly WTI prices were less than $1/b during the April-June period, compared with the significant fluctuations seen in gasoline prices in the US Gu lf, which rose as much as $9.70/b over the same period.
§ In recent years, the price volatility seen in the gasoline market appears to have also infected distillate fuel oil. The sharp $7.40/b rise in the price of distillate fuel in the US Gulf in February 2003 was associated with colder than normal temperatures. However, a look at similar winter conditions in 1999, 1996 and 1993 indicates that the main reason behind the price spike in 2003 was the reduced supply capabilities rather than the winter weather conditions.
§ In the coming years, refiners in the USA and Europe will continue to invest large sums to meet tighter gasoline and distillate fuel specifications. This is over and above the impact that the gradual phasing out of MTBE in the USA at the beginning of 2004 will have on gasoline supply. Considering that the USA will add a modest 136 tb/d of refinery capacity by 2004 and that Europe will see hardly any expansion, downstream product market dynamics will have a
significant impact on oil price movements, both direction and in degree of volatility. While this hurts end consumers and the demand for oil, refiners will benefit from healthier margins.
§ Despite the upward revision in 2003 world oil demand of 150 tb/d seen in this issue — attributable mainly to rising transport fuel requirements in China — the y-o-y growth in the global oil supply has risen to 2.4 mb/d over the first three quarters of the year, far above the incremental demand. This has contributed to a build in OECD oil stocks and resulted in a positive 0.9 mb/d balance in the world oil supply and demand. In fact, OECD crude oil stocks increased by about 80 mb between February -September 2003, and now are approaching the mid-range of the last five year average, as the current contra-seasonal stock build is expected to continue in the fourth quarter.
§ Thus, existing oil fundamentals support the view that, contrary to price level indications, the physical crude oil market outlook is well covered. OPEC has demonstrated, most recently over the last two years, its ability to swiftly meet any unexpected imbalance in global supply and demand. OPEC’s efforts will only be strengthened in the coming years as excess production capacity continues to grow, enhancing the role of the Organization as a stabilizing force in the world oil market.

Monthly Oil Market Report ___________________________________________________________________
November 2003 4
____________________________________________________________________Monthly Oil Market Report
November 2003 5
Highlights of the World Economy
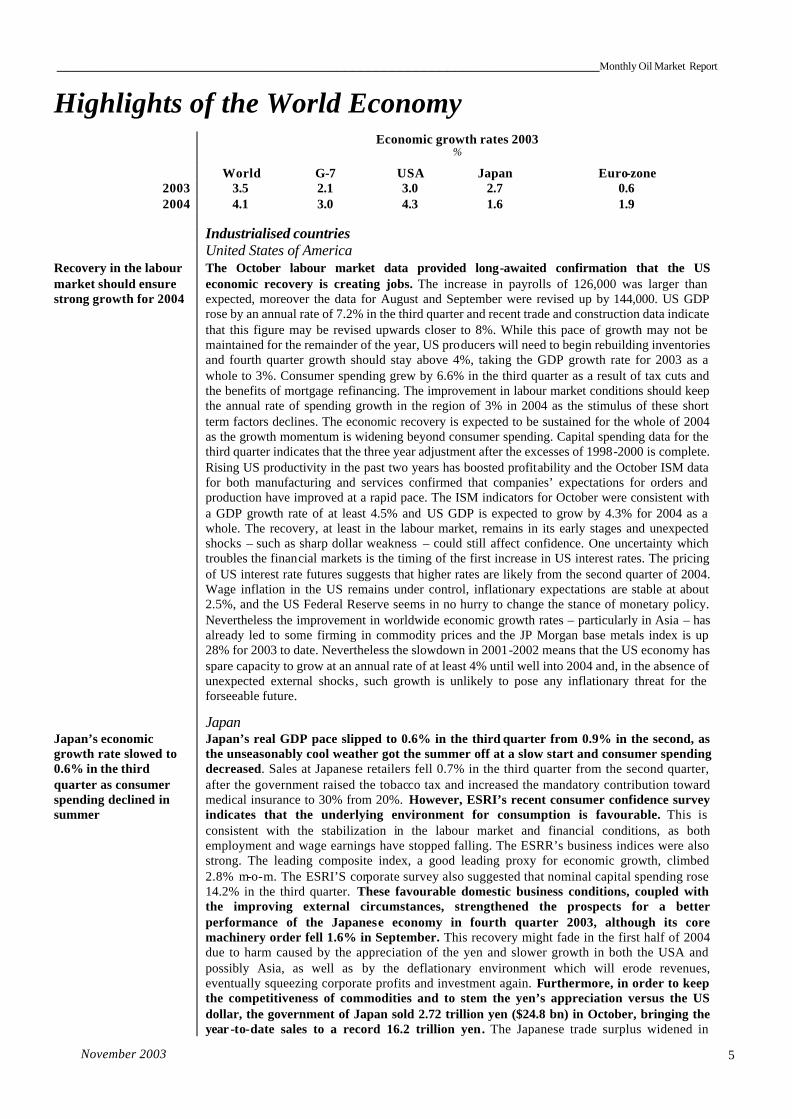
Economic growth rates 2003 %
World G-7 USA Japan Euro-zone
2003 3.5 2.1 3.0 2.7 0.6 2004 4.1 3.0 4.3 1.6 1.9
Industrialised countries United States of America Recovery in the labour market should ensure strong growth for 2004
The October labour market data provided long-awaited confirmation that the US economic recovery is creating jobs. The increase in payrolls of 126,000 was larger than expected, moreover the data for August and September were revised up by 144,000. US GDP rose by an annual rate of 7.2% in the third quarter and recent trade and construction data indicate that this figure may be revised upwards closer to 8%. While this pace of growth may not be maintained for the remainder of the year, US producers will need to begin rebuilding inventories and fourth quarter growth should stay above 4%, taking the GDP growth rate for 2003 as a whole to 3%. Consumer spending grew by 6.6% in the third quarter as a result of tax cuts and the benefits of mortgage refinancing. The improvement in labour market conditions should keep the annual rate of spending growth in the region of 3% in 2004 as the stimulus of these short term factors declines. The economic recovery is expected to be sustained for the whole of 2004 as the growth momentum is widening beyond consumer spending. Capital spending data for the third quarter indicates that the three year adjustment after the excesses of 1998-2000 is complete. Rising US productivity in the past two years has boosted profitability and the October ISM data for both manufacturing and services confirmed that companies’ expectations for orders and production have improved at a rapid pace. The ISM indicators for October were consistent with a GDP growth rate of at least 4.5% and US GDP is expected to grow by 4.3% for 2004 as a whole. The recovery, at least in the labour market, remains in its early stages and unexpected shocks – such as sharp dollar weakness – could still affect confidence. One uncertainty which troubles the financial markets is the timing of the first increase in US interest rates. The pricing of US interest rate futures suggests that higher rates are likely from the second quarter of 2004. Wage inflation in the US remains under control, inflationary expectations are stable at about 2.5%, and the US Federal Reserve seems in no hurry to change the stance of monetary policy. Nevertheless the improvement in worldwide economic growth rates – particularly in Asia – has already led to some firming in commodity prices and the JP Morgan base metals index is up 28% for 2003 to date. Nevertheless the slowdown in 2001-2002 means that the US economy has spare capacity to grow at an annual rate of at least 4% until well into 2004 and, in the absence of unexpected external shocks, such growth is unlikely to pose any inflationary threat for the forseeable future.
Japan Japan’s economic growth rate slowed to 0.6% in the third quarter as consumer spending declined in summer
Japan’s real GDP pace slipped to 0.6% in the third quarter from 0.9% in the second, as the unseasonably cool weather got the summer off at a slow start and consumer spending decreased. Sales at Japanese retailers fell 0.7% in the third quarter from the second quarter, after the government raised the tobacco tax and increased the mandatory contribution toward medical insurance to 30% from 20%. However, ESRI’s recent consumer confidence survey indicates that the underlying environment for consumption is favourable. This is consistent with the stabilization in the labour market and financial conditions, as both employment and wage earnings have stopped falling. The ESRR’s business indices were also strong. The leading composite index, a good leading proxy for economic growth, climbed 2.8% m-o-m. The ESRI’S corporate survey also suggested that nominal capital spending rose 14.2% in the third quarter. These favourable domestic business conditions, coupled with the improving external circumstances, strengthened the prospects for a better performance of the Japanese economy in fourth quarter 2003, although its core machinery order fell 1.6% in September. This recovery might fade in the first half of 2004 due to harm caused by the appreciation of the yen and slower growth in both the USA and possibly Asia, as well as by the deflationary environment which will erode revenues, eventually squeezing corporate profits and investment again. Furthermore, in order to keep the competitiveness of commodities and to stem the yen’s appreciation versus the US dollar, the government of Japan sold 2.72 trillion yen ($24.8 bn) in October, bringing the year -to-date sales to a record 16.2 trillion yen. The Japanese trade surplus widened in
Monthly Oil Market Report ___________________________________________________________________
November 2003 6
September to its highest level in more than three years as exports gained for the sixth month on rising demand from the USA and Asia. The surplus rose to a seasonally adjusted 8.9% to $9.1 bn. Exports grew 3.8% and imports rose 2%. These gains helped to cushion a drop in consumer spending, allowing the economy to grow in the third quarter. But the service deficit widened in September to a seasonally adjusted 351 bn yen from 263 bn in August, as more Japanese traveled abroad after the end of the deadly SARS epidemic in Asia.
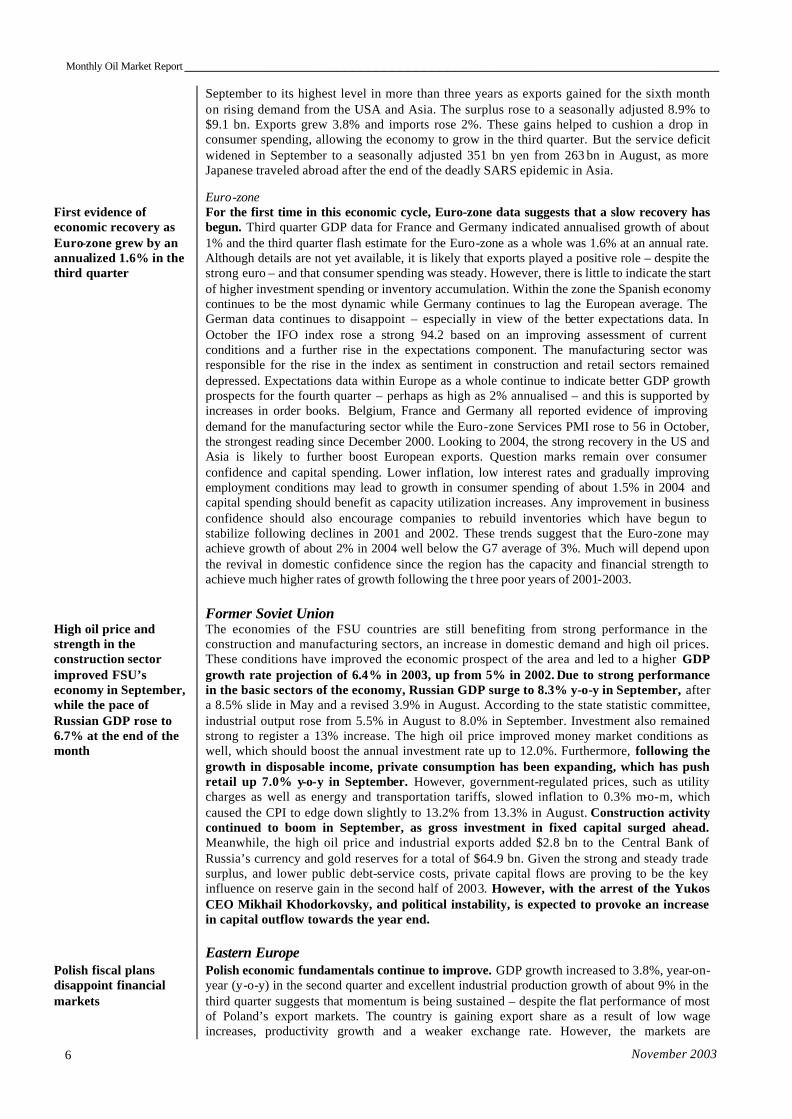
Euro-zone First evidence of economic recovery as Euro-zone grew by an annualized 1.6% in the third quarter
For the first time in this economic cycle, Euro-zone data suggests that a slow recovery has begun. Third quarter GDP data for France and Germany indicated annualised growth of about 1% and the third quarter flash estimate for the Euro-zone as a whole was 1.6% at an annual rate. Although details are not yet available, it is likely that exports played a positive role – despite the strong euro – and that consumer spending was steady. However, there is little to indicate the start of higher investment spending or inventory accumulation. Within the zone the Spanish economy continues to be the most dynamic while Germany continues to lag the European average. The German data continues to disappoint – especially in view of the better expectations data. In October the IFO index rose a strong 94.2 based on an improving assessment of current conditions and a further rise in the expectations component. The manufacturing sector was responsible for the rise in the index as sentiment in construction and retail sectors remained depressed. Expectations data within Europe as a whole continue to indicate better GDP growth prospects for the fourth quarter – perhaps as high as 2% annualised – and this is supported by increases in order books. Belgium, France and Germany all reported evidence of improving demand for the manufacturing sector while the Euro-zone Services PMI rose to 56 in October, the strongest reading since December 2000. Looking to 2004, the strong recovery in the US and Asia is likely to further boost European exports. Question marks remain over consumer confidence and capital spending. Lower inflation, low interest rates and gradually improving employment conditions may lead to growth in consumer spending of about 1.5% in 2004 and capital spending should benefit as capacity utilization increases. Any improvement in business confidence should also encourage companies to rebuild inventories which have begun to stabilize following declines in 2001 and 2002. These trends suggest that the Euro-zone may achieve growth of about 2% in 2004 well below the G7 average of 3%. Much will depend upon the revival in domestic confidence since the region has the capacity and financial strength to achieve much higher rates of growth following the t hree poor years of 2001-2003.
Former Soviet Union High oil price and strength in the construction sector improved FSU’s economy in September, while the pace of Russian GDP rose to 6.7% at the end of the month
The economies of the FSU countries are still benefiting from strong performance in the construction and manufacturing sectors, an increase in domestic demand and high oil prices. These conditions have improved the economic prospect of the area and led to a higher GDP growth rate projection of 6.4% in 2003, up from 5% in 2002. Due to strong performance in the basic sectors of the economy, Russian GDP surge to 8.3% y-o-y in September, after a 8.5% slide in May and a revised 3.9% in August. According to the state statistic committee, industrial output rose from 5.5% in August to 8.0% in September. Investment also remained strong to register a 13% increase. The high oil price improved money market conditions as well, which should boost the annual investment rate up to 12.0%. Furthermore, following the growth in disposable income, private consumption has been expanding, which has push retail up 7.0% y-o-y in September. However, government-regulated prices, such as utility charges as well as energy and transportation tariffs, slowed inflation to 0.3% m-o-m, which caused the CPI to edge down slightly to 13.2% from 13.3% in August. Construction activity continued to boom in September, as gross investment in fixed capital surged ahead. Meanwhile, the high oil price and industrial exports added $2.8 bn to the Central Bank of Russia’s currency and gold reserves for a total of $64.9 bn. Given the strong and steady trade surplus, and lower public debt-service costs, private capital flows are proving to be the key influence on reserve gain in the second half of 2003. However, with the arrest of the Yukos CEO Mikhail Khodorkovsky, and political instability, is expected to provoke an increase in capital outflow towards the year end.
Eastern Europe Polish fiscal plans disappoint financial markets
Polish economic fundamentals continue to improve. GDP growth increased to 3.8%, year-on-year (y-o-y) in the second quarter and excellent industrial production growth of about 9% in the third quarter suggests that momentum is being sustained – despite the flat performance of most of Poland’s export markets. The country is gaining export share as a result of low wage increases, productivity growth and a weaker exchange rate. However, the markets are
____________________________________________________________________Monthly Oil Market Report
November 2003 7
disappointed in the budget plans for both 2004 and the longer term. Increasing concern over the fiscal outlook has had a negative effect on sentiment, which has increased Poland’s five-year interest rates by more than 1% in the past two months. The Polish government also postponed its target date for achieving the Maastricht budget limit of 3% of GDP until 2007. Hungary’s economic growth slowed to 2.4% y-o-y in the second quarter and further deceleration is likely until well into 2004. The only stimulus to growth in 2003 has been consumer spending and falling consumer confidence suggests that this momentum will not be maintained. The Hungarian forint has stabilised at around 250-260 to the euro but higher interest rates may be necessary if the current account continues to deteriorate.
OPEC Member Countries
Non-oil sectors in some OPEC Member Countries to provide marginal GDP growth
The expected decline in oil output and prices will slow economic growth in most OPEC Member Countries, after the strong expansion expected this year due to rising oil values. However, the non-oil sector could make some contribution to growth, albeit marginal. For instance, in Saudi Arabia the economic growth in 2004 is expected to benefit with the start of some foreign investment in the country’s gas resources, the prospected FDI in downstream energy, water projects and telecommunication sector, while the non-oil private sector should strengthen further. In 2005, the onset of high levels of FDI, particularly in the energy and water sectors, as well as continued growth in the non-oil economy should contribute to a rise in real GDP growth of about 2.0%. This year should see an economic expansion of 5%, sliding to 2.4% in 2004. In Venezuela, the greatest opportunities for private sector investments are in hydrocarbons, banking, mining and metals. Venezuela offers a number of comparative advantages to investors with a long-term perspective, such as inexpensive and abundant raw materials and energy supply, a relatively modern road infrastructure, and a strategic location for trade with the USA, Europe and Latin America. Despite these strengths, GDP is expected to contract 8.5% this year but should show a strong 5% recovery in 2004. Domestic demand in Iran – the main driver of growth – has strengthened significantly since international oil prices picked up in 2000, which has allowed restrictions on imports to be lifted and supported robust growth in non-oil industrial and manufacturing sectors. Real growth is expected to ease slightly from 6.2% this year to 6.0% in 2004, mainly as a result of the downturn in oil prices expected for the coming year.
Developing countries Despite the odds, Asia outpaced developing world growth rates, with Brazil gradually recovering and Africa anticipated to improve into the coming year
While sluggish compared to the bubble years of the 1990s, demand in the Asian technology industry has improved during the first half of 2003. However, slow OECD import demand growth is still acting as a drag on Asia’s intensively export-dependent economies, growth in emerging Asia is forecas t to be the highest among the developing countries, largely owing to strong performances in mainland China and India. Since a lack of security hampers economic growth, the latest APEC Summit in Bangkok focused more with security than economics, though still produced a less than satisfactory result. The leaders ignored the USA’s complaints about the undervalued yuan, although China did agree to study the issue. They also reiterated their commitment to free trade within APEC and to global trade liberalization under the auspices of the WTO, but offered no initiatives to bring either about. They also rejected Thailand’s suggestion to advance the deadline for the APEC free-trade area to 2015. Brazil’s GDP growth rate in the first half of the current year was only 0.3% above that registered in the same period last year and, on a seasonally adjusted basis, 1.4% below the rate recorded in the previous six months. Domestic demand remained slack, with a decline in real earnings and investment spending. However, lower interest rates in the second half of the year coupled with an expected strong showing for agricultural production and exports has kept GDP growth positive this year at 0.8% and should increase to 3.1% in 2004. Slower OECD demand also affected Sub-Saharan African exports and delayed a recovery in many commodity prices. Africa’s GDP growth rate should accelerate from 3.2% in 2003 to 4.1% in 2004 compared to 2.9% last year, as world demand improves and commodity prices rise on stronger growth in domestic expenditures. However, domestic political development and weather patterns will also shape growth prospects.
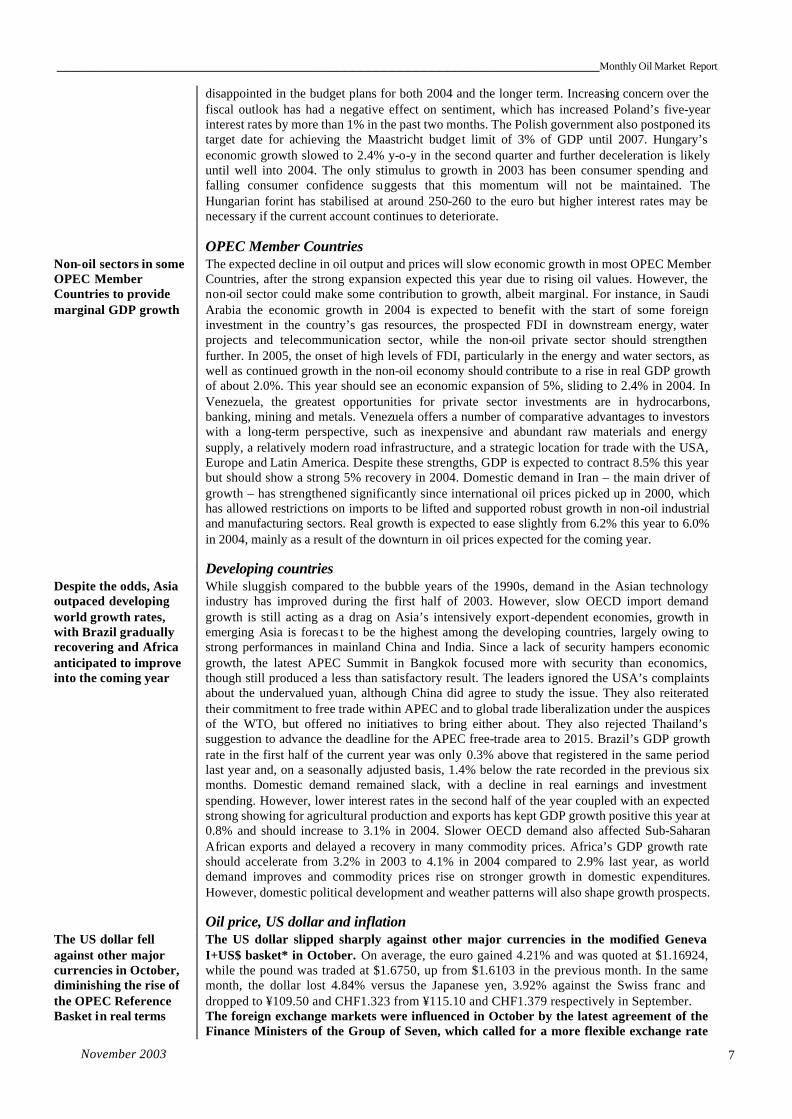
Oil price, US dollar and inflation The US dollar fell against other major currencies in October, diminishing the rise of the OPEC Reference Basket in real terms
The US dollar slipped sharply against other major currencies in the modified Geneva I+US$ basket* in October. On average, the euro gained 4.21% and was quoted at $1.16924, while the pound was traded at $1.6750, up from $1.6103 in the previous month. In the same month, the dollar lost 4.84% versus the Japanese yen, 3.92% against the Swiss franc and dropped to ¥109.50 and CHF1.323 from ¥115.10 and CHF1.379 respectively in September. The foreign exchange markets were influenced in October by the latest agreement of the Finance Ministers of the Group of Seven, which called for a more flexible exchange rate
Monthly Oil Market Report ___________________________________________________________________
November 2003 8
market. The dollar came under pressure against the yen on speculations that policy-makers will allow the US currency to weaken in the coming mo nths and sentiment that was accelerated by expectations that president G.W. Bush will ask Japan to curb its currency sales during a visit to Tokyo. The Japanese government tried to stem this movement but failed, as the market ignored their indirect intervention forcing Japanese government to sell 2.72 trillion yen in October. The dollar also lost ground against the euro after ECB’S officials welcomed the dollar weakness and the former president of the ECB said that he expected a further dollar depreciation, although not necessarily against the euro. He also expressed the hope that this adjustment will be slow and gradual. The widening current account shortfall has also placed the US dollar under downward pressure. Foreign investors appear increasingly to fund the balance of payments gap, fuelling expectations that the US dollar will depreciate further. The dollar also slipped against the pound as speculation on the lifting of the benchmark interest rate by the Bank of England were heightened and on continued concern that the US Administration will tolerate a weaker dollar to boost employment. In the same month, the OPEC Reference Basket increased by $2.22/b or 8.43% to $28.54/b from $26.32/b in September. In real terms (base July 1990=100), after accounting for inflation and currency fluctuations, the Basket price saw less improvement, rising 4.89% to $21.71/b from $20.74/b, as the depreciation of the dollar and inflation eroded a portion of the actual price improvement. The dollar fell 3.15% as measured by the import-weighted modified Geneva I+US$ basket*.
* The ‘modified Geneva I+ US$ basket’ includes the euro, the Japanese yen, the US dollar, the pound sterling and the Swiss franc, weighted according to the merchandise imports of OPEC Member Countries from the countries in the basket.
____________________________________________________________________Monthly Oil Market Report
November 2003 9
Crude Oil Price Movements
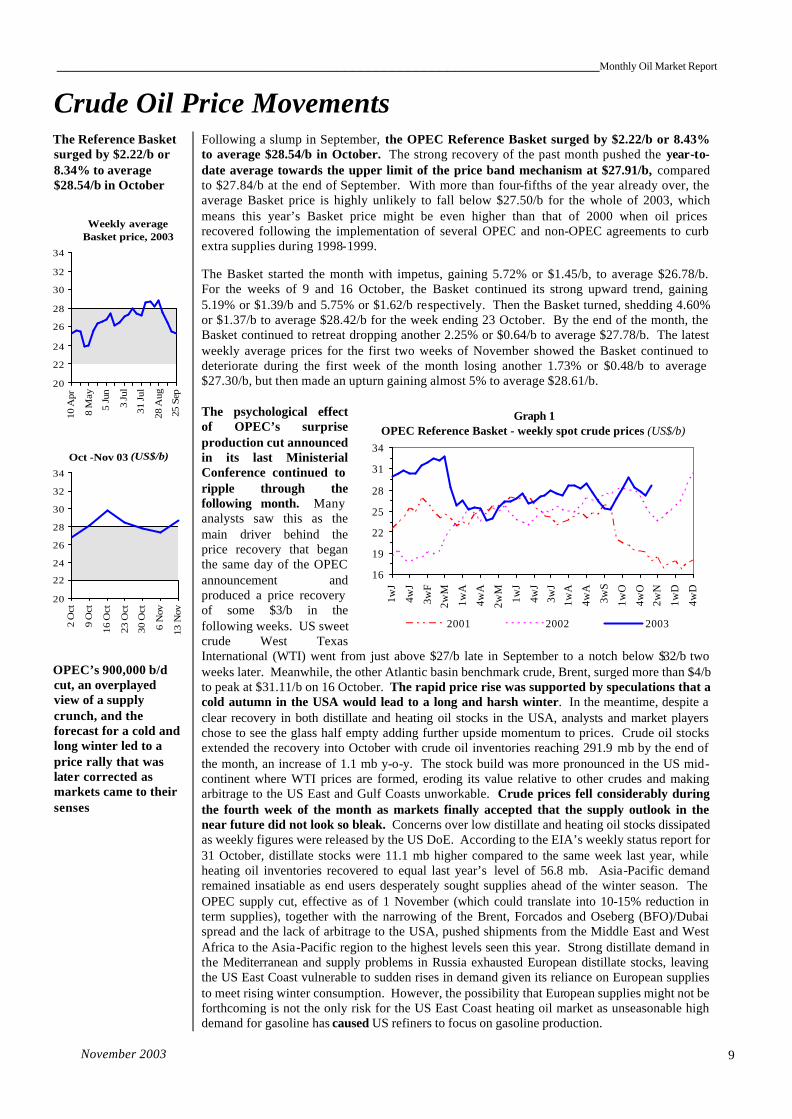
The Reference Basket surged by $2.22/b or 8.34% to average $28.54/b in October
Weekly average Basket price, 2003
20
22
24
26
28
30
32
34
10 A
pr
8 M
ay
5 Ju
n
3 Ju
l
31 J
ul
28 A
ug
25 S
ep
Oct -Nov 03 (US$/b)
20
22
24
26
28
30
32
34
2 O
ct
9 O
ct
16 O
ct
23 O
ct
30 O
ct
6 N
ov
13 N
ov
OPEC’s 900,000 b/d cut, an overplayed view of a supply crunch, and the forecast for a cold and long winter led to a price rally that was later corrected as markets came to their senses
Following a slump in September, the OPEC Reference Basket surged by $2.22/b or 8.43% to average $28.54/b in October. The strong recovery of the past month pushed the year-to-date average towards the upper limit of the price band mechanism at $27.91/b, compared to $27.84/b at the end of September. With more than four-fifths of the year already over, the average Basket price is highly unlikely to fall below $27.50/b for the whole of 2003, which means this year’s Basket price might be even higher than that of 2000 when oil prices recovered following the implementation of several OPEC and non-OPEC agreements to curb extra supplies during 1998-1999. The Basket started the month with impetus, gaining 5.72% or $1.45/b, to average $26.78/b. For the weeks of 9 and 16 October, the Basket continued its strong upward trend, gaining 5.19% or $1.39/b and 5.75% or $1.62/b respectively. Then the Basket turned, shedding 4.60% or $1.37/b to average $28.42/b for the week ending 23 October. By the end of the month, the Basket continued to retreat dropping another 2.25% or $0.64/b to average $27.78/b. The latest weekly average prices for the first two weeks of November showed the Basket continued to deteriorate during the first week of the month losing another 1.73% or $0.48/b to average $27.30/b, but then made an upturn gaining almost 5% to average $28.61/b. The psychological effect of OPEC’s surprise production cut announced in its last Ministerial Conference continued to ripple through the following month. Many analysts saw this as the main driver behind the price recovery that began the same day of the OPEC announcement and produced a price recovery of some $3/b in the following weeks. US sweet crude West Texas International (WTI) went from just above $27/b late in September to a notch below $32/b two weeks later. Meanwhile, the other Atlantic basin benchmark crude, Brent, surged more than $4/b to peak at $31.11/b on 16 October. The rapid price rise was supported by speculations that a cold autumn in the USA would lead to a long and harsh winter. In the meantime, despite a clear recovery in both distillate and heating oil stocks in the USA, analysts and market players chose to see the glass half empty adding further upside momentum to prices. Crude oil stocks extended the recovery into October with crude oil inventories reaching 291.9 mb by the end of the month, an increase of 1.1 mb y-o-y. The stock build was more pronounced in the US mid-continent where WTI prices are formed, eroding its value relative to other crudes and making arbitrage to the US East and Gulf Coasts unworkable. Crude prices fell considerably during the fourth week of the month as markets finally accepted that the supply outlook in the near future did not look so bleak. Concerns over low distillate and heating oil stocks dissipated as weekly figures were released by the US DoE. According to the EIA’s weekly status report for 31 October, distillate stocks were 11.1 mb higher compared to the same week last year, while heating oil inventories recovered to equal last year’s level of 56.8 mb. Asia-Pacific demand remained insatiable as end users desperately sought supplies ahead of the winter season. The OPEC supply cut, effective as of 1 November (which could translate into 10-15% reduction in term supplies), together with the narrowing of the Brent, Forcados and Oseberg (BFO)/Dubai spread and the lack of arbitrage to the USA, pushed shipments from the Middle East and West Africa to the Asia-Pacific region to the highest levels seen this year. Strong distillate demand in the Mediterranean and supply problems in Russia exhausted European distillate stocks, leaving the US East Coast vulnerable to sudden rises in demand given its reliance on European supplies to meet rising winter consumption. However, the possibility that European supplies might not be forthcoming is not the only risk for the US East Coast heating oil market as unseasonable high demand for gasoline has caused US refiners to focus on gasoline production.
16
19
22
25
28
31
34
1w
J
4w
J
3w
F
2w
M
1w
A
4w
A
2w
M
1w
J
4w
J
3w
J
1w
A
4w
A
3w
S
1w
O
4w
O
2w
N
1w
D
4wD
2001 2002 2003
Graph 1OPEC Reference Basket - weekly spot crude prices (US$/b)
Monthly Oil Market Report ___________________________________________________________________
November 2003 10
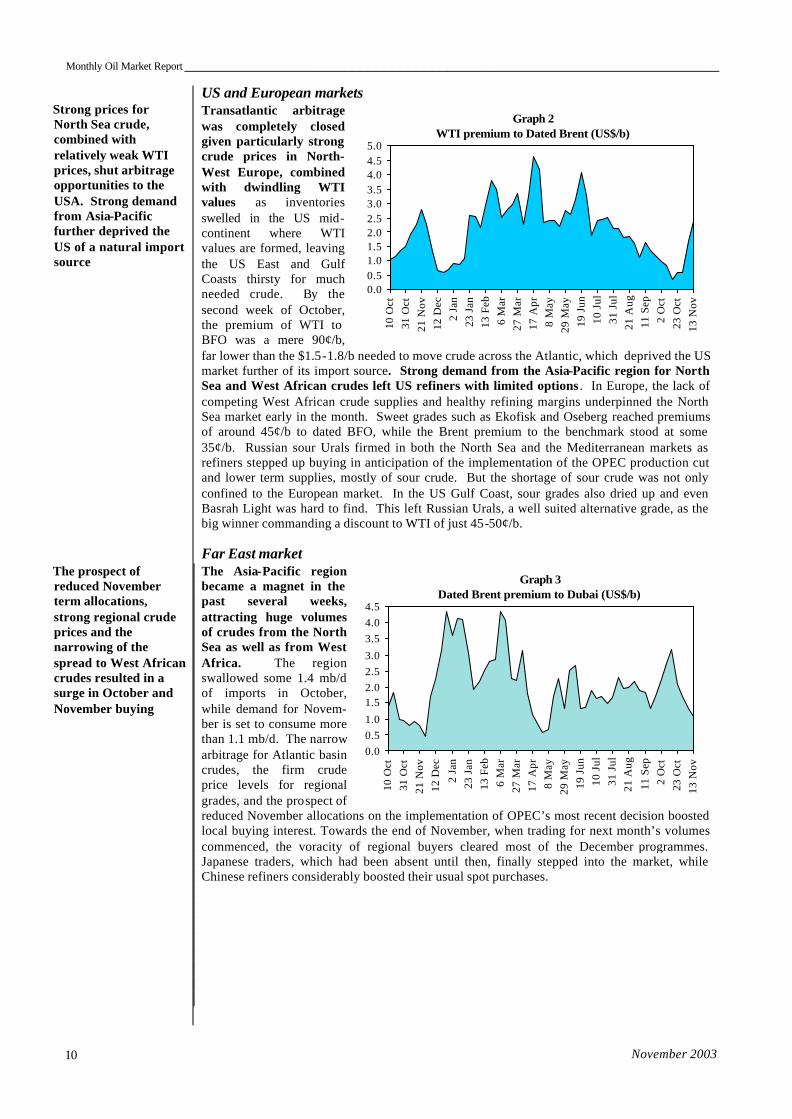
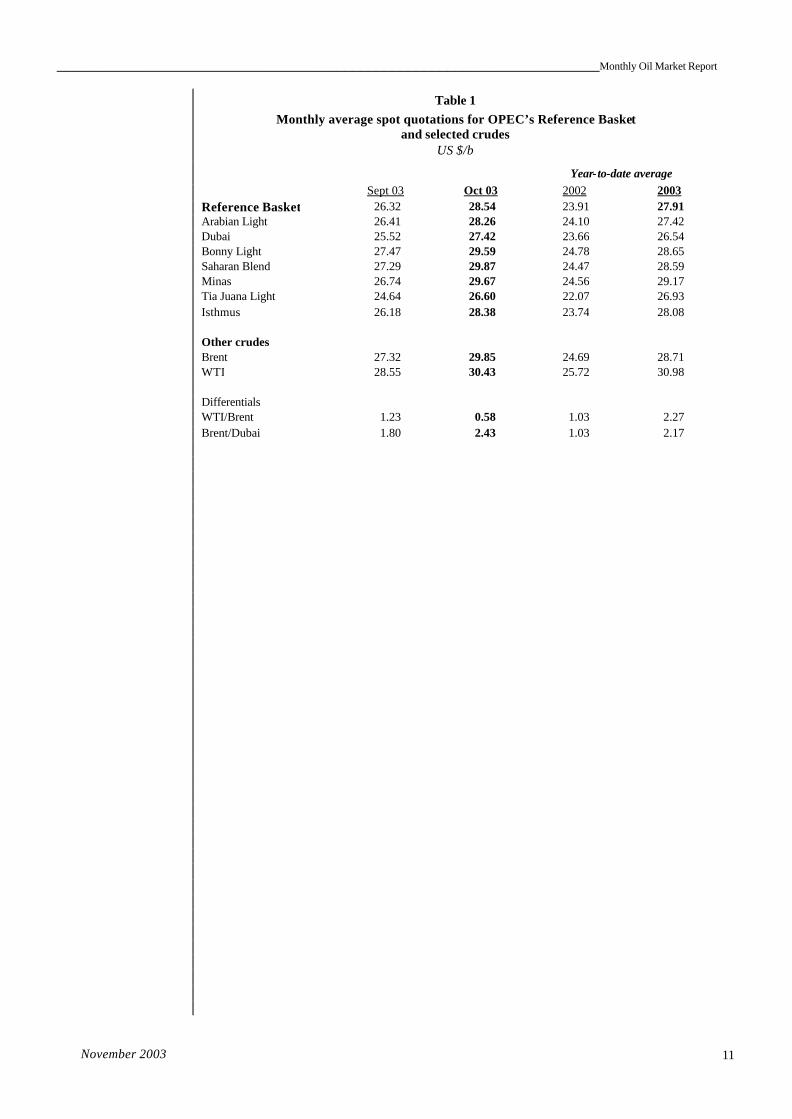
Strong prices for North Sea crude, combined with relatively weak WTI prices, shut arbitrage opportunities to the USA. Strong demand from Asia-Pacific further deprived the US of a natural import source The prospect of reduced November term allocations, strong regional crude prices and the narrowing of the spread to West African crudes resulted in a surge in October and November buying
US and European markets Transatlantic arbitrage was completely closed given particularly strong crude prices in North-West Europe, combined with dwindling WTI values as inventories swelled in the US mid-continent where WTI values are formed, leaving the US East and Gulf Coasts thirsty for much needed crude. By the second week of October, the premium of WTI to BFO was a mere 90¢/b, far lower than the $1.5-1.8/b needed to move crude across the Atlantic, which deprived the US market further of its import source. Strong demand from the Asia-Pacific region for North Sea and West African crudes left US refiners with limited options . In Europe, the lack of competing West African crude supplies and healthy refining margins underpinned the North Sea market early in the month. Sweet grades such as Ekofisk and Oseberg reached premiums of around 45¢/b to dated BFO, while the Brent premium to the benchmark stood at some 35¢/b. Russian sour Urals firmed in both the North Sea and the Mediterranean markets as refiners stepped up buying in anticipation of the implementation of the OPEC production cut and lower term supplies, mostly of sour crude. But the shortage of sour crude was not only confined to the European market. In the US Gulf Coast, sour grades also dried up and even Basrah Light was hard to find. This left Russian Urals, a well suited alternative grade, as the big winner commanding a discount to WTI of just 45-50¢/b. Far East market The Asia-Pacific region became a magnet in the past several weeks, attracting huge volumes of crudes from the North Sea as well as from West Africa. The region swallowed some 1.4 mb/d of imports in October, while demand for Novem-ber is set to consume more than 1.1 mb/d. The narrow arbitrage for Atlantic basin crudes, the firm crude price levels for regional grades, and the prospect of reduced November allocations on the implementation of OPEC’s most recent decision boosted local buying interest. Towards the end of November, when trading for next month’s volumes commenced, the voracity of regional buyers cleared most of the December programmes. Japanese traders, which had been absent until then, finally stepped into the market, while Chinese refiners considerably boosted their usual spot purchases.
Graph 2WTI premium to Dated Brent (US$/b)
0.00.51.01.52.02.53.03.54.04.55.0
10 O
ct31
Oct
21 N
ov12
Dec
2 Ja
n23
Jan
13 F
eb6
Mar
27 M
ar17
Apr
8 M
ay29
May
19 J
un10
Jul
31 J
ul21
Aug
11 S
ep2
Oct
23 O
ct13
Nov
Graph 3Dated Brent premium to Dubai (US$/b)
0.00.51.0
1.52.02.53.0
3.54.04.5
10 O
ct31
Oct
21 N
ov12
Dec
2 Ja
n23
Jan
13 F
eb6
Mar
27 M
ar17
Apr
8 M
ay29
May
19 J
un10
Jul
31 J
ul21
Aug
11 S
ep2
Oct
23 O
ct13
Nov
____________________________________________________________________Monthly Oil Market Report
November 2003 11
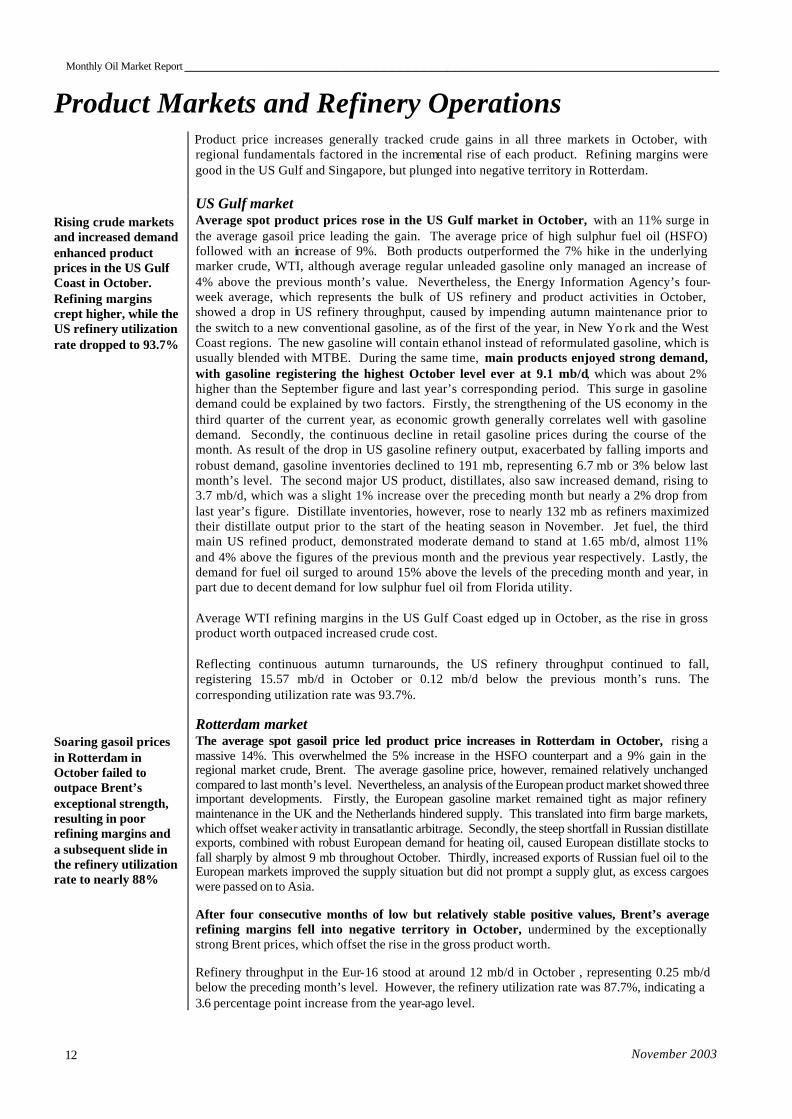
Table 1 Monthly average spot quotations for OPEC’s Reference Basket
and selected crudes US $/b
Year-to-date average Sept 03 Oct 03 2002 2003
Reference Basket 26.32 28.54 23.91 27.91 Arabian Light 26.41 28.26 24.10 27.42 Dubai 25.52 27.42 23.66 26.54 Bonny Light 27.47 29.59 24.78 28.65 Saharan Blend 27.29 29.87 24.47 28.59 Minas 26.74 29.67 24.56 29.17 Tia Juana Light 24.64 26.60 22.07 26.93 Isthmus 26.18 28.38 23.74 28.08 Other crudes Brent 27.32 29.85 24.69 28.71
WTI 28.55 30.43 25.72 30.98 Differentials WTI/Brent 1.23 0.58 1.03 2.27 Brent/Dubai 1.80 2.43 1.03 2.17
Monthly Oil Market Report ___________________________________________________________________
November 2003 12
Product Markets and Refinery Operations
Product price increases generally tracked crude gains in all three markets in October, with regional fundamentals factored in the incremental rise of each product. Refining margins were good in the US Gulf and Singapore, but plunged into negative territory in Rotterdam.
Rising crude markets and increased demand enhanced product prices in the US Gulf Coast in October. Refining margins crept higher, while the US refinery utilization rate dropped to 93.7% Soaring gasoil prices in Rotterdam in October failed to outpace Brent’s exceptional strength, resulting in poor refining margins and a subsequent slide in the refinery utilization rate to nearly 88%
US Gulf market Average spot product prices rose in the US Gulf market in October, with an 11% surge in the average gasoil price leading the gain. The average price of high sulphur fuel oil (HSFO) followed with an increase of 9%. Both products outperformed the 7% hike in the underlying marker crude, WTI, although average regular unleaded gasoline only managed an increase of 4% above the previous month’s value. Nevertheless, the Energy Information Agency’s four-week average, which represents the bulk of US refinery and product activities in October, showed a drop in US refinery throughput, caused by impending autumn maintenance prior to the switch to a new conventional gasoline, as of the first of the year, in New Yo rk and the West Coast regions. The new gasoline will contain ethanol instead of reformulated gasoline, which is usually blended with MTBE. During the same time, main products enjoyed strong demand, with gasoline registering the highest October level ever at 9.1 mb/d, which was about 2% higher than the September figure and last year’s corresponding period. This surge in gasoline demand could be explained by two factors. Firstly, the strengthening of the US economy in the third quarter of the current year, as economic growth generally correlates well with gasoline demand. Secondly, the continuous decline in retail gasoline prices during the course of the month. As result of the drop in US gasoline refinery output, exacerbated by falling imports and robust demand, gasoline inventories declined to 191 mb, representing 6.7 mb or 3% below last month’s level. The second major US product, distillates, also saw increased demand, rising to 3.7 mb/d, which was a slight 1% increase over the preceding month but nearly a 2% drop from last year’s figure. Distillate inventories, however, rose to nearly 132 mb as refiners maximized their distillate output prior to the start of the heating season in November. Jet fuel, the third main US refined product, demonstrated moderate demand to stand at 1.65 mb/d, almost 11% and 4% above the figures of the previous month and the previous year respectively. Lastly, the demand for fuel oil surged to around 15% above the levels of the preceding month and year, in part due to decent demand for low sulphur fuel oil from Florida utility. Average WTI refining margins in the US Gulf Coast edged up in October, as the rise in gross product worth outpaced increased crude cost. Reflecting continuous autumn turnarounds, the US refinery throughput continued to fall, registering 15.57 mb/d in October or 0.12 mb/d below the previous month’s runs. The corresponding utilization rate was 93.7%. Rotterdam market The average spot gasoil price led product price increases in Rotterdam in October, rising a massive 14%. This overwhelmed the 5% increase in the HSFO counterpart and a 9% gain in the regional market crude, Brent. The average gasoline price, however, remained relatively unchanged compared to last month’s level. Nevertheless, an analysis of the European product market showed three important developments. Firstly, the European gasoline market remained tight as major refinery maintenance in the UK and the Netherlands hindered supply. This translated into firm barge markets, which offset weaker activity in transatlantic arbitrage. Secondly, the steep shortfall in Russian distillate exports, combined with robust European demand for heating oil, caused European distillate stocks to fall sharply by almost 9 mb throughout October. Thirdly, increased exports of Russian fuel oil to the European markets improved the supply situation but did not prompt a supply glut, as excess cargoes were passed on to Asia. After four consecutive months of low but relatively stable positive values, Brent’s average refining margins fell into negative territory in October, undermined by the exceptionally strong Brent prices, which offset the rise in the gross product worth. Refinery throughput in the Eur-16 stood at around 12 mb/d in October , representing 0.25 mb/d below the preceding month’s level. However, the refinery utilization rate was 87.7%, indicating a 3.6 percentage point increase from the year-ago level.
____________________________________________________________________Monthly Oil Market Report
November 2003 13
Gasoline led product price rises in Singapore in October, while refining margins remained good, despite a recent reversal
Singapore market Average monthly spot product prices enjoyed gains in Singapore in October. The surge in the average premium of unleaded gasoline was roughly equal to the 7% increase of the regional marker crude, Dubai. However, other product price rises lagged behind, as the average gasoil price rebounded by 4% and the counterpart HSFO increased by 2% over the same period. Nonetheless, the main reasons behind the strengthened gasoline values were restricted gasoline exports from China and Taiwan, a consequence of the continuous strength in their domestic demand, firm naphtha prices, owing to healthy ethylene industrial margins, and emerging robust demand from Australia for stockpiling gasoline prior to its November–December driving season. The distillate market witnessed modest activity in arbitrage trading to Europe and the USA, together with increased regional purchases. Plentiful supply of fuel oil during most of the month at a time of subdued demand from China inflated fuel oil inventories in Singapore above 11 mb during the second week of the month. Nevertheless, renewed demand from China assisted the market during the last decade of October, but the prevailing strong east-west fuel oil price differential is expected to attract higher volumes of European materials in November. Dubai’s average refinery margins retreated in Singapore in October, but remained in positive territory, as its rise in price eclipsed product gains. Refinery throughput in Japan increased by 0.11 mb to hover at 3.93 mb/d in October, in part reflecting the gradual return of two of Japan’s largest refineries after an almost two-month shut-down. Thus, the equivalent utilization rate stood at 82.5% or nearly 3% above the preceding year’s level.
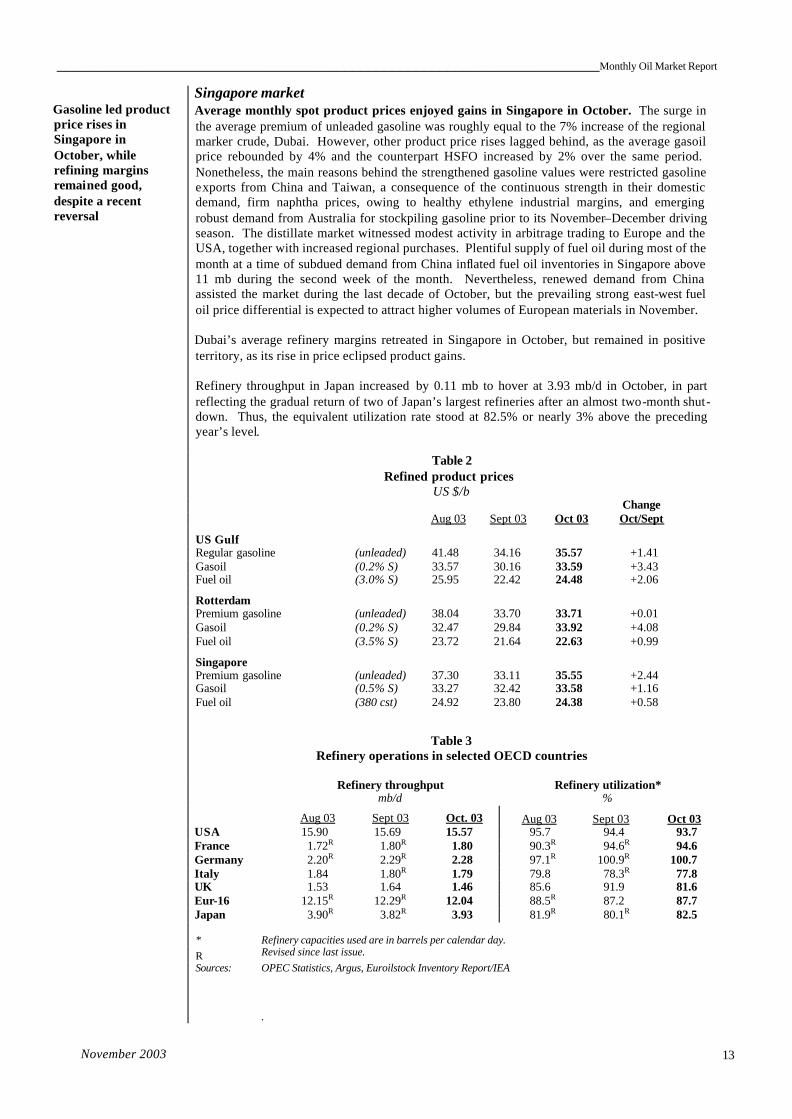
Table 2 Refined product prices
US $/b Change Aug 03 Sept 03 Oct 03 Oct/Sept
US Gulf Regular gasoline (unleaded) 41.48 34.16 35.57 +1.41 Gasoil (0.2% S) 33.57 30.16 33.59 +3.43 Fuel oil (3.0% S) 25.95 22.42 24.48 +2.06
Rotterdam Premium gasoline (unleaded) 38.04 33.70 33.71 +0.01 Gasoil (0.2% S) 32.47 29.84 33.92 +4.08 Fuel oil (3.5% S) 23.72 21.64 22.63 +0.99
Singapore Premium gasoline (unleaded) 37.30 33.11 35.55 +2.44 Gasoil (0.5% S) 33.27 32.42 33.58 +1.16 Fuel oil (380 cst) 24.92 23.80 24.38 +0.58 Table 3
Refinery operations in selected OECD countries
Refinery throughput mb/d
Refinery utilization* %
Aug 03 Sept 03 Oct. 03 Aug 03 Sept 03 Oct 03 USA 15.90 15.69 15.57 95.7 94.4 93.7 France 1.72R 1.80R 1.80 90.3R 94.6R 94.6 Germany 2.20R 2.29R 2.28 97.1R 100.9R 100.7 Italy 1.84 1.80R 1.79 79.8 78.3R 77.8 UK 1.53 1.64 1.46 85.6 91.9 81.6 Eur-16 12.15R 12.29R 12.04 88.5R 87.2 87.7 Japan 3.90R 3.82R 3.93 81.9R 80.1R 82.5
* Refinery capacities used are in barrels per calendar day.
R Revised since last issue. Sources: OPEC Statistics, Argus, Euroilstock Inventory Report/IEA
.

Monthly Oil Market Report ___________________________________________________________________
November 2003 14
The Oil Futures Market
Volatility will remain high while the market assesses more fundamental issues like the approaching winter, the situation in Iraq, stock levels and the impact of OPEC’s latest and upcoming output decision
Judging from the figures released by the Commodity Futures Trading Commission, there is little doubt that the mood of non-commercials or speculators turned bullish in the last week of September following OPEC’s announced decision to trim production levels by 900,000 b/d effective 1 November 2003. According to the Commitment of Traders report for the week ending 30 September, non-commercial net short positions, which implies an expectation that prices will fall in the future, dropped by more than 12,000 lots to 38,786 lots. In the meantime, the Nymex sweet crude front-month contract rose around $2/b to close at $29.20/b in the last trading session of September. A further decline in net short positions took place in the week ending 7 October on the market’s belief that the approaching winter might turn out to be long, harsh and cold, fears that Iraq’s production and exports might not rise as fast as estimated, and the lingering effects of the OPEC production decision. Net shorts were trimmed by half to 19,150 lots in the week, achieved by heavy buying of longs (up 13,018 lots) and a liquidation of shorts (down 6,618 lots). The NYMEX WTI front-month contract continued to rise, exceeding the $30/b mark to close at $30.41/b by week’s end. In the follow-ing week, speculators boosted their long positions by an astonishing 77%, or 39,312 lots, resulting in a net long position of 19,442 lots – the first time since 9 September. However, full confirmation of a more optimistic outlook was absent given the reluctance of big speculators to trim short positions by a meaningful number in that week. Non-commercials disposed a mere 720 lots with the short positions standing at 70,721 according to the CTR for 14 October. Open interest rose significantly by 41,260 lots to 562,251 lots. NYMEX WTI continued to rise, reaching as high as $32.49/b on intra-day trading on 14 October to close at $31.82/b. Non-commercials’ net-long positions continued to rise in the following weeks as speculators trimmed both their long and short positions, but reduced their short side by a far greater extent than their long side. Crude futures took a beating in the second half of the month to retreat by more than two-and-a-half dollars per barrel in what might have been a correction of the exuberant rise seen in the first two weeks of October. The CTR of 4 November showed a growing pessimism on the part of by big speculators. Non-commercials turned to net short by 2,988 lots, disposing heavily of their longs by 28,280 lots while only increasing their shorts by 2,608 contracts. As long as uncertainties remain concerning factors such as the severity of the coming winter season, crude and product stocks levels in the USA and Europe (especially heating oil), the recovery of Iraqi production and exports, and the impact of OPEC’s most recent decision on the supply side, the volatility seen in the last few months will continue with prices oscillating within the $28-33/b range for WTI. OPEC’s next Ministerial Meeting on 4 December will be paramount in this regard for injecting more calmness into the market.
23
25
27
29
31
33
1 A
ug
11 A
ug
19 A
ug
27 A
ug
5 Se
p
15 S
ep
23 S
ep
1 O
ct
9 O
ct
17 O
ct
27 O
ct
4 N
ov
12 N
ov
1st FM 2nd FM6th FM 12th FM
Graph 4NYMEX WTI futures contracts, 2003US$/b
FM = future month
NC = Non-commercials: funds, investments and banks.Ct = * Each contract is 1,000 barrels.
-75-50-25
0
2550
75
12 A
ug
19 A
ug
26 A
ug
2 Se
p
9 Se
p
16 S
ep
23 S
ep
30 S
ep
7 O
ct
14 O
ct
21 O
ct
28 O
ct
4 N
ov
11 N
ov27282930
3132
33
NC WTI
US$/b '000Ct*
Graph 5Futures Commitment of Traders Report:
NYMEX Crude Oil, 2003Long-Short
____________________________________________________________________Monthly Oil Market Report
November 2003 15
The Tanker Market
OPEC area spot-fixtures regained most of the previous two months’ losses, increasing by 3.80 mb/d in October
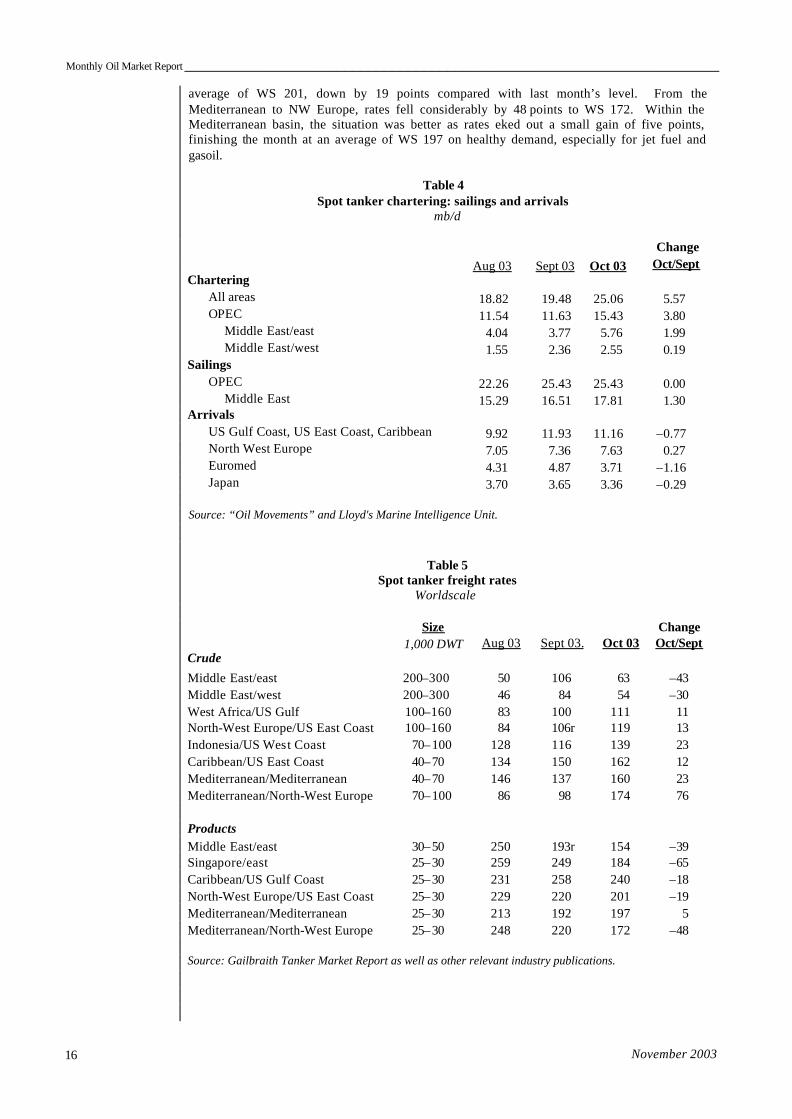
OPEC area spot chartering regained most of the losses of the last two months, increasing by 3.80 mb/d to stand at 15.43 mb/ d, a level not seen since June 2000 when OPEC area spot chartering reached 15.90 mb/d. This new figure showed an increase of 3.54 mb/d or about 23% over last year. The rise in OPEC oil production during October, especially from Iraq, was the main reason behind this upward trend in OPEC area spot fixtures. The rise helped OPEC’s share of global spot-chartering increase by 1% to about 62% compared with last month’s level and about 11% higher than that observed a year ago. Both Middle East long-haul routes contributed to the increase in OPEC area spot fixtures. The eastbound long-haul route displayed an increase of 1.99 mb/d to 5.76 mb/d, or about 52% of the rise in the OPEC area, while the westbound long-haul route added just 0.19 mb/d to 2.55 mb/d, or only about 5% of the OPEC increment. Compared with last year’s level, Middle East eastbound long-haul spot chartering was 1.78 mb/d higher, while westbound long-haul spot fixtures were only up 0.41 mb/d. Together they accounted for about 54% of total chartering in the OPEC area. Non-OPEC spot fixtures followed the same upward trend, displaying an increase of 1.70 mb/d to stand at 9.62 mb/d, a drop of about 17% below the year-ago level. Despite this rise, the non-OPEC share declined by 1.9% to reach 38.4%. Consequently, global spot chartering rose by 5.57 mb/d to 25.06 mb/d, a level not seen since September 2002. Compared with the year-ago level, total spot chartering is 1.62 mb/d higher. Estimated sailings from the OPEC area in October remained unchanged from the previous month’s level of 25.43 mb/d. The rise of 1.30 mb/d to 17.81 mb/d in sailings out of the Middle East seemed to be capped by nearly the same volume as on other main OPEC routes. The share of Middle East sailings of total OPEC showed a slight increase of 5% to stand at 70%. Arrivals in all main consuming markets declined, except in the NW Europe route, which showed a marginal increase of 0.27 mb/d to 7.63 mb/d. The downward pattern in most of the main areas reflected the downturn in OPEC spot chartering during the last two months. In the US Gulf, US East Coast and the Caribbean, arrivals moved down in October by 0.77 mb/d to 11.16 mb/d, while arrivals in Japan declined marginally by 0.29 mb/d to 3.36 mb/d. The biggest drop occurred in Euro-Med, where arrivals fell last month by 1.16 mb/d to 3.71 mb/d due to stagnant demand.
VLCC freight rates fluctuated considerably in October
In October, crude freight rates fluctuated considerably, especially the VLCC rates . Ample tonnage availability at the beginning of the month depressed VLCC freight rates to nearly WS 60s on both long-haul routes. However, increased oil supply, particularly from the Middle East producers on rising demand primarily from major Asian consumers and tight vessel availability helped rates to move up to very high levels in the last week of the month. Higher rates at month’s end wiped out some of the huge early month losses. The monthly average of VLCC freight rates on the Middle East eastbound long-haul route stood at WS 63, down by 43 points compared with last month’s figures. On the westbound long-haul route, rates were at a monthly average of WS 54, or 30 points less than the level registered last month. In the Suezmax sector, the picture was different as rates improved, especially at the month’s end where increased activity lifted rates by 11 points to a monthly average of WS 111 on the West Africa/US Gulf Coast route and by 13 points to WS 119 on the NW Europe/US East-US Gulf Coast route. Aframax freight rates enjoyed relatively high levels, benefiting from improved activity, especially in the Mediterranean basin and from there to NW Europe. On these two routes, rates jumped by 23 points to a monthly average of WS 160 and by 76 points to WS 174. Aframax freight rates also showed a similar increment along the Indonesia/US West Coast route, rising by 23 points to a monthly average of WS 139. In the Caribbean, freight rates ranged between WS 150 and WS 170 to average WS 162, an increase of 12 points compared with last month.
Product freight rates lost on most main routes, except within the Mediterranean basin where small gains materialized
Declining spot product fixtures weighed upon product freight rates along most of the main trading routes in October. Rates on the Middle East Far East route for 30-50,000 DWT cargoes fell by 39 points to stand at a monthly average of WS 154. From Singapore to the East, the market was very quiet, especially at the beginning of the month. This resulted in a massive drop in freight rates along this route, falling by 65 points to WS 184. Month-end improvement along this route did not help to change the direction, but rates are expected to continue to head upwards on the back of higher seasonal demand. In the Caribbean and due to low activity at the start of the month, rates along the Caribbean/US Gulf Coast lost 18 points on average to stand at WS 240. This level was achieved on the improvement which took place later in the month as strong demand from the US market helped rates to gain about 25 points in the last few days in October. Opened Atlantic arbitrage in the last few days of October helped rates along the NW Europe/US East-US Gulf route to regain part of the early month’s losses to stand at a monthly
Monthly Oil Market Report ___________________________________________________________________
November 2003 16
average of WS 201, down by 19 points compared with last month’s level. From the Mediterranean to NW Europe, rates fell considerably by 48 points to WS 172. Within the Mediterranean basin, the situation was better as rates eked out a small gain of five points, finishing the month at an average of WS 197 on healthy demand, especially for jet fuel and gasoil.
Table 4 Spot tanker chartering: sailings and arrivals
mb/d
Change Aug 03 Sept 03 Oct 03 Oct/Sept Chartering All areas 18.82 19.48 25.06 5.57 OPEC 11.54 11.63 15.43 3.80 Middle East/east 4.04 3.77 5.76 1.99 Middle East/west 1.55 2.36 2.55 0.19 Sailings OPEC 22.26 25.43 25.43 0.00 Middle East 15.29 16.51 17.81 1.30 Arrivals US Gulf Coast, US East Coast, Caribbean 9.92 11.93 11.16 –0.77 North West Europe 7.05 7.36 7.63 0.27 Euromed 4.31 4.87 3.71 –1.16 Japan 3.70 3.65 3.36 –0.29 Source: “Oil Movements” and Lloyd's Marine Intelligence Unit.
Table 5
Spot tanker freight rates Worldscale
Size
1,000 DWT
Aug 03 Sept 03. Oct 03 Change Oct/Sept
Crude Middle East/east 200–300 50 106 63 –43 Middle East/west 200–300 46 84 54 –30 West Africa/US Gulf 100–160 83 100 111 11 North-West Europe/US East Coast 100–160 84 106r 119 13 Indonesia/US West Coast 70–100 128 116 139 23 Caribbean/US East Coast 40–70 134 150 162 12 Mediterranean/Mediterranean 40–70 146 137 160 23 Mediterranean/North-West Europe 70–100 86 98 174 76 Products Middle East/east 30–50 250 193r 154 –39 Singapore/east 25–30 259 249 184 –65 Caribbean/US Gulf Coast 25–30 231 258 240 –18 North-West Europe/US East Coast 25–30 229 220 201 –19 Mediterranean/Mediterranean 25–30 213 192 197 5 Mediterranean/North-West Europe 25–30 248 220 172 –48 Source: Gailbraith Tanker Market Report as well as other relevant industry publications.

____________________________________________________________________Monthly Oil Market Report
November 2003 17
World Oil Demand
World demand for 2003 revised up 0.15 mb/d to 78.33 mb/d, an increase of 1.36 mb/d over 2002
Estimates for 2003 World The outlook for world economic growth improved by nearly one fifth of one per cent, mostly thanks to brighter prospects in China and the USA. As a result, the third and fourth quarter averages were revised up substantially by 0.15 mb/s and 0.44 mb/d respectively, and the forecast average for 2003 world oil demand raised by 0.15 mb/d to 78.33 mb/d, compared to the 78.18 mb/d presented in the last MOMR. The yearly increment, i.e. the difference between the 2002 and the 2003 averages, was likewise adjusted upwards by 0.16 mb/d to stand at 1.36 mb/d, implying that the year 2002 average underwent a negligible 0.01 mb/d downward adjustment. Quarterly and regional details are given in Table 7. On a regional basis, the 2003 demand in the OECD is forecast to rise 0.71 mb/d or 1.49%, following a minor fall of 0.07 mb/d in 2002. Developing countries are forecast to see only a moderate 0.11 mb/d or 0.57% rise in consumption in 2003, following much higher 0.18 mb/d growth in 2002. Apparent demand in the former CPEs is forecast to grow a considerable 0.54 mb/d or 5.64%, more than double in volume and growth rate compared with the 0.21 mb/d or 2.21% growth seen in 2002.
Table 6 World oil demand in 2003
mb/d Change 2003/02
2002 1Q03 2Q03 3Q03 4Q03 2003 Volume % North America 24.16 24.57 24.14 24.63 24.68 24.51 0.35 1.43 Western Europe 15.07 15.20 14.98 15.08 15.44 15.17 0.10 0.68 OECD Pacific 8.50 9.61 8.04 8.03 9.34 8.75 0.26 3.02 Total OECD 47.73 49.37 47.17 47.74 49.46 48.43 0.71 1.48 Other Asia 7.47 7.54 7.58 7.60 7.76 7.62 0.15 1.95 Latin America 4.75 4.54 4.69 4.80 4.68 4.68 –0.07 –1.53 Middle East 4.95 4.89 4.76 5.17 5.05 4.97 0.02 0.40 Africa 2.53 2.55 2.54 2.51 2.58 2.55 0.02 0.75 Total DCs 19.70 19.52 19.57 20.07 20.07 19.81 0.11 0.57 FSU 3.77 4.01 3.35 3.70 4.41 3.87 0.10 2.59 Other Europe 0.74 0.77 0.73 0.70 0.76 0.74 0.00 –0.09 China 5.03 5.41 5.46 5.74 5.28 5.47 0.44 8.76 Total "Other Regions" 9.54 10.20 9.54 10.15 10.44 10.08 0.54 5.64 Total world 76.97 79.08 76.28 77.96 79.97 78.33 1.36 1.76 Previous estimate 76.98 79.07 76.29 77.81 79.54 78.18 1.20 1.56 Revision –0.01 0.01 –0.01 0.15 0.44 0.15 0.16 0.21
Totals may not add due to independent rounding.
On a quarterly basis, compared with the exceptionally weak first quarter 2002, world demand is estimated to have grown a significant 2.98% or 2.29 mb/d to average 79.08 mb/d in first quarter 2003. This is the net effect of much colder than normal weather in most parts of the northern hemisphere, fuel substitution in Japan as a result of nuclear power reactor maintenance, stockpiling ahead of the anticipated Iraq war, and record high natural gas prices in the USA. Second quarter 2003 consumption is estimated to have risen 1.41% or 1.06 mb/d, compared to the exceptionally weak second quarter 2002, on robust economic growth in China and the continuation of fuel substitution in Japan. Third quarter consumption is assumed to have grown a more moderate 0.89 mb/d or 1.16%, while that of the fourth is expected to undergo much higher growth of 1.20 mb/d or 1.52%. Detailed quarterly comparisons for all quarters are presented in Tables 8 and 9.
Monthly Oil Market Report ___________________________________________________________________
November 2003 18
Table 7 First and second quarter world oil demand comparison for 2003
mb/d
Change 2003/02 Change 2003/02
1Q02 1Q03 Volume % 2Q02 2Q03 Volume % North America 23.93 24.57 0.64 2.68 24.02 24.14 0.12 0.51 Western Europe 15.14 15.20 0.06 0.37 14.62 14.98 0.36 2.47 OECD Pacific 9.06 9.61 0.55 6.04 7.64 8.04 0.41 5.33 Total OECD 48.13 49.37 1.24 2.58 46.28 47.17 0.89 1.93 Other Asia 7.29 7.54 0.25 3.40 7.50 7.58 0.08 1.06 Latin America 4.70 4.54 –0.17 –3.52 4.78 4.69 –0.10 –2.03 Middle East 4.83 4.89 0.05 1.11 4.91 4.76 –0.15 –3.08 Africa 2.56 2.55 0.00 –0.09 2.50 2.54 0.05 1.83 Total DCs 19.38 19.52 0.13 0.69 19.69 19.57 –0.12 –0.63 FSU 3.78 4.01 0.23 6.20 3.39 3.35 –0.05 –1.45 Other Europe 0.77 0.77 0.00 0.09 0.73 0.73 0.00 0.60 China 4.74 5.41 0.67 14.23 5.12 5.46 0.34 6.65 Total "Other Regions" 9.29 10.20 0.91 9.79 9.24 9.54 0.30 3.20 Total world 76.80 79.08 2.29 2.98 75.21 76.28 1.06 1.41
Totals may not add due to independent rounding.
Table 8
Third and fourth quarter world oil demand comparison for 2003 mb/d
Change 2003/02 Change 2004/03
3Q02 3Q03 Volume % 4Q02 4Q03 Volume % North America 24.34 24.63 0.29 1.19 24.35 24.68 0.34 1.38 Western Europe 15.17 15.08 –0.10 –0.63 15.34 15.44 0.09 0.61 OECD Pacific 8.03 8.03 0.00 0.00 9.26 9.34 0.08 0.88 Total OECD 47.55 47.74 0.19 0.41 48.95 49.46 0.51 1.04 0.00 Other Asia 7.47 7.60 0.13 1.76 7.64 7.76 0.13 1.65 Latin America 4.81 4.80 –0.01 –0.30 4.69 4.68 -0.01 -0.32 Middle East 5.10 5.17 0.06 1.23 4.93 5.05 0.11 2.31 Africa 2.49 2.51 0.02 0.67 2.57 2.58 0.02 0.60 Total DCs 19.88 20.07 0.20 0.99 19.83 20.07 0.24 1.21 FSU 3.65 3.70 0.06 1.56 4.25 4.41 0.15 3.54 Other Europe 0.73 0.70 –0.03 –4.05 0.74 0.76 0.02 2.99 China 5.27 5.74 0.48 9.04 5.00 5.28 0.28 5.54 Total "Other Regions" 9.64 10.15 0.50 5.22 9.99 10.44 0.45 4.50 Total world 77.07 77.96 0.89 1.16 78.77 79.97 1.20 1.52
Totals may not add due to independent rounding.
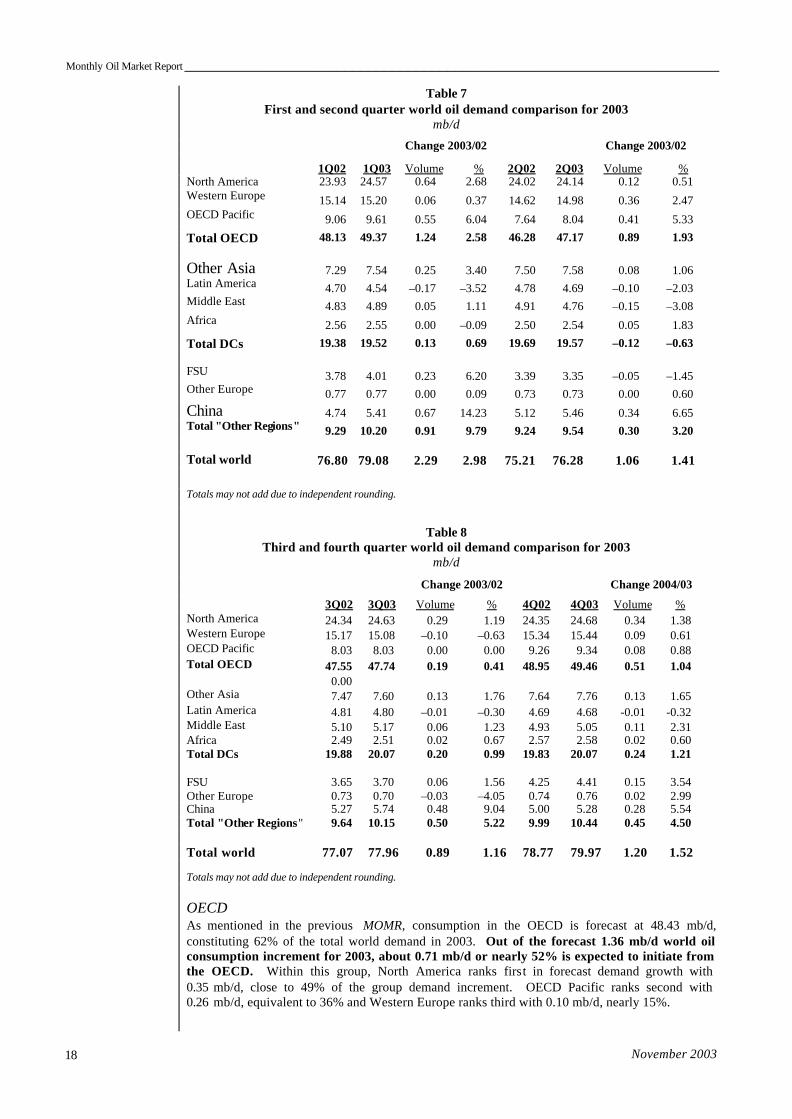
OECD As mentioned in the previous MOMR, consumption in the OECD is forecast at 48.43 mb/d, constituting 62% of the total world demand in 2003. Out of the forecast 1.36 mb/d world oil consumption increment for 2003, about 0.71 mb/d or nearly 52% is expected to initiate from the OECD. Within this group, North America ranks first in forecast demand growth with 0.35 mb/d, close to 49% of the group demand increment. OECD Pacific ranks second with 0.26 mb/d, equivalent to 36% and Western Europe ranks third with 0.10 mb/d, nearly 15%.
____________________________________________________________________Monthly Oil Market Report
November 2003 19
Actual consumption data suggests that OECD January-August oil requirements were 0.79 mb/d higher compared to the corresponding 2002 period. During this period, similar to the January-July period reported in the last MOMR, the leading volume gainer was gasoil/diesel with a 0.43 mb/d or 3.72% rise in consumption on fuel switching in the USA and Europe. The leading percentage gainer was residual fuel oil, which saw a rise in consumption of 11.02% or 0.31 mb/d, mostly due to the colder than normal weather, Japan’s nuclear reactor maintenance and high natural gas prices in the USA.
DCS Oil demand in developing countries is forecast to grow 0.11 mb/d or 0.57% to 19.81 mb/d. Latin American consumption is expected to contract by 0.07 mb/d or 1.53% to average 4.68 mb/d, indicating a relative imp rovement over last year when demand weakened by 0.12 mb/d on persistent economic and financial problems. Other Asia is forecast to register the highest volume and percentage growth with 0.15 mb/d or 1.95%, followed by Africa and the Middle East with 0.02 mb/d or 0.75% and 0.02 mb/d or 0.40% respectively.
Other regions Although apparent demand in the former CPEs in 2003 is now forecast at 10.08 mb/d, marginally higher than the level mentioned in the last MOMR, their share of world oil consumption remains unchanged at 13%. This is thanks to an upward revision in China’s demand forecast, which is now expected to claim as much as 40% of the total world demand increment, equivalent to 0.54 mb/d or 5.64%, and more than double that of 2002. Within the group, China’s 5.47 mb/d demand forecast should register the highest volume and percentage growth at 0.44 mb/d or 8.76%, and singly account for 33% of the total world increment. The FSU, with an average 3.87 mb/d, is expected to experience the second highest demand rise at 0.10 mb/d or 2.59%. Apparent demand in Other Europe is expected to see a negligible change.
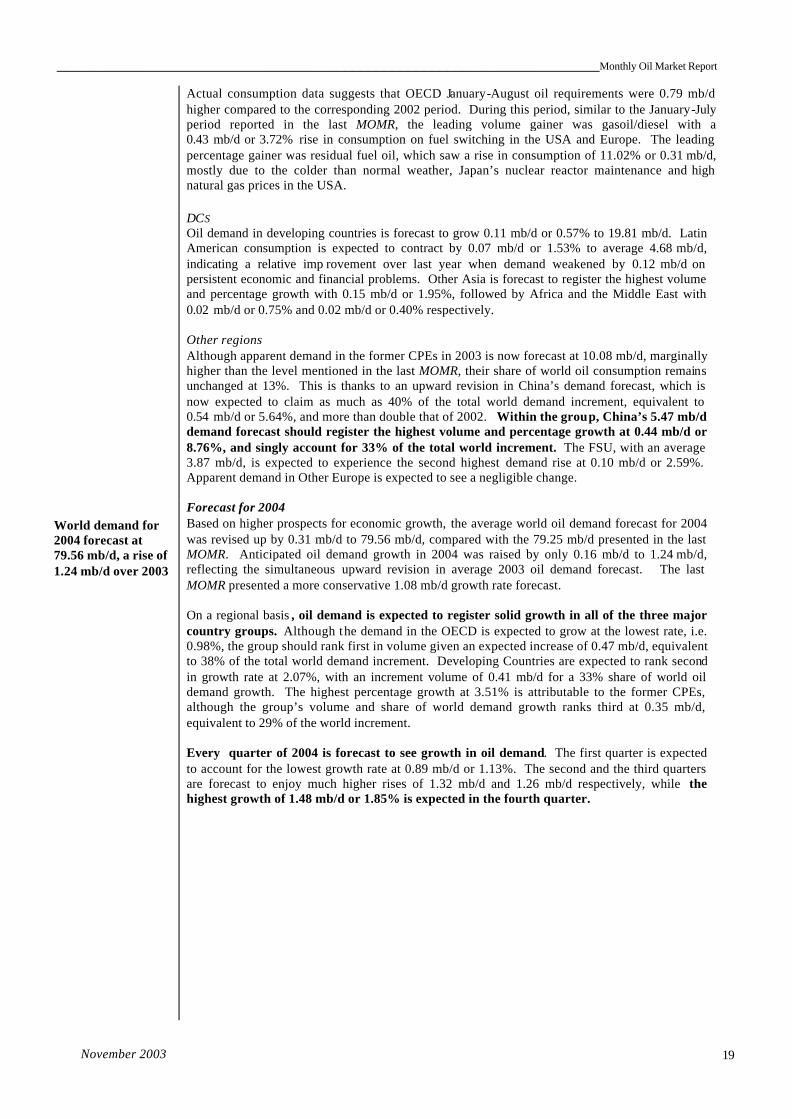
World demand for 2004 forecast at 79.56 mb/d, a rise of 1.24 mb/d over 2003
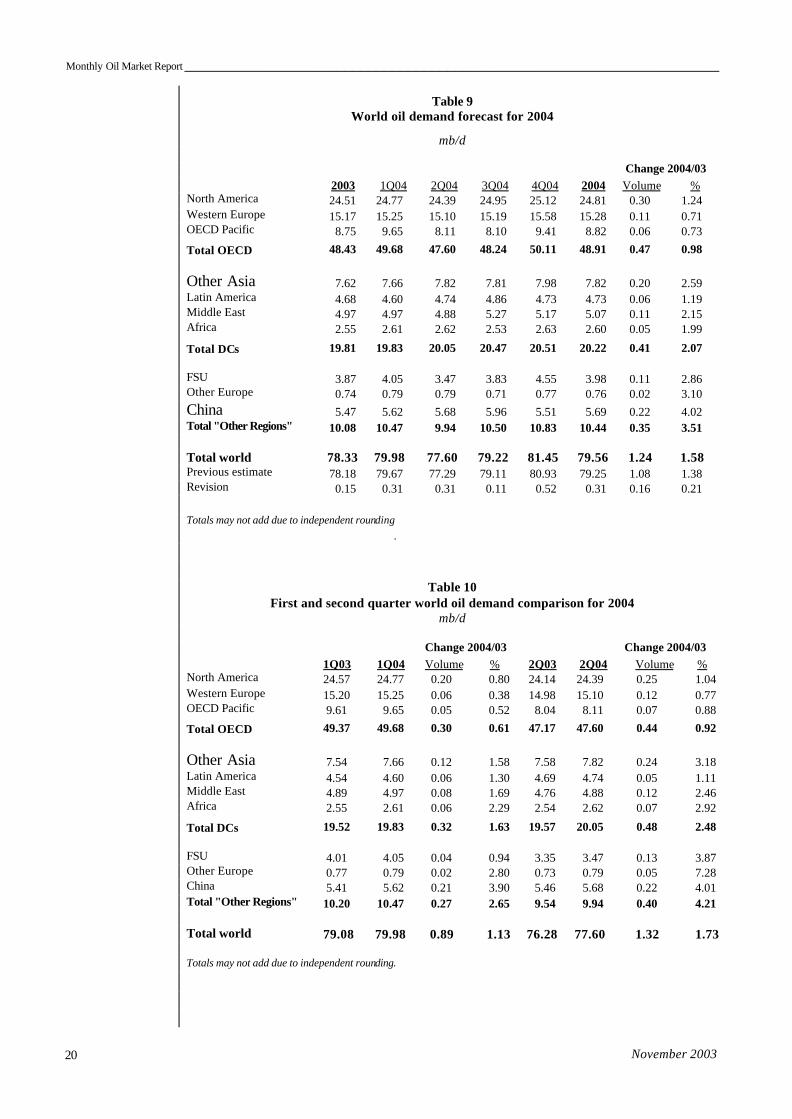
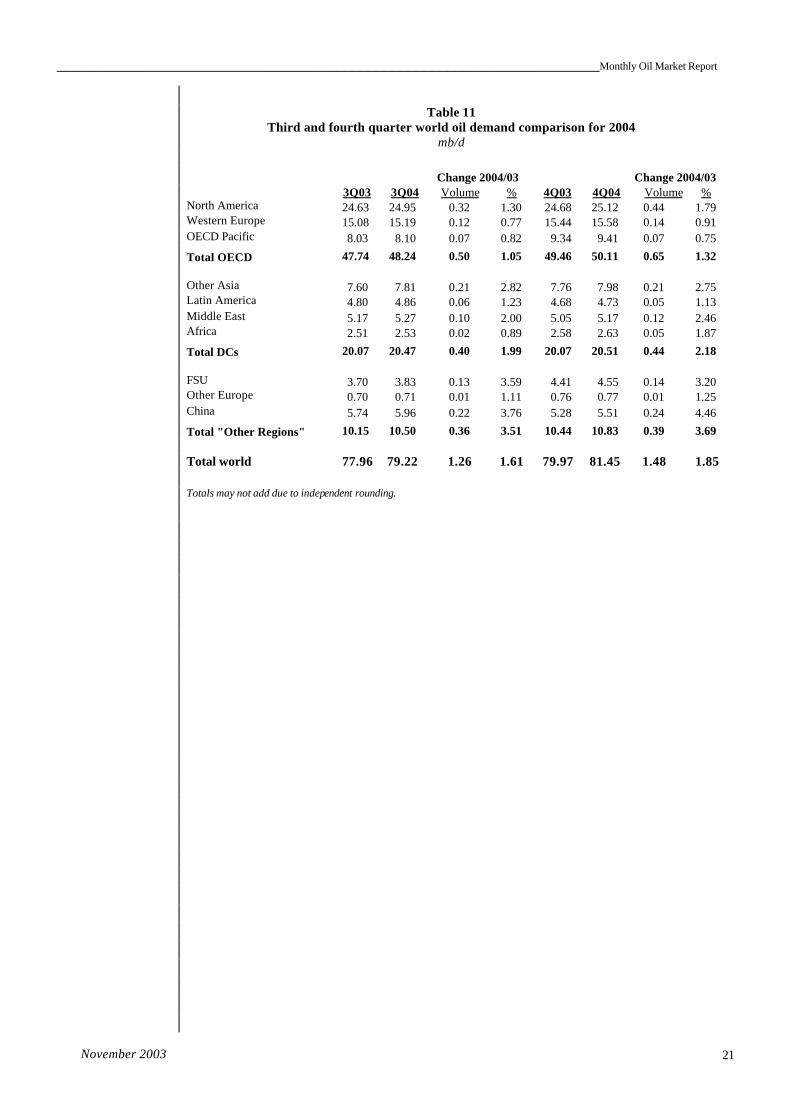
Forecast for 2004 Based on higher prospects for economic growth, the average world oil demand forecast for 2004 was revised up by 0.31 mb/d to 79.56 mb/d, compared with the 79.25 mb/d presented in the last MOMR. Anticipated oil demand growth in 2004 was raised by only 0.16 mb/d to 1.24 mb/d, reflecting the simultaneous upward revision in average 2003 oil demand forecast. The last MOMR presented a more conservative 1.08 mb/d growth rate forecast. On a regional basis , oil demand is expected to register solid growth in all of the three major country groups. Although the demand in the OECD is expected to grow at the lowest rate, i.e. 0.98%, the group should rank first in volume given an expected increase of 0.47 mb/d, equivalent to 38% of the total world demand increment. Developing Countries are expected to rank second in growth rate at 2.07%, with an increment volume of 0.41 mb/d for a 33% share of world oil demand growth. The highest percentage growth at 3.51% is attributable to the former CPEs, although the group’s volume and share of world demand growth ranks third at 0.35 mb/d, equivalent to 29% of the world increment. Every quarter of 2004 is forecast to see growth in oil demand. The first quarter is expected to account for the lowest growth rate at 0.89 mb/d or 1.13%. The second and the third quarters are forecast to enjoy much higher rises of 1.32 mb/d and 1.26 mb/d respectively, while the highest growth of 1.48 mb/d or 1.85% is expected in the fourth quarter.
Monthly Oil Market Report ___________________________________________________________________
November 2003 20
Table 9 World oil demand forecast for 2004
mb/d Change 2004/03 2003 1Q04 2Q04 3Q04 4Q04 2004 Volume % North America 24.51 24.77 24.39 24.95 25.12 24.81 0.30 1.24 Western Europe 15.17 15.25 15.10 15.19 15.58 15.28 0.11 0.71 OECD Pacific 8.75 9.65 8.11 8.10 9.41 8.82 0.06 0.73 Total OECD 48.43 49.68 47.60 48.24 50.11 48.91 0.47 0.98 Other Asia 7.62 7.66 7.82 7.81 7.98 7.82 0.20 2.59 Latin America 4.68 4.60 4.74 4.86 4.73 4.73 0.06 1.19 Middle East 4.97 4.97 4.88 5.27 5.17 5.07 0.11 2.15 Africa 2.55 2.61 2.62 2.53 2.63 2.60 0.05 1.99 Total DCs 19.81 19.83 20.05 20.47 20.51 20.22 0.41 2.07 FSU 3.87 4.05 3.47 3.83 4.55 3.98 0.11 2.86 Other Europe 0.74 0.79 0.79 0.71 0.77 0.76 0.02 3.10 China 5.47 5.62 5.68 5.96 5.51 5.69 0.22 4.02 Total "Other Regions" 10.08 10.47 9.94 10.50 10.83 10.44 0.35 3.51 Total world 78.33 79.98 77.60 79.22 81.45 79.56 1.24 1.58 Previous estimate 78.18 79.67 77.29 79.11 80.93 79.25 1.08 1.38 Revision 0.15 0.31 0.31 0.11 0.52 0.31 0.16 0.21 Totals may not add due to independent rounding
.
Table 10
First and second quarter world oil demand comparison for 2004 mb/d
Change 2004/03 Change 2004/03 1Q03 1Q04 Volume % 2Q03 2Q04 Volume % North America 24.57 24.77 0.20 0.80 24.14 24.39 0.25 1.04 Western Europe 15.20 15.25 0.06 0.38 14.98 15.10 0.12 0.77 OECD Pacific 9.61 9.65 0.05 0.52 8.04 8.11 0.07 0.88 Total OECD 49.37 49.68 0.30 0.61 47.17 47.60 0.44 0.92 Other Asia 7.54 7.66 0.12 1.58 7.58 7.82 0.24 3.18 Latin America 4.54 4.60 0.06 1.30 4.69 4.74 0.05 1.11 Middle East 4.89 4.97 0.08 1.69 4.76 4.88 0.12 2.46 Africa 2.55 2.61 0.06 2.29 2.54 2.62 0.07 2.92 Total DCs 19.52 19.83 0.32 1.63 19.57 20.05 0.48 2.48 FSU 4.01 4.05 0.04 0.94 3.35 3.47 0.13 3.87 Other Europe 0.77 0.79 0.02 2.80 0.73 0.79 0.05 7.28 China 5.41 5.62 0.21 3.90 5.46 5.68 0.22 4.01 Total "Other Regions" 10.20 10.47 0.27 2.65 9.54 9.94 0.40 4.21 Total world 79.08 79.98 0.89 1.13 76.28 77.60 1.32 1.73 Totals may not add due to independent rounding.
____________________________________________________________________Monthly Oil Market Report
November 2003 21
Table 11 Third and fourth quarter world oil demand comparison for 2004
mb/d Change 2004/03
Change 2004/03
3Q03 3Q04 Volume % 4Q03 4Q04 Volume % North America 24.63 24.95 0.32 1.30 24.68 25.12 0.44 1.79 Western Europe 15.08 15.19 0.12 0.77 15.44 15.58 0.14 0.91 OECD Pacific 8.03 8.10 0.07 0.82 9.34 9.41 0.07 0.75 Total OECD 47.74 48.24 0.50 1.05 49.46 50.11 0.65 1.32 Other Asia 7.60 7.81 0.21 2.82 7.76 7.98 0.21 2.75
Latin America 4.80 4.86 0.06 1.23 4.68 4.73 0.05 1.13 Middle East 5.17 5.27 0.10 2.00 5.05 5.17 0.12 2.46 Africa 2.51 2.53 0.02 0.89 2.58 2.63 0.05 1.87 Total DCs 20.07 20.47 0.40 1.99 20.07 20.51 0.44 2.18 FSU 3.70 3.83 0.13 3.59 4.41 4.55 0.14 3.20 Other Europe 0.70 0.71 0.01 1.11 0.76 0.77 0.01 1.25 China 5.74 5.96 0.22 3.76 5.28 5.51 0.24 4.46 Total "Other Regions" 10.15 10.50 0.36 3.51 10.44 10.83 0.39 3.69 Total world 77.96 79.22 1.26 1.61 79.97 81.45 1.48 1.85 Totals may not add due to independent rounding.

Monthly Oil Market Report ___________________________________________________________________
November 2003 22
World Oil Supply
Non-OPEC
Forecast for 2003 Non-OPEC supply for 2003 revised down to 48.64 mb/d in October, still an increase of 0.88 mb/d over the downwardly revised figure for 2002
The 2003 non-OPEC supply figure was revised down to 48.64 mb/d. Minor 0.02 mb/d and 0.06 mb/d downward revisions were made to the first and second quarter supply, while the third and fourth quarters saw significant downward revisions due to lower performance in the North Sea. The USA, Gabon and Angola also contributed to these downward revisions. The quarterly distribution now stands at 48.61 mb/d, 47.97 mb/d, 48.78 mb/d and 49.20 mb/d respectively. The yearly average increase stands at 0.88 mb/d, compared with the downwardly revised 2002 figure.
Table 12 Non-OPEC oil supply in 2003
mb/d
Change 2002 1Q03 2Q03 3Q03 4Q03 2003 03/02
North America 14.51 14.74 14.55 14.78 14.66 14.68 0.17 Western Europe 6.63 6.75 6.20 6.20 6.49 6.41 –0.23 OECD Pacific 0.76 0.67 0.65 0.70 0.71 0.68 –0.08 Total OECD 21.90 22.17 21.40 21.68 21.86 21.77 –0.13 Other Asia 2.27 2.37 2.35 2.35 2.35 2.35 0.09 Latin America 3.87 3.85 3.78 3.90 3.91 3.86 –0.01 Middle East 2.06 2.05 2.02 1.99 2.01 2.02 –0.05 Africa 3.03 2.92 2.96 3.09 3.28 3.06 0.04 Total DCs 11.23 11.18 11.10 11.34 11.55 11.29 0.06 FSU 9.33 9.88 10.09 10.42 10.41 10.20 0.87 Other Europe 0.18 0.17 0.17 0.17 0.17 0.17 0.00 China 3.39 3.40 3.44 3.38 3.39 3.40 0.01 Total "Other regions" 12.90 13.46 13.71 13.97 13.97 13.78 0.88 Total non-OPEC production 46.03 46.81 46.21 46.99 47.38 46.85 0.81 Processing gains 1.73 1.81 1.77 1.79 1.82 1.79 0.06 Total non-OPEC supply 47.76 48.61 47.97 48.78 49.20 48.64 0.88 Previous estimate 47.81 48.63 48.03 48.96 49.32 48.74 0.93 Revision –0.04 –0.02 –0.06 –0.18 –0.12 –0.09 –0.05 Totals may not add due to independent rounding.
____________________________________________________________________Monthly Oil Market Report
November 2003 23
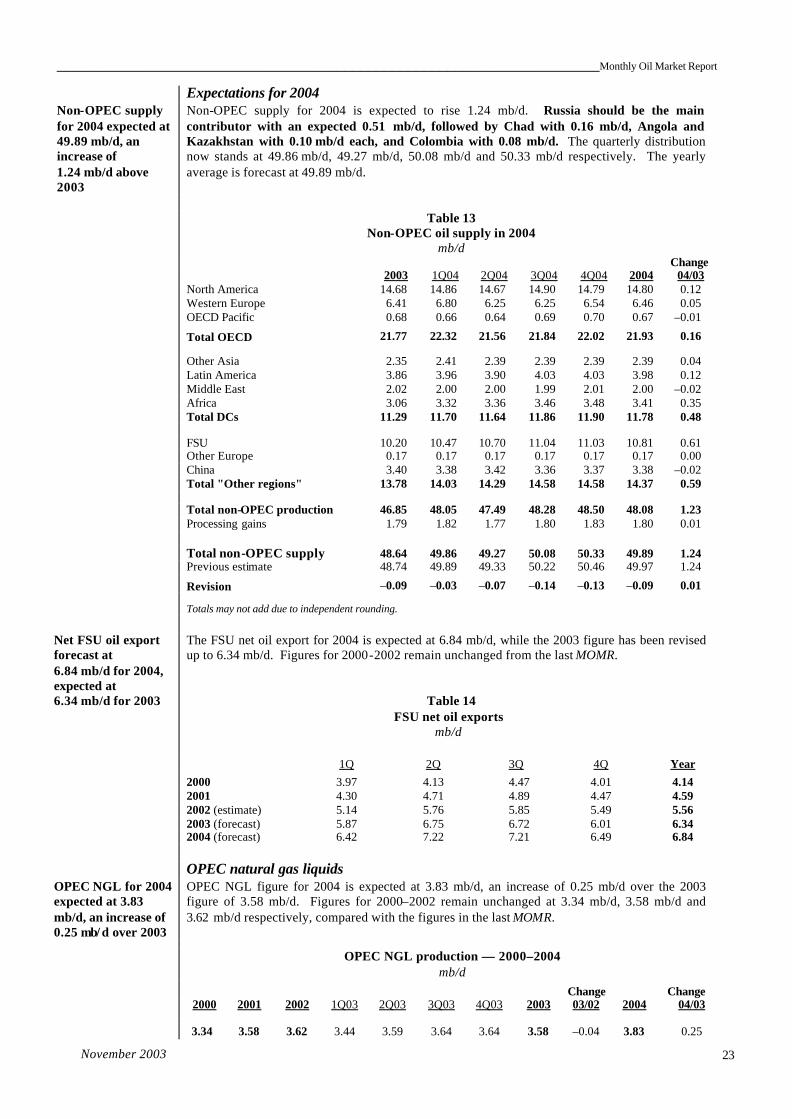
Expectations for 2004 Non-OPEC supply for 2004 expected at 49.89 mb/d, an increase of 1.24 mb/d above 2003
Non-OPEC supply for 2004 is expected to rise 1.24 mb/d. Russia should be the main contributor with an expected 0.51 mb/d, followed by Chad with 0.16 mb/d, Angola and Kazakhstan with 0.10 mb/d each, and Colombia with 0.08 mb/d. The quarterly distribution now stands at 49.86 mb/d, 49.27 mb/d, 50.08 mb/d and 50.33 mb/d respectively. The yearly average is forecast at 49.89 mb/d.
Table 13
Non-OPEC oil supply in 2004 mb/d
Change 2003 1Q04 2Q04 3Q04 4Q04 2004 04/03
North America 14.68 14.86 14.67 14.90 14.79 14.80 0.12 Western Europe 6.41 6.80 6.25 6.25 6.54 6.46 0.05 OECD Pacific 0.68 0.66 0.64 0.69 0.70 0.67 –0.01 Total OECD 21.77 22.32 21.56 21.84 22.02 21.93 0.16 Other Asia 2.35 2.41 2.39 2.39 2.39 2.39 0.04 Latin America 3.86 3.96 3.90 4.03 4.03 3.98 0.12 Middle East 2.02 2.00 2.00 1.99 2.01 2.00 –0.02 Africa 3.06 3.32 3.36 3.46 3.48 3.41 0.35 Total DCs 11.29 11.70 11.64 11.86 11.90 11.78 0.48 FSU 10.20 10.47 10.70 11.04 11.03 10.81 0.61 Other Europe 0.17 0.17 0.17 0.17 0.17 0.17 0.00 China 3.40 3.38 3.42 3.36 3.37 3.38 –0.02 Total "Other regions" 13.78 14.03 14.29 14.58 14.58 14.37 0.59 Total non-OPEC production 46.85 48.05 47.49 48.28 48.50 48.08 1.23 Processing gains 1.79 1.82 1.77 1.80 1.83 1.80 0.01 Total non-OPEC supply 48.64 49.86 49.27 50.08 50.33 49.89 1.24 Previous estimate 48.74 49.89 49.33 50.22 50.46 49.97 1.24 Revision –0.09 –0.03 –0.07 –0.14 –0.13 –0.09 0.01
Totals may not add due to independent rounding.
Net FSU oil export forecast at 6.84 mb/d for 2004, expected at 6.34 mb/d for 2003
The FSU net oil export for 2004 is expected at 6.84 mb/d, while the 2003 figure has been revised up to 6.34 mb/d. Figures for 2000-2002 remain unchanged from the last MOMR.
Table 14
FSU net oil exports mb/d
1Q 2Q 3Q 4Q Year 2000 3.97 4.13 4.47 4.01 4.14 2001 4.30 4.71 4.89 4.47 4.59 2002 (estimate) 5.14 5.76 5.85 5.49 5.56 2003 (forecast) 5.87 6.75 6.72 6.01 6.34 2004 (forecast) 6.42 7.22 7.21 6.49 6.84 OPEC natural gas liquids OPEC NGL for 2004 expected at 3.83 mb/d, an increase of 0.25 mb/ d over 2003
OPEC NGL figure for 2004 is expected at 3.83 mb/d, an increase of 0.25 mb/d over the 2003 figure of 3.58 mb/d. Figures for 2000–2002 remain unchanged at 3.34 mb/d, 3.58 mb/d and 3.62 mb/d respectively, compared with the figures in the last MOMR.
OPEC NGL production — 2000–2004 mb/d
Change Change 2000 2001 2002 1Q03 2Q03 3Q03 4Q03 2003 03/02 2004 04/03
3.34 3.58 3.62 3.44 3.59 3.64 3.64 3.58 –0.04 3.83 0.25

Monthly Oil Market Report ___________________________________________________________________
November 2003 24
OPEC crude oil production Available secondary
sources put OPEC’s October production at 27.41 mb/d
Available secondary sources indicate that OPEC output for October was 27.41 mb/d, an increase of 0.25 mb/d from the revised September figure of 27.17 mb/d. Table 15 shows OPEC production as reported by selected secondary sources.
Table 15
OPEC crude oil production based on secondary sources 1,000 b/d
2001 2002 2Q03 Sept 03* 3Q03 Oct 03* Oct-Sept
Algeria 820 864 1,127 1,172 1,160 1,175 3 Indonesia 1,214 1,120 1,026 1,008 1,011 1,007 –2 IR Iran 3,672 3,428 3,716 3,773 3,768 3,785 13 Iraq 2,383 2,006 291 1,456 1,052 1,645 190 Kuwait 2,021 1,885 2,250 2,150 2,130 2,178 28 SP Libyan AJ 1,361 1,314 1,423 1,435 1,425 1,445 10 Nigeria 2,098 1,969 1,985 2,195 2,173 2,249 54 Qatar 683 648 750 746 740 746 0 Saudi Arabia 7,939 7,535 9,022 8,462 8,533 8,407 –54 UAE 2,163 1,988 2,294 2,228 2,264 2,215 –13 Venezuela 2,862 2,586 2,584 2,543 2,559 2,564 21
Total OPEC 27,217 25,341 26,468 27,166 26,815 27,415 249
Totals may not add due to independent rounding. * Not all sources available.

____________________________________________________________________Monthly Oil Market Report
November 2003 25
Rig Count
Non-OPEC rig count up 47 in October
Non-OPEC Rig activity rose in October. North America gained 60 rigs, compared with the Septemb er figure. Canada’s rig activity increased 46 rigs to 394, while USA and Mexico gained 9 and 5 rigs respectively. Western Europe’s rig activity declined by 7 rigs to 75, mainly from losses in the UK. Rig activity in Australia was up 3 rigs to 15. The Middle East witnessed a decline of 6 rigs to 69, mainly from Egypt which dropped 4 rigs to 24.
Table 16 Non-OPEC rig count in 2002–2003
Change Change 2001 2002 02/01 Sept 03 Oct 03 Oct/Sept North America 1,552 1,162 –390 1,544 1,604 60 Western Europe 95 85 –10 82 75 –7 OECD Pacific 20 17 –3 20 22 2
OECD 1,667 1,264 –40 3 1646 1701 55 Other Asia 95 111 16 123 122 –1 Latin America 141 106 –35 115 114 –1 Middle East 50 62 12 75 69 –6 Africa 36 43 7 48 48 0 DCs 321 322 1 361 353 –8 FSU n.a. n.a. n.a. Other Europe 3 2 –1 2 2 0 China n.a. n.a. n.a. Other regions n.a. n.a. n.a. 2 2 0 Total non-OPEC 1,991 1,588 –403 2,009 2,056 47
Totals may not add due to independent rounding. n.a. not available
Source: Baker Hughes International.
OPEC
OPEC rig count up 5 in October
OPEC’s rig count was 216 in October, an increase of 5 rigs when compared with the September figure. IR Iran and Venezuela added 2 and 3 rigs to 35 and 44 respectively over last month’s figures.
Table 17 OPEC rig count
Change Change
2001 2002 02/01 Sept 03 Oct 03 Oct/Sept Algeria 20 20 0 18 17 –1 Indonesia 41 46 6 41 42 1 IR Iran 30 34 4 33 35 2 Iraq n.a. n.a. n.a. n.a. n.a. n.a. Kuwait 9 6 –3 5 5 0 SP Libyan AJ 5 10 5 10 10 0 Nigeria 12 12 0 8 7 –1 Qatar 9 13 4 6 6 0 Saudi Arabia 30 32 2 32 33 1 UAE 15 16 0 17 17 0 Venezuela 67 42 –25 41 44 3 Total OPEC 238 231 –7 211 216 5
Totals may not add due to independent rounding. n..a. not available
Source: Baker Hughes International.

Monthly Oil Market Report ___________________________________________________________________
November 2003 26
Stock Movements
Commercial oil stocks remained almost unchanged in USA at the end of October
USA Commercial oil stocks in USA, which registered a massive build of 32 mb last month, remained almost unchanged during the period 3-31 October, moving down a marginal 0.5 mb at a rate of 0.02 mb/d to stand at 966.5 mb. However, crude oil stocks continued their upward trend, increasing 5.7 mb to 291.9 mb. US crude oil imports averaged 10.2 mb/d at the end of October, up a slight 17,000 b/d from the previous week. This was the highest weekly average ever during the month of October. Crude oil imports have averaged 10 mb/d over the last four weeks, which was 0.44 mb/d more than this time last year, mainly on the flow of West African cargos to the USA. US crude oil refinery runs averaged 15.5 mb during the week ending 31 October, an increase of 107,000 b/d from the previous week. This was the fourth consecutive week in which crude oil runs have increased, signaling the return of some refineries from their autumn maintenance programmes. Crude runs averaged 15.34 mb/d over the last four weeks, almost 1 mb/d more than last year’s level. On the product side, distillate fuel inventories rose 1.2 mb to 132.7 mb, with a 2.6 mb increase in high-sulphur heating oil, and a more than 1.4 mb decrease in low sulphur diesel fuel. These levels put distillate inventories at 9.1% above the same period last year. Apparent demand for distillate fuel was relatively low since the middle of October, however, it jumped by almost half a million barrels per day at the end of October. At the same time, distillate fuel production recovered gradually in the last four weeks of October signaling the end of refinery maintenance and the resultant boost in distillate stocks. Gasoline stocks registered a significant draw of 6.7 mb to 191.3 mb putting the y-o-y deficit at 1.3%. The implied demand for gasoline averaged 9.17 mb/d over the last four weeks, a hefty 2.4% above last year at the same period, reflecting the recent trend in line with soaring economic growth. Unusual strong demand was the main reason behind this draw. The draw on gasoline stocks left a y-o-y deficit of 1.7% or 17 mb in total oil commercial stocks. During the same period, the Strategic Petroleum Reserve (SPR) increased by 6.2 mb to 630.0 mb, reaching a new record-high, which was 40.5 mb above the level registered a year-ago. During the week ending 7 November, the US commercial oil stocks showed a draw of 4.8 mb to 961.7 mb, corresponding to a 2.2% y-o-y deficit. Crude oil inventories fell 1.5 mb to 291.1 mb, almost the same level as last year at this time. Distillate inventories decreased 1.5 mb to 132.7 mb, with almost all of the decline in low sulphur distillate fuel, but remained at a comfortable level of 7.5% above a year ago. Motor gasoline stocks rose 1.0 mb to 191.3 mb, which was still 1.9% below last year’s figure. During the same period, the SPR gained more volume, increasing by 1.2 mb to reach 631.2 mb, widening the y-o-y surplus to 40.3 mb.
Table 18 US onland commercial petroleum stocks*
mb
28 Aug 03 3 Oct 03 31 Oct 03 Oct/Sept 31 Oct 03 7 Nov 03** Crude oil (excl. SPR) 280.4 286.2 291.9 5.70 290.8 291.1 Gasoline 191.9 198.0 191.3 –6.70 193.9 192.3 Distillate fuel 124.7 131.5 132.7 1.20 121.6 131.2 Residual fuel oil 30.7 32.4 33.6 1.20 33.5 33.8 Jet fuel 38.2 40.4 39.8 –0.60 41.6 39.3 Unfinished oils 85.2 82.5 84.6 2.10 90.3 84.0 Other oils 183.9 196.1 192.6 –3.50 211.7 190.0 Total 935.0 967.0 966.5 –0.50 983.5 961.7 SPR 617.0 623.8 630.0 6.20 589.5 631.2 * At end of month, unless otherwise stated. ** Latest available data at time of report’s release. Source: US Department of Energy’s Energy Information Administration.
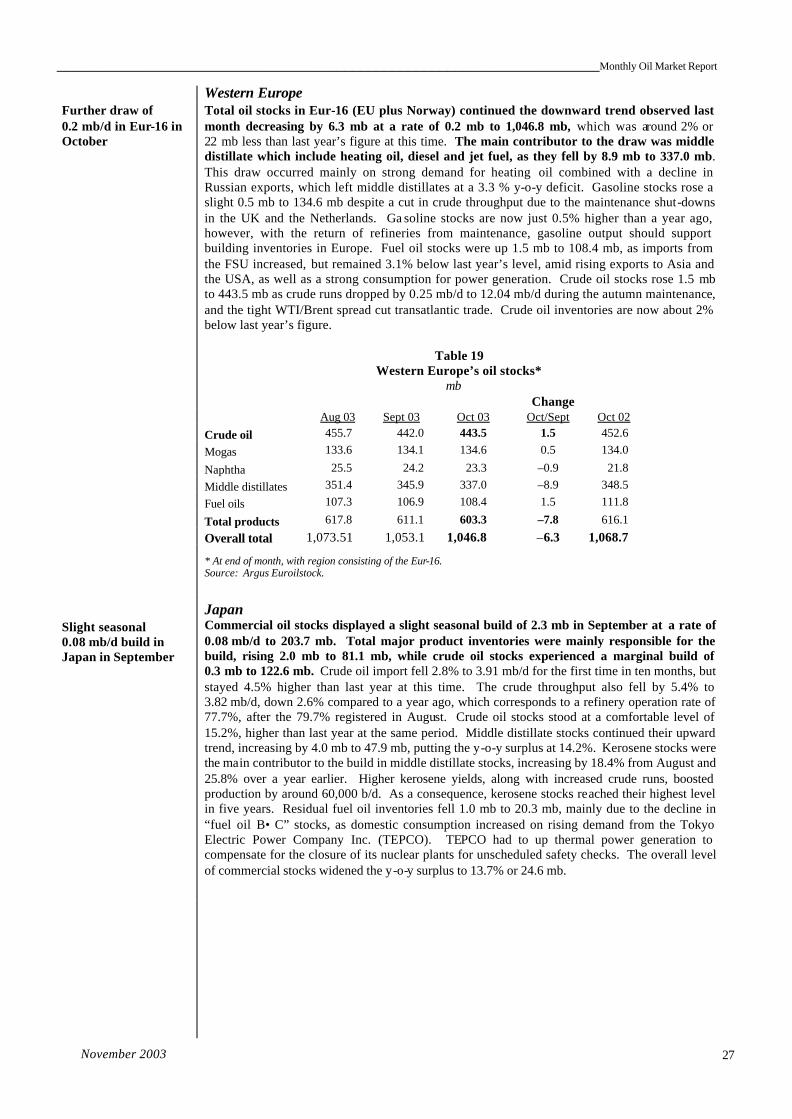
____________________________________________________________________Monthly Oil Market Report
November 2003 27
Western Europe Further draw of 0.2 mb/d in Eur-16 in October
Total oil stocks in Eur-16 (EU plus Norway) continued the downward trend observed last month decreasing by 6.3 mb at a rate of 0.2 mb to 1,046.8 mb, which was around 2% or 22 mb less than last year’s figure at this time. The main contributor to the draw was middle distillate which include heating oil, diesel and jet fuel, as they fell by 8.9 mb to 337.0 mb. This draw occurred mainly on strong demand for heating oil combined with a decline in Russian exports, which left middle distillates at a 3.3 % y-o-y deficit. Gasoline stocks rose a slight 0.5 mb to 134.6 mb despite a cut in crude throughput due to the maintenance shut-downs in the UK and the Netherlands. Ga soline stocks are now just 0.5% higher than a year ago, however, with the return of refineries from maintenance, gasoline output should support building inventories in Europe. Fuel oil stocks were up 1.5 mb to 108.4 mb, as imports from the FSU increased, but remained 3.1% below last year’s level, amid rising exports to Asia and the USA, as well as a strong consumption for power generation. Crude oil stocks rose 1.5 mb to 443.5 mb as crude runs dropped by 0.25 mb/d to 12.04 mb/d during the autumn maintenance, and the tight WTI/Brent spread cut transatlantic trade. Crude oil inventories are now about 2% below last year’s figure.
Table 19
Western Europe’s oil stocks* mb
Change Aug 03 Sept 03 Oct 03 Oct/Sept Oct 02 Crude oil 455.7 442.0 443.5 1.5 452.6 Mogas 133.6 134.1 134.6 0.5 134.0 Naphtha 25.5 24.2 23.3 –0.9 21.8 Middle distillates 351.4 345.9 337.0 –8.9 348.5 Fuel oils 107.3 106.9 108.4 1.5 111.8 Total products 617.8 611.1 603.3 –7.8 616.1 Overall total 1,073.51 1,053.1 1,046.8 –6.3 1,068.7
* At end of month, with region consisting of the Eur-16. Source: Argus Euroilstock.
Slight seasonal 0.08 mb/d build in Japan in September
Japan Commercial oil stocks displayed a slight seasonal build of 2.3 mb in September at a rate of 0.08 mb/d to 203.7 mb. Total major product inventories were mainly responsible for the build, rising 2.0 mb to 81.1 mb, while crude oil stocks experienced a marginal build of 0.3 mb to 122.6 mb. Crude oil import fell 2.8% to 3.91 mb/d for the first time in ten months, but stayed 4.5% higher than last year at this time. The crude throughput also fell by 5.4% to 3.82 mb/d, down 2.6% compared to a year ago, which corresponds to a refinery operation rate of 77.7%, after the 79.7% registered in August. Crude oil stocks stood at a comfortable level of 15.2%, higher than last year at the same period. Middle distillate stocks continued their upward trend, increasing by 4.0 mb to 47.9 mb, putting the y-o-y surplus at 14.2%. Kerosene stocks were the main contributor to the build in middle distillate stocks, increasing by 18.4% from August and 25.8% over a year earlier. Higher kerosene yields, along with increased crude runs, boosted production by around 60,000 b/d. As a consequence, kerosene stocks reached their highest level in five years. Residual fuel oil inventories fell 1.0 mb to 20.3 mb, mainly due to the decline in “fuel oil B • C” stocks, as domestic consumption increased on rising demand from the Tokyo Electric Power Company Inc. (TEPCO). TEPCO had to up thermal power generation to compensate for the closure of its nuclear plants for unscheduled safety checks. The overall level of commercial stocks widened the y-o-y surplus to 13.7% or 24.6 mb.
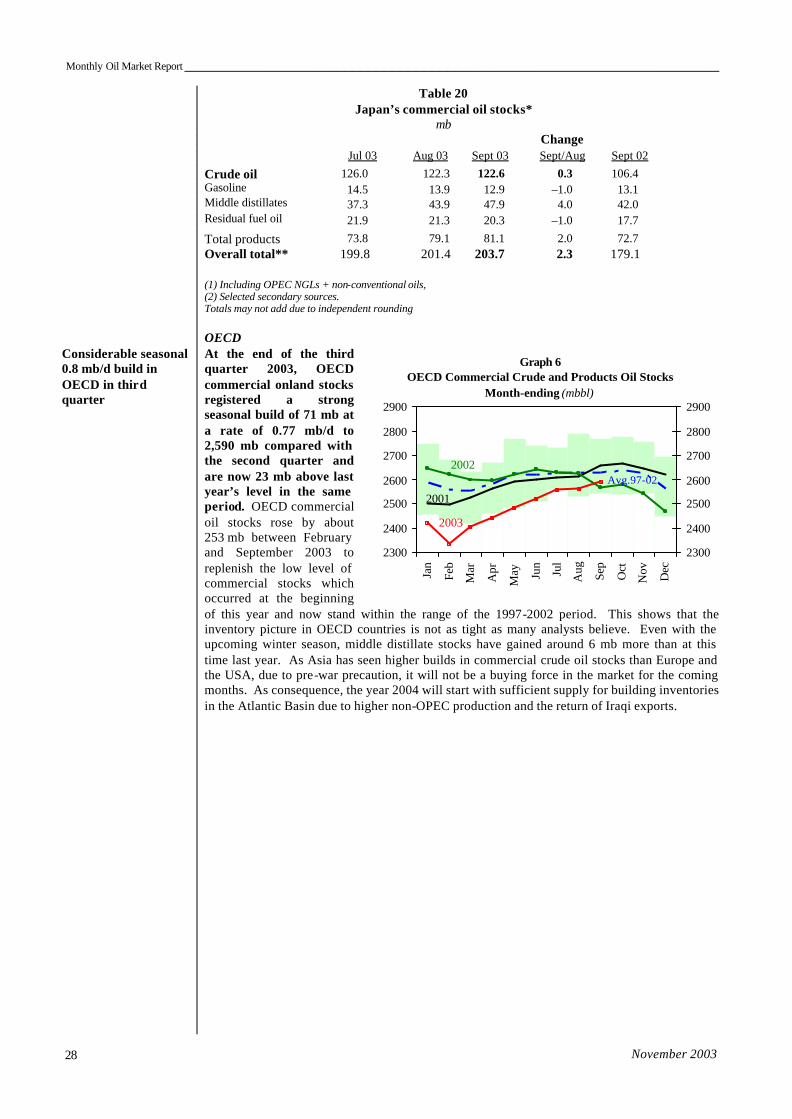
Monthly Oil Market Report ___________________________________________________________________
November 2003 28
Table 20 Japan’s commercial oil stocks*
mb Change Jul 03 Aug 03 Sept 03 Sept/Aug Sept 02 Crude oil 126.0 122.3 122.6 0.3 106.4 Gasoline 14.5 13.9 12.9 –1.0 13.1 Middle distillates 37.3 43.9 47.9 4.0 42.0 Residual fuel oil 21.9 21.3 20.3 –1.0 17.7 Total products 73.8 79.1 81.1 2.0 72.7 Overall total** 199.8 201.4 203.7 2.3 179.1 (1) Including OPEC NGLs + non-conventional oils,
(2) Selected secondary sources. Totals may not add due to independent rounding
Considerable seasonal 0.8 mb/d build in OECD in third quarter
OECD At the end of the third quarter 2003, OECD commercial onland stocks registered a strong seasonal build of 71 mb at a rate of 0.77 mb/d to 2,590 mb compared with the second quarter and are now 23 mb above last year’s level in the same period. OECD commercial oil stocks rose by about 253 mb between February and September 2003 to replenish the low level of commercial stocks which occurred at the beginning of this year and now stand within the range of the 1997-2002 period. This shows that the inventory picture in OECD countries is not as tight as many analysts believe. Even with the upcoming winter season, middle distillate stocks have gained around 6 mb more than at this time last year. As Asia has seen higher builds in commercial crude oil stocks than Europe and the USA, due to pre-war precaution, it will not be a buying force in the market for the coming months. As consequence, the year 2004 will start with sufficient supply for building inventories in the Atlantic Basin due to higher non-OPEC production and the return of Iraqi exports.
Graph 6OECD Commercial Crude and Products Oil Stocks
Month-ending (mbbl)
Avg.97-02
2001
2002
2003
2300
2400
2500
2600
2700
2800
2900
Jan
Feb
Mar
Apr
May Ju
n
Jul
Aug Sep
Oct
Nov Dec
2300
2400
2500
2600
2700
2800
2900
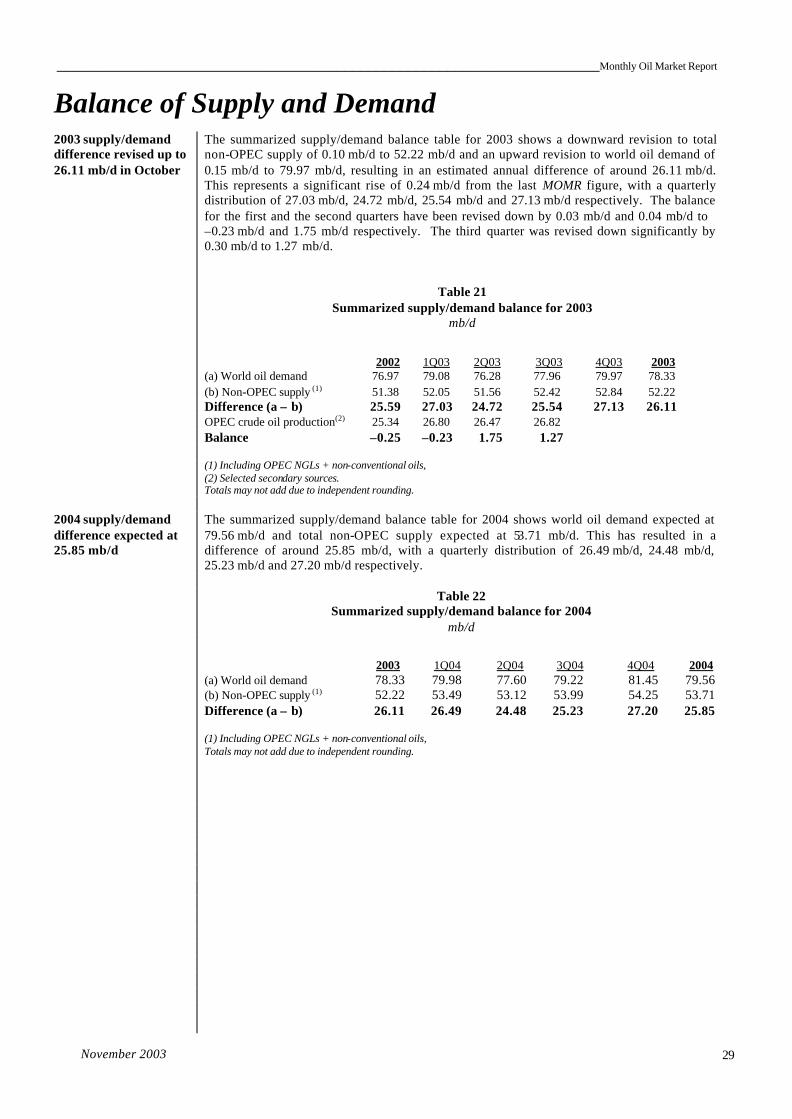
____________________________________________________________________Monthly Oil Market Report
November 2003 29
Balance of Supply and Demand
2003 supply/demand difference revised up to 26.11 mb/d in October
The summarized supply/demand balance table for 2003 shows a downward revision to total non-OPEC supply of 0.10 mb/d to 52.22 mb/d and an upward revision to world oil demand of 0.15 mb/d to 79.97 mb/d, resulting in an estimated annual difference of around 26.11 mb/d. This represents a significant rise of 0.24 mb/d from the last MOMR figure, with a quarterly distribution of 27.03 mb/d, 24.72 mb/d, 25.54 mb/d and 27.13 mb/d respectively. The balance for the first and the second quarters have been revised down by 0.03 mb/d and 0.04 mb/d to –0.23 mb/d and 1.75 mb/d respectively. The third quarter was revised down significantly by 0.30 mb/d to 1.27 mb/d.
Table 21
Summarized supply/demand balance for 2003 mb/d
2002 1Q03 2Q03 3Q03 4Q03 2003 (a) World oil demand 76.97 79.08 76.28 77.96 79.97 78.33 (b) Non-OPEC supply (1) 51.38 52.05 51.56 52.42 52.84 52.22 Difference (a – b) 25.59 27.03 24.72 25.54 27.13 26.11 OPEC crude oil production(2) 25.34 26.80 26.47 26.82 Balance –0.25 –0.23 1.75 1.27
(1) Including OPEC NGLs + non-conventional oils, (2) Selected secondary sources. Totals may not add due to independent rounding.
2004 supply/demand difference expected at 25.85 mb/d
The summarized supply/demand balance table for 2004 shows world oil demand expected at 79.56 mb/d and total non-OPEC supply expected at 53.71 mb/d. This has resulted in a difference of around 25.85 mb/d, with a quarterly distribution of 26.49 mb/d, 24.48 mb/d, 25.23 mb/d and 27.20 mb/d respectively.
Table 22
Summarized supply/demand balance for 2004 mb/d
2003 1Q04 2Q04 3Q04 4Q04 2004 (a) World oil demand 78.33 79.98 77.60 79.22 81.45 79.56 (b) Non-OPEC supply (1) 52.22 53.49 53.12 53.99 54.25 53.71 Difference (a – b) 26.11 26.49 24.48 25.23 27.20 25.85
(1) Including OPEC NGLs + non-conventional oils, Totals may not add due to independent rounding.
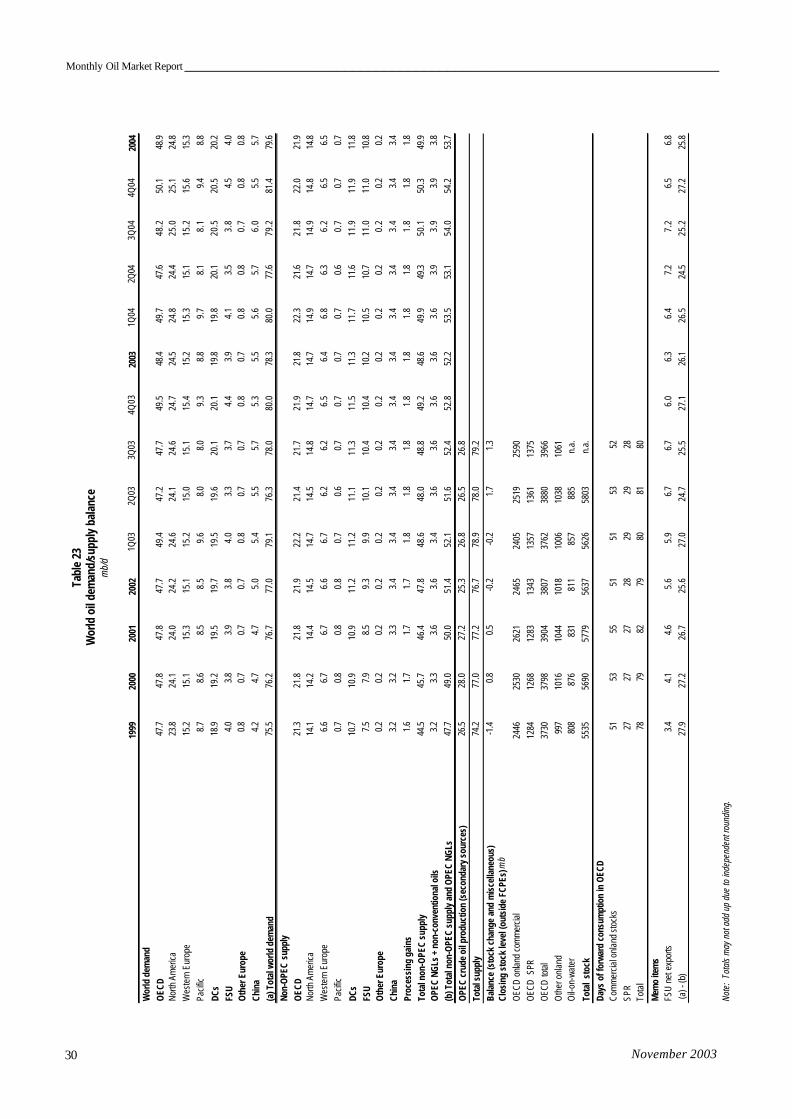
Monthly Oil Market Report ___________________________________________________________________
November 2003 30
1999
2000
2001
2002
1Q03
2Q03
3Q03
4Q03
2003
1Q04
2Q04
3Q04
4Q04
2004
Wor
ld d
eman
dO
ECD
47.7
47.8
47.8
47.7
49.4
47.2
47.7
49.5
48.4
49.7
47.6
48.2
50.1
48.9
North
Am
erica
23.8
24.1
24.0
24.2
24.6
24.1
24.6
24.7
24.5
24.8
24.4
25.0
25.1
24.8
Wes
tern
Eur
ope
15.2
15.1
15.3
15.1
15.2
15.0
15.1
15.4
15.2
15.3
15.1
15.2
15.6
15.3
Pacif
ic8.
78.
68.
58.
59.
68.
08.
09.
38.
89.
78.
18.
19.
48.
8
DCs
18.9
19.2
19.5
19.7
19.5
19.6
20.1
20.1
19.8
19.8
20.1
20.5
20.5
20.2
FSU
4.0
3.8
3.9
3.8
4.0
3.3
3.7
4.4
3.9
4.1
3.5
3.8
4.5
4.0
Oth
er E
urop
e0.
80.
70.
70.
70.
80.
70.
70.
80.
70.
80.
80.
70.
80.
8
Chin
a4.
24.
74.
75.
05.
45.
55.
75.
35.
55.
65.
76.
05.
55.
7
(a) T
otal
wor
ld d
eman
d75
.576
.276
.777
.079
.176
.378
.080
.078
.380
.077
.679
.281
.479
.6
Non-
OPE
C su
pply
OEC
D21
.321
.821
.821
.922
.221
.421
.721
.921
.822
.321
.621
.822
.021
.9No
rth A
mer
ica14
.114
.214
.414
.514
.714
.514
.814
.714
.714
.914
.714
.914
.814
.8W
este
rn E
urop
e6.
66.
76.
76.
66.
76.
26.
26.
56.
46.
86.
36.
26.
56.
5Pa
cific
0.7
0.8
0.8
0.8
0.7
0.6
0.7
0.7
0.7
0.7
0.6
0.7
0.7
0.7
DCs
10.7
10.9
10.9
11.2
11.2
11.1
11.3
11.5
11.3
11.7
11.6
11.9
11.9
11.8
FSU
7.5
7.9
8.5
9.3
9.9
10.1
10.4
10.4
10.2
10.5
10.7
11.0
11.0
10.8
Oth
er E
urop
e0.
20.
20.
20.
20.
20.
20.
20.
20.
20.
20.
20.
20.
20.
2
Chin
a3.
23.
23.
33.
43.
43.
43.
43.
43.
43.
43.
43.
43.
43.
4
Proc
essi
ng g
ains
1.6
1.7
1.7
1.7
1.8
1.8
1.8
1.8
1.8
1.8
1.8
1.8
1.8
1.8
Tota
l non
-OPE
C su
pply
44.5
45.7
46.4
47.8
48.6
48.0
48.8
49.2
48.6
49.9
49.3
50.1
50.3
49.9
OPE
C NG
Ls +
non
-con
vent
iona
l oils
3.2
3.3
3.6
3.6
3.4
3.6
3.6
3.6
3.6
3.6
3.9
3.9
3.9
3.8
(b) T
otal
non
-OPE
C su
pply
and
OPE
C NG
Ls47
.749
.050
.051
.452
.151
.652
.452
.852
.253
.553
.154
.054
.253
.7
OPE
C cr
ude
oil p
rodu
ctio
n (s
econ
dary
sou
rces
)26
.528
.027
.225
.326
.826
.526
.8
Tota
l sup
ply
74.2
77.0
77.2
76.7
78.9
78.0
79.2
Bala
nce
(sto
ck c
hang
e an
d m
isce
llane
ous)
-1.4
0.8
0.5
-0.2
-0.2
1.7
1.3
Clos
ing
stoc
k le
vel (
outs
ide
FCPE
s) m
b
OEC
D on
land
com
mer
cial
2446
2530
2621
2465
2405
2519
2590
OEC
D S
PR12
8412
6812
8313
4313
5713
6113
75O
ECD
tota
l37
3037
9839
0438
0737
6238
8039
66O
ther
onl
and
997
1016
1044
1018
1006
1038
1061
Oil-
on-w
ater
808
876
831
811
857
885
n.a.
Tota
l st
ock
5535
5690
5779
5637
5626
5803
n.a.
Days
of f
orw
ard
cons
umpt
ion
in O
ECD
Com
mer
cial o
nlan
d st
ocks
5153
5551
5153
52SP
R27
2727
2829
2928
Tota
l78
7982
7980
8180
Mem
o ite
ms
FSU
net e
xpor
ts3.
44.
14.
65.
65.
96.
76.
76.
06.
36.
47.
27.
26.
56.
8 (a
) - (b
)
27
.927
.226
.725
.627
.024
.725
.527
.126
.126
.524
.525
.227
.225
.8
Note
: To
tals
may
not
add
up
due
to in
depe
nden
t rou
ndin
g.
Tabl
e 23
Wor
ld o
il de
man
d/su
pply
bal
ance
m
b/d
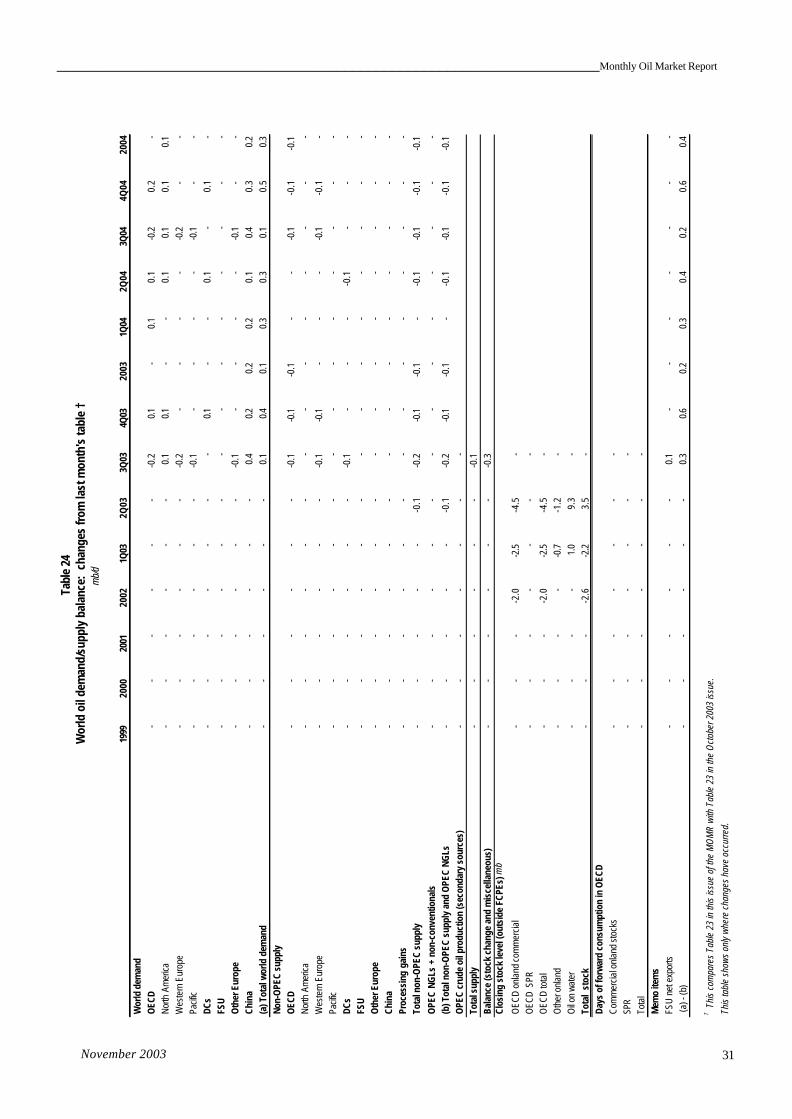
____________________________________________________________________Monthly Oil Market Report
November 2003 31
1999
2000
2001
2002
1Q03
2Q03
3Q03
4Q03
2003
1Q04
2Q04
3Q04
4Q04
2004
Wor
ld d
eman
dO
ECD
--
--
--
-0.2
0.1
-0.
10.
1-0
.20.
2-
North
Am
erica
--
--
--
0.1
0.1
--
0.1
0.1
0.1
0.1
Wes
tern
Eur
ope
--
--
--
-0.2
--
--
-0.2
--
Pacif
ic-
--
--
--0
.1-
--
--0
.1-
-DC
s-
--
--
--
0.1
--
0.1
-0.
1-
FSU
--
--
--
--
--
--
--
Oth
er E
urop
e-
--
--
--0
.1-
--
--0
.1-
-C
hina
--
--
--
0.4
0.2
0.2
0.2
0.1
0.4
0.3
0.2
(a) T
otal
wor
ld d
eman
d-
--
--
-0.
10.
40.
10.
30.
30.
10.
50.
3No
n-O
PEC
supp
lyO
ECD
--
--
--
-0.1
-0.1
-0.1
--
-0.1
-0.1
-0.1
North
Am
erica
--
--
--
--
--
--
--
Wes
tern
Eur
ope
--
--
--
-0.1
-0.1
--
--0
.1-0
.1-
Pacif
ic-
--
--
--
--
--
--
-DC
s-
--
--
--0
.1-
--
-0.1
--
-FS
U-
--
--
--
--
--
--
-O
ther
Eur
ope
--
--
--
--
--
--
--
Chi
na-
--
--
--
--
--
--
-Pr
oces
sing
gai
ns-
--
--
--
--
--
--
-To
tal n
on-O
PEC
sup
ply
--
--
--0
.1-0
.2-0
.1-0
.1-
-0.1
-0.1
-0.1
-0.1
OPE
C NG
Ls +
non
-con
vent
iona
ls-
--
--
--
--
--
--
-(b
) Tot
al n
on-O
PEC
sup
ply
and
OPE
C N
GLs
--
--
--0
.1-0
.2-0
.1-0
.1-
-0.1
-0.1
-0.1
-0.1
OPE
C cr
ude
oil p
rodu
ctio
n (s
econ
dary
sou
rces
)-
--
--
--
Tota
l sup
ply
--
--
--
-0.1
Bal
ance
(sto
ck c
hang
e an
d m
isce
llane
ous)
--
--
--
-0.3
Clos
ing
stoc
k le
vel (
outs
ide
FCPE
s) m
b
OEC
D o
nlan
d co
mm
erci
al-
--
-2.0
-2.5
-4.5
-O
ECD
SPR
--
--
--
-O
ECD
tota
l-
--
-2.0
-2.5
-4.5
-O
ther
onl
and
--
--
-0.7
-1.2
-O
il on
wate
r-
--
-1.
09.
3-
Tota
l st
ock
--
--2
.6-2
.23.
5-
Day
s of
forw
ard
cons
umpt
ion
in O
ECD
Com
mer
cial
onl
and
stoc
ks-
--
--
--
SPR
--
--
--
-To
tal
--
--
--
-M
emo
item
sFS
U ne
t exp
orts
--
--
--
0.1
--
--
--
- (a
) - (b
)
-
--
--
-0.
30.
60.
20.
30.
40.
20.
60.
4
† T
his
com
pare
s Ta
ble
23 in
this
issue
of t
he M
OM
R wi
th T
able
23
in th
e O
ctob
er 2
003
issue
.
This
tabl
e sh
ows
only
whe
re c
hang
es h
ave
occu
rred.
Tabl
e 24
Wor
ld o
il de
man
d/su
pply
bal
ance
: ch
ange
s fr
om la
st m
onth
's ta
ble
†m
b/d
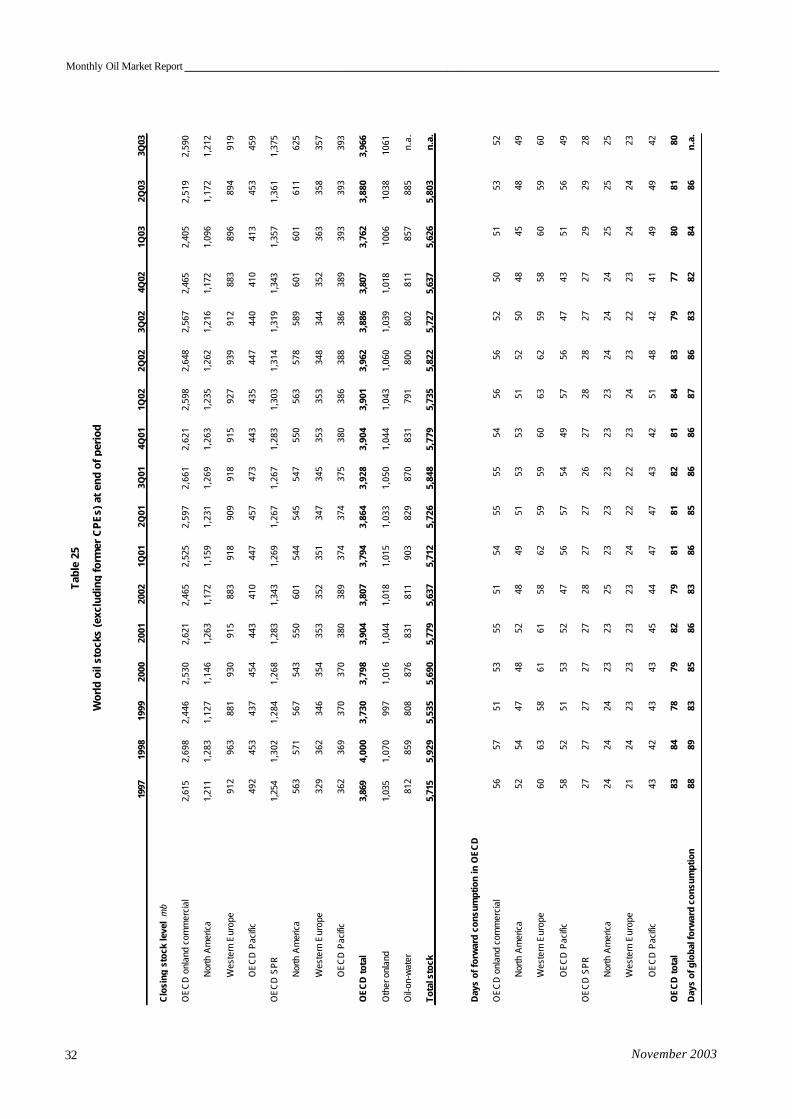
Monthly Oil Market Report ___________________________________________________________________
November 2003 32
1997
1998
1999
2000
2001
2002
1Q01
2Q01
3Q01
4Q01
1Q02
2Q02
3Q02
4Q02
1Q03
2Q03
3Q03
Clo
sing
sto
ck le
vel
mb
OE
CD
onl
and
com
mer
cial
2,61
52,
698
2,44
62,
530
2,62
12,
465
2,52
52,
597
2,66
12,
621
2,59
82,
648
2,56
72,
465
2,40
52,
519
2,59
0
Nor
th A
mer
ica
1,21
11,
283
1,12
71,
146
1,26
31,
172
1,15
91,
231
1,26
91,
263
1,23
51,
262
1,21
61,
172
1,09
61,
172
1,21
2
Wes
tern
Eur
ope
912
963
881
930
915
883
918
909
918
915
927
939
912
883
896
894
919
OE
CD
Pac
ific
492
453
437
454
443
410
447
457
473
443
435
447
440
410
413
453
459
OE
CD
SP
R1,
254
1,30
21,
284
1,26
81,
283
1,34
31,
269
1,26
71,
267
1,28
31,
303
1,31
41,
319
1,34
31,
357
1,36
11,
375
Nor
th A
mer
ica
563
571
567
543
550
601
544
545
547
550
563
578
589
601
601
611
625
Wes
tern
Eur
ope
329
362
346
354
353
352
351
347
345
353
353
348
344
352
363
358
357
OE
CD
Pac
ific
362
369
370
370
380
389
374
374
375
380
386
388
386
389
393
393
393
OE
CD
tot
al3,
869
4,00
03,
730
3,79
83,
904
3,80
73,
794
3,86
43,
928
3,90
43,
901
3,96
23,
886
3,80
73,
762
3,88
03,
966
Oth
er o
nlan
d1,
035
1,07
099
71,
016
1,04
41,
018
1,01
51,
033
1,05
01,
044
1,04
31,
060
1,03
91,
018
1006
1038
1061
Oil-
on-w
ater
812
859
808
876
831
811
903
829
870
831
791
800
802
811
857
885
n.a.
Tota
l sto
ck5,
715
5,92
95,
535
5,69
05,
779
5,63
75,
712
5,72
65,
848
5,77
95,
735
5,82
25,
727
5,63
75,
626
5,80
3n
.a.
Day
s of
for
war
d co
nsum
ptio
n in
OE
CD
OE
CD
onl
and
com
mer
cial
5657
5153
5551
5455
5554
5656
5250
5153
52
Nor
th A
mer
ica
5254
4748
5248
4951
5353
5152
5048
4548
49
Wes
tern
Eur
ope
6063
5861
6158
6259
5960
6362
5958
6059
60
OE
CD
Pac
ific
5852
5153
5247
5657
5449
5756
4743
5156
49
OE
CD
SP
R27
2727
2727
2827
2726
2728
2827
2729
2928
Nor
th A
mer
ica
2424
2423
2325
2323
2323
2324
2424
2525
25
Wes
tern
Eur
ope
2124
2323
2323
2422
2223
2423
2223
2424
23
OE
CD
Pac
ific
4342
4343
4544
4747
4342
5148
4241
4949
42
OE
CD
tot
al83
8478
7982
7981
8182
8184
8379
7780
8180
Day
s of
glo
bal f
orw
ard
cons
umpt
ion
8889
8385
8683
8685
8686
8786
8382
8486
n.a
.
Tabl
e 25
Wor
ld o
il st
ocks
(exc
ludi
ng fo
rmer
CP
Es)
at e
nd o
f per
iod
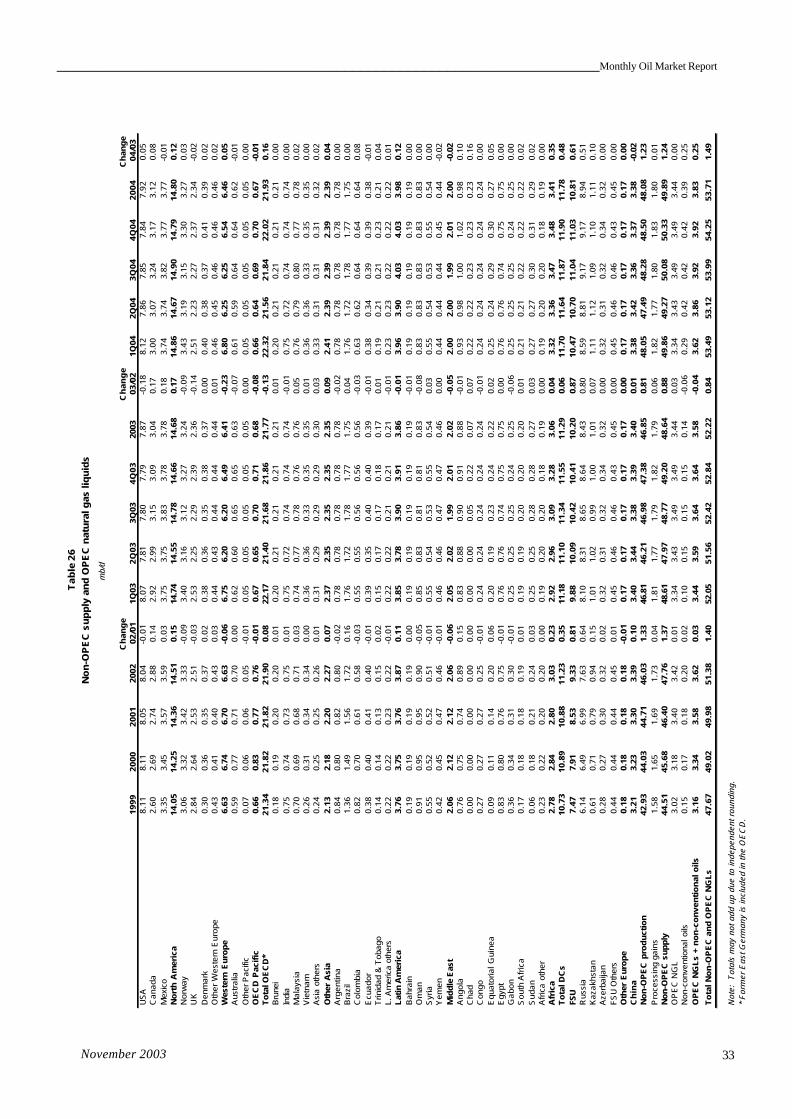
____________________________________________________________________Monthly Oil Market Report
November 2003 33
Ch
ang
eC
ha
ng
eC
han
ge
19
99
20
00
20
01
2002
02/
011Q
032
Q0
33Q
034
Q0
320
03 0
3/02
1Q04
2Q04
3Q
04
4Q
04
20
04
04/
03U
SA
8.11
8.11
8.05
8.04
-0.0
18.
077.
817.
807.
797.
87-0
.18
8.12
7.86
7.85
7.84
7.92
0.05
Can
ada
2.60
2.69
2.74
2.88
0.14
2.92
2.99
3.15
3.09
3.04
0.17
3.00
3.07
3.24
3.17
3.12
0.08
Mex
ico
3.35
3.45
3.57
3.59
0.03
3.75
3.75
3.83
3.78
3.78
0.18
3.74
3.74
3.82
3.77
3.77
-0.0
1N
ort
h A
mer
ica
14.0
514
.25
14.3
614
.51
0.15
14.7
414
.55
14.7
814
.66
14.6
80.
1714
.86
14.6
714
.90
14.7
914
.80
0.12
Nor
way
3.06
3.32
3.42
3.33
-0.0
93.
403.
163.
123.
273.
24-0
.09
3.43
3.19
3.15
3.30
3.27
0.03
UK
2.84
2.64
2.53
2.51
-0.0
32.
532.
252.
292.
392.
36-0
.14
2.51
2.23
2.27
2.37
2.34
-0.0
2D
enm
ark
0.30
0.36
0.35
0.37
0.02
0.38
0.36
0.35
0.38
0.37
0.00
0.40
0.38
0.37
0.41
0.39
0.02
Oth
er W
este
rn E
urop
e0.
430.
410.
400.
430.
030.
440.
430.
440.
440.
440.
010.
460.
450.
460.
460.
460.
02W
este
rn E
uro
pe
6.63
6.74
6.70
6.63
-0.0
66.
756.
206.
206.
496.
41-0
.23
6.80
6.25
6.25
6.54
6.46
0.05
Aus
tral
ia0.
590.
770.
710.
700.
000.
620.
600.
650.
650.
63-0
.07
0.61
0.59
0.64
0.64
0.62
-0.0
1O
ther
Pac
ific
0.07
0.06
0.06
0.05
-0.0
10.
050.
050.
050.
050.
050.
000.
050.
050.
050.
050.
050.
00O
EC
D P
acif
ic0.
660.
830.
770.
76-0
.01
0.67
0.65
0.70
0.71
0.68
-0.0
80.
660.
640.
690.
700.
67-0
.01
To
tal O
EC
D*
21.3
421
.82
21.8
221
.90
0.08
22.1
721
.40
21.6
821
.86
21.7
7-0
.13
22.3
221
.56
21.8
422
.02
21.9
30.
16B
rune
i0.
180.
190.
200.
200.
010.
200.
210.
210.
210.
210.
010.
200.
210.
210.
210.
210.
00In
dia
0.75
0.74
0.73
0.75
0.01
0.75
0.72
0.74
0.74
0.74
-0.0
10.
750.
720.
740.
740.
740.
00M
alay
sia
0.70
0.69
0.68
0.71
0.03
0.74
0.77
0.78
0.76
0.76
0.05
0.76
0.79
0.80
0.77
0.78
0.02
Vie
tnam
0.26
0.31
0.34
0.34
0.00
0.36
0.36
0.33
0.35
0.35
0.01
0.36
0.36
0.33
0.35
0.35
0.00
Asi
a ot
hers
0.24
0.25
0.25
0.26
0.01
0.31
0.29
0.29
0.29
0.30
0.03
0.33
0.31
0.31
0.31
0.32
0.02
Oth
er A
sia
2.13
2.18
2.20
2.27
0.07
2.37
2.35
2.35
2.35
2.35
0.09
2.41
2.39
2.39
2.39
2.39
0.04
Arg
entin
a0.
840.
800.
820.
80-0
.02
0.78
0.78
0.78
0.78
0.78
-0.0
20.
780.
780.
780.
780.
780.
00B
razi
l1.
361.
491.
561.
720.
161.
761.
721.
781.
771.
750.
041.
761.
721.
781.
771.
750.
00C
olom
bia
0.82
0.70
0.61
0.58
-0.0
30.
550.
550.
560.
560.
56-0
.03
0.63
0.62
0.64
0.64
0.64
0.08
Ecu
ador
0.38
0.40
0.41
0.40
-0.0
10.
390.
350.
400.
400.
39-0
.01
0.38
0.34
0.39
0.39
0.38
-0.0
1T
rinid
ad &
Tob
ago
0.14
0.14
0.13
0.15
0.02
0.15
0.17
0.17
0.18
0.17
0.01
0.19
0.21
0.21
0.23
0.21
0.04
L. A
mer
ica
othe
rs0.
220.
220.
230.
22-0
.01
0.22
0.22
0.21
0.21
0.21
-0.0
10.
230.
230.
220.
220.
220.
01L
atin
Am
eric
a3.
763.
753.
763.
870.
113.
853.
783.
903.
913.
86-0
.01
3.96
3.90
4.03
4.03
3.98
0.12
Bah
rain
0.19
0.19
0.19
0.19
0.00
0.19
0.19
0.19
0.19
0.19
-0.0
10.
190.
190.
190.
190.
190.
00O
man
0.91
0.95
0.95
0.90
-0.0
50.
850.
830.
810.
810.
83-0
.08
0.83
0.83
0.83
0.83
0.83
0.00
Syr
ia0.
550.
520.
520.
51-0
.01
0.55
0.54
0.53
0.55
0.54
0.03
0.55
0.54
0.53
0.55
0.54
0.00
Yem
en0.
420.
450.
470.
46-0
.01
0.46
0.46
0.47
0.47
0.46
0.00
0.44
0.44
0.44
0.45
0.44
-0.0
2M
idd
le E
ast
2.06
2.12
2.12
2.06
-0.0
62.
052.
021.
992.
012.
02-0
.05
2.00
2.00
1.99
2.01
2.00
-0.0
2A
ngol
a0.
760.
750.
740.
890.
150.
830.
880.
900.
910.
88-0
.01
0.93
0.98
1.00
1.02
0.98
0.10
Cha
d0.
000.
000.
000.
000.
000.
000.
000.
050.
220.
070.
070.
220.
220.
230.
230.
230.
16C
ongo
0.27
0.27
0.27
0.25
-0.0
10.
240.
240.
240.
240.
24-0
.01
0.24
0.24
0.24
0.24
0.24
0.00
Equ
ator
ial
Gui
nea
0.09
0.11
0.14
0.20
0.06
0.20
0.19
0.23
0.24
0.22
0.02
0.25
0.24
0.29
0.30
0.27
0.05
Egy
pt0.
830.
800.
760.
75-0
.01
0.76
0.76
0.74
0.75
0.75
0.00
0.76
0.76
0.74
0.75
0.75
0.00
Gab
on0.
360.
340.
310.
30-0
.01
0.25
0.25
0.25
0.24
0.25
-0.0
60.
250.
250.
250.
240.
250.
00S
outh
Afr
ica
0.17
0.18
0.18
0.19
0.01
0.19
0.19
0.20
0.20
0.20
0.01
0.21
0.21
0.22
0.22
0.22
0.02
Sud
an0.
060.
180.
210.
240.
030.
250.
250.
280.
280.
270.
030.
270.
270.
300.
310.
290.
02A
fric
a ot
her
0.23
0.22
0.20
0.20
0.00
0.19
0.20
0.20
0.18
0.19
0.00
0.19
0.20
0.20
0.18
0.19
0.00
Afr
ica
2.78
2.84
2.80
3.03
0.23
2.92
2.96
3.09
3.28
3.06
0.04
3.32
3.36
3.47
3.48
3.41
0.35
To
tal D
Cs
10.7
310
.89
10.8
811
.23
0.35
11.1
811
.10
11.3
411
.55
11.2
90.
0611
.70
11.6
411
.87
11.9
011
.78
0.48
FSU
7.47
7.91
8.53
9.33
0.81
9.88
10.0
910
.42
10.4
110
.20
0.87
10.4
710
.70
11.0
411
.03
10.8
10.
61R
ussi
a6.
146.
496.
997.
630.
648.
108.
318.
658.
648.
430.
808.
598.
819.
179.
178.
940.
51K
azak
hsta
n0.
610.
710.
790.
940.
151.
011.
020.
991.
001.
010.
071.
111.
121.
091.
101.
110.
10A
zerb
aija
n0.
280.
270.
300.
320.
020.
320.
310.
320.
340.
320.
000.
320.
310.
320.
340.
320.
00F
SU
Oth
ers
0.44
0.44
0.44
0.45
0.01
0.45
0.46
0.46
0.43
0.45
0.00
0.45
0.46
0.46
0.43
0.45
0.00
Oth
er E
uro
pe
0.18
0.18
0.18
0.18
-0.0
10.
170.
170.
170.
170.
170.
000.
170.
170.
170.
170.
170.
00C
hin
a3.
213.
233.
303.
390.
103.
403.
443.
383.
393.
400.
013.
383.
423.
363.
373.
38-0
.02
No
n-O
PE
C p
rod
uct
ion
42.9
344
.03
44.7
146
.03
1.33
46.8
146
.21
46.9
847
.38
46.8
50.
8148
.05
47.4
948
.28
48.5
048
.08
1.23
Pro
cess
ing
gain
s1.
581.
651.
691.
730.
041.
811.
771.
791.
821.
790.
061.
821.
771.
801.
831.
800.
01N
on
-OP
EC
su
pp
ly44
.51
45.6
846
.40
47.7
61.
3748
.61
47.9
748
.77
49.2
048
.64
0.88
49.8
649
.27
50.0
850
.33
49.8
91.
24O
PE
C N
GL
3.02
3.18
3.40
3.42
0.01
3.34
3.43
3.49
3.49
3.44
0.03
3.34
3.43
3.49
3.49
3.44
0.00
Non
-con
vent
iona
l oils
0.15
0.17
0.18
0.20
0.02
0.10
0.15
0.15
0.15
0.14
-0.0
60.
290.
420.
420.
420.
390.
25O
PE
C N
GL
s +
no
n-c
on
ven
tio
nal
oils
3.16
3.34
3.58
3.62
0.03
3.44
3.59
3.64
3.64
3.58
-0.0
43.
623.
863.
923.
923.
830.
25
To
tal N
on
-OP
EC
an
d O
PE
C N
GL
s47
.67
49.0
249
.98
51.3
81.
4052
.05
51.5
652
.42
52.8
452
.22
0.84
53.4
953
.12
53.9
954
.25
53.7
11.
49
Not
e:
Tot
als
may
not
add
up
due
to in
depe
nden
t ro
undi
ng.
* F
orm
er E
ast G
erm
any
is in
clud
ed in
the
OE
CD
.
Ta
ble
26
No
n-O
PE
C s
up
ply
an
d O
PE
C n
atu
ral g
as li
qu
ids
mb/
d
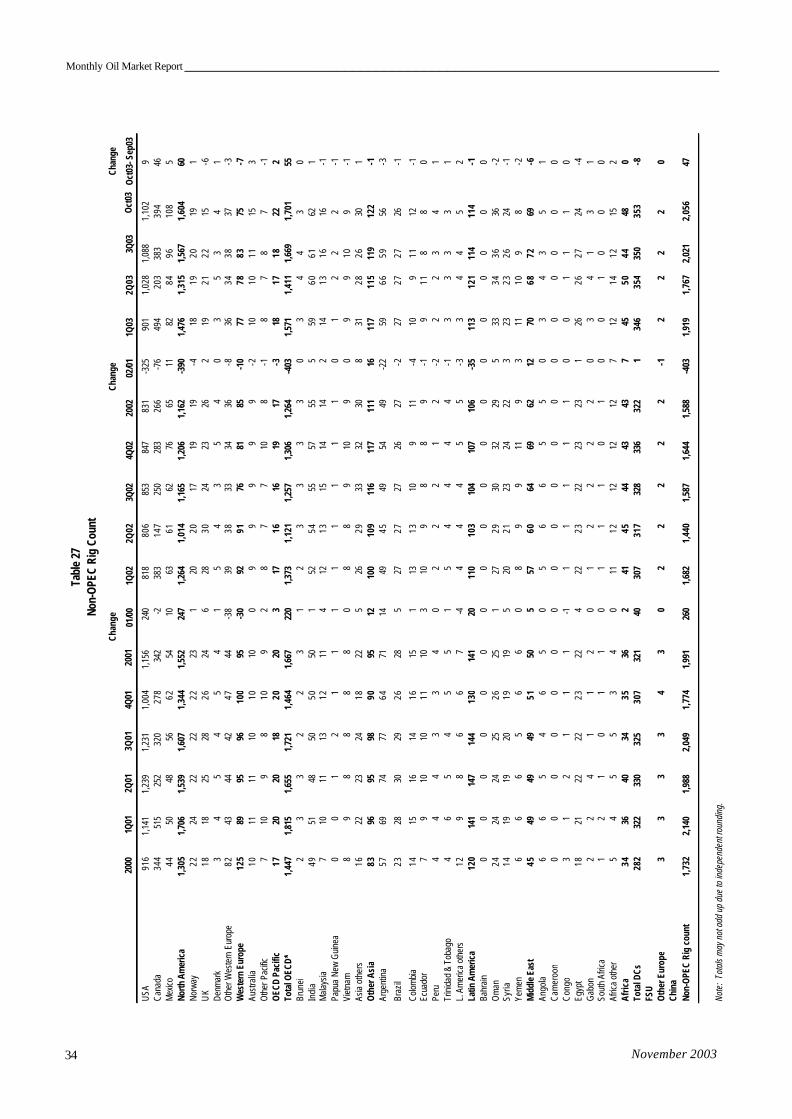
Monthly Oil Market Report ___________________________________________________________________
November 2003 34
Chan
geCh
ange
Chan
ge
2000
1Q01
2Q01
3Q01
4Q01
2001
01/
00 1
Q02
2Q
02 3
Q02
4Q
0220
0202
/01
1Q03
2Q03
3Q03
Oct
03 O
ct03
- Sep
03
USA
916
1,14
11,
239
1,23
11,
004
1,15
624
081
880
685
384
783
1-3
2590
11,
028
1,08
81,
102
9Ca
nada
344
515
252
320
278
342
-238
314
725
028
326
6-7
649
420
338
339
446
Mex
ico44
5048
5662
5410
6361
6276
6511
8284
9610
85
North
Am
eric
a1,
305
1,70
61,
539
1,60
71,
344
1,55
224
71,
264
1,01
41,
165
1,20
61,
162
-390
1,47
61,
315
1,56
71,
604
60No
rway
2224
2222
2223
120
2017
1919
-418
1920
191
UK
1818
2528
2624
628
3024
2326
219
2122
15-6
Denm
ark
34
54
54
15
43
54
03
53
41
Oth
er W
este
rn E
urop
e82
4344
4247
44-3
839
3833
3436
-836
3438
37-3
Wes
tern
Eur
ope
125
8995
9610
095
-30
9291
7681
85-1
077
7883
75-7
Aust
ralia
1011
1110
1010
09
99
99
-210
1011
153
Oth
er P
acific
710
98
109
28
77
108
-18
78
7-1
OEC
D Pa
cific
1720
2018
2020
317
1616
1917
-318
1718
222
Tota
l OEC
D*1,
447
1,81
51,
655
1,72
11,
464
1,66
722
01,
373
1,12
11,
257
1,30
61,
264
-403
1,57
11,
411
1,66
91,
701
55Br
unei
23
32
23
12
33
33
03
44
30
Indi
a49
5148
5050
501
5254
5557
555
5960
6162
1M
alay
sia7
1011
1312
114
1213
1514
142
1413
1616
-1Pa
pua
New
Gui
nea
00
12
11
11
11
11
01
22
2-1
Viet
nam
89
88
88
08
89
109
09
910
9-1
Asia
oth
ers
1622
2324
1822
526
2933
3230
831
2826
301
Oth
er A
sia
8396
9598
9095
1210
010
911
611
711
116
117
115
119
122
-1Ar
gent
ina
5769
7477
6471
1449
4549
5449
-22
5966
5956
-3
Braz
il23
2830
2926
285
2727
2726
27-2
2727
2726
-1
Colo
mbi
a14
1516
1416
151
1313
109
11-4
109
1112
-1Ec
uado
r7
910
1011
103
109
88
9-1
911
88
0Pe
ru4
44
33
40
22
21
2-2
22
34
1Tr
inid
ad &
Tob
ago
46
54
55
15
44
44
-13
33
31
L. A
mer
ica o
ther
s12
98
66
7-4
44
45
5-3
34
45
2La
tin A
mer
ica
120
141
147
144
130
141
2011
010
310
410
710
6-3
511
312
111
411
4-1
Bahr
ain
00
00
00
00
00
00
00
00
00
Om
an24
2424
2526
251
2729
3032
295
3334
3636
-2Sy
ria14
1919
2019
195
2021
2324
223
2323
2624
-1Ye
men
66
65
66
08
99
119
311
109
8-2
Mid
dle
East
4549
4949
5150
557
6064
6962
1270
6872
69-6
Ango
la6
65
46
50
56
65
50
34
35
1Ca
mer
oon
00
00
00
00
00
00
00
00
00
Con
go3
12
11
1-1
11
11
10
01
11
0Eg
ypt
1821
2222
2322
422
2322
2323
126
2627
24-4
Gab
on2
24
11
20
12
22
20
34
13
1So
uth
Afric
a1
21
01
10
11
10
10
01
00
0Af
rica
othe
r5
45
53
40
1112
1212
127
1214
1215
2Af
rica
3436
4034
3536
241
4544
4343
745
5044
480
Tota
l DCs
282
322
330
325
307
321
4030
731
732
833
632
21
346
354
350
353
-8FS
UO
ther
Eur
ope
33
33
43
02
22
22
-12
22
20
Chin
aNo
n-O
PEC
Rig
coun
t1,
732
2,14
01,
988
2,04
91,
774
1,99
126
01,
682
1,44
01,
587
1,64
41,
588
-403
1,91
91,
767
2,02
12,
056
47
Note
: To
tals
may
not
add
up
due
to in
depe
nden
t rou
ndin
g.
Tabl
e 27
Non-
OPE
C Ri
g Co
unt
____________________________________________________________________Monthly Oil Market Report
November 2003 35
Main Contributors to Monthly Oil Market Report
WORLD ECONOMY Mr. M. Behzad e-mail: [email protected]
Mr. S. Keramati
e-mail: [email protected] Mr. G. Skipper
e-mail: [email protected] CRUDE OIL PRICES Mr. O. Salas
e-mail: [email protected] Mr. F. Al Nassar
e-mail: [email protected] PRODUCTS AND REFINERY OPERATIONS
Mr. H. Eldarsi e-mail: [email protected]
THE TANKER MARKET Mr. J. Bahelil
e-mail: [email protected] WORLD OIL DEMAND Dr. M.R. Jazayeri
e-mail: [email protected] WORLD OIL SUPPLY Mr. Z. Mohammad
e-mail: [email protected] STOCK MOVEMENTS Dr. A. Yahyai
e-mail: [email protected] COORDINATORS Mr. M. Alipour-Jeddi Head, Petroleum Market Analysis Dept. e-mail: [email protected] Dr. A. Yahyai e-mail: [email protected]
Data is provided by Data Services Department. Editorial service is rendered by Public Relations & Information Department.
Unless separately credited, material may be reproduced without permission, but kindly mention OPEC as source
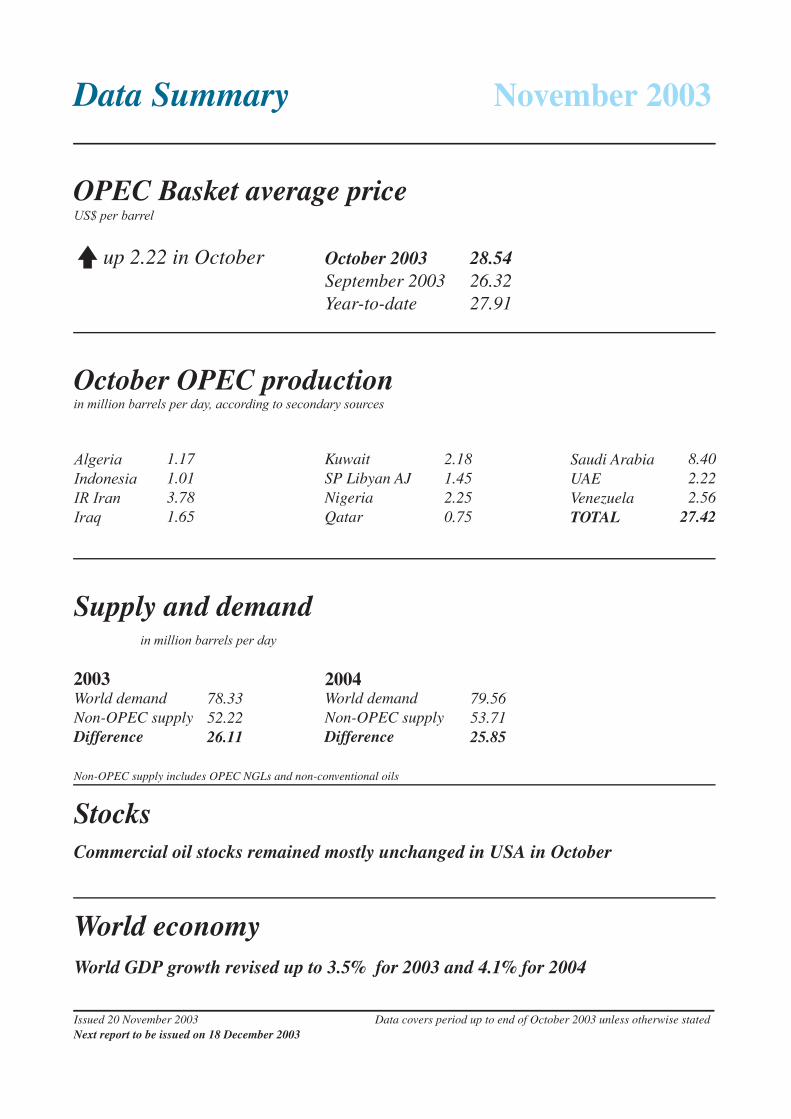
OPEC Basket average price
October OPEC production
US$ per barrel
in million barrels per day, according to secondary sources
Supply and demandin million barrels per day
Stocks
World economy
up 2.22 in October October 2003September 2003Year-to-date
28.5426.3227.91
AlgeriaIndonesiaIR IranIraq
KuwaitSP Libyan AJNigeriaQatar
Saudi ArabiaUAEVenezuelaTOTAL
1.171.013.781.65
2.181.452.250.75
8.402.222.56
27.42
World demandNon-OPEC supplyDifference
78.3352.2226.11
World demandNon-OPEC supplyDifference
79.5653.7125.85
Commercial oil stocks remained mostly unchanged in USA in October
World GDP growth revised up to 3.5% for 2003 and 4.1% for 2004
Issued 20 November 2003 Data covers period up to end of October 2003 unless otherwise stated
November 2003
2003 2004
Non-OPEC supply includes OPEC NGLs and non-conventional oils
Data Summary
Next report to be issued on 18 December 2003