Embed Size (px)
Citation preview

2020ANNUAL REPORT
oO
H!M
EDIA
AN
NU
AL REPO
RT 2020

The Annual Report was authorised for issue, in accordance with a resolution of the Directors. The Directors have the power to amend and reissue the Annual Report. Through the use of the internet, we have ensured that our corporate reporting is timely, complete and available globally at minimum cost to the Company. All media releases, financial reports and other information are available at the Investors section on our website: ww w.oohmedia. com.au.
2 COMPANY OVERVIEW
4 2020 SUMMARY
6 CHAIR REVIEW
8 CEO REVIEW
11 OPERATING AND FINANCIAL REVIEW
18 BOARD OF DIRECTORS
21 DIRECTORS’ REPORT
31 REMUNERATION REPORT
49 SUSTAINABILITY REPORT
65 FINANCIAL STATEMENTS
112 DIRECTORS’ DECLARATION
113 INDEPENDENT AUDITOR’S REPORT
119 SHAREHOLDER INFORMATION
122 GLOSSARY
124 CORPORATE DIRECTORY
CONTENTS
3

01 1

COMPANY OVERVIEWoOh!media is a leading Out of Home media company that is enhancing public spaces through the creation of engaging environments that help advertisers, landlords, leaseholders, community organisations, local councils and governments reach large and diverse public audiences.
The company’s extensive network of more than 37,000 digital and static asset locations includes roadsides, retail centres, airports, train stations, bus stops, office towers, cafes, bars and universities.
Listed on the ASX, oOh! employs around 800 people across Australia and New Zealand, and had revenues of $426.5 million in 2020 and $649 million in 2019.
The company invests strategically in technology, and is pioneering the use of sophisticated data techniques that enable clients to maximise their media spend through unrivalled and accurate audience targeting. oOh! also owns digital publisher Junkee Media and printing business Cactus.
Find out more at oohmedia.com.au
BILLBOARDS
Billboards deliver impact, dominance and scale across 3,850 classic and digital sites in all metro and regional markets, including the most sought after sites in the country. Billboards are the original Unmissable format for building brands, launching products, call to actions, directional and informative messaging, path to purchase and proximity.
FLY
Fly spans 16 cities, 20 terminals, 16 Qantas Lounges and Qantas Inflight Entertainment. With a combination of digital, static, video pre-rolls, WIFI and activations, Fly engages affluent business professionals on their end to end journeys throughout all major Australian airports.
VENUE
Venue is the original social network, with 220 national metro venues where screens are positioned behind, above or next to the bar area showcasing entertaining Bite TV content. A place where Australians gather to eat, drink and socialise, allowing brands to connect with a relaxed and receptive audience.
STREET
Street Furniture provides advertising on bus shelters and roadside locations Australia-wide. With 12,700 classic poster-format sites, and over 400 digital sites, Street Furniture has the flexibility and scale to provide precision targeting to the right audience at the right location during their daily journeys.
RAIL
Rail connects with 14.5 million commuter journeys each week in 41 CBD and inner city stations in Sydney and Melbourne, across the largest digital rail offering in Australia. With full digital animation across portrait, large format and WOW walls, as well as station domination and experiential opportunities, Rail ensures brands connect with professional affluent commuters on their daily journeys.
STUDY
Study is the most powerful and simplest way to connect and engage with students across Australia at scale. With over 100 Uni and TAFE campuses, Study reaches over 1.2 million students with 220 digital screens and 120 static panels located in student hubs on campus.
RETAIL
Retail is the largest retail advertising network in Australia with multi formats in over 500+ shopping centres, reaching 12 million unique shoppers each month. Including local, medium and large shopping centre types, with 2.2 billion shopper visits each year equating to over $82 billion in spend, Retail can reach a breadth of shoppers that no-one else can.
OFFICE
Office has over 3,500 digital advertising displays in over 640 prominent Australian office towers, which house 4,900 different organisations. Office reaches 3 million professionals, enabling brands to target CBD professionals while they are at work.
CAFÉ
Café is Australia’s only digital café media portfolio, connecting with over 800,000 of the metro workforce during their daily routine and ‘me time’. Available in over 400 Australian city and urban cafés, brands are able to connect with café audiences through digital displays, brand experiences, branded coffee cups, mobile activations and Wi-Fi products.
2

3

2020 SUMMARYFINANCIAL SUMMARY
The COVID-19 pandemic and government containment responses adversely impacted Out of Home disproportionately compared to other media.
While conditions remain uncertain, the Company finished 2020 with a strong audience recovery in its key formats of road, retail and street furniture in Australia and New Zealand, and in a strong financial position with net debt reduced by $243 million on the prior year.
GROUP FINANCIAL RESULTS – Pre-adoption of AASB16
1. Underlying results exclude the impact of integration related expenses and non-cash impairment expenses in the current year, and acquisition and integration expenses in the prior year. Underlying EBITDA is disclosed in Note 4 ‘Segment information’ of the Annual Report. Refer to the same Note 4 for a reconciliation between information on reportable segments to IFRS measures. Underlying also excludes the impact of AASB16
REVENUE
NET DEBT
GROSS PROFIT
LEVERAGE RATIO
UNDERLYING1 EBITDA
NPAT
$426.5MILLION
$111.2MILLION
$180.2MILLION
1.8TIMES
$63.2MILLION
($23.9)MILLION
34%
69% FROM 2.6 TIMES 188%
36% 55%^ ^ ^
^ ^
4

OPERATIONAL HIGHLIGHTS
Notwithstanding the challenges of 2020, oOh! continued to implement its strategy to deliver the most diverse and integrated Out of Home network to connect audiences to advertisers. We continue to deliver ground-breaking and innovative campaigns for clients across our network in Australia/New Zealand.
INCREASED MARKET SHARE
oOh! increased market share by refining its offer to advertisers through leveraging the strength of our suburban and regional network. The business continued to invest in key assets through the cyclical audience and advertising revenue challenge created by COVID-19. The Company is confident in the long term growth of our industry as audiences recover from the pandemic impact.
BALANCED, DIVERSE AND LONG TERM LEASE MATURITY PROFILE
oOh! continues to maintain a balanced and diverse lease maturity profile with nearly 60 per cent of pre COVID-19 2019 revenue by concession attached to contracts that expire beyond 2023. During CY2020, oOh! continued to implement its strategy of building the most diverse portfolio backed by data-led innovation in the Out of Home industry.
UPGRADES TO KEY DIGITAL SITES
oOh! continued to develop key sites to protect market share, including two new Signature Series digital signs; “The King” outside Sydney Airport and a large format digital sign on Military Road in Mosman.
The sites are highly desirable, in-demand assets for premium, well-known brands and advertisers seeking unrivalled impact and deeper engagement for their brands.
GROUND-BREAKING CAMPAIGNS
In CY20 oOh! continued to deliver ground-breaking and award-winning campaigns for clients, across multiple formats demonstrating the diversity, reach and effectiveness of the oOh! portfolio.
5

Our strategy remains focused on capitalising on the positive key structural drivers of growth in Out of Home and leveraging our diverse product portfolio, backed by data, to deliver results for advertisers and to create value for our shareholders.
As a result of these initiatives, oOh! successfully addressed the myriad challenges faced over the past year. Our continued focus is to ensure the strength of the business is maintained in the short term while preserving our assets and resources to ensure revenue and earnings recovery as audiences return to our advertising environments.
OVERVIEW OF FINANCIAL RESULTS
In a very challenging market due to the pandemic, total revenue in CY20 decreased by 34% to $426.5 million. As people movement restrictions were relaxed in the third quarter, revenue in the key formats of Road, Retail, Street Furniture and New Zealand started to recover. However, the Fly, Rail and Office formats remained impacted by travel and working restrictions.
The 34% decline in revenue resulted in a gross profit of $180.2 million, which was down 36% on the prior year. This decline reflects the significantly lower revenue, only partially offset by fixed rent relief negotiated with our commercial partners and lower variable rent during the period.
INTRODUCTION
2020 was in many ways an unprecedented and very challenging year. COVID-19 had a major impact on advertising spend and the Out of Home sector was impacted more heavily than other forms of media, given the significant audience decline as a direct result of restrictions on the movement of people caused by the pandemic.
In response, our priority was to ensure the Company’s balance sheet position remained sufficiently robust to manage through the short term volatility whilst supporting our strong competitive position for the medium term.
At the same time, we focused on reducing the Company’s costs to adjust to the significantly reduced revenue environment with a specific emphasis on negotiating rent relief from our commercial partners and swiftly and significantly reducing the Company’s capital and operating expenditure for 2020. Government assistance in the form of JobKeeper in Australia and Wage Subsidy in New Zealand also assisted the Company manage the COVID-19 impact on our revenue for the year.
Underlying EBITDA (pre AASB16) declined by 55% to $63.2 million.
The Net Loss After Tax (pre AASB16) was $23.9 million compared to a Net Profit After Tax (pre AASB16) for the prior year of $27.2 million.
On a reported basis, (including the adoption of AASB16), Net Loss After Tax was $35.7 million.
A detailed explanation of the financial results is contained within the Operating and Financial Review.
CAPITAL MANAGEMENT
Given the significant uncertainty caused by the onset of COVID-19, we responded quickly to ensure the Company was equipped to manage through the short term volatility whilst remaining in a strong competitive position for the medium term.
The Board took the prudent decision to strengthen the Company’s balance sheet with a $167 million equity raising in March 2020. The raising comprised both an institutional and a retail entitlement offer to raise $128 million, together with an institutional placement to raise $39 million.
CHAIR REVIEW
6

Our priority in undertaking this raising was to protect the rights of our existing shareholders to the fullest extent possible with 91% of the institutional entitlement offer subscribed to by existing shareholders.
In March, oOh! amended the debt arrangements with our lending syndicate to increase the gearing covenant, while in December we extended our debt facilities with existing bank syndicate members of $350 million to December 2023. At 31 December 2020, net debt was $111.2 million reduced from $354.5 million at the start of 2020.
The Company’s gearing ratio (Net Debt/Underlying EBITDA) as at 31 December 2020 was 1.8 times, compared to the bank covenant level of 4 times (reducing to 3.25 times by September 2021).
As announced at the time of the equity raising, the Board has temporarily suspended dividends. As a result, no dividends were payable for CY20. The Board will revisit this intent in future periods based on the prevailing market conditions and with consent of our lenders.
APPOINTMENT OF NEW MANAGING DIRECTOR AND CEO
In January 2020, Brendon Cook indicated his intention to step down as Managing Director & CEO and from the Board during 2020. Brendon founded oOh! in 1989 and he has been an innovator and passionate industry leader for the past 30 years.
We are delighted that he has agreed to remain with oOh! in a non-executive consulting role, which means the company continues to benefit from his unparalleled knowledge and industry insights. On behalf of the company, I want to personally thank Brendon for his enormous commitment and dedication to building and leading our business for the past 30 years.
We were very pleased to welcome Cathy O’Connor as oOh!’s new Managing Director and Chief Executive Officer in January 2021.
Cathy brings extensive experience from her 35 years working for Australian media organisations, including the last 12 years as CEO of Nova Entertainment Group and five years prior to that as Managing Director of DMG Radio. Cathy is recognised as one of the most influential leaders in Australian media.
Her outstanding qualities, including her proven success in steering media sales organisations leading their strategy and driving organic growth initiatives, even in the most challenging of environments, will be of enormous benefit to oOh!.
BOARD APPOINTMENTS
The Board continues its focus on ensuring we have the requisite skills and experience to assist management in driving the company’s strategy. Two new appointments were made during the year.
Mick Hellman joined the Board as a Non-executive Director in April 2020. He is Founder and Managing Partner of investment management company, HMI Capital which is the largest shareholder in oOh! and a long-time supporter of the Company, having first entered the share register in March 2017.
Mick brings significant international investment experience to the Board, including investments in several Out of Home companies.
Andrew Stevens joined the Board as an independent Non-executive Director in September 2020.
Andrew has extensive experience in technology and consulting, including as Managing Director of IBM Australia and New Zealand from 2011 to 2014 and previously several consulting roles at
PwC, before being appointed Managing Partner of PwC Consulting across Asia Pacific.
SUMMARY
In a very difficult year, I am immensely proud of, and grateful for, the way our people across the organisation have addressed these challenges.
We have had to make some hard decisions, including asking our staff (including the Board) to agree to work a 4-day week for three months and implementing changes to our organisational structure.
I want to acknowledge and thank our people at oOh! for their focus and dedication in a challenging year.
Out of Home was the most impacted media segment during the COVID-19 period from March to September however, we have seen audiences returning, particularly in our key formats of Road, Retail and Street Furniture towards the end of 2020.
While the market remains uncertain, as the market leader in Out of Home across Australia and New Zealand, oOh! remains well positioned to leverage the ongoing recovery in audience growth and advertiser sentiment.
Our strategy remains focused on capitalising on the positive key structural drivers of growth in Out of Home and leveraging our diverse product portfolio, backed by data, to deliver results for advertisers and to create value for our shareholders.
Tony Faure Chair
7

OUR PEOPLE AT OOH!While oOh! is the market leader across Australia/NZ with the market’s most diverse and scalable platform, it is the people across the business that continue to be our greatest asset.
In my early days as CEO, I have been greatly impressed by the experience and calibre and also the resilience of our staff in delivering results for advertisers. This was never more evident than during 2020 in managing through the COVID-19 pandemic. The market was changing very rapidly throughout the year and our people across Australia/New Zealand have responded admirably to these challenges.
RESPONSE TO COVID-19oOh! implemented a decisive and rapid company-wide response to COVID-19 to ensure the ongoing sustainability of our business.
Our primary focus remains on the health and safety of our people, including the provision of appropriate mental health support where needed.
We continue to adjust our operations as required consistent with all relevant Government and regulatory requirements.
During 2020 our efforts to strengthen the Company’s balance sheet and reduce our capital and operational spend ensured oOh! has been able to manage the short term volatility associated with the pandemic, while preserving strategic growth opportunities as markets recover.
The specific initiatives we implemented in this regard included a $167 million equity raising, refinancing of finance facilities, negotiation with property partners to deliver $68 million in temporary gross fixed rent savings, capital expenditure reduction of $49 million compared to previous guidance, and operational cost savings of $16 million (excluding Job Keeper).
Our focus has also been on adapting and refining our offer to advertisers, leveraging the strength of our network and investing in our key assets.
In the midst of the pandemic we have continued to deliver ground-breaking and award-winning campaigns for clients including Re:act road safety; National Gallery powered by Google Lens; and Doritos Food Truck Classics.
We continue to adapt our business to the latest developments with the pandemic. While short term volatility will continue, including localised Government lockdown measures, the Company is in a strong position to continue to address these challenges and will emerge from the pandemic well placed to leverage the expected growth in the Out of Home segment.
OUT OF HOME AUDIENCES RETURNING – OOH! WELL PLACED TO CAPITALISEDuring 2020 the advertising market was significantly challenged with the broader media market declining by 15%, according to SMI data. The OOH segment was dis-proportionately impacted by people movement restrictions, with an overall decline of 39% as measured by OMA data.
However, the Company experienced a strong recovery in revenue across key formats in the final quarter of 2020 which has continued into 2021 as people movement restrictions have eased. Overall Q4 paced at 70% of Q4 2019 compared to 57% in Q3. This has been most pronounced in Road, Retail, Street Furniture and New Zealand. Q4CY20 revenue in Retail and NZ was over 90% of the prior corresponding quarter (Q4CY19). The recovery has continued into 2021 with total revenue for January 2021 pacing at 80% of January 2019 levels. Road, Retail, Street Furniture and NZ revenue levels
This is my first review as CEO & Managing Director of oOh!. I am privileged to serve in this position and also excited by the opportunity that lies ahead for the Company.
I want to acknowledge the significant contribution of Brendon Cook as founder and CEO of oOh! for the past 30 years. Brendon was a true pioneer of the Out of Home (OOH) industry and I look forward to building on the strong platform that Brendon and the team have created for the next phase of oOh!’s growth.
CEO’S REVIEW
We are well placed to leverage the improvement in market conditions and audience growth with the most comprehensive network of assets across Australia/NZ and the most insightful data to help advertisers reach desired audiences.
8
messaging by leveraging our nation-wide network of inventory across Australia/NZ.
We also continued to support range of community and charitable organisations.
Further details of oOh!’s charitable and community support initiatives are contained within our Sustainability Report.
SUMMARYDuring 2020 oOh! demonstrated the adaptability and flexibility of the business to address the unprecedented challenges caused by COVID-19.
This is a testament to our people and also the strong relationships oOh! maintains with all its stakeholders, including banks, commercial partners and various governments and of course, our shareholders.
We remain grateful for your ongoing support.
We are well placed to leverage the improvement in market conditions and audience growth with the most comprehensive network of assets across Australia/NZ and the most insightful data to help advertisers reach desired audiences.
I am excited by this opportunity and sharing our progress with shareholders.
Cathy O’Connor Managing Director and CEO
Following the strong focus on capital management initiatives, net debt at 31 December 2020 was $111.2 million; a reduction of $243 million from the prior year.
Further detail on the Company’s financial results are contained within the Operating and Financial Review.
SUSTAINABILITYoOh! remains committed to operating as a sustainable business. Our focus in 2020 was the health and safety of our people to enable working from home, mental health and other initiatives to ensure our people have been supported through the pandemic and can continue to deliver for our clients.
We take our responsibility for public messaging seriously and this was particularly important during the pandemic in conveying important health updates and advice to the public. oOh! was able to play a central role in dissemination of important public
for January 2021 were at close to 100% of January 2019 revenue levels.
As anticipated, the Airport, Rail and Office audience environments continue to be impacted from continued restrictions on travel.
FINANCIAL RESULTS SUMMARYTotal revenue in CY20 decreased by 34% to $426.5 million, impacted by people movement restrictions which caused an immediate and steep decline in revenue in the second and third quarters.
Underlying EBITDA (pre AASB16) declined by 55% to $63.2 million, reflecting the decline in revenue, only partially mitigated by the significant reduction in costs across the business.
Underlying NPATA (pre AASB16) was a loss of $8.0 million.
On a reported basis (which includes the adoption of AASB16), Net Loss After Tax was $35.7 million.
9

10

OPERATING AND FINANCIAL REVIEW 2020
Balance sheet resilience and enhanced financial liquidityThe Board took the decision to strengthen the Company’s balance sheet with a $167 million equity raising in March 2020. The raising comprised an institutional and retail entitlement offer to raise $128 million, together with an institutional placement to raise $39 million.
In March 2020, oOh! amended the debt arrangements with its lending syndicate to increase the gearing covenant from 3.5 times to 4.0 times Net Debt/Underlying EBITDA for calendar year 2020, reflecting ongoing support of the lending syndicate.
In December, the Company extended debt facilities with existing bank syndicate members of $350 million to December 2023.
As at 31 December 2020 net debt was $111 million, reduced from $355 million at the start of 2020. The Company’s gearing ratio (Net Debt/Underlying EBITDA) as at 31 December 2020 was 1.8 times. The banking covenants exclude non-cash earnings such as share based payments and factor into net debt supplier payments which are deferred by six months or more, and on this basis gearing was 1.5 times2, compared to the bank covenant level of 4.0 times3.
Fixed rent expense savingsThe Company had or negotiated rent abatement clauses contained within several of its lease contracts. Over the course of the year oOh! achieved gross fixed rent expense savings with its commercial partners of $68 million. These included a substitution to variable rent such that the net savings were $63 million. oOh! did not release any material sites during the period. oOh! remains grateful to those commercial property partners for agreeing to rent abatements where audiences and advertising dollars in the market were so heavily impacted.
Capital expenditure reductionThe Company reduced its capital expenditure significantly during the year, maintaining its disciplined focus on investment in its key sites including two signature digitals in the valuable Sydney market to protect market share, with investment in technology and systems and new offices. Gross capital expenditure reduced by $40 million for CY20 to $16 million. During the year oOh! divested non-core businesses, including gyms and health centre businesses and its 50% ownership in Edge in order to focus on core business units. Proceeds of these divestments were $1 million in CY20.
Operational expenditure savingsThe Company moved quickly to align its operating model to the prevailing revenue environment. Operating expenditure savings of $16 million were successfully achieved in CY20 (excluding Government Assistance payments). The principal components of operating cost reductions were labour savings and discretionary cost reduction. The Company made the difficult decision to request its staff to volunteer to work a 4-day week for a 3 month period (May – July). The vast majority of staff, including all Board and executive management, agreed to this measure, excluding those staff required for essential safety and operational services. Of these savings $10 million will carry forward into 2021 and beyond, as part of structural cost savings initiatives in 2H and early 2021.
Given the decline in the Company’s revenue, Government assistance was received in the form of JobKeeper in Australia and Wage Subsidy in New Zealand – totalling $21 million for the year.
oOh! confirms that Government Assistance payments are excluded from determination of any Short Term Incentive (STI) payments in relation to CY20. In addition, any STI payments for CY20 will be made in equity.
The resilience of oOh! staff in continuing to meet client requirements during COVID-19 was critical to achieving business outcomes in CY20. Notwithstanding the significant disruption caused by the pandemic, oOh! staff continued to execute campaigns for clients, leveraging the Company’s unique data and insights capability to deliver audience reach.
OVERVIEW – increased market share and strongly positioned to capitalise on improving audience and market conditions
From the start of Q2 2020, the COVID-19 pandemic and government containment responses adversely impacted Out of Home disproportionately compared to other media. oOh! responded early and decisively by strengthening its balance sheet, reducing costs and enhancing financing flexibility in response to these challenging and unprecedented conditions.
oOh! gained market share1, notwithstanding the challenging conditions, through refining its offer to advertisers by leveraging the strength of its suburban and regional network. The business continued to invest in key assets through the cyclical audience and advertising revenue challenge created by COVID-19. The Company is confident in the long-term growth of our industry as audiences recover from the pandemic impact.
While conditions remain uncertain, the Company finished 2020 with a strong audience recovery in its key formats of road, retail and street furniture in Australia and New Zealand, and in a strong financial position with net debt reduced by $243 million over 2020 and gearing at 1.8 times (Net Debt/Underlying EBITDA). The initiatives undertaken by the Company position it to capitalise on the structural growth opportunities that Out of Home presents as conditions improve when audiences return in 2021 and beyond.
DECISIVE AND DISCIPLINED RESPONSE TO COVID-19
oOh! implemented a series of initiatives which ensure the Company’s ability to respond to short term volatility and revenue decline while remaining positioned for medium to longer term sustainable growth. These included strengthening the balance sheet, negotiation of temporary fixed rent savings, capital expenditure reduction and operational expenditure savings.
1 oOh! revenues declined by 34% versus a 39% decline across the combined OMA and OMAA published Out of Home industry gross revenues for Australia and New Zealand respectively
2 Per the banking covenant calculations Net Debt at 31 December was $123m and EBITDA was $81m3 The gearing covenant reduces to 3.50 times in March 2021 and to 3.25 times at September 2021
11

SUMMARY OF SPECIFIC INITIATIVES4 IN CY20
Initiative As at 31 December 2020
Fixed rent expense savings for CY20 • $68 million achieved in temporary gross fixed rent savings, offset by $5 million in substituted variable rent resulting in a $63 million net saving
Capital expenditure reductions • CY20 Gross Capex reduced to $16 million from $56 million in the prior year. • The business continued to develop key sites to protect market share, including
two new Signature Series digitals – “The King” outside Sydney Airport and a large format digital sign in Mosman, NSW.
Operating expenditure savings for CY20 • $16 million in operational costs savings achieved (excluding JobKeeper)
Structural cost savings – beyond CY20 • $10 million operating cost savings
Government Wage subsidies (Australia/NZ) • oOh! received $21 million of JobKeeper subsidies in 2020
GROUP FINANCIAL RESULTS Basis of preparation The CY20 statutory results including the prior comparative results are reported in accordance with the leasing standard AASB16 in the attached financial statements. As outlined previously, the Company and most market analysts believe that presenting the accounts on a pre AASB16 basis provides a better indicator of performance as represented by the tables below.
A$m unless specifiedCY20
Pre AASB 16CY19
Pre AASB 16 Variance ($) Variance (%)
Revenue 5 426.5 649.6 (223.1) (34%)
Gross Profit 180.2 283.3 (103.2) (36%)
Gross Profit Margin (%) 42.2% 43.6% (1.4ppts) n/a
Total operating expenditure (117.0) (144.3) 27.3 19%
Underlying EBITDA 63.2 139.0 (75.8) (55%)
Underlying EBITDA Margin (%) 14.8% 21.4% (6.6ppts) n/a
Non-Operating Items (3.2) (13.7) 10.4 76%
EBITDA 59.9 125.3 (65.4) (52%)
Depreciation and Amortisation (65.7) (64.1) (1.6) (2%)
EBIT (5.7) 61.2 (67.0) (109%)
Net finance costs (21.6) (18.4) (3.2) (17%)
Profit (Loss) Before Tax (27.4) 42.9 (70.3) (164%)
Income Tax Expense 3.6 (15.7) 19.2 123%
Net Profit (Loss) After Tax (23.9) 27.2 (51.1) (188%)
Underlying NPATA (8.0) 52.4 (60.4) (115%)
EPS (cps)6 (4.8) 9.9 (14.7) (148%)
Full year Dividend fully franked (cps) – 11.0 (11.0) (100%)
OPERATING AND FINANCIAL REVIEW 2020CONTINUED
4 Cash saving initiatives totaling $65m announced during the capital raise in March 2020. Over $120m in savings achieved. 5 CY20 revenue in this table excludes $3.8m of Other Income from provisional compensation of resumed sites and proceeds from disposal of
gym and health assets. There were no other income items in CY19.6 CY19 EPS restated for bonus share issue component of March 2020 capital raise.
12

Pre adoption of AASB 16 vs statutory results for CY20
A$m unless specifiedCY20
Pre AASB 16CY20
Post AASB 16 Variance ($) Variance (%)
Revenue7 426.5 426.5 – –
Gross Profit 180.2 348.4 168.3 93%
Gross Profit Margin (%) 42.2% 81.7% 39.5ppts n/a
Total operating expenditure (117.0) (109.8) 7.2 6%
Underlying EBITDA 63.2 238.6 175.4 278%
Underlying EBITDA Margin (%) 14.8% 55.9% 41.1ppts n/a
Non-Operating Items (3.2) (0.3) 3.0 92%
EBITDA 59.9 238.3 178.4 298%
Depreciation and Amortisation (65.7) (223.8) (158.1) (241%)
EBIT (5.7) 14.6 20.3 354%
Net finance costs (21.6) (59.0) (37.3) (173%)
Profit (Loss) Before Tax (27.4) (44.4) (16.9) (62%)
Income Tax Expense 3.6 8.7 5.1 142%
Net Profit (Loss) After Tax (23.9) (35.7) (11.9) (50%)
Underlying NPATA (8.0) (19.9) (11.9) (148%)
EPS (cps) (4.8) (7.2) (2.6) (50%)
Full Year Dividend fully franked (cps) – – – –
RevenueIn a very challenging market due to the pandemic, total revenue in CY20 decreased by 34% to $426 million. In addition, there was $3 million of other income in relation to a provisional compensation payment on the Qantas Drive assets which were compulsorily acquired during the year. This matter is ongoing and the company is seeking further compensation. There was $1 million of additional other income from the sale of gym and health assets.
First quarter revenue in CY20 was steady on the prior corresponding quarter. However, the COVID-19 restrictions which started to be implemented from March 2020, both in Australia and New Zealand, caused an immediate and steep decline in revenue in the second quarter and into the third quarter.
In the fourth quarter, Out of Home audiences recovered strongly in the Australian Road, Retail and Street Furniture formats. As anticipated, the Airport, Rail and Office audience environments8 continued to be impacted in Q4.
According to SMI data – overall media revenue grew 5% in Q4 versus a September year to date decline of 23%
Overall, oOh!’s Q3 revenue was approximately 43% behind the prior corresponding period in aggregate and improved in Q4 to approximately 30% behind the strong CY19 Q4.
Q4 revenue was stronger in Australian Road, Retail, Bus Shelters and New Zealand (down by 14%) compared to a very strong Q4 in the prior corresponding period which saw share gains in Road and Street Furniture. Fly, Rail and Office continued to be impacted by people movement restrictions and declined in aggregate by 83% compared to the prior corresponding period in Q4. Audiences in these formats are only expected to return meaningfully during CY21 despite improving performance from December 2020.
7 CY20 post AASB16 revenue in this table excludes $6.8m of Other Income from provisional compensation of resumed sites, proceeds from disposal of gym and health assets, and gain on lease modification in CY20 recognised under AASB16.
8 Airports are included in Fly, Rail in Commute, and office towers in Locate as part of oOh!’s investor reporting. Locate also includes tertiary institutions, pubs and clubs which have been similarly impacted.
13

oOh! improved market share in both markets and remains the market leader across Australia/New Zealand with the scale and diversity across both markets to deliver audience reach and results for advertisers.
A$m unless specified CY20 CY19 Variance ($) Variance (%)
Commute 148.1 234.8 86.7 (37%)
Road 118.4 146.4 (28.0) (19%)
Retail 106.2 139.3 (33.1) (24%)
Fly 22.8 65.9 (43.1) (65%)
Locate 14.3 44.3 (30.0) (68%)
Other 16.7 18.9 (2.2) (12%)
Total 426.5 649.6 (223.1) (34%)
COMMUTE
Commute, representing the Company’s street furniture and rail assets, was impacted significantly by restrictions in people movement on public transport in Sydney and Melbourne as a result of COVID-19. In particular, the rail assets were impacted due to audiences avoiding rail networks, with revenue down by 82% in the second half, compared to revenue from the street furniture assets down 27% for the half. Overall Commute revenue declined by 37% on the prior year to $148 million.
ROAD
The Group’s Road (billboard) assets were the strongest key format performers in the portfolio. The Company continued to leverage its diversity and scale and strong suburban network to deliver results for advertisers. Revenue recovered in the second half to similar levels of the prior period as restrictions started to ease. Full year revenue declined by 19% to $118 million.
RETAIL
Retail revenue declined by 24% to $106 million. Performance was impacted by larger destination/Tier 1 shopping centres which were more impacted by movement restrictions. Retail had a strong recovery in Q4 to 90% of Q4 revenues in CY19 and exceeding CY19 revenues in the key December period.
FLY
As expected, the severe restrictions in air travel resulted in a significant impact in revenue for Fly which declined by 65% to $23 million. Excluded from trading revenue was $3 million of other income in relation to a provisional compensation payment in relation to the Qantas Drive assets which were compulsorily acquired during the year. oOh!’s airport assets are weighted more towards domestic travel which can be expected to recover more quickly than international travel when COVID-19 air travel restrictions are lifted. The key airport leases include inbuilt rent abatement mechanisms in relation to audience declines and will result in rent savings if there is a continuation in lower audiences into CY21.9
LOCATE
Locate revenue as expected was impacted by the closure of office buildings and employees working from home. Revenue declined by 68% to $14 million, noting that Locate predominantly has a variable rent profile. Excluded from trading revenue was $1 million of Other Income from the sale of gym and health assets.
Other revenue represents the contribution from Junkee Media and Cactus Imaging which fell by 12%.
OPERATING AND FINANCIAL REVIEW 2020CONTINUED
9 Airport lease contracts have variations in defining abatement inputs, calculation and length of application.
14

Balanced portfoliooOh!media continues to maintain a balanced and diverse lease maturity profile with nearly 60% of pre COVID-19 2019 revenue by concession attached to contracts that expire beyond 2023. Approximately 20% of the revenue base is either rolling or due for renewal in 2021.
The Company also remains at the forefront of digital and data-led innovation in the sector with continued digitisation of assets in premium locations across its network, as well as continued investment in its operating technology platforms. Digital revenue as a percentage of total revenue declined slightly to 57% from 60% last year as media revenue mix fell compared to non-media revenues.
Earnings The 34% decline in revenue translated to a pre-AASB16 gross profit of $180 million, which was down 36% on the prior year. This decline reflects the significantly lower revenue, only partially offset by fixed rent relief negotiated with commercial partners and lower variable rent during the period.
Gross margin was 42% compared to 44% for the prior year.
As outlined above, the Company implemented a series of initiatives to reduce operating expenditure to deliver significant operational cost savings for the year in response to the revenue decline caused by COVID-19. Operating expenditure was $117 million compared to $144 million for the prior year.
Underlying EBITDA pre-AASB16 declined by 55% to $63 million, reflecting the decline in gross profit, only partially mitigated by the significant reduction in costs across the business.
On a statutory basis, (accounting for the adoption of AASB16), EBITDA declined by 24% to $238 million. This includes fixed rent being captured as depreciation and interest expense under the accounting standard.
Non-operating items of $3 million (pre-tax) are excluded from underlying trading results and relate to a $2 million full impairment of the goodwill and intangibles in Junkee, $1 million of debt forgiveness of Edge Joint Venture, and the balance being restructuring costs. These costs were partially offset by $4 million of other income in Fly and Locate, as outlined above.
Net finance costs pre AASB16 were $22 million, an increase of 17%, reflecting hedge losses previously captured in the balance sheet as a result of the reduction in debt and the associated hedges no longer being fully effective in offsetting the underlying interest rate risk.
The Net Loss After Tax (pre-AASB16) was $24 million compared to a Net Profit After Tax (pre AASB16) for the prior year of $27 million.
On a reported basis, (including the adoption of AASB16), Net Loss After Tax was $36 million, with the impact of AASB16 increasing after tax losses by $12 million.
Underlying NPATA on a pre-AASB16 basis was a loss of $8 million. Underlying NPATA declined by $58 million to a $20 million loss when accounting for the new standard.
Revenue maturity profile – CY19 revenue base10
CY19 revenue attached to contracts – excluding Cactus, Junkee and sundry items
CY19 revenue risk profile (pro forma)
$350.0m
$300.0m
$250.0m
$200.0m
$150.0m
$100.0m
$50.0m
$0.0mCY2021 CY2022 CY2023 CY2024 CY2025+
50.0%
40.0%
30.0%
20.0%
10.0%
0.0%
20.1%
$125.6m $33.5m $93.8m $78.9m $292.3m
5.4%
15.0% 12.6%
46.8%
10 CY19’s revenue base has been adopted in this analysis as this represents a truer picture of the revenue opportunity attached to various leases and their relative expiry profile vs CY20 which was significantly COVID impacted.
15

DividendAs announced at the time of the equity raising, the Board has temporarily suspended dividends. As a result, no dividends were payable for CY20. The Board will revisit this intent in future periods based on the prevailing market conditions and with consent of the Company’s lenders.
CASH FLOW GENERATION
A$m unless specified CY20 CY19 Variance ($) Variance (%)
EBITDA (pre AASB 16) 59.9 125.3 (65.4) (52%)
Net change in working capital and other11 45.1 (7.1) 52.1 (736%)
Interest and Income Tax (included in net cash from operating activities)
(7.6) (27.8) 20.2 (73%)
Net cash from operating activities 97.3 90.4 6.9 8%
Capital expenditure (16.4) (56.0) 39.6 (71%)
Other 2.5 0.3 2.2 677%
Net cash flow before financing and acquisitions 83.5 34.8 48.7 140%
The Company continued its focus on disciplined cash management during the challenging year.
This included the successful collection of receivables notwithstanding COVID-19.
Net Cash from operating activities (pre-AASB16) was $97 million, representing 163% of EBITDA.
Net trade receivables and payables improved by $11 million during the year with a H1 unwind of $65 million offset by a $54 million increase in the second half as revenues recovered. The $48 million increase in trade receivables in H2 was more than offset by stronger earnings, tax refunds and other working capital movements such that overall Net Debt reduced by $4 million in H2 versus the position at 30 June.
As disclosed above, the Company took the prudent decision to significantly reduce its capital expenditure for the year with a strict focus on core maintenance spend and specific growth initiatives. The business continued to develop key sites to protect market share, including two new Signature Series digitals – “The King” outside Sydney Airport and a large format digital sign in Mosman, NSW.
Capital expenditure for CY20 was $16 million compared to $56 million for the prior year.
AASB16 has not had an impact on the cash flow of the business and will not have an impact in the future. However, it does change the presentation of the allocation on the cash flow statement.
OPERATING AND FINANCIAL REVIEW 2020CONTINUED
11 Includes non cash items in EBITDA such as share based payments and earnings related cash movements in accounts other than trade receivables and payables.
16

FINANCIAL POSITION
A$m unless specified CY20 CY19 Variance ($) Variance (%)
Borrowings 191.3 415.7 (224.5) (54%)
Cash and Cash equivalents (80.0) (61.2) 18.8 31%
Net Debt 111.2 354.5 (243.3) (69%)
Leverage Ratio (Net Debt/Underlying EBITDA) 1.8x 2.6x (0.8x) (31%)
Given the significant uncertainty caused by the onset of COVID-19, oOh! responded quickly to ensure the Company was equipped to manage through the short term volatility whilst remaining in a strong competitive position for the medium term.
The Board took the decision to strengthen the Company’s balance sheet with a $167 million equity raising in March 2020.
Net debt at 31 December 2020 was $111 million; a reduction of $243 million from 31 December 2019.
Following the implementation of management initiatives, the Company’s gearing ratio (Net Debt/Underlying EBITDA) as at 31 December 2020 was 1.8 times, compared to the bank covenant level of 4.0 times (reducing to 3.25 times by September 2021).
The gearing excludes the impact of AASB16 on its right of use liabilities which are not seen as debt for the purposes of applying the banking covenants.
In December 2020, oOh! extended its bank facilities with existing bank syndicate members – debt facilities of $350 million to December 2023.
FUTURE BUSINESS PROSPECTS
The business continues to see improving audiences with November to January at circa 90% of the prior corresponding period in Australian road and retail environments and overall revenues across this period at circa 80% versus the same three-month basis in the prior corresponding period. While revenue will likely remain more volatile than pre COVID-19, the refinanced balance sheet and cash flow management ensures the Company remains well placed to manage in the current environment and capitalise on the structural growth opportunities that Out of Home presents as conditions improve as audiences return in 2021 and beyond.
17

CATHERINE O’CONNORChief Executive Officer and Managing Director
Catherine (Cathy) was appointed as Chief Executive Officer effective 1 January 2021 and as Managing Director effective 11 January 2021.
Skills and experience: Before joining oOh!media Cathy spent 12 successful years at the helm of Nova Entertainment.
Cathy helped transform Nova into a multi-platform entertainment business, spending 17 years in total with the company. Prior to that she held several management roles at Austereo, after starting her career in radio advertising sales at 2SM and 2GB.
She is leading the strategic evolution of oOh!’s business model at a time of rapid change, capitalising on the Company’s significant investments in data, audience insights, content and creative to target sustained growth.
Cathy is a Governor of the Cerebral Palsy Alliance Research Foundation, Chair of the Sony Foundation, and previously served on the Commercial Radio Australia Board. Her numerous career achievements include a Telstra NSW Business Women’s Award for the Private Sector, a Centenary Medal for Service to Australian Society in Business Leadership, and induction into the Commercial Radio Hall of Fame.
TONY FAURE Chair and Non-executive Director
Tony Faure was appointed to the Board of oOh!media Limited on 28 November 2014 and appointed Chair on 22 September 2017.
Tony was also a Director of the parent company of the oOh!media group (since February 2014).
Skills and experience: Tony has deep experience in traditional and digital media and marketing, having run both small and large companies. Tony is passionate about ideas that use technology to push limits and create new experiences for consumers. Tony has held the positions of Chief Executive Officer of ninemsn and Chief Executive Officer and Founder of Home Screen Entertainment, and positions at Yahoo! including Regional Vice President, South Asia and Managing Director of Yahoo! Australia and New Zealand. Tony was also an advisor to the Board of seek. com.
Other public directorships (current and recent): Tony is currently the Chair of ReadyTech Holdings (since 2019).
A Graduate of the Institute of Company Directors, Cathy also holds a Bachelor of Arts in Communications from University of Technology Sydney.
JOANNE CREWES Independent Non-executive Director
Joanne was appointed to the Board of oOh!media Limited on 22 September 2017.
Skills and experience: Joanne is the former President of Procter & Gamble’s Global Prestige business unit, having held various senior leadership roles globally with Procter & Gamble over her 27-year career with the company. Joanne brings deep experience and insights across consumer value propositions, data-driven insights, brand positioning and client-side marketing perspectives.
Joanne is a mentor and coach to various senior executives and C-suite leaders.
Joanne holds a Bachelor of Business from University of Technology Sydney and is a graduate of the Australian Institute of Company Directors.
Joanne is currently an Industry Advisory Board member of University of Technology Sydney.
Other public directorships (current and recent): Joanne was formerly a Non-executive Director of the Dulux Group Limited (2018 –2019).
BOARD OF DIRECTORS
Board of Directors as at 22 February 2021 from left to right:Andrew Stevens, Marco Hellman, Joanne Crewes, David Wiadrowski , Cathy O’Connor , Tony Faure , Darren Smorgon, Timothy Miles and Philippa Kelly.
18

MARCO HELLMAN Non-executive Director
Marco (Mick) was appointed to the Board of oOh!media Limited on 7 April 2020.
Skills and experience: Mick is a Founder, Managing Partner and member of the Investment Committee of HMI Capital Management, L.P.
Prior to establishing HMI Capital Management, L.P, Mick spent most of his career at Hellman & Friedman, LLC where he was a Managing Director and a member of the Investment Committee. While at Hellman & Friedman, Mick founded the software and logistics (ports and container terminals) verticals and established the firm’s Hong Kong office. He was instrumental in Hellman & Friedman’s investments in Blackbaud, Inc., Hongkong International Terminals Limited and Mitchell International, Inc.
Prior to joining Hellman & Friedman in 1987, Mick worked as a Financial Analyst at Salomon Brothers Inc. in San Francisco in the Corporate Finance Department.
Mick is on the Board of a number of Not-For-Profit organisations, including San Francisco Jazz Organisation, USA Cycling Foundation and HSB LLC.
Other public directorships (current and recent): Mick was formerly a Director of LPL Financial Holdings Inc. (NASDAQ, 2016 – 2018).
PHILIPPA KELLY Independent Non-executive Director
Philippa was appointed to the Board of oOh!media Limited on 18 September 2019.
Skills and experience: Philippa has a background in law and investment banking, specialising in IPOs and mergers and acquisitions. She has extensive experience across property and finance, governance and risk management.
Philippa has over 20 years’ experience in senior operational and leadership roles within the property sector. She was formerly Chief Operating Officer of the Juilliard Group, one of Melbourne’s largest private property owners. Previously she was Head of Institutional Funds Management of Centro Properties Group (now Vicinity Centres) and Corporate Advisor-Investment Banking at JBWere. Philippa holds a Bachelor of Laws from
University of Western Australia and a Graduate Diploma of Applied Finance & Investment from Finsia. She is a fellow of the Australian Institute of Company Directors and Finsia.
Philippa is a Deputy Chancellor of Deakin University and Chair of its Finance and Business Committee.
Other public directorships (current and recent): Philippa is currently Chair of Lifestyle Communities Limited (Chair since 2019 and Director since 2013).
TIMOTHY MILES Independent Non-executive Director and Chair of Technology Committee
Tim was appointed to the Board of oOh!media Limited on 16 May 2019.
Skills and experience: Based in Auckland, Tim has significant experience, both internationally and in New Zealand, notably in technology and digital development.
Tim has held senior leadership roles including as Chief Executive Officer of Spark Digital, Managing Director of listed agricultural services group PGG Wrightson, Chief Executive Officer of Vodafone New Zealand and Chief Executive of Vodafone UK and Group Chief Technology Officer of Vodafone plc. Tim has also held senior roles at IBM, Data General Corporation and Unisys Corp. Tim holds a Bachelor of Arts from Victoria University of Wellington.
Tim is currently the Chair of the Gut Cancer Foundation.
Other public directorships (current and recent): Tim is currently a Non-executive Director of Genesis (NZE, since 2016) and Nyriad Limited (New Zealand, since 2018).
DARREN SMORGON Independent Non-executive Director and Chair of Remuneration & Nomination Committee
Darren was initially appointed to the Board of oOh!media Limited on 7 October 2014. Darren stepped down as a Director, effective 7 April 2020 and took the position of Board Observer until he was reappointed at the 2020 Annual General Meeting on 4 June 2020.
Darren was also a Director of the parent company of the oOh!media group (since March 2012).
Skills and experience: Darren is the Managing Director of Sandbar Investments, a private investment company. Darren was previously a Director of CHAMP Private Equity where he spent 16 years. While at CHAMP he oversaw the oOh!media privatisation and relisting on the ASX. Darren holds a Bachelor of Economics (with Merit) and Master of Commerce (with Merit) from the University of New South Wales, and a Graduate Diploma in Applied Finance and Investment from the Securities Institute of Australia.
Other public directorships (current and recent): Darren is currently a Director of Swift Media Limited (since 2019) and its Non-executive Chair since 2019.
ANDREW STEVENS Independent Non-executive Director
Andrew Stevens was appointed to the Board of oOh!media Limited on 25 September 2020.
Skills and experience: Andrew brings extensive experience in both technology and consulting.
Andrew was Managing Director of IBM Australia and New Zealand from 2011 to 2014, having joined IBM when the company acquired PricewaterhouseCoopers Consulting (PwC) and previously holding senior roles including Managing Partner, Growth Markets for IBM’s Global Business Services where he was responsible for the performance of the operations in Asia Pacific, Latin America, Central Europe, the Middle East, and Africa.
Prior to that, Andrew held several consulting roles at Price Waterhouse and PwC, before being appointed Managing Partner of PwC Consulting across Asia Pacific.
Andrew holds a Master of Commerce and Bachelor of Commerce from the University of New South Wales and is a Fellow of the Chartered Accountants of Australia and New Zealand.
Andrew is currently the Chair of Industry Innovation and Science Australia and Chair of the Data Standards Body for the Consumer Data Right and Non-executive Director.
19

BRENDON COOK Chief Executive Officer and Managing Director (Retired 31 December 2020)
Brendon retired as CEO and Managing Director effective 31 December 2020.
Brendon founded oOh!media in 1989 and was appointed to oOh!media Limited on 7 October 2014 prior to oOh!media’s listing in December 2014.
Skills and experience: Brendon Cook founded oOh!media in 1989. With over 40 years’ experience in outdoor advertising, Brendon has been at the forefront of the Out of Home advertising business in Australia and New Zealand, creating a multi-award winning company and being actively involved in pioneering the industry’s move into digital.
Under Brendon’s leadership, the business delivered strong organic growth, strategic acquisitions and developed and introduced several new environments to capitalise on the growth in digital and people’s media habits away from home.
Brendon is a founding and current Non-executive Director of the Outdoor Media Association and was instrumental in the development of the MOVE (Measurement of Outdoor Visibility and Exposure) project, a system that allowed for improved accuracy in reporting measurable outcomes to clients using Out of Home media.
Brendon is the International Vice President of The World Out of Home Organization (previously FEPE International, established in 1959). WOO is the Global Out of Home industry body, that now champions the connection of country industry bodies and Out of Home leaders around the world, to develop learnings and strategies that assist Out of Home to become a world leading new media. Brendon is the first Australian to sit on the Board in the organisation’s nearly 60-year history.
Other public directorships (current and recent): Andrew is currently a Non-executive Director of Stockland Group Limited (since 2017).
Andrew was formerly a Non-executive Director of MYOB Group Limited and Thorn Group Limited (both, 2015 – 2019).
DAVID WIADROWSKI Independent Non-executive Director, Lead Independent Director and Chair of Audit, Risk & Compliance Committee
David was appointed to the Board of oOh!media Limited on 29 November 2019 and was appointed Lead Independent Director on 25 February 2020.
Skills and experience: David is an experienced Non-executive Director currently serving on four ASX listed companies and brings strong commercial acumen and skills to the Board. David was a partner of PwC for 25 years, including five years as Chief Operating Officer of the PwC Assurance business, during which he was responsible for the day to day operations of the firm’s largest business consisting of 160 partners and 1,800 staff.
During his time at PwC, David had a focus on technology, entertainment and media and was the lead audit partner for a number of the firm’s major clients including Network Ten, Seven West Media, APN News & Media and APN Outdoor.
David holds a Bachelor of Commence from the University of New South Wales, is a Graduate of the Australian Institute of Company Directors’ Company Directors Course and is a Fellow of the Chartered Accountants of Australia and New Zealand.
David is an Advisory Board member of the Cambodian Children’s Fund.
Other public directorships (current and recent): David is currently a Non-executive Director and Chair of the Audit and Risk Committees of Vocus Group Limited (since 2017) and Life360 Inc (since 2019) and Non-executive Director and Chair of the Audit Committee of carsales. com Limited (since 2019).
DEBRA GOODIN Independent Non-executive Director (Retired 25 February 2020)
Debra (Debbie) was a Director of oOh!media Limited and Chair of the Audit, Risk & Compliance Committee since 28 November 2014 and was appointed Lead Independent Director on 22 September 2017.
Debbie retired as a Director of the Company, effective 25 February 2020.
Skills and experience: Debbie has more than 20 years’ senior management experience with professional services firms, government authorities and ASX-listed companies across a broad range of industries and service areas. Debbie is an experienced Non-executive Director and Audit Committee Chair.
Debbie has executive global experience in finance, operations, corporate strategy and mergers and acquisitions. Debbie holds a Bachelor of Economics from the University of Adelaide and is a Fellow of the Institute of Chartered Accountants ANZ.
Other public directorships (current and recent): Debbie is currently a Non-executive Director of Atlas Arteria Limited (since 2017) and APA Group (since 2015).
Debbie was formerly a Non-executive Director of Senex Energy Limited (2014 – 2020) and Ten Network Limited (2016 – 2017).
COMPANY SECRETARIES
MARIA POLCZYNSKI
Maria is General Counsel and has over 30 years’ legal and leadership experience including as the senior legal officer of Bendigo and Adelaide Bank and partner of Sydney-based law firm, Henry Davis York (now part of Norton Rose Fulbright). Maria holds a Bachelor of Jurisprudence/Bachelor of Laws from the University of New South Wales and a Master of Laws from University of Technology Sydney.
MELISSA JONES
Melissa is the General Manager of Company Matters, Link Group’s company secretarial and governance team, and holds a Bachelor of Law (Hons), with over 18 years’ experience as a lawyer and governance professional.
BOARD OF DIRECTORSCONTINUED
20

oOh!media also owns a leading native content production company and digital printing operations.
OPERATING & FINANCIAL REVIEW
The consolidated profit/(loss) attributable to the owners of the parent entity for the financial year ended 31 December 2020 was $(35,718,000) (2019: $13,668,000)1.
A review of operations and results of the Group for the year ended 31 December 2020 is set out in the Operating and Financial Review, which forms part of this Report.
SIGNIFICANT CHANGES IN THE STATE OF AFFAIRS
The impact of COVID-19 on the Out of Home market has been significant and as a result there have been several significant changes in the state of affairs of the Company during 2020. The financial and other impacts are outlined in the Operating and Financial Review.
LIKELY DEVELOPMENTS & EXPECTED RESULTS
The Group’s prospects and strategic direction are discussed in various sections of this Report. Further information about likely developments in the operations of the Group and the expected results of those operations in future financial years has not been included in this Report because disclosure of the information would be likely to result in prejudice to the Group.
RISK MANAGEMENT
GovernanceThe Company pro-actively manages risks such as strategic risk, operational risk, governance and compliance risk and financial risk. The Board has mechanisms in place to ensure management’s objectives and activities are consistent with risk management direction by the Board including governance structures requiring Board approval of:
• the Group’s strategic plan and operational objectives;
• the Group’s policies regarding governance, conduct and other risks;
• the Group’s annual financial forecasts and operating budgets;
• all contracts and agreements which exceed the level of delegation to management in the Delegated Authority Policy approved by the Board; and
• all project developments which exceed the level of delegation to management in the Delegated Authority Policy approved by the Board;
COVID-19The COVID-19 pandemic realised the following specific risks for the Company in CY20 in addition to the risks in the table below. It is expected the impact will continue into CY21, though to a lesser degree:
• financial risks: lockdown measures enacted by Australian and New Zealand government authorities in late March 2020 significantly reduced audiences for the Company’s assets and therefore advertiser revenues. In response:
– the Company took measures to strengthen the Company’s balance sheet through an equity raise in March 2020, secured temporary covenant changes in the Company’s debt facility through to the second half of 2021 and in December 2020, with the support of the Company’s existing banking syndicate, extended debt financing arrangements until September 2023; and
– the Company enacted a range of operating and capital expenditure reduction measures and negotiated fixed rent relief due to the pandemic from several commercial partners. Following the 2003 SARS pandemic, key Fly concession contracts included rent abatement clauses in the event of significant audience reductions, which the Company activated. The Company expects such clauses to become standard in new concession contracts in other environments following the COVID-19 experience;
INTRODUCTION
The Directors of oOh!media Limited (oOh!media or the Company) present their report of oOh!media Limited and its controlled entities for the year ended 31 December 2020.
The Directors and Company Secretaries who held office at any time during or since the end of the financial year ended 31 December 2020, together with their qualifications, experience and further details, are set out on the previous pages, which form part of this report.
The Directors’ Report has been prepared in accordance with the requirements of the Corporations Act 2001 (Cth). The information below forms part of this Directors’ Report.
CORPORATE STRUCTURE
oOh!media Limited is a public company limited by shares that is incorporated and domiciled in Australia and listed on the Australian Stock Exchange.
PRINCIPAL ACTIVITIES
oOh!media is a leading Out of Home media company, offering advertisers the ability to create deep engagement between people and brands across one of the largest and most diverse Out of Home location-based portfolios in Australia and New Zealand. oOh!media’s portfolio includes:
• large format digital and classic roadside screens;
• large and small format digital and classic signs located in retail precincts such as shopping centres;
• large and small format digital and classic signs in airport terminals and lounges;
• digital and classic street furniture signs;
• digital and classic format advertising in public transport corridors including rail;
• digital and classic signs in high dwell time environments such as cafés, pubs, universities and office buildings; and
• online sites for millennials, students, flyers and small businesses and city-based audiences.
DIRECTORS’ REPORT
1 As a result of the IFRS Interpretation Committee (IC) agenda decision, the Group has changed its accounting policy, retrospectively adjusting the deferred tax accounting for Brands. Refer to Note 10 of the Financial Statements.
21

The measures enacted by the Company mitigated the financial risk to the Company of the severe and immediate reduction in revenue during widespread government lockdown measures during the second and third quarters of 2020 in the jurisdictions in which it operates. The Company expects the risk of more localised government lockdown measures to manage the COVID-19 pandemic will continue in 2021 and that audiences for Fly assets and assets located in central business districts will improve during 2021. The diversity and spread of the Company’s asset portfolio and significantly reduced debt levels achieved over 2020 will assist in mitigating the impact of lockdown measures in CY21; and
• business continuity risks: lockdown measures resulted in the successful enactment of business continuity procedures for the Company from March 2020, with most employees working from home for extended periods in 2020. This risk was mitigated by investment in and resourcing of risk management activities including cyber security, WHSE, governance and regulatory and in the Company’s people and culture. Business continuity during lockdown was also facilitated by achieving essential worker designation for field staff maintaining public infrastructure.
Long-term risks as they operate in CY20In addition to the COVID-19 specific risks above, the Company considers the following as being the most relevant risks to the business achieving its strategic, operational and financial targets:
Business Element Description of risk and the Company’s mitigation
External economic conditions
The Company operates in Australia and New Zealand. Several advertiser customers are global organisations whose media expenditure decisions can be affected by economic conditions in other jurisdictions. A general disruption to or downturn in macroeconomic factors such as consumer confidence, or the media industry specifically, may reduce revenues. This may have a significant impact on operating profit as a large proportion of the Company’s costs have a fixed component. The Company positions its operations to balance the opportunity of delivering outcomes for investors from stronger economic conditions as well as mitigating the impact of economic downturns given the cyclical nature of the media market. The Company maintains a portfolio of assets which is diversified across several out of home segments and across central business district, transport, metropolitan (including suburban) and regional areas in Australia and New Zealand. A significant proportion of arrangements with commercial partners include rent that varies with revenue in a period. The Company maintains debt financing facilities with liquidity headroom above expected operational needs.
Meeting the evolving needs of advertisers
Growth in outdoor advertising will be dependent on oOh!media’s continued ability to adapt to changes in the media landscape, including meeting evolving customer advertising requirements and competitive and legislative changes. The Board oversees key changes in the media landscape and the appropriateness of management’s response to such changes. oOh!media has developed a diversified portfolio to mitigate this risk, with diversity and scale across a number of different environments that deliver return on investment for advertisers. oOh!media has also invested in audience data, scalable systems and operating models to manage this risk in the future.
Business partners oOh!media is dependent on concession contracts with commercial partners to maintain and manage its lease and licence portfolio, media agencies to represent this portfolio to their advertiser clients, and customers who desire the portfolio to advertise their goods and services. Many concession contracts require oOh!media to participate in competitive processes ahead of or at each renewal. Loss of relationships with media agencies, a change in the size or structure of the media agency market, or loss of relationships with key customers could impact the Group’s future operating and business performance. oOh!media has developed a diversified portfolio of relationships with numerous individual commercial partners and with different contract maturity dates to mitigate the impact of losing individual concession contracts, and has invested in data and insights to give agencies and customers more focus and reach for their desired audience using oOh!media’s unique portfolio.
Acquisitions & integration
Acquisitions may not deliver projected benefits or value, and integrations may not be successful, resulting in interruptions to the achievement of business strategy. oOh!media has deep experience managing business integrations and where appropriate, appoints full time project managers to assist with the management and delivery of integration programs. oOh!media regularly reports against the performance of the integration and the new business to the Board.
DIRECTORS’ REPORTCONTINUED
22

Regulatory & Governance Description of risk and the Company’s mitigation
Regulatory The Group operates in an industry which is subject to specific regulatory risk, planning development regulations for deployment of the Group’s assets and regulatory changes with respect to advertising content on the Group’s assets. oOh!media engages proactively with regulatory and industry bodies regarding development of regulation and in ensuring compliance by the Group’s activities. For example, during CY20 the Group engaged effectively with regulatory bodies to secure, where appropriate, essential worker designation to maintain the Company’s assets during periods of government COVID-19 lockdown.
Governance The Group recognises stakeholder expectations regarding governance for an enterprise of its scale and operating as a publicly listed entity. A significant failure to meet expected standards of governance would impact the reputation and business outcomes for the Group. oOh!media engages professional in-house and where required, external, governance experts across its corporate, finance, legal and operations functions to provide advice and support, and to manage and review governance processes and systems.
IT & Cybersecurity Description of risk and the Company’s mitigation
IT security & resilience Failure to appropriately address security risks around external threats to the digital network, IT systems and data (including personal information) could result in system suspension or failure, the potential loss of intellectual property or a personal information data breach. oOh!media has developed a Cyber Security Strategy and processes. Activities in relation to managing Cyber Security risk are overseen by a Cyber Security Steering Committee comprising of executives leading the operational functions in addition to the IT executive leadership. Cyber risk management activities are reported regularly to the Board and its Committees.
People & Capability Description of risk and the Company’s mitigation
WHSE&S Work, health, safety, environmental and sustainability (WHSE&S) risks could occur causing physical injury or death to employees or others, damage to property or the environment, damage to reputation and involve regulatory breach. oOh!media has a dedicated WHSE&S function, complemented by a WHSE&S management system that is rigorously enforced. This team conducts Quality Assurance on providers to ensure compliance with policies, induction, licensing requirements, insurance and WHS policies. oOh!media has a Group-wide training program for WHSE&S, including specific training on bullying and harassment. oOh!media conducts third party independent audits of its work, health & safety and environmental systems to identify any areas for continuous improvement. Strategy and processes, policies and activities in relation to managing WHSE&S are overseen by a WHSE&S Steering Committee comprising of executives leading operational functions across the Group. WHSE&S risk management activities and all incidents are reported to and considered regularly by the Board.
23

People & Capability Description of risk and the Company’s mitigation
Culture, employee retention & succession
The Company has a vibrant and entrepreneurial culture which embraces colleagues as individuals as well as contributors. This culture has enabled the Company to grow to be the largest Out of Home operator in Australia and New Zealand and was the foundation of the Company’s successful response in CY20 to the risks which eventuated with the COVID-19 pandemic. Business structure and staff capability may not continue to evolve to meet the growing changes and complexity in the products, market, agencies and emerging digital environment. This failure may negatively impact the innovative and entrepreneurial culture of the Company and the ongoing relevance and performance of oOh!media within the market. As the business evolves, structure, culture and capability is carefully assessed to ensure the best of the culture and capability is continually enhanced, whilst adapting to new favourable opportunities. oOh!media has Group-wide induction and continuous training programs, a mentoring program, and recognition programs beyond remuneration. The Remuneration & Nomination Committee of the Board works closely with the CEO and Chief People & Culture Officer on the design and implementation of the Company’s culture programs, reviewing results and the Company’s response to regular culture surveys.
Employee retention and succession planning enables the Group’s delivery of its strategy and competitive success. Significant loss of employees over a short period could impact the Company’s ability to operate effectively or achieve its revenue targets. oOh!media has short-term and long-term succession and organisational structure plans for key roles. Retention and succession activities and outcomes are regularly reviewed by the Board. In CY20 the Company’s CEO announced his intention to retire. The Board enacted its CEO succession plan which considered both internal and external candidates. The succession process concluded with the handover to the incoming CEO at the start of CY21. The outgoing CEO, who founded the Company, remains engaged in a consulting capacity to assist in a seamless transition.
MATTERS SUBSEQUENT TO REPORTING DATE
Except as disclosed in Note 34 to the financial statements within this Annual Report, no other matter or circumstance at the date of this Report has arisen since 31 December 2020 that has significantly affected or may affect:
• the operations of the Group in future financial years; • the results of those operations in future financial years; or • the Group’s state of affairs in future financial years.
ENVIRONMENTAL REGULATION
The operations of the consolidated entity are not subject to any particular or significant environmental regulation under the law of the Commonwealth of Australia or any of its states or territories, or New Zealand. The Group has not incurred any significant environmental liabilities.
For further information see the Sustainability Report.
PROCEEDINGS ON BEHALF OF THE COMPANY
No proceedings have been brought on behalf of the Group, nor have any applications been made in respect of the Group under section 237 of the Corporations Act 2001 (Cth).
ROUNDING OF AMOUNTS
ASIC Corporations (Rounding in Financial/Directors’ Reports) Instrument 2016/191 (Instrument) issued by the Australian Securities and Investments Commission (ASIC), relating to the “rounding off” of amounts in the Directors’ Report applies to the Company.
Amounts in the Directors’ Report have been rounded off in accordance with the Instrument to the nearest thousand dollars, or in certain cases, to the nearest dollar, unless otherwise stated.
DIRECTORS’ REPORTCONTINUED
24

DIRECTORS’ MEETINGS
The record below shows the number of directors’ meetings held during the year, the number of meetings the directors were eligible to attend and the number of meetings attended.
Director Board Meetings Audit, Risk & ComplianceRemuneration &
Nomination Committee Technology Committee
H A H A H A H A
Total meetings 18 5 7 4
Brendon Cook 18 16
Joanne Crewes 18 18 7 7 4 4
Tony Faure 18 17 3 3 1 1
Marco Hellmana 10 10 6 6
Philippa Kelly 18 18 6 6 4 4
Timothy Miles 18 18 5 5 4 4
Darren Smorgona+b 16 15 2 2 7 7
Andrew Stevensa 3 3
David Wiadrowski 18 18 5 5
Debra Goodina 2 2 2 2
H – number of meetings held during the period the Director was a member of the Board/Committee.
A – number of meetings attended during the period the Director was a member of the Board/Committee.
a. Not a Board member for all of CY20. For times of Board appointment, see Board of Directors on page 18. b. In addition, Darren Smorgon attended 2 of 2 meetings of the Board as a Board Observer, between 7 April 2020 and 4 June 2020. These meetings
are not included in the above table.
In addition, Board sub-committees were convened from time to time during the period to support the Board in execution of its responsibilities.
25

BOARD SKILLS, EXPERIENCE & DIVERSITY
The Board, together with the Remuneration & Nomination Committee, review the skills, experience and diversity represented by Directors on the Board and determine whether the composition and mix of these factors remain appropriate for the Company’s strategy, subject to limits imposed by the Constitution and the terms served by existing Non-executive Directors.
The results of the 2020 self-assessment of the Directors’ skills and experience are shown on the matrix below. The results represent those Directors who confirmed their expertise or direct experience in the relevant area.
Three new Directors have been appointed to the Board since the beginning of 2020, following the appointment of three new Directors in 2019. The Board has an average tenure of 2 years and 4 months2, repressing a good balance of deep corporate knowledge and new perspectives.
We are confident the current Board composition provides a strong combination of skills, experience and diversity to allow oOh!media to execute its long-term strategy to drive sustainable growth and maximise shareholder value.
Notes: The Board composition changed in 2020 and increased from 7 to 9 Directors as detailed in the notes to the list of KMP in the Remuneration Report (see page 33). The matrix above shows the Board skills composition at the date of this Report.
CORPORATE GOVERNANCEoOh!media’s Corporate Governance Statement is available on oOh!media’s website under https:/ /investors.oohmedia. com.au/investor-centre/?page=governance.
SHARES ISSUED & EXERCISE OF RIGHTSOrdinary shares of oOh!media LimitedAt 31 December 2020, there were 5,308,284 performance rights on issue (2019: 2,829,236). In 2020, none of the performance rights under the Long-Term Incentive Plan vested, therefore no shares were issued. The total number of fully paid shares on issue at 31 December 2020 is 591,788,280 (2019: 242,385,958). The Company issued 315,101,745 new ordinary shares as part of the equity raising completed in April.
DIRECTORS’ REPORTCONTINUED
0
Advertising& Media
Leadership
Strategy
People
International
Finance& Capital
Management
Merger & Acquisition
Supply Chain
Legal
Risk &Governance
WHS &Environment
Marketing& Sales
CustomerEngagement
Content& DigitalMedia
DigitalTechnology
& Data
Male 6/9
Female 3/9
Commercial property & assets
3
6
9
SKIL
LS &
EX
PERI
ENC
E
ADVERTISING AND MEDIA (IN
CLUD
ING
OU
T OF H
OM
E)
GEN
DER
2 Darren Smorgon’s tenure is taken from his initial appointment in October 2014.
26

DIRECTORS’ INTERESTS IN SHARES, RIGHTS AND OPTIONS OF THE COMPANY
The relevant interests of each Director in the equity of the Company and related bodies corporate as at the date of this Directors’ Report are disclosed in the Remuneration Report.
SHAREHOLDER RETURNS
2020 2019 2018a 2017 2016d
Profit attributable to the owners of the Company ($’000)
(35,718) 13,668a 29,124 33,206 24,481
Basic earnings per share (cents) (7) 5b 14c 19 16
Dividends – interim paid and final declared ($’000)
Nil 26,566 26,094 24,704 22,420
Dividends per share – interim paid and final declared (cents)
Nil 11.0 11.0 15.0 14.0
Share price – closing at balance date ($) 1.66 3.64 3.42 4.50 4.57
a. As a result of the IFRS Interpretation Committee (IC) agenda decision, the Group has changed its accounting policy, retrospectively adjusting the deferred tax accounting for Brands. Refer to Note 10 of the Financial Statements.
b. CY19 basic earnings per share have been adjusted to reflect the Group’s capital raising during 2020. Refer to Note 29 of the Financial Statements.c. CY18 basic earnings per share have been adjusted to reflect the effect of the purchase price allocation accounting for Adshel which was
completed in 2019. d. The CY16 accounts have been restated for a change in policy relating to the tax treatment of intangibles on acquisitions.
Shareholder returns per share reflect the issuance of:
• 71,709,994 additional fully paid ordinary shares issued in July 2018 to assist in financing the acquisition of the share capital of Adshel on 28 September 2018.
• 315,101,745 additional fully paid ordinary shares issued in April 2020 as part of the equity raising announced on 26 March 2020.
Net profit amounts have been calculated in accordance with the Australian Accounting Standards. Dividends for CY20 were fully franked.
DIVIDENDS
The following fully franked dividends have been paid to date:
Dividend paid during 2020Amount per
share (cents) Total paid ($)
Final 2019 dividend (paid 3 April 2020) 7.5 18,178,958
Dividends paid during 2019Amount per
share (cents) Total paid ($)
Final 2018 dividend (paid 26 March 2019) 7.5 17,811,345
Interim 2019 dividend (paid 30 September 2019) 3.5 8,387,010
26,198,355
In response to the COVID-19 impact the Board suspended its Dividend Policy in March 2020 and therefore did not pay an interim dividend in CY20 and does not propose to pay a final dividend in respect of the year ended 31 December 2020. The Board will revisit this decision in future periods based on the prevailing market conditions and with consent of the Company’s lenders. The final 2019 dividend was subject to the DRP and the DRP offer was fully underwritten. The financial effect of this dividend is outlined in Note 22 of the Financial Statements.
27

INDEMNIFICATION & INSURANCE OF DIRECTORS AND OFFICERS
The Company, to the extent permitted by law, indemnifies each Director, alternate Director and Executive Officer of the Company on a full indemnity basis against all losses, liabilities, costs, charges and expenses incurred by that person as an Officer of the Company or one of its related bodies corporate.
The Company, to the extent permitted by law, may purchase and maintain insurance, or pay, or agree to pay, a premium for insurance for each Director, alternate Director and Executive Officer of the Company against any liability incurred by that person as an Officer of the Company or its related bodies corporate, including a liability for negligence or for reasonable costs and expenses incurred in defending or responding to proceedings, whether civil or criminal and whatever their outcome.
The Company may enter into contracts with a Director or former Director agreeing to provide continuing access to board papers, books, records and documents of the Company that relate to the period during which the Director or former Director was a Director. The Company may arrange that its related bodies corporate provide similar access to board papers, books, records or documents.
INSURANCE PREMIUMS
The Company has paid insurance premiums in respect of Directors’ and Officers’ Liability insurance for the year ended 31 December 2020 and since the end of that year. Such insurance contracts insure against certain liability (subject to specific exclusions) of persons who are or have been Directors, alternate Directors or Executive Officers of the Company or in that capacity to the extent allowed by the Corporations Act 2001 (Cth). The terms of the policies prohibit disclosure of the liability and premium paid.
NON-AUDIT SERVICES
During the year, KPMG, the Company’s auditor, performed certain other services in addition to its statutory duties.
The Board has considered the non-audit services provided during the year by the auditor, and, in accordance with the advice received from the Audit, Risk & Compliance Committee, is satisfied that the provision of those non-audit services during the year by the auditor is compatible with, and did not compromise, the auditor independence requirement of the Corporations Act 2001 (Cth) for the following reasons:
• all non-audit services are subject to corporate governance procedures adopted by the Group and have been reviewed by those charged with the governance of the Group throughout the year to ensure they do not impact the integrity and objectivity of the auditor; and
• the non-audit services provided do not undermine the general principles relating to auditor independence as set out in APES 110 Code of Ethics for Professional Accountants (including Independence Standards) as they did not involve the auditor reviewing or auditing its own work, acting in a management or decision-making capacity for the Group, acting as an advocate to the Group or jointly sharing the risks and rewards.
Details of the audit and non-audit service fees paid or payable to the Company’s auditor during the year are disclosed in Note 31 of the financial statements:
Audit and assurance services2020
$2019
$
KPMG Australia
Audit and review of Financial Statements 732,888 611,179
Other assurance services 243,782 165,189
Total audit and assurance services 976,670 776,368
DIRECTORS’ REPORTCONTINUED
28

Other services2020
$2019
$
KPMG Australia
Taxation compliance and advisory services 189,761 107,514
Total other services 189,761 107,514
Total auditor’s remuneration 1,166,431 883,882
OTHER INFORMATION
The following information, contained in this Annual Report, forms part of this Directors’ Report:
• Operating and Financial Review• Board of Directors• Audited Remuneration Report• Lead Auditor’s Independence Declaration
This Report is made in accordance with a resolution of Directors, pursuant to section 298(2)(a) of the Corporations Act 2001 (Cth).
Signed on behalf of the Directors.
Tony Faure Chair
22 February 2021, Sydney
29

DIRECTORS’ REPORTCONTINUED
LEAD AUDITOR’S INDEPENDENCE DECLARATION UNDER SECTION 307C OF THE CORPORATIONS ACT 2001
To the Directors of oOh!media LimitedI declare that, to the best of my knowledge and belief, in relation to the audit of oOh!media Limited for the financial year ended 31 December 2020 there have been:
i. no contraventions of the auditor independence requirements as set out in the Corporations Act 2001 in relation to the audit; and
ii. no contraventions of any applicable code of professional conduct in relation to the audit.
KPMG Trent Duvall Sydney Partner
Sydney 22 February 2021
KPMG, an Australian partnership and a member firm of the KPMG network of independent member firms affiliated with KPMG International Cooperative (“KPMG International”), a Swiss entity.Liability limited by a scheme approved under Professional Standards Legislation.
30

1 Both JobKeeper and New Zealand wage support equivalent payments have been identified as cost reduction, rather than revenue in the Company’s accounts, and have been excluded from the calculation of either revenues or cost-savings for the purposes of assessing whether LTI or STI measures of success have been met. See Note 6 to the Company’s financial statements for treatment of JobKeeper receipts.
2 Market share is measured separately for Australia and New Zealand for the STI scheme in each market.3 Underlying EBITDA pre AASB16 referred to in Note 4 of the Financial Statements.
The Directors are pleased to present the 2020 Remuneration Report which outlines remuneration information for Non-executive Directors, Executive Directors and other key management personnel (together KMP).
The information in this Report has been audited as required by section 308(3C) of the Corporations Act 2001 (Cth).
INTRODUCTION
Dear shareholder,2020 has been an unprecedented year for the Out of Home industry as COVID-19 has significantly impacted audiences and depressed revenues. oOh!media has proven resilient in the face of this, mitigating the worst impacts of the pandemic, while remaining mindful of the need to position itself for the recovery, and ensuring that oOh!’s talented team remain motivated and incentivised appropriately.
2020 IncentivesThe Board recognises both the serious and adverse effects of the pandemic for shareholders as well as the substantial demands placed on employees who rose to the challenges of CY20 and are needed for the recovery. Accordingly, oOh!media’s CY20 remuneration outcomes seek to balance appropriate incentivisation and retention of employees with meeting shareholder expectations for disciplined financial management.
In this context the scope of the Board’s planned CY20 review of long-term incentives (LTI), noted in the 2019 Annual Report, was expanded to include also short-term incentives (STI). Potential STI and LTI target measures of success were investigated and assessed for:
• alignment to achieving financial returns for shareholders in the short-, medium- and longer-term; • objectivity and accountability; • setting meaningful targets for staff, i.e. reasonably within their control in an unpredictable COVID-19 market; and• recognising exceptional contributions and protecting the key human capital of the Company needed to capitalise on post
COVID-19 opportunities.
As part of the review the Board determined that to preserve cash during a challenging time, it was appropriate to provide all CY20 incentives, including STI, by issuing equity. The Board considered that the maximum number of new securities that might be issued would not dilute oOh!media’s share register in a material way.
oOh!media qualified for and received significant JobKeeper support in CY201. However, JobKeeper support has been excluded from assessment of all STI performance measures.
As a result of this review, success measures for the CY20 LTI were changed so that there are now three measures, each of equal weighting:
• A free cash flow per share measure replacing the CAGR earnings per share measure previously used;• TSR has been retained; and• A Return on Capital measure has been added.
It is anticipated that these measures will continue to be used in future and changed only if there are compelling reasons to do so. Details of the CY20 LTI measures can be found on page 44 of this Report.
For the CY20 STI Plan there are also three success measures. One measure is strategic. The other two are objective financial measures, designed for an unpredictable market in which audiences and revenues were adversely affected by COVID-19 and macroeconomic matters beyond the control of participants. The three measures in their respective proportions are:• 40%: a new metric of maintaining Out of Home market share2, relative to CY19;
• 40%: a revised EBITDA3 metric based on the change in EBITDA from CY19 being no more than 50% of the corresponding change in revenue; and
• 20%: a revised strategic priorities measure which now includes the achievement of an agreed quantum of CY20 cost savings as well as staff engagement and wellbeing requirements.
REMUNERATION REPORT
31

As part of the balancing of shareholder returns with the need to retain and incentivise staff, the changes to STI measures were also accompanied by a reduction in the size of the STI pool and corresponding individuals’ targets. The STI program for CY20 comprises two components.
In respect of the first component, the STI pool size for 2020 that had been approved before the pandemic, was halved, with individuals’ targets correspondingly reduced by 50%. Shares issued in respect of this component will be unrestricted.
The second, smaller component was an augmentation of that reduced STI pool, specifically introduced to recognise exceptional contributions of key staff through the pandemic and to retain those key staff to enable the Company to capitalise on the opportunities of the recovery. This component addresses the retention risk created by both the relative impact of COVID-19 on Out of Home media and in a context where LTI benefits from 2018-2019 were negatively impacted, such that performance rights issued in 2018 will not vest and those issued in 2019 are expected not to vest. This follows 2017 performance rights not vesting after a downturn in trading conditions in Q3 2019. Shares issued in respect of this component will carry a trading restriction for 12 months from issue.
The Board is pleased that the revised 2020 STI measures were met. Detail of the 2020 STI measures can be found on page 44 of this Report.
2018 and 2019 LTI IncentivesCOVID-19 impacted oOh!media’s financial performance in 2020, following a market downturn in Q3 2019. As a consequence, the 2018 LTI did not vest in February 2021. It is also expected that the 2019 minimum hurdles will not be met due to the COVID-19 impact on the media revenue environment expected to extend into 2021.
REPORTING PRINCIPLES
The Remuneration Report refers to a range of non-IFRS (International Financial Reporting Standards) financial information including Underlying EBITDA pre AASB16.4 oOh!media believes this non-IFRS financial information provides useful insight to users of this Report in measuring the financial performance and condition of oOh!media.
The Remuneration Report has been prepared on a basis consistent with the Financial Statements and accordingly includes total remuneration details for the year ended 31 December 2020. oOh!media’s remuneration framework is structured to ensure it is market competitive and supports and motivates the Executive and the broader team to work toward both short and long-term strategic objectives that align to sustainable value creation for shareholders.
Darren Smorgon Chair, Remuneration & Nomination Committee
Sydney
4 Underlying EBITDA pre AASB16 referred to in Note 4 of the Financial Statements.
REMUNERATION REPORTCONTINUED
32

LIST OF KMP
The key management personnel (KMP) for 2020 are the nine Non-executive Directors and two Executives who have specific responsibility for planning, directing and controlling the material activities of oOh!media, one of whom is the Managing Director. There is also an Executive Leadership Team that supports the KMP.
Non-executive Directors
Joanne Crewes Independent Non-executive Director
Tony Faurea Chair and Non-executive Director
Debra Goodinb Independent Non-executive Director and Lead Independent Director
Marco (Mick) Hellmanc Non-executive Director
Philippa Kelly Independent Non-executive Director
Timothy Miles Independent Non-executive Director
Darren Smorgond Independent Non-executive Director
Andrew Stevense Independent Non-executive Director
David Wiadrowski Independent Non-executive Director and Lead Independent Director
Executives
Brendon Cookf Chief Executive Officer and Managing Director (CEO)
Sheila Lines Chief Financial Officer (CFO)
a. Tony Faure was a consultant to Junkee Media following the acquisition by oOh!media in July 2016 until 1 December 2020. As a consequence, the Board determined Tony Faure was not considered to be an independent Director of oOh!media during the consultancy and for 3 years from the end of the consultancy.
b. Debra Goodin retired on 25 February 2020.c. Mick Hellman was appointed on 7 April 2020. Mick is the Founder and Managing Partner of investment management company, HMI Capital c, L.P.
(from 1 January 2021 the successor entity of the former HMI Capital, LLC), which is the general partner and investment manager of each of HMI Capital Partners, L.P. and MERCKX Capital Partners, L.P, who collectively hold the largest shareholding in oOh!media. As a consequence, the Board determined that Mick Hellman was not considered to be an independent Director of oOh!media.
d. Darren Smorgon stepped down as a Non-executive Director and took up the position of Board Observer effective 7 April 2020. Darren Smorgon was reappointed as an independent Non-executive Director at the Annual General Meeting, effective 4 June 2020.
e. Andrew Stevens was appointed effective 25 September 2020.f. Brendon Cook retired as CEO and Managing Director effective end of day 31 December 2020.
After the reporting period, Catherine (Cathy) O’Connor commenced as CEO, effective 1 January 2021 and Managing Director, effective 11 January 2021.
33

REMUNERATION REPORTCONTINUED
REMUNERATION PHILOSOPHY
This Remuneration Report explains the Board’s approach to executive remuneration, and to performance and remuneration outcomes for oOh!media and its KMP.
Remuneration principles and strategyThe success of oOh!media can be attributed to attracting and retaining talented individuals and the strong company culture that exists. oOh!media’s remuneration framework focuses on a competitive fixed annual remuneration (FAR) combined with short-term incentives (STI) and long-term incentives (LTI).
All incentives are “at-risk” and reward achievement of oOh!media’s annual financial outcomes and strategic goals as well as long-term growth in shareholder value.
In order to preserve cash all 2020 incentives are to be issued as equity not cash.
oOh!media’s remuneration principles are to guide practices that are:
• market competitive;• performance related;• fair; and• relatively easily understood – subject to CY20 introducing complexities inherent in balancing fairness to employees and
shareholders in an unpredictable market.
Remuneration is linked to achievement of business objectives through interlinked goals.
The Board reviews all remuneration principles, practices, strategies and approaches to ensure they support the long-term business strategy and are appropriate for a listed company of oOh!media’s size.
ATTRACT AND RETAINREWARD ACHIEVEMENT
OF GOALSLONG-TERM ALIGNMENT
TO SHAREHOLDERS
Cash Equity
• Benchmarked against comparable independent remuneration data and advice
• Set competitively to relevant industry peer group
• Total STI pool is based on: – Market share – Relative Revenue Drop Through to
Underlying EBITDA preAASB16 – Strategic priorities• Set yearly and linked to individual
and group performance against organisation strategy
• Based on: – Free Cash Flow per share – Return on Capital – Relative Total Shareholder Return • Three-year performance period• Board retains right to alter target or
clawback as necessary
Market competitive fixed annual remuneration
Set challenging short-and-long term incentives linked to the creation of sustainable shareholder returns
FAR STI5 LTI
5 In the exceptional circumstances of the COVID-19 marketplace, STI has also been used to retain key staff in CY20.
34

COMPONENTS OF REMUNERATION AND THEIR RATIONALE INCLUDING LINKS TO PERFORMANCE AND SHAREHOLDER WEALTH
Component Performance conditions Link to strategy and performance
Fixed Annual Remuneration (FAR)
Salary and other benefits including superannuation.
No conditions To attract and retain talented people and in compliance with legal obligations to pay employees minimum salaries and superannuation.
Short Term Incentive (STI)
Most employees are eligible to participate in the STI program. Participants must be employed by 1 October in the year to be eligible that year.
The total STI pool is based on organisational performance against three measures:
1. 40% maintaining Out of Home market share6
Share of the total Australian Out of Home market to be measured principally using the Outdoor Media Association7 CY20 data but excluding the transport category (principally airports and rail passengers), as oOh!media has a greater exposure than competitors to these formats which have been most impacted by COVID-19.
The CY19 base is 49.1% for Australia and a +/- 0.5% margin of error will be applied in CY20.
2. 40% Relative Revenue Drop Through
Change in CY20 Underlying EBITDA (pre-AASB16 and excluding JobKeeper and NZ wage subsidy) from CY19, being no more than 50% of the corresponding change in revenue.
3. 20% achievement of strategic priorities
Company performance against cost savings target of $35m, plus employee engagement and wellbeing measures as determined by the Board.
The target STI pool amount is reduced from CY19, having regard to the financial impacts of COVID-19 for both shareholders and employees. The usual STI pool was reduced by 50% but a smaller second component was added to address exceptional contributions of key staff through the pandemic and to retain those key staff to enable the Company to capitalise on the opportunities of the recovery.
Historically full year Underlying EBITDA was chosen as the company performance measure for STI’s. After a detailed review in CY20, the Board determined that the CY20 STI target pool size would be decided based on the three performance measures stated opposite.
The market share measure is to reward maintaining or exceeding market share in the uncertain COVID-19 recovery period.
The Relative Revenue Drop Through measures the profitability of revenue achieved against an unpredictable revenue base.
The strategic priorities measure aims to reward actions taken in support of cost containment and staff engagement and wellbeing in oOh!media’s short-, medium- and long-term interests.
The measures for Out of Home market share and Relative Revenue Drop Through, include the opportunity for a greater than 100% STI allocation for overachievement or a reduced allocation for a shortfall in achievement but still above minimum thresholds.
No allocation will be made for any underachievement below those minimum thresholds for those measures nor for any underachievement in respect of the strategic priorities measure.
For further detail see page 44.
6 Figures provided are for Australia which applies to all KMP. For New Zealand based STI participants the baseline is 37.0% +/- 0.5% margin of error. 7 For New Zealand the figures are provided for by the Out of Home Media Association Aotearoa (OOHMAA).
35

REMUNERATION REPORTCONTINUED
Component Performance conditions Link to strategy and performance
Long-Term Incentive (LTI)
An allocation of performance rights granted by invitation, to a defined set of senior leaders as approved by the Board and aligned to long-term shareholder value creation.
There are three LTI performance hurdles, each measured over a 3-year performance period and each representing 1/3 of the target award.
The first is based on Free Cash Flow per share (FCF), being calculated as:
(operating cash flow less capital expenditure and finance lease liabilities paid in CY22)/number of issued shares.
The second hurdle is based on a Return on Invested Capital (ROIC): CY22 Underlying pre-AASB16 EBITDA less fixed costs/invested capital.8
The third hurdle is based on Relative Total Shareholder Return9 (TSR) assessed against the ASX200 index (excluding Financials, Industrials and Materials).
For specific targets see page 44.
Aligns the interests of Executive KMP and other key employees with shareholders by focusing on long-term growth. The purpose of oOh!media’s LTI Plan is to provide incentive to attract, retain and motivate eligible employees whose present and potential contributions are important to the success of oOh!media by offering them a chance to participate in the future performance of the Company. All selected measures are objective and transparent:
• FCF was introduced in 2020 as it aligns incentives with shareholder interests by measuring and rewarding oOh!media’s ability to generate cash flow on a per share basis. It is more appropriate post-AASB16 than the EPS measure formally used, which needs to be adjusted for non-cash accounting impacts of adoption of AASB16 arising from renewals and terminations of the Company’s extensive lease inventory.
• The ROIC hurdle was introduced in 2020 and was chosen as a measure that reflects returns generated relative to the deployment of the Company’s capital.
• Relative TSR measures performance against peers and reflects investor returns generated by the Company compared to a broad index of other investment opportunities for shareholders.
The Board retains the right to alter targets during the performance period to account for significant acquisitions or divestments or to clawback or adjust any or all allocated LTI in relevant circumstances.
The number of rights that vest is a percentage of those targeted, based on the outcome of the three hurdles over the performance period of 2020 to 2023.
For further detail see page 44.
8 Average of the opening and closing balances of invested capital for CY22. Fixed costs are fixed rent previously realised in cost of goods sold pre AASB16 resulting in an EBITDA result pre AASB16. Invested capital is total equity plus net debt.
9 Shareholder return is calculated as aggregate dividends paid during the 3-year performance period plus the share price movement from the beginning to end of the performance period.
36

Remuneration linked to financial performance indicators and shareholder wealthInformation on the Company’s performance is shown below:
2020 2019 2018 2017 2016d
Underlying EBITDA ($’000) 63,163 138,987 112,525 90,070 73,500
Profit/(loss) attributable to the owners of the Company ($’000) (35,718) 13,668a 29,124 33,206 24,481
Basic earnings/(loss) per share (cents) (7) 5b 14c 19 16
Dividends – interim paid and final declared ($’000) nil 26,566 26,094 24,704 22,420
Dividends per share – interim paid and final declared (cents) nil 11.0 11.0 15.0 14.0
Share price – closing at balance date ($) 1.66 3.64 3.42 4.50 4.57
Change in share price over the year ($) -1.98 0.22 -1.08 -0.07 -0.15
a. As a result of the IFRS Interpretation Committee (IC) agenda decision, the Group has changed its accounting policy, retrospectively adjusting the deferred tax accounting for Brands. Refer to Note 10 of the Financial Statements.
b. CY19 basic earnings per share have been adjusted to reflect the Group’s capital raising during 2020. Refer to Note 29 of the Financial Statements.c. CY18 basic earnings per share have been adjusted to reflect the effect of the purchase price allocation accounting for Adshel which was
completed in 2019. d. The CY16 accounts have been restated for a change in policy relating to the tax treatment of intangibles on acquisitions.
EXECUTIVE KMP REMUNERATION
Executive KMP FAR for 2020
Brendon Cook $903,453
Sheila Lines $494,068
2020 STI outcomesThe 2020 STI outcomes are based on performance against three performance measures (detailed on page 45):
1. 40% maintaining market share;2. 40% Relative Revenue Drop Through; and3. 20% achievement of strategic priorities.
The business met all three of these measures which resulted in 139% of the STI total pool being awarded to employees of the Australian business.
Target STI for 2020The table below outlines the Target STI for the Executive KMP for CY20.
Target STI opportunity Max STI opportunity
Executive KMP Min STI Original target Modified
Targeta + b
Modified target as a %
of FAR Original targetModified
Target a + c
Modified target as a %
of FAR
Brendon Cook $0 $400,000 $290,000 32% $800,000 $560,000 62%
Sheila Lines $0 $208,590 $194,295 39% $417,180 $368,590 75%
a. Original target equalled CY19 target. It was reduced by 50% but a smaller second component was added to address exceptional contributions of key staff including KMP. The Modified Target is the sum of those two components.
b. Target STI represents the grant value at 100 per cent of STI measures outlined on page 44.c. Maximum STI allocation pool is absolutely capped for all employees at $10m. It is available on achievement of 4.8% OOH market share
increase; CY20 Relative Revenue Drop Through (relative to CY19) being 45% or less; full achievement of strategic priorities; and 200 per cent on achievement of personal goals.
37

REMUNERATION REPORTCONTINUED
Final 2020 STI paymentsThe table below outlines the 2020 STI payments (as a value of the grant price) to the Executive KMP for the calendar year ended 31 December 2020a, based on the short term incentives and equity incentive plan and including the STI allocation as a percentage of the FAR:
Executive KMP
Target opportunity as a
% of FARActual allocation
as a % of FAR STI allocated ($)
Number of shares issued at
VWAPb
Brendon Cook 32% 42% $376,376 358,453
Sheila Lines 39% 51% $252,165 240,157
a. Payable in Q1 2021. b. The ‘STI allocated ($) amount’ was divided by the Volume Weighted Average Price of the Company’s shares from 1 January 2020 to 30 June 2020 to
calculate the number of shares. 111,244 to be issued as restricted shares to each of Brendon Cook and Sheila Lines, following an exceptional CY20 mid-year assessment of personal performance and contribution during the immediate COVID-19 impacts and to address retention risks of key staff (including KMP). 247,209 to be issued as unrestricted shares to Brendon Cook and 128,913 to be issued as unrestricted shares to Sheila Lines, following the usual end-of year assessment. For detail see the introductory paragraphs to the Statutory remuneration disclosure table on page 40.
Components of remunerationThe following table shows the target remuneration mix as a percentage of total remuneration for each of the Executive KMP in CY20. The STI amount reflects the Modified Target10 STI opportunity. The Board determined all STI payments for CY20 would be in the form of shares. The STI amounts were divided by $1.1206, being the Volume Weighted Average Price (VWAP) of the Company’s shares from 1 January 2020 to 30 June 2020, to calculate the number of shares. The LTI amount is based on the total face value of the number of performance rights granted in December 2020 for B Cook and S Lines related to the 2020 LTI program.
CEO STI Performance Scorecard
Goala Weight % STI allocation% Total STI allocation
$ value of Total STI allocation
Maintaining market sharea 40% 146% 42% 158,992
Relative Revenue Drop Througha+b 40% 150% 43% 163,038
Strategic prioritiesa 20% 100% 15% 54,346
a. For detail of these goals see the STI performance conditions in the table on page 44.b. The ‘Relative Revenue Drop Through’ is calculated as being the change in underlying EBITDA (excluding job keeper and other income) of $95m
divided by the change in underlying revenue (excluding other income) of $223m between CY19 and CY20. This resulted in a revenue drop through of 42.7%.
% 10 20 30 40 50 60 70 80 90 100
B COOKFAR – 30% STI – 13% LTI – 27% TERMINATION – 30%
S LINESFAR – 60% STI – 30% LTI – 10%
10 Original target equalled CY19 target. It was reduced by 50% but a smaller second component was added to address exceptional contributions of key staff including KMP. The Modified Target is the sum of those two components.
38

MAR 2018 FEB 2019 MAR 2019 FEB 2020 MAR 2020 FEB 2021 MAR 2021 FEB 2022 MAR 2022 FEB 2023
CFO STI Performance Scorecard
Goala Weight % STI allocation% Total STI allocation
$ value of Total STI allocation
Maintaining market sharea 40% 146% 42% 106,522
Relative Revenue Drop Througha+b 40% 150% 43% 109,232
Strategic prioritiesa 20% 100% 15% 36,411
a. For detail of these goals see the STI performance conditions in the table on page 44.b. The ‘Relative Revenue Drop Through’ is calculated as being the change in underlying EBITDA (excluding job keeper and other income) of $95m
divided by the change in underlying revenue (excluding other income) of $223m between CY19 and CY20. This resulted in a revenue drop through of 42.7%.
Executive Officers LTIThe rights over ordinary shares granted in the period were:
Executive KMP and Officers Plan
Number of rights granted during
2020Vesting
condition Grant dateaFace value at
grant dateaFair value at grant datea Vesting date
Brendon Cook LTI Plan 669,284 FCFROIC
TSR
December 2020b
$750,000 $861,034 February 2023
Sheila Lines LTI Plan 245,404 FCFROIC
TSR
December 2020
$275,000 $315,712 February 2023
Maria Polczynskic
LTI Plan 107,085 FCFROIC
TSR
December 2020
$120,000 $137,765 February 2023
a. The December 2020 disclosed in the table as the Grant date is the legal date the performance rights were granted to employees. The Face value and Fair value are determined as at 25 September 2020 which is the grant date based on accounting standards.
b. For detail see the introductory paragraphs to the Statutory remuneration disclosure table on page 40.c. Maria Polczynski is the Company Secretary.
The table below sets out the details of each tranche of rights issued or approved to be issued to Executive KMP and Officers over the last three years, together with their respective vesting dates.
The 2017 and 2018 grants did not vest as the vesting conditions for both the CAGR EPS growth and Relative TSR were not met. Based on macroeconomic and market conditions, the Company also does not expect the 2019 grant to vest. The Board did not exercise its discretion to alter the performance targets, as it believed that this outcome aligned with shareholder interests.
B COOK – 112,933 S LINES – 45,173Mar 2018 – Feb 2021 Mar 2018 – Feb 2021
B COOK – 192,940 S LINES – 70,745 M POLCZYNSKI – 30,870May 2019 – Feb 2022 Mar 2019 – Feb 2022 Mar 2019 – Feb 2022
B COOK – 669,284 S LINES – 245,404 M POLCZYNSKI – 107,085Dec 2020 – Feb 2023 Dec 2020 – Feb 2023 Dec 2020 – Feb 2023
39

NON-EXECUTIVE DIRECTOR REMUNERATION
Overview & arrangementsThe Board aims to set Non-executive Directors’ remuneration at a level that attracts and retains high calibre and talented Non-executive Directors.
Non-executive Director fees were most recently changed in 2019. Acknowledging the impact of COVID-19 on the Company, all Board members and the significant majority of staff (whose hours were reduced accordingly) volunteered for a 20% reduction in remuneration for 3 months from 18 May to 14 August 2020 and Directors devoted substantially increased Board and Committee time to the Company during CY20.
Due to the increase in Board numbers and the full-year operation of the Technology Committee, established in December 2019, the total fee pool available to meet Board fees increased by $100,000 pa, as approved by shareholders at the 2020 Annual General Meeting.
Following this increase, the total amount provided to all Non-executive Directors for their services as Directors, as fixed by oOh!media, must not exceed $1,400,000 in aggregate in any financial year.
Non-executive Director feesFrom 1 January 2020, the Directors’ annual fee structure is as below:
Chair feea Member feea
Board $245,000b $135,000
Audit, Risk & Compliance Committee $25,000 $12,500
Remuneration & Nomination Committee $20,000 $10,000
Technology Committee $20,000 $10,000
Per diem feec $1,750
a. Inclusive of superannuation.b. The Chair of the Board receives no extra member fees in addition to Chair fee.c. To recognise excessive additional responsibility or time commitments, where relevant. Application of per diem is subject to oOh! Board Chair
and RNC Chair approval. No per diem payments were made in CY20.
STATUTORY REMUNERATION DISCLOSURE TABLES
The following statutory remuneration disclosure table for KMP has been prepared in accordance with accounting standards and the Corporations Act 2001 (Cth) requirements.
Both KMP participated in the Company’s request to employees to reduce FAR to 4 days per week for 3 months in 2020 as part of the Company’s response to the COVID-19 pandemic, reducing accounting expense and statutory disclosed FAR in the period. Brendon Cook stepped down as CEO on 31 December 2020. For accounting expense and therefore statutory remuneration disclosure, Mr Cook’s FAR includes entitlement to 12 months’ notice at 31 December 2020.
The amounts shown relating to share-based remuneration are equal to the accounting expense recognised in oOh!media’s Financial Statements in respect of the LTI rights grant and STI share issue. These amounts do not reflect the actual realisable value received in CY20 year or in future years.
For STI, the amounts disclosed are determined from the amount awarded11 to KMP with respect to the STI by first translating amounts awarded into a number of shares by dividing them by the VWAP of the Company’s shares from 1 January to 30 June 2020. For accounting expense, and therefore statutory remuneration disclosure for KMP, this number of shares is then disclosed at the value of the market price of the Company’s shares at 25 September 2020, when the STI targets and eligibility criteria were approved by the Board and disclosed to KMP. The actual STI amounts received by participants (i.e. the realisable value of the shares awarded) will depend on the share price at the time the shares are received and in the case of the restricted shares, become unrestricted.
Mr Cook’s LTI entitlements disclosed in the table below include an accelerated charge to the Company of $607,305 on termination in relation to the fair value of the performance rights due to vest in 2021, 2022 and 2023. Notwithstanding that disclosure, these rights are not accelerated but remain on-foot to vest or lapse in accordance with the terms on which they were issued. This does not necessarily reflect the value (if any) that Mr Cook may receive for these unvested performance rights, as this will depend on whether the hurdles are achieved and, if they are, the share price at the date of vesting.
REMUNERATION REPORTCONTINUED
11 The amount awarded is the STI allocated ($) on page 38.
40

Statutory Remuneration Disclosure Table – KMP
Share based
Short term Post-
Employment Other
Name Salaryf
STI Cash
BonusNon-
monetary
STI Unrestricted
Shares
STI Restricted
shares LTIa SuperTermination
Benefit Total
Per-formance related %b
Brendon Cooke
2020 825,072 – – 259,570 116,806 821,592 78,382 903,435 3,004,857 40%
2019 767,636 – 48,433 – – 194,361 72,925 – 1,083,354 18%
Joanne Crewes
2020 134,477 – – – – – 13,177 – 147,654 –
2019 132,422 – – – – – 12,580 – 145,002 –
Tony Faurec
2020 212,739 – – – – – 20,970 – 233,709 –
2019 313,748 – – – – – 21,256 – 335,004 –
Debbie Goodind
2020 24,287 – – – – – 2,307 – 26,594 –
2019 157,536 – – – – – 14,966 – 172,502 –
Marco Hellman
2020 108,750 – – – – – – – 108,750 –
2019 – – – – – – – – – –
Philippa Kelly
2020 130,023 – – – – – 11,232 – 141,255 –
2019 35,226 – – – – – 3,346 – 38,572 –
Sheila Lines
2020 449,481 – – 135,359 116,806 81,301 44,587 – 827,535 40%
2019 459,009 – – – – – 24,760 – 527,375 5%
Timothy Miles
2020 154,261 – – – – – – – 154,261 –
2019 104,214 – – – – – – – 104,214 –
Darren Smorgon
2020 134,537 – – – – – 11,841 – 146,378 –
2019 152,970 – – – – – 14,532 – 167,502 –
Andrew Stevens
2020 32,691 – – – – – 3,106 – 35,797 –
2019 – – – – – – – – – –
David Wiadrowski
2020 140,071 – – – – – 13,307 – 153,378 –
2019 10,214 – – – – – 1,021 – 11,769 –
a. Fair value of performance rights related to the LTI grants scheduled to vest in 2021, 2022 and 2023 respectively. The fair value of non-market hurdles has been assessed and adjusted for probability in accordance with accounting standards.
b. Performance-related percentage is calculated by adding cash and share-based remuneration amounts (all of which have performance hurdles that determine payment) and dividing by total remuneration.
c. Tony Faure, Chair of oOh!media, was engaged as a consultant by Junkee Media Pty Limited for $90,000p.a from the period 1 January 2020 to 1 December 2020. Junkee Media Pty Limited is a subsidiary of the Company.
d. Debra Goodin was Lead Independent Director until 24 February 2020 and David Wiadrowski was appointed Lead Independent Director on 25 February 2020. There is no additional remuneration for this role.
e. Brendon Cook retired as Managing Director and CEO effective end of day 31 December 2020. Brendon received $903,453 (which is 12 months FAR) on termination. The reported LTI grants include the full fair-value amount of Mr Cook’s unvested LTI grants scheduled to vest in 2021, 2022 and 2023. These are not accelerated but remain on-foot to vest or lapse in accordance with the terms on which they were issued.
f. As a result of changes in Committee membership during the year, 2 Directors were overpaid by a total of $6,856 which was settled with the individual Directors in February 2021.
41

KMP ShareholdingsThe following table sets out the movement during the reporting period in the number of ordinary shares in oOh!media held directly, indirectly or beneficially, by KMP, including their related parties. These changes are correct as at the date of this Report. The Board has a minimum shareholding policy for the Non-executive Directors requiring them to acquire on market shares totalling a minimum total acquisition cost of one times the base fee that is paid to Non-executive Directors (“Minimum Shareholding”) within three years following the earlier of the date of their appointment or the adoption of the policy (February 2019).
Name of Director
Held at 1 January
2020Granted as
remunerationVesting of
rightsNet change
other
Held at 31 December
2020
Met minimum shareholding requirementa
Required to meet minimum
shareholding (year)
Brendon Cook 1,145,335 – - 690,263 1,835,598 n/a n/a
Joanne Crewes 33,375 – – 38,099 71,474 Yes 2022
Tony Faure 143,188 – – 163,455 306,643 Yes 2022
Debra Goodinb 40,420 – – – – – –
Marco Hellmanc + d - - - 112,951,250 112,951,250 Yes 2023
Philippa Kelly Nil – – 70,000 70,000 No 2022
Sheila Lines 8,570 – – 8,570 8,570 n/a n/a
Timothy Miles 36,000 – – 176,000 212,000 Yes 2023
Darren Smorgon 87,916 – – 85,830 173,746 Yes 2022
Andrew Stevensc - - - 100,000 100,000 No 2023
David Wiadrowski Nil – – 100,000 100,000 No 2022
a. Based on cumulative acquisition cost of Minimum Shareholding shares acquired.b. Debra Goodin retired as a Non-executive Director of the Company on 25 February 2020.c. Marco Hellman and Andrew Stevens were appointed to the Board after 1 January 2020, respectively on 7 April 2020 and 25 September 2020.d. The Directors’ Minimum Shareholding Policy recognises the relationship between Marco Hellman and HMI as a related party relationship for
the purposes of the Policy. Mick is the Founder and Managing Partner of investment management firm, HMI Capital Management, L.P., which is the general partner and investment manager of each of HMI Capital Partners, L.P. and MERCKX Capital Partners, L.P, who collectively hold the largest shareholding in oOh!media. As a result of this relationship Marco Hellman already satisfied the Board policy to acquire the minimum shareholding upon his appointment to the Board.
Executive KMP and Officers: Movement in rights over ordinary shares The following table sets out the movement during the reporting period in the number of rights over ordinary shares in oOh!media held directly, indirectly or beneficially, by KMP or officers in oOh!media, including their related parties.
Executive KMP and Officers
Number held at 1 Jan 2020
Vesting conditions of
those held at 1 Jan 2020
Number granted as
remuneration during 2020
Vesting conditions of
those granted during 2020
Number and value – vested and exercised
Number lapsed during
2020
Held at 31 December
2020 and noted vested
Brendon Cook 416,358 CAGR/EPS TSR
669,284 FCFROIC
TSR
- 110,485 975,157
Sheila Lines 115,918 CAGR/EPS TSR
245,404 FCFROIC
TSR
– - 361,322
Maria Polczynski
30,870 CAGR/EPS TSR
107,085 FCFROIC
TSR
– - 137,955
REMUNERATION REPORTCONTINUED
42

FURTHER INFORMATION
Service agreementsoOh!media has entered into service agreements with each Executive. The Group retains the right to terminate a contract immediately by making payment equal to the agreed number of months’ fixed annual remuneration in lieu of notice, including superannuation plus any statutory entitlements of accrued annual and long service leave.
The service contracts outline the components of compensation but do not prescribe how compensation levels are modified year-to-year. The Remuneration & Nomination Committee (RNC) reviews compensation each year to take into account any changes in scope or nature of role or agreed objectives to determine and recommend any changes in line with the remuneration strategy and principles.
The key conditions of the service agreements of the Executive KMP are set out in the following table.
Notice of termination
NameAgreement
commenced Agreement expires By Company By Employee
Termination payments under the
contract
Brendon Cook 1 Oct 2014 No contractual expiry*
12 months 12 months 12 Months FAR
Sheila Lines 1 Mar 2018 No expiry 6 months 6 months 6 Months FAR
Non-executive Directors’ terms of appointment have no fixed end date, no fixed notice of termination period, nor any agreed termination payments.
All Non-executive Directors may not hold office without re-election beyond the third Annual General Meeting following appointment or the meeting at which they were last elected.
*Change in Chief Executive Officer and Managing Director Brendon Cook retired as Chief Executive Officer and Managing Director effective end of day 31 December 2020. Brendon was paid 12 months FAR as a termination payment and unvested LTI will be treated in the ordinary course, based solely on the extent to which the relevant LTI conditions are met.
Brendon Cook ceased to be a KMP from 31 December 2020.
The Company entered into an agreement with Brendon to provide consulting services as required. The agreement is for a minimum of 12 months at $200,000 p.a. (based on 9 hours of work per week over the 12 months). The initial period is from 1 January to 31 December 2021. Refer to Note 28 Related Parties in the Financial Statements.
Cathy O’Connor commenced as Chief Executive Officer on 1 January 2021 and as Managing Director effective 11 January 2021. On 31 August 2020 the Company announced to the ASX Cathy’s appointment and remuneration terms, including a 12-month notice period. Cathy is a KMP of the Company commencing 1 January 2021.
Use of advisersSince 2016, oOh!media has engaged Aon Hewitt to provide benchmarking data on an ongoing basis. oOh!media subscribes to Aon Hewitt’s Media and General Industry Salary Surveys, as well as participating in its Policy and Practice reviews. This allows oOh!media to access insight, expertise and benchmarking data as they relate to both individual positions and overall remuneration within oOh!media.
During 2020, oOh!media engaged Aon Hewitt to provide benchmarking data for Executive and Non-executive Director remuneration, based on position descriptions provided by the Company and using a peer group of listed company peers of similar medium term revenue and total enterprise value to the Company. The outcomes of the review will be considered in 2021.
The RNC has rights of access to management and to external auditors/resources without management present, and rights to seek explanations and additional information from management, advisers and auditors.
The RNC may seek the advice of the Company’s auditor, solicitor or other independent advisers (including external consultants and specialists) as to any matter pertaining to the powers or duties of the RNC or the responsibilities of the committee, as the RNC may require.
43

Diversity & remunerationoOh!media recognises the value of a diverse and inclusive workforce reflective of the markets where we operate.
Accordingly, the Board and management of oOh!media are focused on diversity, inclusion and belonging as key business goals. oOh!media is committed to addressing and promoting gender equality. Gender pay analysis commenced in 2016 and continues annually, to identify any underlying disparity between male and female pay. oOh!media continues to focus on reducing the pay gap, which has significantly reduced since 2016.
Detailed information on STI and LTI granted in CY2020
Short-term incentive Long-term incentive
Description Annual Incentive issued as equity from a total STI pool that is scaled and based on performance against 3 STI measures.
It consists of two components.
The first component issued as unrestricted shares, following the usual end-of CY20 assessment of personal performance.
The second component: issued as shares subject to 12 months’ restriction on trade12. These shares were issued based on contribution of key staff during the immediate COVID-19 impacts and response and as a staff retention measure.
Award of performance rights with a three-year performance period based on performance against 3 LTI measures.
Conditions/Measures13
3 measures, weighted 40%:40%:20%:
40%: Maintain 2019 OOH market share14: identified as 49.1% + 0.5% in Australia15.
40%: Relative Revenue Drop Through: Change in underlying EBITDA pre-AASB16 from CY19 must be no more than 50% of the change in revenue from CY19.
20%: Achieve strategic priorities:• for cost savings of a minimum of $35 million for
CY20 as compared to original Board approved budget across cost of goods sold (including rent) and operating expenditure.
• employee engagement and wellbeing measures:
– attrition lower than industry – employee engagement survey score of 78%+ – prioritisation of wellbeing, health and safety
during COVID-19 – survey score of 80%+
3 measures, each of equal weighting:• FCF per share of $6.33• ROIC of 12.9% • Relative TSR – top quartile of comparator group.
Performance period
Calendar year 2020. Three calendar years i.e. 1 January 2020 to 31 December 2023.
REMUNERATION REPORTCONTINUED
12 The Board has delegated discretion to the CEO and Chief People and Culture Officer acting jointly to remove the restriction on up to half the restricted shares issued to any employee (excluding KMP) if that is needed to meet a tax liability incurred upon issue of these shares, that must be met before the restriction period expires.
13 See also ‘Amount that can be earned’ for thresholds, stretch targets and rates applying to under/over achievement.14 Figures provided are for Australia which applies to all KMP. For New Zealand based STI participants the baseline is 37.0% +/- 0.5% margin of error.15 Excluding the transport category (principally airports and rail passengers), as oOh!media has a greater exposure than competitors to these
formats which have been most impacted by COVID-19.
44

Short-term incentive Long-term incentive
Amount that can be earned
The total STI allocation pool is absolutely capped for all employees at $10m16.
1. OOH Market share measure17
100% STI pool target is achieved when oOh! maintains by end 2020 its 2019 OOH market share, set at 49.1% +/- 0.5% margin of error for Australia.
There is an uncapped 30% multiplier for each 1% of OOH market share gained above the margin of error.
Market share % end 2020 STI allocation % target
<48.6 Nil.
49.1 + 0.5% 100%
50.1 115%
50.6 130%
51.1 145%
51.6 160%
52.1 175%
The number of performance rights granted was a fixed dollar amount as determined by reference to the face value of the shares on the date of grant.
The number of performance rights granted to each Executive was the LTI value attributable to the individual at 1 January 2020 divided by the 180-trading day VWAP price from 1 January 2020 ($1.1206). Rights were granted for nil consideration.
The number of performance rights granted to each of the KMP was:
KMP No. Face Value Date of grant
Brendon Cook 669,284 $750,000 December 2020
Sheila Lines 245,404 $275,000 December 2020
2. Revenue drop through measure:100% STI pool target is achieved when the change in CY20 Underlying EBITDA pre-AASB16 and excluding JobKeeper/wage subsidies from CY19 EBITDA is no more than 50% of the corresponding CY20 change in revenue from CY19 revenue.
A straight line 10% increase in STI allocation applies for every 1% below a relative 50% change in EBITDA, capped at 150% of STI target. A corresponding reduction applies until relative change exceeds 55%, when no STI allocation will be made.
Relative change % STI allocation % target
>55% Nil.
55% 50%
52.5% 75%
50% 100%
47.5% 125%
45% or less 150%
3. Strategic Priorities measure• A minimum of $35 million savings for CY20 as
compared to original Board approved budget across cost of goods sold (including rent) and operating expenditure.
• Employee wellbeing and engagement, measures achieved.
This measure is allocated 100% on achievement or at nil, with no scaling.
16 This is the value of the allocated STI as explained on page 38, not the accounting expense or final realisable value.17 Figures provided are for Australia which applies to all KMP. For New Zealand based STI participants the baseline is 37.0% +/- 0.5% margin of error.
45

Short-term incentive Long-term incentive
Vesting n/a For the 2020 LTI, granted in 2020, the performance rights will vest, or not, following the publication of the 31 December 2022 audited Financial Statements to the Australian Securities Exchange.
The percentage of performance rights that vest, if any, will be determined at the end of the performance period by reference to the following vesting schedule. One-third of the rights vest upon achieving 100% of each of the FCF hurdle, the ROIC hurdle and the Relative TSR hurdle. Scaling of rights to vest addresses both some underperformance and, for FCF and ROIC, also for overperformance, subject to maximum vesting at 150%.
The threshold and stretch targets for FCF, ROIC and Relative TSR over the performance period are determined by the Board and specified to the participant at the time of grant of the performance rights. Following testing, any rights that do not vest, lapse.
Company’s Free Cash Flow per share (cents/per share) in CY2218 % of rights that vest
<2.14 Nil
2.14 50% of target LTI
2.15 – 6.32 Straight line pro rata vesting between 50% and 100%
6.33 100% of target LTI
6.34 – 11.19 Straight line pro rata vesting between 100% and 150%
11.20 Max 150% of target LTI
Company’s Return on Invested Capital19 % of rights that vest
<10.1% Nil
10.1% 50% of target LTI
10.1%-12.9% Straight line pro rata vesting between 50% and 100%
12.9% 100% of target LTI
12.9%-16.6% Straight line pro rata vesting between 100% and 150%
16.6% Max 150% of target LTI
REMUNERATION REPORTCONTINUED
18 The 100% target represents consensus midpoint for this metric with the upper and lower limits reflecting the spread of sell side analyst forecasts.19 The 100% target represents consensus midpoint for this metric with the upper and lower limits reflecting the spread of sell side analyst forecasts. Invested Capital is the average of the opening and closing balances of invested capital for CY22.
46

Short-term incentive Long-term incentive
Company’s Relative TSR20 % of rights that vest
Less than 50% Relative TSR Nil
50% Relative TSR (threshold performance target)
50%
Between 50% and 75% Relative TSR
Straight line pro rata vesting between 50% and 100%
At or above 75% Relative TSR 100%
Restrictions Participants must be employed and not under notice of resignation or termination at the completion of the performance period (calendar year) to be eligible for an STI award. The Board retains discretion to settle partial or complete payment in the case of good leavers.
Shares issued in respect of the second component of the STI program are subject to a 12-month restriction on trading, which does not apply to shares issued in respect of the first component.
Shares allocated on the vesting of rights after the three-year performance period are not subject to any additional trading restrictions. If an Executive ceases employment with oOh!media before the end of the performance period, their entitlement to rights (if any) will depend on the circumstances of cessation. All rights will lapse in the event of termination for cause. A full or pro rata number of rights may be approved by the Board if an Executive ceases employment by reason of redundancy, ill health, death, or other circumstances approved by the Board including resignation with good leaver status.
Clawback n/a To ensure integrity within the LTI Plan, the Board retains the authority to clawback or adjust LTI awards in circumstances such as fraudulent or dishonest behaviour, gross misconduct, and breach of obligations or material financial misstatement.
REMUNERATION GOVERNANCE
Remuneration & Nomination Committee and Board oversightA Remuneration & Nomination Committee operates under a charter and set of responsibilities approved by the Board. The charter can be found on the Company’s Governance page in the Investors section of the oOh!media website – ww w.oohmedia. com.au/investors/governance and further detail on the RNC’s responsibilities can be found in the Company’s most recent Corporate Governance Statement.
The RNC has been delegated responsibility to review and make recommendations to the Board, with the Board maintaining overall responsibility as outlined below.
The Board maintains overall responsibility for oversight of the Company’s remuneration policy and the principles and processes which give effect to that policy. The Board approves, having regard to the recommendations of the RNC, the:
• Size, composition and criteria for membership of the Board, including review of Board succession plans, performance evaluation and the succession of the Chair, CEO and CFO, as well as Executive performance assessment processes and results;
• Company’s remuneration, recruitment, retention and termination policies and procedures for senior management;• Company’s incentive strategy, performance targets and bonus payments, including major changes and developments to the
Company’s equity incentive plans; and• Effectiveness of the Board Diversity & Inclusion Policy.
20 Shareholder return is calculated as aggregate dividends paid during the 3-year performance period plus the share price movement from the beginning to end of the performance period.
47

48

SUSTAINABILITY REPORT INTRODUCTION
I am pleased to present the 2020 Sustainability Report.
The outcomes of conscious and responsible corporate behaviour are inextricably linked to financial performance and lead to long-term sustainable growth. oOh! has created a framework for overseeing and reporting on long-term sustainable growth. That framework includes:
• operational and governance policies and practices;• risk management processes; and• internal controls.
The framework is considered appropriate for oOh!’s business and designed to promote sustainable and ethical behaviour.
While oOh! continues to work within the above framework, in 2020 priorities were adjusted to respond to risks and issues posed by COVID-19 to ensure the ongoing health and safety of our people together with the sustainability of our operations and business recovery. A number of projects scheduled to be completed in 2020 remain ongoing.
This Sustainability Report outlines oOh!’s core sustainability activities between 1 January 2020 and 31 December 2020 (the reporting period).
Tony Faure Chair
March 23, 2021, Sydney
49

SUSTAINABILITY REPORT CONTINUED
CURRENCY AND QUESTIONS
This Sustainability Report is current as at 23 March 2021 (except as specified otherwise) and has been approved by the Board. Any questions regarding this report can be directed to the Company Secretary of oOh!media Limited.
ORGANISATIONAL PROFILE
oOh!media Limited (oOh!), a publicly listed company on the Australia Securities Exchange (ASX), operates across Australia and New Zealand, with headquarters located in North Sydney, NSW, Australia.
oOh! provides its products and services for the benefit of both media agencies and clients wishing to advertise their own products and services.
As at 31 December 2020, oOh! has 784 permanent employees and 32 casual employees working across Australia and New Zealand, none are covered by collective bargaining agreements.
In more detail:
Total number of employees by contract and gender
Employment arrangement Female Male Total
Permanent 373 411 784
Casual 15 17 32
Fixed Term Contractors 19 22 41
Board (Non-executive Directors only) 2 6 8
Total Workforce 409 456 865
Number of permanent employees by employment type and gender
Employment type Female Male Total
Full time 337 401 738
Part time 36 10 46
Total 373 411 784
Total workforce by region and gender
Location Female Male Total
New South Wales 271 261 532
Australian Capital Territory 0 2 2
Victoria 72 101 173
Queensland 21 31 52
South Australia 9 14 23
Western Australia 6 15 21
New Zealand 30 31 61
Other 0 1 1
Total Workforce 409 456 865
50
oOh!’s supply chain can be broken down into the following categories:
Commercial: oOh! engages with commercial partners to secure properties, generally by exclusive rights under lease or licence, on which oOh! can in turn install advertising media (and associated infrastructure) for sale to third parties. This involves all parties referred to in the overview of principal activities on page 21 of the Directors’ Report. The majority of these activities are operated from within oOh!.
Operations: oOh!’s operations include the procurement, installation, monitoring and maintenance of manufactured goods including digital screens and classic faces and the supporting structures, the printing of classic skins, creation and procurement of content, data and insights, the development and maintenance of information technology systems and processes and the management of all workplace health, safety and environmental elements associated with same. The majority of these activities are led by oOh! employees with support from specialist manufacturers, installers and service providers.
Customer: oOh! has a dedicated customer team to assist media agencies and advertisers source the most effective and impactful locations for their advertising and engagement needs.
The majority of these activities are operated by oOh! employees.
Support services: oOh! operates a suite of support services to ensure quality and risk management and effective governance. These include human resources, finance and legal functions. The majority of these activities are undertaken by oOh! employees.
No significant changes to the supply chain have occurred during the reporting period.
oOh! was also a member of the following associations and organisations in the reporting period:
• Outdoor Media Association (Australia);
• Outdoor Media Association of New Zealand;
• Founding member and shareholder of Measurement of Outdoor Visibility and Exposure (MOVE);
• Media Federation of Australia (MFA) and Next Generation (ngen);
• Association for Data-driven Marketing and Advertising (ADMA);
• Australian Association of National Advertisers (AANA);
• Property Council of Australia (PCA); and• The World Out of Home Organization
(previously FEPE). oOh!’s former CEO, Brendon Cook*, holds the role of Vice President.
* Brendon Cook retired as oOh! CEO effective end of day 31 December 2020.
STAKEHOLDERS
oOh!’s stakeholders are an essential part of oOh!’s operations, and planning and engagement with stakeholders is a key element of effective risk management and opportunity development. The following is a list of stakeholders that oOh! believes have the greatest potential impact on sustainability risks.
Employees: oOh!’s people are our greatest asset and our culture is a distinct competitive advantage. Our cultural aim is to create a thriving workplace where people find meaning and belonging and can contribute to something bigger and better. We want to build an organisation of talented people who implicitly do the right thing for the Company and its customers, and ensure our values, processes, systems, symbols and our leaders support and reward the right behaviours.
Our People and Culture team partners with the business to provide strategic and operational people support, with specialised resources ensuring we have the right initiatives in place to attract, engage, retain, develop, recognise, reward and communicate to our talent.
An employee’s experience with oOh! begins with our mobile-based onboarding and induction program, which ensures new employees are well equipped when they start with us. We measure their ongoing experience through regular one-on-one feedback and employee surveys at multiple stages during their first 12 months.
All employees set goals with their managers which are linked to the Company’s strategic priorities and aspiration and are reviewed quarterly. Regular conversations between managers and employees enables ongoing feedback to ensure effective delivery against goals with 360º feedback encouraged twice yearly through our Impact & Growth platform. Beyond their goals, employees are also assessed on their contribution to their team and the wider business, in terms of their outputs, influence and core behaviours aligned to our values.
Through aligning employees’ efforts, creating an exceptional experience and continuing to evolve our culture to meet our long-term strategy, we are building a successful and sustainable business.
Investors: oOh! communicates important information regularly to investors through a range of forums and publications in accordance with oOh!’s Continuous Disclosure Policy and Communication Strategy as further detailed in the Investor Relations section of the Corporate Governance Statement.
oOh!’s stakeholders are an essential part of oOh!’s operations, and planning and engagement with
stakeholders is a key element of effective risk management and opportunity development.
51

An overview of oOh!’s profile, businesses and corporate governance framework is also available on oOh!’s website at http://investors.oohmedia. com.au. oOh!’s investor relations program is led by the CEO and CFO with support from an external investor relations consultant.
The Chair of the Board and the Chair of the Remuneration & Nomination Committee also make themselves available for meetings with investors, analysts and proxy advisers over the year to ensure two-way engagement.
Commercial partners: oOh! is dependent on relationships with concession holders to manage its lease and licence portfolio. oOh! has deep experience working with commercial partners, with dedicated account managers to facilitate meaningful and successful relationship outcomes, particularly when managing risks in the portfolio environment such as safety, data protection and advertising regulatory compliance.
Commercial partners can be private landlords, government bodies, local councils and regulatory authorities.
Service providers: oOh! selectively secures the services of specialists where required. Service providers are required to enter into, and comply with oOh!’s standard WHSE Agreement to ensure oOh!’s standards are maintained across all environments. Safety management
plans are required by service providers, on the basis of the services provided. oOh! and the respective service providers review performance during the relationship and at times of contract review.
Media agencies: oOh! is dependent on relationships with media agencies to represent oOh!’s products and services to their advertiser clients. oOh! has invested in data and insights to give agencies a greater understanding of the performance of advertiser client campaigns using oOh!’s unique portfolio, and the opportunities presented with technological advancements.
Advertisers: oOh! is also dependent on relationships with customers who advertise their goods and services. Whilst it is a smaller proportion of revenue than that sourced through media agencies, oOh!’s digital footprint and operational support has allowed advertisers to engage directly for bespoke campaigns.
Government and local councils: Planning laws continue to develop alongside commercial property opportunities and technological advancements. Similarly, federal, state and local safety regulations and advertising standards develop alongside community expectations. oOh! will continue to engage directly and through industry with regulatory bodies to ensure Out of Home advertising activity is
of high quality and conducted with safety as an absolute priority for all stakeholders.
Communities: oOh! is passionate about our community and our ability to operate in a way that benefits the wider population. Where required, oOh! engages with individuals, business alliances and resident groups to seek feedback on proposed development activities. oOh! also regularly engages specialists to provide assessments of the impact of its proposed activities on local community environments, particularly regarding any potential heritage, lighting or traffic issues.
ETHICS & INTEGRITY
oOh! has 3 core values:
• Bold Dreams: We dream big and inspire others with our ideas and passion. We are bold and push boundaries to create “Unmissable” moments.
• Big Impact: We bring our best selves to work, operating ethically and responsibly, to make everything we do meaningful for our audiences.
• Deep Connection: We align as one team with shared goals and always look after our work mates like family.
oOh!’s Values Statement is available on its investors website http://investors.oohmedia. com.au.
SUSTAINABILITY REPORT CONTINUED
52
The values include actionable behaviours that sit below each to ensure clarity on what is required to live them day to day. The values are also represented in oOh!’s policies, including the Code of Conduct.
The Code of Conduct is designed to ensure that oOh! and all people employed, contracted by, associated with, or acting on behalf of oOh!, maintain a reputation for the highest standards of business conduct, professionalism and integrity. The key components of the Code of Conduct include:
• Our actions must be governed by the highest standards of integrity and fairness;
• Our decisions must be made in accordance with the spirit and letter of applicable laws; and
• Our business must be conducted honestly and ethically, with our best skills and judgment, and for the benefit of customers, employees, shareholders and oOh! alike.
oOh! supports these policies with a Whistleblower Policy, most recently updated in December 2019. This together with the Code of Conduct, sets out the process for seeking advice on ethical and lawful behaviour, and for reporting concerns about unethical or unlawful behaviour. Employees have access to an in-house legal team comprising qualified solicitors to facilitate understanding of legal requirements. Concerns can be reported to key management including the CEO, CFO, Chief People and Culture Officer or General Counsel, the Audit, Risk & Compliance Committee, or where required, to an independent external whistleblower service at no cost to the employee and with the guarantee of anonymity.
KEY IMPACTS, RISKS & OPPORTUNITIES
The most relevant risks to the business achieving its operational and financial targets are captured under risk management in the Directors’ Report on pages 21 to 24 of the Annual Report. The summary below describes the key sustainability risks and associated challenges and opportunities, together with mitigation strategies and actions undertaken by the Company.
There continues to be change with technological advancement, regulatory development and innovation in our competitive environment. oOh!
implements strategies that allow it to take advantage of these challenges for long-term business growth. It is this approach that has historically resulted in growth and allowed the Company to transform from an Out of Home media property business to a location-based, digitally-enabled public space media business delivering industry leading insights and technological advancements.
In 2020 the Company, like all other businesses, focused on mitigating the risks and impacts of COVID-19. The Company expects the impacts of COVID-19 to continue into 2021 and implemented decisive actions throughout 2020 to ensure oOh! is well positioned in 2021 and beyond to respond to the ongoing impacts of COVID-19.
oOh! has collated the risks that reflect oOh!’s significant economic, environmental and social impacts or those elements that substantively influence the assessments and decisions of oOh!’s stakeholders. In this Sustainability Report, these have been captured under four headings:
• People: maintaining an innovative, engaged and safe workforce is essential for oOh!’s continued performance;
• Operations, economic impacts and governance: oOh! is committed to acting professionally, fairly and with integrity in all activities and with all stakeholders;
• Environment and sustainability: managing the business in an environmentally responsible manner, whilst considering, protecting and caring for the environment, now and for the future; and
• Community: consulting with local communities as part of our everyday business activities, and working with community partners to invest time, resources and money where we can make a positive difference.
There are a number of governance mechanisms in place to manage these risks:
• Capable people: Senior Management and dedicated teams trained in relevant regulatory and legal requirements, to specialist internal and external advisers across the areas of finance, law, WSE and procurement;
• Systems and processes: a framework of policies, systems, processes and training to guide the business; and
• Documentation: standard template contracts to ensure compliance to standards and allocate risk appropriately amongst parties.
PEOPLE
oOh! is committed to being an employer of choice through our exceptional culture and leading people practices. In 2020, with COVID-19 impacting Australian and New Zealand businesses, the focus was on keeping our people safe, both in the physical oOh! locations and whilst working remotely.
Beyond the foundation of providing a safe working environment for all people across our business, we aim to engage, develop and support our people to be their best self and to contribute fully in their careers and life as a whole. As innovation leaders, we recognise that our differences as individuals are key to our success and promote diversity, inclusion and belonging as a core operating principle.
Responding to COVID-19: oOh! transitioned our office-based employees to remote and flexible working arrangements in 2020 as a response to COVID-19 restrictions.
A COVID-19 business continuity team consisting of the Executives, internal communications and WSE was established with the following objectives:
• Maintain oversight of Australian and New Zealand government bodies, state health authorities as well as state safety regulators for advice and guidance; and
• Establish the best response to protect the health and wellbeing of our employees and the longevity of our operations.
The WSE team provided regular updates to ensure employees:
• Were set up and working effectively from home, including welfare calls as necessary;
• Received timely communications on locality specific instructions; and
• Staggered return to work plans developed to ensure employees were safe as they were permitted to return to working in oOh! offices (at 31 December 2020 there were still several locations where returning to work in the office was under strict limitations due to government regulations).
53

In 2020 many oOh! field and manufacturing employees, where appropriate, were designated as essential workers to maintain public infrastructure and produce business-specific signage as well as community announcements for COVID-19 messaging. The WSE team in consultation with the business leaders and operations employees, put in place and monitored processes to provide for and promote employee safety while performing essential tasks.
More generally, where roles permitted, employees have previously had access to flexible working arrangements, either on an ad hoc basis or through a formal arrangement. These arrangements became more informal in 2020 as a result of COVID-19 to allow employees to find the appropriate balance between working from home and starting to relocate back into the office towards the end of the year. The key message in 2021 is for the office to be the primary working location, allowing employees to maintain a level of flexibility.
Safety: oOh! strives to create a safe and healthy workplace for all employees, contractors and visitors. This includes psychological safety as much as physical safety.
oOh! maintains high standards in WSE for its outdoor operations, warehouse, printing and office environments and has a comprehensive WSE management framework and strategic plan in place.
• A Head of Wellbeing, Safety & Environment commenced with oOh! in late 2019 to prioritise and co-ordinate the improvement of WSE systems and practices, including opportunities identified in an internal audit report conducted earlier in 2019 on oOh!’s WHS framework and reporting processes. A review of these opportunities at the end of the year, confirmed that all but one of the actions were completed in 2020, in addition to leading the business response for COVID-19.
• In mid-2020, a Wellbeing, Safety & Environment Coordinator commenced, bringing an experienced injury management skillset to the business.
• Ongoing commitment to further developing the comprehensive framework, policies and guidance notes for WSE that aligns with the Corporate Governance Framework as outlined by the legal department.
• A WHS Committee with representatives from across the business meets monthly to review the safety framework, initiatives, incidents, learnings, communication and training programs.
• Accreditation was upgraded from the AS/NZS 4801:2015 standard to ISO 45001-2018 Occupational Health and Safety Management System in late 2019. Certification to the system was reconfirmed in 2020.
• Regular reporting of WSE initiatives, issues and opportunities to the Executives, the Audit, Risk & Compliance Committee and the Board.
A review of safety data in 2020 indicates:
• Total reported incident numbers in 2020, compared with 2019 showed a 20% increase in reported numbers (115 vs 96). This is attributed to the work the WSE team has done to both simplify the reporting process and engage with business leaders and employees on the importance of reporting not just the incidents that result in personal injury or property damage, but also the near miss and hazard events.
• Whilst the number of motor vehicle accidents remained the same between the two years, the largest increases in incidents related to slips, manual handling and mental stress; the latter being a possible direct correlation to the effect COVID-19 has had on our work force.
• Comparison of incident data over several years shows that while the number of incidents reported in primarily office-based operations has remained steady, there was a marked increase in numbers following the acquisition of Adshel in late 2018 for field-related events resulting in injuries and property damage. This is reflective of the heightened risk with field operatives working in public spaces, the tasks performed, equipment handled, and the variable hours worked, as well as the percentage of employees working in that higher risk environment increasing.
oOh! did not receive any fines for non-compliance with safety laws and regulations over the reporting period.
Psychological safety: oOh! recognises the increasing impact of mental health issues in the workplace and strives to create an environment where all employees see the workplace as contributing positively to their mental health.
Support is available to employees and families through an independently run Employee Assistance Program (EAP). The service, which is no cost to the employee and provides a guarantee of anonymity, is proactively and reactively communicated to employees regularly, particularly during times of major change or potentially stressful events like COVID-19 presented in 2020.
As the workforce transitioned to remote working due to COVID-19, the Company put in place additional processes to support our people’s mental health, including regular communications and invitations to participate in webinars and information sessions involving our EAP provider. The Company understands that COVID-19 impacted all staff differently and encouraged dialogue with managers and use of EAP.
In May 2020, a pulse survey was launched to understand how our people were coping with remote work, supporting their own mental health and wellbeing, and perceptions of oOh!s response to the pandemic. The statement “oOh! has demonstrated that employee wellbeing, health and safety is a priority during this time” was posed and received a score of 94% agree or strongly agree.
“oOh! has effective processes and controls in place to ensure my health and safety at work” was also presented and received a score of 84%, showing a very high level of confidence in our WSE team.
Throughout the year, the WSE team collaborated with the People and Culture Business Partners, Executive Leaders and the EAP provider to facilitate ‘Ask Me Anything’ panel discussions within business channels focusing on the impact of COVID-19 on mental health and wellbeing, and the expectations and provisions of the business to support this.
The employee-led initiative called TLC that commenced in 2019 to help drive awareness of mental health, destigmatise mental health issues and support people to talk about their mental health with trusted colleagues or leaders, continued through 2020 with key messaging on mental health and wellbeing through COVID-19.
In response to COVID-19, the plans for Mental Health First Aid training were cancelled in early 2020. In October & November 2020, as the business returned to work, an initial Mental Health First Aid session was arranged to gauge interest and trial a combination of self-paced e-learning/virtual sessions. The feedback has been extremely positive, with further sessions to run into 2021.
SUSTAINABILITY REPORT CONTINUED
54

At an industry level, oOh! was a founding member of the Mentally Healthy Change Group, a group of industry leaders who, in 2019, introduced the first ever minimum standards for mental health in the media industry. Through 2020, a number of oOh! employees contributed to an ebook publication designed in collaboration with a number of partners and led by Heart on my Sleeve, on how the pandemic affected people so differently.
Talent acquisition, management & retention: oOh! has a talent acquisition and management process to maximise our ability to attract and retain the best talent for the benefit of oOh! and its stakeholders. oOh! also supports new employees with a mobile onboarding experience which commences 30 days prior to a new employee commencing and continues until the end of their first 12 months.
oOh! has an external careers website and talent community where existing and potential employees can submit their profiles and be considered for future opportunities. In 2020 our top sources of external appointments were directly sourced through a combination of job sites, recruitment agencies and employee referrals. Candidate experience continues to be a huge focus, ensuring we communicate, engage and excite our candidates throughout the recruitment experience as evidenced by being a multi-year winner of the APAC Candidate Experience Awards as voted by our candidates (last won in 2019).
During the period, overall employee turnover for our permanent workforce was 20% which was in line with the previous reporting year. Voluntary turnover was 14% which represented a 2% increase on the prior reporting period in 2019. These retention results are a positive confirmation of oOh!’s investment in this area.
COVID-19 impacted oOh!’s talent acquisition, management and retention processes in 2020 particularly in the second and third quarters of the year. To reduce salary costs, in March the Company put in place measures to reduce non-critical new hires, with all new roles requiring Executive approval.
People development: oOh! has a comprehensive people development agenda, and over the reporting period activities relating to culture and engagement, leadership, employee development and performance were undertaken.
• Supporting the innovative culture of the Company through the physical environment, the business continued a multi-year facilities refresh, introducing collaborative, flexible and future-focused workplaces aligned with the principles of activity-based working. In Q4 2020, the North Sydney offices began the move into new state of the art offices. In Q1 2021 the remainder of our North Sydney and
Surry Hills (Junkee) locations will have also moved into the new office. The Melbourne office is set to relocate into their new offices through Q1-Q2 2021.
• Facilitating the refresh and relaunch of the oOh! business strategy a variety of methods (workshops, goal setting, communications) were used to increase alignment, collaboration and results orientation across the business.
• Driving continuous improvement in our leadership capability. Due to the travel restrictions and social distancing restrictions imposed with COVID-19, our “LEAD 2020 – 2021” leadership development program was put on hold. Our leadership group received alternate leadership training focused on remote working, which included virtual sessions on leading teams remotely, enhancing employee motivation while working from home and increasing resilience during uncertain times.
• Maintaining a talent management program, ensuring we have the right people to meet our longer-term strategy and that we deploy our best people into roles that can maximise their contribution to the business. In 2020 a talent review was conducted focusing on our senior leadership cohort, with a broader talent review to occur in May 2021.
oOh! has a comprehensive people development agenda, and over the reporting period activities relating
to culture and engagement, leadership, employee development and performance were undertaken.
55

Diversity, inclusion & belonging: oOh! is committed to unlocking the innovative potential of the Company by creating and supporting an environment where all ideas are heard, inspiring our people to harness their creativity to generate value and growth in an inclusive and diverse culture. Further details of oOh!’s diversity, inclusion and belonging framework are set out below.
oOh! committed to an updated three-year Diversity, Inclusion and Belonging strategy in 2019. The Company is committed to this strategy and reviewed processes and systems throughout 2020 to ensure they align to the strategy and are up to date with expectations. As at the end of 2020:
• Women in people leadership roles across the business comprise 39%.• 93% of oOh! employees returned from parental leave in 2020.• Women represented 25% of Non-executive Directors on the Board. As of January 2021, 33% of all Directors are female.
The Company refreshed its measurable diversity objectives to ensure continued focus, progress and alignment with the overall Diversity, Inclusion and Belonging strategy as shown below.
Focus Measurable Objectivesa Progress at 31 December 2020
Balanced Teams
Increase the percentage of women in leadership roles
NED representation 50/50 Non-executive Directors female representation is 25%.b
ELT representation – recruitment to prioritise female candidates
New female CEO recruited August 2020 to commence 1 January 2021.
Pending the commencement of the new CEO, Executive leadership female representation was 11.1%.c
Key leadership representation 50/50 Senior leadership female representation is 40%d
Manager representation 50/50 Overall manager female representation is 39%e
Succession plan representation 50/50 Reprioritised to 2021 – due to COVID-19 disruption.
Provide opportunity for underrepresented groups
Create a Reconciliation Action Plan that includes indigenous employment initiatives
Reconciliation Action Plan Working Group established to develop a Reconciliation Action Plan.
Continue targeted leadership development for women
Continue (inclusive) Women in Leadership program
Reprioritised to 2021, due to COVID-19 disruption.
50% female representation in LEADf program LEAD program not run in 2020 due to COVID-19 disruption.
Enrolments at 31 Dec 2020 for 2021 program stood at 41% women, with further places being considered to reflect staff changes.
Inclusion and Belonging
Demonstrate commitment to inclusive behavioural practices
Formal training, workshops and direct coaching on inclusive mindsets and belonging
Incorporated commitment to inclusive behavioural practices into the LEAD training program.
Continue unconscious bias training Decision taken in November 2020 to remove this item, in light of emerging professional questioning of its effectiveness
Leadership development (through LEAD, development plans, ELT People Plans)
Reprioritised to 2021, due to COVID-19 impacts on F2F development sessions
SUSTAINABILITY REPORT CONTINUED
56

Focus Measurable Objectivesa Progress at 31 December 2020
Demonstrate appreciation for all employees regardless of gender, cultural identity, age, sexual orientation, disability, work style or approach
Celebrate the diversity of the company and showcase contributions from diverse employee base at internal events and customer events.
Reprioritised to 2021 due to COVID-19 restrictions on events.
Create DIBs working groups to address key focus areas: reflecting and leading our customers, inclusion for all employees, increasing capability in behaviours that promote belonging
oOh!’s Reconciliation Action Plan Working Group launched
Create an environment to ensure all employees can thrive
Refine and embed flexible working practices Flexible working practices were extended during and after COVID-19 pandemic and are in place for all roles where flexible working is operationally feasible.
A new workplace Flexibility & Activity Based Working Practice Notice was introduced in November 2020.
Continue annual gender pay equity and performance review
Annual salary review conducted in early 2020 resulted in women receiving:
• 56% of salary increases > 5% and• 47.5% of increases >10%.
A remuneration benchmarking process was started and substantially progressed by end 2020 and subsequently implemented effective 1 January 2021, with women receiving an average increase of 9.3% compared to 8.5% for men.
Introduce oOh!WOW design thinking coaching, behaviours and training
Reprioritised to 2021 due to COVID-19 impacts.
Benchmark and act on belonging & psychological safety feedback via culture survey
Inclusion survey developed in 2020 for 2021 launch, to understand current levels of psychological safety.
September 2020 Pulse Survey results noted:
• 79% of people agree or strongly agree with the statement “I feel like I belong at oOh!”
• 86% of people agree or strongly agree with the statement ”My manager is checking in regularly enough with how I am doing (not just work related)”
May 2020 Pulse Survey results noted:
• 92% of people agree or strongly agree with the statement ”My manager genuinely cares about my wellbeing, health and safety”
57

Focus Measurable Objectivesa Progress at 31 December 2020
Process and Policies
Ensure robust measurement, benchmarking and visibility of Diversity, Inclusion and Belonging
Create and publish a Diversity, Inclusion and Belonging statement and Reconciliation Action Plan for oOh! in line with 2019 results
Diversity, Inclusion and Belonging Policy reviewed in 2020.
Reconciliation Action Plan Working Group established in 2020.
Maintain competitive parental leave and flexible working policies
External benchmarkingg indicated oOh! has maintained competitive parental leave and flexible working position.
oOh! offers primary carers 12 weeks paid parental leave, 2 weeks return to work bonus and a further 2 weeks bonus annual leave (after 3 months of returning to work) and $1,000 worth of vouchers.
Equity in parental leave: increase % of men taking primary carer leave, maintain robust stay in touch programs, ensure return to meaningful roles
93% of team members returned from parental leave in 2020. The practice is for those returning to return to the same or equivalent roles, unless requesting reduced roles.
During 2020 one male member of staff took up primary carer parental leave.
Review progress towards DIBs priorities and measurable objectives bi-annually
One review carried out in 2020, due to COVID-19 business disruption.
Identify, implement and measure outcomes on diversity priorities by team
Reprioritised to 2022, following impact of COVID-19.
a These Diversity Measurable Objectives were originally set in 2018 and refreshed in February 2019. This table measures progress against the refreshed Measurable Objectives. The Measurable Objectives were reviewed again in November 2020, after the impact of COVID-19. At that time a previously included measure concerning unconscious bias training was removed, in light of emerging professional questioning of its effectiveness.
b The Board increased to 9 Directors during 2020 and one female Non-executive Director, Debbie Goodin, retired. This resulted in a decrease in the proportion of female Non-executive Directors from a peak of 43% in Sept 2019.
c From 1 January 2021, female Executive representation is 22.2%. The figures reflect also that the Executive increased to from 9 to 10 during 2020.d This is an increased from 35% at end 2019.e This is a decrease compared to 43% at end 2019. Reasons for this are under investigation in 2021 and may in part be due to change in key
leadership female representation.f The LEAD program is aimed at developing leadership capability for our Key Leadership Group.g WGEA website refers to primary carers’ leave data (2018) which shows that in 2017-18, the average length of paid primary carer’s leave was
10.3 weeks across all industries
oOh! did not receive any fines or grievances for non-compliance with discrimination laws and regulations over the reporting period.
Parental leave: Primary caregivers can access 16 weeks’ parental leave as a combination of upfront payments, return to work bonuses and additional leave, and receive $1,000 worth of vouchers to put towards essential services upon commencing parental leave. Combined with “keep in touch” and “return to work” programs, this helped to ensure high rates of employees returning from parental leave.
Reconciliation Action Plan: In 2020 oOh! launched its Reconciliation Action Plan Working Group to support our Aboriginal and Torres Strait Islander employees (present and future), communities, vendors/suppliers and clients. The group has committed to a Reflect Reconciliation Action plan, which scopes our impact as a business and provides a pathway forward to engage with our stakeholders in ways that progress reconciliation.
SUSTAINABILITY REPORT CONTINUED
58

OPERATIONS, ECONOMIC IMPACTS & GOVERNANCE
oOh! conducts its business in an honest and ethical manner. We believe a strong commitment to corporate governance helps build an environment of trust, transparency and accountability. Not only does this align with our strategy to build a sustainable business, but it also delivers long-term value for our shareholders.
Throughout 2020 oOh! took measures to mitigate the financial impacts of COVID-19 and position the Company to respond to the ongoing impacts of the pandemic.
Suppliers: In selecting suppliers, oOh! considers as appropriate issues of capability, quality, innovation, good governance and ethical behaviour and regulatory compliant work practices. Depending on the scope of works being undertaken, local suppliers may be required to provide a detailed safety management plan as well as agree to oOh!’s WHS Agreement stipulating the minimum safety standards. Further to this, following a risk assessment of the works being completed, the supplier may be audited to provide an additional element of assurance with their work practices.
Offshore suppliers may be subjected to additional due diligence, whether requiring compliance with Australian standards, demonstrating good governance regarding privacy and people management, or hosting oOh! for site inspections of manufacturing and distribution facilities. No negative labour or environmental practices have been identified with any current suppliers in oOh!’s domestic or international supply chains.
Since the introduction of specific anti-modern slavery laws in Australia which apply to oOh! from 1 January 2020, oOh! has been enhancing its supply chain due diligence and requirements, focussing on high risk products and countries of origin. The Company will publish its first Modern Slavery Statement as required in H1 2021.
Responding to COVID-19: oOh!s technology infrastructure maturity enabled a relatively smooth transition to working from home at scale. The technology solutions already in place provided for an effective transition, including secure remote access to core business systems and collaboration platforms. IT support efforts in the early days and weeks of the government restrictions were aimed at supporting an orderly transition. It also enabled oOh! to focus on increased security and network
performance monitoring as well as more proactive additional contingency action, rather than excessive and reactive end user support. Being aware of the increased threat landscape during COVID-19, oOh! increased user training and communications around targeted phishing and dangerous behaviours on home and public networks, to help minimise information security risk.
Data protection & privacy management: A core feature of oOh!’s strategy is the use of data to develop insights for the benefit of advertisers. The bulk of data used is de-identified and anonymous, however we also manage limited personal information from time-to-time. In all cases, oOh! takes data and privacy management obligations seriously and has an established governance and data management framework to ensure application of proper industry practices in ingesting, processing, storing and purging data, including:• “Acceptable Encryption” Policies, being
industry standard encryption policies;• Data protection policies mandating
standards for encryption in transit and at rest;
• Extensive monitoring of all critical systems;
• Offsite encrypted backups;• Implementation of multiple audit
points to cover full stages of data lifecycles;
• Privacy policies for oOh!’s general operations, and co-operative policies where collecting information
on behalf of an advertiser or commercial partner;
• Privacy management plans with suppliers of data;
• Review of disclosures on personal information collection by the oOh! legal team;
• A structured mandatory data breach reporting process;
• Regular external penetration testing and auditing; and
• Best practice cyber security controls framework aligned with the ISO 27001:2013 standard.
Compliance with regulations & standards: oOh! operates within a number of regulatory and industry self-regulatory frameworks. In addition to those applied to most businesses, all content displayed via oOh! assets is governed in Australia by the standards set by the Ad Standards, AANA, and in New Zealand by the Advertising Standards Authority. oOh! is diligent in adhering to these standards, providing clients and employees with Advertising Standard Guidelines as well as having developed its own Copy Advice Committee for the review of creative content. oOh! has a role which is to specifically engage more closely with regulators and to oversee compliance with these regulations and standards.
oOh! is a foundation member of the Out of Home industry body, the Outdoor Media Association (OMA), which is a self-regulating body to whose standards oOh! adheres.
59

oOh! is focused on continued monitoring of the potential impacts of climate change on the business through further assessment of environmental activities and impacts, risk identification and data collection to review and understand our carbon footprint. This will be an ongoing focus of our Sustainability Agenda for future reports.
In the meantime, oOh! maintains a continuous improvement objective to reduce carbon emissions from activities.
For the energy data that has been captured for the oOh! facilities across Australia and New Zealand in 2019 and 2020, the Cactus manufacturing site is the largest user of electricity, followed by the North Sydney and St Kilda offices. As the data becomes more reliable in 2021, close attention will be paid to see how the relocations of both offices to more environmentally aware building operations may be identified. Further detail on the environmental ratings and fit out inclusions of the new buildings is included on page 61.
The New Zealand depot has installed two 30,000 litre rain capture tanks to replenish vehicle water tanks used for cleaning public infrastructure e.g. bus shelters, therefore saving on the need to deionise water on site.
Vehicles: The rollout of replacement vehicles continued in 2020 to more efficient Adblue-type vehicles, a product that reduces CO2 emissions. These new vehicles include telematics that allow for monitoring of vehicle use (e.g. speed, handling, maintenance) that provide opportunity to improve vehicle wear and tear, which in turn reduces CO2 emissions. Work continues on the planning of vehicle routing in the Commute business where possible, to potentially reduce kilometres travelled and, in turn, result in fuel reductions and CO2 emissions.
We started receiving reports from our Fleet Partner in 2020 to help us understand the fuel usage across the fleet, as well as looking at the telemetrics on the vehicle including kilometres travelled. This review will continue in 2021 to understand trends or hotspots, which will allow us to then understand if this is an area where we can set objectives for future years.
Commercial development: All new commercial developments and digitisation projects comply with environmental and planning legislation of the relevant state or council jurisdiction, supported by a Statement of Environmental Effects (or equivalent).
Corporate governance framework: The Board has created a framework for overseeing oOh!’s corporate governance, supported by core functions and registers across the business. oOh! regularly reviews its corporate governance framework to ensure it remains up to date for evolving business operations and external expectations.
Corporate Governance Statement: oOh! has prepared a Corporate Governance Statement for the reporting period, following the fourth edition of the ASX Corporate Governance Council (ASX CGC) Principles & Recommendations. The Corporate Governance Statement is available on the oOh! website under “Governance”.
ENVIRONMENT & SUSTAINABILITY
oOh! is committed to managing its business in an environmentally responsible manner and believes that caring for and considering the environment, now and for the future, is crucial to our continued success.
Management: With the time and scale of the business response to COVID-19 a number of the key environmental objectives for 2020 were not achieved and have been deferred into 2021; namely the commencement of a Sustainability Committee and while the tracking of energy use and volumes of waste for 2019/2020 have commenced, the process has not been finalised for all the Australian/New Zealand operations.
Climate change: oOh! acknowledges climate-related risks and opportunities within its business operations. The display of outdoor advertising consumes physical resources as well as energy, and therefore oOh! is indirectly exposed to carbon emission regulations which may impact input pricing and further regulation in our business.
However, oOh! has minimum carbon or energy intensive business activities and is a relatively low emitter of greenhouse gas emissions compared to other activities or other industries. In general, oOh!’s activities and geographic distribution present limited exposure to potential costs associated with carbon pricing or regulatory caps.
SUSTAINABILITY REPORT CONTINUED
oOh! is committed to managing its business in an environmentally responsible manner and believes that caring for and considering the environment, now and for the future,
is crucial to our continued success.
60

Exact guidelines are followed to prepare an internal assessment where the project may be an exempt development in agreement with the lease partner (i.e. no requirement to submit a development application) pending road authority approval, where required, which sets out the current operational state of our assets and/or details any planning or environmental consequences of the proposed future development. This process ensures the consent authority can fully consider any impact/s attributable to the development proposal prior to making its determination.
We aim to incorporate environmentally friendly or sustainable products into all our commercial developments. This includes LED lighting on classic billboards, and small format poster assets being more environmentally friendly than traditional lighting practices, as well as ensuring our digital billboards are equipped so their brightness adjusts to ambient lighting levels, meaning that power reductions occur automatically as the operational need for energy reduces.
Recycling & waste: oOh!’s intent remains to recycle, reuse, refurbish or repurpose our assets, posting materials and waste.
Depot and warehouse facilities across the country have strong waste segregation practices in place, providing numerous opportunities to limit the type or volume of materials sent to landfill. Waste streams identified for recycling include batteries, fluorescent tubes, glass, steel, aluminium, copper, PVC cabling, e-waste and of course cardboard/posters. In some locations, specialist providers have been identified for targeted recycling initiatives e.g. posters recycled into corflute/packaging materials, safety glass into road base. Where possible, former or salvaged bus shelters and sign housings are broken down with reusable parts stored on site or refurbished for future use before recycling or disposal at landfill is considered.
We work with our clients and contract installers to see billboard skins either reused or repurposed as often as possible. Contract installers have a variety of solutions in place for skins at the end of their display-life including supply to charities for overseas disaster relief, repurposed in farming, painting or maintenance industries, sent overseas for use in housing, or donated to schools or volunteer associations e.g. local Scout units.
Working with an Australian dedicated recycling partner, waste posters have been accepted from New South Wales and Victoria throughout the year. In late 2020, this dedicated recycling was further extended to Queensland and South Australia also, preventing almost 60 tonnes of poster material going to landfill for the year across all sites. It is currently under investigation if recycling of posters can include the variety of poster that connects to others, allowing a scrolling action in the display unit; currently the materials used to connect the posters renders them non-recyclable.
Our New Zealand operations were able to recycle 65% of their poster products in 2020 with a locally-based recycling partner; we are investigating the potential for the full volume of posters to be recycled in 2021.
Throughout 2020, oOh! commenced fit out and relocations into new office locations in both North Sydney (head office) and Melbourne. Both buildings have similarities and site-specific environmental ratings and initiatives:
• North Sydney building-specific – Three separate locations
consolidating into a single building
– 5-star NABERs energy rating – 5-star Green Star rating for
sustainable design
• Melbourne building-specific – 4.5 star NABERs energy rating – 4-star Green Star rating for
sustainable design – Green share cars available for use
• Building similarities – Photovoltaic system on the roof – Rainwater harvesting for onsite
use e.g. toilet flushing, plant watering systems
– Air conditioning and LED lighting zone control (movement sensor operated)
• oOh! incorporated features into fit out or facility management
– Inbuilt water point refilling stations to encourage minimum use of drinking glassware;
– Elimination of waste bins in offices and meetings rooms, as well as reduced number of waste stations that encourage waste segregation of landfill, recyclables and paper whilst encouraging incidental exercise for our employees
– Encouraging the reduction in printing by setting up technology restrictions on security card access to print and clearing print queue at the end of each day
Energy: Connecting new bus shelters to mains power is often a lengthy and expensive process, especially where new connections require trenching. oOh! always considers using solar energy to power our non-advertising and static advertising shelters, however our shelters are often designated to locations that are partially shaded by trees or subjected to poor sunlight which leads to the battery voltage depleting to levels unable to continue to power the advertising lighting as required. This issue is exacerbated when solar energy is low during cloudy winter days.
In 2019 we invested in a new solar solution to better respond to these challenges and provide the lighting reliability we need with advertising sites. The new solar solution included;
• A compact and efficient lithium battery that is more powerful, safer and longer lasting than previous solutions;
• A smarter charge controller providing telemetry for improved monitoring of performance and preventative maintenance activities; and
• Use of solar panels with a smaller surface area yet more efficient in their ability to harness increased volume of energy from the sun compared with other units.
By early 2020 we had installed over 50 new advertising shelters across Perth and Sydney fitted with this new solar technology as part of a large-scale case study. With 12 months of data now to validate, the results have exceeded our expectations and oOh! considers this case study a success. The new solution has shown it can withstand more challenging conditions, has sufficient battery life to keep the lighting on for up to 7.5 days without charge – almost 5 days more than our previous solution which only held enough charge to run for just over 2 days without sufficient charging.
In 2020 we also developed our first scroller advertising shelter powered by battery. This site required 24-hour power but was only connected to a 12-hour street light circuit, meaning the scroller would stop working between sunrise – sunset. By retrofitting our new lithium battery solution to this shelter, we can power the
61

lighting and scroller from the battery 24 hours a day. Each night when the street light circuit is switched on and supplies the shelter with mains power, our battery is recharged to full so it can continue to run uninterrupted. This type of solution has the potential to alleviate a lot of issues we may have with power in the future and can hopefully lead to the development of a digital advertising shelter being powered by battery one day.
In New Zealand, our operations have partnered with the electricity supplier, to confirm 100% of our advertising assets are sourced from renewable electricity.
Sustainable printing: oOh! operates a printing company – Cactus Imaging. The business is continually seeking opportunities to align with suppliers that are reducing their environmental impact with innovative and sustainable product offerings. An increase in the use of PVC-free and recycled printing and laminating materials across a broader range of applications, combined with latex (water-based) and UV-based printing technologies makes up a key part of our environmental plans.
Posters for use in the oOh! Street Furniture business are printed on 100% recyclable materials. Cactus continues to offer a lightweight vinyl option for billboard skins which accounted for 75% of all skins printed through 2020.
Environmental campaigns: Throughout 2020, oOh! provided advertising space for a number of clients on their environmental messaging. These
included local councils on waste disposal processes, Water Authorities on the importance of water sustainability and independent clients with messaging such as planting trees, preparing for storm season and addressing global warming.
As part of oOh!’s response to long term bushfire relief and recovery oOh! supported one of our Community partners, Taronga Conservation Society Australia, with their Wildlife Crisis Appeal campaign. Funds raised from this appeal went to emergency care for rescued wildlife and long-term projects such as restoring habitats destroyed by fire.
oOh! ran a campaign for Plastic Free July in June/July 2020 donating $1.6 million in media space including 25 large format digital billboards and 400 digital street panels (including bus stops) across Queensland, New South Wales, Victoria, South Australia and Western Australia. The intent was to raise community awareness of the consumption of single-use plastic products, as well as to apply pressure on large companies to consider stopping the use of plastic packaging.
The winner of the 2019 oOh! Open Awards “Impact” sustainability category was awarded $250,000 in media spend to promote a cause of their choice across the oOh! network; this was donated to the Australian Marine Conservation Society and their ‘Fight For Our Reef’ campaign to combat the damage being done to the Great Barrier Reef. The campaign ran for two weeks from mid-August across digital road and retail assets in
Queensland, New South Wales, Victoria and Australian Capital Territory.
Certification: oOh! is certified to the ISO 14001:2015 Environmental Management System as part of an integrated management system with ISO 45001:2018 (occupational health & safety) and ISO 9001:2015 (quality). A surveillance audit conducted by an independent third party in late 2020 concluded that oOh! retain this certification.
Regulatory compliance: oOh! did not receive any fines or grievances for non-compliance with environmental laws and regulations over the reporting period.
COMMUNITY
oOh! continued its strong history of community support in 2020. During the reporting period, oOh! further developed its oOh! Community program, including a renewed vision ‘to shine a light on important community issues and organisations to help generate positive change for our Australian and New Zealand communities’.
AustraliaoOh!’s contribution: oOh! supports a number of charities by providing free of charge advertising space to amplify their campaigns through oOh!’s network and donating media packages to auction for charity events. Over the reporting period, oOh! responded to over 100 requests for support, donated 7 media packages at a value of $295,000, and
SUSTAINABILITY REPORT CONTINUED
62

provided over $25 million in media space to charity and community causes. Due to COVID-19, many events were cancelled throughout 2020 that impacted the value of donations made/space utilised.
Charities and causes we actively support include:• Lifeline;• Make-A-Wish Australia;• Pink Hope;• Taronga Conservation Society
Australia;• Two Good;• SANE Australia;• Humpty Dumpty Foundation;• Ovarian Cancer Research Foundation;• Shake It Up Australia;• Jean Hailes for Women’s Health;• Sony Foundation;• UnLtd; • Australian Children’s Music Foundation;
and• Orange Sky.
Industry support: Through the OMA oOh! also supported:• National Missing Persons Week
– In conjunction with other OMA members, approximately $1,000,000 in advertising space was donated to highlight the profiles of missing persons cases; and
• DrinkWise – In 2020 OMA members, including oOh!, supported DrinkWise to reinforce safe drinking behaviour in times of stress. Commencing at the end of May 2020, the campaign encouraged people to reach out and look for help if isolation is taking its toll. The DrinkWise and OMA partnership has for the past three years delivered an important message to adults, in particular parents, reminding them to consider the impact their drinking habits can have on their children’s future drinking habits.
Employee contribution: oOh! offers employees a paid workday a year to volunteer for a registered charity. Employees volunteered for a variety of causes in 2020 including Orange Sky.
Responding to the Bushfires: Throughout late 2019 and into 2020, a significant portion of Australia was heavily impacted by bushfires. oOh! not only supported the advertising campaigns of our clients with their bushfire relief appeals and grants on our digital media, but on the days of unprecedented fire conditions, oOh! used our digital media to provide public service announcements to the community.
In response to the devastating bushfires in late 2019, in early 2020 oOh! introduced an additional day of annual leave in 2020 and 2021 for all employees who holiday in those fire affected communities to support local tourism and assist in the long term economic recovery efforts.
Responding to COVID-19: Similar to the bushfire response, the breadth of oOh!’s infrastructure across Australia and New Zealand has proved invaluable in sharing public service announcements to the public. Such examples have included:
- The Australian Government providing official medical advice, communicating the COVIDsafe app and JobKeeper;
- State-based health authorities on lock-down restrictions;
- Public transport providers on requirements to wear PPE whilst travelling;
- Community partners (e.g. shopping centres and office towers) used our panels to display COVIDsafe messaging and requirements;
- Mental health providers e.g. Lifeline, reminding the community of their services in these times; and
- Individual client requirements on business COVIDsafe requirements or community reminders.
New ZealandoOh! New Zealand’s ambition for the 2020 Community Program was to give back and make a difference to the Not-for-Profit organisations we represent, as well as engage the NZ public and enrich the communities and suburbs our assets are part of.
In 2020, we continued an ongoing programme of support for our three long-standing partners:
• Keep New Zealand Beautiful;• Youthline; and• The Urban Art Foundation.We provided media space for the following charities:• Breast Cancer Foundation NZ;• Semi Permanent;• World Vision;• Starship Air Ambulance;• Pet Refuge;• Blue September;• Bowel Cancer New Zealand; and• Kidscan.
In addition, we supported the following community and industry entities and events:• NZ Geographic;• Semi Permanent;• Our Second Chance;• Queenstown Tourism; and• ANZAC – Stand at Dawn.
In 2020 we also launched the ‘Art in the Hood’ project. Designed to engage communities via a nationwide competition that invited school-aged children to create a picture that illustrates the community they are part of. We had over 300 entries and four winners were selected from each participating school and displayed on their local shelter. We also ran 10 overall winners on our street and retail digital panels over the quieter holiday period.
Responding to COVID-19: The New Zealand team were quick to turn the impact of the COVID-19 pandemic into an opportunity to support NZ communities:• National Teddy Bear Campaign;• Art in Isolation exhibition, leading
to the TradeMe action, that raised over $10,000 for Youthline as well as supporting the artists involved; and
• Together campaign to support NZ fashion industry.
63

64

Note 1. Reporting entity
Note 2. Basis of accounting
Note 3. Significant accounting policies
Note 4. Operating segments
Note 5. Revenue an d other income
Note 6. Government grants and rent concessions
Note 7. Other expenses
Note 8. Net finance costs
Note 9. Share based payments
Note 10. Income tax
Note 11. Trade and other receivables
Note 12. Property, plant and equipment
Note 13. Right of use assets
Note 14. Intangible assets and goodwill
Note 15. Non current assets
Note 16. Inventories
Note 17. Other assets
Note 18. Loans and borrowings
Note 19. Trade and other payables
Note 20. Make good provisions
Note 21. Derivative liabilities
Note 22. Capital and reserves
Note 23. Fair values
Note 24. Financial risk management
Note 25. List of subsidiaries and equity accounted investees
Note 26. Capital commitments
Note 27. Contingencies
Note 28. Related parties
Note 29. Earnings per share
Note 30. Reconciliation of cash flows from operating activities
Note 31. Auditor’s remuneration
Note 32. Parent entity disclosures
Note 33. Deed of cross guarantee
Note 34. Subsequent events
Directors’ Declaration
Independent Auditor’s Review Report
CONTENTS
General Information
Significant changes in the reporting period
Consolidated statement of profit or loss and other comprehensive income
Consolidated st atement of financial position
Consolidated statement of cash flows
Consolidated statement of changes in equity
Notes to the consolidated financial statements
FINANCIALREPORT
65

General Information
The Annual Report covers oOh!media Limited and its controlled entities. The financial statements are presented in Australian currency.
oOh!media Limited is a listed company limited by shares, incorporated and domiciled in Australia. Its registered office and principal place of business is:
Level 2, 73 Miller Street, North Sydney, New South Wales 2060
The Annual Report was authorised for issue, in accordance with a resolution of the Directors. The Directors have the power to amend and reissue the Annual Report.
Through the use of the internet, oOh!media Limited ensures that all corporate reporting is timely, complete and available to all users at minimum cost to the Company. All media releases, financial reports and other information are available at the Investors section on the website: www.investors.oohmedia.com.au
Significant changes in the reporting period
On 11 March 2020 the World Health Organisation announced that the coronavirus (COVID-19) outbreak be classified as a pandemic. This has resulted in the Australian and New Zealand governments introducing various measures to combat the outbreak, including travel restrictions, quarantines, closure on non-essential businesses and lock-down of the country.
The pandemic has caused significant uncertainty in the period and continues to do so at the reporting date. Due to government measures in Australia and New Zealand from March 2020, audiences for the Group’s assets declined significantly and as a consequence advertising revenue declined. As government measures relaxed, audiences for the Company’s assets increased and revenues have also started to increase. Specific asset formats operated by the Company and disclosed under Principal Activities are affected differently by the government measures due to their location and audience. The broader impact on the economy of government measures has affected advertiser appetite for media expenditure within various advertiser categories. Other impacts include temporary assistance from commercial partners with regards to rent relief measures, receipt of government assistance measures, and cost control measures by the Company including significant reduction of previously planned operating and capital expenditure. The Company continues to evaluate further action in these areas as the external environment continues to evolve due to the pandemic.
The Company has also considered the significant impact of the pandemic on the assumptions and judgements within these financial statements which have been prepared using current internal and external available information to assess likely future operating conditions. Refer to Note 2(e) for further information on estimates and judgements made as a result, and the Operating and Financial Review for further discussion on the impact on financial performance.
For a detailed discussion on the Group’s financial performance and position, refer to the Operating and Financial Review.
66

Consolidated statement of profit or loss and other comprehensive income
for the year ended 31 December 2020 Consolidated Restated (1)
31 Dec 20 31 Dec 19 Note $'000 $'000
Revenue from continuing operations 5 426,525 649,606 Cost of media sites and production (3) (78,103) (184,785) Gross profit 348,422 464,821 Other income (2) 5 6,829 -
-
Operating expenditure Employee benefits expense (4) (77,053) (98,609) Depreciation and amortisation expense 12,13,14 (223,783) (232,147) Legal and professional fees (5,758) (5,296) Advertising and marketing expenses (6,622) (9,705) Restructuring and integration related expenses (3,621) (10,167) Impairment expense 15,25 (3,461) (3,500) Other expenses 7 (20,387) (23,898) Total operating expenditure (340,685) (383,322)
Operating profit 14,566 81,499
Finance income 8 331 1,350 Finance costs 8 (59,190) (59,777) Net finance costs (58,859) (58,427)
Share of (loss) / profit of equity-accounted investees, net of tax (93) 105 (Loss) / profit before income tax (44,386) 23,177
Income tax benefit / (expense) (1) 10 8,668 (9,524) (Loss) / profit after income tax (35,718) 13,653
Attributable to: Owners of the company (35,718) 13,668 Non-controlling interest 22(c) -
- (15)
(Loss) / profit for the period (35,718) 13,653
Other comprehensive (loss) / income (Loss) / profit for the period (35,718) 13,653
Items that may be subsequently classified to profit or loss: Effective portion of changes in fair value of cash flow hedges, net of tax (4,732) (7,936) De-designation of interest rate derivatives to the Consolidated Income Statement, net of tax (5) 4,394 - Foreign currency translation differences (848) 1,086 Total comprehensive loss for the period (36,904) 6,803
Attributable to: Owners of the company (36,904) 6,818 Non-controlling interest -
- (15)
Total comprehensive income for the period (36,904) 6,803 Restated (6)
Earnings per share attributable to the ordinary equity holders of the company Cents Cents Basic (loss) / earnings per share 29 (7.0) 5.0 Diluted (loss) / earnings per share 29 (7.0) 5.0
(1) As a result of the IFRS IC agenda decision, the Group has changed its accounting policy, retrospectively adjusting the deferred tax accounting
for Brands. Refer Note 10. (2) Other income comprises compensation recognised for compulsory acquisition of leased site, gain on sale of assets and gain on lease
modification. Refer Note 5. (3) Cost of media sites and production is shown net of negotiated rent abatements with lessors. Refer Note 6. (4) Employee benefits are shown net of government grants specifically Jobkeeper and NZ Wage Subsidy. Refer Note 6. (5) Pursuant to AASB9, a portion of the interest rate derivative was deemed ineffective, and the $4,394,000 adjustment to Fair value was recognised
in the statement of profit and loss. Refer Note 23. (6) Prior year comparatives have been restated following the Group’s capital raising during 2020.
The above consolidated statement of profit or loss and comprehensive income should be read in conjunction with the accompanying notes.
67

Consolidated statement of financial position
as at 31 December 2020
Consolidated Restated (1)
Notes 31-Dec-20 31-Dec-19 $'000 $'000 Current assets Cash and cash equivalents 80,042 61,208 Trade and other receivables 11 85,480 133,519 Inventories 16 3,472 4,025 Other assets 17 23,199 32,417 Income tax asset - 2,784 Total current assets 192,193 233,953
Non-current assets Property, plant and equipment 12 214,205 248,271 Right-of-use-assets (2) 13 727,243 807,608 Intangible assets and goodwill (1) 14 775,159 794,896 Other assets 17 - 1,988 Total non-current assets 1,716,607 1,852,763 Total assets 1,908,800 2,086,716 Current liabilities Trade and other payables 19 42,596 79,450 Interest bearing lease liabilities (2) 18 159,424 170,025 Provisions 20 828 661 Employee benefits 7,348 7,173 Income tax payable 10 1,632 - Total current liabilities 211,828 257,309
Non-current liabilities Loans and borrowings 18 191,277 415,697 Provisions 20 14,858 15,170 Employee benefits 2,568 3,931 Interest bearing lease liabilities (2) 18 645,127 681,748 Derivative liabilities 21 18,335 13,094 Deferred tax liability (1) 10 18,312 32,239 Total non-current liabilities 890,477 1,161,879
Total liabilities 1,102,305 1,419,188
Net assets 806,495 667,528 Equity Share capital 22(a) 876,291 694,913 Reserves 22(b) 28,791 17,305 Accumulated losses (1) (97,682) (43,785) Equity attributable to the owners of the Company 807,400 668,433
Non-controlling interest 22(c) (905) (905) Total equity 806,495 667,528
(1) As a result of the IFRS IC agenda decision, the Group has changed its accounting policy, retrospectively adjusting the deferred tax
accounting for Brands. Refer Note 10 Income Tax. (2) Following the IFRC decision under COVID-19 the Group have taken up the practical expedients detailed under AASB 2020-4 Amendments
to Australian Accounting Standards – COVID-19 Related Rent Concessions.
The above consolidated statement of financial position should be read in conjunction with the accompanying notes.
68

Consolidated statement of cash flows
for the year ended 31 December 2020
Consolidated 31-Dec-20 31-Dec-19
Notes $'000 $'000 Cash flows from operating activities Receipts from customers (inclusive of goods and services tax) 522,847 701,185 Payments to suppliers and employees (inclusive of goods and services tax) (309,348) (396,180) Cash generated from operations 213,499 305,005 Interest paid (46,341) (57,870) Interest received 331 986 Income tax paid 1,133 (10,890) Net cash generated in operating activities 30 168,622 237,231
Cash flows from investing activities Acquisition of property, plant and equipment 12 (13,027) (47,754) Acquisition of intangible assets 14 (3,348) (8,460) Payment for acquisition of subsidiaries, net of cash acquired - (2,413) Proceeds from sale of property, plant and equipment 2,491 321 Net cash used in investing activities (13,884) (58,306)
Cash flows from financing activities Proceeds from issue of shares 167,004 - Transaction costs related to issue of shares (5,238) - Proceeds from loans and borrowings 24,818 60,000 Repayment of loans and borrowings (248,818) (51,000) Payment of transaction costs related to borrowings and derivatives (2,395) (1,858) Payment of lease liabilities (71,275) (146,584) Proceeds from underwriters for DRP (12,180) 3,479 Dividends paid in cash 12,180 (14,781) Net cash used in financing activities (135,904) (150,744)
Net increase in cash and cash equivalents 18,834 28,181 Cash and cash equivalents at beginning of period 61,208 33,027 Cash and cash equivalents at end of period 80,042 61,208
The above consolidated statement of cash flows should be read in conjunction with the accompanying notes.
A footnote relating to 2019 transitional arrangements was erroneously included in the Annual Financial Report, so has been corrected by deletion in this Annual Report.
69

Consolidated statement of changes in equity for the year ended 31 December 2020
Contributed equity
Foreign currency
translation reserve
Other equity
reserve
Cash flow hedge
reserve
Share-based payments
reserve
Accumulated losses
Non-controlling
interest
Total equity
Consolidated $'000 $'000 $'000 $'000 $'000 $'000 $'000 $'000 Restated balance at 1 January 2019 (1) 675,371 284 16,608 (1,358) 11,152 (31,251) (784) 670,022 Total comprehensive income for the period: Profit / (loss) for the period after income tax - - - - - 13,668 (15) 13,653 Other comprehensive income/(loss): Effective portion of changes in fair value of cash flow hedges - - - (7,936) - - - (7,936) Exchange differences on translation of foreign operations - 1,086 - - - - - 1,086 Total comprehensive income for the period - 1,086 - (7,936) - 13,668 (15) 6,803 Transactions with owners, recorded directly in equity: Contributions and distributions Issue of ordinary shares (Employee Performance Rights) 3,569 - - - (3,569) - - - Issue of ordinary shares (Dividend Reinvestment Plan) 14,896 - - - - (14,896) - - Other performance rights issued 1,077 - - - (1,077) - - - Dividends paid - - - - - (11,302) - (11,302) Equity-settled share-based payment transactions - - - - 2,115 - - 2,115 Change to non-controlling interest - - - - - (4) (106) (110) Total transactions with owners of the Company 19,542 - - - (2,531) (26,202) (106) (9,297) Balance at 31 December 2019 694,913 1,370 16,608 (9,294) 8,621 (43,785) (905) 667,528 Total comprehensive income for the period: Loss for the period after income tax - - - - - (35,718) - (35,718) Other comprehensive income: Effective portion of changes in fair value of cash flow hedges - - - (4,732) - - - (4,732) De-designation of interest rate derivatives to the Consolidated Income Statement, net of tax - - - 4,394 - - - 4,394
Exchange differences on translation of foreign operations - (848) - - - - - (848) Total comprehensive loss for the period - (848) - (338) - (35,718) - (36,904) Transactions with owners, recorded directly in equity: Contributions and distributions Issue of ordinary shares 167,004 - - - - - - 167,004 Share issue costs, net of tax (3,805) - - - - - - (3,805) Issue of Ordinary Shares (Dividend Reinvestment Plan) 18,179 (18,179) - Equity-settled share-based payment transactions - - - - 12,672 - - 12,672 Total transactions with owners of the Company 181,378 - - - 12,672 (18,179) - 175,871 Balance at 31 December 2020 876,291 522 16,608 (9,632) 21,293 (97,682) (905) 806,495
(1) As a result of the IFRS IC agenda decision, the Group has changed its accounting policy, retrospectively adjusting the deferred tax accounting for Brands. Refer Note 10 Income Tax. The above consolidated statement of changes in equity should be read in conjunction with the accompanying notes.
70

Notes to the consolidated financial statements
1. Reporting entity
oOh!media Limited is a company domiciled in Australia. The Company was incorporated on 7 October 2014 and listed on the Australian Securities Exchange (ASX) on 17 December 2014. The Company's registered office and principal place of business is at Level 2, 73 Miller Street, North Sydney, NSW 2060.
The consolidated Annual Financial Statements (Annual Financial Statements) of the Company as at and for the year ended 31 December 2020 comprises the Company and its subsidiaries (together referred to as the Group, and individually as Group entities), and the Group’s interests in associates and joint ventures. The comparative information represents the financial position of the Company as at 31 December 2020 and the Group's performance for the period 1 January 2020 to 31 December 2020.
The Group is a for-profit entity and is primarily involved in outdoor media, production and advertising in Australia and New Zealand.
2. Basis of accounting
a) Statement of compliance
The consolidated financial statements are general purpose financial statements which have been prepared in accordance with Australian Accounting Standards (AASBs) adopted by the Australian Accounting Standards Board (AASB) and the Corporations Act 2001 (Cth). The consolidated financial statements comply with International Financial Reporting Standards (IFRS) adopted by the International Standards Board (IASB).
Full disclosure notes are included to explain events and transactions that are significant to gain an understanding of the changes in financial position and performance of the Group since the last consolidated financial statements as at, and for the year ended 31 December 2019.
These consolidated financial statements were approved and authorised for issue by the Board of Directors on 22 February 2021.
b) Basis of measurement
The consolidated financial statements have been prepared on the historical cost basis except for the following item in the consolidated statement of financial position:
- Derivative financial instruments are measured at fair value
c) Functional and presentation currency
These consolidated financial statements are presented in Australian dollars, which is the Company’s functional currency. The Company is of a kind referred to in ASIC Corporations Instrument 2016/191 dated 1 April 2016 and in accordance with the instrument, all financial information presented in Australian dollars has been rounded to the nearest thousand unless otherwise stated.
d) Going concern
The consolidated financial statements have been prepared on a going concern basis, which contemplates the continuity of normal business activities and realisation of assets and settlement of liabilities in the ordinary
71

course of business. The Group has, an excess of current liabilities over current assets totalling $19,635,000 (2019: $23,356,000). The Group is generating positive operating cash flows and there is no indication that the Group will not be able to meet its obligations as and when they fall due.
The Group re-negotiated its financing facilities as set out in Note 18 extending the facilities to $350,000,000. As part of this refinancing, financial covenants were revised which provided further headroom for the next 12 months covenant calculations.
The Company continues to see an increase in revenues since half year with increased public movements and reduced government-imposed restrictions and has continued to experience strong support from commercial partners with regard to rent relief arrangements. As part of the Directors’ consideration of the going concern basis in preparing the annual report, cash flow forecasts based on current internal and external information to assess likely future operating conditions have been considered. Whilst the full magnitude and length of time of the disruption from COVID-19 remains uncertain and requires continual reassessment, the Directors are satisfied that the Group will be able to meet its debts as and when they fall due based on risk adjusted cash flow forecasts and related forecast compliance with banking covenants.
e) Use of judgements and estimates
In preparing these Annual Financial Statements, management has made judgements, estimates and assumptions that affect the application of the Group's accounting policies and the reported amounts of assets and liabilities, income and expenses. Actual results may differ from these estimates. Estimates and underlying assumptions are reviewed on an ongoing basis. Revisions to accounting estimates are recognised prospectively.
During the reporting period the COVID-19 pandemic had significant impact on the Group. In March 2020 the Government imposed a reduction in public movement, strict controls on cross border travel and a halt on international travel. This has had a significant impact on the revenue for the period and is expected to be an impact on audience measures and therefore revenues for outdoor advertising for the near future, specifically for air travel audiences in 2021. In addition, the Company has considered the broad impact of the pandemic on economic activity in both Australia and New Zealand and how it will impact media revenues, and therefore outdoor media revenues for a multi-year period.
i) Judgements
COVID-19 led to the need for additional judgements and estimates. Key judgements include the forecast performance of the Group, which at the time of this report has inherent uncertainty. These key judgements relate to the carrying value of the tangible and intangible assets and were made based on the internal and external available information. Should actual performance differ significantly from these assumptions there may be material changes to the carrying value of the assets and liabilities listed above for future reporting periods. Quantified sensitivity impacts of the assumptions with regards to the recoverability of tangible and intangible assets of Cash Generating Units on impairment are included in Note 15 Non-current assets.
ii) Assumptions and estimation uncertainties
Information about assumptions and estimation uncertainties that have a significant risk of resulting in a material adjustment within the year ending 31 December 2020 are included in the following notes:
- Note 15 Non-current assets: key assumptions underlying recoverable amounts for impairment testing; and
- Note 18 Loans and borrowings: incremental borrowing rate and lease terms.
72

iii) Measurement of fair values
A number of the Group’s accounting policies and disclosures require the measurement of fair values for both financial and non-financial assets and liabilities.
The Group has an established control framework with respect to the measurement of fair values. This includes a finance team that has overall responsibility for overseeing all significant fair value measurements, including Level 3 fair values, and which reports directly to the Chief Financial Officer.
The finance team reviews significant unobservable inputs and valuation adjustments. If third party information, such as broker quotes or pricing services, is used to measure fair values, then the finance team assesses the evidence obtained from the third parties to support the conclusion that such valuations meet the requirements of IFRS, including the level in the fair value hierarchy in which such valuations should be classified. Significant valuation issues are reported to the Group’s Audit, Risk & Compliance Committee.
When measuring the fair value of an asset or a liability, the Group uses observable market data as much as possible. Fair values are categorised into different levels in a fair value hierarchy based on the inputs used in the valuation techniques as follows:
- Level 1: quoted prices (unadjusted) in active markets for identical assets or liabilities; - Level 2: inputs other than quoted prices included in Level 1 that are observable for the asset or liability,
either directly (i.e. as prices) or indirectly (i.e. derived from prices); and - Level 3: inputs for the asset or liability that are not based on observable market data (unobservable
inputs).
If the inputs used to measure the fair value of an asset or a liability might be categorised in different levels of the fair value hierarchy, then the fair value measurement is categorised in its entirety in the same level of the fair value hierarchy as the lowest level input that is significant to the entire measurement.
The Group recognises transfers between levels of the fair value hierarchy at the end of the reporting period during which the change has occurred. Further information about the assumptions made in measuring fair values is included Note 23 Fair values.
f) Changes in accounting policies
The accounting policies adopted in this report have been consistently applied to each entity in the Group and are consistent with those of the previous year, with the exception of revisions to standard AASB16 and AASB112 discussed below.
g) New standards and interpretations
The Group has adopted all the relevant new, revised, or amended Accounting Standards and interpretations issued by the AASB which are mandatory for the current and comparative reporting period.
AASB16 Leases
In response to the COVID-19 coronavirus pandemic, the International Accounting Standards Board (“IASB”) issued amendments to IFRS16 Leases with AASB 2020-4 Amendments to Australian Accounting Standards – COVID-19 Related Rent Concessions. The Group has taken up the practical expedient related to rent concessions.
This allows the Group to elect not to account for changes in lease payments as a lease modification where a change in lease payments to the revised consideration are substantially the same or less than the consideration for the lease preceding the change, the reductions only affect payments which fall due before 30 June 2021 and there has been no substantive change in terms and conditions. In some cases, the Group has
73

negotiated reduced payments due to the impact of the COVID-19 coronavirus pandemic beyond 30 June 2021. In accordance with current IASB amendments these reductions are accounted for as a lease modification. Should the IASB issue further amendments to the existing practical expedients, these lease payment reductions may be restated in future reporting periods. Where the practical expedient has been applied, rent concessions are accounted for as a reduction in property costs. Rent concessions are accounted for as a reduction to Cost of media sites and production when the Group has an unconditional right to the concession. Refer Note 6 Government grants and rent concessions.
AASB112 Income Taxes
As a result of the IFRS Interpretations Committee (IFRS IC) publishing its final agenda decision ‘Multiple Tax Consequences of Recovering an Asset (IAS 12 Income Taxes)’, oOh!media Limited changed its accounting policy in 2020, retrospectively adjusting the deferred tax accounting for Brands. The impact of this change in accounting policy for the comparative reporting period and the beginning of the earliest period presented are presented in Note 10 Income tax.
Accounting for Government Grants
JobKeeper & NZ Wage subsidy receipts are accounted for under AASB120 – Accounting for Government Grants and have been recognised net of employee expense. Refer Note 6 Government grants and rent concessions.
3. Significant accounting policies
Accounting policies can be found throughout the notes to these financial statements, beneath the appropriate note disclosure. For changes in the accounting policy in the period refer to Note 2(f) Changes in accounting policies.
a) Basis of consolidation
The consolidated financial statements incorporate the assets and liabilities of all subsidiaries of oOh!media Limited and the results of subsidiaries. oOh!media Limited and its subsidiaries together are referred to in this Annual Report as ‘the Group’.
i) Subsidiaries
Subsidiaries are entities controlled by the Group. The financial statements of subsidiaries are included in the consolidated financial statements from the date that control commences until the date that control ceases. The Group controls an entity when it is exposed to, or has rights to, variable returns from its involvement with the entity and has the ability to affect those returns through its power over the entity.
ii) Investments in equity-accounted investees
The Group’s interest in equity-accounted investees represents its interest in a joint venture. A joint venture is an arrangement in which the Group has joint control, whereby the Group has rights to the net assets of the arrangement, rather than rights to its assets and obligations for its liabilities. The Group’s interest in associates and the joint venture are accounted for using the equity method. They are initially recognised at cost, which includes transaction costs. Subsequent to initial recognition, the consolidated financial statements include the Group’s share of profit or loss and other comprehensive income of equity-accounted investees, until the date on which significant influence or joint control ceases.
74

iii) Transactions eliminated on consolidation Intra-group balances and transactions, and any unrealised income and expenses arising from intra-group transactions, are eliminated. Unrealised gains arising from transactions with equity-accounted investees are eliminated against the investment to the extent of the Group’s interest in that investee. Unrealised losses are eliminated in the same way as unrealised gains, but only to the extent that there is no evidence of impairment.
iv) Non-controlling interests (NCI)
NCI are measured at their proportionate share of the acquiree’s identifiable net assets at the date of acquisition. Changes in the Group’s interest in a subsidiary that do not result in a loss of control are accounted for as equity transactions.
b) Income tax – refer to Note 10 Income tax
c) Receivables and revenue recognition – refer to Note 11 Trade and other receivables and Note 5 Revenue and other income
d) Plant and equipment – refer to Note 12 Property, plant and equipment
e) Right-of-use assets – refer to Note 13 Right-of-use assets
f) Intangibles – refer to Note 14 Intangible assets and goodwill
g) Inventories – refer to Note 16 Inventories
h) Financial instruments – refer to Note 24 Financial risk management
i) Leases – refer to Note 18 Loans and borrowings
j) Trade and other payables – refer to Note 19 Trade and other payables
k) Employee benefits – refer to Note 9 Share-based payments
l) Cash and cash equivalents – refer to Note 30 Reconciliation of cash flows from operating activities
m) Impairment of assets – refer to Note 15 Non-current assets
n) Foreign currency translation
i. Transactions and balances
Foreign currency transactions are translated into the functional currency using the exchange rates prevailing at the dates of the transactions. Foreign exchange gains and losses resulting from the settlement of such transactions and from the translation at period-end exchange rates of monetary assets and liabilities denominated in foreign currencies are recognised in the statement of comprehensive income.
ii. Foreign operations
The results and financial position of foreign operations (none of which have the currency of a hyperinflationary economy) that have a functional currency different from the presentation currency are translated into the presentation currency as follows:
75

- Assets and liabilities for each balance sheet presented are translated at the closing rate at the date of that balance sheet;
- Income and expenses for each statement of comprehensive income are translated at average exchange rates unless this is not a reasonable approximation of the: • Cumulative effect of the rates prevailing on the transaction dates, in which case income and
expenses are translated at the dates of the transactions; • All resulting exchange differences are recognised as a separate component of equity.
On consolidation, exchange differences arising from the translation of any net investment in foreign operations, and of borrowings and other financial instruments designated as hedges of such investments, are taken to shareholders’ equity. When a foreign operation is sold, ceases operation or any borrowings forming part of the net investment are repaid, a proportionate share of such exchange differences are recognised in the statement of comprehensive income, as part of the gain or loss on sale where applicable. Goodwill and fair value adjustments arising on the acquisition of a foreign operation are treated as assets and liabilities of the foreign operation and translated at the closing rate.
o) Borrowings – refer to Note 18 Loans and borrowings
p) Finance income and finance costs – refer to Note 8 Net finance costs
q) Maintenance and repairs – refer to Note 12 Property, plant and equipment
r) Provisions – refer to Note 20 Make good provisions
s) Goods and services tax (GST)
Revenues, expenses and assets are recognised net of the amount of associated GST, unless the GST incurred is not recoverable from the taxation authority. Operating cash flows are recognised inclusive of the associated GST. In this case, it is recognised as part of the cost of acquisition of the asset or as part of the expense. Receivables and payables are stated inclusive of the amount of GST receivable or payable. The net amount of GST recoverable from, or payable to, the taxation authority is included with other receivables or payables in the balance sheet.
t) Share capital – refer to Note 22 Capital and reserves
u) Glossary – refer to glossary of defined terms
4. Operating segments
a) Basis for segmentation
The Group operates as a single segment providing a range of Out-of-Home advertising solutions.
b) Reconciliation of information on reportable segments to IFRS measures
The Board and executive management review the Underlying Earnings Before Interest, Tax, Depreciation and Amortisation (EBITDA) pre AASB16 to monitor business performance because they believe that it provides a better representation of financial performance in the ordinary course of business.
76

31-Dec-20 31-Dec-19
$'000 $'000 Underlying EBITDA pre AASB16 (2) 63,163 138,987 Fixed rent obligations (1) 175,439 188,326 Underlying EBITDA post AASB16 238,602 327,313 Other income (3) 6,829 - Non-operating items (4) (3,621) (10,167) Impairment of non-current assets (3,461) (3,500) Statutory EBITDA 238,349 313,646 Share of (loss) of equity-accounted investees, net of tax (93) 105 Amortisation (23,391) (22,685) Depreciation (200,392) (209,462) Net finance costs (58,859) (58,427) (Loss) / Profit before income tax (44,386) 23,177
(1) Includes rent of $168,265,000 excluded from Cost of media sites and production and $7,174,000 from Other expenses under AASB16.
Abatements for fixed rent, due up to 31 December 2020, that qualify for practical expedients relief of $54,401,000 and $13,438,000 relating to unconditional abatements accounted for as part of a lease modification. Refer Note 6 Government grants and rent concessions.
(2) Includes government grants, refer Note 6 Government grants and rent concessions. (3) Other income comprises compensation for the compulsory acquisition of sites leased, gain on sale of Health and Gym assets and gain on
lease modification. (4) Non-operating items of $3,621,000 consist of: restructuring costs including redundancy payments and programme costs for the integration
of the Adshel acquisition.
5. Revenue and other income
Revenue by Product
Key information relating to the Group's financial performance is detailed below. This is also included in management reports reviewed by the Group's Chief Operating Decision Maker (The Board).
31-Dec-20 31-Dec-19 $'000 $'000 Commute (1) 148,082 234,825 Road 118,393 146,422 Retail 106,226 139,290 Fly 22,814 65,890 Locate 14,327 44,281 Other (2) 16,683 18,898 Revenue from continuing operations 426,525 649,606
(1) Commute revenue includes advertising, production, sale of street furniture, and cleaning and maintenance revenue. (2) Other revenues include subsidiary entities Cactus and Junkee.
31-Dec-20 31-Dec-19 $'000 $'000
Compensation for compulsory acquisition 2,586 - Sale of assets 1,252 - Gain on lease modification 2,991 - Other income 6,829 -
Other income includes the compensation recognised for the compulsory acquisition of sites leased, gain on sale of Health and Gym assets and gain on lease modification.
Accounting policy: Revenue recognition
Revenue is recognised at the fair value of the consideration received or receivable, net of the amount of goods and services tax. Revenue from core operating activities consists of Out Of Home advertising revenues. Revenue from Out Of Home advertising is recognised equally on a pro rata basis over the period in which the advertising
77

is on display. Revenue for media production work is recognised on completion of the assignment. Revenue is recognised on a gross basis with commissions payable to advertising and media agencies recognised as expenses in 'Cost of media sites and production'.
In accordance with AASB15, the Group has applied the exemption not to disclose revenue from unfulfilled performance obligations, as performance obligations form part of a contract that has an original term of one year or less.
Contract balances
The timing of revenue recognition, invoicing and cash collections results in accounts receivable, un-invoiced receivables (contract assets), and customer advances (contract liabilities) on the consolidated statement of financial position. Media contracts are billed in accordance with agreed-upon contractual terms, either upfront, at periodic intervals (e.g. lunar period) or upon achievement of contractual milestones. These assets and liabilities are reported on the consolidated statement of financial position on a contract-by-contract basis at the end of each reporting period. Changes in the contract asset and liability balances were not materially impacted by any other factors during the year ended 31 December 2020.
Revenue recognised in 2020 that was included in the contract liability balance at the beginning of the year was $7,786,000.
6. Government grants and rent concessions
31-Dec-20 31-Dec-19 $'000 $'000
JobKeeper 20,258 - New Zealand Wage Subsidy 497 - Total government grants 20,755 -
JobKeeper (for JV) 296 - Total government grants for JV 296 -
Rent abatements - COVID-19 practical expedient 54,401 - Variable rent (5,216) - Net rent abatement 49,185 -
Net cost reduction 70,236 -
JobKeeper (AU)
The JobKeeper payment is a temporary subsidy scheme to support businesses that have been impacted by Coronavirus (COVID-19) and have seen significant reductions of in annual turnover.
oOh!media Operations Pty Limited, oOh!media Street Furniture Pty Limited and oOh!edge have each qualified for JobKeeper in CY2020 and oOh!media Street Furniture Pty Limited is expected to do so until 31 March 2021 .
Wage Subsidy (NZ)
The Wage Subsidy was released by the NZ Government to support businesses that have been impacted by Coronavirus (COVID-19) and have seen significant reductions in revenue.
oOh!media Street Furniture New Zealand Limited and oOh!media New Zealand Limited each qualified for the Wage Subsidy in CY2020.
78

Rent abatements – COVID-19 practical expedient
Fixed rent abatements of $54,401,000 that would have normally been due for the period, however the commercial partners provided rent relief due to the COVID-19 impact, either as a waiver or as a conversion to variable rent.
Deferral of lease payments
$16,837,000 of fixed rent payments which would have been paid by December 2020 have been deferred to 2021 with the agreement of the commercial partners.
7. Other expenses 31-Dec-20 31-Dec-19
$'000 $'000 Office expenses 3,305 3,687 Information technology and communications expenses 9,739 8,639 Taxes and charges 4,816 5,299 Loss / (Profit) on disposal of assets 409 (48) Other expenses 2,118 6,321 Other expenses 20,387 23,898
8. Net finance costs 31-Dec-20 31-Dec-19
$'000 $'000 Finance income (331) (1,350)
Interest expense on bank borrowings 12,163 17,577 Amortisation of debt facility establishment costs 4,051 1,907 AASB16 interest expense 37,253 39,986 Hedge ineffectiveness 1,329 307 De-designation of cash flow hedges 4,394 - Finance Costs 59,190 59,777
Net finance costs 58,859 58,427
Accounting policy: Finance income and finance costs
i) Finance income
Finance income is recognised as income in the period in which it is earned. Finance income includes interest income, which is recognised on a time proportion basis using the effective interest method.
ii) Finance costs
Finance costs are recognised as expenses in the period in which they are incurred using the effective interest method. Finance costs include interest on bank borrowings, finance lease charges, short-term and long-term borrowings and ancillary costs incurred in connection with arrangement of borrowings, and interest expense on lease liabilities recognised on application of AASB16 Leases. Refer to Note 18 Loans and borrowings. During the period the company extended its bank borrowings before maturity. In line with AASB9 the original debt was derecognised, including unamortised ancillary costs on the original facility of $1,899,000. The fees incurred relating to the change in facility terms are being amortised over the period of the modified debt.
Total other expenses
79

9. Share-based payments Description of the share-based payment arrangements
As at 31 December 2020 the Group had the following share-based payment arrangements:
Performance rights granted to senior executives that existed during the period are as follows:
Grant date Vesting date Number granted
Tranche #4 01-Mar-17 15-Feb-20 712,615 Tranche #5 01-Feb-18 15-Feb-21 822,152 Tranche #6a 04-Mar-19 15-Feb-22 1,146,035 Tranche #6b 16-May-19 15-Feb-22 192,940 Tranche #7 30-Nov-20 28-Feb-23 3,453,482 Total performance rights 6,327,224
Vesting conditions for the performance rights are as follows:
Tranche #4 - 3 years’ service from grant date and (i) 75% of rights subject to EPS achieving EPS hurdle of 12% CAGR and (ii) 25% subject to achieving a Total Shareholder Return (TSR) performance hurdle.
Tranche #5 - 3 years’ service from grant date and (i) 75% of rights subject to EPS achieving EPS hurdle of 10% CAGR and (ii) 25% subject to achieving a Total Shareholder Return (TSR) performance hurdle.
Tranche #6a & #6b - 3 years’ service from grant date and (i) 75% of rights subject to EPS achieving 10% CAGR EPS and (ii) 25% subject to achieving a Total Shareholder Return (TSR) performance hurdle.(1)
Tranche #7 - 3 years’ from start of performance period and (i) 1/3 of rights subject to achieving Free Cash Flow (FCF) of 6.33 cents per share of and (ii) 1/3 subject to achieving a Return on Capital (ROC) of 12.9% and 1/3 subject to achieving a Relative TSR Hurdle of at or above 75%
(1) Relative Total Shareholder return (TSR) over a three-year performance period assessed against the ASX200 index (excluding Financials and Industrials), representing 25% of the award.
Long-term incentive plan - performance rights
Tranche #4 performance rights which were due to vest on 15 February 2020, did not meet the vesting conditions and the LTI program for 2017 shares lapsed.
Tranche #7 was granted in November 2020.
Reconciliation of performance rights
The number of performance rights on issue during the year ended 31 December 2020 are illustrated below:
Number of rights Face Value # $'000
Outstanding at 1 January 2020 2,829,236 10,032 Exercised during the period -
- - - Granted during the period 3,453,482 4,455
Forfeited (974,434) (3,729) Outstanding at 31 December 2020 5,308,284 10,758 Exercisable at 31 December 2020 -
- - -
The share-based payment expense has been adjusted to reflect the expectation that vesting conditions for non-market based hurdles for all open tranches, excluding Tranche 7, are not expected to be met.
80

As a result, a net share based payment expense relating to the performance rights was recorded in the year to 31 December 2020 of $1,281,193 (2019: $2,115,000 expense) and is included in the 'Employee benefits' expense line in the consolidated statement of profit or loss and other comprehensive income.
Measurement of fair values
The fair value of the share-based payment plan was measured based on the Monte Carlo and Binomial models. The inputs used in the measurement of the fair values at grant date were as follows:
Fair value of performance rights and assumptions Tranche #4
Tranche #5
Tranche #6a
Tranche #6b
Tranche #7
Share price at grant date $4.29 $4.58 $3.49 $3.75 $1.74 5-day VWAP at grant date $4.54 $4.54 $3.58 $3.63 $1.70 Fair value at grant date (EPS hurdle) $3.91 $4.15 $3.17 $3.43 - Fair value at grant date (TSR hurdle) $2.20 $2.80 $1.76 $2.07 $0.58 Fair value at grant date (FCF hurdle) - - - - $1.64 Fair value at grant date (ROC hurdle) - - - - $1.64 Exercise price Nil Nil Nil Nil Nil Expected volatility 36.30% 33.00% 32.20% 31.50% 60.00% Expected life 3 years 3 years 3 years 3 years 3 years Expected dividends 3.31% 3.40% 3.40% 3.40% 1.00% Risk-free interest rate (based on government bonds) 1.99% 2.13% 1.69% 1.19% 0.11%
Accounting policy: Employee benefits
i) Short-term employee benefits
Short-term employee benefits are expensed as the related service is provided. A liability is recognised for the amount expected to be paid if the Group has a present legal or constructive obligation to pay this amount as a result of past service provided by the employee and the obligation can be estimated reliably.
Short-term incentive plan - performance rights
In response to the COVID 19 pandemic impact, the Company chose to provide short-term incentives for 2020 in the form of shares instead of cash. The vesting conditions for the shares completed at the period end date and 6,953,000 shares will be issued in 2021 under the short-term incentive plan. An expense of $11,390,742 with a corresponding increase in equity, based on the number of shares expected to be issued at the market price on grant dates of 25 September 2020 and 30 November 2020 have been recorded in the period.
ii) Long service leave
The liability for long service leave is recognised in the provision for employee benefits and measured as the present value of expected future payments to be made in respect of services provided by employees up to the reporting date using the projected unit credit method. Consideration is given to expected future wage and salary levels, experience of employee departures and periods of service.
Expected future payments are discounted using market yields at the reporting date on corporate bonds with terms to maturity and currency that match, as closely as possible, the estimated future cash outflows. Benefits falling more than 12 months after the end of the reporting period are classified as non-current.
iii) Shared-based payment transactions
The Group currently engages in the practise of allocating its employees long-term equity share-based payments as part of their remuneration packages.
81

The grant date fair value of long-term share-based payment arrangements granted to employees is recognised as share-based payment expense, with a corresponding increase in equity, over the period that the employees become unconditionally entitled to the awards. The amount recognised as an expense is adjusted to reflect the number of awards for which the related service and non-market performance conditions are expected to be met, such that the amount is ultimately recognised as an expense for the strategic milestone. Expense related to the TSR are measured on grant and is not subsequently adjusted based on the number of awards that meet the related service and non-market performance conditions at the vesting date.
iv) Termination benefits
Termination benefits are payable when employment is terminated before the normal retirement date, or when an employee accepts voluntary redundancy in exchange for these benefits. The Group recognises termination benefits when it is demonstrably committed to either terminating the employment of current employees according to a detailed formal plan without possibility of withdrawal or to providing termination benefits as a result of an offer made to encourage voluntary redundancy. Benefits falling due more than 12 months after the end of the reporting period are discounted to present value and classified as non-current.
v) Defined contribution plans
Obligations for contributions to defined contribution plans are expensed as the related service is provided. Prepaid contributions are recognised as an asset to the extent a cash refund or reduction of future payments is available.
Employee benefits expense includes contributions to defined contribution plans of $8,498,000 for the current reporting period (2019: $7,301,000).
10. Income tax a) Tax recognised in profit or loss
Restated
31-Dec-20 31-Dec-19 $'000 $'000
Current tax expense Current tax expense 3,382 6,842 Adjustment for prior periods 100 564 Total current tax expense 3,482 7,406 Deferred tax (benefit) / expense Origination and reversal of temporary difference (12,150) 2,118 Total deferred tax (benefit) / expense (12,150) 2,118 Total income tax (benefit) / expense (8,668) 9,524
Tax recognised in other comprehensive income (OCI) 2020 2019
Before tax Tax
(expense) / benefit
Net of tax Before tax Tax
(expense) / benefit
Net of tax
$'000 $'000 $'000 $'000 $'000 $'000 Changes in fair value of cash flow hedges (482) 144 (338) (11,319) 3,383 (7,936)
82

Reconciliation between income tax expense and pre-tax profit
Restated
31-Dec-20 31-Dec-19 $'000 $'000
(Loss) / Profit after income tax for the year (35,718) 13,653 Total income tax (benefit) / expense (8,668) 9,524 (Loss) / Profit before income tax (44,386) 23,177 Tax using the Company's domestic tax rate 30% (2019: 30%) (13,316) 6,953 Effect of tax rate in foreign jurisdictions (130) (162) Non-deductible expenses 4,650 2,200 Effect of share of loss / (profit) of equity-accounted investees 28 (31) (Over)/Under provided in prior years 100 564 Total income tax (benefit) / expense (8,668) 9,524
The effective tax rate is calculated as company income tax expense divided by profit before income tax, adjusted for post-tax share of results of equity-accounted investees. Restated
31-Dec-20 31-Dec-19 $'000 $'000
(Loss) / Profit from ordinary activities before income tax (44,386) 23,177 Add/(less): Post-tax share of results of equity-accounted investees 93 (105) (Loss) / Profit before income tax (44,293) 23,072 Income tax (benefit) / expense (8,668) 9,524 Total income tax (benefit) / expense 19.6% 41.3%
b) Recognised deferred tax assets and liabilities
2020
Balance 1-Jan-20
Recognised in profit or
loss
Recognised in Equity
Recognised in OCI
Balance 31-Dec-20
$'000 $'000 $'000 $'000 $'000 Plant, property and equipment (3,512) 1,811 - - (1,701) Right-of-use asset (238,425) 21,312 - - (217,113) Transaction costs related to acquisitions and equity raising 1,133 (746) - - 387 Cash flow hedges 4,153 1,203 - 144 5,500 Other capital costs deductible over 5 years 2,263 (795) 1,633 - 3,101 Accrued expenses 1,145 (234) - - 911 Provisions 4,994 192 - - 5,186 Employee benefits provision 3,197 (149) - - 3,048 Licences acquired (49,369) 5,580 - - (43,789) Other intangibles (3,822) 344 - - (3,478) Unearned revenue 852 (574) - - 278 Lease liabilities 245,062 (16,009) - - 229,053 Other 90 215 - - 305 Total tax assets/(liabilities) (32,239) 12,150 1,633 144 (18,312)
83

2019
Restated Balance
1-Jan-19
Restatement for AASB16
Restated Balance
1-Jan-19
Recognised in profit or
loss
Recognised in OCI
Restated Balance
31-Dec-19 $'000 $'000 $'000 $'000 $'000 $'000
Plant, property and equipment (6,164) - (6,164) 2,652 - (3,512) Right-of-use asset - (195,550) (195,550) (42,875) - (238,425) Transaction costs related to acquisitions and equity raising 1,957 - 1,957 (824) - 1,133
Cash flow hedges 669 - 669 101 3,383 4,153 Other capital costs deductible over 5 years 960 - 960 1,303 - 2,263
Accrued expenses 3,926 - 3,926 (2,781) - 1,145 Provisions 16,097 (3,358) 12,739 (7,745) - 4,994 Employee benefits provision 2,858 - 2,858 339 - 3,197 Licences acquired (54,653) - (54,653) 5,284 - (49,369) Other intangibles (2,893) - (2,893) (929) - (3,822) Unearned revenue 702 - 702 150 - 852 Lease liabilities - 202,063 202,063 42,999 - 245,062 Other (1,199) 1,081 (118) 208 - 90 Total tax assets/(liabilities) (37,740) 4,236 (33,504) (2,118) 3,383 (32,239)
Restated
31-Dec-20 31-Dec-19 $'000 $'000
Deferred tax assets - - Deferred tax liabilities (18,312) (32,239) Net deferred tax liability (18,312) (32,239)
Accounting policy: Income tax
Income tax expense comprises current and deferred tax. It is recognised in profit or loss except to the extent that it relates to a business combination or items recognised directly in equity or in other comprehensive income (OCI).
Current tax comprises the expected tax payable or receivable on the taxable income or loss for the year and any adjustment to the tax payable or receivable in respect of previous years. The amount of current tax payable or receivable is the best estimate of the tax amount expected to be paid or received. It is measured using tax rates enacted or substantively enacted at the reporting date. Current tax also includes any tax arising from dividends. Current tax assets and liabilities are offset only if certain criteria are met.
Deferred tax assets and liabilities are recognised for temporary differences at the tax rates expected to apply when the assets are recovered, or liabilities are settled, based on those tax rates which are enacted or substantially enacted for each jurisdiction. The relevant tax rates are applied to the cumulative amounts of deductible and taxable temporary differences to measure the deferred tax asset or liability. Deferred tax assets are recognised for deductible temporary differences and unused tax losses only if it is probable that future taxable amounts will be available to utilise those temporary differences and losses.
Deferred tax assets and liabilities are not recognised for temporary differences between the carrying amount and tax bases of investments in controlled entities where the parent entity is able to control the timing of the reversal of the temporary differences and it is probable that the temporary differences will not reverse in the foreseeable future.
With regards to measuring deferred tax consequences on licences and brands, management considers the tax consequences of recovery through use and then disposal separately. Under this approach the tax base from use (nil as the licences and brands are not depreciable for tax) is considered separate from the tax base from disposal (capital gains tax value). This results in a taxable temporary difference (deferred tax liability) on revenue account and a deductible temporary difference (deferred tax asset) on capital account. As it is not currently probable that future capital gains will be made, the deferred tax asset has not been recognised.
84

2020 accounting policy change
In May 2020, the IFRS Interpretations Committee (IFRS IC) published its final agenda decision ‘Multiple Tax Consequences of Recovering an Asset (IAS 12 Income Taxes)’ which considers how an entity accounts for deferred taxes on an asset that has two distinct tax consequences over its life that cannot be offset (taxable economic benefits from use and capital gains on disposal or expiry). The IFRS IC concluded that in these circumstances an entity identifies separate temporary differences (and deferred taxes) that reflect these distinct and separate tax consequences of recovering the assets carry amount.
The Group’s accounting policy relating to the tax consequences of Brands had previously been to consider these two tax consequences of recovering the assets carrying amount together as they crystallised over the assets life, irrespective of how the asset was recovered. The accounting policy does not align with the IFRS IC agenda decision.
As a result of the IFRS IC agenda decision, the Group has changed its accounting policy, retrospectively adjusting the deferred tax accounting for Brands. The impact of this change in accounting policy for the comparative reporting period and the beginning of the earliest period presented are shown below.
Impact for 12 months ended 31 December 2019
Previous Policy Change New Policy $'000 $'000 $'000
Goodwill 592,745 2,935 595,680 Deferred tax asset / (liability) (30,984) (1,255) (32,239) Retained earnings / (accumulated losses) (45,465) 1,680 (43,785) Income tax expense (9,739) 215 (9,524) Change in EPS 4.9 0.1 5.0
Impact at 1 January 2019
Previous Policy Change New Policy $'000 $'000 $'000
Goodwill 595,750 2,935 598,685 Deferred tax asset / (liability) (36,270) (1,470) (37,740) Retained earnings / (accumulated losses) (22,839) 1,465 (21,374)
Had the Group continued to apply the previous accounting policy in the current period, at 31 December 2020, goodwill would have been lower by $2,696,000, deferred tax liabilities would have been lower by $1,090,000, impairment expense would have been lower by $239,000, loss before tax would have been lower by $239,000, tax benefit would have been lower by $164,000, net loss after tax would have been lower by $74,000, and earnings per share would have been lower by 0.03 cents.
Tax consolidation legislation
oOh!media Limited and its wholly owned Australian controlled subsidiaries apply the tax consolidation legislation.
The deferred tax balances recognised by the parent entity and the consolidated entity in relation to wholly-owned entities joining the tax consolidated group are initially measured and remeasured based on the carrying amounts of the assets and liabilities of those entities at the level of the tax consolidated group and their tax values, as applicable under the tax consolidation legislation.
oOh!media Limited, as the head entity in the tax consolidated group, recognises current and deferred tax amounts relating to transactions, events and balances of the controlled entities in this group as if those transactions, events and balances were its own, in addition to the current and deferred tax amounts arising in relation to its own transactions, events and balances. Amounts receivable or payable under a tax sharing agreement with the tax consolidated entities are recognised as tax-related amounts receivable or payable.
85

Expenses and revenues arising under the tax sharing agreement are recognised as a component of income tax (expense)/benefit.
In accordance with Urgent Issues Group Interpretation 1052 "Tax Consolidation Accounting", the controlled entities in the tax consolidated group account for their own deferred tax balances, except for those relating to tax losses.
11. Trade and other receivables 31-Dec-20 31-Dec-19
$'000 $'000 Trade receivables 85,577 131,744 Allowance for impairment of receivables (1,025) (1,449)
84,552 130,295 Other receivables 928 3,224 Total trade and other receivables 85,480 133,519
Information on the Group's exposure to credit and market risks and impairment losses for trade and other receivables are included in Note 24 Financial risk management.
Accounting policy: Trade receivables
All trade debtors are recognised at the amount receivable as they are due for settlement no more than 45 days from the date of recognition. Recoverability of trade receivables is reviewed on an ongoing basis. Debts which are known to be uncollectible are written off. A provision for doubtful receivables is calculated using an expected credit losses provision matrix. The provision matrix is based on the Group's historical observed default rates, adjusted for forward looking estimates. The historical observed default rates are updated to reflect current and forecast credit conditions on each reporting date. Provisions for specific receivables are recognised in addition to the general provision originating from the expected credit losses matrix.
The amount of the provision is recognised in the consolidated statement of financial position with a corresponding charge recognised in the consolidated statement of profit or loss and other comprehensive income.
12. Property, plant and equipment Reconciliation of carrying amount
2020 Leasehold
improvements Plant & equipment Total $'000 $'000 $'000
Cost Balance as at 1 January 2020 10,017 385,991 396,008 Additions 1,851 11,176 13,027 Disposals - (2,764) (2,764) Reclassification 2 (3,073) (3,071) Other (430) 217 (213) As at December 2020 11,440 391,547 402,987 Accumulated depreciation Balance as at 1 January 2020 (6,759) (140,978) (147,737) Depreciation for the year (1,754) (40,512) (42,266) Disposals 95 1,021 1,116 Reclassification 451 (256) 195 Other - (90) (90) As at December 2020 (7,967) (180,815) (188,782) Carrying amount at 31 December 2020 3,473 210,732 214,205
86

2019 Leasehold
improvements Plant & equipment Total
$'000 $'000 $'000 Cost Balance as at 1 January 2019 9,705 339,694 349,399 Additions 323 47,431 47,754 Disposals (17) (1,425) (1,442) Effects of movement in exchange rates 6 291 297 As at December 2019 10,017 385,991 396,008 Accumulated depreciation Balance as at 1 January 2019 (4,697) (100,650) (105,347) Depreciation for the year (2,062) (41,396) (43,458) Disposals - 1,169 1,169 Effects of movements in exchange rates - (101) (101) As at December 2019 (6,759) (140,978) (147,737) Carrying amount at 31 December 2019 3,258 245,013 248,271
Accounting policy: Plant and equipment
Plant and equipment are stated at historical cost less accumulated depreciation and any accumulated impairment losses. Historical cost includes expenditure that is directly attributable to the acquisition of the items, except as noted above.
Subsequent costs are included in the asset’s carrying amount or recognised as a separate asset, as appropriate, only when it is probable that future economic benefits associated with the item will flow to the Group and the cost of the item can be measured reliably. All other repairs and maintenance are charged to the statement of comprehensive income during the financial period in which they are incurred.
Within the Group, depreciation is calculated on a straight-line basis to write-off the cost of each item of plant and equipment over its estimated remaining useful life (less the estimated residual value). Estimates of remaining useful lives are made on a regular basis for all assets, with annual reassessments for major items. The expected useful lives are as follows:
- Leasehold improvements 2-10 years; and - Plant and equipment 2-20 years. Gains and losses on disposals are determined by comparing proceeds with carrying amounts. These are included in the statement of comprehensive income.
Accounting policy: Maintenance and repairs
Certain plant and equipment are required to be overhauled on a regular basis. This is managed as part of an ongoing major cyclical maintenance program. The costs of this maintenance are charged as expenses as incurred, except where they relate to the replacement of a component of an asset, in which case the costs are capitalised and depreciated over their useful lives. Other routine operating maintenance, repair costs and minor renewals are charged as expenses as incurred.
13. Right-of-use assets 31-Dec-20 31-Dec-19
$'000 $'000 Balance as at 1 January 807,608 645,595 Depreciation for the year (158,127) (166,004) Additions, modifications and remeasurements 145,119 328,017 Disposals (13,861) - COVID-19 related Lease modification (1) (53,496) - As at 31 December 727,243 807,608
(1) Due to Covid-19 a number of leases have moved from a fixed to variable rent.
87

Accounting policy: Right-of-use - intangible assets
The Group recognises a right-of-use asset and a lease liability at the lease commencement date. The right-of-use asset is initially measured at cost, and subsequently at cost less any accumulated depreciation and impairment losses and adjusted for certain remeasurements of the lease liability. The right-of-use assets are depreciated over the lease term using the straight-line method.
Lease modification is a change in the scope of a lease, or the consideration for a lease, that was not part of its original terms and conditions. Common lease modifications include, for example: increasing the scope of the lease by adding the right to use one or more underlying assets; decreasing the scope of the lease by removing the right to use one or more underlying assets or shortening the contractual lease term; increasing the scope of the lease by extending the contractual lease term; and changing the consideration in the lease by increasing or decreasing the lease payments. Changes that result from renegotiations and changes to the terms of the original contract are lease modifications.
When the right to use one or more underlying assets is removed, a corresponding adjustment is made to decrease the carrying amount of the right-of-use asset to reflect the lease. The Group shall then recognise in profit or loss (if any) relating to the termination of the lease and making corresponding adjustments to the lease liabilities.
14. Intangible assets and goodwill Reconciliation of carrying amount
2020 Brands Goodwill Licences Software Total $'000 $'000 $'000 $'000 $'001 Cost Balance as at 1 January 2020 9,783 601,818 254,647 38,645 904,893 Additions - - 500 2,848 3,348 Disposals - - - - - Reclassification - - 2,015 1,056 3,071 Effects of movement in exchange rates - - (656) - (656) As at December 2020 9,783 601,818 256,506 42,549 910,656 Accumulated amortisation Balance as at 1 January 2020 (5,599) (6,138) (87,008) (11,252) (109,997) Amortisation for the year (550) - (19,390) (3,451) (23,391) Disposals - - - - - Reclassification - - - (195) (195) Impairment - (1,041) (306) - (1,347) Effects of movements in exchange rates - - (567) - (567) As at December 2020 (6,149) (7,179) (107,271) (14,898) (135,497) Carrying amount at 31 December 2020 3,634 594,639 149,235 27,651 775,159
88

2019 Restated (1) Brands Goodwill Licences Software Total $'000 $'000 $'000 $'000 $'001 Cost Balance as at 1 January 2019 9,783 601,323 254,279 34,109 899,494 Additions - 495 9 7,956 8,460 Disposals - - - (3,420) (3,420) Effects of movement in exchange rates - - 359 - 359 As at December 2019 9,783 601,818 254,647 38,645 904,893 Accumulated amortisation and impairment Balance as at 1 January 2019 (4,882) (2,638) (66,968) (9,277) (83,765) Amortisation for the year - - (20,710) (1,975) (22,685) Impairment - (3,500) - - (3,500) Reclassification (717) - 717 - - Effects of movements in exchange rates - - (47) - (47) As at December 2019 (5,599) (6,138) (87,008) (11,252) (109,997) Carrying amount at 31 December 2019 4,184 595,680 167,639 27,393 794,896
(1) As a result of the IFRS IC agenda decision, the Group has changed its accounting policy, retrospectively adjusting the deferred tax accounting for Brands. Refer Note 10.
Accounting policy: Intangible assets
i) Goodwill
Goodwill represents the excess of the purchase consideration plus incidental costs over the fair value of the identifiable net assets acquired. Goodwill acquired in business combinations is not amortised. Instead, goodwill is tested for impairment annually, or more frequently, if events or changes in circumstances indicate that it might be impaired and is carried at cost less accumulated impairment losses. Goodwill is allocated to cash generating units for impairment testing. Refer to Note 15 Non-current assets for further information.
ii) Licences
Licences represent the rights and relationships associated with acquired site leases and the associated new business revenue streams. Licences are amortised over their expected useful life.
iii) Software
Software that is acquired by the Group and has a finite useful life is measured at cost less accumulated amortisation and any accumulated impairment losses.
iv) Amortisation
Amortisation is calculated to write-off the cost of intangible assets less estimated residual values using the straight-line method over their estimated useful lives and is recognised in the consolidated statement of profit or loss and comprehensive income. The estimated useful lives are as follows:
- Licences 11-15 years; - Brands 2-15 years; and - Software 3-7 years.; Amortisation methods, useful lives and residual values are reviewed at each reporting date and adjusted if appropriate. Other than noted above there has been no change to the useful life or residual value of assets held in the current year.
89

15. Non-current assets Cash generating units (CGUs) for the purpose of goodwill impairment testing have been identified as follows for the year ended 31 December 2020: Australia, New Zealand, Cactus, and Junkee Media.
Goodwill is allocated to CGUs as shown below:
Australia Cactus Junkee New Zealand Total
$'000 $'000 $'000 $'000 $'000 Goodwill 514,845 2,917 - 76,877 594,639
The Company assessed the impact of COVID-19 as a potential impairment indicator and performed procedures to assess the recoverable value of groups of CGUs to which goodwill attaches and for individual CGUs with tangible and intangible assets excluding goodwill.
The recoverable value of the Group’s CGUs was determined by using a discounted cash flow methodology. Under this methodology, estimated post-tax cash flows are discounted to their present value using a post-tax discount rate. The discount rate used reflects current market assessment of the time value of money and the risks specific to oOh!media CGUs. Due to the uncertainty of cash flows as a direct result of the COVID-19 operating environment, probability weighted scenarios were used within the discounted cash flow model. The recoverable amount represents the fair value less cost of disposal. The key assumptions, reflecting current conditions, are as follows:
i. Annual earnings before interest, tax, depreciation and amortisation growth (EBITDA): based on high, mid and low case revenue scenarios. The Company is forecasting that the advertising market returns to pre COVID-19 levels during CY2022, and have forecast annual growth of 4% into 2024
ii. Terminal growth rate in year 5: 3.0% for all CGUs, except 2.0% for Cactus iii. Discount rate post-tax: Australia 9.80% (2019: 9.04%) and New Zealand 11.60% (2019: 10.22%), Cactus
11.80% (2019: 11.53%) and Junkee Media 14.20% (2019: 14.00%)
The values assigned to the key assumptions represent management’s assessment of future trends in the media industry and are based on historical and projected data from both external and internal sources.
The application of these EBITDA and growth rate assumptions have given rise to an impairment loss of $1,900,000 in the reporting period for the remainder of the goodwill and intangible assets in Junkee Media only, shown as intangible impairment expense on the consolidated statement of profit and loss and other comprehensive income. The carrying value of the intangible assets in Junkee Media, including goodwill, after the impairment is nil.
Based on these assumptions, there was no impairment loss in any other CGU. Sensitivity analysis undertaken on the assumptions modelled if there were a change in the assumptions by the magnitudes indicate the below:
i. Australia CGU: an impairment loss if there was a decrease in the 2019-2024 revenue CAGR below 0.9%, all other assumptions held constant
ii. Australia CGU: no impairment would result if there was a decrease in the terminal growth rate from year 5 by 100bp to 2.0%, nor an impairment if there was an increase in the discount rate by 70bp to 10.50%, all other assumptions held constant
iii. NZ CGU: an impairment loss if there was a decrease in the 2019-2024 revenue CAGR below -1.3%, all other assumptions held constant
iv. NZ CGU: no impairment would result if there was a decrease in the terminal growth rate from year 5 by 100bp to 2.0%, nor an impairment if there was an increase in the discount rate by 70bp to 12.30%, all other assumptions held constant
90

v. Cactus CGU: no impairment would result if there was a decrease in terminal growth rate from year 5 by 100bp to 1.0%, nor an impairment if there was an increase in the discount rate by 100bp to 12.80%, all other assumptions held constant.
Accounting policy: Impairment of assets
Non-financial assets
At each reporting date, the Group reviews the carrying amounts of its non-financial assets to determine whether there is any indication of impairment. If any such indication exists, then the asset’s recoverable amount is estimated. Goodwill is tested annually for impairment.
For impairment testing, assets are grouped together into the smallest group of assets that generates cash inflows from continuing use that are largely independent of the cash inflows of other assets or CGUs. Goodwill arising from a business combination is allocated to CGUs or groups of CGUs that are expected to benefit from the synergies of the combination.
The recoverable amount of an asset or CGU is the greater of its value in use and its fair value less costs to sell. Fair value less costs of disposal is based on the estimated future cash flows, discounted to their present value using a post-tax discount rate that reflects current market assessments of the time value of money and the risks specific to the asset or CGU.
An impairment loss is recognised if the carrying amount of an asset or CGU exceeds its recoverable amount.
Impairment losses are recognised in profit or loss. They are allocated first to reduce the carrying amount of any goodwill allocated to the CGU, and then to reduce the carrying amounts of the other assets in the CGU on a pro rata basis.
An impairment loss in respect of goodwill is not reversed. For other assets, an impairment loss is reversed only to the extent that the asset’s carrying amount does not exceed the carrying amount that would have been determined, net of depreciation or amortisation, if no impairment loss had been recognised.
The carrying value of assets allocated to each CGU is supported by their recoverable amount.
16. Inventories
31-Dec-20 31-Dec-19 $'000 $'000
Gross value of inventories 4,024 4,665 Provision for obsolescent stock (552) (640) Net value of inventories 3,472 4,025
Accounting policy: Inventories
Inventories are measured at the lower of original cost and replacement cost. The cost of inventories are based on first in first out methodology.
91

17. Other assets 31-Dec-20 31-Dec-19
$'000 $'000 Current Prepayments 7,186 5,476 Contract assets 10,262 21,342 Other assets 5,751 5,599 Total current other assets 23,199 32,417
Non-current Other assets - 1,988 Total non-current other assets - 1,988 Total other assets 23,199 34,405
18. Loans and borrowings 31-Dec-20 31-Dec-19
$'000 $'000 Current Interest bearing lease liabilities 159,424 170,025 Total current borrowings 159,424 170,025
Non-current Bank loan 195,000 419,000 Unamortised borrowing costs (3,723) (3,303) Interest bearing lease liabilities 645,127 681,748 Total non-current borrowings 836,404 1,097,445 Total loans and borrowings 995,828 1,267,470
In December 2020, the Group entered into a new fully underwritten 3-year debt facility with a syndicate of lending banks, with a facility limit of $350,000,000. As a result of this significant modification to the Group’s debt facilities, any remaining unamortised borrowing costs from the previous facility were expensed to the consolidated statement of profit and loss and other comprehensive income. The banking syndicate has security over the assets of the Company and its Subsidiaries and dividend payments by the Group are subject to banking syndicate consent.
Information about the Group's exposure to interest rate, foreign currency and liquidity risks is included in Note 24 Financial risk management.
Accounting Policy: Borrowings
Borrowings are initially recognised at fair value, net of transaction costs incurred. Borrowings are subsequently measured at amortised cost. Any difference between the proceeds (net of transaction costs) and the redemption amount is recognised in profit or loss over the period of the borrowings using the effective interest method. Fees paid on the establishment of loan facilities are recognised as transaction costs of the loan to the extent that it is probable that some or all of the facility will be drawn down. In this case, the fee is deferred until the draw down occurs. To the extent there is no evidence that it is probable that some or all of the facility will be drawn down, the fee is capitalised as a prepayment for liquidity services and amortised over the period of the facility to which it relates.
Borrowings are derecognised when the obligation specified in the contract is discharged, cancelled or expired. The difference between the carrying amount of a financial liability that has been extinguished or transferred to another party and the consideration paid, including any non-cash assets transferred or liabilities assumed, is recognised in profit or loss as other income or finance costs.
92

Borrowings are classified as current liabilities unless the Group has an unconditional right to defer settlement of the liability for at least 12 months after the reporting period.
Lease liabilities 31-Dec-20 31-Dec-19
$'000 $'000 Within one year 142,538 180,771 Later than one year but not later than five years 452,125 503,045 Later than five years 366,912 368,414 Total undiscounted lease liabilities at 31 December (1) 961,575 1,052,230 Lease liabilities included in the statement of financial position at 31 December 804,551 851,773 Current 159,424 170,025 Non-current 645,127 681,748
(1) Lease terms range from 1 to 23 years. The weighted average incremental borrowing rate applied is 4.9%.
Variable rent payments not included in the measurement of the lease liabilities listed above was $24,626,000 for the year ended 31 December 2020.
Accounting policy: Interest bearing lease liabilities
The Group recognises a right-of-use asset and a lease liability at the lease commencement date. The lease liability is initially measured at the present value of the lease payments at the commencement date, discounted using the Group’s incremental borrowing rate. The lease liability is subsequently increased by the interest cost on the lease liability (recognised in Finance costs on the income statement) and decreased by lease payments made.
Lease modification is a change in the scope of a lease, or the consideration for a lease, that was not part of its original terms and conditions. Common lease modifications include, for example: increasing the scope of the lease by adding the right to use one or more underlying assets; decreasing the scope of the lease by removing the right to use one or more underlying assets or shortening the contractual lease term; increasing the scope of the lease by extending the contractual lease term; and changing the consideration in the lease by increasing or decreasing the lease payments. Changes that result from renegotiations and changes to the terms of the original contract are lease modifications. Changes in the assessment of whether an extension option is reasonably certain to be exercised is a lease modification and the Group has applied judgement to determine whether it is reasonably certain to exercise an extension option.
When the right to use one or more underlying assets is removed, a corresponding adjustment is made to decrease the carrying amount of the lease liabilities to reflect the lease modification. The Group shall then recognise in profit or loss (if any) relating to the termination of the lease and making corresponding adjustments to the right-of-use asset.
19. Trade and other payables 31-Dec-20 31-Dec-19
$'000 $'000 Trade payables 3,308 27,071 Accrued expenses 28,383 38,648 Contract liability 6,611 7,786 Other payables 4,294 5,945 Total trade and other payables 42,596 79,450
Information about the Group's exposure to currency and liquidity risks is included in Note 24 Financial risk management.
93

Accounting policy: Trade and other payables
These amounts represent liabilities for goods and services provided to the Group prior to the end of the financial year, which are unpaid. The amounts are unsecured and are usually paid within 30 days of recognition. Contract liabilities are recognised within trade payables where invoices are issued in advance of the period in which the revenue is earned.
20. Make good provisions
31-Dec-20 31-Dec-19 $'000 $'000
Make good provision Balance as at 1 January 15,831 16,636 Provisions used during the year (293) (1,091) Provisions made during the year 145 2,355 Provisions released during the year - (2,078) Effects of movement in exchange rates 3 9 As at 31 December 15,686 15,831 Current provisions 828 661 Non-current provisions 14,858 15,170 As at 31 December 15,686 15,831
Accounting policy: Make good provisions
Provisions are determined by discounting the expected future cash flows at a pre-tax rate that reflects current market assessments of the time value of money and the risks specific to the liability. The unwinding of the discount is recognised as a finance cost.
A make good provision is recognised for the costs of restoration or removal in relation to plant and equipment and site leases where there is a legal or constructive obligation. The provision is initially recorded when a reliable estimate can be determined and discounted to present value. The unwinding of the effect of discounting on the provision is recognised as a finance cost. At the time of initial recognition of the make good provision, a corresponding asset is recognised as part of plant and equipment.
21. Derivative liabilities
31-Dec-20 31-Dec-19 $'000 $'000
Interest rate derivative liability 18,335 13,094 Total derivative liabilities 18,335 13,094
Information about the fair value of derivative instruments is included in Note 23 Fair values.
22. Capital and reserves a) Contributed equity 31-Dec-20 31-Dec-19 31-Dec-20 31-Dec-19
number number $'000 $'000 Opening balance as at 1 January 242,385,958 236,640,789 694,913 675,371 Employee rights issue - 843,816 - 3,569 Other performance rights issue - 308,704 - 1,077 Dividend reinvestment plan 34,300,577 4,592,649 18,179 14,896 Capital raising - shares issued 315,101,745 - 163,199 - Issued and paid up share capital 591,788,280 242,385,958 876,291 694,913
94

Ordinary shares
In April 2020, the Company concluded its capital raise, in which 315,101,745 new fully paid ordinary shares were issued. This was made up of: 289,123,959 new shares under the institutional component of the Entitlement offer, and 25,977,786 new shares under the retail component of the Entitlement Offer. Issue share price of $0.53.
The Company does not have authorised capital or par value in respect of its issued shares. All issued shares are fully paid. The holders of these shares are entitled to receive dividends as declared from time to time and are entitled to one vote per share at general meetings of the Company.
b) Reserves
Nature and purpose of reserves
31-Dec-20 31-Dec-19
$'000 $'000 Foreign currency translation reserve 522 1,370 Other equity reserve 16,608 16,608 Cash flow hedge reserve (9,632) (9,294) Share based payment reserve 21,293 8,621 Total reserves 28,791 17,305
Foreign currency translation reserve - The translation reserve comprises all foreign currency differences arising from the translation of the financial statements of foreign operations in New Zealand. Refer to Note 3(n) Significant accounting policies.
Other equity reserve - The other equity reserve mostly represents the difference between the issued capital in Outdoor Media Investments Limited (OMI) and the consideration paid to acquire OMI on 18 December 2014. The transaction was accounted for as a common control transaction as disclosed in the annual financial statements for the year ended 31 December 2014. The other equity reserve reflects the share price movements for former OMI owners who remained as oOh!media Limited (OML) owners.
Cash flow hedge reserve - The hedging reserve comprises the effective portion of the cumulative net change in the fair value of hedging instruments used in cash flow hedges pending subsequent recognition in profit or loss as the hedged cash flows affect profit or loss. Refer to Note 23 Fair values.
Share-based payments reserve - The share-based payments reserve is used to record the value of share-based payments provided to employees as part of their remuneration and the expense relating to cancelled shares under the legacy share-based payments plan. The current balance relates to unexercised rights issued to senior executives and managers. This includes the short-term incentive at 31 December 2020. A portion of this reserve may be reversed against contributed equity if the underlying rights are exercised and results in shares being issued.
c) Non-controlling interest (NCI) 31-Dec-20 31-Dec-19 Non controlling interest $'000 $'000 Balance at 1 January (905) (784) Change of non-controlling interest - (106) Share of operating profit / (loss) for the period after income tax - (15) Balance at 31 December (905) (905)
95

d) Equity - dividends Amount per share
cents Total value ($) Dividends paid during 2020 Final 2019 dividend (paid 3 April 2020) 7.5 18,178,958 Interim 2020 dividend - - Total reserves 18,178,958
Dividends paid during 2019 Final 2018 dividend (paid 26 March 2019) 7.5 17,811,345 Interim 2019 dividend (paid 30 September 2019) 3.5 8,387,010 Total reserves 26,198,355
On 3 April 2020, a fully franked final dividend of 7.5 cents per ordinary share amounting to $18,178,958 was paid in respect of the year ended 31 December 2019 (31 December 2018: $17,811,345). The Company’s Dividend Reinvestment Plan operated for the Interim 2019 and Final 2019 dividends and each were fully underwritten.
As part of the Company’s response to the COVID-19 pandemic the Board announced in March 2020 the suspension of the Company’s dividend policy. In addition, under the amended terms of the bank finance facility agreed in March 2020, any dividend proposed by the Board is subject to the consent of the bank syndicate. No such consent has been sought for the Interim or Final 2020 reporting period.
The Board has not yet determined when the dividend policy will be re-instated and will continue to evaluate the suspension in light of the continuing impact of the COVID-19 pandemic, and subject to bank syndicate consent.
Dividend franking account
31-Dec-20 31-Dec-19 $'000 $'000
Adjusted franking account balance 42,866 49,807
Impact on franking account balance of dividends proposed after the reporting date but not recognised as a liability - (7,791)
Franking credits available to shareholders of the Company for subsequent financial years based on a tax rate of 30% 42,866 42,016
The ability to utilise franking credits is dependent upon the ability to declare dividends. In accordance with the tax consolidation legislation, the Company, as the head entity in the tax-consolidated group, has assumed the benefit of the $42,866,000 (2019: $42,016,000) franking credits.
e) Capital management policy
The Board's policy is to retain a strong capital base relative to normal trading conditions including media advertising industry cycles to maintain investor and creditor confidence and to sustain future development of the business. Capital consists of share capital, retained earnings and the non-controlling interest of the Group.
The Board seeks to maintain a balance between the higher returns that might be possible with higher levels of borrowings and the advantages and security afforded by a capital position.
Accounting policy: Share capital
Ordinary shares
Incremental costs directly attributable to the issue of ordinary shares are recognised as a deduction from equity. Income tax relating to transaction costs of an equity transaction are accounted for in accordance with AASB112 Income Taxes.
96

23. Fair values Accounting classifications and fair values
a) Fair values vs carrying amounts
The fair values of financial assets and liabilities equals the carrying amounts shown in the statement of financial position, with the exception of interest rate derivatives. The fair value of interest rate derivatives is determined as the present value of future contracted cash flows and credit adjustments.
b) Interest rates used for determining fair value
The interest rates used to discount estimated cash flows, where applicable, are based on the government yield curve at the end of the reporting period plus an appropriate credit spread, and were as follows:
31-Dec-20 31-Dec-19 Interest rate derivatives 1.80% - 2.80% 1.80% - 2.80% Bank loan 1.49% - 2.87% 2.75% - 3.90% Leases 1.60% - 7.26% 3.30%-7.30%
c) Fair values hierarchy
Fair values are categorised into different levels in a fair value hierarchy based on the inputs used in the valuation techniques as follows:
a) Level 1: quoted prices (unadjusted) in active markets for identical assets or liabilities. b) Level 2: inputs other than quoted prices included in Level 1 that are observable for the asset or liability,
either directly (i.e. as prices) or indirectly (i.e. derived from prices); and c) Level 3: inputs for the asset or liability that are not based on observable market data (unobservable
inputs).
The table below analyses financial instruments carried at fair value, by the levels in the fair value hierarchy. The different levels have been defined as below. It does not include fair value information for financial assets and financial liabilities not measured at fair value if the carrying amount is a reasonable approximation of fair value.
Consolidated 31 December 2020 31 December 2019
Carrying value Level 2 Level 3 Carrying
value Level 2 Level 3 $'000 $'000 $'000 $'000 $'000 $'000 Financial liabilities measured at fair value Interest rate derivatives (18,335) (18,335) - (13,094) (13,094) - Interest rate derivatives (liability) / asset (18,335) (18,335) - (13,094) (13,094) -
d) Valuation techniques
The fair value of Level 2 interest rate derivatives is determined as the present value of future contracted cash flows and credit adjustments. Cash flows are discounted using standard valuation techniques at the applicable market yield, having regard to the timing of the cash flows.
In accordance with AASB9, there has been a rebalancing of the interest rate derivative (hedging instrument) following repayments in April and June 2020 to the Debt Facility (hedged item). As a result, $110,000,000 of the hedging instrument has been designated as ineffective, and $4,394,000 has been accounted for in Finance Costs refer Note 8.
97
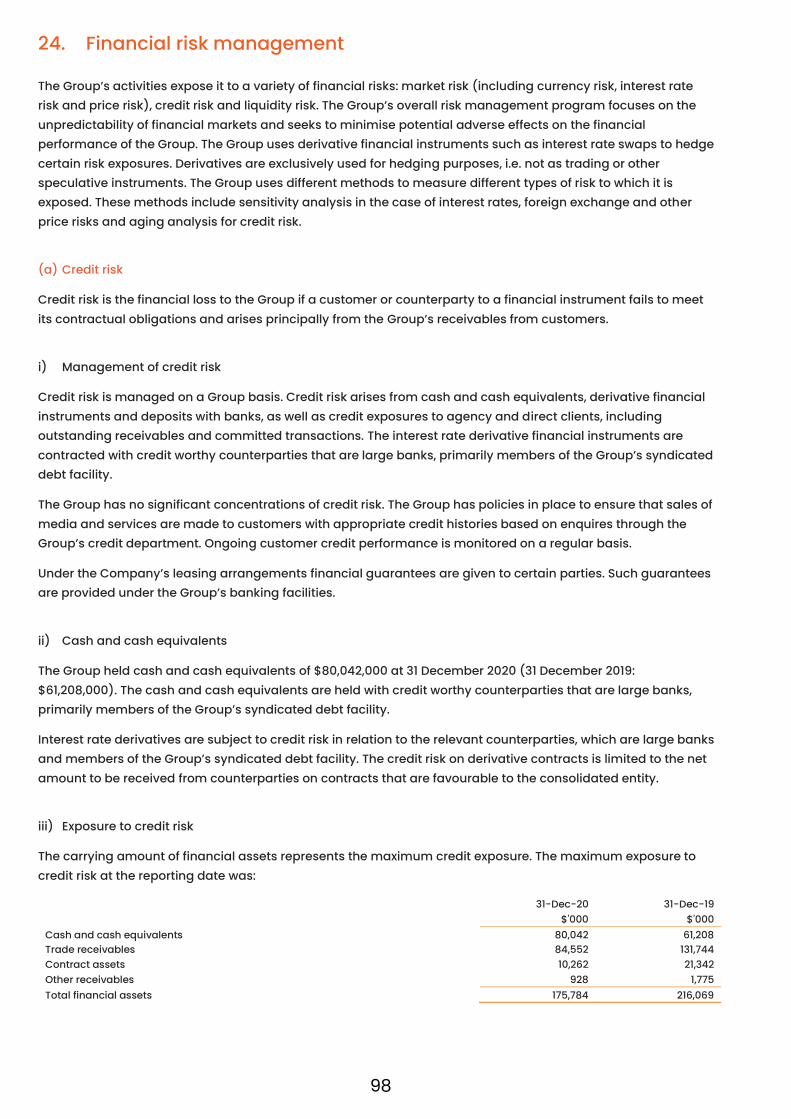
24. Financial risk management The Group’s activities expose it to a variety of financial risks: market risk (including currency risk, interest rate risk and price risk), credit risk and liquidity risk. The Group’s overall risk management program focuses on the unpredictability of financial markets and seeks to minimise potential adverse effects on the financial performance of the Group. The Group uses derivative financial instruments such as interest rate swaps to hedge certain risk exposures. Derivatives are exclusively used for hedging purposes, i.e. not as trading or other speculative instruments. The Group uses different methods to measure different types of risk to which it is exposed. These methods include sensitivity analysis in the case of interest rates, foreign exchange and other price risks and aging analysis for credit risk.
(a) Credit risk
Credit risk is the financial loss to the Group if a customer or counterparty to a financial instrument fails to meet its contractual obligations and arises principally from the Group’s receivables from customers.
i) Management of credit risk
Credit risk is managed on a Group basis. Credit risk arises from cash and cash equivalents, derivative financial instruments and deposits with banks, as well as credit exposures to agency and direct clients, including outstanding receivables and committed transactions. The interest rate derivative financial instruments are contracted with credit worthy counterparties that are large banks, primarily members of the Group’s syndicated debt facility.
The Group has no significant concentrations of credit risk. The Group has policies in place to ensure that sales of media and services are made to customers with appropriate credit histories based on enquires through the Group’s credit department. Ongoing customer credit performance is monitored on a regular basis.
Under the Company’s leasing arrangements financial guarantees are given to certain parties. Such guarantees are provided under the Group’s banking facilities.
ii) Cash and cash equivalents
The Group held cash and cash equivalents of $80,042,000 at 31 December 2020 (31 December 2019: $61,208,000). The cash and cash equivalents are held with credit worthy counterparties that are large banks, primarily members of the Group’s syndicated debt facility.
Interest rate derivatives are subject to credit risk in relation to the relevant counterparties, which are large banks and members of the Group’s syndicated debt facility. The credit risk on derivative contracts is limited to the net amount to be received from counterparties on contracts that are favourable to the consolidated entity.
iii) Exposure to credit risk
The carrying amount of financial assets represents the maximum credit exposure. The maximum exposure to credit risk at the reporting date was: 31-Dec-20 31-Dec-19
$'000 $'000 Cash and cash equivalents 80,042 61,208 Trade receivables 84,552 131,744 Contract assets 10,262 21,342 Other receivables 928 1,775 Total financial assets 175,784 216,069
98

iv) Receivables
The aging of trade receivables at the end of the reporting date that were not impaired was as follows: 31-Dec-20 31-Dec-19
$'000 $'000 Neither past due nor impaired 79,646 118,432 Past due 0-30 days 3,456 7,964 Past due 31-60 days 738 2,184 Past due 61-90 days 70 674 Past due 91+ days 642 2,490 Trade receivables 84,552 131,744
The movement in the allowance for impairment in respect of trade receivables during the year was as follows: 31-Dec-20 31-Dec-19
$'000 $'000 Balance at 1 January 1,449 1,109 Impairment loss recognised 47 427 Amounts written off (471) (87) Balance at 31 December 1,025 1,449
Other than those receivables specifically considered in the above allowance for impairment, the Group does not believe there is a material credit quality issue with the remaining trade receivables balance
(b) Liquidity risk
Liquidity risk is the risk that the Group will encounter difficulty in meeting the obligations associated with its financial liabilities that are settled by delivering cash or another financial asset. The Group’s approach to managing liquidity is to ensure that, as far as possible, it will always have sufficient liquidity to meet its liabilities when due, under both normal and stressed conditions, without incurring unacceptable losses or risking damage to the Group’s reputation. Stressed conditions used for liquidity management scenario planning do not extend to the COVID-19 coronavirus pandemic and widespread government restriction of movement conditions which resulted in a severe and immediate effect on advertising revenues in 2020. To meet the challenges of the COVID-19 pandemic the Group raised additional equity in April 2020 and retired debt.
i) Management of liquidity risk
Prudent liquidity risk management implies maintaining sufficient cash and the availability of funding through an adequate amount of committed credit facilities and the ability to close out market positions. The Group manages liquidity risk by continuously monitoring forecast and actual cash flows and matching the maturity profiles of financial assets and liabilities.
ii) Financing arrangements
The Group had access to the following undrawn borrowing facilities at the end of the reporting date:
31-Dec-20 31-Dec-19
$'000 $'000 Revolving facility including bank guarantees 111,426 65,174
iii) Maturities of financial liabilities
The table below analyses the Group’s financial liabilities, net and gross settled derivative financial instruments in relevant maturity groupings based on the remaining period at the reporting date to the contractual maturity
99
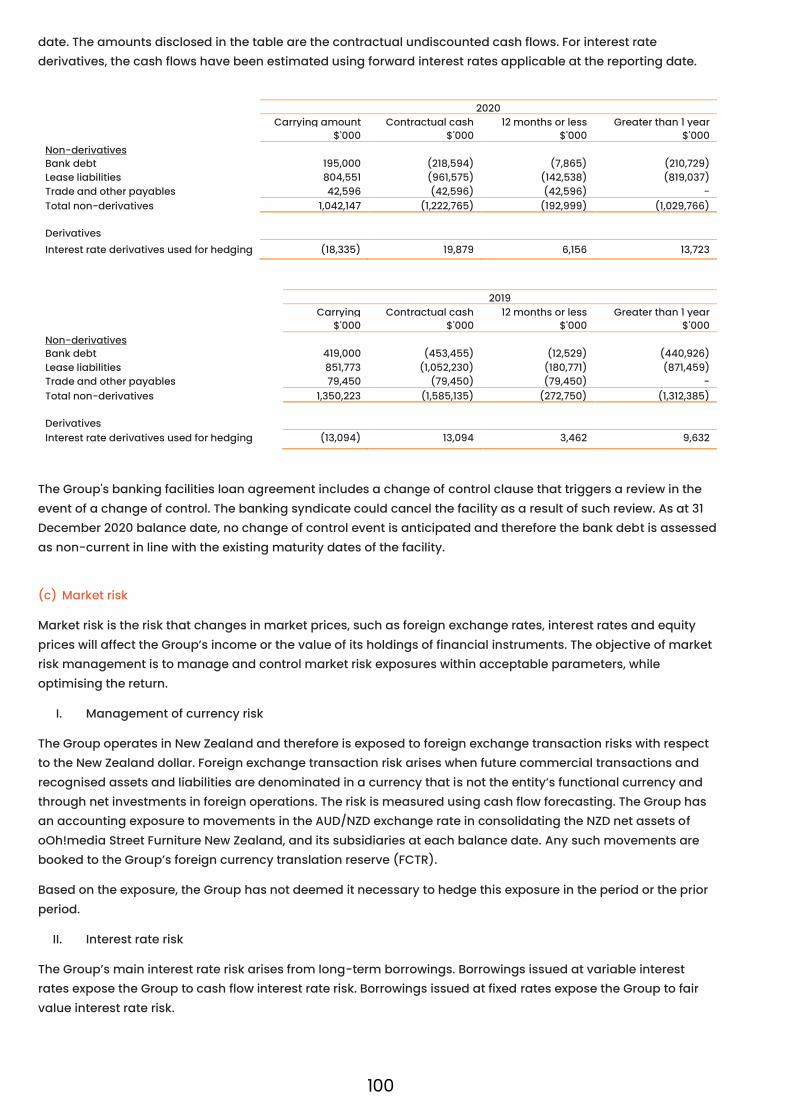
date. The amounts disclosed in the table are the contractual undiscounted cash flows. For interest rate derivatives, the cash flows have been estimated using forward interest rates applicable at the reporting date.
2020
Carrying amount Contractual cash flows
12 months or less Greater than 1 year $'000 $'000 $'000 $'000
Non-derivatives Bank debt 195,000 (218,594) (7,865) (210,729) Lease liabilities 804,551 (961,575) (142,538) (819,037) Trade and other payables 42,596 (42,596) (42,596) - Total non-derivatives 1,042,147 (1,222,765) (192,999) (1,029,766)
Derivatives
Interest rate derivatives used for hedging (18,335) 19,879 6,156 13,723 2019 Carrying
amount Contractual cash
flows 12 months or less Greater than 1 year
$'000 $'000 $'000 $'000 Non-derivatives Bank debt 419,000 (453,455) (12,529) (440,926) Lease liabilities 851,773 (1,052,230) (180,771) (871,459) Trade and other payables 79,450 (79,450) (79,450) - Total non-derivatives 1,350,223 (1,585,135) (272,750) (1,312,385) Derivatives Interest rate derivatives used for hedging (13,094) 13,094 3,462 9,632
The Group's banking facilities loan agreement includes a change of control clause that triggers a review in the event of a change of control. The banking syndicate could cancel the facility as a result of such review. As at 31 December 2020 balance date, no change of control event is anticipated and therefore the bank debt is assessed as non-current in line with the existing maturity dates of the facility.
(c) Market risk
Market risk is the risk that changes in market prices, such as foreign exchange rates, interest rates and equity prices will affect the Group’s income or the value of its holdings of financial instruments. The objective of market risk management is to manage and control market risk exposures within acceptable parameters, while optimising the return.
I. Management of currency risk
The Group operates in New Zealand and therefore is exposed to foreign exchange transaction risks with respect to the New Zealand dollar. Foreign exchange transaction risk arises when future commercial transactions and recognised assets and liabilities are denominated in a currency that is not the entity’s functional currency and through net investments in foreign operations. The risk is measured using cash flow forecasting. The Group has an accounting exposure to movements in the AUD/NZD exchange rate in consolidating the NZD net assets of oOh!media Street Furniture New Zealand, and its subsidiaries at each balance date. Any such movements are booked to the Group’s foreign currency translation reserve (FCTR).
Based on the exposure, the Group has not deemed it necessary to hedge this exposure in the period or the prior period.
II. Interest rate risk
The Group’s main interest rate risk arises from long-term borrowings. Borrowings issued at variable interest rates expose the Group to cash flow interest rate risk. Borrowings issued at fixed rates expose the Group to fair value interest rate risk.
100

The Group’s interest rate policy is to fix estimated interest rate risk exposure at a minimum of 50% for a period of at least 12 months or as otherwise determined by the Board.
The Group manages its cash flow interest rate risk by using floating to fixed interest rate derivatives. Such interest rate derivatives have the economic effect of converting borrowings from floating rates to fixed rates. Generally, the Group raises long-term borrowings at floating rates and hedges them into fixed rates using a mixture of swaps and options. Under the interest rate derivatives, the Group agrees with other parties to exchange, monthly or quarterly, the difference between fixed contract rates and floating rate interest amounts calculated by reference to the agreed notional principal amounts.
At the reporting date the interest rate profile of the Group’s interest-bearing financial instruments as reported to the management of the Group was as follows: 31-Dec-20 31-Dec-19
$'000 $'000 Fixed rate instruments Financial liabilities 804,551 851,773 Variable rate instruments Financial assets 80,042 61,208 Financial liabilities 195,000 419,000
Cash flow hedges
The amounts at the reporting date relating to items designated as hedged items were as follows:
Change in value used for calculating hedge ineffectiveness
Interest rate risk $'000 Variable rate instruments (5,241)
In 2018, the Group entered into interest rate derivative transactions totalling $280,000,000, of which $170,000,00 remains effective. The amounts relating to items designated as hedging instruments and hedge ineffectiveness were as follows:
31 December 2020 During the period - 2020 Carrying amount Changes in the value of the
hedging instrument recognised in the OCI
Hedge ineffectiveness
recognised in profit and loss
Nominal amount
Assets Liabilities $'000 $'000 $'000 $'000 $'000 Interest rate derivatives 170,000 - 18,335 482 (5,723)
III. Cash flow sensitivity analysis for variable rate instruments
A change of 100 basis points in interest rates at the reporting date would have increased / (decreased) equity and profit or loss by the amounts shown below. This analysis assumes that all other variables and foreign currency rates remain constant. The analysis was performed on the same basis as 2019.
2020
Profit or loss Equity 100 BP increase 100 BP decrease 100 BP
increase 100 BP decrease $'000 $'000 $'000 $'000
Variable rate instruments (1,950) 1,950 (1,950) 1,950 Interest rate derivatives - - (1,700) 1,700 Cash flow sensitivity (net) (1,950) 1,950 (3,650) 3,650
101

2019 Profit or loss Equity 100 BP
increase 100 BP decrease 100 BP increase 100 BP decrease
$'000 $'000 $'000 $'000 Variable rate instruments (4,190) 4,190 (4,190) 4,190 Interest rate derivatives - - 2,800 (2,800) Cash flow sensitivity (net) (4,190) 4,190 (1,390) 1,390
Accounting policy: Financial instruments
(a) Initial recognition and measurement
Trade receivables and debt securities are initially recognised when they are originated. Other financial assets/liabilities are recognised when the Group becomes a party to the contractual provisions of the instrument.
Trade receivables are initially measured at the transaction price. Financial assets / liabilities are initially measured at fair value (together with any transaction costs which are directly attributable to the acquisition of the asset, or cost of the liability).
Classification and subsequent remeasurement
Three principal classification categories for financial assets exist:
i) measured at amortised cost; ii) fair value other comprehensive income (FVOCI); and iii) fair value to the consolidated statement of profit or loss (FVTPL).
Financial assets are classified according to the business model in which the asset is managed and according to its contractual cash flow characteristics. They will not subsequently be reclassified unless the Group changes its business model for managing financial assets. If the business model changes, all financial assets would be reclassified on the first day of the reporting period after which the change took place.
A financial asset is measured at amortised cost if it is held within a business model whose objective is to hold assets to collect contractual cash flows and contractual terms give rise to cash flows of principal and interest on specific dates. When assessing whether cash flows represent solely principal and interest, the Group considers factors which may affect the timing and amount of the cash flows, such as contingent events, contractual terms and prepayment or extensions features.
All derivative financial assets are measured as FVTPL. At inception, the Group may also irrevocably designate that a financial asset be measured as FVTPL, even though it would otherwise be measured as amortised cost or FVOCI, if such an election eliminates (or significantly reduces) an accounting mismatch which would otherwise occur.
Subsequent remeasurement of Remeasured at Gains / Losses Other considerations
Financial assets at FVTPL Fair value Profit or loss Does not apply to hedging
instruments (refer to (d) below) Financial assets at
amortised cost Amortised cost using the effective interest method Profit or loss Amortised cost is reduced by
any impairment losses Financial liabilities at
FVTPL Fair value Profit or loss Does not apply to hedging instruments (refer to (d) below)
Financial liabilities at amortised cost
Amortised cost using the effective interest method Profit or loss -
102
(b) Derecognition
Financial assets
The Group will de-recognise a financial asset when any of the following occur:
- expiration of the contractual right to receive cash flow from the asset; or - a transaction occurs which results in the Group transferring substantially all of the risks and rewards of
ownership of the asset and therefore it also transfers the right to receive cash flows from the asset; or - although the Group does not transfer the risks and rewards of ownership, it no longer retains control of
the asset.
Financial liabilities
The Group will derecognise a financial liability when any of the following occur:
- contractual obligations are discharged, cancelled or expire; or - the terms are modified, such that the cash flows are also modified. In this situation, a new financial
liability would be recognised, at fair value, based on the modified terms.
(c) Offsetting
The Group may only offset financial assets and liabilities (or present them on a net basis) in circumstances where there is a legally enforceable right to do so and the Group intends to settle the asset and liability on a net basis, or simultaneously.
(d) Derivative financial instruments and hedge accounting The Group holds derivative financial instruments to hedge its interest rate risk exposure. Derivatives are initially measured at fair value. Subsequent changes in fair value are recognised in OCI. The Group designates certain instruments as cash flow hedges to minimise the variability in cash flows associated with highly probable forecast transactions arising from changes in interest rates. The risk management objective and strategy for undertaking a hedge, are documented at the inception of the hedging relationship. The Group also documents the economic relationship between the hedged item and the hedging instrument (including whether the changes in cash flows of the hedged item and hedging instrument are expected to offset). The accounting policy for cash flow hedges is as follows:
- When a derivative is designated as a cash flow hedging instrument, the effective portion of changes in the fair value of the derivative is recognised in OCI and accumulated in the hedging reserve. Any ineffective portion of changes in the fair value of the derivative is recognised immediately in profit or loss.
- The amount accumulated in equity is retained in OCI and reclassified to profit or loss in the same period or periods during which the hedged item affects profit or loss.
If the hedging instrument no longer meets the criteria for hedge accounting, expires or is sold, terminated or exercised, or the designation is revoked, then hedge accounting is discontinued prospectively. If the forecast transaction is no longer expected to occur, then the amount accumulated in equity is reclassified to profit or loss.
103

25. List of subsidiaries and equity accounted investees
(a) Subsidiaries
The consolidated financial statements incorporate the assets, liabilities and results of the following subsidiaries in accordance with the accounting policy described in Note 3(a):
Consolidated entity Name of entity Country of incorporation 2020 2019 Outdoor Media Operations Pty Limited Australia 100% 100% oOh!media Group Pty Limited Australia 100% 100% oOh!media Street Furniture Pty Ltd Australia 100% 100% oOh!media Street Furniture New Zealand Limited New Zealand 100% 100% oOh!media Operations Pty Limited Australia 100% 100% oOh!media Produce Pty Limited Australia 100% 100% oOh!media Assets Pty Limited Australia 100% 100% oOh!media Factor Pty Limited Australia 100% 100% oOh!media Digital Pty Limited Australia 100% 100% oOh!media Retail Pty Limited Australia 100% 100% oOh!media Lifestyle Pty Limited Australia 100% 100% oOh!media Shop Pty Limited Australia 100% 100% oOh!media Roadside Pty Limited Australia 100% 100% oOh!media MEP Pty Limited Australia 100% 100% oOh!media Regional Pty Ltd Australia 100% 100% Red Outdoor Pty Ltd Australia 100% 100% Closebuys Pty Limited Australia 83% 83% oOh!media Café Screen Pty Limited Australia 100% 100% Eye Corp Pty Limited Australia 100% 100% Eye Corp Australia Pty Limited Australia 100% 100% oOh!media Fly Pty Limited Australia 100% 100% Eye Drive Sydney Pty Limited Australia 100% 100% Eye Outdoor Pty Limited Australia 100% 100% Eye Mall Media Pty Limited Australia 100% 100% Eye Drive Melbourne Pty Limited Australia 100% 100% oOh!media Study Pty Limited Australia 100% 100% Outdoor Plus Pty Limited Australia 100% 100% Eye Shop Pty Limited Australia 100% 100% Homemaker Media Pty Limited Australia 100% 100% oOh!media Office Pty Limited Australia 100% 100% Inlink Office Pty Ltd Australia 100% 100% Inlink Café Pty Ltd Australia 100% 100% Inlink Fitness Pty Ltd Australia 100% 100% Executive Channel International Pty Ltd Australia 100% 100% Executive Channel Pty Ltd Australia 100% 100% Junkee Media Pty Limited Australia 100% 100% InTheMix dot com dot au Pty Ltd Australia 100% 100% Thought By Them Pty Ltd Australia 100% 100% Qjump Australia Pty Limited Australia 100% 100% Faster Louder Pty Ltd Australia 100% 100% Sound Alliance Nominees Pty Ltd Australia 100% 100% Cactus Imaging Pty Limited Australia 100% 100% Cactus Holdings Pty Limited Australia 100% 100% oOh!media Locate Pty Ltd Australia 100% 100% oOh!edge Pty Limited Australia - 50% oOh!media New Zealand Limited New Zealand 100% 100% oOh!media Retail New Zealand Limited New Zealand 100% 100% oOh!media Study New Zealand Limited New Zealand 100% 100%
(b) Equity-accounted investees
On 25th November 2020, the Group divested the joint venture arrangement entered into in 2014 creating oOh!edge Pty Limited, no longer holding 50% of the partnership. The Group made no initial monetary investment in the joint venture. The resulting loss on disposal is shown as an impairment in the Consolidated statement of profit and loss and other comprehensive income in 2020.
104

26. Capital commitments The Group entered into contracts to purchase plant and equipment in 2020 for $5,083,000 (2019: $8,474,000).
27. Contingencies Contingent Liabilities
Details and estimates of maximum amounts of contingent liabilities are as follows:
31-Dec-20 31-Dec-19
$'000 $'000 Bank guarantees 43,574 35,826 Bank guarantees 43,574 35,826
Bank Guarantees are issued to lessors as part of the groups commercial lease obligations.
Contingent Assets
During 2019, the Group was advised by the Transport for NSW and Australian Rail Track Corporation that certain sites in the Sydney Airport Precinct would be permanently or temporarily removed as part of the Sydney Gateway Project and the Botany Rail Duplication projects. In September the compulsory acquisition of certain Transport for NSW sites was completed. The Group has recorded a receivable based on the Valuer General’s report. The Group has reserved its rights with regards to seeking further compensation. The quantum and timing of the compensation for the Australian Rail Track sites is subject to negotiation or subsequent determination and cannot be reliably measured at this point in time.
28. Related parties (a) Parent entity and ultimate controlling party
As at 31 December 2020, the parent entity of the Group is oOh!media Limited.
(b) Subsidiaries
Interest in subsidiaries is set out in Note 25 List of subsidiaries and equity accounted investees.
(c) Transactions with Key Management Personnel
1) Key Management Personnel compensation
The Key Management Personnel compensation comprised:
31-Dec-20 31-Dec-19
$'000 $'000 Short term employee benefits 1,274,553 1,275,077 Termination benefits 903,435 - Post-employment benefits 122,969 116,531 Share-based benefits 1,531,435 219,121
3,832,392 1,610,729
105

Key Management Personnel also participate in the Group’s share plans, details of which are discussed in Note 9 Share-based payments. In addition to the above, Non-executive Director compensation included short-term employee benefits of $1,071,836 (2019: $957,622) and post-employment benefits of $75,940 (2019: $72,524).
The Company’s founding Chief Executive Officer and Managing Director, Brendon Cook, retired from those positions effective 31 December 2020. Mr. Cook has been engaged by the Company in a contracting role for at least 12 months on a remuneration of $200,000 per annum.
2) Directors' related party transactions
Directorships and shareholdings held by oOh!media Limited's Chair Tony Faure and non-executive director Marco Hellman have given rise to two related party arrangements in the current and prior period.
Marco Hellman is Founder, Managing Partner & co-CIO of HMI Capital. HMI Capital is a significant shareholder in the Group. Marco Hellman was appointed as a Non-Executive Director on 7 April 2020. In June 2020 the Company entered into a consultancy agreement with HMI under which the Company may request consultancy services on matters the Company considers are within the expertise of HMI. There is no fee payable for services provided under the consultancy agreement. Either party may terminate the consultancy agreement at any time by giving one months’ notice.
Tony Faure held a 5.0% interest in Junkee Media until March 2019 when it was bought by oOh!media for consideration of $600,000. Tony Faure received consulting fees during CY2020 from Junkee Media of $90,000 (CY2019: $156,000). Tony Faure ceased consultancy services to Junkee in November 2020.
To mitigate any potential conflicts arising, there is a Board protocol in place whereby the aforementioned Board member is asked to exit a Board meeting should any matters arise that may impact their independence.
29. Earnings per share The table below shows the calculation of basic and diluted earnings per share for 2020 and 2019. Restated (1)
31-Dec-20 31-Dec-19 $'000 $'000
Profit attributable to ordinary shareholders (35,718) 13,668 Net (loss) / profit after income tax attributable to equity holders of the parent (35,718) 13,668
Number of shares Weighted average number of shares outstanding - basic Opening issued ordinary shares balance 242,385,958 236,640,789 Effect of allotment and issuances 205,192,041 815,451 Effect of 2020 share capital raising 34,495,119 34,495,119 Effect of dividend reinvestment scheme 25,560,978 2,115,630 Weighted average number of ordinary shares at 31 December 507,634,096 274,066,989
Weighted average number of shares outstanding - diluted Weighted average number of shares outstanding - basic 507,634,096 274,066,989 Effect of performance rights on issue - 1,974,256 Weighted average number of ordinary shares at 31 December 507,634,096 276,041,245
Restated (1)
31-Dec-20 31-Dec-19 $'000 $'000
Basic (loss)/ profit earnings per share (cents) (7.0) 5.0 Diluted (loss)/ profit earnings per share (cents) (7.0) 5.0
(1) Prior year comparatives have been restated following the Group’s capital raising during 2020.
106

30. Reconciliation of cash flows from operating activities Restated
31-Dec-20 31-Dec-19 $'000 $'000
Cash flows from operating activities Profit after income tax for the year (35,718) 13,653 Adjustments for: Depreciation 200,392 209,462 Amortisation 23,391 22,685 Hedge ineffectiveness 5,723 - Borrowing costs 4,128 1,759 Share of profit of equity-accounted investees, net of tax 93 (105) Impairment Expense 3,461 3,500 Covid-19 Fixed rent abatements (54,401) - Written off capitalised intangible software - 3,420 Net exchange differences 6 (216) Equity-settled share-based payment transactions 12,672 2,115
159,747 256,273
Changes in: Trade receivables 46,490 (8,705) Deferred tax balances (13,926) (1,265) Other operating assets 9,681 8,028 Trade payables (36,852) 262 Other provisions (1,335) (7,972) Provision for income taxes payable 4,416 (13,510) Other operating liabilities 401 4,120 Cash generated from operating activities 168,622 237,231
Accounting policy: Cash and cash equivalents
For cash flow statement presentation purposes, cash and cash equivalents includes cash on hand, deposits held at call with financial institutions and other highly liquid investments with original maturities of three months or less that are readily convertible to cash on hand and are subject to an insignificant risk of change in value, net of outstanding bank overdrafts.
31. Auditor’s remuneration
31-Dec-20 31-Dec-19 $'000 $'000
Audit and assurance services KPMG Australia Audit and review of financial statements 732,888 611,179 Other assurance services 243,782 165,189 Total audit and assurance services 976,670 776,368
Other services KPMG Australia Taxation compliance and advisory services 189,761 107,514 Total other services 189,761 107,514 Total auditor's remuneration 1,166,431 883,882
1
1 As a result of the IFRS IC agenda decision, the Group has changed its accounting policy, retrospectively adjusting the deferred tax accounting for Brands. Refer Note 10 Income Tax.
107

32. Parent entity disclosures As at and throughout the financial year ended 31 December 2020 the parent entity of the Group was oOh!media Limited (2019: oOh!media Limited).
31-Dec-20 31-Dec-19 $'000 $'000 (a) Financial position Financial position of parent entity at year end Current assets 228,032 448,761 Non-current assets 900,327 718,949 Total assets 1,128,359 1,167,710 Current liabilities (1,632) - Non-current liabilities 231,647 463,078 Total liabilities 230,015 463,078 Net assets 898,344 704,632 Total equity of parent entity comprising of: Contributed equity 876,291 694,913 Reserves 22,053 9,719 Retained earnings - - Total equity 898,344 704,632
(b) Comprehensive income Result of parent entity Profit for the year: Dividends received from subsidiary 18,179 26,198 Other comprehensive (loss) / profit (338) (7,936) Total comprehensive income for the year 17,841 18,262
(c) Parent entity capital commitments for acquisition of property, plant and equipment
The parent entity did not have any capital commitments for the acquisition of property, plant or equipment as at 31 December 2020 (2019: Nil).
(d) Guarantees and contingent liabilities
Please refer to Note 27 for information on the guarantees and contingent liabilities of the parent entity.
33. Deed of cross guarantee On 20 April 2018, the wholly-owned subsidiaries listed below entered into a Deed of Cross Guarantee with oOh!media Limited in accordance with ASIC Corporations (Wholly Owned Companies) Instrument 2016/785 thereby relieving them from the Corporations Act 2001 requirements for preparation, audit and lodgement of financial reports, and Directors’ reports.
The effect of the Deed is that the Company guarantees to each creditor payment in full of any debt of the others.
The subsidiaries subject to the Deed are: Outdoor Media Operations Pty Limited oOh!media Group Pty Limited oOh!media Operations Pty Limited oOh!media Produce Pty Limited oOh!media Assets Pty Limited oOh!media Factor Pty Limited
108

oOh!media Digital Pty Limited oOh!media Locate Pty Limited oOh!media Retail Pty Limited oOh!media Lifestyle Pty Limited oOh!media Shop Pty Limited oOh!media Roadside Pty Limited oOh!media MEP Pty Limited oOh!media Regional Pty Limited Red Outdoor Pty Ltd Eye Corp Pty Limited Eye Corp Australia Pty Limited oOh!media Fly Pty Limited Eye Drive Sydney Pty Limited Eye Outdoor Pty Limited Eye Mall Media Pty Limited Eye Drive Melbourne Pty Limited oOh!media Study Pty Limited Outdoor Plus Pty Limited Eye Shop Pty Limited Homemaker Media Pty Limited oOh!media Office Pty Limited Inlink Office Pty Ltd Inlink Café Pty Ltd Inlink Fitness Pty Ltd Executive Channel International Pty Ltd Executive Channel Pty Ltd Cactus Imaging Holdings Pty Limited Cactus Imaging Pty Limited oOh!media Café Screen Pty Limited oOh!media Street Furniture Limited Junkee Media Pty Ltd (1) Faster Louder Pty Limited (1)
Thought By Them Pty Ltd (1)
QJump Australia Pty Limited (1)
Sound Alliance Nominees Pty Ltd (1)
Inthemix dot com dot au Pty Ltd (1)
(1) Junkee Media Pty Ltd, FasterLouder Pty Ltd, Thought By Them Pty Ltd, QJump Australia Pty Ltd, Sound Alliance Nominees Pty Ltd and InTheMix dot com dot au Pty Ltd became a party to the Deed on 28 June 2019, by virtue of a Deed of Assumption.
A consolidated statement of comprehensive income and consolidated statement of financial position, comprising the Company and controlled entities which are a party to the Deed, after eliminating all transactions between parties to the Deed of Cross Guarantee, for the year ended 31 Dec 2020 is set out as follows:
109

Statement of profit or loss and other comprehensive income and retained earnings
31-Dec-20 Restated (1)
31-Dec-19 $'000 $'000
Revenue 384,640 593,197 Cost of sales (59,912) (160,082) Gross profit 324,728 433,115 Other income 6,829 - Operating expenses, depreciation and amortisation (324,077) (360,023) Finance income 327 1,214 Finance costs and foreign exchange costs (58,592) (57,874) Share of profit of equity-accounted investees (93) 104 Profit before tax (50,878) 16,536 Tax expense 10,447 (6,245) Profit after tax (40,431) 10,291 Effective portion of changes in fair value of cash flow hedges, net of tax (4,732) (7,936) De-designation of interest rate derivatives to the Consolidated Income Statement, net of tax
4,394 -
Other comprehensive income for the period, net of tax (338) (7,936) Total comprehensive income for the period, net of tax (40,769) 2,355
Statement of financial position
31-Dec-20 Restated (1)
31-Dec-19 Assets $'000 $'000 Cash and cash equivalents 57,046 53,489 Trade and other receivables 65,046 129,087 Inventories 2,771 3,339 Other current assets 22,761 30,249 Income tax assets (183) 4,048 Current assets 147,441 220,212 Property, plant and equipment 188,888 217,595 Right of use asset 711,453 802,936 Intangible assets 679,222 693,032 Investments 131,112 128,722 Other non-current assets - 1,989 Non-current assets 1,710,675 1,844,274 Total assets 1,858,116 2,064,486 Liabilities Trade and other payables 37,489 100,004 Interest bearing lease liabilities 156,015 166,962 Provisions 570 570 Employee benefits 7,110 6,874 Current liabilities 201,184 274,410 Loans and borrowings 191,277 415,697 Provisions 13,649 14,195 Employee benefits 2,568 3,931 Interest bearing lease liabilities 630,332 665,457 Derivative liabilities 18,335 13,094 Deferred tax liabilities 10,016 21,712 Non-current liabilities 866,177 1,134,086 Total liabilities 1,067,361 1,408,496 Net assets 790,755 655,990 Equity Share capital 876,291 694,913 Reserves 28,270 15,935 Accumulated losses (113,806) (54,858) Total equity 790,755 655,990
(1) 2019 restatement to correct an adjustment to transition on AASB16 leases within the deed of cross guarantee.
110

34. Subsequent events The Group continues to evaluate the impact on operations of the COVID-19 pandemic and government actions in relation to the pandemic. The Company has considered events after 31 December 2020 to determine if there is further evidence of conditions existing at 31 December 2020 when forming judgements on the values of assets and liabilities at 31 December 2020.
On 1 January 2021 Cathy O’Connor was appointed Chief Executive Officer and Managing Director. Brendon Cook was engaged in a consulting capacity from 1 January 2021, refer Note 28 Related Parties.
No other matter or circumstance at the date of this report has arisen since 31 December 2020 that has significantly affected or may affect:
(a) the operations of the Group;
(b) the results of those operations in future financial years; or
(c) the Group's state of affairs in the future financial years.
111

DIRECTORS’ DECLARATIONDirectors’ Declaration
In accordance with a resolution of the Directors of oOh!media Limited (‘the Company’), we state that:
1. In the Directors opinion: a) the consolidated financial statements and notes of the Group that are set out on pages XX to XX, for the
year ended 31 December 2020, are in accordance with the Corporations Act 2001 (Cth), including:
i. giving a true and fair view of the Group’s financial position as at 31 December 2020 and of its performance for the year ended on that date; and
ii. complying with Australian Accounting Standards and the Corporations Regulations 2001 (Cth); and
b) there are reasonable grounds to believe that the Company will be able to pay its debts as and when they become due and payable.
2. The Directors have been given the declarations required by section 295A of the Corporations Act 2001 (Cth) from the Chief Executive Officer and the Chief Financial Officer for the financial year ended 31 December 2020.
3. The Directors draw attention to Note 2(a) to the consolidated financial statements, which includes a statement of compliance with International Financial Reporting Standards as issued by the Accounting Standards Board.
On behalf of the Board
Tony Faure
Chairman
22 February 2021
Sydney
65 111
112

INDEPENDENT AUDITOR’S REPORT
KPMG, an Australian partnership and a member firm of the KPMG global organisation of independent member firms affiliated with KPMG International Limited, a private English company limited by guarantee. All rights reserved. The KPMG name and logo are trademarks used under license by the independent member firms of the KPMG global organisation. Liability limited by a scheme approved under Professional Standards Legislation.
Independent Auditor’s Report
To the shareholders of oOh!media Limited
Report on the audit of the Financial Report
Opinion
We have audited the Financial Report of oOh!media Limited (the Company).
In our opinion, the accompanying Financial Report of the Company is in accordance with the Corporations Act 2001, including:
• giving a true and fair view of the Group’s financial position as at 31 December 2020 and of its financial performance for the year ended on that date; and
• complying with Australian Accounting Standards and the Corporations Regulations 2001.
The Financial Report comprises:
• Consolidated Statement of financial position as at 31 December 2020
• Consolidated statement of profit or loss and other comprehensive income, Consolidated statement of changes in equity, and Consolidated Statement of cash flows for the year then ended
• Notes including a summary of significant accounting policies
• Directors’ Declaration.
The Group consists of the Company and the entities it controlled at the year-end or from time to time during the financial year.
Basis for opinion
We conducted our audit in accordance with Australian Auditing Standards. We believe that the audit evidence we have obtained is sufficient and appropriate to provide a basis for our opinion.
Our responsibilities under those standards are further described in the Auditor’s responsibilities for the audit of the Financial Report section of our report.
We are independent of the Group in accordance with the Corporations Act 2001 and the ethical requirements of the Accounting Professional and Ethical Standards Board’s APES 110 Code of Ethics for Professional Accountants (including Independence Standards) (the Code) that are relevant to our audit of the Financial Report in Australia. We have fulfilled our other ethical responsibilities in accordance with the Code.
This is the original version of the Independent Auditor’s Report over the Financial Report signed by the Directors on 22 February 2021. Page reference 23 to 39 with respect to the audit of the Remuneration Report, should be updated to read 31 to 47. The page reference has been updated to reflect the correct references now that the financial statements have been presented in the context of the Annual Report.
113

INDEPENDENT AUDITOR’S REPORTCONTINUED
Key Audit Matters
The Key Audit Matters we identified are:
• Accuracy of Lease asset and liability accounting under AASB16 Leases
• Recoverable amount of goodwill and intangible assets
Key Audit Matters are those matters that, in our professional judgement, were of most significance in our audit of the Financial Report of the current period.
These matters were addressed in the context of our audit of the Financial Report as a whole, and in forming our opinion thereon, and we do not provide a separate opinion on these matters.
Accuracy of Lease asset and liability accounting under AASB16 Leases
Refer to Notes 13 and 18 to the Financial Report
The key audit matter How the matter was addressed in our audit
The accounting requirements of AASB 16 Leases (AASB16) are inherently complex, where specific and individualised lease-features drive different accounting outcomes, increasing the need for interpretation and judgement. This is a key audit matter for us, focusing on the judgements, along with other factors driving additional audit effort, such as:
• High volume of leases – the Group has a high volume of individualised lease agreements required to be assessed in determining the lease liability and right-of-use asset. A focus for us was the completeness of the lease population and the accuracy of multiple and varied inputs which may drive different accounting outcomes, including key terms of the lease agreements, such as key dates, fixed and variable rent payments, renewal options and incentives.
• Complex modelling process - the Group developed an AASB 16 lease calculation model, which is largely manual and complex, and therefore is at greater risk for potential error and inconsistent application.
• Relative magnitude – the size of balances has a significant financial impact on the Group’s financial position and performance.
Our procedures included:
• We considered the appropriateness of the Group’s accounting policies against the requirements of the accounting standard and our understanding of the business and industry practice.
• We obtained an understanding of the Group’s processes used to calculate the lease liability, right-of-use asset, depreciation and interest expense.
• We compared the Group’s inputs in the AASB 16 lease calculation model, such as, key dates, fixed rent payments, renewal options and incentives, for consistency to the relevant terms of a sample of underlying signed lease agreements, including new lease arrangements and modifications.
• We assessed the Group’s estimate of whether it is reasonably certain to exercise lease renewal options. This included considering the Group’s assessment of the forecast future contribution to a sample of lease contracts.
• We assessed the scope, competency and objectivity of the external expert engaged by the Group to assist determining the Group’s incremental borrowing rates. We involved our Debt Advisory specialists to assess the
114

Key Audit Matters
The Key Audit Matters we identified are:
• Accuracy of Lease asset and liability accounting under AASB16 Leases
• Recoverable amount of goodwill and intangible assets
Key Audit Matters are those matters that, in our professional judgement, were of most significance in our audit of the Financial Report of the current period.
These matters were addressed in the context of our audit of the Financial Report as a whole, and in forming our opinion thereon, and we do not provide a separate opinion on these matters.
Accuracy of Lease asset and liability accounting under AASB16 Leases
Refer to Notes 13 and 18 to the Financial Report
The key audit matter How the matter was addressed in our audit
The accounting requirements of AASB 16 Leases (AASB16) are inherently complex, where specific and individualised lease-features drive different accounting outcomes, increasing the need for interpretation and judgement. This is a key audit matter for us, focusing on the judgements, along with other factors driving additional audit effort, such as:
• High volume of leases – the Group has a high volume of individualised lease agreements required to be assessed in determining the lease liability and right-of-use asset. A focus for us was the completeness of the lease population and the accuracy of multiple and varied inputs which may drive different accounting outcomes, including key terms of the lease agreements, such as key dates, fixed and variable rent payments, renewal options and incentives.
• Complex modelling process - the Group developed an AASB 16 lease calculation model, which is largely manual and complex, and therefore is at greater risk for potential error and inconsistent application.
• Relative magnitude – the size of balances has a significant financial impact on the Group’s financial position and performance.
Our procedures included:
• We considered the appropriateness of the Group’s accounting policies against the requirements of the accounting standard and our understanding of the business and industry practice.
• We obtained an understanding of the Group’s processes used to calculate the lease liability, right-of-use asset, depreciation and interest expense.
• We compared the Group’s inputs in the AASB 16 lease calculation model, such as, key dates, fixed rent payments, renewal options and incentives, for consistency to the relevant terms of a sample of underlying signed lease agreements, including new lease arrangements and modifications.
• We assessed the Group’s estimate of whether it is reasonably certain to exercise lease renewal options. This included considering the Group’s assessment of the forecast future contribution to a sample of lease contracts.
• We assessed the scope, competency and objectivity of the external expert engaged by the Group to assist determining the Group’s incremental borrowing rates. We involved our Debt Advisory specialists to assess the
The most significant areas of judgement we focus on was in assessing the Group’s:
• Incremental borrowing rates used – these are meant to reflect the Group's entity specific credit risk and vary based on each lease term. The Group engaged an external expert to assist with determining each of the Group’s incremental borrowing rates. The Group’s AASB 16 lease calculation model is highly sensitive to small changes in the incremental borrowing rates.
• Lease terms where leases have renewal options – assessing the determination of whether it is reasonably certain renewal options will be exercised impacts the measurement of the lease, therefore is critical to the accuracy of the accounting.
In the financial year, the Group was impacted by COVID-19 and in response, negotiated a number of rent abatements and deferrals with lessors. The Group applied the practical expedient issued by the IASB in May 2020 and the assessment of whether individual rent abatements met the criteria of the practical expedient required additional audit effort in the current year. We involved our senior audit team members in assessing these areas, along with our debt advisory and modelling specialists.
appropriateness of the expert’s methodology and we tested key inputs to external sources.
• Working together with our modelling specialists, we assessed the integrity of the Group’s AASB 16 lease calculation model used, including the accuracy of the underlying calculation formulas.
• We tested a sample of rent abatements and deferrals to agreed lease modifications and assessed against the requirements of the practical expedient.
• We assessed the disclosures in the financial report using our understanding obtained from our testing and against the requirements of the accounting standard.
115

INDEPENDENT AUDITOR’S REPORTCONTINUED
Recoverable amount of goodwill and intangible assets ($775 million)
Refer to Notes 14 and 15 to the Financial Report
The key audit matter How the matter was addressed in our audit
A key audit matter for us was the Group’s annual testing of goodwill and intangible assets for impairment, given the size of the balance (being 41% of total assets). We focussed on the significant forward-looking assumptions the Group applied in their value in use models, including:
• forecast cash flows – specific attention has been paid to forecast duration and severity of COVID-19 government-imposed restrictions and the subsequent economic recovery.
• discount rate - these are complicated in nature and vary according to the conditions and environment the specific Cash Generating Unit (CGU) is subject to from time to time, and the models approach to incorporating risks into the cash flows or discount rates.
We involve our valuations specialists to supplement our senior audit team members in assessing this key audit matter.
Our procedures included:
• We considered the appropriateness of the fair value less costs of disposal method applied by the Group to perform the annual test of goodwill for impairment against the requirements of the accounting standards.
• We assessed the integrity of the discounted cash flow models used, including the accuracy of the underlying calculation formulas.
• We compared the forecast cash flows contained in the discounted cash flow models to Board approved forecasts.
• We challenged the Group’s forecast cash flow and growth assumptions. We compared the recovery period and terminal growth rates to authoritative published studies from external sources. We used our knowledge of the Group and our industry experience. We sourced authoritative and credible inputs from our specialists.
• Working with our valuation specialists we independently developed a discount rate range considering publicly available market data for comparable entities, adjusted for risk factors in certain CGUs relating to achievement of forecasts and concentration of revenue.
• We considered the sensitivity of the models by varying key assumptions, such as forecast growth rates and discount rates, within a reasonably possible range. We did this to identify any CGU at higher risk of impairment and to focus our further procedures.
• We assessed the disclosures in the financial report using our understanding of the issue obtained from our testing and against the requirements of the accounting standards.
Key Audit Matters
The Key Audit Matters we identified are:
• Accuracy of Lease asset and liability accounting under AASB16 Leases
• Recoverable amount of goodwill and intangible assets
Key Audit Matters are those matters that, in our professional judgement, were of most significance in our audit of the Financial Report of the current period.
These matters were addressed in the context of our audit of the Financial Report as a whole, and in forming our opinion thereon, and we do not provide a separate opinion on these matters.
Accuracy of Lease asset and liability accounting under AASB16 Leases
Refer to Notes 13 and 18 to the Financial Report
The key audit matter How the matter was addressed in our audit
The accounting requirements of AASB 16 Leases (AASB16) are inherently complex, where specific and individualised lease-features drive different accounting outcomes, increasing the need for interpretation and judgement. This is a key audit matter for us, focusing on the judgements, along with other factors driving additional audit effort, such as:
• High volume of leases – the Group has a high volume of individualised lease agreements required to be assessed in determining the lease liability and right-of-use asset. A focus for us was the completeness of the lease population and the accuracy of multiple and varied inputs which may drive different accounting outcomes, including key terms of the lease agreements, such as key dates, fixed and variable rent payments, renewal options and incentives.
• Complex modelling process - the Group developed an AASB 16 lease calculation model, which is largely manual and complex, and therefore is at greater risk for potential error and inconsistent application.
• Relative magnitude – the size of balances has a significant financial impact on the Group’s financial position and performance.
Our procedures included:
• We considered the appropriateness of the Group’s accounting policies against the requirements of the accounting standard and our understanding of the business and industry practice.
• We obtained an understanding of the Group’s processes used to calculate the lease liability, right-of-use asset, depreciation and interest expense.
• We compared the Group’s inputs in the AASB 16 lease calculation model, such as, key dates, fixed rent payments, renewal options and incentives, for consistency to the relevant terms of a sample of underlying signed lease agreements, including new lease arrangements and modifications.
• We assessed the Group’s estimate of whether it is reasonably certain to exercise lease renewal options. This included considering the Group’s assessment of the forecast future contribution to a sample of lease contracts.
• We assessed the scope, competency and objectivity of the external expert engaged by the Group to assist determining the Group’s incremental borrowing rates. We involved our Debt Advisory specialists to assess the
116

Other Information
Other Information is financial and non-financial information in oOh!media Limited’s annual reporting which is provided in addition to the Financial Report and the Auditor’s Report. The Directors are responsible for the Other Information.
The Other Information we obtained prior to the date of this Auditor’s Report was the Directors Report, including the Operating and Financial Review and Remuneration Report. The Corporate Governance Statement, Sustainability Report and Chair and CEO reviews are expected to be made available to us after the date of the Auditor’s Report.
Our opinion on the Financial Report does not cover the Other Information and, accordingly, we do not express an audit opinion or any form of assurance conclusion thereon, with the exception of the Remuneration Report and our related assurance opinion.
In connection with our audit of the Financial Report, our responsibility is to read the Other Information. In doing so, we consider whether the Other Information is materially inconsistent with the Financial Report or our knowledge obtained in the audit, or otherwise appears to be materially misstated.
We are required to report if we conclude that there is a material misstatement of this Other Information, and based on the work we have performed on the Other Information that we obtained prior to the date of this Auditor’s Report we have nothing to report.
Responsibilities of the Directors for the Financial Report
The Directors are responsible for:
• preparing the Financial Report that gives a true and fair view in accordance with Australian Accounting Standards and the Corporations Act 2001
• implementing necessary internal control to enable the preparation of a Financial Report that gives a true and fair view and is free from material misstatement, whether due to fraud or error
• assessing the Group and Company’s ability to continue as a going concern and whether the use of the going concern basis of accounting is appropriate. This includes disclosing, as applicable, matters related to going concern and using the going concern basis of accounting unless they either intend to liquidate the Group and Company or to cease operations, or have no realistic alternative but to do so.
Auditor’s responsibilities for the audit of the Financial Report
Our objective is:
• to obtain reasonable assurance about whether the Financial Report as a whole is free from material misstatement, whether due to fraud or error; and
• to issue an Auditor’s Report that includes our opinion.
Reasonable assurance is a high level of assurance, but is not a guarantee that an audit conducted in accordance with Australian Auditing Standards will always detect a material misstatement when it exists.
Misstatements can arise from fraud or error. They are considered material if, individually or in the aggregate, they could reasonably be expected to influence the economic decisions of users taken on the basis of the Financial Report.
Key Audit Matters
The Key Audit Matters we identified are:
• Accuracy of Lease asset and liability accounting under AASB16 Leases
• Recoverable amount of goodwill and intangible assets
Key Audit Matters are those matters that, in our professional judgement, were of most significance in our audit of the Financial Report of the current period.
These matters were addressed in the context of our audit of the Financial Report as a whole, and in forming our opinion thereon, and we do not provide a separate opinion on these matters.
Accuracy of Lease asset and liability accounting under AASB16 Leases
Refer to Notes 13 and 18 to the Financial Report
The key audit matter How the matter was addressed in our audit
The accounting requirements of AASB 16 Leases (AASB16) are inherently complex, where specific and individualised lease-features drive different accounting outcomes, increasing the need for interpretation and judgement. This is a key audit matter for us, focusing on the judgements, along with other factors driving additional audit effort, such as:
• High volume of leases – the Group has a high volume of individualised lease agreements required to be assessed in determining the lease liability and right-of-use asset. A focus for us was the completeness of the lease population and the accuracy of multiple and varied inputs which may drive different accounting outcomes, including key terms of the lease agreements, such as key dates, fixed and variable rent payments, renewal options and incentives.
• Complex modelling process - the Group developed an AASB 16 lease calculation model, which is largely manual and complex, and therefore is at greater risk for potential error and inconsistent application.
• Relative magnitude – the size of balances has a significant financial impact on the Group’s financial position and performance.
Our procedures included:
• We considered the appropriateness of the Group’s accounting policies against the requirements of the accounting standard and our understanding of the business and industry practice.
• We obtained an understanding of the Group’s processes used to calculate the lease liability, right-of-use asset, depreciation and interest expense.
• We compared the Group’s inputs in the AASB 16 lease calculation model, such as, key dates, fixed rent payments, renewal options and incentives, for consistency to the relevant terms of a sample of underlying signed lease agreements, including new lease arrangements and modifications.
• We assessed the Group’s estimate of whether it is reasonably certain to exercise lease renewal options. This included considering the Group’s assessment of the forecast future contribution to a sample of lease contracts.
• We assessed the scope, competency and objectivity of the external expert engaged by the Group to assist determining the Group’s incremental borrowing rates. We involved our Debt Advisory specialists to assess the
117

A further description of our responsibilities for the audit of the Financial Report is located at the Auditing and Assurance Standards Board website at: http://www.auasb.gov.au/auditors_responsibilities/ar1.pdf. This description forms part of our Auditor’s Report.
Report on the Remuneration Report
Opinion
In our opinion, the Remuneration Report of oOh!media Limited for the year ended 31 December 2020, complies with Section 300A of the Corporations Act 2001.
Directors’ responsibilities
The Directors of the Company are responsible for the preparation and presentation of the Remuneration Report in accordance with Section 300A of the Corporations Act 2001.
Our responsibilities
We have audited the Remuneration Report included in pages 23 to 39 of the Directors’ report for the year ended 31 December 2020.
Our responsibility is to express an opinion on the Remuneration Report, based on our audit conducted in accordance with Australian Auditing Standards.
KPMG Trent Duvall
Partner
Sydney
22 February 2021
KPM_INI_01
PAR_SIG_01 PAR_NAM_01 PAR_POS_01 PAR_DAT_01 PAR_CIT_01
INDEPENDENT AUDITOR’S REPORTCONTINUED
Key Audit Matters
The Key Audit Matters we identified are:
• Accuracy of Lease asset and liability accounting under AASB16 Leases
• Recoverable amount of goodwill and intangible assets
Key Audit Matters are those matters that, in our professional judgement, were of most significance in our audit of the Financial Report of the current period.
These matters were addressed in the context of our audit of the Financial Report as a whole, and in forming our opinion thereon, and we do not provide a separate opinion on these matters.
Accuracy of Lease asset and liability accounting under AASB16 Leases
Refer to Notes 13 and 18 to the Financial Report
The key audit matter How the matter was addressed in our audit
The accounting requirements of AASB 16 Leases (AASB16) are inherently complex, where specific and individualised lease-features drive different accounting outcomes, increasing the need for interpretation and judgement. This is a key audit matter for us, focusing on the judgements, along with other factors driving additional audit effort, such as:
• High volume of leases – the Group has a high volume of individualised lease agreements required to be assessed in determining the lease liability and right-of-use asset. A focus for us was the completeness of the lease population and the accuracy of multiple and varied inputs which may drive different accounting outcomes, including key terms of the lease agreements, such as key dates, fixed and variable rent payments, renewal options and incentives.
• Complex modelling process - the Group developed an AASB 16 lease calculation model, which is largely manual and complex, and therefore is at greater risk for potential error and inconsistent application.
• Relative magnitude – the size of balances has a significant financial impact on the Group’s financial position and performance.
Our procedures included:
• We considered the appropriateness of the Group’s accounting policies against the requirements of the accounting standard and our understanding of the business and industry practice.
• We obtained an understanding of the Group’s processes used to calculate the lease liability, right-of-use asset, depreciation and interest expense.
• We compared the Group’s inputs in the AASB 16 lease calculation model, such as, key dates, fixed rent payments, renewal options and incentives, for consistency to the relevant terms of a sample of underlying signed lease agreements, including new lease arrangements and modifications.
• We assessed the Group’s estimate of whether it is reasonably certain to exercise lease renewal options. This included considering the Group’s assessment of the forecast future contribution to a sample of lease contracts.
• We assessed the scope, competency and objectivity of the external expert engaged by the Group to assist determining the Group’s incremental borrowing rates. We involved our Debt Advisory specialists to assess the
118

SHAREHOLDER INFORMATIONVOTING RIGHTS
The voting rights attaching to each class of equity securities are set out below:
Ordinary shares: On a show of hands every member present at a meeting in person or by proxy shall have one vote and upon a poll each share shall have one vote. There are no other classes of equity securities.
Share rights: Share rights holders do not have any voting rights on the share rights held by them.
The shareholder information set out below is current at 29 January 2021.
DISTRIBUTION OF EQUITY SECURITIES
Analysis of number of equity security holders by size of holding:
RangeNumber of
holders % of holdersNumber of
shares % of shares
1 – 1,000 3,145 32.20 1,833,376 0.31
1,001 – 5,000 3,974 40.68 10,157,898 1.72
5,001 – 10,000 1,261 12.91 9,553,541 1.61
10,001 – 100,000 1,303 13.34 33,065,411 5.59
100,001 and over 85 0.87 537,178,054 90.77
Total number of security holders 9,768 100.00 591,788,280 100.00
Holders holding less than a marketable parcel of shares (being a parcel of 316 shares based on a closing price of $1.585 on 29 January 2021)
636 6.51 80,886 -
RESTRICTED SECURITIES
There are currently no restricted securities on issue.
ON-MARKET BUY BACK
There is no current on-market buy back.
UNQUOTED EQUITY SECURITIES
RangeNumber of share
rights holdersNumber of share
rights % of share rights
1 – 1,000 0 0 0
1,001 – 5,000 0 0 0
5,001 – 10,000 15 115,755 4.09
10,001 – 100,000 40 1,366,858 48.31
100,001 and over 9 1,346,623 47.60
Total 64 2,829,236 100.00
119

TOTAL OF QUOTED AND RESTRICTED SECURITIES
Range % of share rights
Ordinary shares not subject to voluntary escrow (quoted securities) 591,788,280
Ordinary shares subject to voluntary escrow (restricted securities) 0
Total Number of Shares 591,788,280
TWENTY LARGEST QUOTED EQUITY SECURITY HOLDERS
RangeNumber of ordinary
shares heldPercentage of
ordinary shares %
HSBC CUSTODY NOMINEES (AUSTRALIA) LIMITED 133,780,688 22.61
J P MORGAN NOMINEES AUSTRALIA PTY LIMITED 119,287,269 20.16
HSBC CUSTODY NOMINEES (AUSTRALIA) LIMITED 112,990,401 19.09
CITICORP NOMINEES PTY LIMITED 53,057,148 8.97
HT AND E OPERATIONS LTD 27,645,055 4.67
NATIONAL NOMINEES LIMITED 27,485,785 4.64
HSBC CUSTODY NOMINEES (AUSTRALIA) LIMITED – A/C 2 16,140,958 2.73
BNP PARIBAS NOMINEES PTY LTD 12,323,199 2.08
CS THIRD NOMINEES PTY LIMITED 3,949,795 0.67
BNP PARIBAS NOMS PTY LTD 3,357,246 0.57
CS FOURTH NOMINEES PTY LIMITED 2,351,863 0.40
BNP PARIBAS NOMINEES PTY LTD 1,784,918 0.30
AUSTRALIAN EXECUTOR TRUSTEES LIMITED 1,195,505 0.20
BNP PARIBAS NOMINEES PTY LTD 1,097,044 0.19
PACIFIC CUSTODIANS PTY LIMITED 1,020,433 0.17
HOBSON WEALTH CUSTODIANS LTD 1,016,203 0.17
MR JOHN GERARD BELL 945,985 0.16
MRS DEBRA ANNE COOK 900,000 0.15
MR CHRISTOPHER JOHN PIKE + MS NATALIE KAY GREEN 896,190 0.15
UBS NOMINEES PTY LTD 794,970 0.13
Total held by top 20 largest holders 522,020,655 88.21
Other 69,767,625 11.79
Total 591,788,280 100.00
SHAREHOLDER INFORMATIONCONTINUED
120

SUBSTANTIAL HOLDERS (AS DISCLOSED IN SUBSTANTIAL HOLDING NOTICES GIVEN TO THE COMPANY IN ACCORDANCE WITH THE CORPORATIONS ACT)
RangeNumber of ordinary
shares heldPercentage of
ordinary shares %
HMI CAPITAL, LLC (FROM 1 JANUARY 2021 KNOWN AS HMI CAPITAL MANAGEMENT, L.P.) 45,087,297 18.6*
T. ROWE PRICE ASSOCIATES INC 32,060,197 5.41
* This table discloses information as set out in substantial shareholding notices. HMI Capital Management, L.P. acquired additional shares as part of the equity raise in 2020, but as its percentage of the Company’s ordinary shares did not increase by 1% or more, no change in substantial holding notice was required to be lodged.
121

GLOSSARYTerm Meaning/definition
AASB Australian Accounting Standards Board
AGM Annual General Meeting
ASIC Australian Securities and Investments Commission
ASX Australian Securities Exchange, as operated by ASX Limited ABN 98 008 624 691
AUD, A$, $ or Australian dollar The lawful currency of the Commonwealth of Australia
Auditor KPMG
Australian Accounting Standards
Australian Accounting Standards and other authoritative pronouncements issued by the Australian Accounting Standards Board and Urgent Issues Group Interpretations
Board or Board of Directors The board of Directors of oOh!media Limited
CAGR Compound Annual Growth Rate
CEO Chief Executive Officer
CFO Chief Financial Officer
CGU Cash Generating Unit
Company oOh!media Limited ACN 602 195 380
Company Secretary The Company Secretary of oOh!media as appointed from time-to-time
Constitution The constitution of the Company
Corporations Act Corporations Act 2001 (Cth)
CY15 Financial year ended 31 December 2015
CY16 Financial year ended 31 December 2016
CY17 Financial year ended 31 December 2017
CY18 Financial year ended 31 December 2018
CY19 Financial year ended 31 December 2019
CY20 Financial year ended 31 December 2020
Digital revenue Revenue from digital advertising display panels
Director Each of the Directors of oOh!media as appointed to the position from time-to-time
EBIT Earnings before interest and taxation
EBITDA Earnings before interest, taxation, depreciation and amortisation
EPS Earnings Per Share
Escrow An 'escrow' is a restriction on sale, disposal or encumbering of, or certain other dealings in respect of, the shares concerned for the period of the escrow, subject to exceptions set out in the escrow arrangement
FAR Fixed annual remuneration
FCTR Foreign Currency Translation Reserve
FMCG Fast moving consumer goods
Group oOh!media Limited and its subsidiaries
GST Goods and services or similar tax imposed in Australia and New Zealand
IASB International Accounting Standards Board
IFRS International Financial Reporting Standards
KMP Key Management Personal
KPI Key Performance Indicator
KPMG KPMG ABN 51 194 660 183
122

Term Meaning/definition
Listing The admission of oOh!media to the Official List of the ASX
Listing Rules The Official Listing Rules of ASX
LTI Long term incentive as payable under the LTI Plan
LTI Plan oOh!media's long-term incentive plan, as amended by oOh!media from time-to-time
Management The management of oOh!media
MD Managing Director
MOVE Measurement of Outdoor Visibility and Exposure, Australia's national Out of Home audience measurement system
n/a Not applicable
NCI Non-controlling Interest
NED Non-executive Director
NPAT Net profit after tax
NPATA Net profit after tax before amortisation of acquired intangibles
NZD New Zealand Dollars
OCI Other Comprehensive Income
OFR Operating and Financial Review
OMA Outdoor Media Association, the peak national industry body that represents most of Australia's traditional and digital outdoor media display companies and production facilities, as well as some media display asset owners.
Officer An Officer of the Company
OMI Outdoor Media Investments Limited ABN 32 156 446 187
OML oOh!media Limited ACN 602 195 380
oOh! oOh!media Limited ACN 602 195 380
oOh!media oOh!media Limited ACN 602 195 380
Out of Home Out of Home, also commonly referred to as out of home or outdoor advertising, represents the media sector of the advertising industry that communicates with people when they are out of their home
Registry Link Market Services Limited ABN 54 083 214 537
Rights Rights to shares granted pursuant to the LTI Plan
Senior Executive The senior executive management of oOh!media
Share of security A fully paid ordinary share in oOh!media
Share registry Link Market Services Limited ABN 54 083 214 537
Shareholder The registered holder of a Share
SMI Standard Media Index
STI Short term incentive payable under the STI Plan
STI Plan oOh!medi’s short term incentive plan, as amended by oOh!media from time-to-time
TSR Total Shareholder Return
VWAP Volume weighted average price
WHS Workplace health & safety
WHSE&S Work, health, safety, environment & sustainability
WPP Cavendish Square Holding BV
WSE Wellbeing, safety & environment
123

CORPORATE DIRECTORYOOH!MEDIA LIMITED ACN 602 195 380
Directors: Tony Faure Chair and Non-executive Director
Cathy O’Connor Chief Executive Officer and Managing Director
Joanne Crewes Independent Non-executive Director
Marco Hellman Non-executive Director
Philippa Kelly Independent Non-executive Director
Tim Miles Independent Non-executive Director
Darren Smorgon Independent Non-executive Director
Andrew Stevens Independent Non-executive Director
David Wiadrowski Independent Non-executive Director
Company Secretary: Maria Polczynski
Principal registered office: Level 2, 73 Miller Street North Sydney NSW 2060 Ph: +61 2 9927 5555
Share register: Link Market Services Limited Level 12, 680 George Street Sydney NSW 2000 Ph: 1300 554 474
Auditors: KPMG Tower 3, International Towers Sydney 300 Barangaroo Avenue Sydney NSW 2000
Bankers: Commonwealth Bank of Australia ING Bank (Australia) Limited National Australia Bank Sumitomo Mitsui Banking Corporation Westpac Banking Corporation
Stock exchange listing: The shares of oOh!media Limited are listed by ASX Ltd on the Australian Securities Exchange trading under the ASX Listing Code “OML”.
Website: www.oohmedia.com.au https://investors.oohmedia.com.au/investor-centre/
124

125