Embed Size (px)
Citation preview
Facts & Figures
2 0 1 6
F L O R I D A P U B L I C
S E R V I C EC O M M I S S I O N
Florida Utility
Industry
o f t h e
This publication is a reference manual for anyone needing quick information about the electric, natu-ral gas, telecommunications, and water and wastewater industries in Florida. The facts have been gathered from in-house materials, outside publications, and websites. Every effort has been made to accurately reference the source of the information used. Though most of the data refers specifically to Florida, some data from other states and national averages are included for comparison purposes. If you have questions about this publication, please contact:
Office of Consumer Assistance & Outreach Florida Public Service Commission
2540 Shumard Oak BoulevardTallahassee, Florida 32399-0850
(850) 413-6482
Table of Contents E L E C T R I C
Quick Facts
Regulatory Authority ............................................................................................................. 1 Generating Capacity ................................................................................................................. 1
Transmission Capability for Peninsular Florida .........................................................................1 Florida Energy Generation by Fuel Type ....................................................................................2 Energy Sources ........................................................................................................................ 2 Florida’s Renewable Capacity .................................................................................................. 3
Customers Average Number of Customers ................................................................................................. 4
Rates Typical Electric Bill Comparisons ............................................................................................ 5 Average Residential Price of Electricity by State ..................................................................... 6
Nuclear Power Nuclear Waste Policy ..................................................................................................................7 Operating Nuclear Power Reactors .............................................................................................8
Maps Reliability Councils ................................................................................................................... 9 Investor-Owned Electric Utilities .............................................................................................10 Municipal Electric Utilities ....................................................................................................... 11 Rural Electric Cooperatives ......................................................................................................12
F A C T S & F I G U R E S O F T H E F L O R I D A U T I L I T Y I N D U S T R Y
i
F A C T S & F I G U R E S O F T H E F L O R I D A U T I L I T Y I N D U S T R Y
N AT U R A L G A S
Quick Facts Regulatory Authority ............................................................................................................... 13 Transmission ............................................................................................................................ 13
Customers Number of Customers ............................................................................................................... 14
Rates Typical Natural Gas Bill Comparisons .................................................................................... 15
Sales Annual Therm Sales ................................................................................................................ 16
Map Natural Gas Companies in Florida .......................................................................................... 17
T E L E C O M M U N I C AT I O N SQuick Facts Regulatory Authority ............................................................................................................... 18 Definitions ................................................................................................................................ 18 Broadband, VoIP, and Wireless ................................................................................................ 19
Customers Access Lines ............................................................................................................................ 20 Universal Service Programs ..................................................................................................... 21 Universal Service Program Developments in Florida .............................................................. 24 Universal Service Support Mechanisms by Program for Florida ............................................ 26 Universal Service Support Mechanisms by State .................................................................... 27 Telephone Subscribership ........................................................................................................ 28 Lifeline Assistance Subscribership .......................................................................................... 28
ii
F A C T S & F I G U R E S O F T H E F L O R I D A U T I L I T Y I N D U S T R Y
WAT E R & WA S T E WAT E R
Quick Facts Regulatory Authority ................................................................................................................30 Reuse of Reclaimed Water Data ...............................................................................................30 Florida’s Reuse Growth ........................................................................................................... 31 Reclaimed Water Utilization .................................................................................................... 31
Customers & Rates Utility Classifications ................................................................................................................ 32 Rate Structure ............................................................................................................................ 32 Residential Wastewater Gallonage Cap .................................................................................... 32 Water & Wastewater Utility Rates ............................................................................................ 32
Maps Water & Wastewater Jurisdictional Counties ........................................................................... 33 Florida’s Water Management Districts .................................................................................... 34
iii
F L O R I D A E L E C T R I C I N D U S T R Y
Q U I C K F A C T S
Regulatory Authority
Generating Capacity(Utility and Non-Utility)As of December 31, 2014
Transmission Capability for Peninsular Florida
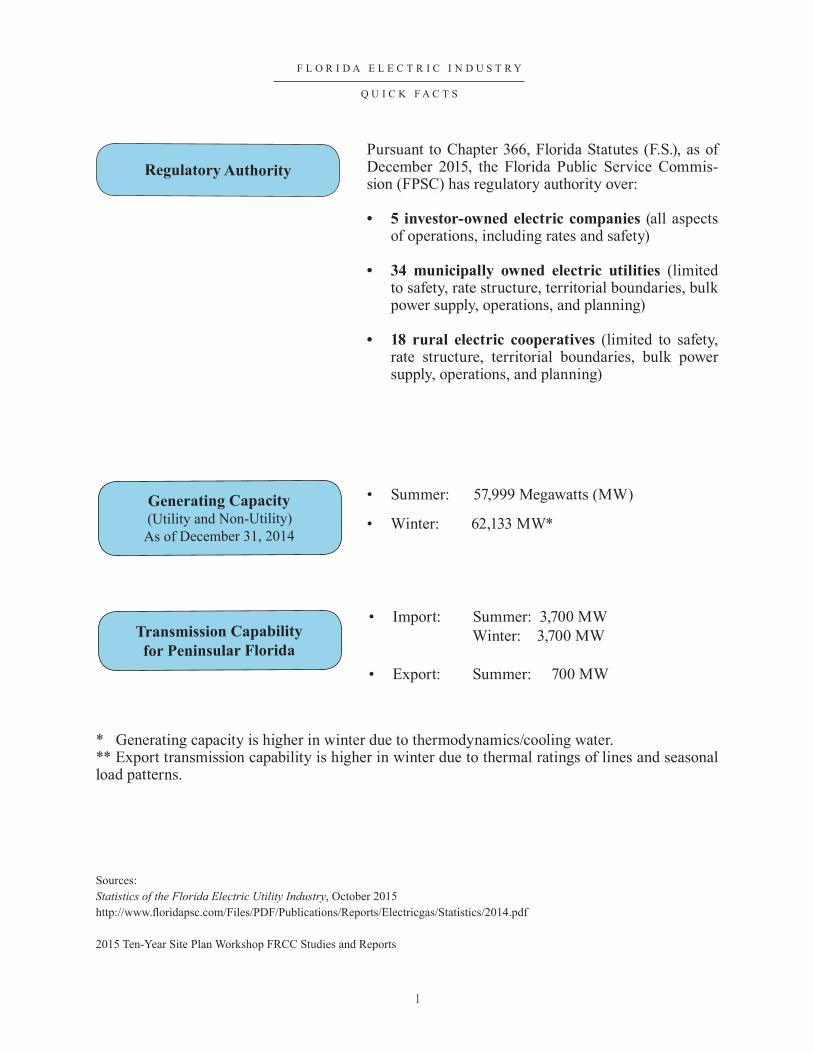
Pursuant to Chapter 366, Florida Statutes (F.S.), as of December 2015, the Florida Public Service Commis-sion (FPSC) has regulatory authority over:
• 5 investor-owned electric companies (all aspects of operations, including rates and safety)
• 34 municipally owned electric utilities (limited to safety, rate structure, territorial boundaries, bulk power supply, operations, and planning)
• 18 rural electric cooperatives (limited to safety, rate structure, territorial boundaries, bulk power supply, operations, and planning)
• Summer: 57,999 Megawatts (MW)
• Winter: 62,133 MW*
• Import: Summer: 3,700 MW Winter: 3,700 MW
• Export: Summer: 700 MW
* Generating capacity is higher in winter due to thermodynamics/cooling water.** Export transmission capability is higher in winter due to thermal ratings of lines and seasonal load patterns.
Sources:Statistics of the Florida Electric Utility Industry, October 2015http://www.floridapsc.com/Files/PDF/Publications/Reports/Electricgas/Statistics/2014.pdf
2015 Ten-Year Site Plan Workshop FRCC Studies and Reports
1
F L O R I D A E L E C T R I C I N D U S T R Y
Q U I C K F A C T S
2
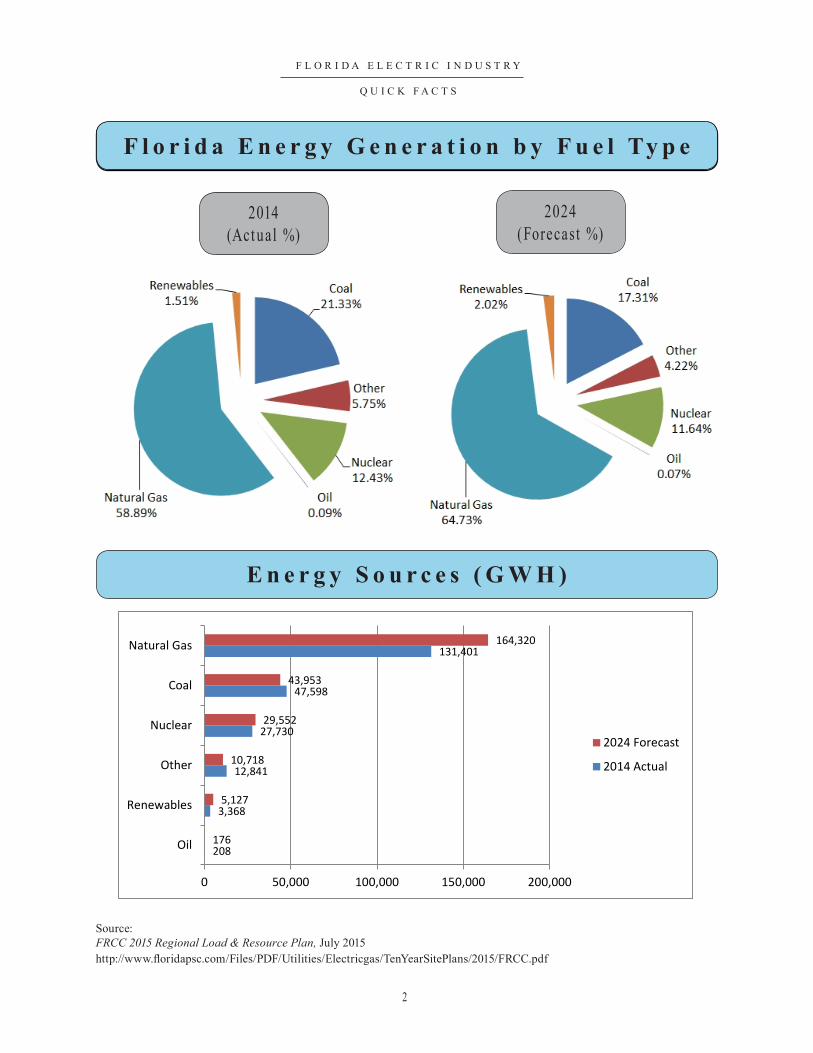
F l o r i d a E n e r g y G e n e r a t i o n b y F u e l Ty p eF l o r i d a E n e r g y G e n e r a t i o n b y F u e l Ty p e
E n e r g y S o u r c e s ( G W H )
2014(Act ual %)
2024(Forecast %)
Source: FRCC 2015 Regional Load & Resource Plan, July 2015http://www.floridapsc.com/Files/PDF/Utilities/Electricgas/TenYearSitePlans/2015/FRCC.pdf
208
3,368
12,841
27,730
47,598
131,401
176
5,127
10,718
29,552
43,953
164,320
0 50,000 100,000 150,000 200,000
Oil
Renewables
Other
Nuclear
Coal
Natural Gas
2024 Forecast
2014 Actual
F L O R I D A E L E C T R I C I N D U S T R Y
Q U I C K F A C T S
3
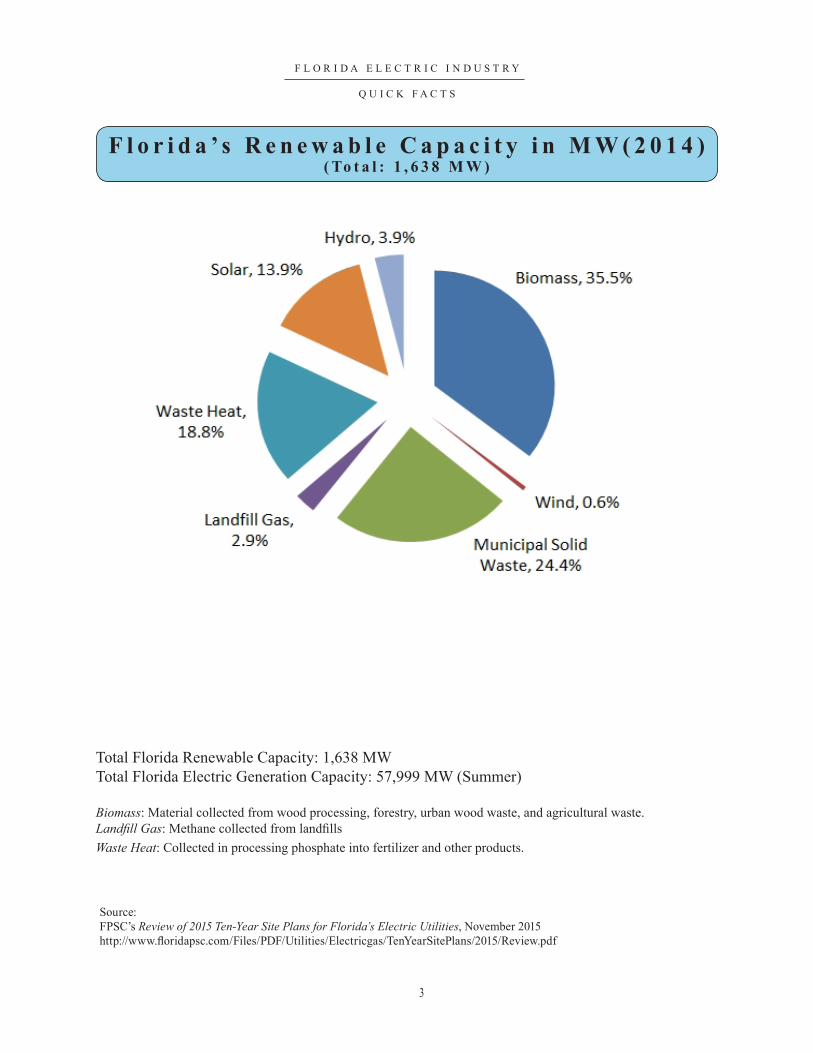
F l o r i d a ’ s R e n e w a b l e C a p a c i t y i n M W ( 2 0 1 4 )( To t a l : 1 , 6 3 8 M W )
Source:FPSC’s Review of 2015 Ten-Year Site Plans for Florida’s Electric Utilities, November 2015http://www.floridapsc.com/Files/PDF/Utilities/Electricgas/TenYearSitePlans/2015/Review.pdf
Total Florida Renewable Capacity: 1,638 MWTotal Florida Electric Generation Capacity: 57,999 MW (Summer)
Biomass: Material collected from wood processing, forestry, urban wood waste, and agricultural waste.Landfill Gas: Methane collected from landfillsWaste Heat: Collected in processing phosphate into fertilizer and other products.
4
Av e r a g e N u m b e r o f C u s t o m e r s
F L O R I D A E L E C T R I C I N D U S T R Y
C U S T O M E R S
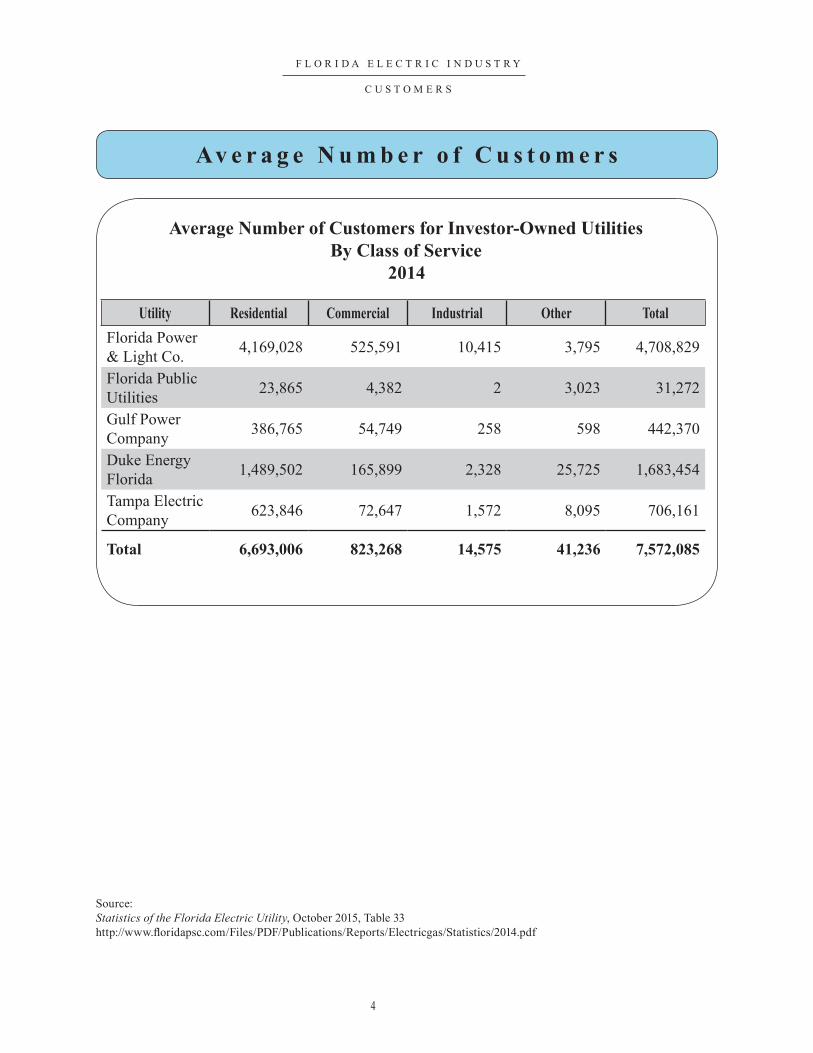
Average Number of Customers for Investor-Owned Utilities
By Class of Service2014
Utility Residential Commercial Industrial Other TotalFlorida Power & Light Co. 4,169,028 525,591 10,415 3,795 4,708,829
Florida Public Utilities 23,865 4,382 2 3,023 31,272
Gulf Power Company 386,765 54,749 258 598 442,370
Duke Energy Florida 1,489,502 165,899 2,328 25,725 1,683,454
Tampa Electric Company 623,846 72,647 1,572 8,095 706,161
Total 6,693,006 823,268 14,575 41,236 7,572,085
Source: Statistics of the Florida Electric Utility, October 2015, Table 33 http://www.floridapsc.com/Files/PDF/Publications/Reports/Electricgas/Statistics/2014.pdf

5
Ty p i c a l E l e c t r i c B i l l C o m p a r i s o n s
F L O R I D A E L E C T R I C I N D U S T R Y
R A T E S
Residential Service Provided by Investor-Owned UtilitiesDecember 31, 2015
Ty p i c a l E l e c t r i c B i l l C o m p a r i s o n s
Utility Minimum Bill or Customer Charge*
1,000Kilowatt Hours
Florida Power & Light Company
$7.57 $94.30
Duke Energy Florida $8.76 $118.55Tampa Electric Company $15.00 $106.20Gulf Power Company $18.60 $135.81Florida Public Utilities Company Northwest Northeast
$14.00$14.00
$137.57$137.57
Commercial/Industrial Service Provided by Investor-Owned Utilities
December 31, 2015
Utility 400,000
Kilowatt Hours 1,000 KW Demand*
Florida Power & Light Company $31,030Duke Energy Florida $34,023Tampa Electric Company $34,248Gulf Power Company $38,001Florida Public Utilities Company Northwest Northeast
$44,562$44,562
* Excludes local taxes, franchise fees, and gross receipts taxes that are billed as a separate line item. Includes cost recovery clause factors effective December 2015.
Note: Typical electric bill comparisons for municipally and cooperatively owned electric utilities are available in the Comparative Rate Statistics report available at: http://www.floridapsc.com/Publications/Reports#
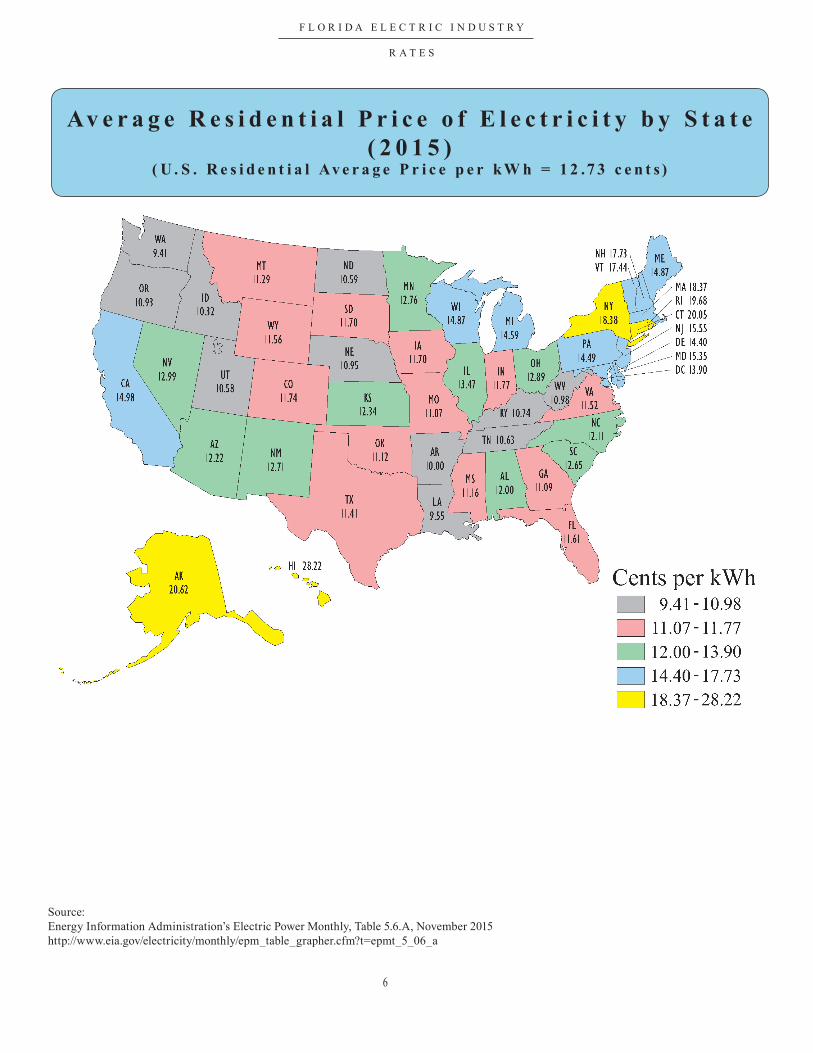
Av e r a g e R e s i d e n t i a l P r i c e o f E l e c t r i c i t y b y S t a t e ( 2 0 1 5 )
( U . S . R e s i d e n t i a l Av e r a g e P r i c e p e r k W h = 1 2 .7 3 c e n t s )
F L O R I D A E L E C T R I C I N D U S T R Y
R A T E S
6
Source:Energy Information Administration’s Electric Power Monthly, Table 5.6.A, November 2015http://www.eia.gov/electricity/monthly/epm_table_grapher.cfm?t=epmt_5_06_a
7
F L O R I D A E L E C T R I C I N D U S T R Y
N U C L E A R P O W E R
N u c l e a r Wa s t e P o l i c y
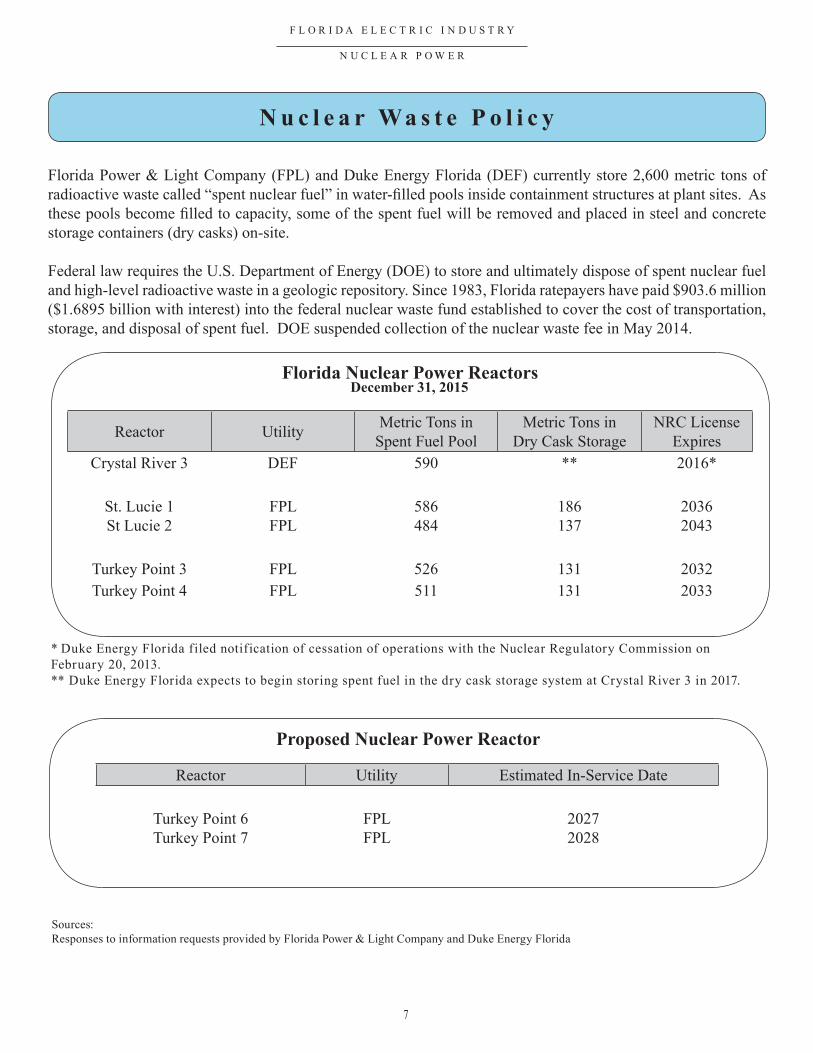
Florida Power & Light Company (FPL) and Duke Energy Florida (DEF) currently store 2,600 metric tons of radioactive waste called “spent nuclear fuel” in water-filled pools inside containment structures at plant sites. As these pools become filled to capacity, some of the spent fuel will be removed and placed in steel and concrete storage containers (dry casks) on-site.
Federal law requires the U.S. Department of Energy (DOE) to store and ultimately dispose of spent nuclear fuel and high-level radioactive waste in a geologic repository. Since 1983, Florida ratepayers have paid $903.6 million ($1.6895 billion with interest) into the federal nuclear waste fund established to cover the cost of transportation, storage, and disposal of spent fuel. DOE suspended collection of the nuclear waste fee in May 2014.
Florida Nuclear Power ReactorsDecember 31, 2015
Reactor Utility Metric Tons in Spent Fuel Pool
Metric Tons in Dry Cask Storage
NRC License Expires
Crystal River 3 DEF 590 ** 2016*
St. Lucie 1St Lucie 2
FPLFPL
586484
186137
20362043
Turkey Point 3 FPL 526 131 2032Turkey Point 4 FPL 511 131 2033
* Duke Energy Florida filed notification of cessation of operations with the Nuclear Regulatory Commission on February 20, 2013.** Duke Energy Florida expects to begin storing spent fuel in the dry cask storage system at Crystal River 3 in 2017.
Proposed Nuclear Power Reactor
Reactor Utility Estimated In-Service Date
Turkey Point 6Turkey Point 7
FPLFPL
20272028
Sources: Responses to information requests provided by Florida Power & Light Company and Duke Energy Florida
8
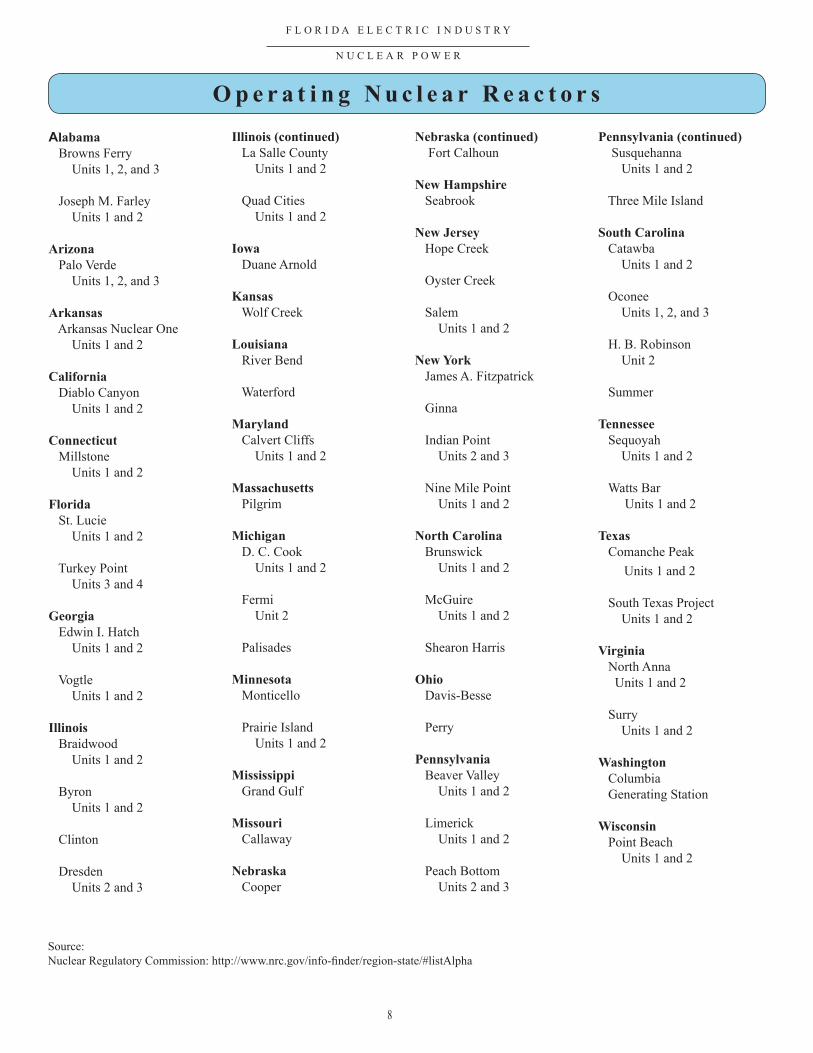
O p e r a t i n g N u c l e a r R e a c t o r s
F L O R I D A E L E C T R I C I N D U S T R Y
N U C L E A R P O W E R
Alabama Browns Ferry Units 1, 2, and 3
Joseph M. Farley Units 1 and 2
Arizona Palo Verde Units 1, 2, and 3
Arkansas Arkansas Nuclear One Units 1 and 2
California Diablo Canyon Units 1 and 2
Connecticut Millstone Units 1 and 2
Florida St. Lucie Units 1 and 2 Turkey Point Units 3 and 4
Georgia Edwin I. Hatch Units 1 and 2
Vogtle Units 1 and 2
Illinois Braidwood Units 1 and 2
Byron Units 1 and 2
Clinton
Dresden Units 2 and 3
Illinois (continued) La Salle County Units 1 and 2
Quad Cities Units 1 and 2
Iowa Duane Arnold
Kansas Wolf Creek
Louisiana River Bend
Waterford
Maryland Calvert Cliffs Units 1 and 2
Massachusetts Pilgrim
Michigan D. C. Cook Units 1 and 2
Fermi Unit 2
Palisades
Minnesota Monticello
Prairie Island Units 1 and 2
Mississippi Grand Gulf
Missouri Callaway
Nebraska Cooper
Nebraska (continued) Fort Calhoun
New Hampshire Seabrook
New Jersey Hope Creek
Oyster Creek Salem Units 1 and 2
New York James A. Fitzpatrick
Ginna
Indian Point Units 2 and 3
Nine Mile Point Units 1 and 2
North Carolina Brunswick Units 1 and 2
McGuire Units 1 and 2
Shearon Harris
Ohio Davis-Besse
Perry
Pennsylvania Beaver Valley Units 1 and 2
Limerick Units 1 and 2
Peach Bottom Units 2 and 3
Pennsylvania (continued) Susquehanna Units 1 and 2
Three Mile Island
South Carolina Catawba Units 1 and 2
Oconee Units 1, 2, and 3
H. B. Robinson Unit 2
Summer
Tennessee Sequoyah Units 1 and 2
Watts Bar Units 1 and 2
Texas Comanche Peak Units 1 and 2
South Texas Project Units 1 and 2
Virginia North Anna Units 1 and 2
Surry Units 1 and 2
Washington Columbia Generating Station
Wisconsin Point Beach Units 1 and 2
Source:Nuclear Regulatory Commission: http://www.nrc.gov/info-finder/region-state/#listAlpha
9
F L O R I D A E L E C T R I C I N D U S T R Y
M A P S
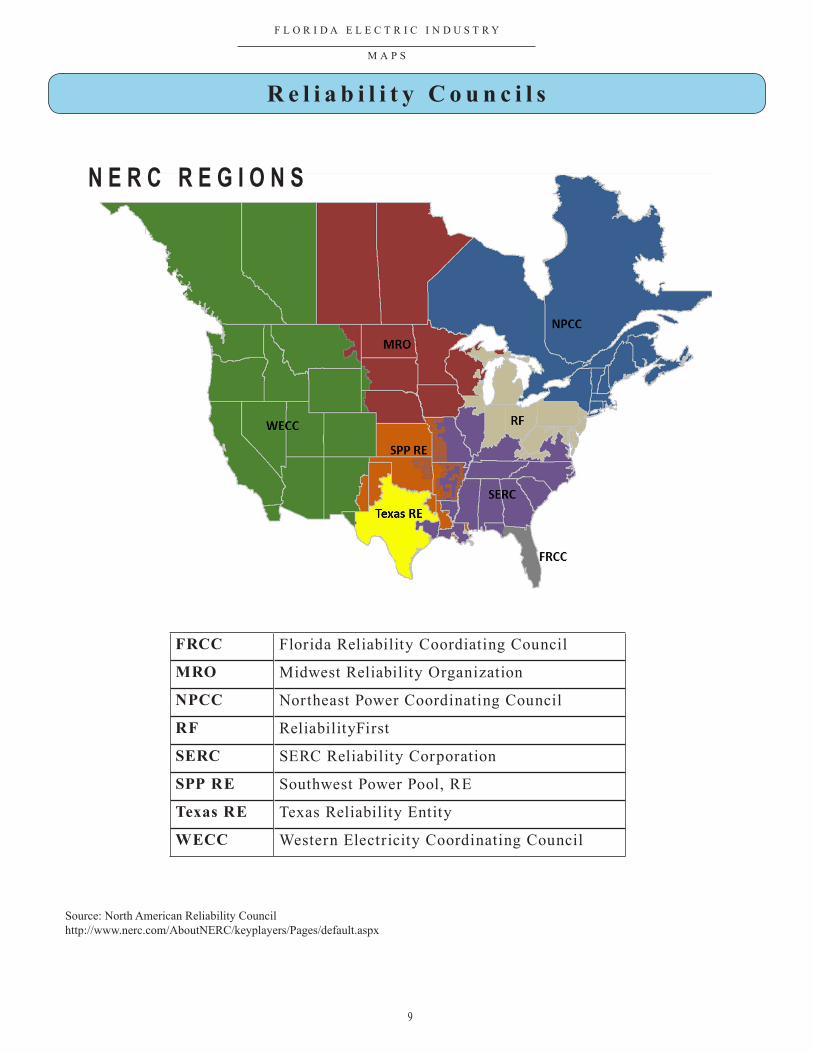
R e l i a b i l i t y C o u n c i l s
FRCC Florida Reliability Coordiating Council
MRO Midwest Reliability Organization
NPCC Northeast Power Coordinating Council
RF ReliabilityFirst
SERC SERC Reliability Corporation
SPP RE Southwest Power Pool, RE
Texas RE Texas Reliability Entity
WECC Western Electricity Coordinating Council
Source: North American Reliability Councilhttp://www.nerc.com/AboutNERC/keyplayers/Pages/default.aspx
N E R C R E G I O N S
10
F L O R I D A E L E C T R I C I N D U S T R Y
M A P S
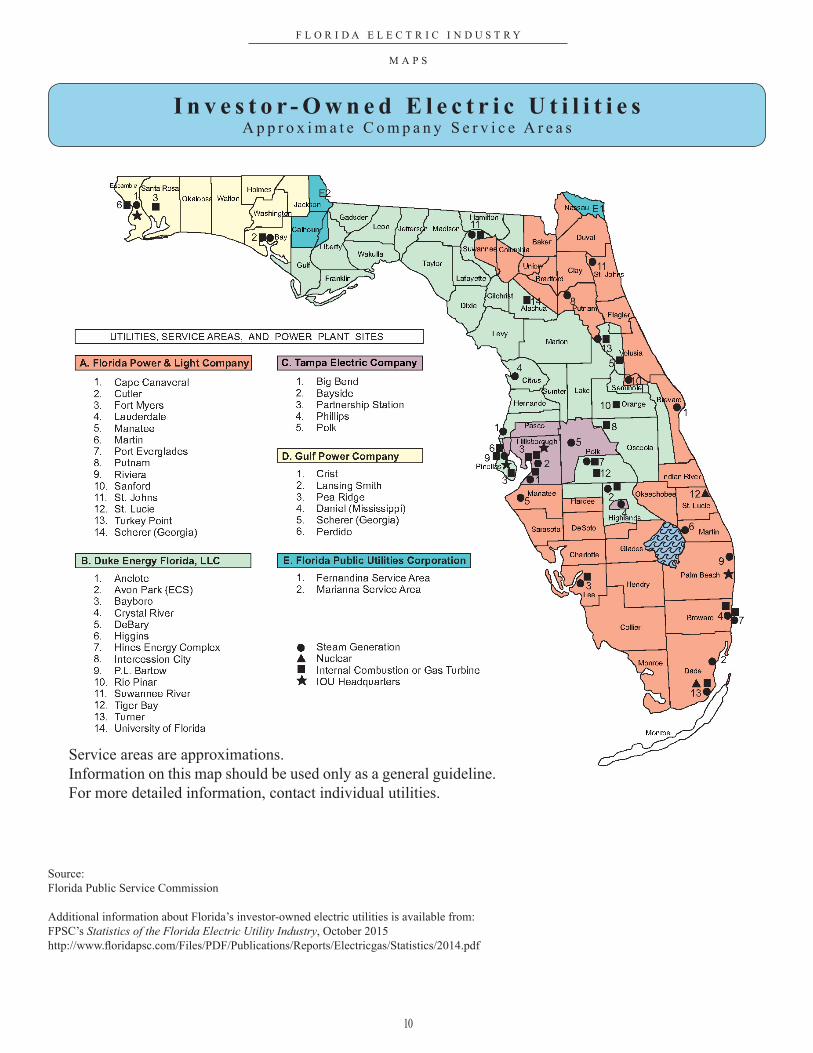
Source:Florida Public Service Commission
Additional information about Florida’s investor-owned electric utilities is available from:FPSC’s Statistics of the Florida Electric Utility Industry, October 2015http://www.floridapsc.com/Files/PDF/Publications/Reports/Electricgas/Statistics/2014.pdf
I n v e s t o r - O w n e d E l e c t r i c U t i l i t i e sA p p r o x i m a t e C o m p a n y S e r v i c e A r e a s
Service areas are approximations.Information on this map should be used only as a general guideline.For more detailed information, contact individual utilities.
11
F L O R I D A E L E C T R I C I N D U S T R Y
M A P S
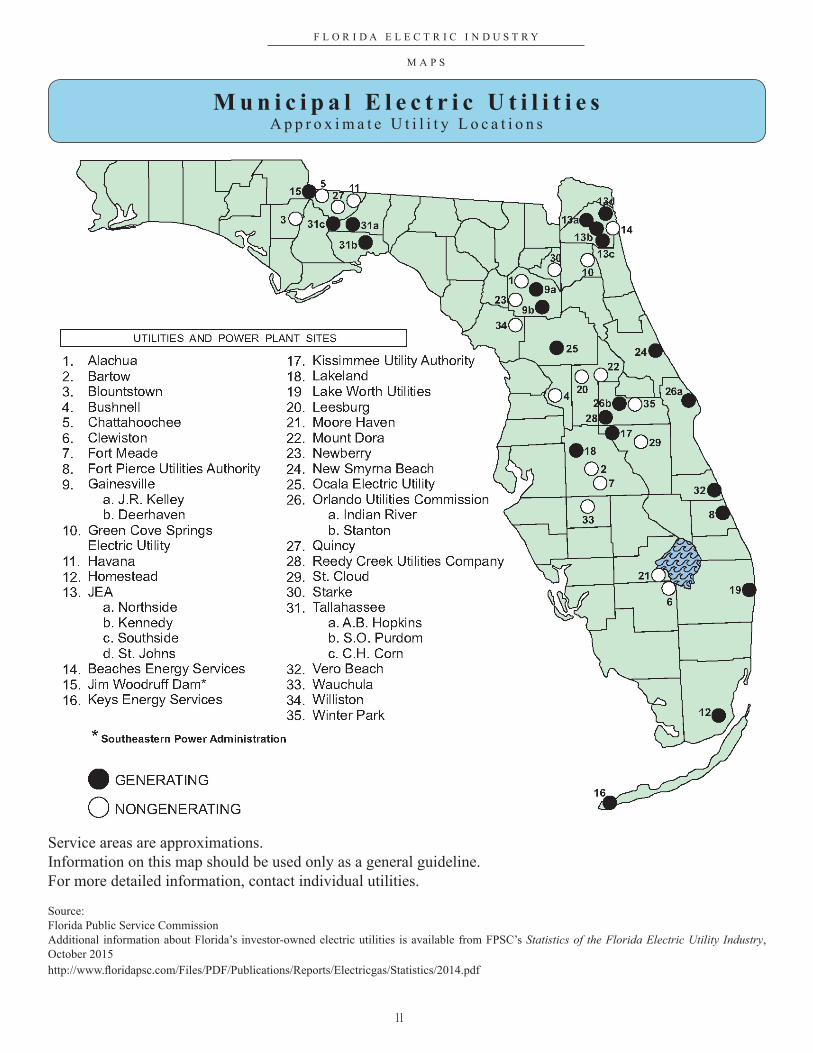
M u n i c i p a l E l e c t r i c U t i l i t i e sA p p r o x i m a t e U t i l i t y L o c a t i o n s
Source:Florida Public Service CommissionAdditional information about Florida’s investor-owned electric utilities is available from FPSC’s Statistics of the Florida Electric Utility Industry, October 2015http://www.floridapsc.com/Files/PDF/Publications/Reports/Electricgas/Statistics/2014.pdf
Service areas are approximations.Information on this map should be used only as a general guideline.For more detailed information, contact individual utilities.
12
F L O R I D A E L E C T R I C I N D U S T R Y
M A P S
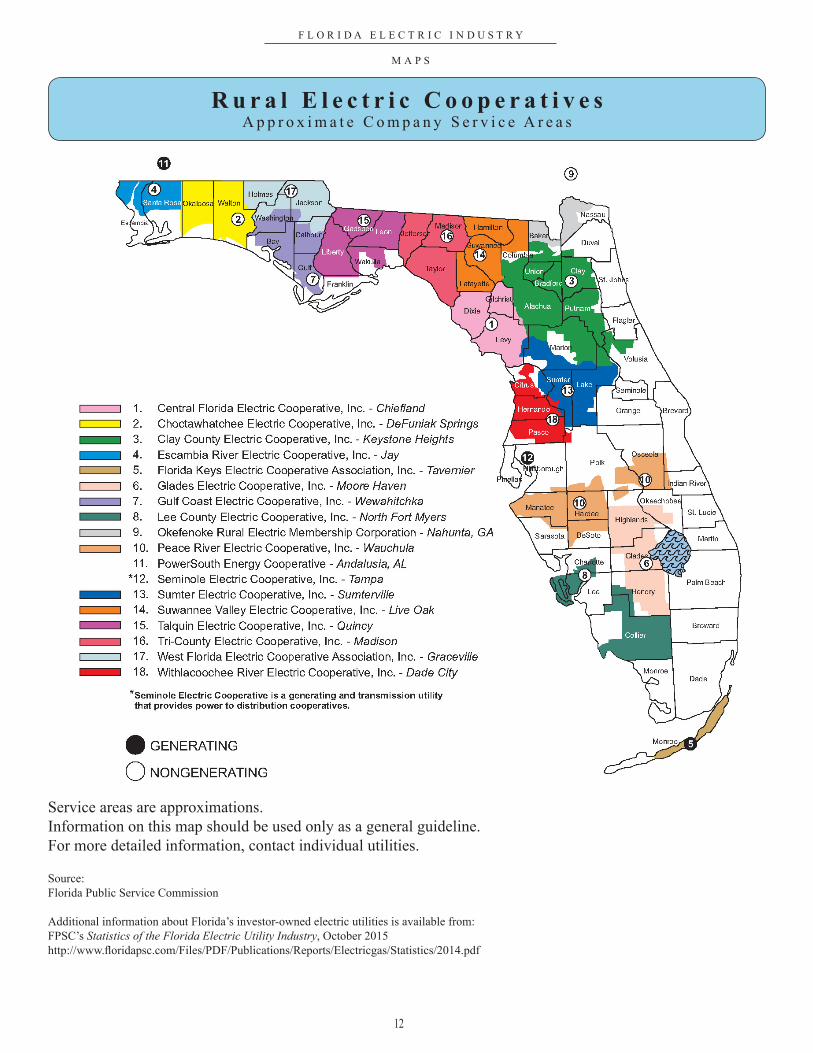
R u r a l E l e c t r i c C o o p e r a t i v e sA p p r o x i m a t e C o m p a n y S e r v i c e A r e a s
Source:Florida Public Service Commission
Additional information about Florida’s investor-owned electric utilities is available from:FPSC’s Statistics of the Florida Electric Utility Industry, October 2015http://www.floridapsc.com/Files/PDF/Publications/Reports/Electricgas/Statistics/2014.pdf
Service areas are approximations.Information on this map should be used only as a general guideline.For more detailed information, contact individual utilities.
13
F L O R I D A N A T U R A L G A S I N D U S T R Y
Q U I C K F A C T S
R e g u l a t o r y A u t h o r i t y
• Natural gas is transported to Florida customers through two major and two small interstate pipelines: Major 1. Florida Gas Transmission Company (FGT) 2. Gulfstream Natural Gas System Small 1. Gulf South Pipeline Company 2. Southern Natural Gas
• FGT’s pipeline capacity is nearly 3 million cubic feet per day.
• Gulfstream’s pipeline capacity is 1.3 billion cubic feet per day.
Tr a n s m i s s i o n
Pusuant to Chapter 366, F.S., as of December 31, 2015, the FPSC has regulatory authority over:
• 8 investor-owned natural gas utilities (all aspects of operations, including safety)
• 27 municipally-owned natural gas utilities (limited to safety and territorial boundaries)
• 4 special gas districts (limited to safety and territorial boundaries)
Sources:Florida Gas Transmission Company http://fgttransfer.energytransfer.com/ipost/FGT
Gulfstream Natural Gas System http://wp.gulfstreamgas.com/
14
F L O R I D A N A T U R A L G A S I N D U S T R Y
C U S T O M E R S
N u m b e r o f C u s t o m e r s
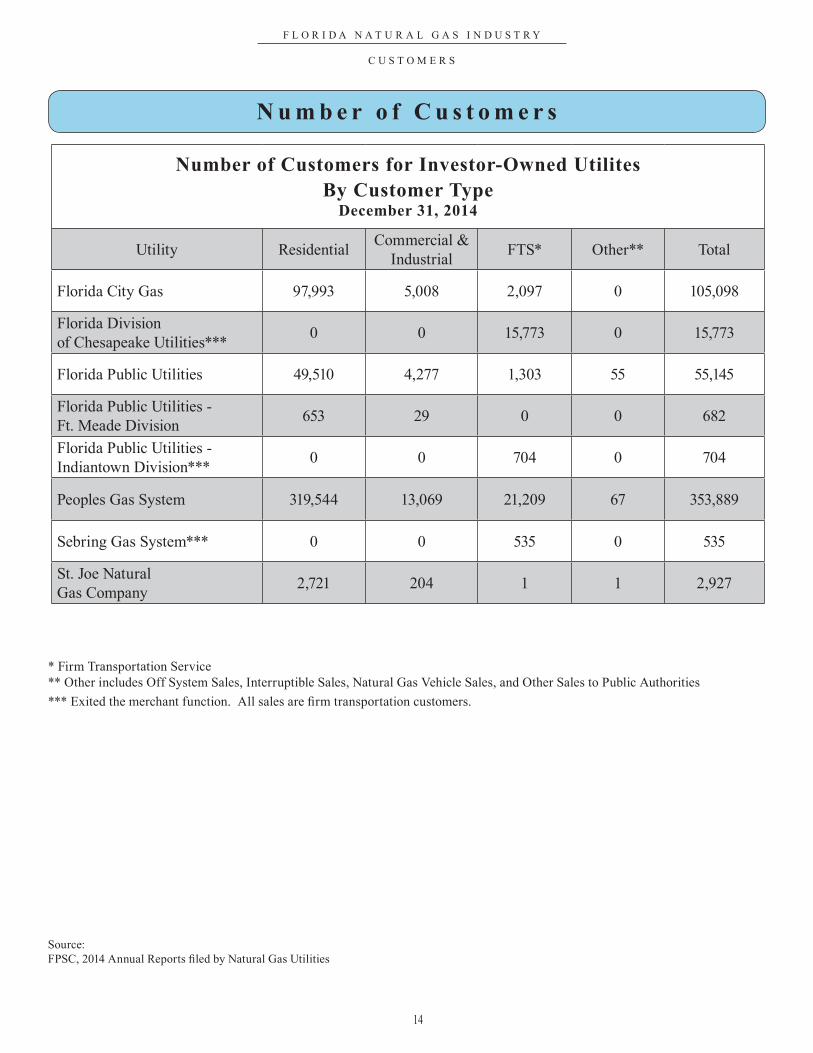
Number of Customers for Investor-Owned UtilitesBy Customer Type
December 31, 2014
Utility Residential Commercial & Industrial FTS* Other** Total
Florida City Gas 97,993 5,008 2,097 0 105,098
Florida Division of Chesapeake Utilities*** 0 0 15,773 0 15,773
Florida Public Utilities 49,510 4,277 1,303 55 55,145
Florida Public Utilities - Ft. Meade Division 653 29 0 0 682
Florida Public Utilities - Indiantown Division*** 0 0 704 0 704
Peoples Gas System 319,544 13,069 21,209 67 353,889
Sebring Gas System*** 0 0 535 0 535
St. Joe Natural Gas Company 2,721 204 1 1 2,927
* Firm Transportation Service** Other includes Off System Sales, Interruptible Sales, Natural Gas Vehicle Sales, and Other Sales to Public Authorities*** Exited the merchant function. All sales are firm transportation customers.
Source:FPSC, 2014 Annual Reports filed by Natural Gas Utilities
15
F L O R I D A N A T U R A L G A S I N D U S T R Y
R A T E S
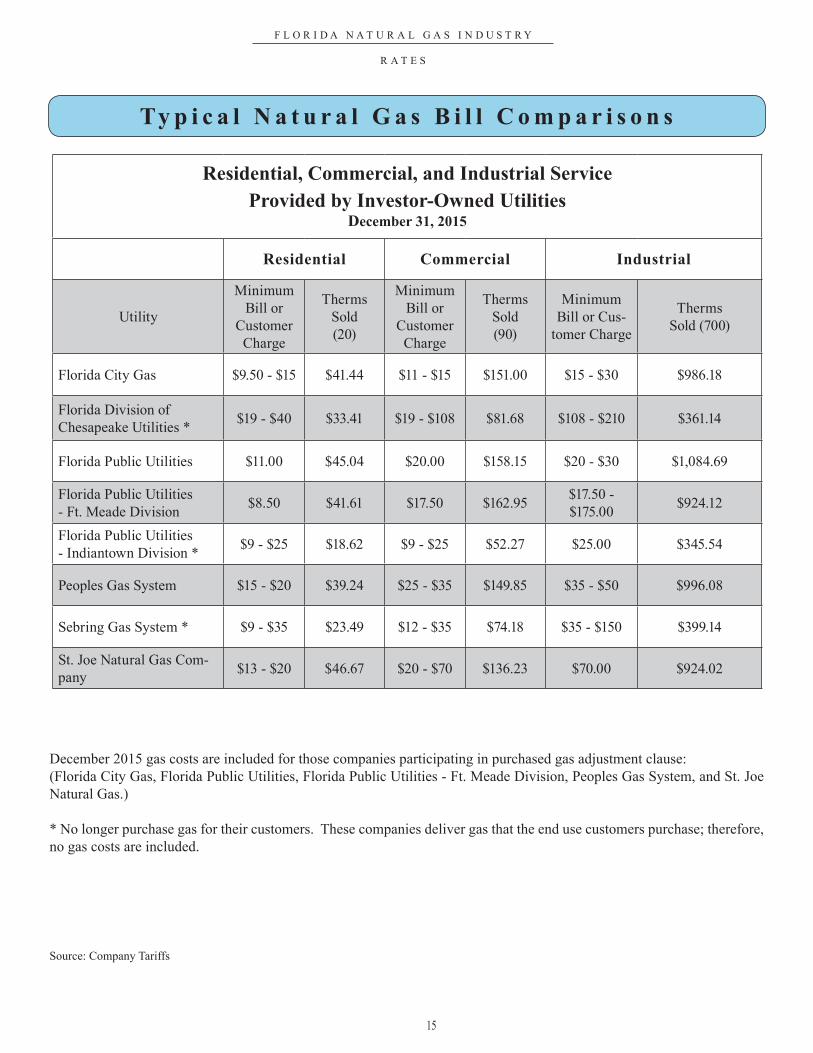
Residential, Commercial, and Industrial Service Provided by Investor-Owned Utilities
December 31, 2015
Residential Commercial Industrial
Utility
Minimum Bill or
Customer Charge
Therms Sold(20)
Minimum Bill or
Customer Charge
Therms Sold (90)
Minimum Bill or Cus-
tomer Charge
Therms Sold (700)
Florida City Gas $9.50 - $15 $41.44 $11 - $15 $151.00 $15 - $30 $986.18
Florida Division of Chesapeake Utilities * $19 - $40 $33.41 $19 - $108 $81.68 $108 - $210 $361.14
Florida Public Utilities $11.00 $45.04 $20.00 $158.15 $20 - $30 $1,084.69
Florida Public Utilities - Ft. Meade Division $8.50 $41.61 $17.50 $162.95 $17.50 -
$175.00 $924.12
Florida Public Utilities - Indiantown Division * $9 - $25 $18.62 $9 - $25 $52.27 $25.00 $345.54
Peoples Gas System $15 - $20 $39.24 $25 - $35 $149.85 $35 - $50 $996.08
Sebring Gas System * $9 - $35 $23.49 $12 - $35 $74.18 $35 - $150 $399.14
St. Joe Natural Gas Com-pany $13 - $20 $46.67 $20 - $70 $136.23 $70.00 $924.02
Ty p i c a l N a t u r a l G a s B i l l C o m p a r i s o n s
December 2015 gas costs are included for those companies participating in purchased gas adjustment clause: (Florida City Gas, Florida Public Utilities, Florida Public Utilities - Ft. Meade Division, Peoples Gas System, and St. Joe Natural Gas.)
* No longer purchase gas for their customers. These companies deliver gas that the end use customers purchase; therefore, no gas costs are included.
Source: Company Tariffs
16
F L O R I D A N A T U R A L G A S I N D U S T R Y
A N N U A L T H E R M S A L E S
A n n u a l T h e r m S a l e s
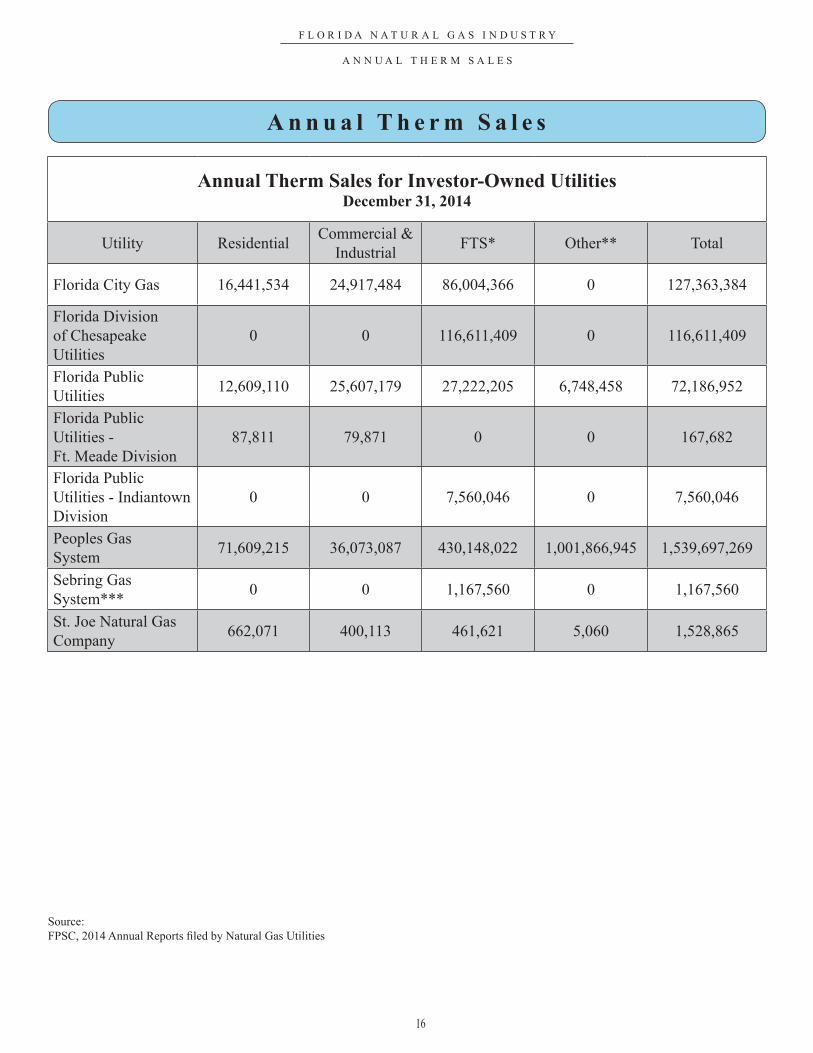
Annual Therm Sales for Investor-Owned UtilitiesDecember 31, 2014
Utility Residential Commercial & Industrial FTS* Other** Total
Florida City Gas 16,441,534 24,917,484 86,004,366 0 127,363,384
Florida Division of Chesapeake Utilities
0 0 116,611,409 0 116,611,409
Florida Public Utilities 12,609,110 25,607,179 27,222,205 6,748,458 72,186,952
Florida Public Utilities - Ft. Meade Division
87,811 79,871 0 0 167,682
Florida Public Utilities - Indiantown Division
0 0 7,560,046 0 7,560,046
Peoples Gas System 71,609,215 36,073,087 430,148,022 1,001,866,945 1,539,697,269
Sebring Gas System*** 0 0 1,167,560 0 1,167,560
St. Joe Natural Gas Company 662,071 400,113 461,621 5,060 1,528,865
Source:FPSC, 2014 Annual Reports filed by Natural Gas Utilities
17
F L O R I D A N A T U R A L G A S I N D U S T R Y
M A P
JacksonHolmes
WaltonOkaloosa
Franklin
Liberty
Bay
LeonGadsden
St. Johns
ColumbiaSuwannee
MadisonJefferson
Wakulla
Clay
Duval
Nassau
Union
Baker
Putnam
MarionLevy
Lafayette
Sumter
Citrus
Flagler
Manatee
Pasco
Dixie
Orange
Osceola
Pinellas
Palm Beach
Martin
Glades
Lee
Sarasota
Okeechobee
Monroe
Monroe
Collier
Dade
Broward
Hendry
Lake
Volusia
Seminole
Taylor
Calhoun
Brevard
DeSoto
Alachua
Highlands
INVESTOR-OWNED
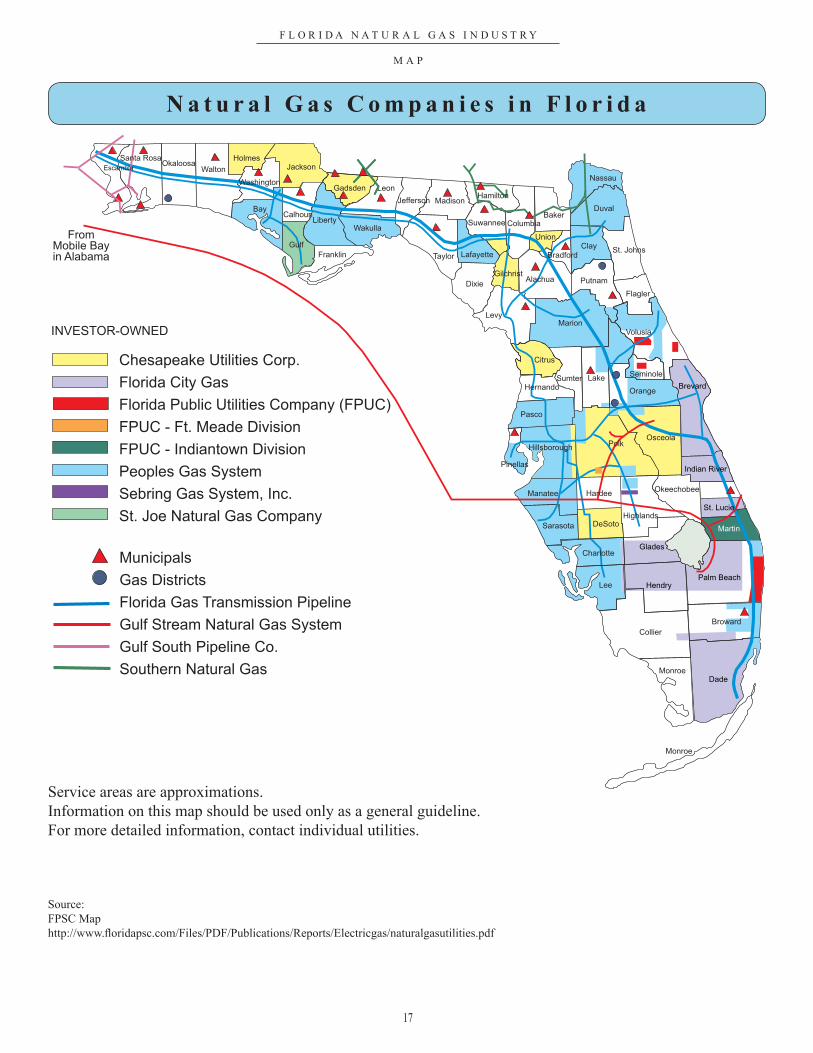
Municipals
Gas Districts
Florida Gas Transmission Pipeline
Gulf Stream Natural Gas System
Gulf South Pipeline Co.
Southern Natural Gas
Hillsborough
Indian River
St. Lucie
Charlotte
Washington
Gulf
Bradford
Gilchrist
FromMobile Bayin Alabama
Polk
Hardee
Chesapeake Utilities Corp.
Florida City Gas
Florida Public Utilities Company (FPUC)
FPUC - Ft. Meade Division
FPUC - Indiantown Division
Peoples Gas System
Sebring Gas System, Inc.
St. Joe Natural Gas Company
Hernando
Escambia
Santa Rosa
Hamilton
Service areas are approximations.Information on this map should be used only as a general guideline.For more detailed information, contact individual utilities.
Source:FPSC Maphttp://www.floridapsc.com/Files/PDF/Publications/Reports/Electricgas/naturalgasutilities.pdf
N a t u r a l G a s C o m p a n i e s i n F l o r i d a
18
F L O R I D A T E L E C O M M U N I C A T I O N S I N D U S T R Y
Q U I C K F A C T S
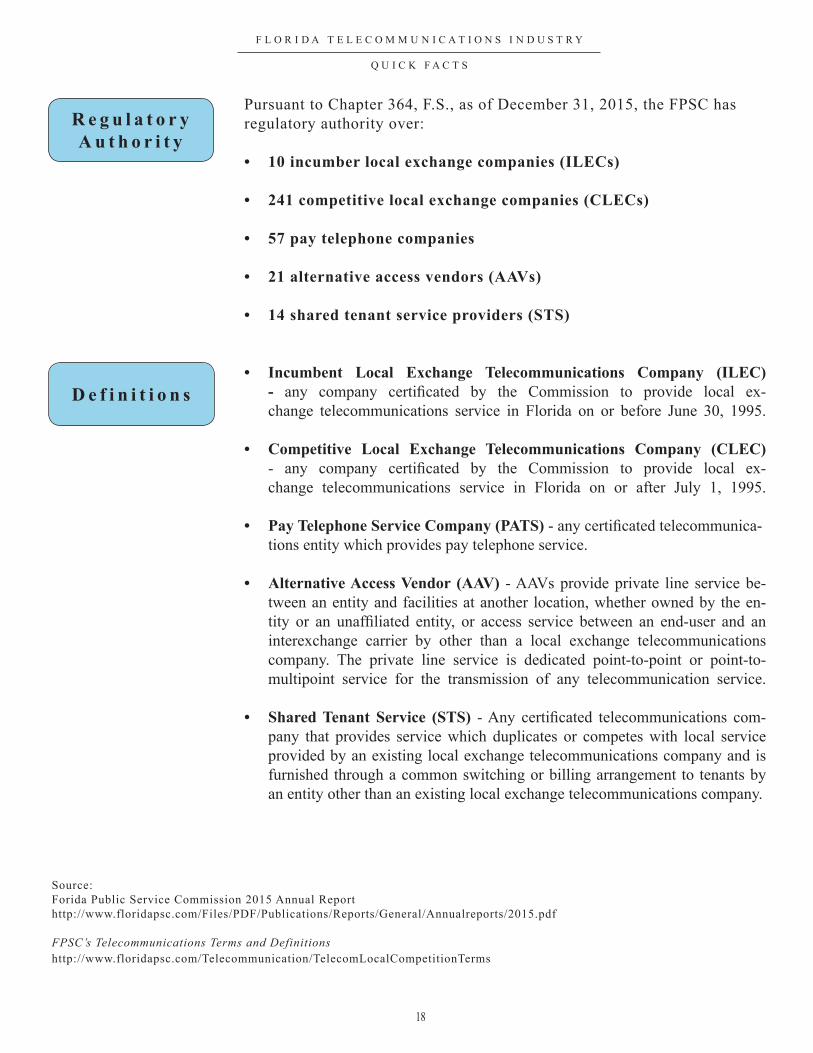
Pursuant to Chapter 364, F.S., as of December 31, 2015, the FPSC has regulatory authority over:
• 10 incumber local exchange companies (ILECs)
• 241 competitive local exchange companies (CLECs)
• 57 pay telephone companies
• 21 alternative access vendors (AAVs)
• 14 shared tenant service providers (STS)
• Incumbent Local Exchange Telecommunications Company (ILEC) - any company certificated by the Commission to provide local ex-change telecommunications service in Florida on or before June 30, 1995.
• Competitive Local Exchange Telecommunications Company (CLEC) - any company certificated by the Commission to provide local ex-change telecommunications service in Florida on or after July 1, 1995.
• Pay Telephone Service Company (PATS) - any certificated telecommunica-tions entity which provides pay telephone service.
• Alternative Access Vendor (AAV) - AAVs provide private line service be-tween an entity and facilities at another location, whether owned by the en-tity or an unaffiliated entity, or access service between an end-user and an interexchange carrier by other than a local exchange telecommunications company. The private line service is dedicated point-to-point or point-to-multipoint service for the transmission of any telecommunication service.
• Shared Tenant Service (STS) - Any certificated telecommunications com-pany that provides service which duplicates or competes with local service provided by an existing local exchange telecommunications company and is furnished through a common switching or billing arrangement to tenants by an entity other than an existing local exchange telecommunications company.
D e f i n i t i o n s
Source:Forida Public Service Commission 2015 Annual Report http://www.floridapsc.com/Files/PDF/Publications/Reports/General/Annualreports/2015.pdf
FPSC’s Telecommunications Terms and Definitionshttp://www.floridapsc.com/Telecommunication/TelecomLocalCompetitionTerms
R e g u l a t o r y A u t h o r i t y
19
F L O R I D A T E L E C O M M U N I C A T I O N S I N D U S T R Y
Q U I C K F A C T S
B r o a d b a n d , Vo I P, a n d W i r e l e s s
Broadband is a term describing evolving digital technologies offering consumers integrated access to voice, high-speed data services, video on demand services, and interactive information delivery services. Voice over Internet Protocol (VoIP) and wireless services compete with traditional wireline service and represent a significant portion of today’s communications market in Florida. VoIP is not the same as the Internet. It is a technology that allows you to make voice calls using a broadband internet connection instead of a regular telephone line. Broadband service also provides the basis for some VoIP services. These three services are not subject to FPSC jurisdiction.
Broadband
• Approximately 50 percent of fixed broadband connections are at download speeds of 3 megabytes per second (Mbps) or greater; however, 72 percent of those connections are greater than or equal to 200 Mbps.
• Residential subscribership in Florida reached 78 percent as of June 2014, which is above the current national of 73 percent.
VoIP
• As of December 2014, there were an estimated 2.8 million residential VoIP subscribers in Florida, about the same number estimated in 2013.
• The Florida Cable Telecommunications Association (FCTA) reported 2.1 million residential cable digital voice (VoIP) subscribers as of December 2014, about the same number as reported for December 2013.
Wireless• Wireless suscribers in Florida, as of June 2013, reached 19 million handsets.
• The Centers for Disease Control (CDC) estimates that over 45 percent of households are wireless-only as of December 2014.
Source: FPSC’s Report on the Status of Competition in the Telecommunications Industry, As of December 31, 2014 http://www.f loridapsc.com/Files/PDF/Publications/Reports/Telecommunication/TelecommunicationIndustry/2015.pdf
20
F L O R I D A T E L E C O M M U N I C A T I O N S I N D U S T R Y
C U S T O M E R S
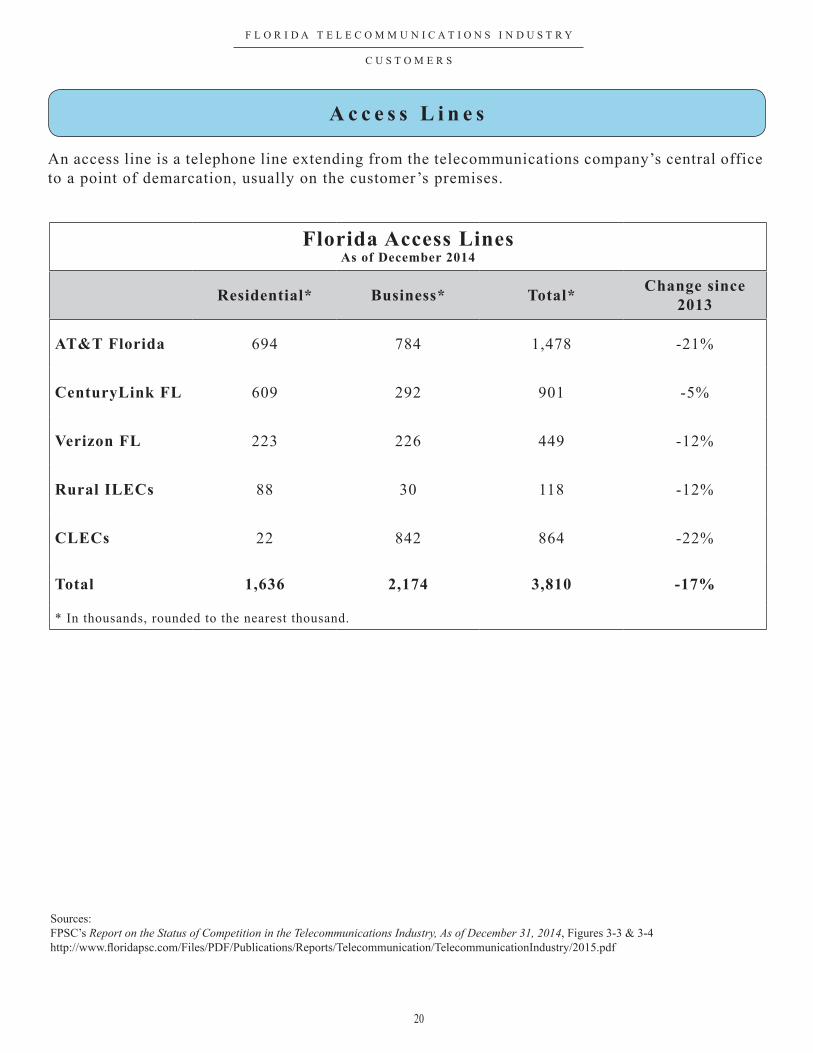
A c c e s s L i n e s
An access line is a telephone line extending from the telecommunications company’s central office to a point of demarcation, usually on the customer’s premises.
Florida Access LinesAs of December 2014
Residential* Business* Total* Change since 2013
AT&T Florida 694 784 1,478 -21%
CenturyLink FL 609 292 901 -5%
Verizon FL 223 226 449 -12%
Rural ILECs 88 30 118 -12%
CLECs 22 842 864 -22%
Total 1,636 2,174 3,810 -17%
* In thousands, rounded to the nearest thousand.
Sources:FPSC’s Report on the Status of Competition in the Telecommunications Industry, As of December 31, 2014, Figures 3-3 & 3-4http://www.floridapsc.com/Files/PDF/Publications/Reports/Telecommunication/TelecommunicationIndustry/2015.pdf
21
F L O R I D A T E L E C O M M U N I C A T I O N S I N D U S T R Y
C U S T O M E R S
U n i v e r s a l S e r v i c e P r o g r a m s
The Federal Communications Commission (FCC) and Congress recognize that telephone service provides a vital link to emergency services, government services, and surrounding communities. To help promote tele-communications service nationwide, the FCC, as directed by Congress, developed the Federal Universal Service Fund (USF). The USF is administered by the Universal Service Administrative Company (USAC). The USF includes the High-Cost, Low-Income, Schools and Libraries, and Rural Health Care Programs.
High-Cost Program. The federal universal service high-cost program (also known as the Connect America Fund) is designed to ensure that consumers in rural, insular, and high-cost areas have access to modern com-munications networks capable of providing voice and broadband service, both fixed and mobile, at rates that are reasonably comparable to those in urban areas. The program fulfills this universal service goal by allowing eligible carriers who serve these areas to recover some of their costs from the federal Universal Service Fund.
Low-Income Program. Provides telephone service discounts to qualifying low-income consumers. It of-fers benefits through the Lifeline Assistance program:
▲ The Lifeline Assistance Program: Provides a monthly credit of at least $9.25 on basic month-ly service or the option of receiving a free Lifeline cell phone and monthly minutes at the pri-mary residence for qualified telephone subscribers. The telephone subscriber may receive a cred-it less than $9.25 if the subscriber’s bill for basic local telephone service is less than that amount.
▲ Tribal Benefits: Residents living on federally recognized tribal lands may receive a one-time discount of up to $100.00 in Link-Up support and enhanced Lifeline support (up to an additional $25.00 in support beyond current levels). Link-Up helps income-eligible consumers on tribal lands with initial installation or activation of a wireline or wireless telephone for the primary residence.
▲ Monthly Lifeline Credit: Under the FCC’s rules, monthly federal Lifeline support consists of at least a $9.25 monthly credit on basic monthly service or the option of receiving a free Lifeline cell phone and monthly minutes. Eligible subscribers living on tribal lands can receive a monthly discount of up to $34.25 ($9.25 plus an additional $25).
1
2
22
F L O R I D A T E L E C O M M U N I C A T I O N S I N D U S T R Y
C U S T O M E R S
▲ Customer Eligibility: Customers with annual incomes up to 150 percent of the federal poverty guidelines may be eligible to participate in the Lifeline program. In addition, eligibility is deter-mined by customer enrollment in any one of the following programs:
> Temporary Cash Assistance (TCA)*
> Supplemental Security Income (SSI)
> Supplemental Nutritional Assistance Program (SNAP)
> Medicaid
> Federal Public Housing Assistance (Section 8)
> Low-Income Home Energy Assistance Program (LIHEAP)
> National School Lunch Program’s Free Lunch Program
> Bureau of Indian Affairs Programs**
Schools and Libraries (or E-Rate) Program. Helps to ensure that the nation’s classrooms and libraries receive access to the vast array of educational resources that are accessible through the tele-communications network. While funding for the program is capped, the FCC has included an index for inflation to preserve the purchasing power of the program. Recently, the FCC increased the annual cap from $2.4 billion to $3.9 billion. The E-Rate program offers the following benefits:
▲ Eligible schools and libraries receive discounts on telephone service, Internet access, and internal connections (i.e., network wiring) within school and library buildings.
▲ The discounts range from 20 percent to 90 percent, depending on the school’s eligibility for the National School Lunch program (or a federally approved alternative mechanism) and whether or not the school or library is located in an urban or rural area.
* Known as Temporary Assistance to Needy Families (TANF) for federal Universal Service purposes.** Eligible consumers living on tribal lands qualify for Link-Up and Lifeline if they participate in one of the following federal assistance programs: (1) Tribal TANF, (2) National School Lunch Free Lunch Program, or (3) Head Start Subsidy.
Low-Income Program (continued)
3
23
F L O R I D A T E L E C O M M U N I C A T I O N S I N D U S T R Y
C U S T O M E R S
Rural Health Care Program. Helps to link health care providers located in rural areas to urban medical centers so that patients living in rural America will have access to the same advanced diagnostic and other medical services that are enjoyed in urban communities. Funding is capped at $400 million annually. This program offers many benefits:
▲ Public and non-profit health care providers in rural areas can receive discounts on monthly telecommu-nications charges, installation charges, and long distance Internet connection charges.
▲ Rural health care providers are using funds from this program for a variety of patient services, such as transmitting x-rays from remote areas to be read by health care professionals and experts in urban areas.
▲ The FCC has augmented the existing support with a pilot program to fund the construction of dedicated broadband networks that connect health care providers in a state or region. This program will provide funding for up to 85 percent of an applicant’s costs of deploying a dedicated broadband network, includ-ing any necessary network design studies, as well as the costs of advanced telecommunications and information services that will ride over this network. Participants deploying dedicated broadband health care networks would also have the option of connecting those systems to Internet-2, National Lambda-Rail, or the public Internet.
▲ Eligible entities include:
> post-secondary educational institutions offering health care instruction, including teaching hospitals and medical schools
> community health centers or health centers providing health care to migrants > community mental health centers > local health departments or agencies > not-for-profit hospitals > rural health clinics
4
Source: Federal Communications Commissionhttp://www.fcc.gov/cgb/consumerfacts/universalservice.html
24
F L O R I D A T E L E C O M M U N I C A T I O N S I N D U S T R Y
C U S T O M E R S
▲ Coordinated Enrollment Process In 2006, FPSC and the Department of Children and Families (DCF) staff developed a process whereby potential Lifeline customers, once certified through a DCF program, could re-ceive Lifeline discounts. From the perspective of the client, the coordinated enrollment process established by the FPSC and DCF is seamless, from filling out the DCF web application to receiving Lifeline discounts. The coordinated enrollment process entails the DCF client checking a “yes” or “no” box. DCF then forwards the names of the clients who have chosen and been approved for Lifeline, along with their relevant enrollment information, to the FPSC. The FPSC electronically sorts the information by eligible telecommunications car-rier (ETC) and places the names on a secure Web site for retrieval and enrollment by the appropriate ETC.
▲ Lifeline Annual Recertification All ETCs are now required to perform an annual recertification of their Lifeline subscribers to verify their ongoing eligibility. Subscribers failing to respond to recertifi-cation efforts must be de-enrolled from Lifeline. ETCs may contact and receive recertification respons-es from subscribers in writing, by phone, by text message, by e-mail, by Interactive Voice Response, or otherwise through the internet using an electronic signature. If an ETC is unable to recertify a subscrib-er because the subscriber did not respond to the recertification request, the ETC must de-enroll the sub-scriber. If an ETC receives a response that the subscriber is no longer eligible, the subscriber must be de-enrolled within five business days, and offered transitional Lifeline benefits for up to 12 months.
▲ National Lifeline Accountability Database (NLAD) The FCC directed the Universal Service Administra-tive Company to establish a database to both eliminate existing duplicative support and prevent duplicative support in the future. To prevent waste in the Universal Service Fund, the FCC created and mandated the use by ETCs of a National Lifeline Accountability Database to ensure that multiple ETCs do not seek and receive reimbursement for the same Lifeline subscriber. The NLAD conducts a nationwide real-time check to determine if the consumer, or another person at the address of the consumer, is already receiving a Lifeline-supported service.
U n i v e r s a l S e r v i c e P r o g r a m D e v e l o p m e n t s i n F l o r i d a
Low-Income Program
Source:FPSC’s Number of Customers Subscribing to Lifeline Service and the Effectiveness of Procedures to Promote Participation, December 2015http://www.floridapsc.com/Files/PDF/Publications/Reports/Telecommunication/LifelineReport/2015.pdf
25
F L O R I D A T E L E C O M M U N I C A T I O N S I N D U S T R Y
C U S T O M E R S
Low-Income Program (continued)
▲ Eligible Telecommunications Carriers (ETC) A carrier that is granted ETC status is eligible to receive federal universal service support pursuant to FCC rules. To qualify as an ETC, a common carrier must offer services that are supported by federal universal service support mechanisms either using its own facilities or using a combination of its own facilities and another carrier’s resold service. Additionally, the carrier must advertise the availability of such services and charges using media of general distribution. As of June 2015, Florida had 21 ETCs, comprised of 10 incumbent local exchange companies, 8 competitive local exchange companies, and 4 wireless companies. FCC rules allow state commissions, upon their own motion or upon request, to designate a common carrier that meets certain requirements as a landline ETC. As of July 2012, the Federal Communications Commission approves wireless providers applying for ETC designation in Florida. As of June 2015 there were 35 Florida ETC wireless petitions pending at the FCC.
▲ Income Eligibility Section 364.10(2)(a), F.S., allows any local exchange company designated as an ETC with more than 1 million access lines and any commercial mobile radio service provider designated as an ETC carrier pursuant to 47 U.S.C. §214(e), upon filing a notice of election to do so with the Commission, to provide Lifeline service to any customer who meets an income eligibility test of 150 percent or less of the federal poverty income guidelines. All other ETCs must use 135 percent or less of the Federal Poverty Level guidelines for income eligibility.
26
F L O R I D A T E L E C O M M U N I C A T I O N S I N D U S T R Y
C U S T O M E R S
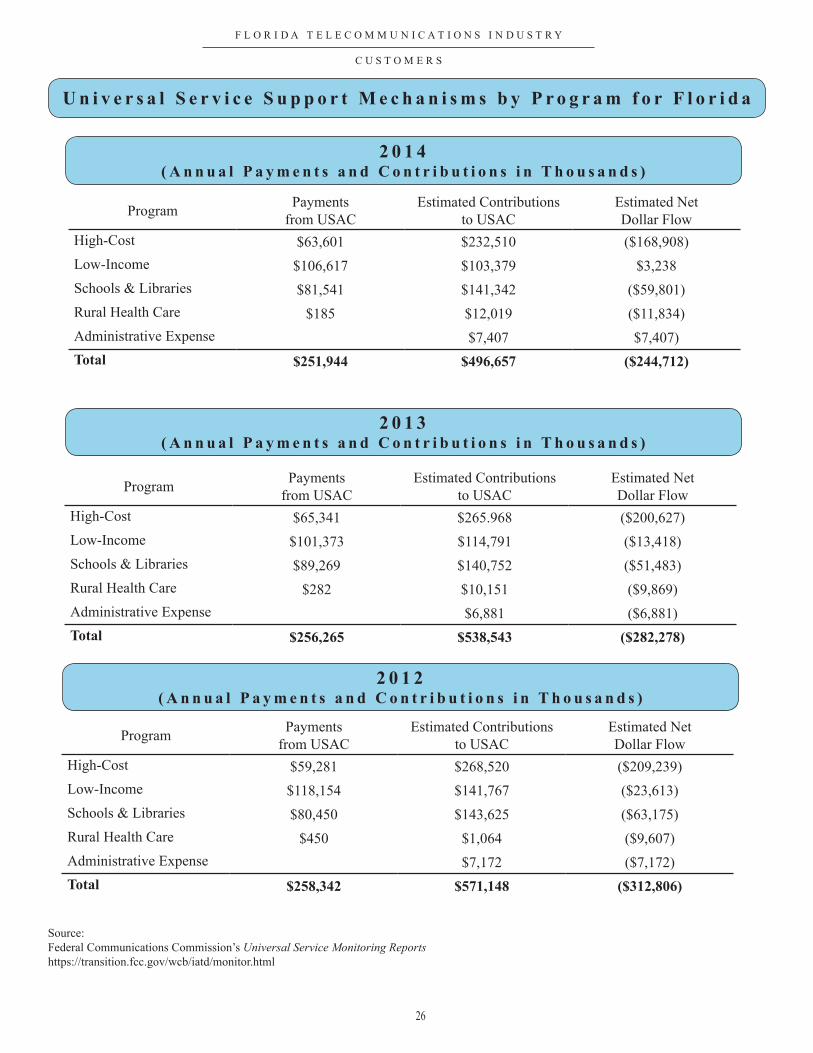
U n i v e r s a l S e r v i c e S u p p o r t M e c h a n i s m s b y P r o g r a m f o r F l o r i d a
2 0 1 4( A n n u a l P a y m e n t s a n d C o n t r i b u t i o n s i n T h o u s a n d s )
Program Payments from USAC
Estimated Contributions to USAC
Estimated Net Dollar Flow
High-Cost $63,601 $232,510 ($168,908)Low-Income $106,617 $103,379 $3,238Schools & Libraries $81,541 $141,342 ($59,801)Rural Health Care $185 $12,019 ($11,834)Administrative Expense $7,407 $7,407)Total $251,944 $496,657 ($244,712)
2 0 1 3( A n n u a l P a y m e n t s a n d C o n t r i b u t i o n s i n T h o u s a n d s )
Program Payments from USAC
Estimated Contributions to USAC
Estimated Net Dollar Flow
High-Cost $65,341 $265.968 ($200,627)Low-Income $101,373 $114,791 ($13,418)Schools & Libraries $89,269 $140,752 ($51,483)Rural Health Care $282 $10,151 ($9,869)Administrative Expense $6,881 ($6,881)Total $256,265 $538,543 ($282,278)
Program Payments from USAC
Estimated Contributions to USAC
Estimated Net Dollar Flow
High-Cost $59,281 $268,520 ($209,239)Low-Income $118,154 $141,767 ($23,613)Schools & Libraries $80,450 $143,625 ($63,175)Rural Health Care $450 $1,064 ($9,607)Administrative Expense $7,172 ($7,172)Total $258,342 $571,148 ($312,806)
2 0 1 2( A n n u a l P a y m e n t s a n d C o n t r i b u t i o n s i n T h o u s a n d s )
Source:Federal Communications Commission’s Universal Service Monitoring Reports https://transition.fcc.gov/wcb/iatd/monitor.html
27
F L O R I D A T E L E C O M M U N I C A T I O N S I N D U S T R Y
C U S T O M E R S
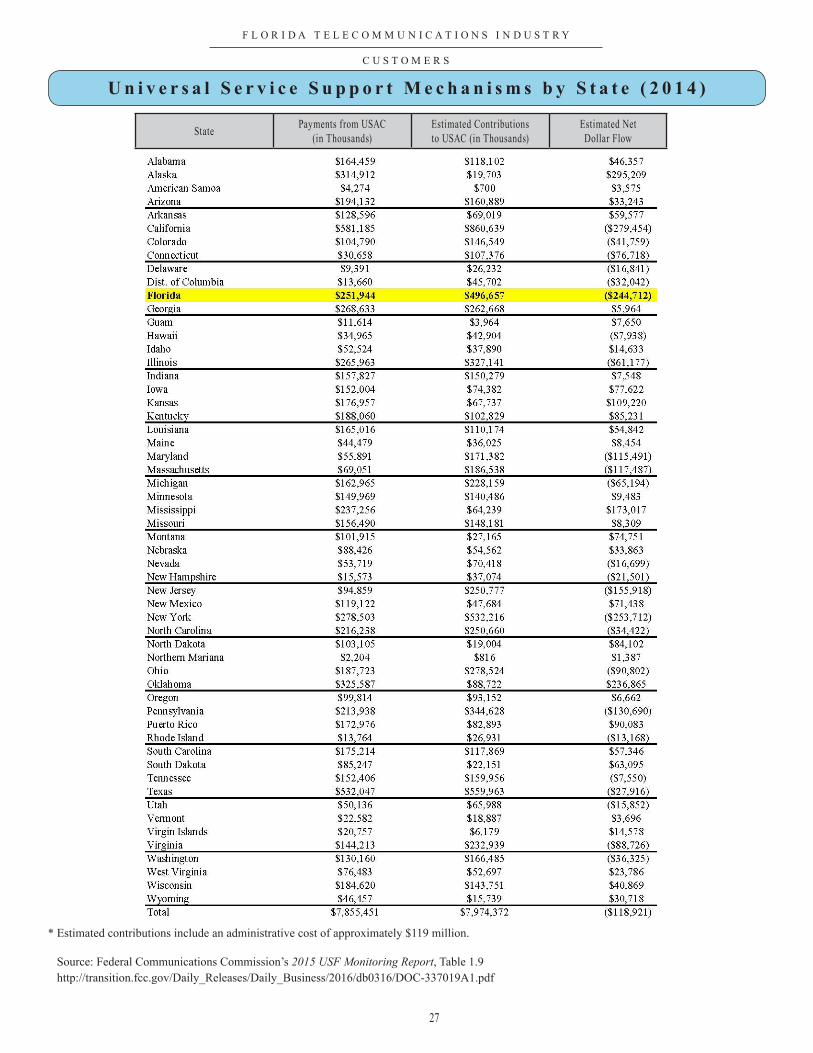
U n i v e r s a l S e r v i c e S u p p o r t M e c h a n i s m s b y S t a t e ( 2 0 1 4 )
State Payments from USAC(in Thousands)
Estimated Contributionsto USAC (in Thousands)
Estimated NetDollar Flow
* Estimated contributions include an administrative cost of approximately $119 million.
Source: Federal Communications Commission’s 2015 USF Monitoring Report, Table 1.9 http://transition.fcc.gov/Daily_Releases/Daily_Business/2016/db0316/DOC-337019A1.pdf
28
F L O R I D A T E L E C O M M U N I C A T I O N S I N D U S T R Y
C U S T O M E R S
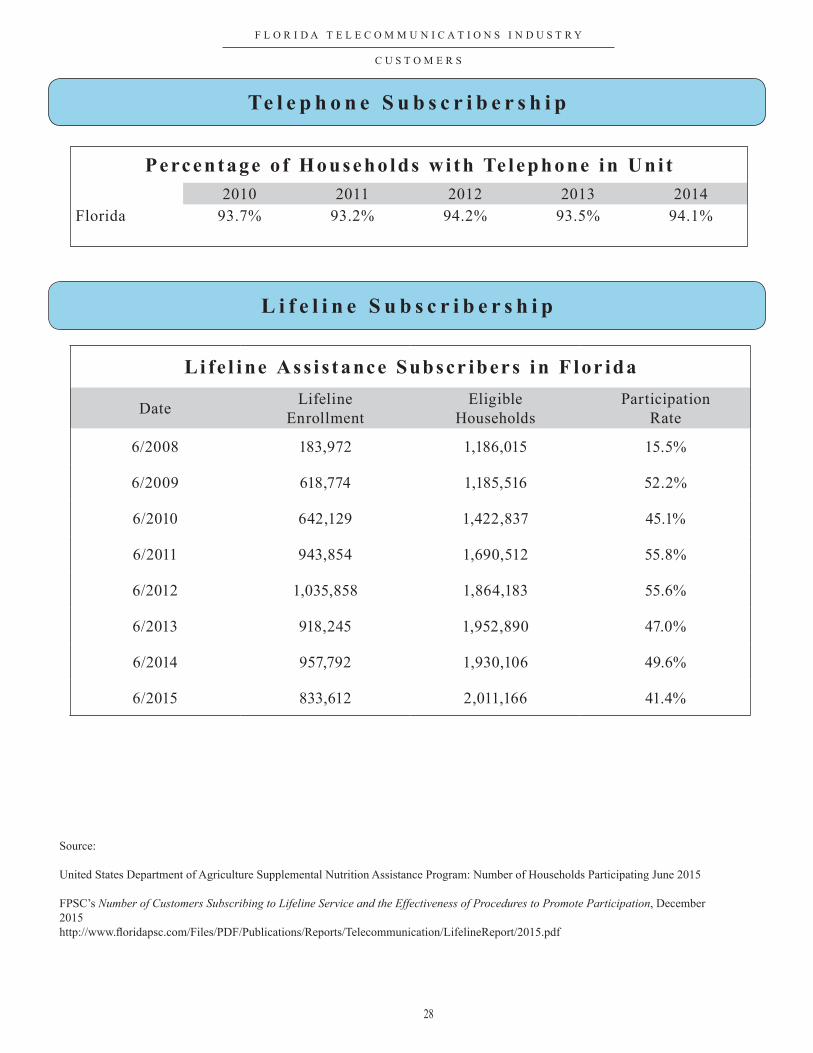
Te l e p h o n e S u b s c r i b e r s h i p
Percentage o f Househo lds wi th Te lephone in Uni t2010 2011 2012 2013 2014
Florida 93.7% 93.2% 94.2% 93.5% 94.1%
L i f e l i n e S u b s c r i b e r s h i p
Li fe l i ne Ass i s t ance Subscr ibers i n F lor ida
Date Lifeline Enrollment
EligibleHouseholds
ParticipationRate
6/2008 183,972 1,186,015 15.5%
6/2009 618,774 1,185,516 52.2%
6/2010 642,129 1,422,837 45.1%
6/2011 943,854 1,690,512 55.8%
6/2012 1,035,858 1,864,183 55.6%
6/2013 918,245 1,952,890 47.0%
6/2014 957,792 1,930,106 49.6%
6/2015 833,612 2,011,166 41.4%
Source: United States Department of Agriculture Supplemental Nutrition Assistance Program: Number of Households Participating June 2015 FPSC’s Number of Customers Subscribing to Lifeline Service and the Effectiveness of Procedures to Promote Participation, December 2015http://www.floridapsc.com/Files/PDF/Publications/Reports/Telecommunication/LifelineReport/2015.pdf
29
F L O R I D A T E L E C O M M U N I C A T I O N S I N D U S T R Y
C U S T O M E R S
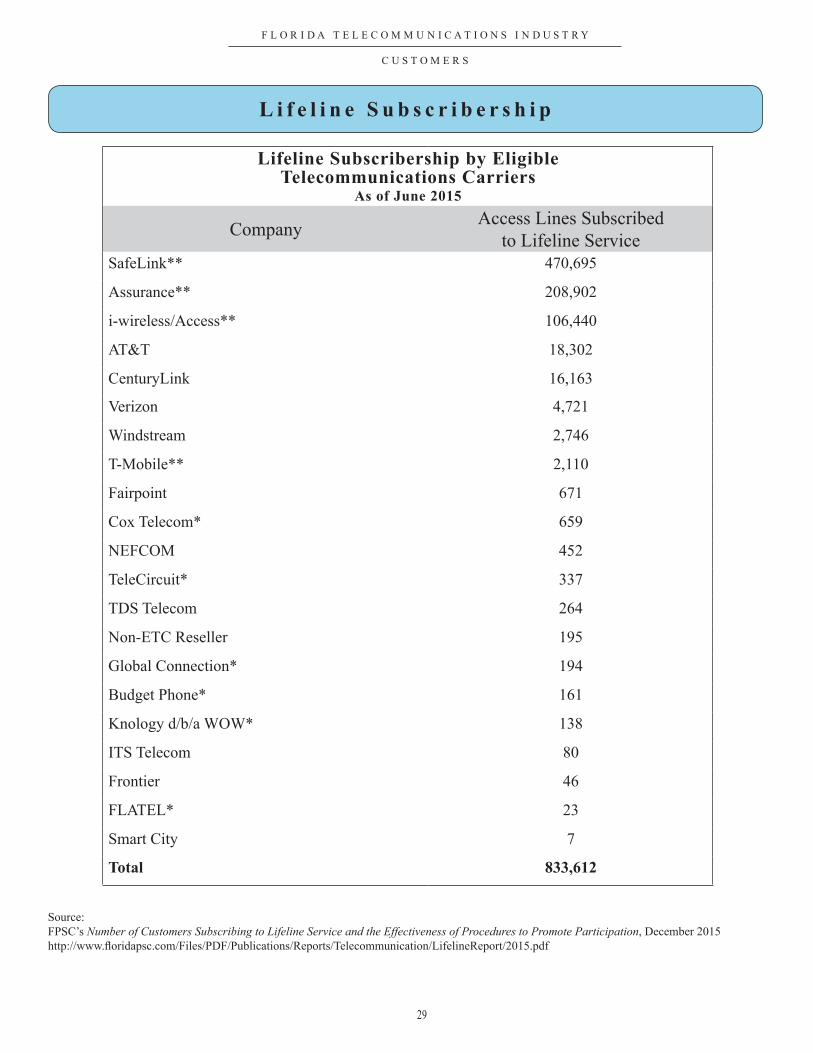
L i f e l i n e S u b s c r i b e r s h i p
Source:FPSC’s Number of Customers Subscribing to Lifeline Service and the Effectiveness of Procedures to Promote Participation, December 2015http://www.floridapsc.com/Files/PDF/Publications/Reports/Telecommunication/LifelineReport/2015.pdf
Lifeline Subscribership by Eligible Telecommunications Carriers
As of June 2015
Company Access Lines Subscribed to Lifeline Service
SafeLink** 470,695
Assurance** 208,902
i-wireless/Access** 106,440
AT&T 18,302
CenturyLink 16,163
Verizon 4,721
Windstream 2,746
T-Mobile** 2,110
Fairpoint 671
Cox Telecom* 659
NEFCOM 452
TeleCircuit* 337
TDS Telecom 264
Non-ETC Reseller 195
Global Connection* 194
Budget Phone* 161
Knology d/b/a WOW* 138
ITS Telecom 80
Frontier 46
FLATEL* 23
Smart City 7
Total 833,612
30
F L O R I D A W A T E R & W A S T E W A T E R I N D U S T R Y
Q U I C K F A C T S
R e g u l a t o r y A u t h o r i t y
U s e o f R e c l a i m e d Wa t e r D a t a f o r 2 0 1 4 *
* Most current data available as of September 2015** Million gallons per day
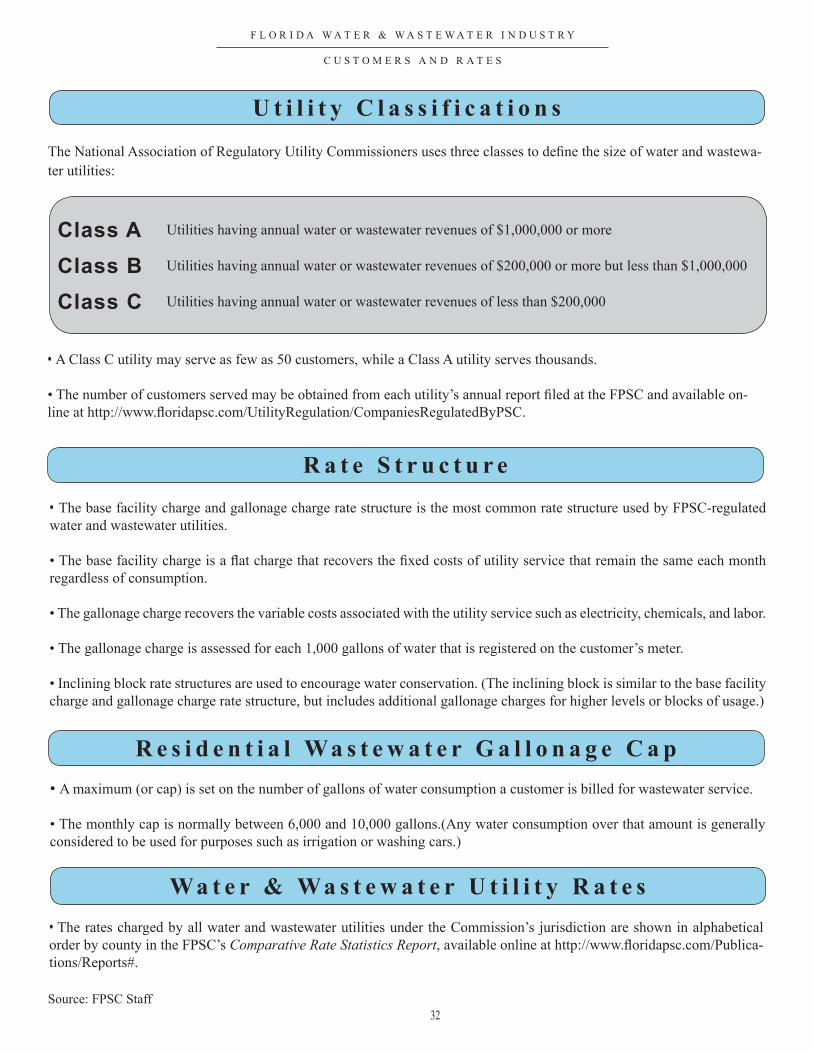
Source: Florida Department of Environmental Protection’s 2014 Reuse Inventory Report, July 2015 (Revised September 21, 2015)http://www.dep.state.fl.us/water/reuse/docs/inventory/2014_reuse-report.pdf
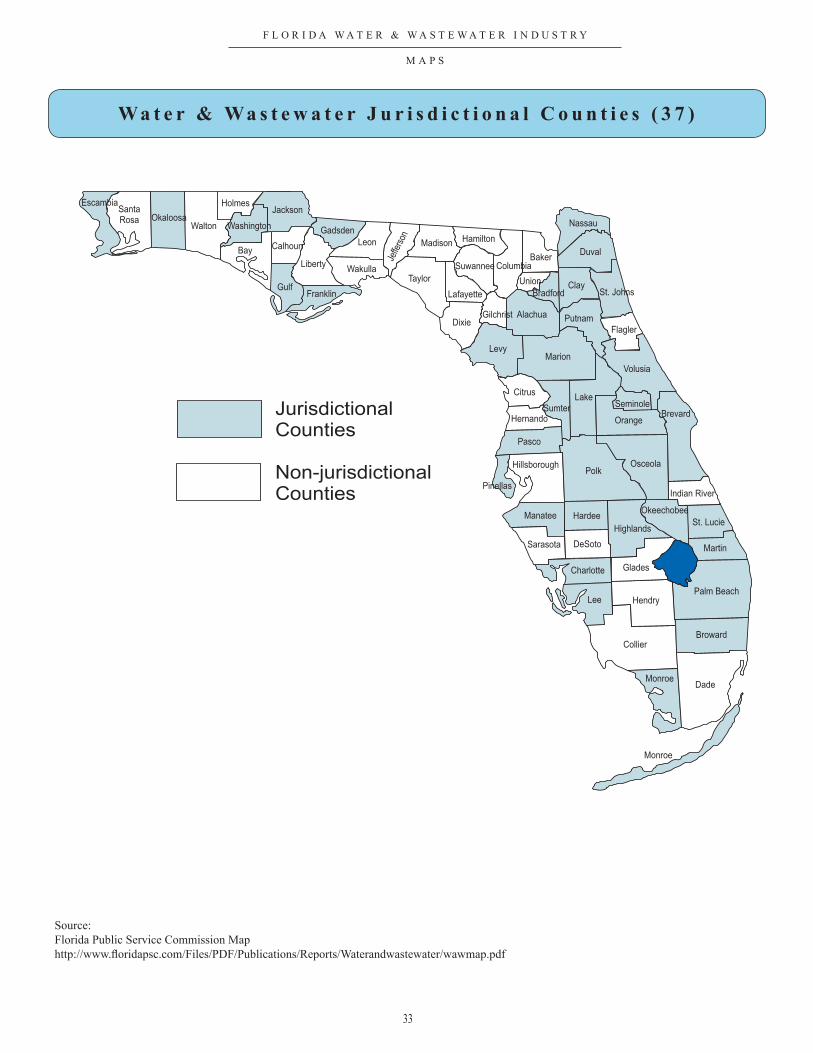
Pursuant to Chapter 367, F.S., as of December 2015, the FPSC has jurisdiction over 146 investor-owned water and/or wastewater utilities in 37 of Florida’s 67 counties.
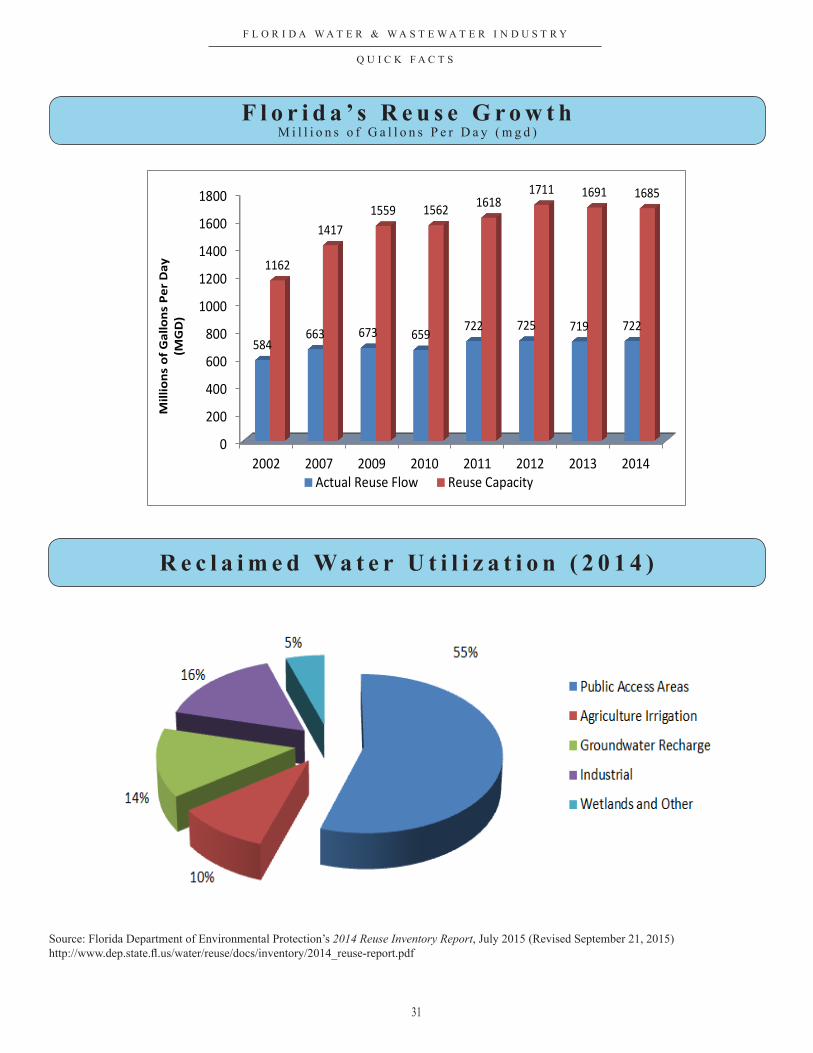
• Approximately 727 mgd** of reclaimed water from these facilities was reused for beneficial purposes and represents approximately 44% of the total domestic water flow in the state.
• The 1,685 mgd of reuse capacity represents approximately 65% of the total domestic wastewater treat-ment capacity in the state.
31
F L O R I D A W A T E R & W A S T E W A T E R I N D U S T R Y
Q U I C K F A C T S
F l o r i d a ’ s R e u s e G r o w t hM i l l i o n s o f G a l l o n s P e r D a y ( m g d )
Source: Florida Department of Environmental Protection’s 2014 Reuse Inventory Report, July 2015 (Revised September 21, 2015)http://www.dep.state.fl.us/water/reuse/docs/inventory/2014_reuse-report.pdf
0
200
400
600
800
1000
1200
1400
1600
1800
2002 2007 2009 2010 2011 2012 2013 2014
584663 673 659 722 725 719 722
1162
14171559 1562 1618
1711 1691 1685
Mill
ions
of G
allo
ns P
er D
ay
(MG
D)
Actual Reuse Flow Reuse Capacity
R e c l a i m e d Wa t e r U t i l i z a t i o n ( 2 0 1 4 )
32
F L O R I D A W A T E R & W A S T E W A T E R I N D U S T R Y
C U S T O M E R S A N D R A T E S
U t i l i t y C l a s s i f i c a t i o n s
R a t e S t r u c t u r e
R e s i d e n t i a l Wa s t e w a t e r G a l l o n a g e C a p
Wa t e r & Wa s t e w a t e r U t i l i t y R a t e s
Class A Utilities having annual water or wastewater revenues of $1,000,000 or more
Class B Utilities having annual water or wastewater revenues of $200,000 or more but less than $1,000,000
Class C Utilities having annual water or wastewater revenues of less than $200,000
• A Class C utility may serve as few as 50 customers, while a Class A utility serves thousands. • The number of customers served may be obtained from each utility’s annual report filed at the FPSC and available on-line at http://www.floridapsc.com/UtilityRegulation/CompaniesRegulatedByPSC.
• The base facility charge and gallonage charge rate structure is the most common rate structure used by FPSC-regulated water and wastewater utilities.
• The base facility charge is a flat charge that recovers the fixed costs of utility service that remain the same each month regardless of consumption.
• The gallonage charge recovers the variable costs associated with the utility service such as electricity, chemicals, and labor.
• The gallonage charge is assessed for each 1,000 gallons of water that is registered on the customer’s meter. • Inclining block rate structures are used to encourage water conservation. (The inclining block is similar to the base facility charge and gallonage charge rate structure, but includes additional gallonage charges for higher levels or blocks of usage.)
• A maximum (or cap) is set on the number of gallons of water consumption a customer is billed for wastewater service.
• The monthly cap is normally between 6,000 and 10,000 gallons.(Any water consumption over that amount is generally considered to be used for purposes such as irrigation or washing cars.)
• The rates charged by all water and wastewater utilities under the Commission’s jurisdiction are shown in alphabetical order by county in the FPSC’s Comparative Rate Statistics Report, available online at http://www.floridapsc.com/Publica-tions/Reports#.
The National Association of Regulatory Utility Commissioners uses three classes to define the size of water and wastewa-ter utilities:
Source: FPSC Staff
33
F L O R I D A W A T E R & W A S T E W A T E R I N D U S T R Y
M A P S
Wa t e r & Wa s t e w a t e r J u r i s d i c t i o n a l C o u n t i e s ( 3 7 )
Source:Florida Public Service Commission Maphttp://www.floridapsc.com/Files/PDF/Publications/Reports/Waterandwastewater/wawmap.pdf
W A T E R & W A S T E W A T E R
37 Jurisdictional Counties
JurisdictionalCounties
Non-jurisdictionalCounties
Washington
JacksonHolmes
WaltonOkaloosa
SantaRosa
Escambia
FranklinGulf
Liberty
CalhounBayLeon
Gadsden
St. Johns
ColumbiaSuwannee
Hamilton
Taylor
Madison
Jeffe
rson
Wakulla
Clay
Duval
Nassau
Union
Bradford
AlachuaGilchrist
Baker
Putnam
MarionLevy
Lafayette
BrevardSeminoleSumter
LakeCitrus
Volusia
Flagler
Manatee
Pasco
Hernando
Dixie
Indian River
Orange
OsceolaPolk
Pinellas
Palm Beach
Martin
Glades
Lee
Charlotte
Sarasota DeSoto
St. Lucie
Okeechobee
Highlands
Hardee
Hillsborough
Monroe
Monroe
Collier
Dade
Broward
Hendry
34
F L O R I D A W A T E R & W A S T E W A T E R I N D U S T R Y
M A P S
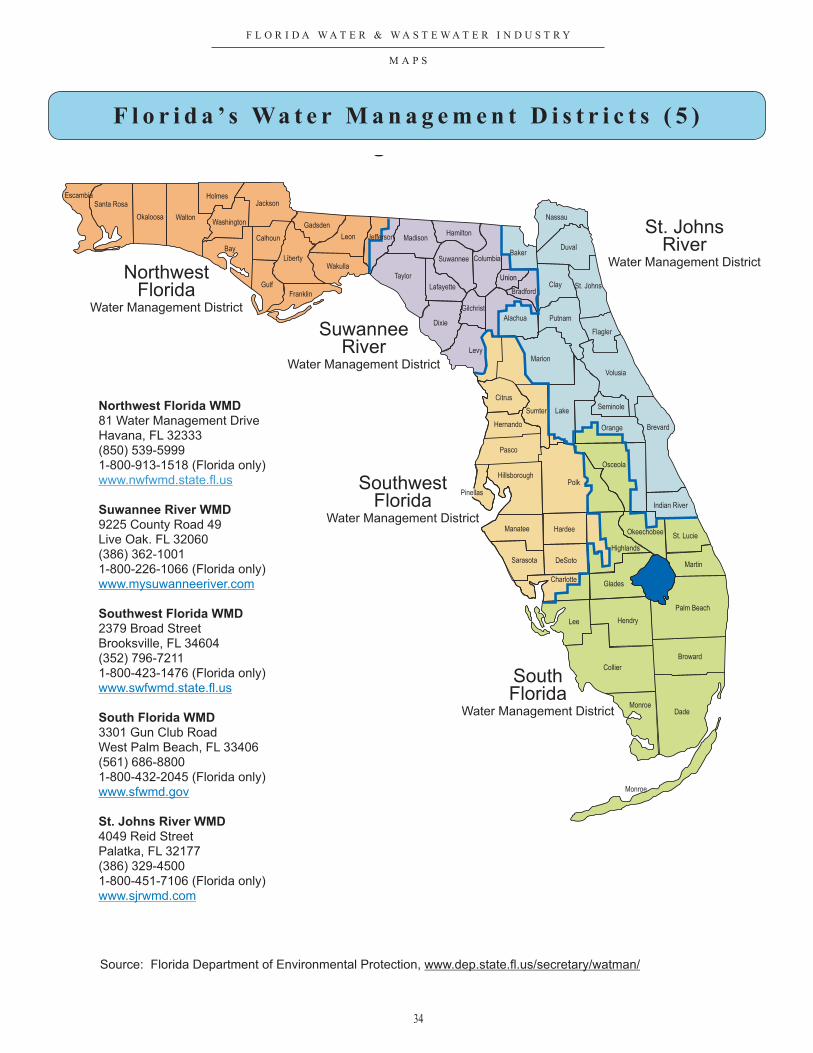
F l o r i d a ’ s Wa t e r M a n a g e m e n t D i s t r i c t s ( 5 )
Washington
JacksonHolmes
WaltonOkaloosa
Santa Rosa
Franklin
Gulf
Liberty
Calhoun
Bay
Leon
Gadsden
St. Johns
ColumbiaSuwannee
Hamilton
Taylor
Madison
Wakulla
Clay
Duval
Nassau
Union
Bradford
Alachua
Gilchrist
Baker
Putnam
MarionLevy
Lafayette
Brevard
SeminoleSumter Lake
Citrus
Volusia
Flagler
Manatee
Pasco
Hernando
Dixie
Indian River
Orange
Osceola
Polk
Palm Beach
Martin
Glades
Lee
Charlotte
Sarasota DeSoto
St. LucieOkeechobeeHardee
Hillsborough
Monroe
Monroe
Collier
Dade
Broward
Hendry
Pinellas
Escambia
Highlands
Jefferson
NorthwestFlorida
Water Management District
SuwanneeRiver
Water Management District
SouthwestFlorida
Water Management District
SouthFlorida
Water Management District
St. JohnsRiver
Water Management District
Water Management Districts
Northwest Florida WMD
81 Water Management DriveHavana, FL 32333(850) 539-59991-800-913-1518 (Florida only)
Suwannee River WMD
Southwest Florida WMD
South Florida WMD
St. Johns River WMD
9225 County Road 49Live Oak. FL 32060(386) 362-10011-800-226-1066 (Florida only)
2379 Broad StreetBrooksville, FL 34604(352) 796-72111-800-423-1476 (Florida only)
3301 Gun Club RoadWest Palm Beach, FL 33406(561) 686-88001-800-432-2045 (Florida only)
4049 Reid StreetPalatka, FL 32177(386) 329-45001-800-451-7106 (Florida only)
www.nwfwmd.state.fl.us
www.mysuwanneeriver.com
www.swfwmd.state.fl.us
www.sfwmd.gov
www.sjrwmd.com
Source: Florida Department of Environmental Protection, www.dep.state.fl.us/secretary/watman/