Embed Size (px)
Citation preview
O Captain, My Captain! – The Effect of Leadership in Professional Football
3rd International Conference Sport Economics & Sport Management, May 10th, 2018
Daniel Weimar & Joachim Prinz (University of Duisburg-Essen)
SESM| Weimar & Prinz 2
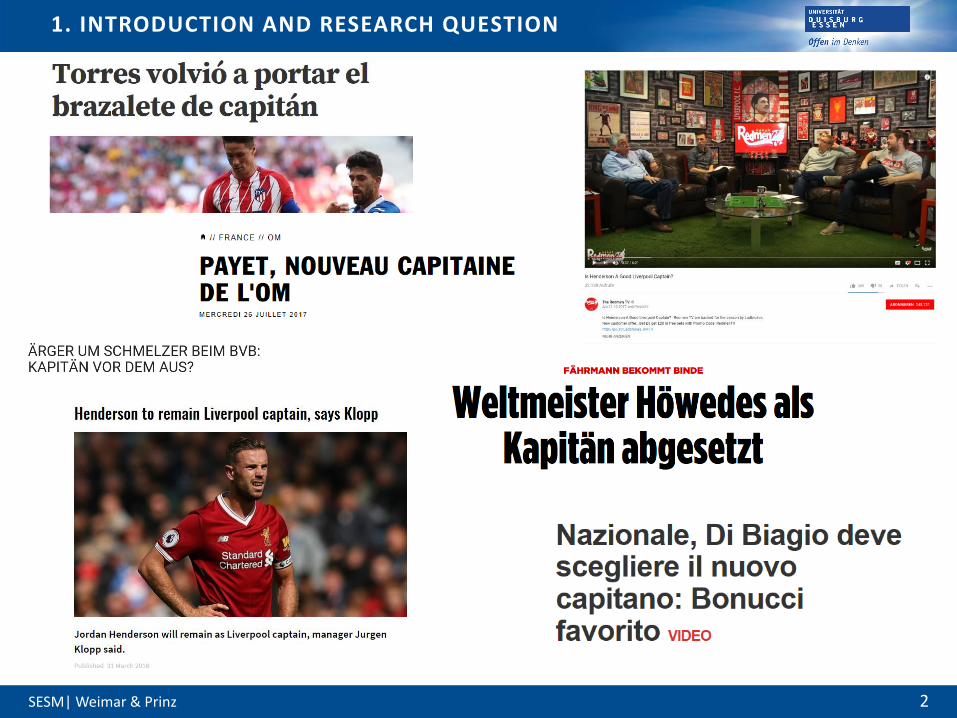
1. INTRODUCTION AND RESEARCH QUESTION
SESM| Weimar & Prinz 3
1. INTRODUCTION AND RESEARCH QUESTION
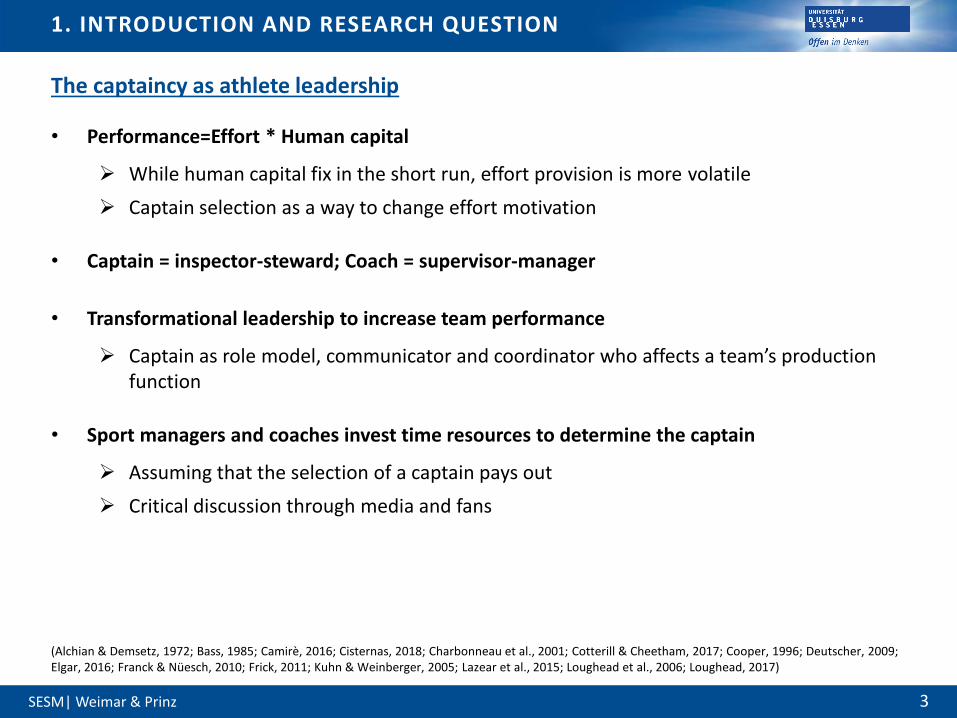
• Performance=Effort * Human capital
While human capital fix in the short run, effort provision is more volatile
Captain selection as a way to change effort motivation
• Captain = inspector-steward; Coach = supervisor-manager
• Transformational leadership to increase team performance
Captain as role model, communicator and coordinator who affects a team’s production function
• Sport managers and coaches invest time resources to determine the captain
Assuming that the selection of a captain pays out
Critical discussion through media and fans
The captaincy as athlete leadership
(Alchian & Demsetz, 1972; Bass, 1985; Camirè, 2016; Cisternas, 2018; Charbonneau et al., 2001; Cotterill & Cheetham, 2017; Cooper, 1996; Deutscher, 2009; Elgar, 2016; Franck & Nüesch, 2010; Frick, 2011; Kuhn & Weinberger, 2005; Lazear et al., 2015; Loughead et al., 2006; Loughead, 2017)
SESM| Weimar & Prinz 4
1. INTRODUCTION AND RESEARCH QUESTION
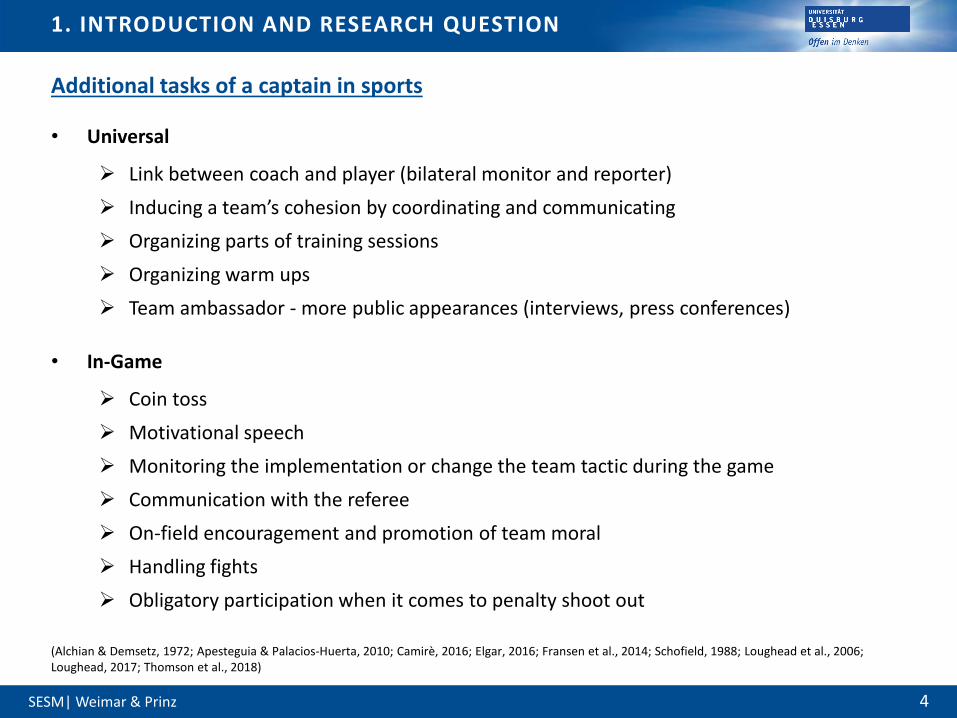
• Universal
Link between coach and player (bilateral monitor and reporter)
Inducing a team’s cohesion by coordinating and communicating
Organizing parts of training sessions
Organizing warm ups
Team ambassador - more public appearances (interviews, press conferences)
• In-Game
Coin toss
Motivational speech
Monitoring the implementation or change the team tactic during the game
Communication with the referee
On-field encouragement and promotion of team moral
Handling fights
Obligatory participation when it comes to penalty shoot out
Additional tasks of a captain in sports
(Alchian & Demsetz, 1972; Apesteguia & Palacios-Huerta, 2010; Camirè, 2016; Elgar, 2016; Fransen et al., 2014; Schofield, 1988; Loughead et al., 2006; Loughead, 2017; Thomson et al., 2018)
SESM| Weimar & Prinz 5
1. INTRODUCTION AND RESEARCH QUESTION
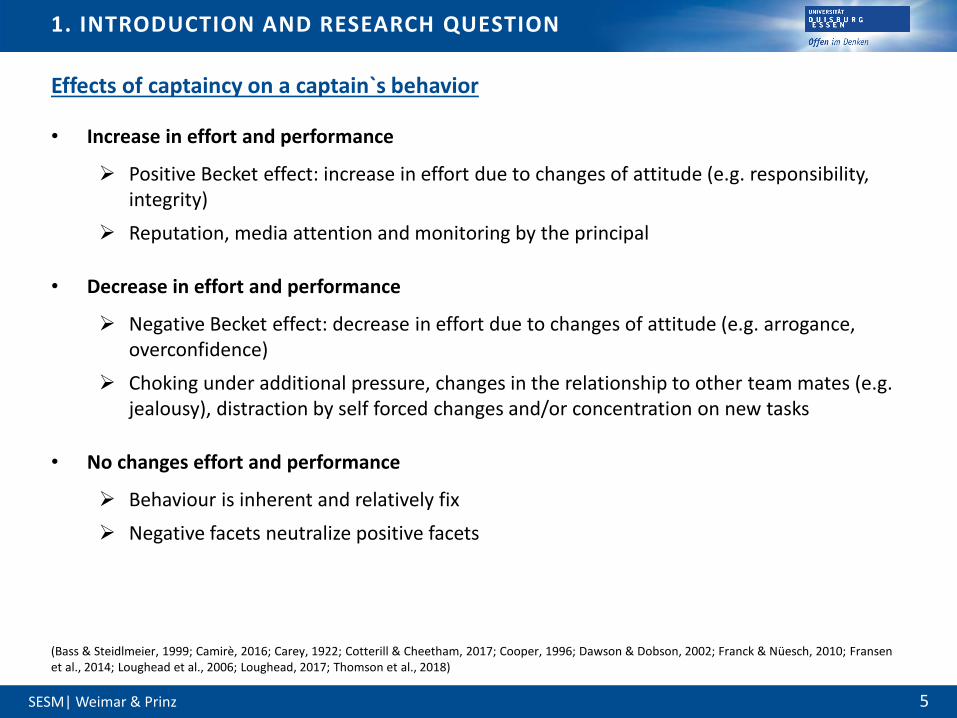
• Increase in effort and performance
Positive Becket effect: increase in effort due to changes of attitude (e.g. responsibility, integrity)
Reputation, media attention and monitoring by the principal
• Decrease in effort and performance
Negative Becket effect: decrease in effort due to changes of attitude (e.g. arrogance, overconfidence)
Choking under additional pressure, changes in the relationship to other team mates (e.g. jealousy), distraction by self forced changes and/or concentration on new tasks
• No changes effort and performance
Behaviour is inherent and relatively fix
Negative facets neutralize positive facets
Effects of captaincy on a captain`s behavior
(Bass & Steidlmeier, 1999; Camirè, 2016; Carey, 1922; Cotterill & Cheetham, 2017; Cooper, 1996; Dawson & Dobson, 2002; Franck & Nüesch, 2010; Fransenet al., 2014; Loughead et al., 2006; Loughead, 2017; Thomson et al., 2018)
SESM| Weimar & Prinz 6
1. INTRODUCTION AND RESEARCH QUESTION
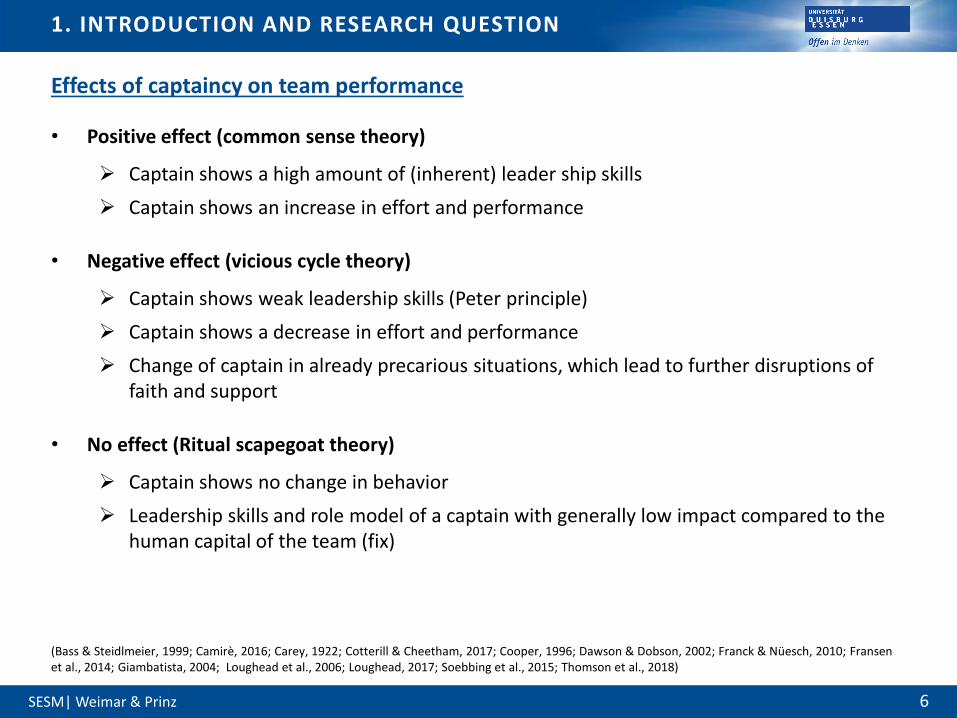
• Positive effect (common sense theory)
Captain shows a high amount of (inherent) leader ship skills
Captain shows an increase in effort and performance
• Negative effect (vicious cycle theory)
Captain shows weak leadership skills (Peter principle)
Captain shows a decrease in effort and performance
Change of captain in already precarious situations, which lead to further disruptions of faith and support
• No effect (Ritual scapegoat theory)
Captain shows no change in behavior
Leadership skills and role model of a captain with generally low impact compared to the human capital of the team (fix)
Effects of captaincy on team performance
(Bass & Steidlmeier, 1999; Camirè, 2016; Carey, 1922; Cotterill & Cheetham, 2017; Cooper, 1996; Dawson & Dobson, 2002; Franck & Nüesch, 2010; Fransenet al., 2014; Giambatista, 2004; Loughead et al., 2006; Loughead, 2017; Soebbing et al., 2015; Thomson et al., 2018)
SESM| Weimar & Prinz 7
1. INTRODUCTION AND RESEARCH QUESTION
• Past economic empirical research on captaincy in professional sports
Schoefield (1988): Performance and captaincy in Cricket
Deutscher (2009): Wage premium for captains in the NHL
Frick (2011): Captains with higher market values in the Bundesliga
Goncalves (2013): Captaincy does not correlate with player values in fantasy football
Fransen et al. (2014): Captaincy might be overrated (survey on roles of a captain)
Allen (2015): Captaincy and the impact on the draft selection in the NFL
Sacheti et al. (2016): Decision making of captains in cricket (coin toss)
Elgar (2016): Height and age as determinants of captain selection in 6 Olympic team sports
• Missing evidence on the actual effect of captaincy on a captain`s effort and performance and thus on a team`s performance in football (Loughead, 2017)
Question: Does captaincy affects a captain`s behavior and/or team performance
Research relevanz
SESM| Weimar & Prinz 8
2. EMPIRICAL ANALYSIS
• Game-level captaincy and performance data from 6 Bundesliga seasons: 2011/2012 –2016/2017 (1,836 games)
• Observations without goalkeeper, 3 observations per player at lower bound, at least 15 minutes of playing time, missing values
• Player-match level (N=39,102) and team level as means (N=3,672)
• Data retrieved from Bundesliga.de, transfermarkt.de and google.de
Data Sample
SESM| Weimar & Prinz 9
2. EMPIRICAL ANALYSIS
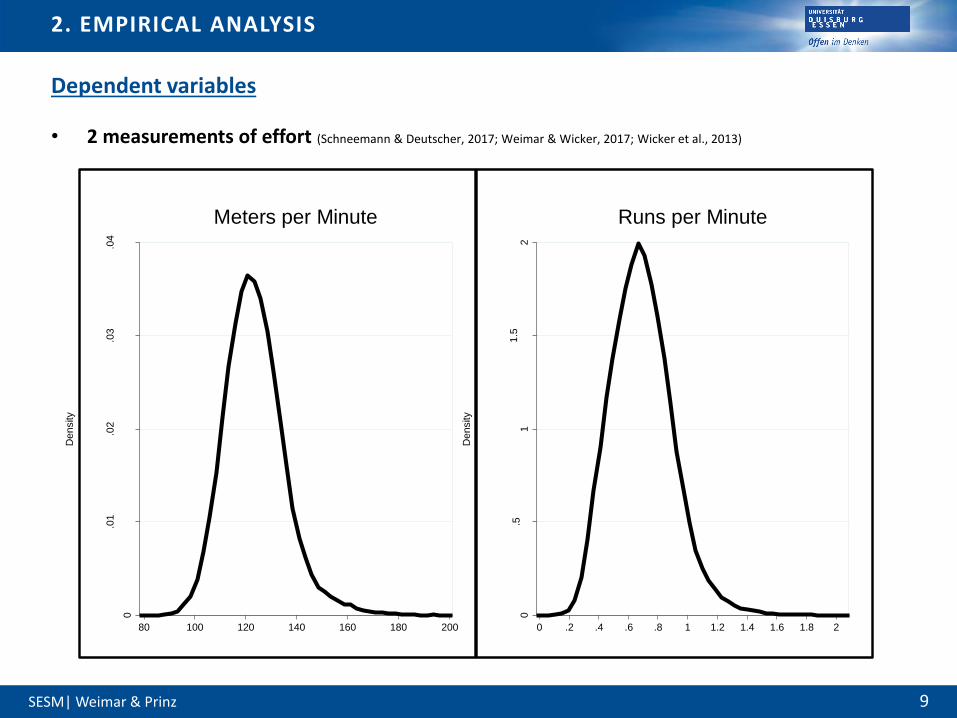
• 2 measurements of effort (Schneemann & Deutscher, 2017; Weimar & Wicker, 2017; Wicker et al., 2013)
Dependent variables
0
.01
.02
.03
.04
De
nsity
80 100 120 140 160 180 200
Meters per Minute
0.5
11
.52
De
nsity
0 .2 .4 .6 .8 1 1.2 1.4 1.6 1.8 2
Runs per Minute
SESM| Weimar & Prinz 10
2. EMPIRICAL ANALYSIS – DEPENDENT VARIABLES
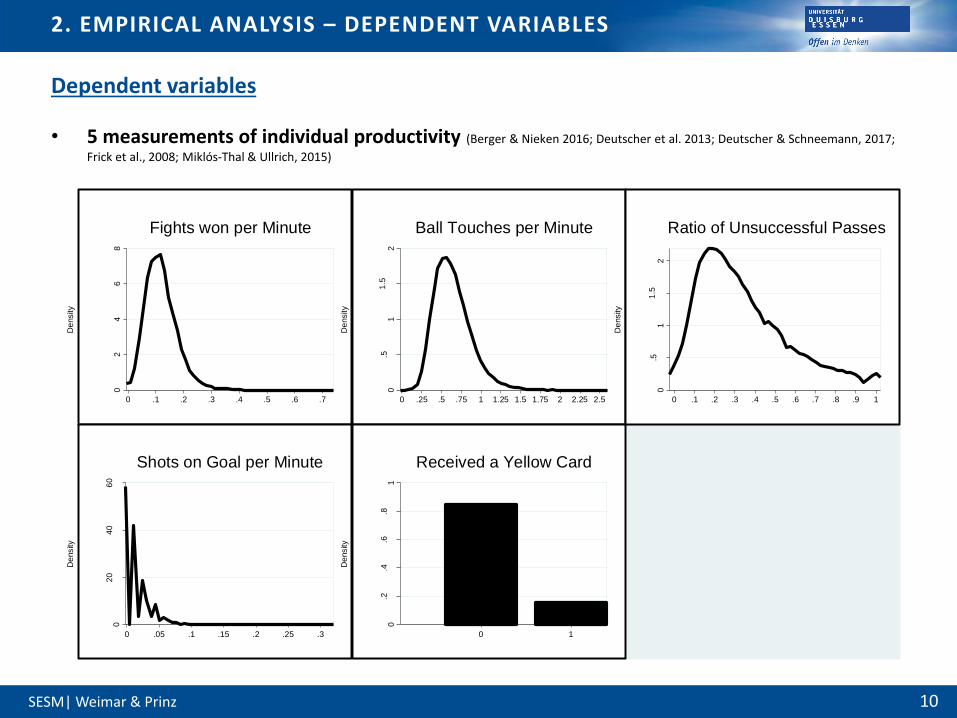
• 5 measurements of individual productivity (Berger & Nieken 2016; Deutscher et al. 2013; Deutscher & Schneemann, 2017;
Frick et al., 2008; Miklós-Thal & Ullrich, 2015)
Dependent variables0
24
68
De
nsity
0 .1 .2 .3 .4 .5 .6 .7
Fights won per Minute
0.5
11
.52
De
nsity
0 .25 .5 .75 1 1.25 1.5 1.75 2 2.25 2.5
Ball Touches per Minute
0.5
11
.52
De
nsity
0 .1 .2 .3 .4 .5 .6 .7 .8 .9 1
Ratio of Unsuccessful Passes
02
04
06
0
De
nsity
0 .05 .1 .15 .2 .25 .3
Shots on Goal per Minute
0.2
.4.6
.81
De
nsity
0 1
Received a Yellow Card
SESM| Weimar & Prinz 11
2. EMPIRICAL ANALYSIS – DEPENDENT VARIABLES
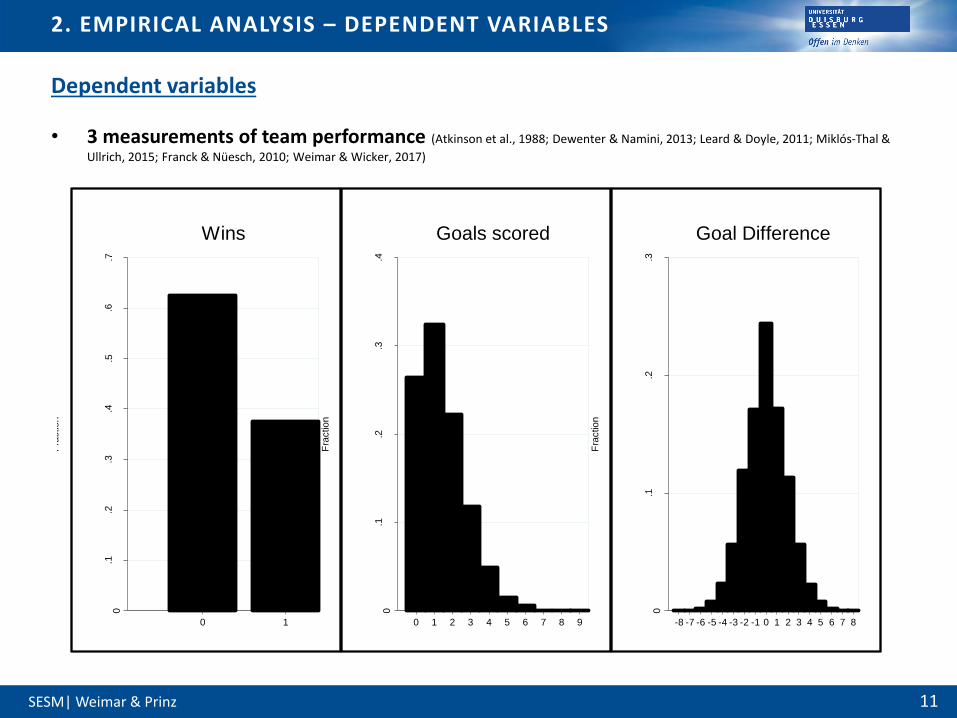
• 3 measurements of team performance (Atkinson et al., 1988; Dewenter & Namini, 2013; Leard & Doyle, 2011; Miklós-Thal &
Ullrich, 2015; Franck & Nüesch, 2010; Weimar & Wicker, 2017)
Dependent variables0
.1.2
.3.4
.5.6
.7
Fra
ctio
n
0 1
Wins
0.1
.2.3
.4
Fra
ctio
n
0 1 2 3 4 5 6 7 8 9
Goals scored
0.1
.2.3
Fra
ctio
n
-8 -7 -6 -5 -4 -3 -2 -1 0 1 2 3 4 5 6 7 8
Goal Difference
SESM| Weimar & Prinz 12
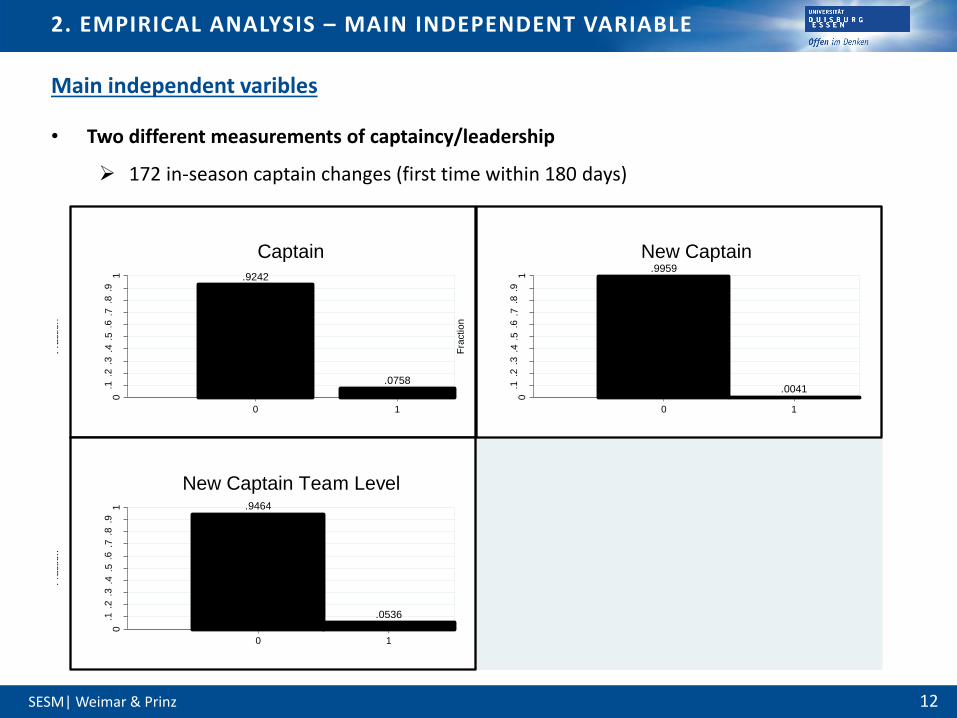
2. EMPIRICAL ANALYSIS – MAIN INDEPENDENT VARIABLE
• Two different measurements of captaincy/leadership
172 in-season captain changes (first time within 180 days)
Main independent varibles
.9242
.0758
0.1
.2.3
.4.5
.6.7
.8.9
1
Fra
ctio
n
0 1
Captain.9959
.0041
0.1
.2.3
.4.5
.6.7
.8.9
1
Fra
ctio
n
0 1
New Captain
.9464
.0536
0.1
.2.3
.4.5
.6.7
.8.9
1
Fra
ctio
n
0 1
New Captain Team Level
SESM| Weimar & Prinz 13
2. EMPIRICAL ANALYSIS – MAIN INDEPENDENT VARIABLE
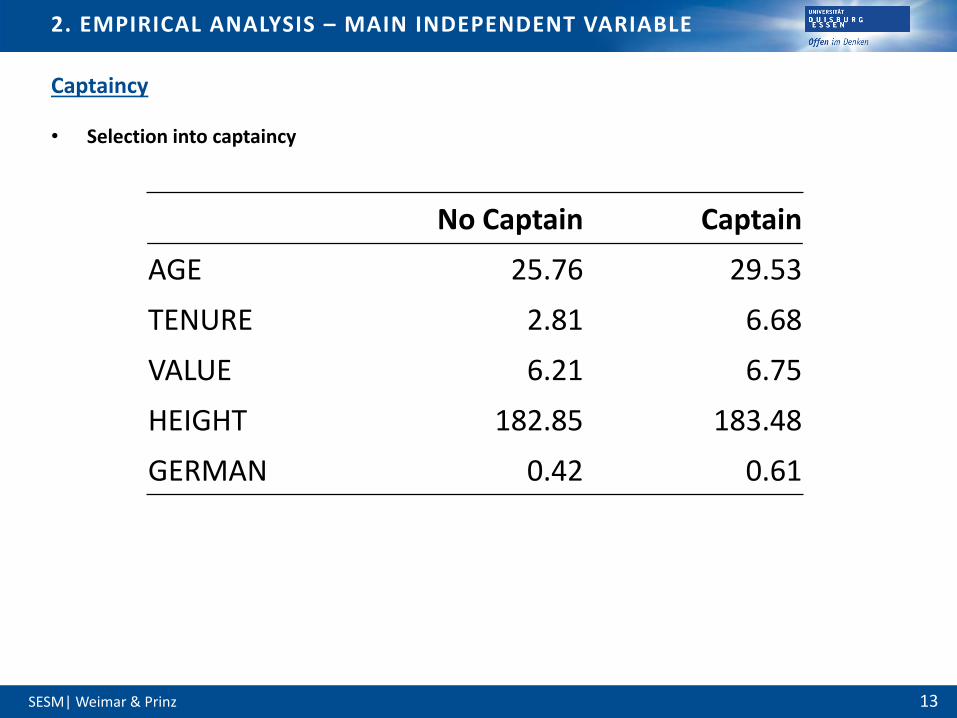
Captaincy
No Captain Captain
AGE 25.76 29.53
TENURE 2.81 6.68
VALUE 6.21 6.75
HEIGHT 182.85 183.48
GERMAN 0.42 0.61
• Selection into captaincy
SESM| Weimar & Prinz 14
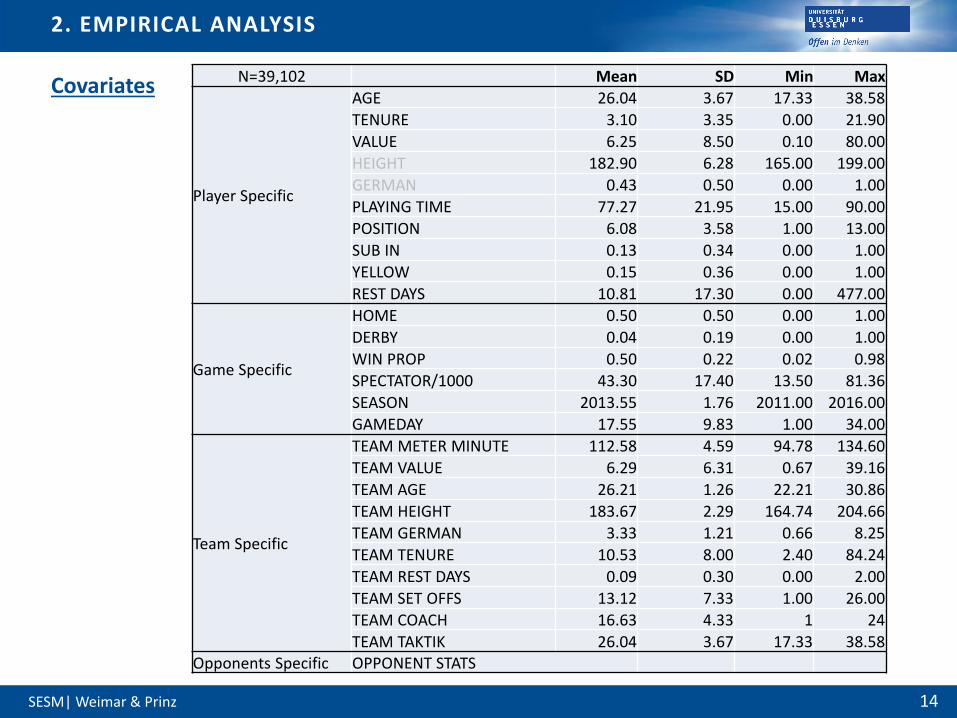
2. EMPIRICAL ANALYSIS
Covariates N=39,102 Mean SD Min Max
Player Specific
AGE 26.04 3.67 17.33 38.58
TENURE 3.10 3.35 0.00 21.90
VALUE 6.25 8.50 0.10 80.00
HEIGHT 182.90 6.28 165.00 199.00
GERMAN 0.43 0.50 0.00 1.00
PLAYING TIME 77.27 21.95 15.00 90.00
POSITION 6.08 3.58 1.00 13.00
SUB IN 0.13 0.34 0.00 1.00
YELLOW 0.15 0.36 0.00 1.00
REST DAYS 10.81 17.30 0.00 477.00
Game Specific
HOME 0.50 0.50 0.00 1.00
DERBY 0.04 0.19 0.00 1.00
WIN PROP 0.50 0.22 0.02 0.98
SPECTATOR/1000 43.30 17.40 13.50 81.36
SEASON 2013.55 1.76 2011.00 2016.00
GAMEDAY 17.55 9.83 1.00 34.00
Team Specific
TEAM METER MINUTE 112.58 4.59 94.78 134.60
TEAM VALUE 6.29 6.31 0.67 39.16
TEAM AGE 26.21 1.26 22.21 30.86
TEAM HEIGHT 183.67 2.29 164.74 204.66
TEAM GERMAN 3.33 1.21 0.66 8.25
TEAM TENURE 10.53 8.00 2.40 84.24
TEAM REST DAYS 0.09 0.30 0.00 2.00
TEAM SET OFFS 13.12 7.33 1.00 26.00
TEAM COACH 16.63 4.33 1 24
TEAM TAKTIK 26.04 3.67 17.33 38.58Opponents Specific OPPONENT STATS
SESM| Weimar & Prinz 15
2. EMPIRICAL ANALYSIS
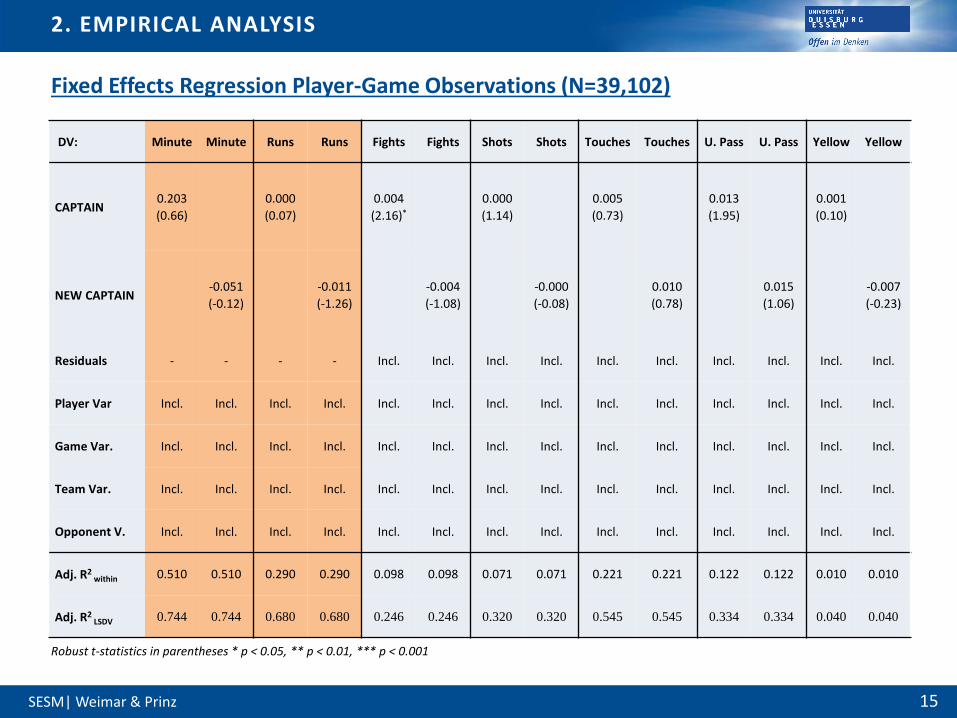
Fixed Effects Regression Player-Game Observations (N=39,102)
Robust t-statistics in parentheses * p < 0.05, ** p < 0.01, *** p < 0.001
DV: Minute Minute Runs Runs Fights Fights Shots Shots Touches Touches U. Pass U. Pass Yellow Yellow
CAPTAIN0.203
(0.66)
0.000
(0.07)
0.004
(2.16)*
0.000
(1.14)
0.005
(0.73)
0.013
(1.95)
0.001
(0.10)
NEW CAPTAIN-0.051
(-0.12)
-0.011
(-1.26)
-0.004
(-1.08)
-0.000
(-0.08)
0.010
(0.78)
0.015
(1.06)
-0.007
(-0.23)
Residuals - - - - Incl. Incl. Incl. Incl. Incl. Incl. Incl. Incl. Incl. Incl.
Player Var Incl. Incl. Incl. Incl. Incl. Incl. Incl. Incl. Incl. Incl. Incl. Incl. Incl. Incl.
Game Var. Incl. Incl. Incl. Incl. Incl. Incl. Incl. Incl. Incl. Incl. Incl. Incl. Incl. Incl.
Team Var. Incl. Incl. Incl. Incl. Incl. Incl. Incl. Incl. Incl. Incl. Incl. Incl. Incl. Incl.
Opponent V. Incl. Incl. Incl. Incl. Incl. Incl. Incl. Incl. Incl. Incl. Incl. Incl. Incl. Incl.
Adj. R2within 0.510 0.510 0.290 0.290 0.098 0.098 0.071 0.071 0.221 0.221 0.122 0.122 0.010 0.010
Adj. R2LSDV 0.744 0.744 0.680 0.680 0.246 0.246 0.320 0.320 0.545 0.545 0.334 0.334 0.040 0.040
SESM| Weimar & Prinz 16
2. EMPIRICAL ANALYSIS – RESULTS
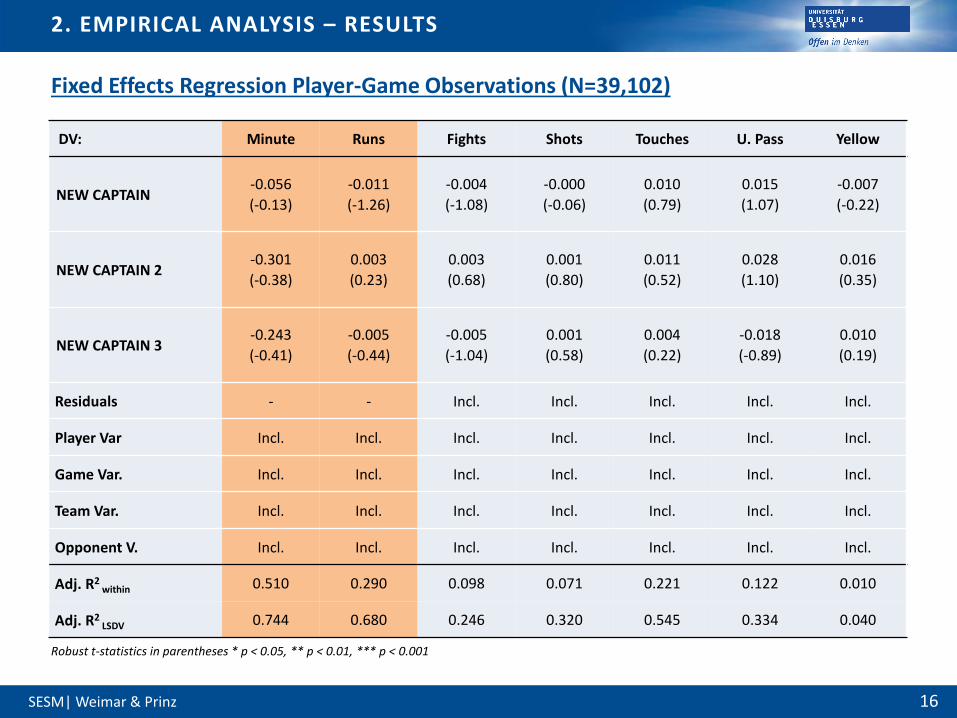
Fixed Effects Regression Player-Game Observations (N=39,102)
Robust t-statistics in parentheses * p < 0.05, ** p < 0.01, *** p < 0.001
DV: Minute Runs Fights Shots Touches U. Pass Yellow
NEW CAPTAIN-0.056
(-0.13)
-0.011
(-1.26)
-0.004
(-1.08)
-0.000
(-0.06)
0.010
(0.79)
0.015
(1.07)
-0.007
(-0.22)
NEW CAPTAIN 2-0.301
(-0.38)
0.003
(0.23)
0.003
(0.68)
0.001
(0.80)
0.011
(0.52)
0.028
(1.10)
0.016
(0.35)
NEW CAPTAIN 3-0.243
(-0.41)
-0.005
(-0.44)
-0.005
(-1.04)
0.001
(0.58)
0.004
(0.22)
-0.018
(-0.89)
0.010
(0.19)
Residuals - - Incl. Incl. Incl. Incl. Incl.
Player Var Incl. Incl. Incl. Incl. Incl. Incl. Incl.
Game Var. Incl. Incl. Incl. Incl. Incl. Incl. Incl.
Team Var. Incl. Incl. Incl. Incl. Incl. Incl. Incl.
Opponent V. Incl. Incl. Incl. Incl. Incl. Incl. Incl.
Adj. R2within 0.510 0.290 0.098 0.071 0.221 0.122 0.010
Adj. R2LSDV 0.744 0.680 0.246 0.320 0.545 0.334 0.040
SESM| Weimar & Prinz 17
2. EMPIRICAL ANALYSIS – RESULTS
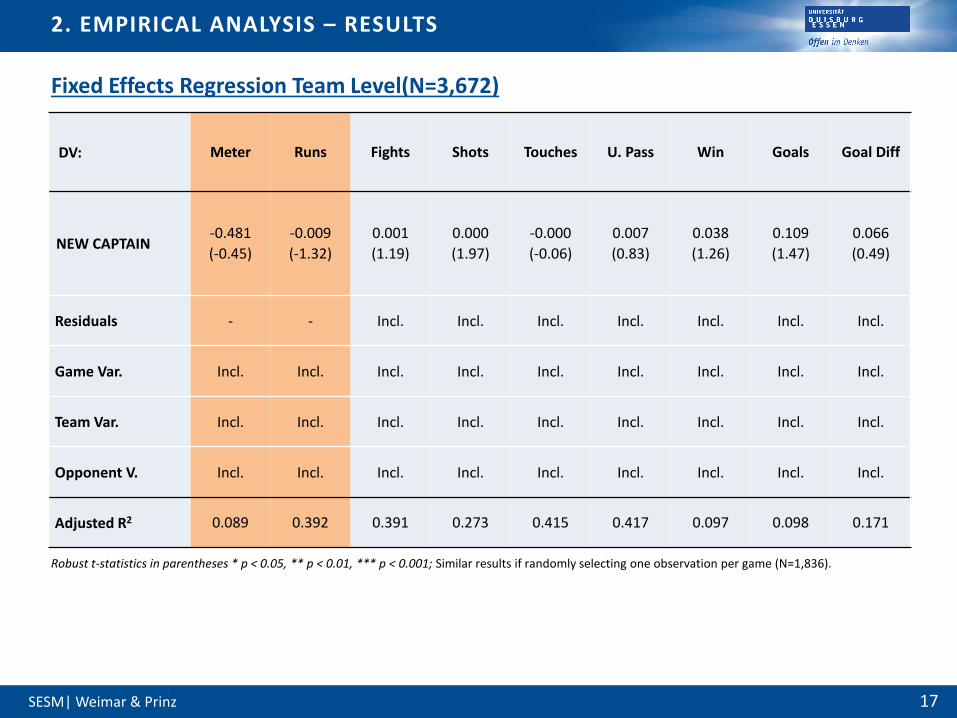
Fixed Effects Regression Team Level(N=3,672)
Robust t-statistics in parentheses * p < 0.05, ** p < 0.01, *** p < 0.001; Similar results if randomly selecting one observation per game (N=1,836).
DV: Meter Runs Fights Shots Touches U. Pass Win Goals Goal Diff
NEW CAPTAIN-0.481
(-0.45)
-0.009
(-1.32)
0.001
(1.19)
0.000
(1.97)
-0.000
(-0.06)
0.007
(0.83)
0.038
(1.26)
0.109
(1.47)
0.066
(0.49)
Residuals - - Incl. Incl. Incl. Incl. Incl. Incl. Incl.
Game Var. Incl. Incl. Incl. Incl. Incl. Incl. Incl. Incl. Incl.
Team Var. Incl. Incl. Incl. Incl. Incl. Incl. Incl. Incl. Incl.
Opponent V. Incl. Incl. Incl. Incl. Incl. Incl. Incl. Incl. Incl.
Adjusted R2 0.089 0.392 0.391 0.273 0.415 0.417 0.097 0.098 0.171
SESM| Weimar & Prinz 18
2. EMPIRICAL ANALYSIS – RESULTS
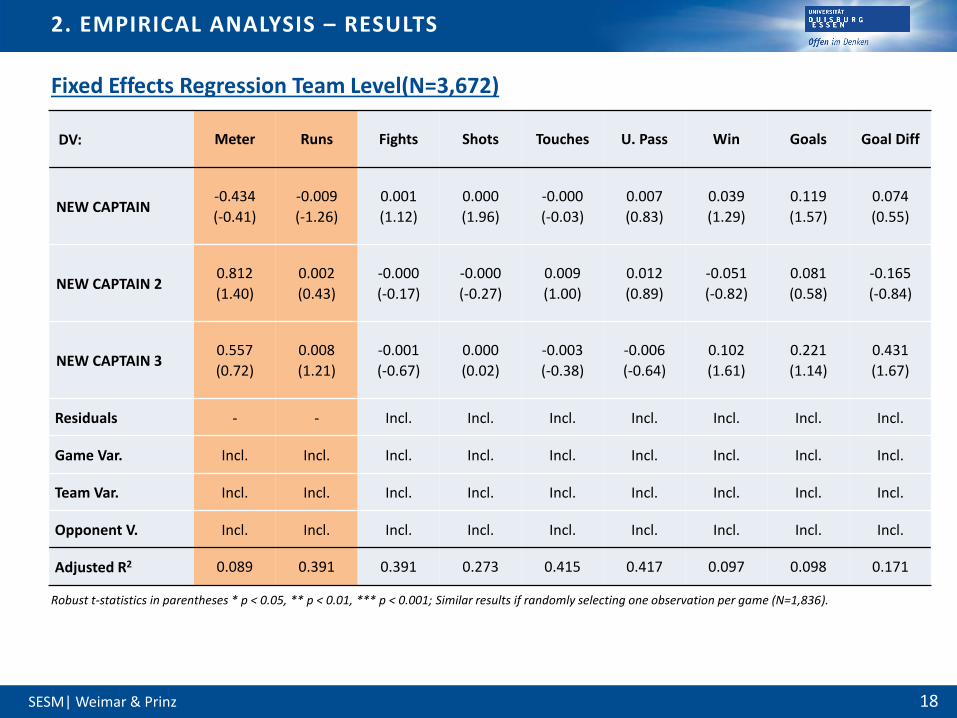
Fixed Effects Regression Team Level(N=3,672)
Robust t-statistics in parentheses * p < 0.05, ** p < 0.01, *** p < 0.001; Similar results if randomly selecting one observation per game (N=1,836).
DV: Meter Runs Fights Shots Touches U. Pass Win Goals Goal Diff
NEW CAPTAIN-0.434
(-0.41)
-0.009
(-1.26)
0.001
(1.12)
0.000
(1.96)
-0.000
(-0.03)
0.007
(0.83)
0.039
(1.29)
0.119
(1.57)
0.074
(0.55)
NEW CAPTAIN 20.812
(1.40)
0.002
(0.43)
-0.000
(-0.17)
-0.000
(-0.27)
0.009
(1.00)
0.012
(0.89)
-0.051
(-0.82)
0.081
(0.58)
-0.165
(-0.84)
NEW CAPTAIN 30.557
(0.72)
0.008
(1.21)
-0.001
(-0.67)
0.000
(0.02)
-0.003
(-0.38)
-0.006
(-0.64)
0.102
(1.61)
0.221
(1.14)
0.431
(1.67)
Residuals - - Incl. Incl. Incl. Incl. Incl. Incl. Incl.
Game Var. Incl. Incl. Incl. Incl. Incl. Incl. Incl. Incl. Incl.
Team Var. Incl. Incl. Incl. Incl. Incl. Incl. Incl. Incl. Incl.
Opponent V. Incl. Incl. Incl. Incl. Incl. Incl. Incl. Incl. Incl.
Adjusted R2 0.089 0.391 0.391 0.273 0.415 0.417 0.097 0.098 0.171
SESM| Weimar & Prinz 19
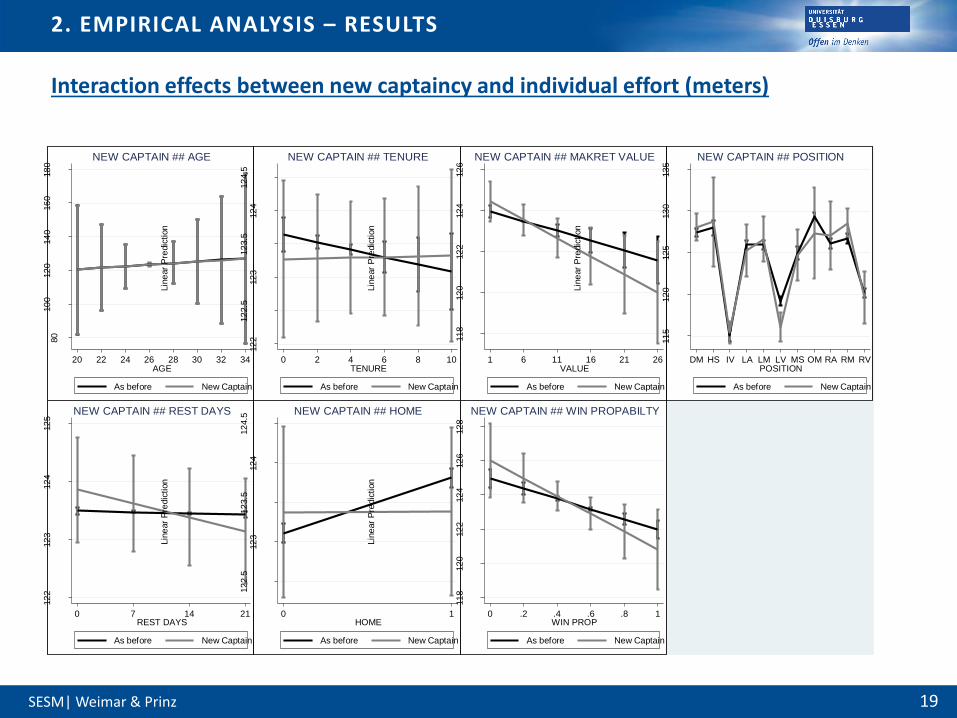
2. EMPIRICAL ANALYSIS – RESULTS
Interaction effects between new captaincy and individual effort (meters)
80
10
012
014
016
018
0
Lin
ear
Pre
dic
tion
20 22 24 26 28 30 32 34AGE
As before New Captain
NEW CAPTAIN ## AGE
12
212
2.5
12
312
3.5
12
412
4.5
Lin
ear
Pre
dic
tion
0 2 4 6 8 10TENURE
As before New Captain
NEW CAPTAIN ## TENURE
11
812
012
212
412
6
Lin
ear
Pre
dic
tion
1 6 11 16 21 26VALUE
As before New Captain
NEW CAPTAIN ## MAKRET VALUE
11
512
012
513
013
5
Lin
ear
Pre
dic
tion
DM HS IV LA LM LV MS OM RA RM RVPOSITION
As before New Captain
NEW CAPTAIN ## POSITION
12
212
312
412
5
Lin
ear
Pre
dic
tion
0 7 14 21REST DAYS
As before New Captain
NEW CAPTAIN ## REST DAYS
12
2.5
12
312
3.5
12
412
4.5
Lin
ear
Pre
dic
tion
0 1HOME
As before New Captain
NEW CAPTAIN ## HOME
11
812
012
212
412
612
8
Lin
ear
Pre
dic
tion
0 .2 .4 .6 .8 1WIN PROP
As before New Captain
NEW CAPTAIN ## WIN PROPABILTY
SESM| Weimar & Prinz 20
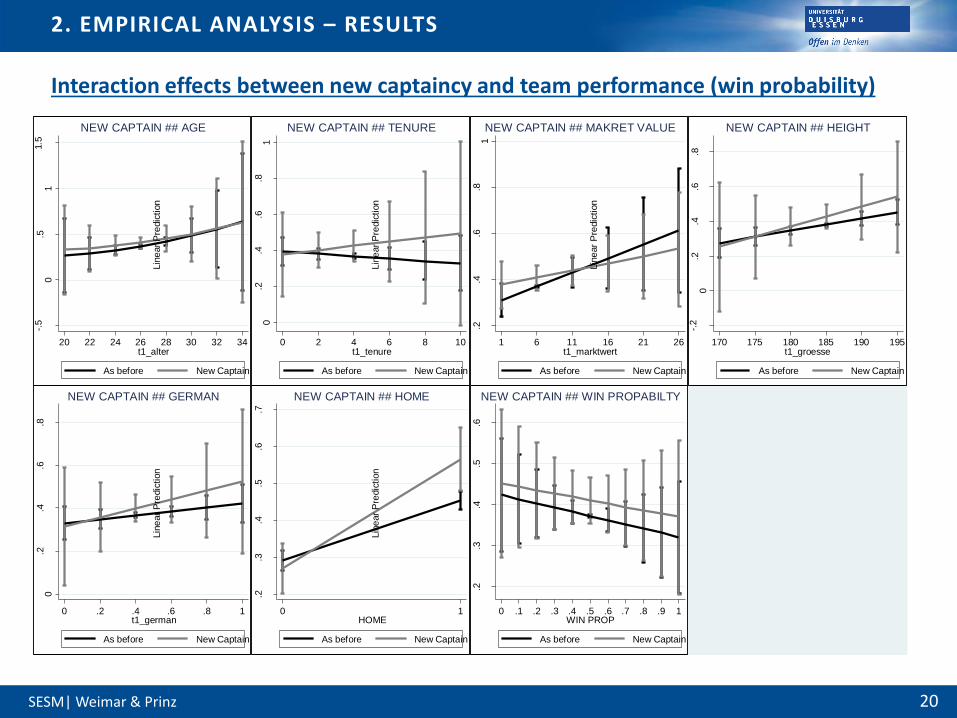
2. EMPIRICAL ANALYSIS – RESULTS
Interaction effects between new captaincy and team performance (win probability)
-.5
0.5
11.5
Lin
ear
Pre
dic
tion
20 22 24 26 28 30 32 34t1_alter
As before New Captain
NEW CAPTAIN ## AGE
0.2
.4.6
.81
Lin
ear
Pre
dic
tion
0 2 4 6 8 10t1_tenure
As before New Captain
NEW CAPTAIN ## TENURE
.2.4
.6.8
1
Lin
ear
Pre
dic
tion
1 6 11 16 21 26t1_marktwert
As before New Captain
NEW CAPTAIN ## MAKRET VALUE
-.2
0.2
.4.6
.8
Lin
ear
Pre
dic
tion
170 175 180 185 190 195t1_groesse
As before New Captain
NEW CAPTAIN ## HEIGHT
0.2
.4.6
.8
Lin
ear
Pre
dic
tion
0 .2 .4 .6 .8 1t1_german
As before New Captain
NEW CAPTAIN ## GERMAN
.2.3
.4.5
.6.7
Lin
ear
Pre
dic
tion
0 1HOME
As before New Captain
NEW CAPTAIN ## HOME
.2.3
.4.5
.6
Lin
ear
Pre
dic
tion
0 .1 .2 .3 .4 .5 .6 .7 .8 .9 1WIN PROP
As before New Captain
NEW CAPTAIN ## WIN PROPABILTY
SESM| Weimar & Prinz 21
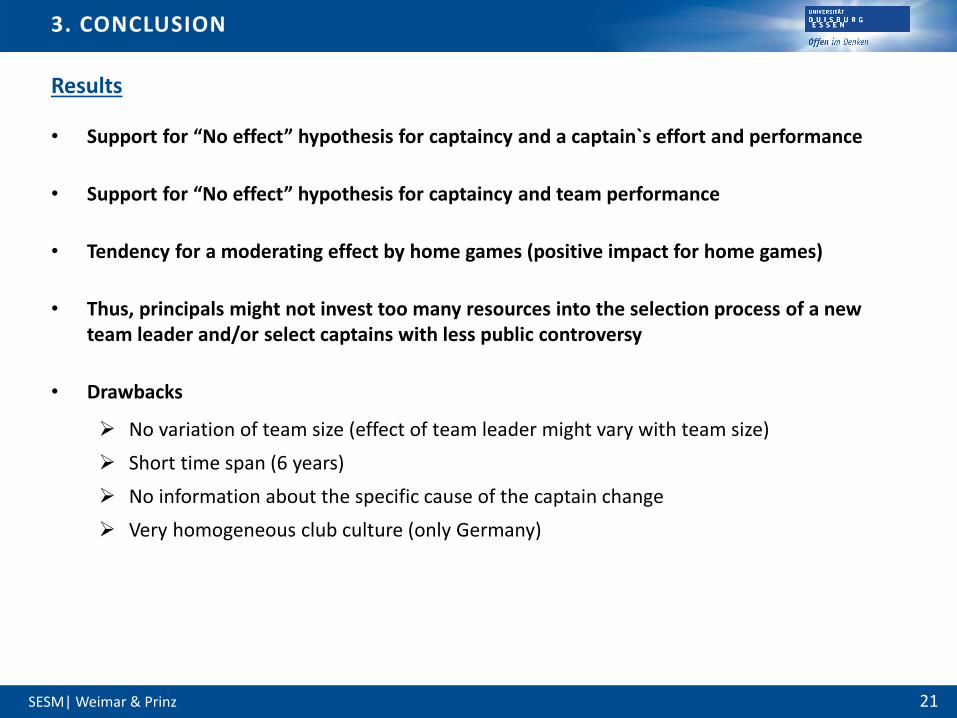
3. CONCLUSION
• Support for “No effect” hypothesis for captaincy and a captain`s effort and performance
• Support for “No effect” hypothesis for captaincy and team performance
• Tendency for a moderating effect by home games (positive impact for home games)
• Thus, principals might not invest too many resources into the selection process of a new team leader and/or select captains with less public controversy
• Drawbacks
No variation of team size (effect of team leader might vary with team size)
Short time span (6 years)
No information about the specific cause of the captain change
Very homogeneous club culture (only Germany)
Results
SESM| Weimar & Prinz 22
REFERENCES
Allen, W. D. (2015). The demand for younger and older workers: Patterns from NFL labor markets. Journal of Sports Economics, 16(2), 127-158.Apesteguia, J., & Palacios-Huerta, I. (2010). Psychological pressure in competitive environments: Evidence from a randomized natural experiment. American Economic Review, 100(5),
2548-64.Atkinson, S. E., Stanley, L. R., & Tschirhart, J. (1988). Revenue sharing as an incentive in an agency problem: An example from the National Football League. The Rand Journal of
Economics, 19, 27–43.Alchian, A. A., & Demsetz, H. (1972). Production, information costs, and economic organization. The American economic review, 62(5), 777-795.Bass, B. M. (1985). Leadership and performance beyond expectations. Collier Macmillan.Berger, J., & Nieken, P. (2016). Heterogeneous contestants and the intensity of tournaments: An empirical investigation. Journal of Sports Economics, 17(7), 631-660.Brook, S. (2010). The Payoff to Leadership in Teams. Journal of Sports Economics, 11(3), 358-360.Charbonneau, D., Barling, J., & Kelloway, E. K. (2001). Transformational leadership and sports performance: The mediating role of intrinsic motivation. Journal of applied social
psychology, 31(7), 1521-1534.Cisternas, G. (2017). Career Concerns and the Nature of Skills. American Economic Journal: Microeconomics, Forthcoming.Cooper, R. G. (1996). Overhauling the new product process. Industrial Marketing Management, 25(6), 465-482.Cotterill, S. T., & Cheetham, R. (2017). The experience of captaincy in professional sport: The case of elite professional rugby. European journal of sport science, 17(2), 215-221.Dewenter, R., & Namini, J. E. (2013). How to make soccer more attractive? Rewards for a victory, the teams’ offensiveness, and the home bias. Journal of Sports Economics, 14, 65–86.Dawson, P., & Dobson, S. (2002). Managerial efficiency and human capital: an application to English association football. Managerial and Decision Economics, 23(8), 471-486.Deutscher, C. (2009). The payoff to leadership in teams. Journal of Sports Economics, 10(4), 429-438.Deutscher, C., & Schneemann, S. (2017). The impact of intermediate information on sabotage in tournaments with heterogeneous contestants. Managerial and Decision Economics,
38(2), 222-237.Deutscher, C., Frick, B., Gürtler, O., & Prinz, J. (2013). Sabotage in tournaments with heterogeneous contestants: Empirical evidence from the soccer pitch. The Scandinavian Journal of
Economics, 115(4), 1138-1157.Elgar, M. A. (2016). Leader selection and leadership outcomes: Height and age in a sporting model. The Leadership Quarterly, 27(4), 588-601.Franck, E., & Nüesch, S. (2010). The effect of talent disparity on team productivity in soccer. Journal of Economic Psychology, 31(2), 218-229.Fransen, K., Vanbeselaere, N., De Cuyper, B., Vande Broek, G., & Boen, F. (2014). The myth of the team captain as principal leader: Extending the athlete leadership classification within
sport teams. Journal of Sports Sciences, 32(14), 1389-1397.Frick, B., Gürtler, O., & Prinz, J. (2008). Anreize in Turnieren mit heterogenen Teilnehmern—Eine empirische Untersuchung mit Daten aus der Fußball-Bundesliga. Schmalenbachs
Zeitschrift für betriebswirtschaftliche Forschung, 60(4), 385-405.Frick, B. (2011). Performance, salaries, and contract length: Empirical evidence from German soccer. International Journal of Sport Finance, 6(2), 87.Giambatista, R. C. (2004). Jumping through hoops: A longitudinal study of leader life cycles in the NBA. The Leadership Quarterly, 15(5), 607-624.Loughead, T. M., Hardy, J., & Eys, M. A. (2006). The nature of athlete leadership. Journal of Sport Behavior, 29(2), 142.Loughead, T. M. (2017). Athlete leadership: a review of the theoretical, measurement, and empirical literature. Current opinion in psychology, 16, 58-61.Lazear, E. P., Shaw, K. L., & Stanton, C. T. (2015). The value of bosses. Journal of Labor Economics, 33(4), 823-861.Miklós-Thal, J., & Ullrich, H. (2015). Career prospects and effort incentives: Evidence from professional soccer. Management Science, 62(6), 1645-1667.Leard, B., & Doyle, J. M. (2011). The effect of home advantage, momentum, and fighting on winning the National Hockey League. Journal of Sports Economics, 12, 538–560.Soebbing, B. P., Wicker, P., & Weimar, D. (2015). The impact of leadership changes on expectations of organizational performance. Journal of Sport Management, 29(5), 485-497.Schneemann, S., & Deutscher, C. (2017). Intermediate information, loss aversion, and effort: Empirical evidence. Economic Inquiry, 55(4), 1759-1770.Thompson, J., Johnstone, J., & Banks, C. (2018). An examination of initiation rituals in a UK sporting institution and the impact on group development. European Sport Management
Quarterly, 1-19.Weimar, D., & Wicker, P. (2017). Moneyball revisited: Effort and team performance in professional soccer. Journal of Sports Economics, 18(2), 140-161.Wicker, P., Prinz, J., Weimar, D., Deutscher, C., & Upmann, T. (2013). No pain, no gain? Effort and productivity in professional soccer. International Journal of Sport Finance, 8(2), 124.