Embed Size (px)
Citation preview

U. S. Forest Service Research Paper INT -20 1965
l 7 '.''
Robert W. Carlson and Walter E. Cole···
·', .~·;"' .'1'.
l
Gene. o; Amm6 '·· i ', . ~ ~

U.S. Forest Service ~ Research Paper INT-20
~. 1965
' .•
A TECHNIQUE FOR SAMPLING POPULATIONS OF
THE MOUNTAIN PINE BEETLE
by
Robert W. Carlson and Walter E. Cole
INfERMOUNTAIN FOREST AND RANGE EXPERIMENT STATION Forest Service
U.S. Department of Agriculture Ogden, Utah
Joseph F. Pechanec, Director

•
THE AUI'HORS
ROBERT W. CARLSON was employed as biological aid at the time this research project was active. Since then he has completed work for the M.S. degree at the University of Michigan.
WALTER E. COLE, research entomologist at Intermountain Forest and Range Experiment Station, has been studying the dynamics of forest insect populations since 1960. For 10 years before that he had studied biological evaluations and control of forest insects. He has published several articles and reports about sampling forest insect populations •
•
!
i l ; ;

(l (.
•• 8
A TECHNIQUE FOR SAMPLING POPULATIONS OF THE MOUNTAIN PINE BEETLE
Robert W. Carlson and Walter E. Cole
Suitable sampling techniques are basic to the determination of relations between an insect and the host plant. Development of suitable sampling techniques is part of intensive studies on the population dynamics of the mountain pine beetle, Dendroctonus monticolae Hopk., in lodgepole pine, now actively underway in the intermountain area of Utah and Wyoming.
This paper reports results of research designed to develop a procedure for sampling populations of the bark beetle during the mature larval and pupal stages. The experimental design tested for variation between sample sizes and shapes, locations on the tree, and trunk diameters , as well as testing for the nature of the statistical distribution.
The study areas selected, though widely separated geographically, were bioclimatically equivalent as defined by Hopkins' Law. One was on the Wasatch National Forest in Utah and the other on the Teton National Forest in Wyoming. The populations sampled in both areas can be considered as epidemic. The Wasatch population has been epidemic in numbers since 1938. The Teton population has shown cyclic tendencies of recurrent epidemics; the present cycle began about 1958. The affected timber stands differ. The Wasatch stand, in general, consists of smaller diameter trees, as old as those in the Teton stand, or older, but less vigorous. The Wasatch population was characterized by low brood density and a current static trend. The Teton infestation showed a definitely increasing trend.
EXPERIMENTAL DESIGN
The experimental work in the two stands was replicated as closely as possible. Three variables were measured (counts): (1) density of attack, (2) length of egg gallery, and (3) density of brood. All existing stages of brood were recorded: mature larvae, pupae, and callow adults. Only successful attacks and consequently successfully constructed egg galleries were recorded.
Sample size: Six sample units were superimposed in a nested fashion at each point sampled (fig. 1). The six units were: four rectangular--1/10, 1/4, and 1/2 sq. ft.--and a sample proportional to tree diameter; and two circular--1/10 and 1/4 sq. ft. Brood counts were made only for the rectangular samples.
Sample location: Each tree was sampled at six points: on the north and south aspects at breast height, 5 feet below the height of infestation, and midway between these two points.
Tree size: Ten trees in each of the following d.b.h. categories per plot were used: 6-9, 9-12, 12-15, and greater than 15 inches. Only 13 trees per plot were sampled for brood, because of the stage of brood development and imminent adult emergence. These trees were selected randomly.

.:.
(.
2
a 911 proportional width
1---- min. prop. width
.----t---
----- Sample center axis, defining the sample locus Boundary of 1/2 sq •• ft. rectangular sample
- ·-- Boundary of 1/4 sq. ft. rectangular sample ------- Boundary of 1/IO sq. ft. rectangular sample ---- Boundary of proportional sample.
Figure 1. --The relative placement of the various sample units, showing the method of nesting. Scale: 6" = 1'. ••

-,,;·, ',
•• t;' .
•• l '.'
•
ANALYSIS OF DATA
Statistical distribution: Comparisons of infestations, populations, and other categories can be made on the basis of their statistical distributions. In this study, analysis of distributions was based upon scatter diagrams of variance plotted over means of the three variables measured.
The scatter of variance in relation to mean attack density and gallery length al?peared to be random. Comparison of Wasatch and Teton data (figs. 2, 3, 4, and 5) showed no difference in distribution. The brood data, however, typified a contagious distribution--increasing variance with an increase in the mean (figs. 6, 7). There were not enough data to determine the specific contagious distribution involved.
... .... ... ~ .,. u rz. I
41 u 1!1 .. .... "' .. >
... .... ... "'
120
100
80
60
40
20
0
160
140
120
IQ 100 N' .
u rz. I 80 41 u ; .... 60 "' ~
40
20
0
..
,..
• 2 4
a,
2 4
JJ
'It
" .. • ,. .. •
,/' )I'
lC
• . ,. , . • • • • •• .. • 0 .. 0 .. • • 6 8 10 12 14
Mean Attacks Per Ft. 2
...
.. 'II
)r
•• " " )C X
lt :)(' • • •
lt • II'
• • IIC • ••• , • .It
• • • • . .
6 8 10 12 14 Mean Attacks Per Ft. 2
lf
•
16 18
..
,.
" ,. •
• •
16 18
·20
20
Figure 2.- -Teton plot --attack density: x for 1/10 sq. ft. rectangular sampies, o for 1/2 sq. ft. samples.
Figure 3. --Wasatch plot -- attack den-sity: x fqr 1/10 .sq • ft. rectangular samples, o for 1/2 sq. ft. samples.
3 ·-
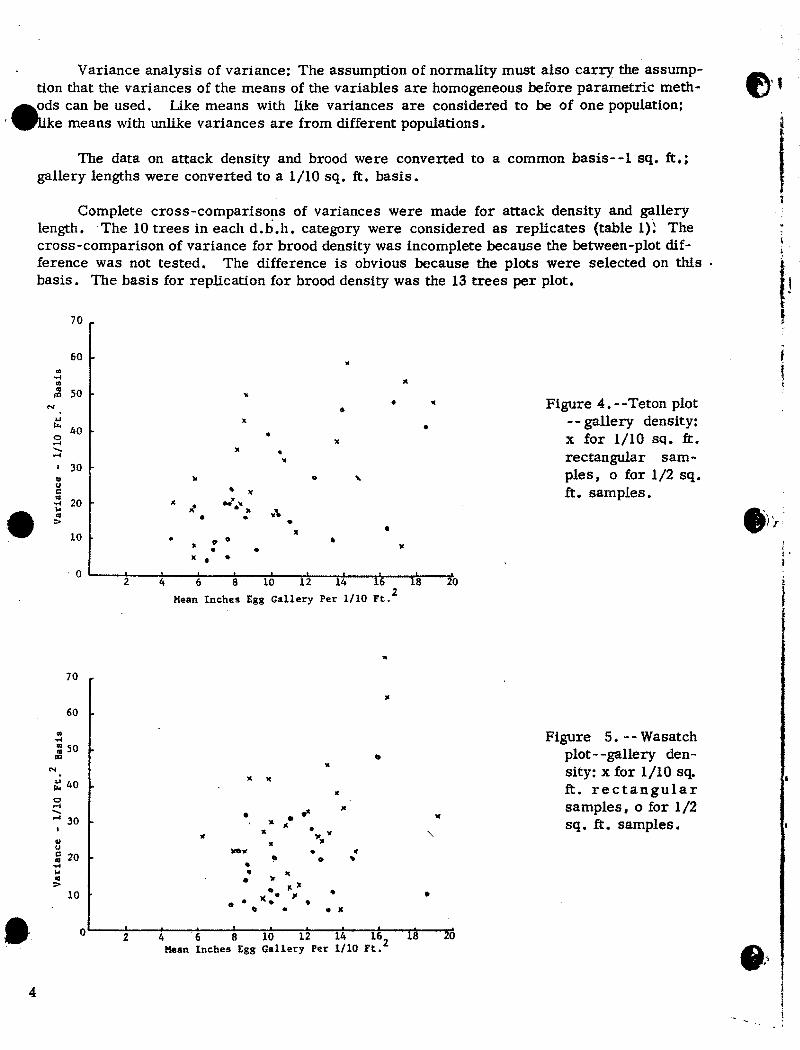
Variance analysis of variance: The assumption of normality must also carry the assumption that the variances of the means of the variables are homogeneous before parametric meth
aods can be used. Like means with like variances are considered to be of one population; ' WUke means with unlike variances are from different populations.
•
• 4
The data on attack density and brood were converted to a common basis--1 sq. ft.; gallery lengths were converted to a 1/10 sq. ft. basis.
Complete cross-comparisons of variances were made for attack density and gallery length. The 10 trees in each d.b.h. category were considered as replicates (table 1)~ The cross-comparison of variance for brood density was incomplete because the between-plot difference was not tested. The difference is obvious because the plots were selected on this basis. The basis for replication for brood density was the 13 trees per plot.
70
60
N
... "' 40 0 ..... ...... .....
I 30 Ill u s:: !l 20 ,. .. >
10
)f
" ,.• •
• • " • "' •
J(
... • " •
" • • l(
" • .. ..
• lC
..: .. . ,. y'\ • •
" • • • • ll
• , 0 ~---~2~---4~---~6------~s----l~o~~1*2----1M4~~~6---~~~o
2 Mean Inches Egg Gallery Per 1/10 Ft.
70
60
.. ... :50 IQ
N
~ 40 0 ..... ...... ..... 30
I
Ill u ; 20 ... ,. 01 >
10
0 2
" .. •
" " • • • • )r
0
• I( • 0 • •
IC
J( ll 11
•
. " ,,. • •
" "
• • • IC
"
•
4 6 8 10 12 14 162 Mean Inches Egg Gallery Per 1/10 Ft.
IC
•
Figure 4. --Teton plot -- gallery density: x for 1/10 sq. ft. rectangular samples, o for 1/2 sq • ft. samples.
Figure 5. --Wasatch plot--gallery density: x for 1/10 sq. ft. rectangular samples, o for 1/2 sq. ft. samples.
l
&· .,)'r

. , ~y-
t
160'
140
N . i;! 100
.... 0 80 0
I<
:: 60 c:: .. .... ... :. 40
20
•
ll •
" • • • ..
II
0~-=~~~~~~~~~~~~~ 20 40 60 80 0
... .... ... .. 1111
N
... r..
' ~ 0
>< Ill u c:: .. .... ... .. >
225
200
175
150
125
100
.15
so
25
0
Mean Brood Count Per Ft. 2
• • •
•
...
Mean Brood CoWlt Per Ft. 2
Chi-square analyses: Chi-square comparisons of variance arrangements were used to show the within -tree density trends for d. b. h. categories and plots. These analyses supplemented the variance analysis of variance as a tool in making decisions about proper sampling procedures. Only data for the 1/2 sq. ft. samples were 4sed in the analyses .
Regression analysis: Regression and variance analyses were used to check the relation of each of the following variables to d.b.h.: height of infestation, attack density, and gallery length.
Figure .6. --Teton plot--brood density: x for 1/10 sq. ft. rectangular samples, o for 1/2 sq. ft. samples.
Figure 7 .--Wasatch plot--brood density: x for 1/10 sq. ft. rectangular samples, o for 1/2 sq. ft. samples.
5 "'~ ..

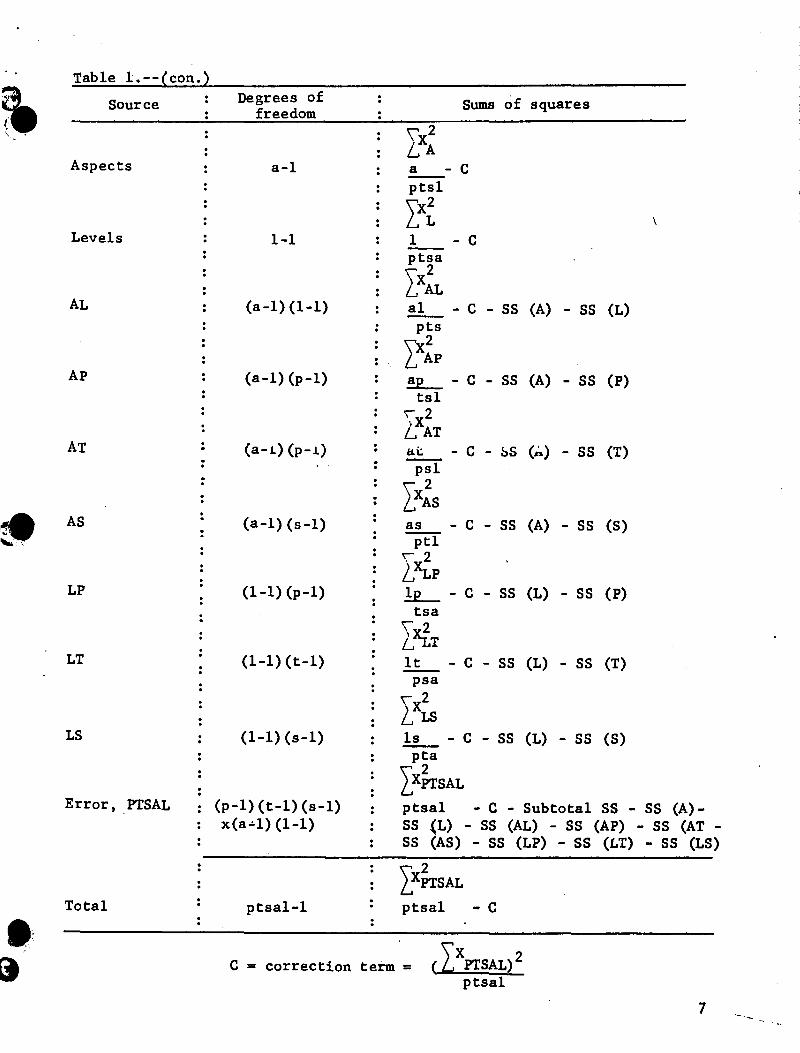
Table 1.--Form for comEutation of sums of variances for attack ,.
\ .. Source Degrees of : : freedom
Plots p-1
Tree sizes t-1
Sample sizes s-1
PT (p-1) (t-1)
PS (t-1) (s-1) ,. TS (t-1) (s-1)
Error, PTS (p-1) (t-1) (s-1)
Subtotal pts-1
•• 6
of sguares ih variance anal Isis and for gallerx densiti
Sums of squares
Ix: E.__- c tsal
I~ t - c psa1
Lx~ s - c ptal
Ix~T !!!__ - c - SS (P) - SS (T)
sal
Ix~s ..
£.!.__- c - SS (P) - 55 (5) tal
'"xi L s ts - c - ss (T) - 55 (5) pal
\' 2 2}PTS E.!!_- c - 55 (P) - 55 (T) - 55 (5)
al
Ix~s £!!_ - c
al
(Continued)
' ,. ~ I
fl'i
~· ,,
l I l ~ I '
-l·'" ..
-~·_I ! I
~ \ .
Table 1.--(con.)
Source
Aspects
Levels
AL
AP
AT
AS
LP
LT
LS
Error, . PTSAL
Total
. . . . . .
Degrees of freedom
a-1
1-1
(a-1) (1-1)
(a-1) (p-1)
(a-1) (p-1)
(a-1) (s-1)
(1-1) (p-1)
(1-l)(t-1)
(1-l)(s-1)
(p-1) (t-1) (s-1) x(a-'-1)(1-1)
ptsal-1
. .
\x2 LA
Sums of squares
a - C ptsl
IX~ 1 - c ptsa '\' 2 LXAL
al - C - SS (A) - SS (L) pts
r~p !£__ - C - SS (A) - SS (P)
tsl '\ x2 LAT at - C - bS (~) - SS (T) psl
\2 LXAS
as - C - SS (A) - SS (S) ptl
L~P !L_ - C - SS (L) - SS (P)
tsa \~ L-LT
lt - C - SS (L) - SS (T) psa
\x2 L LS ls - C - SS (L) - SS (S) pta
IxhsAL
ptsal - C - Subtotal SS - SS (A)SS (L) - SS (AL) - SS (AP) - SS (AT -SS (AS) - SS (LP) - SS (LT) - SS (LS)
IxhsAL
ptsal - C
C = correction term =
7

RESULTS
Sample size: The variance analysis of variances showed significant differences between :Ample sizes, diameters, and plots for the attack density and gallery length variables, but ·.owed no significant differences between sample sizes for brood. The Student-Newman-Keul's
Multiple Range Test (Steel and Torrie 1960)~ showed that all sample sizes differed significantly from each other for gallery length, and the 1/10 sq. ft. sample differed significantly from all others for attack density. The variance between diameter for both attack density and gallery length did not show like patterns of occurrence. The test failed to reveal differences between sample heights for attack density, and only top and mid-sample heights differed significantly for prood density.
The brood density variation was greater than either the attack density or gallery length variation. Thus, inferences drawn from the brood density variable will be used to determine sample size for the sampling plan.
The Teton data showed downward trend of the coefficient of variation with increase of sample size, but the Wasatch data did not. This distribution of the coefficient of variation is probably due to the effect of zero counts--the larger the sample size the fewer zero counts, and the greater likelihood of reducing variance.
Sample location: The variances of all three variables were generally greater at breast height and mid-height than at the top sampling height. The only significant difference was between mid- and top heights for the brood density variable. On a percentile basis , the three variables were also more consistent. Variance tends to be greatest at breast height, but since the mean values also tend to be larger at this position, the coefficients of variation are not
.rrespondingly high.
Aspect: A significant interaction between aspects by plots indicated that there was never complete consistency. In some interacuons, as with aspects, the data cannot be treated as if they fit the same distribution. Random placement of samples, by aspect, can eliminate this effect.
Tables 2, 3, and 4 show the results of the variance analysis of variances.
Tree diameter: Not enough trees were sampled to permit any analysis of brood density in relation to d.b.h.
Regression analysis showed that both attack density and gallery length were significantly related to tree size. Attack density and gallery length increased with tree diameter (tables 5, 6, and 7).
· Size of sample needed: The number of samples (trees) needed for a 20-percent SME at the 2/3 probability level was computed for each sample size and all three variables at d.b.h. The north and south samples were combined because they :Were not random with respect to each other and in effect constituted a single sample.
• ~Steel, G. D., and J. H. Torrie. Principles and procedures of statistics.
icGraw-Hill Book Co., Inc. 481 pp. 1960. New York:
8
i. t I
• '

-\ . ~··
~
Table 3.--Variance analysis of variances for gallery density per 1/10 square foot1
Source
Plots Tree sizes Sample sizes PT PS TS Error, PTS
Subtotal
Sum of Degrees of squares freedom
180.8485 8774.8823 5750.9965 4140.8553
84.0797 423.1305 556.8869
19911.6797
1 3 5 3 5
15 " 15
47
Mean square F
180.8485 4.86* 2924.9608 78.68** 1150.1993 30.94** 1380.2851 37.13**
16.8159 0.45 28.2087 0.76 37.1258
(Continued)
9

f I
' .. Table 3. --(con.) e~ Sum of Degrees of
,
• Source Mean square F squares freedom
Aspects 1.4056 1 1.4056 o.oo Levels 1800.3353 2 900.1676 1. 71 AL 243.1305 2 121.5518 0.23 AP 2786.9334 1 2786.9334 5.3o• AT 194.6111 3 64.8704 0.12 AS 40.5396 5 8.1079 0.02 LP 119.1520 2 59.5760 0.11 LT 4236.7795 6 706.1299 1.34 LS 668.6304 10 66.8630 0.13 Error, PTSAL 109753.6130 208 527.6616
Total 139756.7831 287
1 Variances computed on a 1/10 square foot basis.
Table 4. --Variance analysis of variances for brood density per square foot
• -~) Sum of Degrees of . Source Mean square . F squares freedom
Plots (Blocks) 370909825.92 1 --------------------------------------------------------------------------------------
Sample sizes 12845676.64 3 4281892.21 1.16 Error, PS 11038342.64 3 3679447.55
Subtotal 394793845.20 7
Aspects 17908167.36 1 17908167.36 5.32• Levels 35517526.09 2 17758763.04 5.27• AP 44466345.09 1 44466345.03 I3.2o•• AS 1774537.12 3 59i512.37 0.18 AL 33448518.07 2 16724259.04 4.96• LP 19075248.37 2 9537624.51 2.83 LS 1364835.05 6 227472.51 0.07 Error, PSAL 77471934.61 23
' 363344.98
Total 625820956.90 47
10

• (ct,, , .. '
~
Table 5. --Regression and variance analysis for height of infestation X d.b.h.
Regression matrix
N X Y :D. F.
N 80 974.10 2052.00 X 12799.57 26485.66 y 58716.50 X ------~9~3~8-.6~8~--~715~0~0~.0~0~-~~
80
y 6082.70 y ------------------~36~8~5~.7~2~~~
79 78
Analysis of variance
Source:
Bo B~ Res.
ss 52633.80 2396.98 3685.72
Total 58716. 50
X = D.b.h.
:D.F.: MS
1 1
76 2396.98
48.50
Y = Height of infestation
F
49.42**
Table 6.--Regression and variance analysis for attack density X d.b.h.
WASATCH PLOT
Regression matrix
N X y
N 40 487.50 398.00 \ X 6414.29 5160.90 y 4454.00 X 472.88 310.28 y 493.90 y 290.31
Analysis of variance
Source : D. F.: SS MS
B0 1 B1 1 Res. 38
3960.10 203.59 203.59 290.31 7.64
Total 4454.00
N
N. 40 X y X y y
TETON PLOT
Regression matrix
X
486.60 6385.28
465.79
y
530.00 6792.40 8016.00 344.95 993.50 738.04
Analysis of variance
Source: D.F .: ss MS
B" 0 1 7022.50 B1 1 255.46 255.46 Res. 38 738.04 19.42
Total 8016.00
X = D.b.h. Y = Density of attack
: D.F.
40
39 38
F
27.96**
: D.F.
40
39 38
F
13.15 ..
11
I . II '

Table 7. --Regression and variance analysis fl! ( • for gallery density X d.b.h •
'··· •,:; WASATCH PLOf
Regression matrix
N X y :D. F.
N 40 487.50 2358.00 \
X 6414.29 31824.60 y 169952.00 40. X 472.88 3086.48 y 30947.90 39 y 10802.51 38
Analysis of variance
Source: D. F.: ss MS F
Bo 1 139004.10 B1 1 20145.39 20145.39 70.86 .. Res. 38 10802.51 284.28
Total 169952.00
(' ------------------------------------------TETONPLOf -)\
Regression matrix
N X y :D. F.
N 40 486.60 2717.00 X 6385.28 34359.00 y 203475.00 40 X 465.79 1306.70 y 18922.78 39 y 15257.04 38
Analysis of variance
Source.: D. F.: ss MS F
" Bo 1 184552.22 Bl. 1 3665.74 3665.74 9.13 .. ~
Res. 38 15257.04 401.50 I • Total 203475.00
' X = D.b.h. Y = Density of gallery e
12 -·~. '

More samples are required for measuring attack density and gallery lengths for the smaller size sample than for the larger size. For measurements of brood density, the required number of samples decreases as sample size increases. Combining north and south samples at d.b.h. generally effected an increase of number of trees needed (table 8).
Table 8. --The number of trees required to be sampled for a 20-percent SME at 2/3 probability level based upon summed north and south bottom samples (rectangular samples only)
Density Plot Sample size
1/10 sq.ft. 1/4 sq.ft. 1/2 sq.ft. Proportional
Attack Teton 9.13 3.36 2.42 3.13 density Wasatch 7.76 4.22 3.63 3.08
Gallery Teton 6.40 5.71 5.56 4.67 density Wasatch 2.46 2.63 2.20 2.12
Brood Teton 8.19 9.93 8.16 7.56 density Wasatch 54.06 66.94 67.84 55.36
THE SAMPLING PLAN
The principal object of any sampling procedure is to secure a sample which, subject to physical limitations, will reproduce the characteristics of the population as closely as possible. The simplest and most certain way to achieve this goal is for the sample to be drawn at random. However, selection at random, subject to restrictions that do not introduce bias- -called systematic random sampling- -is permissible.
Sampling can be limited to the breast-height region within an infested tree and satisfy the requirements of efficiency and reliability in reproducing the characteristics of the population. In adhering to the principles of systematic random sampling, the sampling universe was defined as that subpopulation within a zone 1 foot above and 1 foot below breast height of infested trees.
This zone was divided into four quadrants: north, east, south, and west. If the 1/10 sq. ft. sample is used, the zone can be divided into six levels of 4 inches each--three above and three below breast height; this produces 24 sample loci. If the 1/4 sq. ft. sample is used, the zone can be divided into four levels of 6 inches each, producing 16 loci. Prior to sampling, two loci were selected at random and sampled without replacement.
The important advantage of this plan is that an estimate of within-tree variance can be computed to determine the statistical distribution; th~ within-tree error can be treated as error attributable to replication; additional degrees of freedom result--one an attribute of replication error and the other distributed to the error term or interactions, thus increasing experimental precision. This particular two-sample technique will be used in the future work on the population dynamics of the mountain pine beetle in lodgepole pine to determine the type of distribution, and to provide the basis for conversion to normality, when necessary. This plan should be a step toward the development of more effective sampling techniques.