Embed Size (px)
Citation preview

Volume 18 • Issue 1 • 1000398J Coast Zone ManagISSN: 2473-3350 JCZM, an open access journal
Research Article Open Access
Supriyadi and Sandra, J Coast Zone Manag 2015, 18:1 DOI: 10.4172/2473-3350.1000398
Research Article Open Access
Journal ofCoastal Zone ManagementJo
urna
l of C
oastal Zone Managem
ent
ISSN: 2473-3350
Impacts and Adaptation to Climate Change: A Case Study of Coastal Inundation at Proboliunggo, East-JavaIndarto Happy Supriyadi* and Asep Sandra
Research Center for Oceanography-Indonesian Institute of Sciences, Indonesia
AbstractThe vulnerability of communities in coastal areas continues to increase in the face of climate change. The
increasing rainfall in one place and droughts elsewhere, high waves and strong ocean winds are real phenomena indicative of climate change. Increasing symptoms of climate change at the same time as a high tide can cause widespread coastal inundation. This can interfere with food security, livelihoods and environmental sustainability (including bio-diversity), and threaten coastal infrastructure. The purpose of this study was to study the impact of climate change and the adaptation and mitigation done by coastal communities in the face of it. The method of this study is the analysis of satellite imagery data, interviews and analysis of the productive land. The results of this study show the occurrence of irregularities such as increased rainfall in 2010, during the period 2002-2011; how flood tides in coastal areas can damage productive land (fish ponds), and submerge residences, public facilities and infrastructure. In Kalibuntu there was flooding to an average water depth of 110 cm over 87.84 Ha for 4-4.5 hours. Coastal communities adapted by raising the ground floor of their houses about 0.5-1 meters and switching to other kinds of job. Flood mitigation involved building a seawall of stacked stone in a trapezoidal shape with groins extending in to the sea. This design has strong resistance and has proven durable. In addition to physical prevention efforts, biological precautions, especially mangrove reforestation, are necessary.
Keywords: Symptoms of climate change; Impacts Adaptation/mitigation; Kalibuntu village
IntroductionSymptoms of climate change
Coastal areas are highly dynamic and geo-morphologically` complex systems which respond in various ways to extreme weather events [1]. More than one-third of the world’s human population lives in coastal areas and on small islands [2]. Considering the fact that 21 % of the world’s population lives within coastal zones [1], the potential impacts of sea-level-rise are significant for the wider coastal ecosystem [3]. Climate change is expected to cause accelerated rises in sea-level with elevated tidal inundation, increased flood frequency, accelerated erosion, increased saltwater intrusion, increasing storm surge and increasing frequency of cyclones [4]. The vulnerability of communities living in coastal areas continues to increase in the face of climate change [5-7]. The long-term sustainability of these populations is dependent on the coastal ecosystems and the services they provide, such as storm buffering, fisheries production and enhanced water quality [8].
The increasing rainfall in one place and droughts elsewhere, high waves and a change in strong ocean winds are real phenomena indicative of climate change. Increasing symptoms of climate change, along with high tides, can cause widespread tidal flooding in coastal areas. This can interfere with food security, livelihoods and environmental sustainability (including bio-diversity), and coastal infrastructure was also threatened. The vulnerability of coastal communities and economic sectors to coastal flooding is expected to increase in the coming decades due to both environmental and social-economic changes [6,7]. Coastal floods are regarded as among the most dangerous and harmful of natural disasters [1].
Climate change is expected to cause accelerated sea-level rise with elevated tidal inundation, increased flood frequency, accelerated erosion, rising water tables, increased saltwater intrusion, increasing storm surges and increasing frequency of cyclones [4]. If the frequency of coastal flooding, population growth, development activity and
*Corresponding author: Indarto Happy Supriyadi, Research Center for Oceanography-Indonesian Institute of Sciences, Jl. Pasir Putih No. 1 Ancol TimurJakarta, Indonesia, Tel: +62-081286096125; E-mail: [email protected]
Received January 19, 2015; Accepted February 14, 2015; Published February 24, 2015
Citation: Supriyadi IH, Sandra A (2015) Impacts and Adaptation to Climate Change: A Case Study of Coastal Inundation at Proboliunggo, East-Java. J Coast Zone Manag 18: 398. doi: 10.4172/2473-3350.1000398
Copyright: © 2015 Supriyadi IH, et al. This is an open-access article distributed under the terms of the Creative Commons Attribution License, which permits unrestricted use, distribution, and reproduction in any medium, provided the original author and source are credited.
environmental degradation in coastal areas continue increasing, this suggests that coastal communities should to plan to adapt to such changes. Adaptation is an important strategy in the face of the risk of change. The identification of sections of shoreline susceptible to sea-level-rise is necessary to more effectively manage coastal areas, in order to increase resilience and to help reduce the impacts of climate change on both infrastructure and human beings [9].
The initial concept in the study of climate change in this paper is referring to ‘any change in climate over time, whether due to natural variability or human activity’ [6]. This concept emphasizes that the causes of climate change involve natural and human factors. The main indicators of the occurrence of climate change are the increasing concentration of carbon dioxide, rising temperature of earth’s surface, the melting polar ice caps and sea level rise. Global emissions of greenhouse gases (carbon dioxide, methane, nitrogen oxide,) caused by human activity have increased since the start of the industrial revolution. The increase in emissions makes global warming inevitable: the surface temperature between 1970 and 2004 increased by 0.6oC (the decade of 1990s recorded the highest temperatures), rainfall patterns also change spatially and temporally and global sea levels rose by 0.1-0.2 m [6]. The rate of sea level rise since the mid-19th century has been larger than the mean rate during the previous two millennia. Over the period 1901 to 2010 global mean sea level rose by 0.19 (0.17 to 0.21)
Page 2 of 8
Citation: Supriyadi IH, Sandra A (2015) Impacts and Adaptation to Climate Change: A Case Study of Coastal Inundation at Proboliunggo, East-Java. J Coast Zone Manag 18: 398. doi: 10.4172/2473-3350.1000398
Volume 18 • Issue 1 • 1000398J Coast Zone ManagISSN: 2473-3350 JCZM, an open access journal
m [10]. Conditions indicate significant symptoms of climate change such as an increase in sea level of about 17 cm in the last century at a rate of 3.3 mm per year, and rising global temperatures are causing ocean warming, decay of ice in the polar regions, the increase in CO2 concentration, change in salinity, alkalinity and ocean circulation [11,12]. Indications suggest that increased CO2 in the atmosphere is a major cause of global warming and global climate change [13].
MethodStudy area
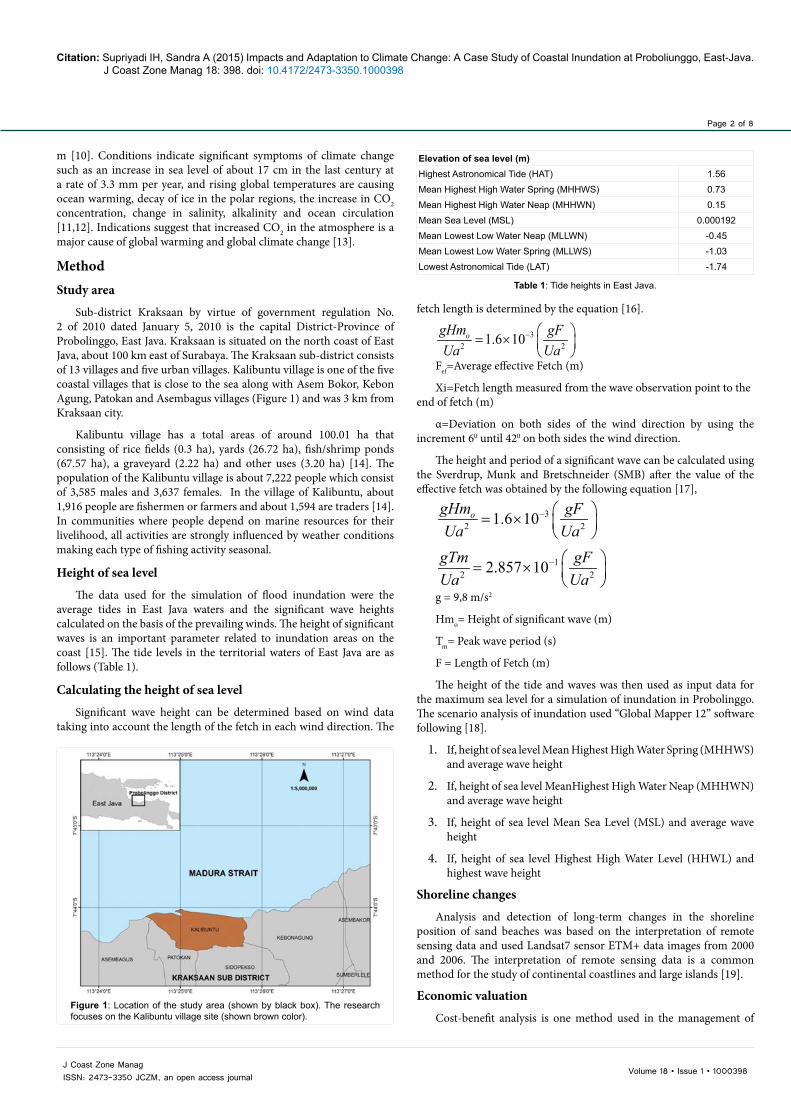
Sub-district Kraksaan by virtue of government regulation No. 2 of 2010 dated January 5, 2010 is the capital District-Province of Probolinggo, East Java. Kraksaan is situated on the north coast of East Java, about 100 km east of Surabaya. The Kraksaan sub-district consists of 13 villages and five urban villages. Kalibuntu village is one of the five coastal villages that is close to the sea along with Asem Bokor, Kebon Agung, Patokan and Asembagus villages (Figure 1) and was 3 km from Kraksaan city.
Kalibuntu village has a total areas of around 100.01 ha that consisting of rice fields (0.3 ha), yards (26.72 ha), fish/shrimp ponds (67.57 ha), a graveyard (2.22 ha) and other uses (3.20 ha) [14]. The population of the Kalibuntu village is about 7,222 people which consist of 3,585 males and 3,637 females. In the village of Kalibuntu, about 1,916 people are fishermen or farmers and about 1,594 are traders [14]. In communities where people depend on marine resources for their livelihood, all activities are strongly influenced by weather conditions making each type of fishing activity seasonal.
Height of sea level
The data used for the simulation of flood inundation were the average tides in East Java waters and the significant wave heights calculated on the basis of the prevailing winds. The height of significant waves is an important parameter related to inundation areas on the coast [15]. The tide levels in the territorial waters of East Java are as follows (Table 1).
Calculating the height of sea level
Significant wave height can be determined based on wind data taking into account the length of the fetch in each wind direction. The
fetch length is determined by the equation [16].
32 21.6 10ogHm gF
Ua Ua− = ×
Fef=Average effective Fetch (m)
Xi=Fetch length measured from the wave observation point to the end of fetch (m)
α=Deviation on both sides of the wind direction by using the increment 60 until 420 on both sides the wind direction.
The height and period of a significant wave can be calculated using the Sverdrup, Munk and Bretschneider (SMB) after the value of the effective fetch was obtained by the following equation [17],
32 21.6 10ogHm gF
Ua Ua− = ×
12 22.857 10gTm gF
Ua Ua− = ×
g = 9,8 m/s2
Hmo= Height of significant wave (m)
Tm= Peak wave period (s)
F = Length of Fetch (m)
The height of the tide and waves was then used as input data for the maximum sea level for a simulation of inundation in Probolinggo. The scenario analysis of inundation used “Global Mapper 12” software following [18].
1. If, height of sea level Mean Highest High Water Spring (MHHWS) and average wave height
2. If, height of sea level MeanHighest High Water Neap (MHHWN) and average wave height
3. If, height of sea level Mean Sea Level (MSL) and average wave height
4. If, height of sea level Highest High Water Level (HHWL) and highest wave height
Shoreline changes
Analysis and detection of long-term changes in the shoreline position of sand beaches was based on the interpretation of remote sensing data and used Landsat7 sensor ETM+ data images from 2000 and 2006. The interpretation of remote sensing data is a common method for the study of continental coastlines and large islands [19].
Economic valuation
Cost-benefit analysis is one method used in the management of Figure 1: Location of the study area (shown by black box). The research focuses on the Kalibuntu village site (shown brown color).
Table 1: Tide heights in East Java.
Elevation of sea level (m)Highest Astronomical Tide (HAT) 1.56Mean Highest High Water Spring (MHHWS) 0.73Mean Highest High Water Neap (MHHWN) 0.15Mean Sea Level (MSL) 0.000192Mean Lowest Low Water Neap (MLLWN) -0.45Mean Lowest Low Water Spring (MLLWS) -1.03Lowest Astronomical Tide (LAT) -1.74

Page 3 of 8
Citation: Supriyadi IH, Sandra A (2015) Impacts and Adaptation to Climate Change: A Case Study of Coastal Inundation at Proboliunggo, East-Java. J Coast Zone Manag 18: 398. doi: 10.4172/2473-3350.1000398
Volume 18 • Issue 1 • 1000398J Coast Zone ManagISSN: 2473-3350 JCZM, an open access journal
coastal areas with various forms of Environmental Impact Assessment. However, the weakness of this analysis is that the only aspects that can be measured are those that can be assessed in terms of monetary value. The purpose of this analysis is to compare the cost, or disadvantages, with the benefits or advantages [20]. Cost-benefit analysis was used to calculate the economic value of the natural resources in coastal areas. Cost was something that reduces to an object, whereas benefits the something added to an object.
Community adaptation
To obtain accurate information about the effects of climate change and the effort of coastal communities to adapt to it, interviews and group discussions were conducted with community leaders and fisherman.
Results and Discussion Symptoms of climate change
Based on an analysis of rainfall data from the Agency for Meteorology, Climatology and Geophysics (BMKG) in Juanda Airport Surabaya-East Java in 2002-2011, the Probolinggo district has its highest
rainfall in February (525.5mm). Relatively high precipitation occurs in December (366.9 mm), January (459.6 mm), and March (401.9 mm), commonly referred to as the west monsoon or rainy season. Conversely the east monsoon or dry season begins in June and decreases until August (4.1 mm). During 2010 there were anomalies in rainfall patterns that continued to increase compared to the average rainfall per month between 2002 to 2011 (Table 2). Based on the observed data for 30 years (1971-2000) in East Java, there has been a shift in the rainy and dry seasons [21].
Based on the analysis meteorology data, there has been a change of wind speed in the rainy season (December-March) on the Probolinggo coast in the period 2004-2010 (Table 3). It is important for fisherman to be careful especially with wind speeds of 10.3 m/s, although they occurrence only momentarily. During the rainy season the wind direction was from the north, but at the certain moments the wind direction was from south (Figure 2). In the dry season the wind direction was from the northeast and occasionally from the southwest (Figure 3). Fisherman should be especially aware of wind speed between 5.5-8.5 m/s which tend to last longer than wind speed 8.5-10 m/s which tend to occur only for short periods of time.
Figure 2: Direction and speed of wind in the rainy season.
Table 2: Rainfall pattern during 2002-2011 in Probolinggo and surrounding region.
YearsChanges in rainfall (mm) patterns ( increased) and ( decreasing) Probolinggo and surrounding region 2002-2011
Jan Feb Mar Apr May Jun Jul Aug Sep Oct Nov Dec2002 0 0 0 0 0
2003 0 0 0
2004 0 0 0 0
2005 0 0 0 0
2006 0 0 0 0 0 0
2007 0 0 0 0
2008 0 0 0 0 0 0
2009 0 0 0 0 0
2010
2011 0 0 0 0 0
Average rainfall 459.6 525.5 401.9 200.7 146.6 34.8 42.7 4.1 25.5 29.2 119.7 366.9
Table 3: Changes in wind speed 2004-2010 at Probolinggo Coast.
No. Month 2005 2007 20081. January 8.0 m/s 9.9 m/s -2. December 8.1 m/s 10.3 m/s -3 February 8.0 m/s - 8.9 m/s

Page 4 of 8
Citation: Supriyadi IH, Sandra A (2015) Impacts and Adaptation to Climate Change: A Case Study of Coastal Inundation at Proboliunggo, East-Java. J Coast Zone Manag 18: 398. doi: 10.4172/2473-3350.1000398
Volume 18 • Issue 1 • 1000398J Coast Zone ManagISSN: 2473-3350 JCZM, an open access journal
Inundation scenarios
In the rainy season, especially in November-December and in the dry season from June to July, the highest tides occur and coastal inundation tends to be more widespread. At the same time there was a change of wave height and wind speed so that inundation impacts on some coastal areas such as milkfish ponds, salt ponds, crab cultivation areas, rice fields, settlements and infrastructure in coastal environments. Direct measurements during the inundation, show that Kalibuntu village was more affected than other villages (Table 4). An indication of the increase in the level of sea water was that some people have made efforts to raise the level of the ground floor of their houses.
In the first scenario, if the tide height at the Mean High Water Neap (MHHWN) was 0.15 meter and the average wave height is 0.15 meter, the sea level height will be 0.3 meter (Figure 4a). Secondly, if the height of sea at the Mean High Water Spring (MHHWS) 0.73 meter and the average wave height is 0.15 meter, the sea level was 0.88 meter (Figure 4b). In the third scenario, the highest tide of 1.6 meter with an average wave height of 0.15 meter, so that the sea level was 1.75 meter (Figure 4c). In extreme conditions of a 1.6 meter tide and an average significant wave height of 0.7 meter, the sea level height would be 2.3 meter (Figure 4d). The results of the four scenarios show that Kalibuntu was more vulnerable to flood inundation than Randutatah or Gending villages. Inundation scenarios on the coast, assuming the waves and sea level continue to increase, still require further study and the available data for more than 30 years to predict the occurrence of inundation. In addition, the occurrence of inundation needs to be brought to the attention of various stakeholders such as the government, coastal communities and NGOs.
Based on the measurements of the increased inundation at Kalibuntu in July 2012 the widespread impacts of inundation on land use in coastal area can be calculated (Table 5). The areas most extensively affected were the fish ponds (54.44 ha) and the settlement (33.054 ha).
Shore line change
This study was not based on continuous observation of the changes
in sea level, but based on the assumption that the continuous increase in wave size and rainfall will contribute to shore line changes. Based on the results of the interpretation of Landsat 7 ETM data recorded in 2000 and 2006, shoreline changes can be calculated. Erosion that occurred in Kalibuntu was -4.99 meter/year, which was faster than Gending -1.42 meter/year, whereas accretion of +1.3 meter/year occurred in Randutatah (Table 6). Coastal communities used stone rubble buildings and bamboo in their erosion prevention efforts, though the latter was less effective for slowing it down.
Economic valuation
Calculation of the economic impact of rising flood tides, predict a total loss of Rp. 158.2 billion (Table 7). The calculation only covers a few types of land uses such as rice fields, milkfish, crab fattening, salt ponds and settlements. Studies are not yet available for use in policy making by local government about the use of coastal resources in an efficient and sustainable manner, both economically and socially, in coastal areas that are vulnerable to inundation. Because of this, the government often does not recognize the significance of the effect of environmental damage on economic activity [22].
Strategy of adaptation
The community has made efforts to adapt in anticipation of flooding as result of climate change in coastal areas as follows:
Increase of ground floor
In general, the most common adaptation done in coastal communities was to increase the height of the ground floor of the house by between 0.5-1.0 meters (Figure 5). Coastal community members that formerly lived near the beach have already left since their settlements were inundated in the 1970-1980’s. Based on field studies during the flood tides, there were 15 homes that were inundated for 30-75 minutes. Many people moved on their own initiative, but some of them moved under the direction of the local government. Some other people moved to another residence or village that was more convenient. A Kalibuntu village monograph in 2012 recorded that 49 families that had moved
Figure 3: Direction and speed of wind in the dry season.
Table 4: The depth of water during inundation at Kalibuntu Village.
No. Locations Longitude Latitude Depth (m)1. Kalibuntu village 113.417307 -7.737197 0.1102. Gending-1 village 113.312262 -7.769192 0.863. Gending-2 village 113.311814 -7.769567 0.98

Page 5 of 8
Citation: Supriyadi IH, Sandra A (2015) Impacts and Adaptation to Climate Change: A Case Study of Coastal Inundation at Proboliunggo, East-Java. J Coast Zone Manag 18: 398. doi: 10.4172/2473-3350.1000398
Volume 18 • Issue 1 • 1000398J Coast Zone ManagISSN: 2473-3350 JCZM, an open access journal
residence. If this displacement was one of the ways the community adapts in anticipation of the impact of tidal flooding, it needs to be studied more deeply.
Coastal embankments or sea-wall
Another effort for the prevention of damage and loss of land was the
construction of a seawall. The new seawall has a total length of 1225.3 meters along the shoreline of 2147 meters, so the remaining 921.77 meters was still prone to erosion. The estimated cost of construction was around 13.8 billion. The cost of construction of coastal embankments was high, so of course this will be an obstacle for local governments. The construction of seawalls was the responsibility of many parties, involving both local and central government, and in the absence of
Figure 4a: First scenario.
Figure 4b: Second scenario.
Figure 4c: Third scenario.
Figure 5: Increase of ground floor level to adapt to higher tides.
Figure 4d: Extreme condition.
Table 5: Land flooded during high tide.
No. VillagesInundation Land (ha)
Total (ha)Rice field Fish Ponds Settlement
1. Gending 0.46 14.14 - 14.592. Kalibuntu 0.35 54.44 33.05 87.843. Randutatah - 32.20 - 32.20
Total 0.81 102.78 33.05 136.64(0.59 %) (75.22 %) 24.19 %) (100 %)
Table 6: The average of Shore line change at Kraksaan Sub-district.
VillagesShore line change (m)
Erosion Accretion Trend (m/year)Randutatah 10.89 19.67 + 1.3Kalibuntu 70.96 40.98 - 4.99Gending 50.00 41.47 - 1.42
Table 7: Economic valuation on coastal flood.
No. Villages/Land use Inundation (ha)
Value (Rp/ha)
Economic Loss Rp (000)
1.Gending:-Rice field-Milkfish Pond
0.45614.139
11,775,0004,450,000
5,369,40062,918,500
I 68,287,900
2.
Kalibuntu:-Rice field-Milkfisk pond-Settlement-Mud crab
0.3554.43633.0540.474
11,775,0004,450,000
50,000,000/105 m2
11,560,000
4,121,250242,240,200
157,400,000,000739,440
II 157,647,100,890
3.Randutatah:-Salt ponds-Rice field
34.24.0
12,967,80011,775,000
443,498,76047,100,000
III 490,598,760I+II+III 158,205,987,550
Page 6 of 8
Citation: Supriyadi IH, Sandra A (2015) Impacts and Adaptation to Climate Change: A Case Study of Coastal Inundation at Proboliunggo, East-Java. J Coast Zone Manag 18: 398. doi: 10.4172/2473-3350.1000398
Volume 18 • Issue 1 • 1000398J Coast Zone ManagISSN: 2473-3350 JCZM, an open access journal
cooperation between central and local governments, the communities who live in coastal areas will be increasingly vulnerable.
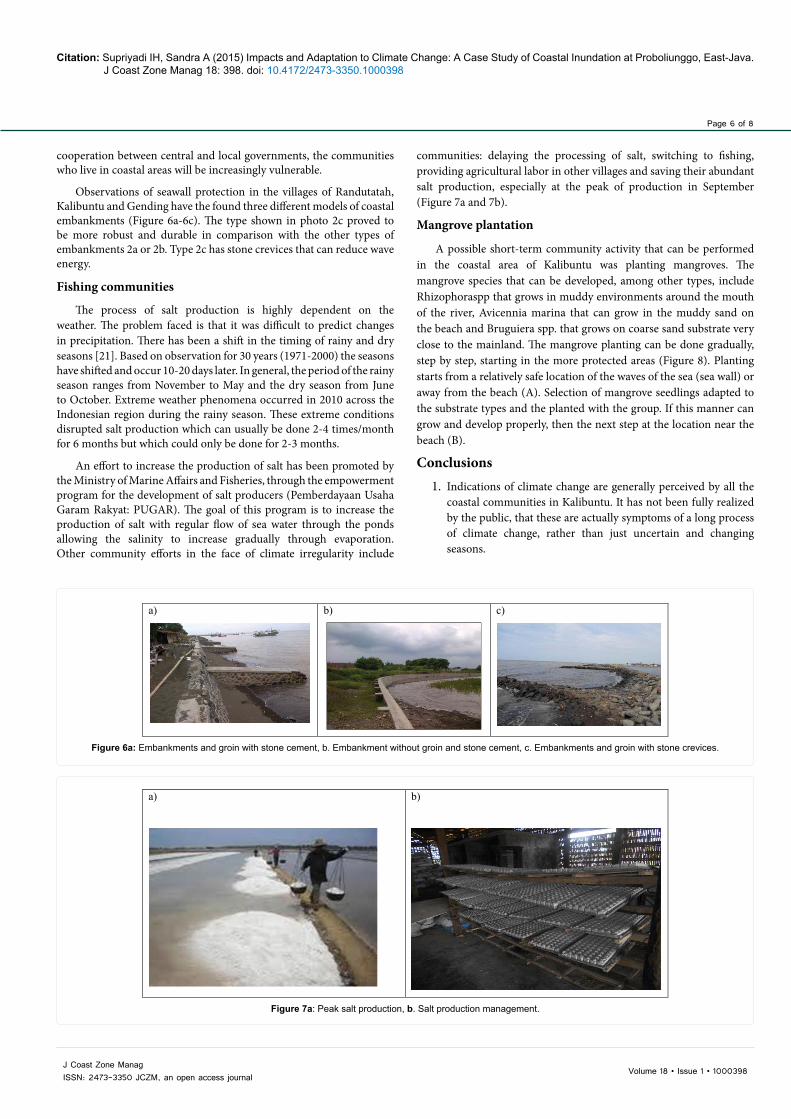
Observations of seawall protection in the villages of Randutatah, Kalibuntu and Gending have the found three different models of coastal embankments (Figure 6a-6c). The type shown in photo 2c proved to be more robust and durable in comparison with the other types of embankments 2a or 2b. Type 2c has stone crevices that can reduce wave energy.
Fishing communities
The process of salt production is highly dependent on the weather. The problem faced is that it was difficult to predict changes in precipitation. There has been a shift in the timing of rainy and dry seasons [21]. Based on observation for 30 years (1971-2000) the seasons have shifted and occur 10-20 days later. In general, the period of the rainy season ranges from November to May and the dry season from June to October. Extreme weather phenomena occurred in 2010 across the Indonesian region during the rainy season. These extreme conditions disrupted salt production which can usually be done 2-4 times/month for 6 months but which could only be done for 2-3 months.
An effort to increase the production of salt has been promoted by the Ministry of Marine Affairs and Fisheries, through the empowerment program for the development of salt producers (Pemberdayaan Usaha Garam Rakyat: PUGAR). The goal of this program is to increase the production of salt with regular flow of sea water through the ponds allowing the salinity to increase gradually through evaporation. Other community efforts in the face of climate irregularity include
communities: delaying the processing of salt, switching to fishing, providing agricultural labor in other villages and saving their abundant salt production, especially at the peak of production in September (Figure 7a and 7b).
Mangrove plantation
A possible short-term community activity that can be performed in the coastal area of Kalibuntu was planting mangroves. The mangrove species that can be developed, among other types, include Rhizophoraspp that grows in muddy environments around the mouth of the river, Avicennia marina that can grow in the muddy sand on the beach and Bruguiera spp. that grows on coarse sand substrate very close to the mainland. The mangrove planting can be done gradually, step by step, starting in the more protected areas (Figure 8). Planting starts from a relatively safe location of the waves of the sea (sea wall) or away from the beach (A). Selection of mangrove seedlings adapted to the substrate types and the planted with the group. If this manner can grow and develop properly, then the next step at the location near the beach (B).
Conclusions1. Indications of climate change are generally perceived by all the
coastal communities in Kalibuntu. It has not been fully realized by the public, that these are actually symptoms of a long process of climate change, rather than just uncertain and changing seasons.
Figure 6a: Embankments and groin with stone cement, b. Embankment without groin and stone cement, c. Embankments and groin with stone crevices.
a) b) c)
Figure 7a: Peak salt production, b. Salt production management.
a) b)

Page 7 of 8
Citation: Supriyadi IH, Sandra A (2015) Impacts and Adaptation to Climate Change: A Case Study of Coastal Inundation at Proboliunggo, East-Java. J Coast Zone Manag 18: 398. doi: 10.4172/2473-3350.1000398
Volume 18 • Issue 1 • 1000398J Coast Zone ManagISSN: 2473-3350 JCZM, an open access journal
2. The impact of climate change was already disturbing regular activities and the productivity of land, aquaculture ponds and the livelihoods of fishermen. Flood tides are increasing and becoming more widespread from year to year, resulting in high economic losses for productive land.
3. Community adaptation strategies in the face of changes that occur in the coastal environment include: increasing the height of the floor of homes to anticipate flood tides, making embankments to dampen and reduce the rate of abrasion, and, some people are permanently moving to another village.
Recommendations1. To plant mangroves such as Rhizophora sp., Bruguiera sp.,
Avecennia sp. in selected locations safe from the influence of the wave.
2. To study and develop potential adaptations and forms of flood mitigation so that the government was better able to coordinate stakeholder programs for integrated coastal zone management.
Acknowledgments
This research activity was part of the National Priority Programme-9 (PN-9) ‘Climate Change’. This research was undertaken for two years (2012-2013) and focuses on Kalibuntu in the Kraksaan sub-district. We would like to thank the Research Centre for Geotecnologi-LIPI Bandung and the Research Centre for Society and Culture-LIPI Jakarta which has involved the author in this research activity. We also thank Dedy Supriadi Adhuri, Ratna Indrawasih and Sudiyono for cooperation in the field.
References
1. Balica SF, Wright NG, Vander Meulen F (2012) A flood vulnerability index for coastal cities and its use in assessing climate change impacts. Nat Hazards 64:73-105.
2. Dahuri R, Rais J, Ginting SP, Sitepu MJ (1996) Pengelolaan sumberdaya wilayah pesisir dan lautan secara terpadu. Coastal zone management.
3. Kumar PKD (2006) Potential vulnerability implications of sea level rise for the coastal zones of Cochin, Southwest Coastal of India. Environ Monit Assess 123: 333-344.
4. Fenster MS, Dolan R (1996) Assessing the impact of tidal inlets on adjacent barrier island shorelines. J. Coast Res 12: 294-310.
5. Nhuan MT, Ngoc NTM, Huong NQ, Hue NTH, Tue NT, et al., (2009) Assessment of Vietnam coastal wetlands vulnerability for sustainable uses (Case study in Xuanthuy Ramsar site, Vietnam. Journal of Wetlands Ecology 2: 1-16.
6. IPCC (2007) Climate Change 2007 Impacts, Adaptation and Vulnerability. Contribution of Working Group II to the Fourth Assessment Report of the Intergovermental Panel on Climate Change.
7. Ward PJ, Marfai MA, Yulianto F & Hizbaron DR (2011) Coastal inundation and exposure estimation: A case study for Jakarta Nat Hazards 56: 899-916.
8. Barbier EB, Hacker SD, Kennedy CJ, Koch EW, Wolanski E, et al., (2008) Coastal ecosystem-based management with non linier ecological functional and values. Science 319: 321-323.
9. Abuodha PAO & Woodroffe CD (2010) Assessing vulnerability to sea-level-rise using a coastal sensitivity index: A case study from southeast Australia. Journal Coast Conservation 14: 189-205.
10. IPCC (2013) Summary for policymakers In: Climate Change 2013: The physical Science Basis Contribution of Working Group I to the Fifth Assessment report of the Intergovernmental Panel on Climate Change.
11. McLean RFA, Tsyban V. Burkett, Codignott JO, Forbes DL, Mimura N, et al., (2001) Coastal Zones and Marine Ecosystems. In. Climate Change 2001: Impacts, Adaptation, and Vulnerability. Contribution of Working Group II to Third Assessment Report of the Intergovernmental Panel on Climate Change. 343-379.
12. VijayaVenkataRaman S, Iniyan S and Goic R (2012) A review of climate change, mitigation and adaptation. Renewable and Sustainable Energy Reviews 16: 878-897
13. Nellerman C, Corcoran E, Duarte CM, Valdes L, De Young C, et al., (edtns) (2009) Blue Carbon. A Rapid Response Assessment.
14. Biro Pusat Statistik Kabupaten Probolinggo (2012) Kecamatan Kraksaan Dalam Angka 2011.
15. Maulana E & Hartanto M (2010) Model pengolahan data tinggi gelombang signifikan. Institute Pertanian Bogor. 15.
16. Triatmodjo B (1999) Teknikpantai, Beta offset, Yogyakarta. Indonesian.
17. Muhtadi A (2009) Kajian beberapa alternative lay out breakwater Desa Sumber Anyar Probolinggo. Neutron 9: 20-3.
18. Bakti LM (2010) Kajian Sebaran Potensi Rob Kota Semarang dan Penanganannya. TESIS: Program Pascasarjana Teknik Sipil. Universitas Diponegoro. Semarang, Indonesian.
19. Mann T, Westphal H (2014) Assessing long-term changes in the beach width of reef islands based on temporally fragmented remote sensing data. Remote Sens 6: 6961-6987.
Figure 8: Strategic of mangrove rehabilitation.

Page 8 of 8
Citation: Supriyadi IH, Sandra A (2015) Impacts and Adaptation to Climate Change: A Case Study of Coastal Inundation at Proboliunggo, East-Java. J Coast Zone Manag 18: 398. doi: 10.4172/2473-3350.1000398
Volume 18 • Issue 1 • 1000398J Coast Zone ManagISSN: 2473-3350 JCZM, an open access journal
20. Yahaya J, Ghani AA (1997) Marine pollution prevention and management in the strait of Malacca. Benefit-Cost Analysis. Paper presented at the Malacca Strait Methodology Development Workshop. 18-21.
21. Aldrian E, Karmini M, Budiman (2011) Adaptasi dan Mitigasi Perubahan Iklim
di Indonesia. Pusat Perubahan Iklimdan Kualitas Udara, Kedeputian Bidang Klimatologi-BMKG.178.
22. Kusumastatnto T (1997) Penilaian ekonomi sumberdaya wilayah pesisir. Dalam. Pelatihan pengelolaan hutan mangrove lestari.
![260-2501 Tipping Bucket Rain Gauge User ManualE } À > Ç v Æ } } ] } v z z z z z z z z z z z z z z z z z z z z z z z z z z z z z z z z z z z z z z z z z z z z z z z z z z z z z z](https://img.pdfslide.us/doc/110x75/60df9ff0f4aa6921e4565fc2/260-2501-tipping-bucket-rain-gauge-user-manual-e-v-v-z-z.jpg)

![NATIONAL CENTERS FOR COASTAL OCEAN SCIENCE€¦ · z © w l l } o ] v x v } x p } À what we are doing why we are doing it national centers for coastal ocean science](https://img.pdfslide.us/doc/110x75/5f16c34c43da7f7d5a549e07/national-centers-for-coastal-ocean-science-z-w-l-l-o-v-x-v-x-p-what.jpg)

![Coastal Processes and Conflicts - files.nc.gov · Coastal Processes and Conflicts: E } Z } o ] v [ K µ v l ... Coast: Sea-Level Rise and Estuarine Dynamics, a NC Sea Grant publication](https://img.pdfslide.us/doc/110x75/5f02e60b7e708231d4068f52/coastal-processes-and-conflicts-filesncgov-coastal-processes-and-conflicts.jpg)


![W z z z z z z z z z z z z z z z z z z z z z z z z z z z z z z z z...#RT Z ] o [ v u W z z z z z z z z z z z z z W v [ ^ ] P v µ W z z z z z z z z z z z z z z z z z z z z z z z z z](https://img.pdfslide.us/doc/110x75/60949c1fa8e30d779b79b9c0/w-z-z-z-z-z-z-z-z-z-z-z-z-z-z-z-z-z-z-z-z-z-z-z-z-z-z-z-z-z-z-z-z-rt-z-o.jpg)


![6688==88..,, 66:::,,))777 - Autonet Suzuki · s ] µ v ] Z ] } ] v KK> z z z z z z z z z z z z z z z z z z z z z z z z z z z z z z z z z z z z z z z z z z z z z z z z z z z z z z](https://img.pdfslide.us/doc/110x75/5e9312c274650c20c60d46b4/668888-66777-autonet-suzuki-s-v-z-v-kk-z-z-z-z-z.jpg)